Embed Size (px)
Citation preview

1
RESEARCH PROJECT
IOL CALCULATION FOR HIGHLY MYOPIC EYES, COMPARISON OFDIFFERENT PUBLISHED METHODS. HADASSAH EIN KEREN HOSPITAL,JERUSALEM, ISRAEL, 2014
AUTHOR:
Carlos Idrobo MD,
Retina and Vitreous Service, Hadassah Ein Keren Hospital, Jerusalem-Israel
SCIENTIFIC DIRECTOR:
Dr Edward Averbukh. Retina and Vitreous Service, Hadassah Ein Keren Hospital,
Jerusalem-Israel
STATISTIC DIRECTOR
Dr. Clara López de Mesa. Scientific Research Director, Barraquer Institute of
America, Bogotá - Colombia
2
RESUMEN:
OBJETIVO Comparar la precisión de varios métodos propuestos para mejorar el càlculo del lente
intraocular en pacientes altamente miopes (mayor a 25 mm).
LUGAR: Hospital Hadassah Ein Keren, Jerusalém – Israel
MÉTODOS: Se realizó una búsqueda de todos los casos de cirugía de catarata en pacientes con
longitudes axiles de 25 a 30 mm en los cuales se calculó el lente intraocular mediante biometría
óptica (IOL Master) usando la fórmula SRK/T, estos pacientes fueron operados de
facoemulsificación y colocación de lente intraocular IQ SN60WF. Se realizó un cálculo regresivo del
poder del lente intraocular mediante las fórmulas : SRK/T con constante optimizada (119.0), SRK/T
con 3 constantes personalizadas de acuerdo a la queratometría, fórmula T2, fórmula T2 con
constante optimizada (119.0) y fórmula Holladay 1 con factor del cirujano optimizado (1,84). Estos
resultados se compararon entre sí buscando los métodos más precisos
RESULTADOS: Se obtuvieron 55 casos correspondientes a 38 pacientes en los que el método
más preciso fue el de SRK/ T con constante optimizada de 119.0 con un Error Mediano Absoluto
(EMedA) de 0.275, seguido por SRK/T con la constante original (EMedA:0,3), SRK/T con 3
constantes personalizadas ( EMedA: 0.31) T2 (EMedA: 0.33), T2 con constante optimizada
(EMedA:0.38) y finalmente Holladay 1 con Factor del Cirujano Optimizado (EMedA:0.388).
CONCLUSIONES: Los resultados muestran que el cálculo del lente intraocular SN60WF para
pacientes altamente miopes usando los métodos de SRK/T con una constante optimizada de
119.0, SRK/T con 3 constantes personalizadas según la queratometrìa y fórmula T2 es más
preciso. Se requieren estudios en poblaciones más grandes para aclarar las tendencias del
presente estudio

3
ABSTRACT
PURPOSE: To Compare the accuracy of various published methods to improve the IOL calculation
in highly myopic patients ( higher than 25 mm)
PLACE: Hadassah Ein Keren Hospital, Jerusalém – Israel
METHODS: Cases with an axial lenght higher than 25 mm to 30 mm which underwent cataract
surgery were collected from the database of the Hadassah Ein Keren Hospital, the cases received
Phacoemulsification surgery with IOL implant SN60WF, the calculation of intraocular lens (IOL)
power was done using optic biometry (IOL Master) and the SRK/T formula. After successful surgery
and followup period of minimum 3 weeks, the cases were evaluated by optometry and then a back
calculation of the IOL power was done using the SRK/T with optimized A constant of 119,0; SRK/T
with 3 IOL personalized constants according to the keratometry, T2 formula, T2 formula with an
optimized A constant of 119.0, and Holladay 1 with an optimized surgeon factor of 1.84, the results
were compared looking for the more accurate and for concordance between the methods
RESULTS: 55 cases (eyes) were obtained, from 38 patients, the most accurate methods
according to the median absolute error (MedAE) was SRK/T with an optimized A constant of 119.0
(MedAE: 0.275), followed by SRK/T with the original constant (MedAE: 0.3), SRK/T with 3
personalized constants (MedAE0.31) and T2 formula (MedAE: 0.33), finally the Holladay 1 formula
with Optimized Surgeon Factor (MedAE: 0.388)
CONCLUSIONS: The results show that the IOL calculation for the SN60WF IOL in highly myopic
eyes with the SRK/T formula using an optmized constant of 119.0, the SRK/T formula with 3
personalized A constants according to the keratometry values and the T2 formula show accuracy
and concordance and can be used in these cases, A higher amount of cases is necessary to
improve the tendency shown in the present sample.
4
INTRODUCTION
Myopia can be defined as a refractive error in which parallel rays of light are
brought to focus in front of the retina in a resting eye1. High myopia, on the other
hand, is defined as a spherical refractive power of 5 diopters or higher 2.
The etiology of this condition is not well understood and factors like near sight
activities performed since an early age and scant outdoor activity have been
considered, genetic loci have been identified and approved by the Human Genome
Organization Gene Nomenclature Committee, and called MYP 1 to MYP 14 in the
chromosomes X, 1, 2-4,7,8,11,17,18,22, most of them related to high , early onset
myopia 2
The worldwide prevalence of myopia ranges from 17 to 95%3 A report regarding
myopia in the United States, registered a prevalence of 33,1%,, most of these
cases corresponded to young and white females4. In A nation-wide study of
myopia performed in Israel in 312,149 subjects, 17 to 19 years old, it was found
that a 16,27% of this population was myopic, with an increased prevalence in
female subjects 5.
Another big study performed in Israel with a population of teenagers and young
adults from 16 to 22 years old from 1990 to 2002, determined that the prevalence
of myopia has increased in the cited population, with a remarkable change in the
group of highly myopic eyes, which started on 13,5% in 1990 and increased to
20,7% in 2002 for female, and in male from 11,6% in 1990 to 16,3% in 20026.
In regard of this information it is understood that some populations like the Israeli,
show a tendency to increase the prevalence of its myopic patients, therefore, the
incidence of high myopia will also increase. Also, while these populations become
older, the need for an accurate intraocular lens (IOL) calculation for cataract
surgery in myopic patients will also increase.
Myopic eyes differ in many ways from emmetropic eyes. A longer axial length, an
increased diameter of the lens capsular bag and a deeper anterior chamber are
5
found7, these features are responsible of a deeper position of the IOL in the bag ,
which also is related to an hyperopic surprise after IOL calculation 8 . On the other
hand, the IOL’s positioning in the bag is also affected, the posterior capsule takes
more time to make contact with the posterior IOL’s surface7. some concepts must
be taken into account when calculating IOLs for myopic patients, which include:
1. The Axial length (AL) patients with a staphiloma are considered a problem
when measuring with ultrasound, the optic biometry is able to overcome this
pitfall because the measurements can be done respect to the fixation point
of the patient.8 In spite of this statement, Olsen and Thorwest 9 found that
the preoperative AL was longer than the post-operative axial length by
around 0,08 mm on average, and a proposed a model of the phakic eye with
a slightly higher refractive index of 1,3616 was developed. Other authors
describe transformation formulas to improve the AL measurement by the
IOL master, examples are found in the studies by Preußner et al 10 and Li
Wang et al 11 who found a reduction in the amount of eyes left hyperopic
using methods of back calculation of AL in order to obtain a prediction error
of 0.
Another problem related with the AL is specific to the commonly used
formula SRK/T, which requires a correction when measuring AL longer than
24,2. This was fixed by the original authors with a change in the step 2,
introducing a corrected axial length (LCOR) according to the following
calculation:
If LCOR ≥ 24,2 then
LCOR= -3,446 + 1,716 x 36,2 – 0,0237 x 36,2
In spite this correction, Sheard et al. documented that when the AL reaches
a value of 36,2 mm, the LCOR reaches a maximum of 27,62 mm and, after
this point, the LCOR decreases while the actual AL increases, this is an
illogical behavior called the LCOR reversal, the cited author states that
when the AL is greater than or equal to 36.2 mm, LCOR should be a
constant (LCOR = 27.62 mm). This calculation is part of the T2 formula

6
which also makes a correction in the corneal height, this will be reviewed
later in the text12.
2. The anterior chamber depth (ACD) is defined as the axial distance from the
central front surface of the cornea to the central front surface of the
crystalline lens, it plays an important role as a source of error in cases
where the AL has been accurately measured, this is because the ACD is
related to the effective lens position (ELP), which is the distance from the
anterior surface of the cornea to the effective main plane of the IOL in the
visual axis.
The ACD and ELP are part of the calculation of the IOL constants used in
the different formulas, for example, in order to calculate the A constant for
the SRK/T formula, the ACD is necessary (A = [(ACD × 0.9704) +
62.005]0.5663) the same thing happens with the Surgeon factor from
Holladay’s formula (SF = 0.9704 × ACD – 3,595). The conclusion is that the
ELP is contained in the A constant8. A higher value of an A constant is
reflected by a longer ACD value, most of the time this combination will be
observed in the presence of a long eye.
Petermier et al. describe that a more accurate AL measurement could not
improve the IOL calculation for highly myopic eyes, and instead of facing the
issue by changing the AL like the previous description, these authors
calculated individualized IOL constants based on the postoperative
refractive results, separately for the positive-diopter and negative-diopter
ranges within the framework of the User Group for Laser Interference
Biometry project to optimize constants for optical biometry, the cited authors
performed a study in which they optimized the IOL constants, the base of
this procedure was the assumption that the main error in IOL calculation
was the difficulty to measure the ELP properly, this because of, 1) the IOL
lens calculated can be negative, positive or zero, a fact that changes the
calculation patterns (most formulas are not designed to deal with negative

7
values). 2) The anatomy of the lens is also changed when there is a positive
or negative lens, because the main plane of the lens moves, according to
the power required. The optimization of constants allowed them to reach a
refractive deviation of zero in positive and negative IOLs using the Haigis,
Sanders–Retzlaff–Kraff/T (SRK/T), Holladay, Hoffer Q, and Sanders–
Retzlaff–Kraff II (SRK II), although the intraocular lenses with a value of zero
didn’t perform that well in the sample.13.
Youngsub et al, demonstrated a median absolute error decrease from 0.29
D to 0.23 D using the SRK/T formula with personalized optimized constants,
using the IQ intraocular lens, (P= 0.001). The conclusion of the study was
that for a steep cornea, the calculated A-constant would be of a lower value,
but for a flat cornea, a higher magnitude A-constant was necesary. The use
of personalized A-constants based on the keratometic values showed
improvement in the refractive outcomes.14
3. Corneal height. A big study by Sheard et al. using 11 189 eyes concluded
that the SRK/T, has a non-physiological behavior when calculating IOL
power in certain keratometric values, this means that with certain axial
length and keratometric readings, the estimation of the corneal height value
does not follow a normal curve, but has an unexpected peak, known as the
corneal height cusp, after this point, the gradient reverses and all the curves
show an almost linear relationship. The shape of the corneal height curves
suggests that in the vicinity of the cusp, the SRK/T formula may
overestimate the corneal height. The original SRK/T formula changes
negative values of X, to 0, in order to prevent the formula from attempting to
take the square root of a negative number, this is the solution to the ACD
problem. In this region, the corneal height was equal to the corneal radius of
curvature.12
In order to deal with this pitfall,, the referred authors considered that a new
corrected formula based on the SRK/T, this formula was published under

8
the name of T2 and has a reported 10% improved accuracy (with a lower
IOL mean error than the calculations performed by the regular SRK/T). 12
The T2 formula overcomes the non-physiological behavior of the corneal
height of the regular SRK/T formula correcting the steps 2 to 4 by a
regression formula:
H2= -10,326 + 0,32630 x L + 0,13533 x K.
With this calculation, it is possible to avoid the peak in corneal height
calculation which appears in a point when combining specific AL and
Keratometric values, the ones of our interest would be the curve of 24 mm
axial length which peak is found at around 50 diopters of mean keratometry,
26 mm, around 47 D and 28 mm around 46 D.12
To the best of our knowledge, no publication has compared the described
methods, therefore, an study using the SRK/T formula without A constant
optimization, SRK/T with 1 optimized A constant (taken from the ULIB
website), SRK/T with 3 optimized A constants personalized according to the
keratometric values, T2 formula, T2 formula with 1 optimized A constant
(taken from the ULIB website), and the Holladay 1 formula with an optimized
Surgeon Factor (taken from the ULIB website) is proposed.

9
METHODSStudy design: Observational analytical retrospective cohort
Population: Highly myopic patients, defined as those having more than -5 D of
spherical power lens correction, which underwent uneventful crystalline lens
phacoemulsification and IOL insertion in the Hadassah Ophthalmology clinic from
June 2012 until January 2014 in one of the surgeon’s surgical practice (Dr EA).
Institutional review board approval was obtained from The Hadassah Ein Keren
Hospital, Jerusalem, Israel. All research and data collection followed the tenets of
the Helsinki Agreement.
Inclusion criteria: Highly myopic patients (AL longer than 25 mm), implant of IOL
Acrisoft SN60WF acrylic, A constant 118.7, Visual acuity > 20/40 in the operated
eye, after cataract surgery
Exclusion criteria: Patients who were not measured by optical biometry , patients
who suffer of any ophthalmological condition that could affect the accuracy of
biometric measurements, (retinal detachment surgery, corneal scars) , patients that
have suffered of any ophthalmological condition that could affect their best
corrected visual acuity apart from their cataract (choroidal neovascularization due
to myopia or NVAMD, Diabetic Macular Edema, Optic Atrophy or Optic neuritis)
appearing previous to the surgery or during the time the patients are being
followed, myopic degeneration and glaucoma patients would be excluded only if
their condition affects severely the visual acuity, traumatic cataract cases, previous
ocular surgery (penetrating keratoplasty), complicated surgery (e.g., anterior or
posterior capsular tears), sulcus fixated lenses, IOL exchanges, postoperative
complications, indwelling silicone oil history of any kind of refractive surgery in the
case)
Variables: The following information should be obtained from the clinical records to
calculate the IOL according to the methods previously described: AL, measured
with the IOL Master, K1 , K2, measured with IOL Master or autorefractometer

10
keratometry, if IOL Master measurement was not available, best corrected
Preoperative VA, measured with the ETDRS chart, converted to fraction, best
corrected Postoperative VA. measured with the ETDRS chart, converted to
fraction, lens A constant and other constants required according to the formulas
used, post operative spherical power, post operative cylinder, post-operative
spherical equivalent, IOL Prediction deviation from the target refraction in the post-
operative.
The refractive prediction error will be calculated according to the analysis published
by J. Aramberri15: which includes the following steps: 1) The expected refraction
with a certain IOL power was subtracted from the expected refraction from an IOL
1,0 Diopter higher or lower than the first one.2) 1 is divided by this value, resulting
in the magnitude in IOL power that should produce 1.0 D of refractive change
(IOL1DRx). 3) This value was multiplied by the refractive error (Rx) calculation and
added to the implanted lens power. The result is the emmetropic power in the
case. The IOL power required for emmetropia in the case is subtracted from the
IOL power that would lead to the refraction target and this is divided by the
IOL1DRx value, the result is the predicted refractive error that would be obtained
with this method, finally, this is subtracted from the original refraction target in order
to know the numerical error, and this value is converted to absolute values to
obtain the absolute numerical error, this operation was repeated for the other
methods included in the present study.
The IOL power calculation methods included were: SRK/T with original constant,
SRK/T with optimized constant (SRK/T O.C.), T2, T2 with optimized constant (T2
O.C.), SRK/T with 3 Optimized constants according to the K value (119,08 for K
lower than 43,0 D; 119.08 for K from 43,0 to 44.7 D and 118.71 for a K higher than
44,7 D14) and Holladay 1 with Optimized Surgeon Factor (Holladay 1), for each
method the following values were obtained: IOL power, IOL power equivalence in
the glasses plane using the formula, IOL deviation from target refraction,
percentage of cases with an error within + 0,50 D, from +0,50 to +1,00 D, from
+1,00 to +2,00 D and within an error ≥ to +2,00 D
11
The Optimized A constant for the 118,7 Alcon IOL, SN60WF is 119,0 according to
the ULIB group with 5128 cases 16, The Holladay 1 Surgeon Factor (S.F) of 1.84
was used according to the ULIB website.
Mean numerical and absolute error as well as median absolute error were
compared between methods, employing the Lin’s coefficient of Correlation and
Concordance. Correlation between mean Keratometry and Absolute error (AE), as
well as between AL and AE were measured with Pearson’s coefficient.
The analysis was done using Excel 2013, Graph Pad Prism 6,0, MedCalc14.10.2.0 and SPSS software 12.0 (SPSS Inc., Chicago,IL)
12
RESULTSDescriptive statisticsDemographics:
After using the inclusion and exclusion criteria, 38 patients were obtained, with a
mean age of 68,47 years old (Standard Deviation(SD): 10,31, maximum value: 85
years old, minimum value: 43 years old), and a gender distribution of 55,2% female
(21 patients) and 44,7% male (17 patients).From this group, a total of 55 eyes
(cases) underwent Phaco + IOL procedure.
Preoperative status:
The visual acuity is presented as a fraction from the ETDRS chart.In the
preoperative visit had a mean of 0,3565 (SD: 0,2303, min: 0,05, max: 0,9).
The axial length had a mean of 26,84 mm, (SD: 1,128mm, min: 25,18mm, max:
30,08mm). The keratometries showed the following values: K1 had a mean value
of 43,56 diopters (SD 1,532 D, min 39,94D, max 46,81 D) and K2 had a mean
value of 44,5 diopters (SD 1,429 D, min 40,23D, max 47,6 D), the mean
keratometry was 44,03 Diopters (SD: 1,441 D, min: 40,08D, max 47,2D).
The refraction target of the studied group had a mean of -1,749 Diopters (SD:
1,218 D min: – 5 D, max: 0,68 D), The extreme -5 D refraction target was the case
of one patient who didn’t want to be operated in his second eye since he had a
history of uveitis under control. Preoperative remarks of the studied cases
included: Previous uveitis, not active at the moment of the surgery in three cases,
significant peripapilary atrophy in one case, pseudoexfoliation syndrome in two
cases, convergence defect in one patient, mild macular pseudohole in one case,
and atrophic retinal changes without macular involvement in two cases. One case
with staphyloma was registered
13
Actual surgical IOL Calculations: The Intraocular Lens (IOL) power calculations
were first performed using the SRK/T with original constants, for the actual
surgeries in which the IOL for refraction target was implanted, the value which
would lead the case to emmetropia was calculated according to the method
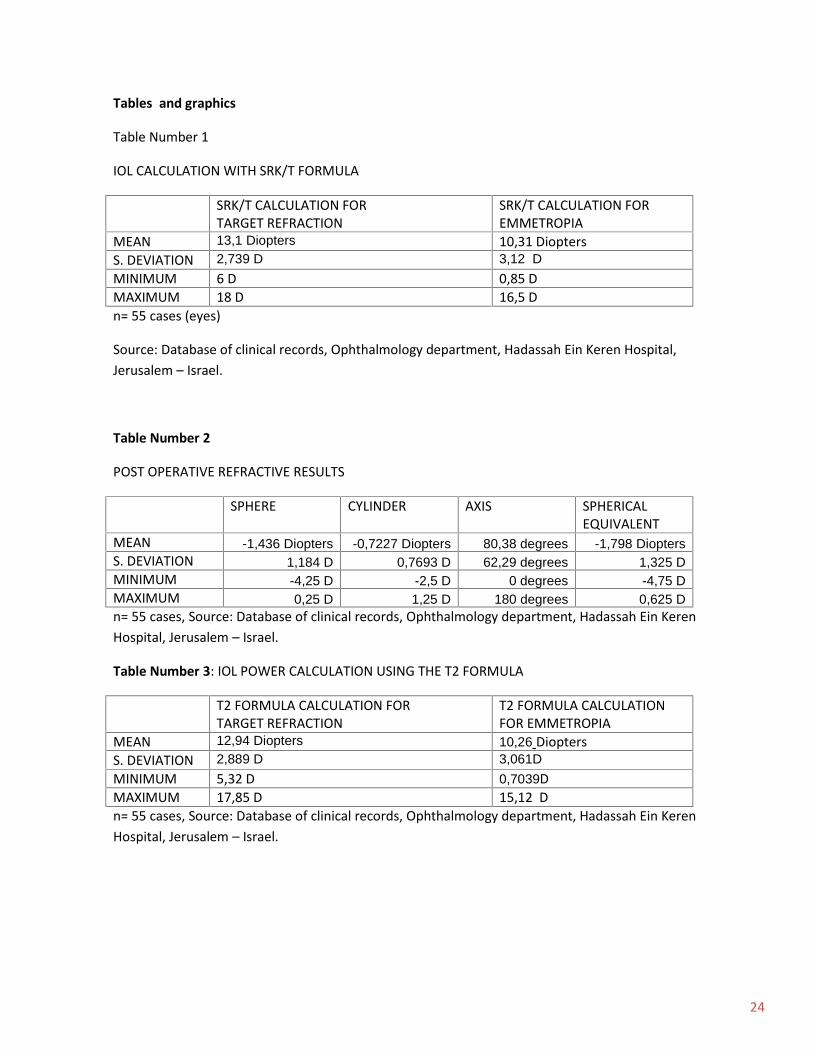
described previously15. These results are summarized in table number 1.
The actual refraction of the patients was obtained and converted to spherical
equivalent, and the expected target refraction with which the IOL was calculated ,
was subtracted from this spherical equivalent, this value was used to measure the
prediction error whicha was called numerical error, the absolute values were used
to obtain the mean absolute error. Then errors expressed in diopters were grouped
according to their magnitudes.
From the calculated series, using the SRK/T with the original constant of 118,7, the
Mean numerical error (MNE) was – 0,049±0,65 (Min -1,965 Max 1,450) and the
Mean absolute error (MAE) was 0,4768±0,467 (Min 0 Max 1,965). 70,9% (39
cases) had a ± 0,50 D error, 10,9% (6) had an error ranging from ±0,50 to 1,00 D,
14,5% (8) had an error of ± 1,00 to ±1,50 D while a 3,6% (2) had an error of ± 1,50
to ±2,00 D.
Postoperative evaluation
The best corrected visual acuity of the cases included had a mean of 0,8347,
Standard deviation of 0,1837, (Min 0,5 Max 1,25). The postoperative refractive
status of the cases was evaluated, these results are resumed in table number
2.The studied cases underwent uneventful surgeries, without complications in the
postoperative time lapse.
1. IOL Calculation with different methods.
The T2 formula: The IOL power calculated using this formula for the desired
refraction target and for emetropia are summarized in table number 3.The mean
numerical error (MNE) using this formula was 0,044 D (SD:0,687 D min:-2,078D

14
max:1,40D). the Mean Absolute Error (MAE) was 0,503 Diopters (SD 0,465 D min:
0,010 D, max: 2,078 D). The percentage of cases falling within ± 0,50 Diopters was
65,45% (30), from ± 0,50 to ± 1,00 it was 20%(11), from ± 1,00 to ± 1,50 diopters it
was 12,72% (7), from ± 1,50 to ± 2,00 diopters it was 0% (0) and an error bigger
than ± 2 D it was 1,81%(1)
T2 fórmula with Optimized constant
In an attempt of improving the results, the T2 formula was used together with the
Optimized contstant of 119,0 provided by the ULIB website. The IOL results of this
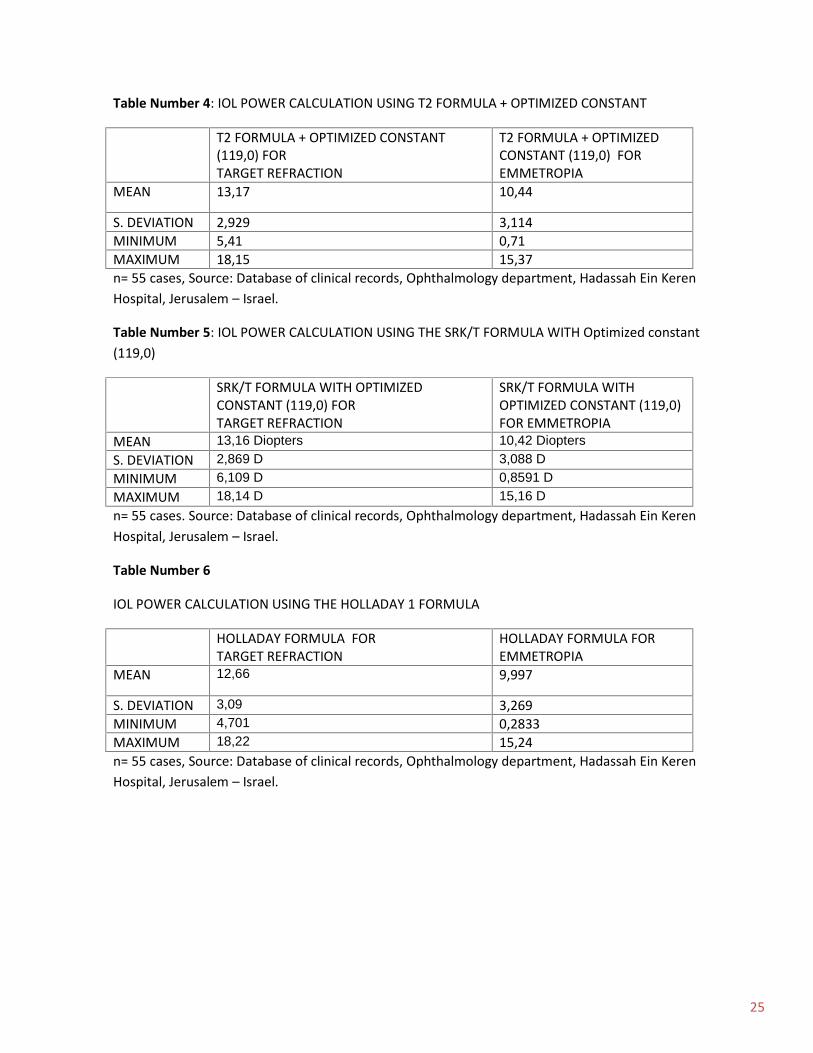
method are shown in table number 4. The MNE with this formula was -0,109
Diopters (SD: 0,67 D, min:-2,174 D max 1,239 D), the MAE was 0,49 D (SD: 0,466
D ,min 0,0066 D, max 2,174 D).
The percentage of cases falling within ± 0,50 Diopters was 65,45% (36), from ±
0,50 to ± 1,00 it was 20%(11), from ± 1,00 to ± 1,50 diopters it was 10,9% (6), from
± 1,50 to ± 2,00 diopters it was 1,81% (1) and an error bigger than ± 2 D it was
1,81%(1)
The SRK/T formula, with an optimized constant of 119,0 generated the IOL power
for refraction target and emmetropia which appear in table 5.
The MNE using this method was -0,081 D (SD: 0,65 D, min: -2,05 D, max: 1,304
D). the MAE was 0,456 Diopters (SD: 0,4711 D, min: 0,011 D, max: 2,06 D).
The percentage of cases falling within ± 0,50 Diopters was 67,27 % (37), from ±
0,50 to ± 1,00 it was 18,18%(10), from ± 1,00 to ± 1,50 diopters it was 10,90% (6),
from ± 1,50 to ± 2,00 diopters it was 1,82% (1) and an error bigger than ± 2 D it
was 1,82%(1).
Holladay 1 formula with an optimized surgeon factor (SF) of 1,84 provided an IOL
power as shown in table number 6, for both target refraction and emmetropia.
The MNE with this formula was -0,232 Diopters (SD: 0,65 D, min:-1,51D max
1,58D), the MAE was 0,514 (SD: 0,456 D min, 0,022 D, max 1,58 D).
The percentage of cases falling within ± 0,50 Diopters was 63,63% (35), from ±
0,50 to ± 1,00 it was 16,36%(9), from ± 1,00 to ± 1,50 diopters it was 16,35% (9),

15
from ± 1,50 to ± 2,00 diopters it was 3,63% (2) and an error bigger than ± 2 D it
was 0%(0)
Finally, the last method used in comparison with the previously described ones is
the SRK/T with 3 constants, the results of this method are resumed in table
number 7.
The Median Absolute Error (MedAE), was calculated for the all the methods and is
presented in a comparative way in table number 8.
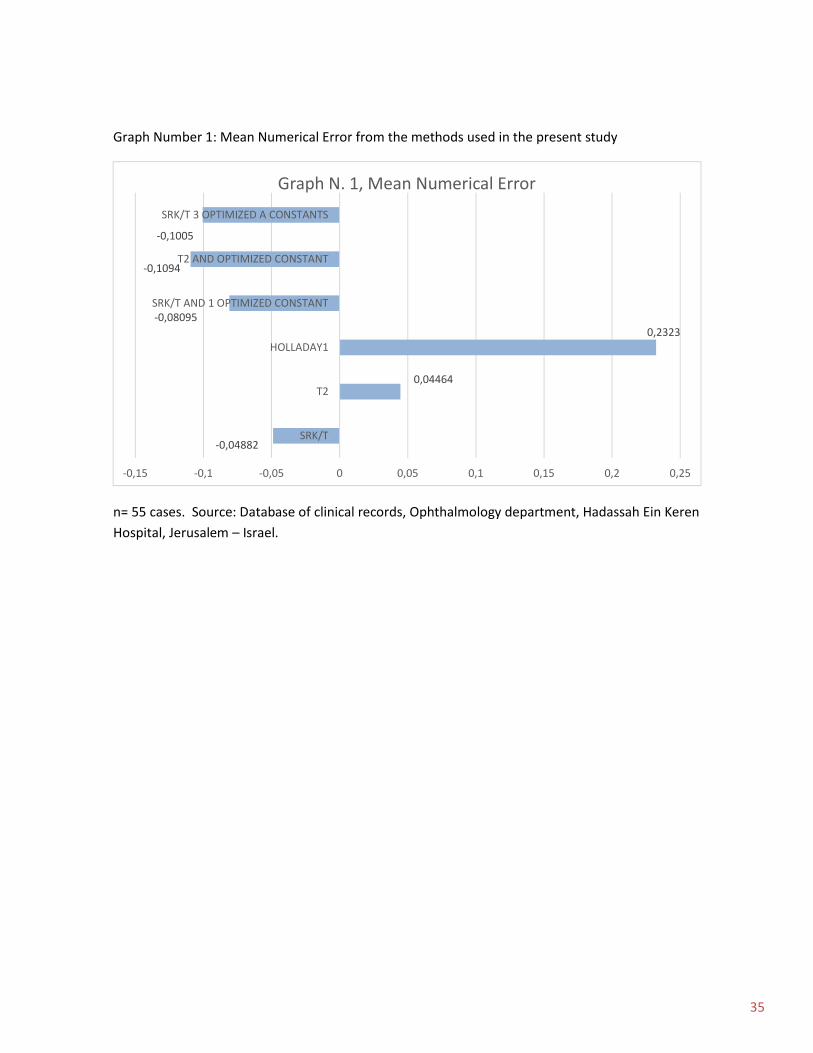
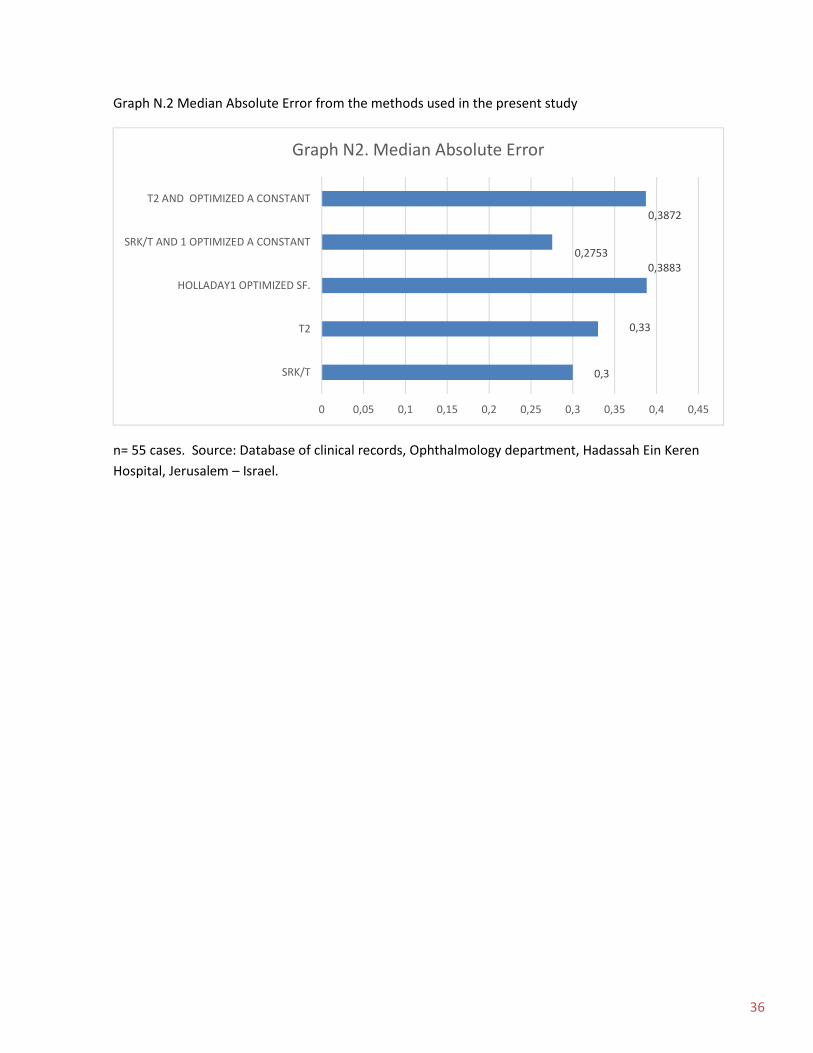
Graph number 1 summarizes and compares de outcomes of the MNE of the 6
formulas used for calculation in the present series. While graph number 2 shows
the behavior of the MAE.
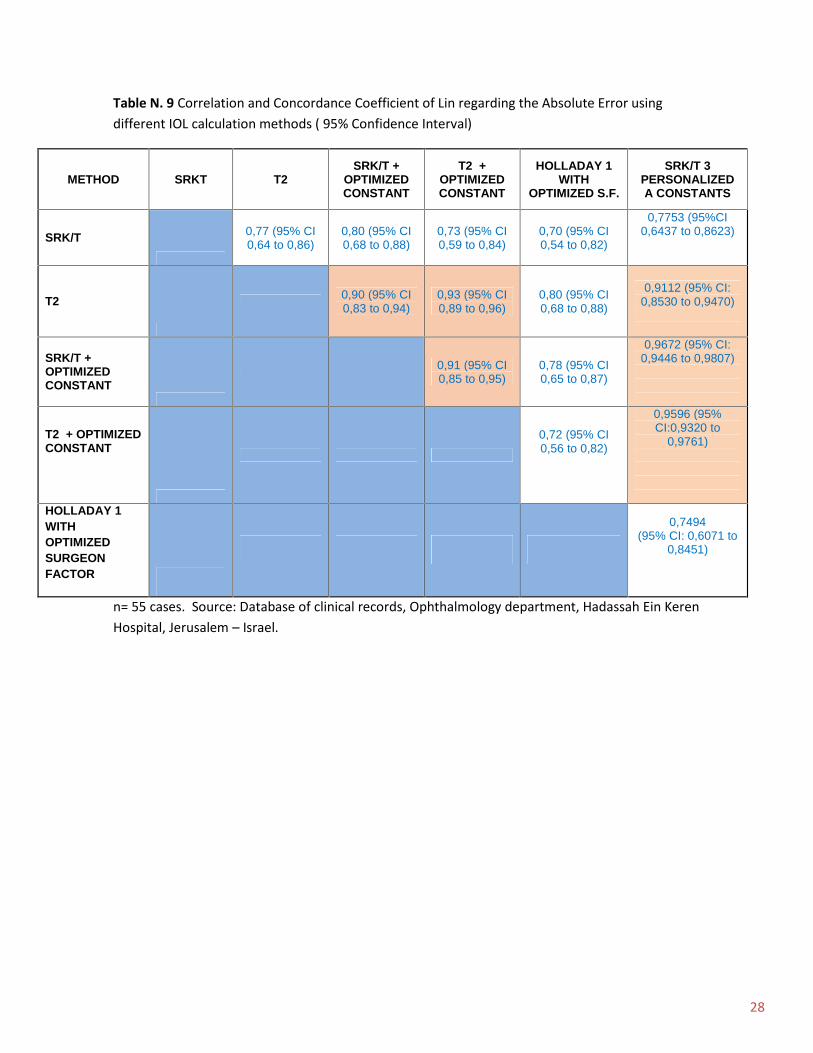
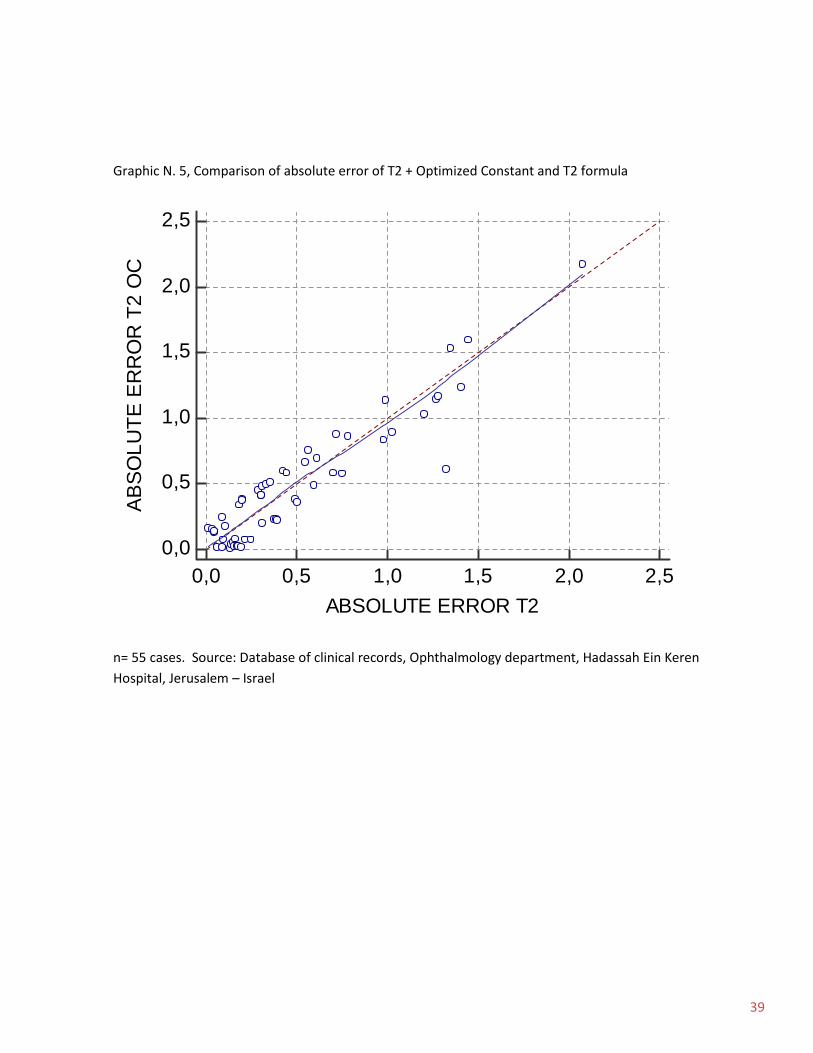
Correlative AnalysisA) Concordance Correlation Coefficient of Lin
In order to improve the analysis, a Concordance correlation coefficient of Lin was
calculated between all the methods, these calculations are summarized in table
number 9 for Absolute Error.
The following methods showed concordance:
T2, T2 calculated with Optimized Constant of 119,0 (T2 + OC), SRK/T with
Optimized Constant (SRK/T OC) of 119,0 and SRK/T with 3 Optimized constants
Graphics number 3-8 show the scatter diagrams of the Absolute Error from these
correlations.
The relationship between the keratometry and the absolute error was also
analyzed, no correlation was found with any method in the present sample. Table
number 10 summarizes the data. On the other hand, a grouped analysis in order to
find keratometric values where the absolute prediction error could be higher was
also performed, the results are shown in table 11 A and 11 B.

16
The absolute error - axial length relationship was also analyzed, no correlation was
found with any method in the present sample. Table number 12 summarizes this
information.Also a grouped analysis was performed between different axial lengths
and the median absolute error, this is shown in table number 13. The Absolute
error did not show a Gaussian distribution using the D'Agostino & Pearson
normality test.
DISCUSION
In the present study, the method which showed the lowest Median Absolute Error
was the SRK/T formula with an optimized A constant of 119,0 for the SN60WF lens
(median absolute error: 0,2753). The accuracy of this method might be related to
the high amount of cases provided for the A constant database used in the ULIB
website (more than 5300 cases)16, and is consistent with previous evidence
showing the benefits of this method17.
In regard gf the evidence of the not physiologic behavior of the SRK/T formula
when some K values are reached, a group analysis based on the mean
keratometry was performed, it showed that the median absolute error (MedAE) of
the SRK/T formula with the Optimized A Constant of 119,0, increased with values
≥44,7 D as shown in table 11 A (Median error of 0,2981) and more specifically in
the group from 44 to 46 D group (Median error of 0,27) as shown in table 11 B, this
agrees with what was described by Youngsub et al, who found that the SRK/T had
an increased error in the extremes of the keratometric values, and suggested the
use of personalized constants for cases with keratometries lower than 43.0 D
which would benefit from an A constant of 119.33, cases from 43.0 D to 44.7 D
which would have better results with an A constant of 119.08 and those with a K
higher 44,7 D that would require a K of 118.71. Using the 3 constants reduced the
median error from 0,36 to 0,24 in the cited report 14 Therefore a calculation with
the 3 constants described in cited article was tested, these results are shown in
table N. 13, the median absolute error found was 0,31 D which in comparison with
17
the other methods used, was slightly higher than that of SRK/T with the optimized
A constant of 119,0 and the SRK/T with a non optimized A constant of 118,7. This
could result from the necessity of further optimization of the 3 A constants for each
surgical center, also, multicenter reports following the same A constant
optimization protocol may be necessary in order to obtain a database which could
be applied to different places.
. In spite of the median error being higher for the 3 A constant optimized method
than that of the SRK/T with one optimized A constant in the present sample, it is
possible to see that the median absolute error in the individual keratometric groups
Is kept very low and similar to that of the 1 optimized constant SRK/T as seen in
table number 11A
The T2 formula avoids the not physiological peak in corneal height calculation
which appears in a point when combining specific AL and Keratometric values, the
ones of our interest would be the curve of 24 mm axial length and 47 diopters of
mean keratometry, 26mm, with 46 D and 28 around 45,5 D12. These combinations
of AL and Keratometric values are not common, but the T2 formula is able to
overcome this issue. The mean keratometry of the present study was 44,03 D and
the mean axial length was 26,84 mm, this means that at the least the mean values
of the present sample, are not yet inside the slope areas of the not physiological
behavior cusps of the regular SRK/T, allowing the calculations made by the SRK/T
to be accurate within the limits of this study. The mean absolute error found in the
present article with the T2 formula without constant optimization is of 0,5039 with a
Median Absolute error of 0,33. The Mean absolute error found in the original article
of the T2 formula was 0,3064 . Since the sample used for the original T2 study is
big, around 5600 cases, it is clear that the distribution of the data will be Gaussian,
and therefore closer to the median, so it is possible to state that the median
absolute error in the present study is similar to the mean absolute error found by
Sheard et al.12 The same is true for the T2 formula used in conjunction with the
Optimized constant, which Median absolute error is not far from the mentioned one
(0,38).

18
A more detailed study comparing the absolute error and the keratometry showed
that the best performance of the T2 formula in the present study was in the group
of 42 to 44 D (MedAE:0,312) , and the worse was in the group of 46 to 48 D
(MedAE: 0,4928). The T2 with A constant optimization showed the best results in
the 44 to 46 D (MedAE: 0,230), and the worse results in the 40 to 42 D (MedAE:
0,517). In this regard we could suggest that either an A constant personalization or
a different optimized constant is necessary to further improve the results of the T2
formula. In any case, this formula has shown adequate correlation with the SRK/T
formula with an optimized A constant, and therefore it can be used as good tool for
IOL calculation in highly myopic cases.
The Holladay 1 formula was also calculated using the ULIB optimized surgeon
factor of 1,84, a median absolute error of 0,3883 was obtained, being this the
higher between the methods compared in the present study, this fact could be
explained by the already documented reduced accuracy of the Holladay 1 formula
for IOL calculation in eyes with axial lengths longer than 26 mm18. The Mean
absolute error reported for this method in the present study of 0,5138 is similar to
the mentioned study by Hoffer for very long eyes, where the error is 0,5616. The
Median Absolute error is of a higher magnitude than the reported by Li Wang,
which had a value of 0,4011, in which the IOL calculation was improved, optimizing
the AL with a back calculation. According to these findings we understand that
optimizing the Surgeon Factor is not enough to improve the accuracy of this
formula, and that an AL based optimization is necessary in order to improve the
results.
All the methods used in this study were tested for concordance, using Lin’s
Concordance and Correlation coefficient 19, 20 taking the absolute error as the
output comparison variable, the SRK/T with Optimized Constant was used as the
“gold standard” because of its accuracy proved in several publications 8,16,17
19
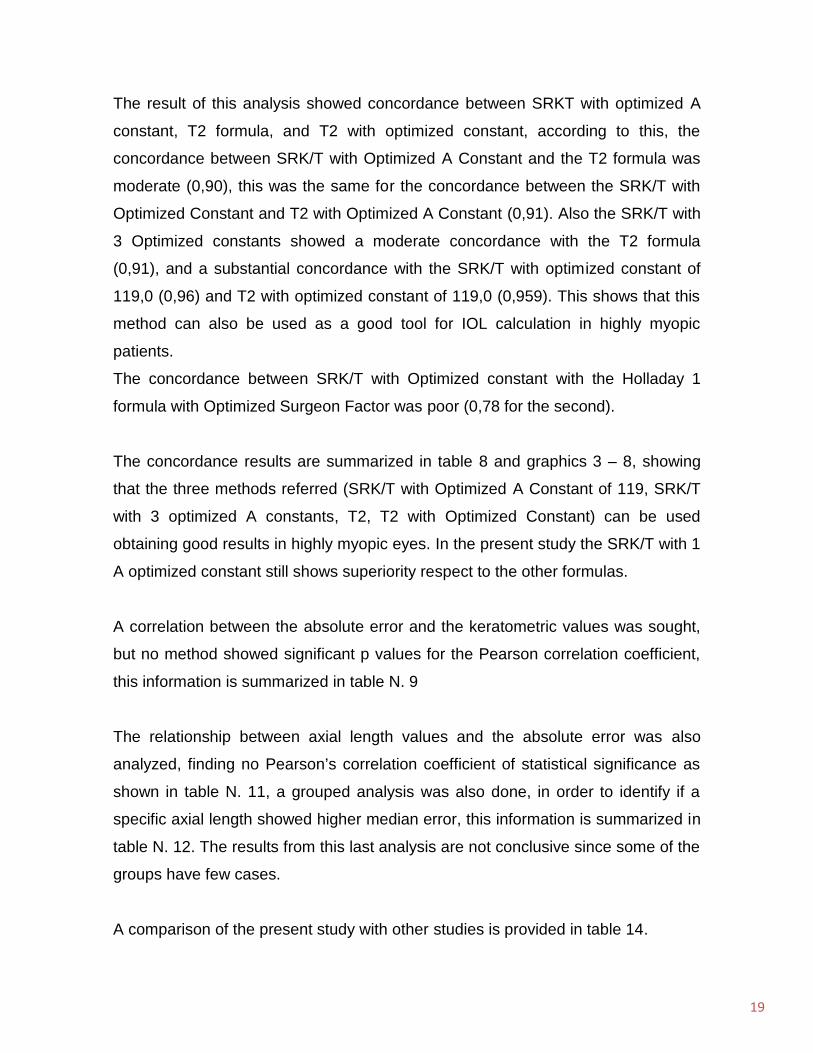
The result of this analysis showed concordance between SRKT with optimized A
constant, T2 formula, and T2 with optimized constant, according to this, the
concordance between SRK/T with Optimized A Constant and the T2 formula was
moderate (0,90), this was the same for the concordance between the SRK/T with
Optimized Constant and T2 with Optimized A Constant (0,91). Also the SRK/T with
3 Optimized constants showed a moderate concordance with the T2 formula
(0,91), and a substantial concordance with the SRK/T with optimized constant of
119,0 (0,96) and T2 with optimized constant of 119,0 (0,959). This shows that this
method can also be used as a good tool for IOL calculation in highly myopic
patients.
The concordance between SRK/T with Optimized constant with the Holladay 1
formula with Optimized Surgeon Factor was poor (0,78 for the second).
The concordance results are summarized in table 8 and graphics 3 – 8, showing
that the three methods referred (SRK/T with Optimized A Constant of 119, SRK/T
with 3 optimized A constants, T2, T2 with Optimized Constant) can be used
obtaining good results in highly myopic eyes. In the present study the SRK/T with 1
A optimized constant still shows superiority respect to the other formulas.
A correlation between the absolute error and the keratometric values was sought,
but no method showed significant p values for the Pearson correlation coefficient,
this information is summarized in table N. 9
The relationship between axial length values and the absolute error was also
analyzed, finding no Pearson’s correlation coefficient of statistical significance as
shown in table N. 11, a grouped analysis was also done, in order to identify if a
specific axial length showed higher median error, this information is summarized in
table N. 12. The results from this last analysis are not conclusive since some of the
groups have few cases.
A comparison of the present study with other studies is provided in table 14.

20
From the present study we can conclude that Myopic IOL calculation is still far from
being as accurate as that for normal eyes, in any case several methods have been
proposed to overcome this problem, being the SRK/T with an optimized constant,
one of the most explored since the constant optimization process is relatively easy
to obtain the more accurate IOL A constant, also several groups around the globe
are providing thousands of cases with IOL constants optimized for commonly used
IOLs, this is the case of the ULIB web site of Zeiss, which can become a very
useful tool for those interested in improving their results when it comes to IOL
calculation for myopic patients. Using the SRK/T formula with the correct optimized
constant shows excellent results. The use of Holladay 1 formula for highly myopic
eyes (AL longer than 26 mm) is not encouraged, since even with a Surgeon Factor
constant optimization, the results are less accurate than those of the SRK/T.
The T2 formula with or without an A constant optimization also provides very
accurate results, although in the the present sample, the use of the optimized
constant of 119,0 showed worse results than those with the regular 118,7 A
constant, therefore more studies in order to obtain a better constant optimization
for the T2 formula are encouraged.
Advantages of the present study include a homogeneous sample, with eyes with
high myopia, operated by the same surgeon and with the same IOL implanted, also
the calculations were performed using exclusively the IOL Master optical biometry
in a single center, also four documented methods are compared and the T2
formula is used for the first time in a study besides the original one. Pitfalls of the
present study include a relatively small sample size.
The A constant optimization is a useful method to improve the results of the SRK/T
formula lowering the Median error, for the IQ IOL, the optimized A constant widely
calculated is of 119,0, according to the ULIB website, and used in the present
study, this approach proved to be accurate.

21
The authors would like to acknowledge Dr. Sheard for providing the necessary
software for IOL calculation with the T2 formula as well as the Barraquer Institute
of America research head, Clara Lopez de Mesa, who provided advice for the
statistical analysis.

22
References
1. Seang-Mei Saw, Joanne Katz, et al Epidemiology of Myopia, Epidemiologic
Reviews No2, 1996, pg 175 – 187.
2. Hornbeak Dana, Young Terri et al, Myopia genetics: a review of current
research and emerging trends, Current Opinion in Ophthalmology, Vol. 20,
September 2009, p 356 – 362
3. Nangia V, Jonas JB et al, Refractive error in Central India: The Central India
Eye and Medical Study, Ophthalmology, 2010; 117(4):693 – 699
4. Vitale S,Ellwein L, et al, Prevalence of refractive error in the United States,
1999 – 2004, Archives of Ophthalmology, 2008, 126, 1111 – 1119.
5. Rosner M, Belkin M, A nation-wide study of myopia prevalence in Israel.
Findings in a population of 312,149 young adults, Metabolic Pediatric and
Systemic Ophthalmology, 1991; 14(2), 37 – 41.
6. Yosefa Bar Dayan, Avi Levin, The Changing Prevalence of Myopia in Young
Adults: A 13-Year Series of Population-Based Prevalence Surveys, Invest
Ophthalmol Vis Sci. 2005;46:2760–2765.
7. Yinying Zhao, Jin Li and associates, Capsular Adhesion to Intraocular Lens
in Highly Myopic Eyes Evaluated In Vivo Using Ultralong-scan-depth Optical
Coherence Tomography, American Journal of Ophthalmology
2013;155:484–491.
8. Kenneth J. Hoffer, MD and asociates, IOL Power formulas & special
circumstances, 2010, American Academy of Ophthalmology.
9. Olsen T, Thorwest M. Calibration of axial length measurements with the
Zeiss IOLMaster. J Cataract Refract Surg 2005;31:1345–1350)
10.Preußner P-R, Olsen T, Hoffmann P, Findl O. Intraocular lens calculation
accuracy limits in normal eyes. J Cataract Refract Surg 2008; 34:802–808
11.Li Wang, MD, PhD, Mariko Shirayama, Optimizing intraocular lens power
calculations in eyes with axial lengths above 25.0 mm, J Cataract Refract
Surg 2011; 37:2018–2027),

23
12. Sheard R, Smith G, et al, Improving the prediction accuracy of the SRK/T
formula: The T2 formula, Journal of Cataract and Refractive Surgery 2010;
36:1829–1834).
13.Petermeier, K, Gekeler F, Intraocular lens power calculation and optimized
constants for highly myopic eyes, J Cataract Refract Surg, 2009 35:1575–
1581)
14.Youngsub Eom, MD, Su-Yeon Kang, MD, Use of Corneal Power-Specific
Constants to Improve the Accuracy of the SRK/T Formula Ophthalmology
2013;120:477–481)
15.Jaime Aramberri, MD Intraocular lens power calculation after corneal
refractive surgery: Double-K method, J Cataract Refract Surg 2003;
29:2063–2068
16. Optimized IOL Constants for the ZEISS IOLMaster calculated from patient
data, http://www.augenklinik.uni-wuerzburg.de/ulib/c1.htm, ULIB,User Group
for Laser Interference Biometry, accessed the 23/4/2014.
17.Olsen T, Corydon L, Gimbel H. Intraocular lens power calculation with an
improved anterior chamber depth prediction algorithm, J Cataract Refract
Surg. 1995 May;21(3):313-9.
18.Hoffer KJ. Clinical results using the Holladay 2 intraocular lens power
formula. J Cataract Refract Surg. 2000;26(8):1233–1237.
19.Lin LI. A concordance correlation coefficient to evaluate reproducibility.
Biometrics. 1989; 45, 255-268.
20.McBride G.B, A Proposal for Strength of Agreement Criteria for Lin’s
Concordance Correlation Coefficient, NIWA Client Report: HAM 2005 – 062,
May 2005, NIWA Project: MOH 05201pp:5-6
24
Tables and graphics
Table Number 1
IOL CALCULATION WITH SRK/T FORMULA
SRK/T CALCULATION FORTARGET REFRACTION
SRK/T CALCULATION FOREMMETROPIA
MEAN 13,1 Diopters 10,31 DioptersS. DEVIATION 2,739 D 3,12 DMINIMUM 6 D 0,85 DMAXIMUM 18 D 16,5 Dn= 55 cases (eyes)
Source: Database of clinical records, Ophthalmology department, Hadassah Ein Keren Hospital,Jerusalem – Israel.
Table Number 2
POST OPERATIVE REFRACTIVE RESULTS
SPHERE CYLINDER AXIS SPHERICALEQUIVALENT
MEAN -1,436 Diopters -0,7227 Diopters 80,38 degrees -1,798 DioptersS. DEVIATION 1,184 D 0,7693 D 62,29 degrees 1,325 DMINIMUM -4,25 D -2,5 D 0 degrees -4,75 DMAXIMUM 0,25 D 1,25 D 180 degrees 0,625 Dn= 55 cases, Source: Database of clinical records, Ophthalmology department, Hadassah Ein KerenHospital, Jerusalem – Israel.
Table Number 3: IOL POWER CALCULATION USING THE T2 FORMULA
T2 FORMULA CALCULATION FORTARGET REFRACTION
T2 FORMULA CALCULATIONFOR EMMETROPIA
MEAN 12,94 Diopters 10,26 DioptersS. DEVIATION 2,889 D 3,061DMINIMUM 5,32 D 0,7039DMAXIMUM 17,85 D 15,12 Dn= 55 cases, Source: Database of clinical records, Ophthalmology department, Hadassah Ein KerenHospital, Jerusalem – Israel.
25
Table Number 4: IOL POWER CALCULATION USING T2 FORMULA + OPTIMIZED CONSTANT
T2 FORMULA + OPTIMIZED CONSTANT(119,0) FORTARGET REFRACTION
T2 FORMULA + OPTIMIZEDCONSTANT (119,0) FOREMMETROPIA
MEAN 13,17 10,44
S. DEVIATION 2,929 3,114MINIMUM 5,41 0,71MAXIMUM 18,15 15,37n= 55 cases, Source: Database of clinical records, Ophthalmology department, Hadassah Ein KerenHospital, Jerusalem – Israel.
Table Number 5: IOL POWER CALCULATION USING THE SRK/T FORMULA WITH Optimized constant(119,0)
SRK/T FORMULA WITH OPTIMIZEDCONSTANT (119,0) FORTARGET REFRACTION
SRK/T FORMULA WITHOPTIMIZED CONSTANT (119,0)FOR EMMETROPIA
MEAN 13,16 Diopters 10,42 DioptersS. DEVIATION 2,869 D 3,088 DMINIMUM 6,109 D 0,8591 DMAXIMUM 18,14 D 15,16 Dn= 55 cases. Source: Database of clinical records, Ophthalmology department, Hadassah Ein KerenHospital, Jerusalem – Israel.
Table Number 6
IOL POWER CALCULATION USING THE HOLLADAY 1 FORMULA
HOLLADAY FORMULA FORTARGET REFRACTION
HOLLADAY FORMULA FOREMMETROPIA
MEAN 12,66 9,997
S. DEVIATION 3,09 3,269MINIMUM 4,701 0,2833MAXIMUM 18,22 15,24n= 55 cases, Source: Database of clinical records, Ophthalmology department, Hadassah Ein KerenHospital, Jerusalem – Israel.

26
Table N. 7 Summary of IOL calculation using 3 optimized constants with the SRK/T formula.
Optimized Constants for the IQIOL according to keratometry.
≤ 43 : 119.3343 – 44,7 : 119.08≥ 44,7 : 118.71
Emmetropic IOL Mean: 10.43 (SD 3.112,min: 0.844 max: 15.38)
Target refraction IOL Mean: 13.17 (SD 2.89,min: 6.005 max: 18.22)
Median Absolute Error 0,3104
Mean Absolute Error 0,4538
Mean Numerical Error -0,1005
Minimum Value 0,00926
Maximum Value 2,084
Error group0,00 - 0,25 D0,25 – 0,50 D0,50 - 1,00 D1,00 – 2,00 D≥ 2,00
Percentage / Number69,09 % / 3820 % / 117,27 % / 41,81 % / 11,81 % / 1
n= 55 cases. Source: Database of clinical records, Ophthalmology department, Hadassah Ein KerenHospital, Jerusalem – Israel

27
Table N. 8 Comparison of IOL calculation formulas for Myopic eyes regarding their Error
METHOD MEDIANABSOLUTE
ERROR
MEANNUMERICAL
ERROR
MEANABSOLUTE
ERROR
ABSOLUTEERROR
MINIMUMVALUE
ABSOLUTEERROR
MAXIMUMVALUE
SRK/T 0,3 -0,048 0,4768 0 1,965
T2 0,33 0,044 0,5039 0,01081 2,0776
SRK/T WITHOPTIMIZEDCONSTANT
0,2753 -0,081 0,4565 0,01054 2,0583
T2 WITHOPTIMIZEDCONSTANT
0,3872 -0,10 0,4929 0,006628 2,174
HOLLADAY 1WITH
OPTIMIZEDCONSTANT
0,3883 0,23 0,5138 0,02211 1,5813
SRK/T 3 APERSONALIZED
CONSTANTS
0,3104 -0,1005 0,4538 0.00926 2.084
n= 55 cases. Source: Database of clinical records, Ophthalmology department, Hadassah Ein KerenHospital, Jerusalem – Israel.
28
Table N. 9 Correlation and Concordance Coefficient of Lin regarding the Absolute Error usingdifferent IOL calculation methods ( 95% Confidence Interval)
METHOD SRKT T2SRK/T +
OPTIMIZEDCONSTANT
T2 +OPTIMIZEDCONSTANT
HOLLADAY 1WITH
OPTIMIZED S.F.
SRK/T 3PERSONALIZEDA CONSTANTS
SRK/T 0,77 (95% CI0,64 to 0,86)
0,80 (95% CI0,68 to 0,88)
0,73 (95% CI0,59 to 0,84)
0,70 (95% CI0,54 to 0,82)
0,7753 (95%CI0,6437 to 0,8623)
T2 0,90 (95% CI0,83 to 0,94)
0,93 (95% CI0,89 to 0,96)
0,80 (95% CI0,68 to 0,88)
0,9112 (95% CI:0,8530 to 0,9470)
SRK/T +OPTIMIZEDCONSTANT
0,91 (95% CI0,85 to 0,95)
0,78 (95% CI0,65 to 0,87)
0,9672 (95% CI:0,9446 to 0,9807)
T2 + OPTIMIZEDCONSTANT
0,72 (95% CI0,56 to 0,82)
0,9596 (95%CI:0,9320 to
0,9761)
HOLLADAY 1WITHOPTIMIZEDSURGEONFACTOR
0,7494(95% CI: 0,6071 to
0,8451)
n= 55 cases. Source: Database of clinical records, Ophthalmology department, Hadassah Ein KerenHospital, Jerusalem – Israel.

29
Table N. 10 Comparison of the correlation between the Absolute error from various methods forIOL calculation and the Mean Keratometry, in myopic eyes.
METHOD Pearson correlation coefficient(Absolute error and Mean K)
p value
SRK/T 0,089 0,517
SRK/T+OPTIMIZED CONSTANT 0,0051 0,970
T2 0,134 0,329
T2 + OPTIMIZED CONSTANT -0,017 0,903
HOLLADAY 1 OPTIMIZED S.F. -0,0114 0,934
SRK/T+3 O. CONSTANTS -0,012 0,93
n= 55 cases. Source: Database of clinical records, Ophthalmology department, Hadassah Ein KerenHospital, Jerusalem – Israel

30
Table N. 11 A Median absolute error for different IOL Calculation methods related to the MeanKeratometric values.
MeanKeratometry
AbsoluteError T2
AbsoluteError
SRK/T
AbsoluteError
Holladay1 with
OptimizedSurgeonFactor
AbsoluteError
SRK/T +Optimized
AConstant
AbsoluteError T2 +Optimized
AConstant
AbsoluteMedian
AbsoluteError
SRK/T 3O.C. N
41 - 43 D
0,3192min 0,04max: 1,45
0,3075min:0,045max: 1,25
0,285min:0,085max:1,476
0,243min:0,111max:1,386
0,4814min:0,025max:1,597
0,337min:0,029max:1,54 12
43 - 44,7 D
0,311min: 0,010max:2,078
0,315min: 0max:1,965
0,4535min: 0,026max: 1,58
0,2645min: 0,010max:2,058
0,3629min:0,0066max:2,174
0,314min:0,0377max:2,084 25
≥44,7 D
0,3863min:0,060.max1,35
0,2625min:0.max:1,59
0,3371min: 0,022max: 1,41
0,2981min: 0,028max: 1,74
0,4018min:0,012max: 1,53
0,3037min:0,009max:1,56 18
Total n= 55 cases. Source: Database of clinical records, Ophthalmology department, Hadassah EinKeren Hospital, Jerusalem – Israel

31
Table N. 11 B Median absolute error for different IOL Calculation methods related to the MeanKeratometric values.
MeanKeratometry
MedianAbsoluteError T2
MedianAbsolute
ErrorSRK/T
MedianAbsolute
ErrorHolladay 1
+O. S.F.
MedianAbsolute
ErrorSRK/T +
O. C.
MedianAbsoluteError T2+
O. C.
MedianAbsolute Error
SRK/T 3O.C.
N
40 - 42 D 0,365 0,2375 0,5409 0,2601 0,5175 0,25 4
42 - 44 D 0,3125 0,3150 0,3404 0,264 0,38 0,36 27
44-46 D 0,373 0,450 0,455 0,2753 0,230 0,1957 19
46 - 48 D 0,4928 0,225 0,355 0,22 0,387 0,30 5
Total n= 55 cases. Source: Database of clinical records, Ophthalmology department, Hadassah EinKeren Hospital, Jerusalem – Israel

32
Table N. 12 Comparison of the correlation between the Absolute error from various methods forIOL calculation and the Axial length, in myopic eyes.
METHOD Pearson correlation coefficient(Absolute error and Axial Length )
p value
SRK/T 0,0091 0,947
SRK/T+OPTIMIZED CONSTANT 0,075 0,584
T2 -0,0429 0,756
T2 + OPTIMIZED CONSTANT 0,0832 0,546
HOLLADAY 1 OPTIMIZED S.F. 0,1136 0,409
SRK/T + 3 OPTIMIZEDPERSONALIZED CONSTANTS
0,088 0,52
n= 55 cases. Source: Database of clinical records, Ophthalmology department, Hadassah Ein KerenHospital, Jerusalem – Israel

33
Table N. 13 Median absolute error for different IOL Calculation methods related to the AxialLength values.
Axial length(mm)
MedianAbsoluteError T2
MedianAbsolute
ErrorSRK/T
MedianAbsolute
ErrorHolladay 1
O. S.F
MedianAbsolute
Error SRK/TOptimizedConstant
MedianAbsoluteError T2
OptimizedConstant
MedianAbsolute
ErrorSRK/T, 3
OptimizedConstants N
25-26 0,3134 0,1775 0,1834 0,104 0,1899 0,12 1426-27 0,33 0,315 0,4535 0,294 0,4806 0,41 2127-28 0,351 0,43 0,4552 0,4746 0,4171 0,453 1328-29 0,2874 0,3 0,3897 0,3577 0,4543 0,3028 529-30 0,608 0,41 0,1086 0,4744 0,6983 0,4975 130-31 0,09188 0,205 0,7757 0,1596 0,01747 0,140 1
n= 55 cases. Source: Database of clinical records, Ophthalmology department, Hadassah EinKeren Hospital, Jerusalem – Israel
34
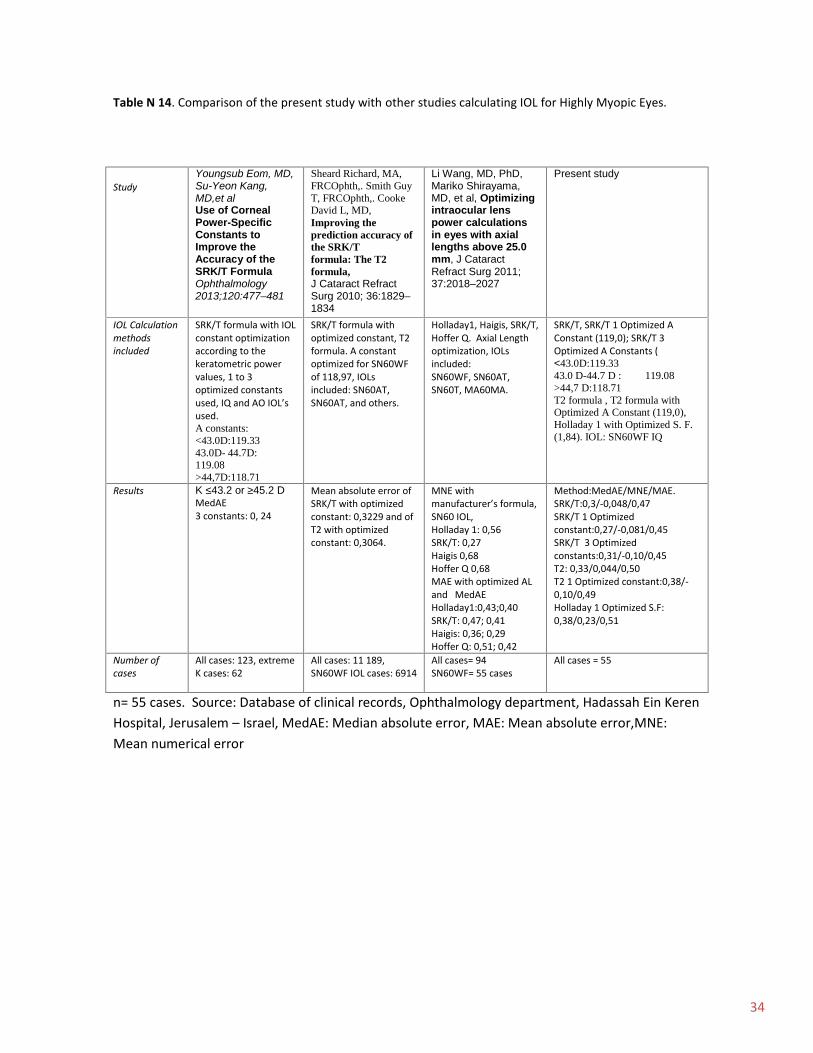
Table N 14. Comparison of the present study with other studies calculating IOL for Highly Myopic Eyes.
n= 55 cases. Source: Database of clinical records, Ophthalmology department, Hadassah Ein KerenHospital, Jerusalem – Israel, MedAE: Median absolute error, MAE: Mean absolute error,MNE:Mean numerical error
StudyYoungsub Eom, MD,Su-Yeon Kang,MD,et alUse of CornealPower-SpecificConstants toImprove theAccuracy of theSRK/T FormulaOphthalmology2013;120:477–481
Sheard Richard, MA,FRCOphth,. Smith GuyT, FRCOphth,. CookeDavid L, MD,Improving theprediction accuracy ofthe SRK/Tformula: The T2formula,J Cataract RefractSurg 2010; 36:1829–1834
Li Wang, MD, PhD,Mariko Shirayama,MD, et al, Optimizingintraocular lenspower calculationsin eyes with axiallengths above 25.0mm, J CataractRefract Surg 2011;37:2018–2027
Present study
IOL Calculationmethodsincluded
SRK/T formula with IOLconstant optimizationaccording to thekeratometric powervalues, 1 to 3optimized constantsused, IQ and AO IOL’sused.A constants:<43.0D:119.3343.0D- 44.7D:119.08>44,7D:118.71
SRK/T formula withoptimized constant, T2formula. A constantoptimized for SN60WFof 118,97, IOLsincluded: SN60AT,SN60AT, and others.
Holladay1, Haigis, SRK/T,Hoffer Q. Axial Lengthoptimization, IOLsincluded:SN60WF, SN60AT,SN60T, MA60MA.
SRK/T, SRK/T 1 Optimized AConstant (119,0); SRK/T 3Optimized A Constants (<43.0D:119.3343.0 D-44.7 D : 119.08>44,7 D:118.71T2 formula , T2 formula withOptimized A Constant (119,0),Holladay 1 with Optimized S. F.(1,84). IOL: SN60WF IQ
Results K ≤43.2 or ≥45.2 DMedAE3 constants: 0, 24
Mean absolute error ofSRK/T with optimizedconstant: 0,3229 and ofT2 with optimizedconstant: 0,3064.
MNE withmanufacturer’s formula,SN60 IOL,Holladay 1: 0,56SRK/T: 0,27Haigis 0,68Hoffer Q 0,68MAE with optimized ALand MedAEHolladay1:0,43;0,40SRK/T: 0,47; 0,41Haigis: 0,36; 0,29Hoffer Q: 0,51; 0,42
Method:MedAE/MNE/MAE.SRK/T:0,3/-0,048/0,47SRK/T 1 Optimizedconstant:0,27/-0,081/0,45SRK/T 3 Optimizedconstants:0,31/-0,10/0,45T2: 0,33/0,044/0,50T2 1 Optimized constant:0,38/-0,10/0,49Holladay 1 Optimized S.F:0,38/0,23/0,51
Number ofcases
All cases: 123, extremeK cases: 62
All cases: 11 189,SN60WF IOL cases: 6914
All cases= 94SN60WF= 55 cases
All cases = 55
35
Graph Number 1: Mean Numerical Error from the methods used in the present study
n= 55 cases. Source: Database of clinical records, Ophthalmology department, Hadassah Ein KerenHospital, Jerusalem – Israel.
-0,04882
0,04464
0,2323-0,08095
-0,1094
-0,1005
-0,15 -0,1 -0,05 0 0,05 0,1 0,15 0,2 0,25
SRK/T
T2
HOLLADAY1
SRK/T AND 1 OPTIMIZED CONSTANT
T2 AND OPTIMIZED CONSTANT
SRK/T 3 OPTIMIZED A CONSTANTS
Graph N. 1, Mean Numerical Error
36
Graph N.2 Median Absolute Error from the methods used in the present study
n= 55 cases. Source: Database of clinical records, Ophthalmology department, Hadassah Ein KerenHospital, Jerusalem – Israel.
0,3
0,33
0,38830,2753
0,3872
0 0,05 0,1 0,15 0,2 0,25 0,3 0,35 0,4 0,45
SRK/T
T2
HOLLADAY1 OPTIMIZED SF.
SRK/T AND 1 OPTIMIZED A CONSTANT
T2 AND OPTIMIZED A CONSTANT
Graph N2. Median Absolute Error

37
Graphic N. 3, Comparison of Absolute errors of T2 + Optimized Constant and SRT/T + Optimizedconstant
n= 55 cases. Source: Database of clinical records, Ophthalmology department, Hadassah Ein KerenHospital, Jerusalem – Israel
0,0 0,5 1,0 1,5 2,0 2,50,0
0,5
1,0
1,5
2,0
2,5
ABSOLUTE ERROR SRKT OC
ABSO
LUTE
ER
RO
R T
2 O
C

38
Graphic N. 4, Comparison of absolute errors of SRK/T + Optimized Constant and T2 formula
n= 55 cases. Source: Database of clinical records, Ophthalmology department, Hadassah Ein KerenHospital, Jerusalem – Israel
0,0 0,5 1,0 1,5 2,0 2,50,0
0,5
1,0
1,5
2,0
2,5
ABSOLUTE ERROR T2
ABSO
LUTE
ER
RO
R S
RKT
OC
39
Graphic N. 5, Comparison of absolute error of T2 + Optimized Constant and T2 formula
n= 55 cases. Source: Database of clinical records, Ophthalmology department, Hadassah Ein KerenHospital, Jerusalem – Israel
0,0 0,5 1,0 1,5 2,0 2,50,0
0,5
1,0
1,5
2,0
2,5
ABSOLUTE ERROR T2
ABSO
LUTE
ER
RO
R T
2 O
C

40
Graphic N. 6, Comparison of absolute error of SRK/T with 3 personalized constants according tothe keratometric values and the T2 formula
n= 55 cases. Source: Database of clinical records, Ophthalmology department, Hadassah Ein KerenHospital, Jerusalem – Israel
0,0 0,5 1,0 1,5 2,0 2,50,0
0,5
1,0
1,5
2,0
2,5
ABSOLUTE ERROR T2
ABSO
LUTE
ER
RO
R S
RK/
T +
3 O
PTIM
IZED
CO
NST
ANTS

41
Graphic N. 7, Comparison of absolute error of SRK/T with 3 personalized constants according tothe keratometric values and the SRK/T with 1 optimized constant of 119,0
n= 55 cases. Source: Database of clinical records, Ophthalmology department, Hadassah Ein KerenHospital, Jerusalem – Israel
0,0 0,5 1,0 1,5 2,0 2,50,0
0,5
1,0
1,5
2,0
2,5
ABSOLUTE ERROR SRK/T +1 OPTIMIZED CONSTANT
ABSO
LUTE
ER
RO
R S
RK/
T +
3 O
PTIM
IZED
CO
NST
ANTS
42
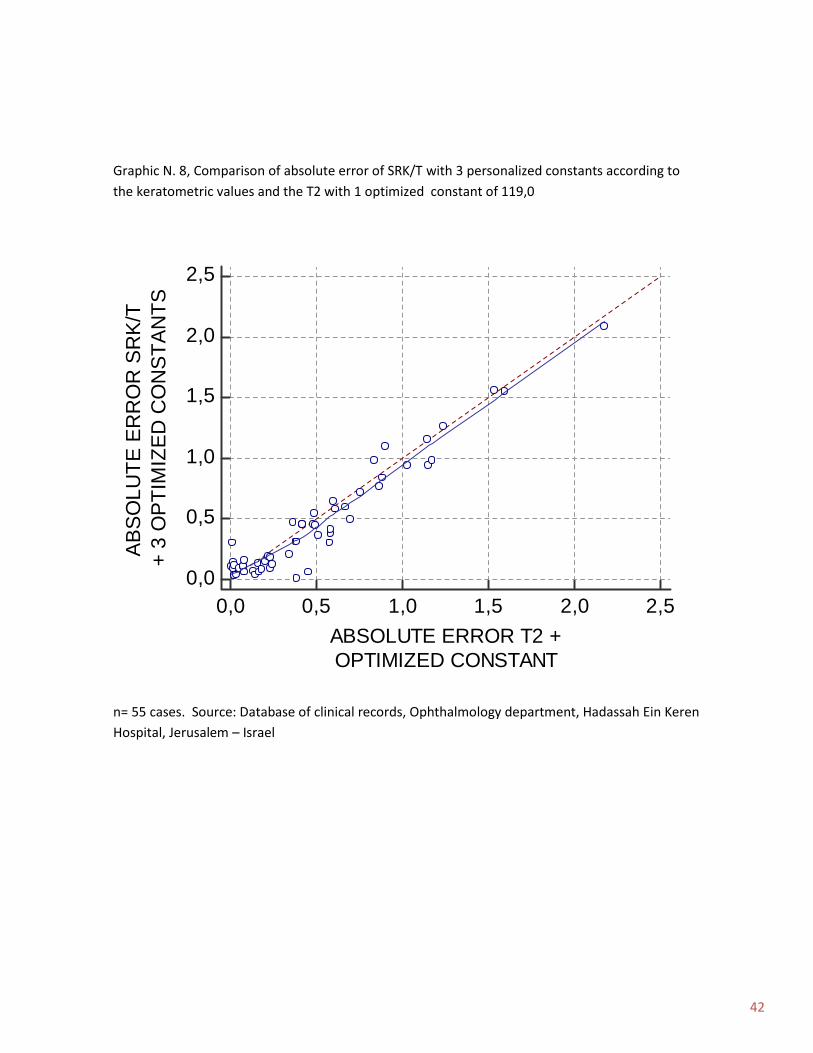
Graphic N. 8, Comparison of absolute error of SRK/T with 3 personalized constants according tothe keratometric values and the T2 with 1 optimized constant of 119,0
n= 55 cases. Source: Database of clinical records, Ophthalmology department, Hadassah Ein KerenHospital, Jerusalem – Israel
0,0 0,5 1,0 1,5 2,0 2,50,0
0,5
1,0
1,5
2,0
2,5
ABSOLUTE ERROR T2 +OPTIMIZED CONSTANT
ABSO
LUTE
ER
RO
R S
RK/
T+
3 O
PTIM
IZED
CO
NST
ANTS