Embed Size (px)
Citation preview
Fan Language Testing in Asia 2014, 4:6http://www.languagetestingasia.com/content/4/1/6
RESEARCH Open Access
Chinese test takers’ attitudes towards the VersantEnglish Test: a mixed-methods approachJinsong Fan
Correspondence:[email protected] Testing Center, Collegeof Foreign Languages andLiteratures, Fudan University, No.220, Handan Road, Yangpu District,Shanghai 200433, People’s Republicof China
©Lp
Abstract
This study investigated Chinese test takers’ attitudes towards the Versant EnglishTest (VET), an automated spoken English test developed by Pearson KnowledgeTechnologies. Based on previous attitudinal studies, ‘attitude’ in this study wasconceptualized as a hypothetical psychological construct which consisted of threecomponents: beliefs, opinions, and emotions. In data collection and analysis, thisstudy adopted the mixed-methods sequential explanatory design. Quantitativedata were collected through a questionnaire while qualitative data were collectedthrough follow-up semi-structured interviews and focus-group discussions. Thefindings of this study indicate that test takers had overall positive attitudes towardsthe VET, believing that the VET largely reflected their spoken English ability. Testtakers’ gender and background had no significant relationship with their reportedattitude. Despite the satisfactory face validity of the VET, this study also found thattest takers still preferred the more traditional speaking tests (e.g., the IELTS-style liveinterviews) because these tests were believed to be more authentic and tap into awider range of English speaking competencies. The findings of this study haveimplications for the VET provider in light of the further improvement and promotionof the test. Meanwhile, the findings are also meaningful to other providers of spokenEnglish tests of a similar nature.
Keywords: Test taker’s attitude; Test validity; Versant English Test
BackgroundAttitude, defined as ‘a psychological tendency that is expressed by evaluating a particular
entity with some degree of favor or disfavor’ (Eagly & Chaiken, 1993, p. 1), has been
extensively researched in social psychology. In the field of second language acquisition,
numerous studies have demonstrated that a learner’s positive attitudes towards the target
language or the target-language culture have a beneficial impact on their language
learning (e.g., Brown, 2000; Ellis, 1999). Gardner (1985), for example, believes that
attitude and other affective variables are as important as aptitude for language achieve-
ment. Despite the widely recognized importance of attitude in second language learning,
there is no evidence that it is adequately investigated in the field of language testing
(Murray et al. 2012).
Two reasons might explain the paucity of attitudinal research in language testing.
First, test taker’s attitude towards a language test is often considered as equivalent to
face validity, a concept which is defined as ‘surface credibility and public acceptability
2014 Fan; licensee Springer. This is an Open Access article distributed under the terms of the Creative Commons Attributionicense (http://creativecommons.org/licenses/by/4.0), which permits unrestricted use, distribution, and reproduction in any medium,rovided the original work is properly credited.
Fan Language Testing in Asia 2014, 4:6 Page 2 of 17http://www.languagetestingasia.com/content/4/1/6
of a test’ (Ingram, 1977, p. 18). Since face validity is based on subjective evaluation of
laypeople and not a statistical model, it is frequently dismissed as unscientific and
irrelevant by testing researchers (e.g., Bachman, 1990; Stevenson, 1985). Secondly,
‘attitude’ itself is an elusive hypothetical construct which cannot be directly measured
(e.g., Eagly & Chaiken, 1993). To date, several terms have been used to describe a test
taker’s attitude towards a language test including, for example, ‘reactions’ (Elder et al.
2002), ‘feedback’ (Brown, 1993), ‘views’ (Wu, 2008), and ‘psychological factors’ (Jin &
Cheng, 2013). Similarly, this construct has been interpreted and operationalized in
manifold ways in previous studies (e.g., Fan & Ji, 2014; Murray, et al., 2012; Rasti, 2009;
Zhao & Cheng, 2010).
The first reason, i.e. attitude is synonymous to face validity, is not tenable because
attitude as a hypothetical construct has a wider scope which often subsumes face
validity. Furthermore, in response to the argument that face validity is unscientific and
irrelevant, some convincing counter-arguments have been presented by researchers.
For example, Alderson et al. (1995, p. 173) argue that face validity is important because
if test takers consider a test to be face valid, ‘they are more likely to perform to the best
of their ability on that test and to respond appropriately to items’. According to Karelitz
(2013, p. 2), face validity is important because it can affect examinees’ motivation to
prepare for and perform well on a language test, and the willingness of potential exam-
inees to take the test. Drawing upon the recent developments in test validation theory
(e.g., Kane, 2006), Karelitz cogently presents how to integrate evidence about face valid-
ity into building an interpretative validity argument. In addition to these counter-
arguments about the importance of examining face validity, some empirical studies
have demonstrated that how test takers perceive a test is related to how they prepare
for the test and respond to the test items (e.g., Elder, et al., 2002; Fan & Ji, 2014; Zhao
& Cheng, 2010), hinting that attitude is related, directly or indirectly, to construct
validity. Murray et al. (2012) argue that a test taker’s attitude towards a language test
forms part of test impact, which is one of the essential qualities in Bachman and
Palmer’s (1996) test usefulness framework and described by Shohamy (1998) as conse-
quential validity. Messick (1989) also explicitly recommends that attitude be considered
as a crucial source of evidence for construct validity.
In relation to the second reason, i.e. ‘attitude’ is a hypothetical construct which is
difficult to operationalize and measure, we believe it is important to apply the general
theoretical frameworks of this construct in social psychology to the needs of a particular
research situation (see also Fan & Ji, 2014). In the domain of social psychology, attitude is
generally believed to be a construct consisting of three inter-related components: affective,
cognitive, and conative (e.g., Eagly & Chaiken, 1993), and this tripartite division of attitude
has been widely accepted in language studies (e.g., Baker, 1992; Ladegaard, 2000). Based
on this definition, Murray et al. (2012, p. 7) argue that a test taker’s attitude towards a
language test should be a unitary construct consisting of three components: beliefs (that a
proposition is or is not true), opinions (that an actual or hypothetical action should or
should not happen), and emotions (corresponding to ‘affective’ in the tripartite division of
attitude). Given the purpose of this study which is to investigate test takers’ attitudes
towards the Versant English Test (VET), a spoken English test developed by Pearson
Knowledge Technologies (Pearson, 2008), we decided to adopt the tripartite division of
attitude (e.g., Baker, 1992) as a broad point of reference and Murray et al.’s (2012)

Fan Language Testing in Asia 2014, 4:6 Page 3 of 17http://www.languagetestingasia.com/content/4/1/6
interpretations of this construct. The conceptualization of attitude in this study is pre-
sented schematically in Figure 1.
The Versant English Test
The VET is a fully automated spoken English test developed by Pearson. According to
the test description and validation summary published by Pearson (2008, p. 1), the VET
is intended to evaluate the facility in spoken English of people whose native language is
not English. ‘Facility’ is defined as ‘the ability to understand the spoken language on
everyday topics and to speak appropriately in response at native-like conversational
pace in an intelligible form of the language’ (Bernstein et al. 2010, p. 358). The VET
can be delivered over the telephone or on a computer. As a fully automated spoken
English test, the VET system can analyze test takers’ responses and report their test
scores within minutes of the completion of the test. Test administrators and score users
can view and print out test scores from a password-protected website (Pearson, 2008).
The VET consists of six parts: Reading, Repeat, Short Answer Questions, Sentence
Builds, Story Retelling, and Open Questions. The test format of the VET is presented
in Table 1 together with a brief description of each task in the VET and the number of
items in each part. The test results that test takers receive include a numeric composite
score and four diagnostic subscores in Sentence Mastery, Vocabulary, Fluency, and
Pronunciation (Pearson, 2008). According to Bernstein et al. (2010, p. 360), of the four
diagnostic scores, Sentence Mastery and Vocabulary measure the linguistic content of
the response, and Fluency and Pronunciation measure the manner in which the
response is said. Accurate content indicates how well the test taker understands the
prompt and responds with appropriate linguistic content while the manner scores
indicate how close the test taker’s articulation, rhythm, phrasing, and pausing are to the
majority of native speakers, as determined by statistical models based on a large sample
of native speaker data. Of the 63 items in the VET, 57 responses are currently used in
the automatic scoring, excluding the two items in Open Questions and each first item
in Reading, Repeat, Short Answer Questions, and Sentence Builds (Pearson, 2008). For
Figure 1 The conceptualization of attitude in this study (adapted from Murray et al., 2012).
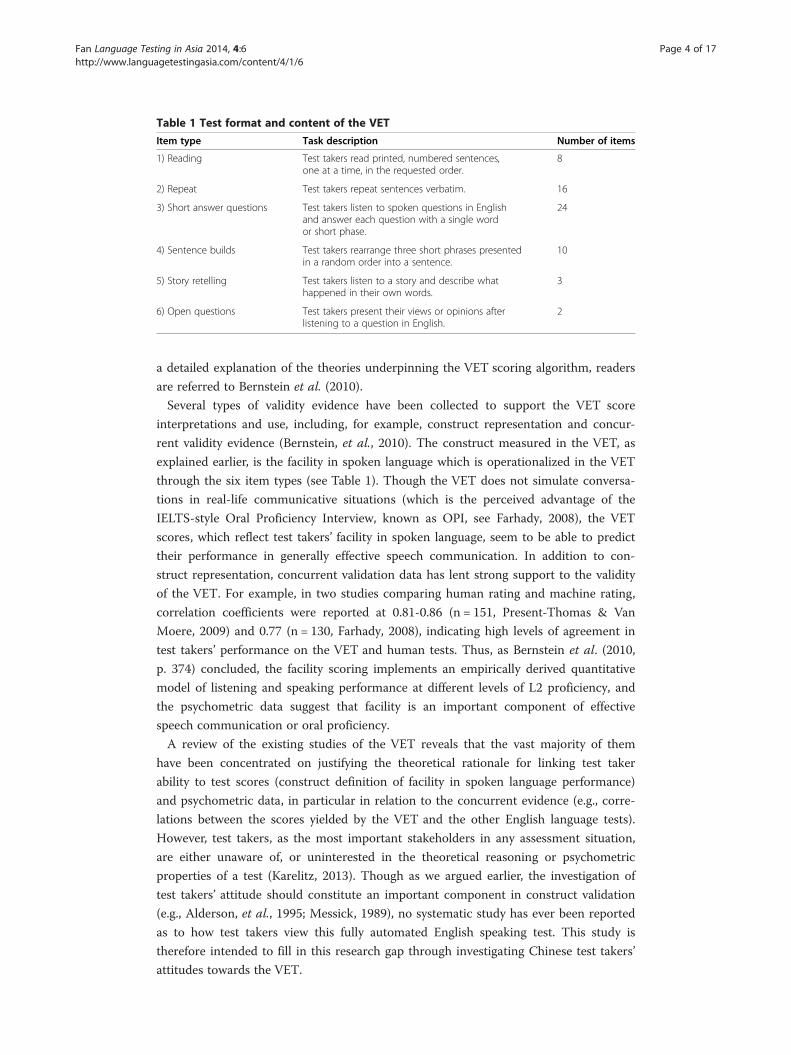
Table 1 Test format and content of the VET
Item type Task description Number of items
1) Reading Test takers read printed, numbered sentences,one at a time, in the requested order.
8
2) Repeat Test takers repeat sentences verbatim. 16
3) Short answer questions Test takers listen to spoken questions in Englishand answer each question with a single wordor short phase.
24
4) Sentence builds Test takers rearrange three short phrases presentedin a random order into a sentence.
10
5) Story retelling Test takers listen to a story and describe whathappened in their own words.
3
6) Open questions Test takers present their views or opinions afterlistening to a question in English.
2
Fan Language Testing in Asia 2014, 4:6 Page 4 of 17http://www.languagetestingasia.com/content/4/1/6
a detailed explanation of the theories underpinning the VET scoring algorithm, readers
are referred to Bernstein et al. (2010).
Several types of validity evidence have been collected to support the VET score
interpretations and use, including, for example, construct representation and concur-
rent validity evidence (Bernstein, et al., 2010). The construct measured in the VET, as
explained earlier, is the facility in spoken language which is operationalized in the VET
through the six item types (see Table 1). Though the VET does not simulate conversa-
tions in real-life communicative situations (which is the perceived advantage of the
IELTS-style Oral Proficiency Interview, known as OPI, see Farhady, 2008), the VET
scores, which reflect test takers’ facility in spoken language, seem to be able to predict
their performance in generally effective speech communication. In addition to con-
struct representation, concurrent validation data has lent strong support to the validity
of the VET. For example, in two studies comparing human rating and machine rating,
correlation coefficients were reported at 0.81-0.86 (n = 151, Present-Thomas & Van
Moere, 2009) and 0.77 (n = 130, Farhady, 2008), indicating high levels of agreement in
test takers’ performance on the VET and human tests. Thus, as Bernstein et al. (2010,
p. 374) concluded, the facility scoring implements an empirically derived quantitative
model of listening and speaking performance at different levels of L2 proficiency, and
the psychometric data suggest that facility is an important component of effective
speech communication or oral proficiency.
A review of the existing studies of the VET reveals that the vast majority of them
have been concentrated on justifying the theoretical rationale for linking test taker
ability to test scores (construct definition of facility in spoken language performance)
and psychometric data, in particular in relation to the concurrent evidence (e.g., corre-
lations between the scores yielded by the VET and the other English language tests).
However, test takers, as the most important stakeholders in any assessment situation,
are either unaware of, or uninterested in the theoretical reasoning or psychometric
properties of a test (Karelitz, 2013). Though as we argued earlier, the investigation of
test takers’ attitude should constitute an important component in construct validation
(e.g., Alderson, et al., 1995; Messick, 1989), no systematic study has ever been reported
as to how test takers view this fully automated English speaking test. This study is
therefore intended to fill in this research gap through investigating Chinese test takers’
attitudes towards the VET.

Fan Language Testing in Asia 2014, 4:6 Page 5 of 17http://www.languagetestingasia.com/content/4/1/6
The present study
The main objective of this study is to investigate Chinese test takers’ attitudes to the
VET, adopting the conceptualization of ‘attitude’ as schematized in Figure 1. Though
some studies have been reported of test takers’ attitude towards language tests (e.g.,
Fan & Ji, 2014; Jin & Cheng, 2013; Murray, et al., 2012; Rasti, 2009; Zhao & Cheng,
2010), none of them was focused on a computer-based English speaking test, not to
mention a fully automated one. The anecdotal evidence we have collected through
interacting with Chinese students and teachers seems to suggest that many of them do
not like fully automated speaking tests; neither do they place sufficient trust in the
validity of such tests. The investigations of test takers’ attitudes to the VET can therefore
help us clarify whether such anecdotal evidence holds true.
Secondly, test takers’ attitude has been regarded as part of test impact (Murray, et al.,
2012; Zhao & Cheng, 2010). A fair test, according to Kunnan (2000; see also AERA,
APA, & NCME, 1999), should function equally among different groups of test takers in
terms of both psychometric properties and impact. It is therefore essential to investigate
whether demographic and/or experiential variables affect test takers’ reported attitude. In
the present study, the two most relevant demographic and experiential variables are
gender and background.
Finally, as suggested by Murray et al. (2012), while investigating test takers’ attitude,
it is essential to pinpoint the sources of the positivity and negativity in their reported
attitude. A clear understanding of the sources of attitude can help the test provider and
validators paint a fine-grained picture about test takers’ attitude, thus paving the way
for more informed decisions in future test improvement and test score interpretations.
Contextualized within the existing research literature, this present study seeks to ad-
dress the following three research questions:
RQ1. What is the overall pattern of test takers’ attitude towards the VET?
RQ2. What is the relationship between test takers’ gender and background and their
reported attitude to the VET?
RQ3. What are the sources of the positivity and negativity in test takers’ reported atti-
tude to the VET?
MethodParticipants
A total of 118 students from a research university in east China participated in the
questionnaire survey. For all participants in this study, Chinese is their first language.
Of the 118 students, 72 (61%) were female and 46 (39%) were male. These students
came from different academic backgrounds with 54 (45.8%) of them majoring in the
domain of humanities and 64 (54.2%) in science. At the time of investigation, all of
them were studying for their Bachelor’s degree at this university. After the questionnaire
survey, 12 students also participated in the follow-up semi-structured interviews on a
voluntary basis, and another six students participated in two focus-group discussions with
three students in each group.
Instruments
Two instruments were adopted for this study: a questionnaire and an interview guide.
The questionnaire was designed on the basis of the conceptualization of ‘attitude’ as
Fan Language Testing in Asia 2014, 4:6 Page 6 of 17http://www.languagetestingasia.com/content/4/1/6
schematized in Figure 1. The initial draft of the questionnaire was intended to be as
comprehensive as possible, containing a total of 30 items, all on a six point Likert scale
of agreement (with ‘1’ standing for ‘completely disagree’ and ‘6’ standing for ‘completely
agree’). The six point scale was adopted with a view to avoiding central tendency effect
when respondents answered the questionnaire items (Dornyei & Taguchi, 2011). In line
with the conceptualization of ‘attitude’ in this study (see Figure 1), the 30 items were
generally divided into three components: beliefs, opinions, and emotions. At the end of
the questionnaire, participants were required to provide their personal information,
including gender and academic background.
After the questionnaire was drafted, it underwent several revisions. First, it was sent
to five experienced researchers in the field of language testing for comment. As a result,
seven items were deleted because they were believed to be either irrelevant or confusing
to the prospective respondents. Then the revised questionnaire was piloted among a
group of 52 students from the same university where the experiment was to be
conducted. Based on the feedback from these students and some initial data analyses
(e.g., exploratory factor analysis), another three items were deleted, leaving a total of 20
items in the final version of the questionnaire. Cronbach’s α for the pilot study data was
0.80 (n = 20), indicating satisfactory internal consistency.
The interview guide, designed on the basis of the questionnaire, consisted of six
open-ended questions, including, for example, asking respondents to briefly describe
their test-taking experience, comment on the design, validity, and delivery of the VET,
and their primary motivation in taking the VET. The six questions in the interview
guide were also used to scaffold the focus-group discussions.
Data collection procedures
The participants in this study were recruited through emails. Two months before
the experiment, the researcher sent emails to 300 students, calling for participation
in this study. Thanks to the generous support from Pearson Knowledge Technologies,
the provider of the VET, all participants in this study were exempt from the
charges of taking the VET. In response to the call for participation, 161 students
volunteered to participate in this study. The rather low response rate is under-
standable since currently the VET is not widely known to Chinese university students.
Upon receiving the confirmation of participation, we sent the VET information pack to
students, including an introduction to the VET and practice test papers. Students were
also encouraged to visit the official website of the VET to obtain further information
about the test.
The VET was administered to the participants in April, 2014 at two language
laboratories. Efforts were made to ensure that the testing procedures conformed to the
good testing practice as prescribed by the VET provider (Pearson, 2008). Due to the
bad weather on the examination day, only 118 participants took the test and completed
the survey questionnaire. Before taking the VET, each participant signed the consent
form. The questionnaire was administered to the participants immediately after they
had completed the VET. The interview and focus-group data were collected in the two
weeks following the examination. All interviews and focus-group discussions were
conducted on an anonymous basis, which were recorded, and then transcribed
verbatim for analysis.
Fan Language Testing in Asia 2014, 4:6 Page 7 of 17http://www.languagetestingasia.com/content/4/1/6
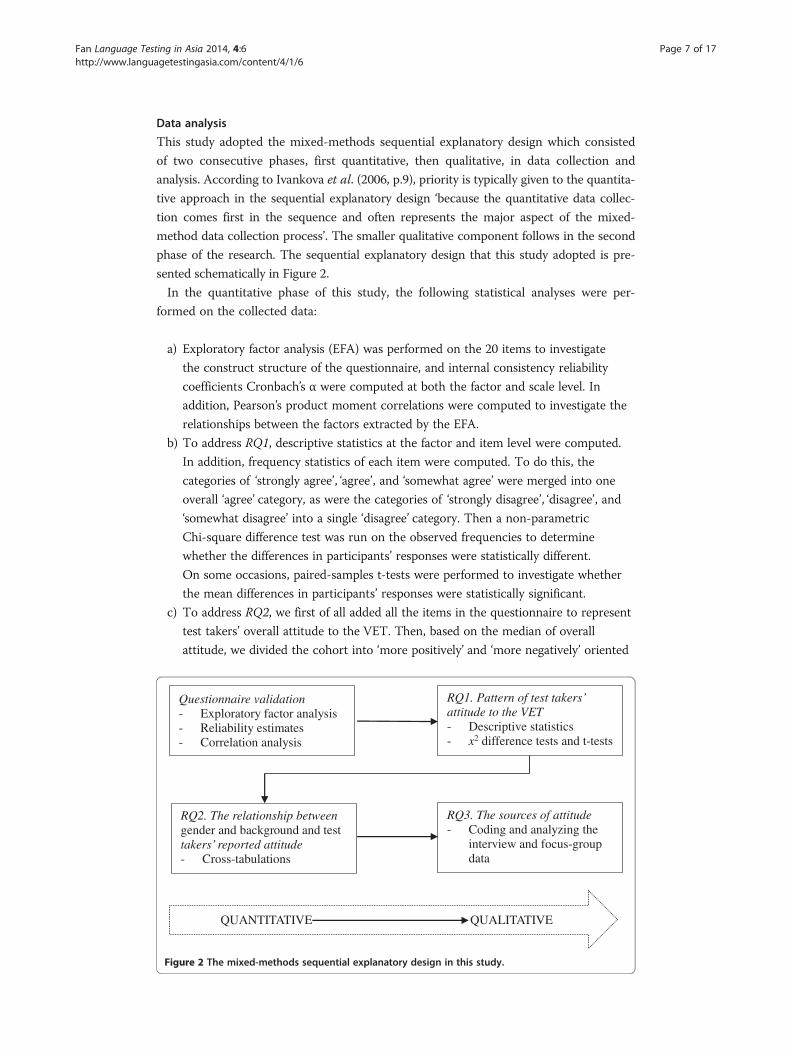
Data analysis
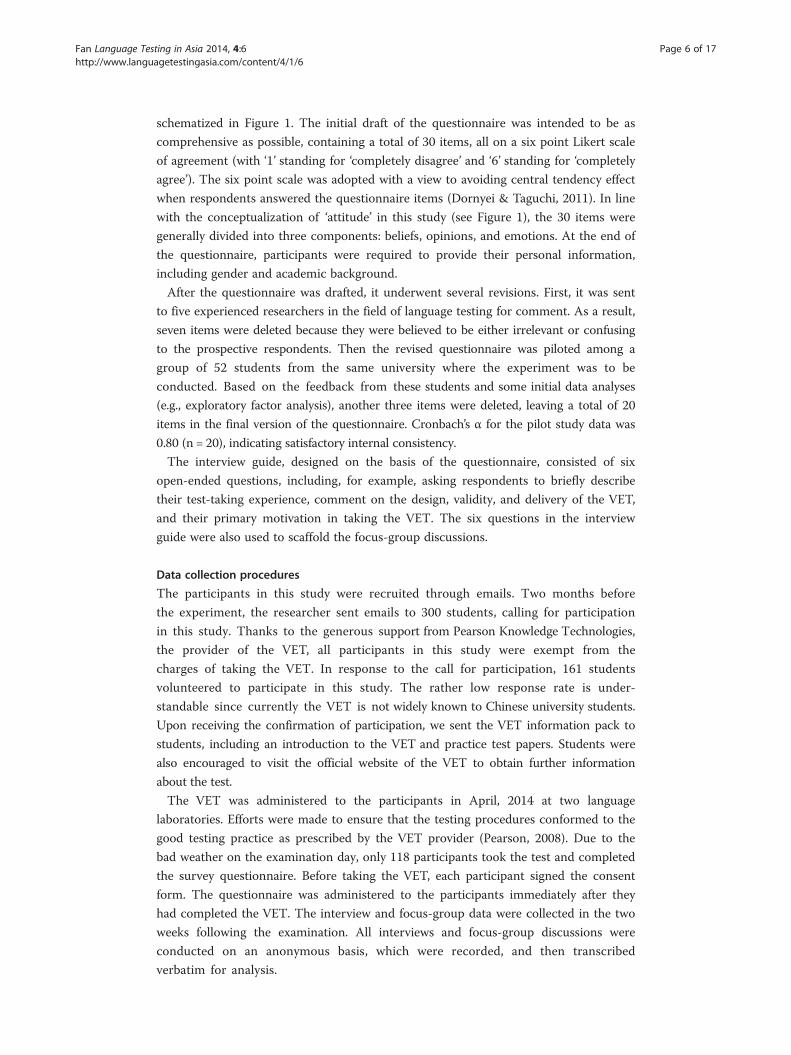
This study adopted the mixed-methods sequential explanatory design which consisted
of two consecutive phases, first quantitative, then qualitative, in data collection and
analysis. According to Ivankova et al. (2006, p.9), priority is typically given to the quantita-
tive approach in the sequential explanatory design ‘because the quantitative data collec-
tion comes first in the sequence and often represents the major aspect of the mixed-
method data collection process’. The smaller qualitative component follows in the second
phase of the research. The sequential explanatory design that this study adopted is pre-
sented schematically in Figure 2.
In the quantitative phase of this study, the following statistical analyses were per-
formed on the collected data:
a) Exploratory factor analysis (EFA) was performed on the 20 items to investigate
the construct structure of the questionnaire, and internal consistency reliability
coefficients Cronbach’s α were computed at both the factor and scale level. In
addition, Pearson’s product moment correlations were computed to investigate the
relationships between the factors extracted by the EFA.
b) To address RQ1, descriptive statistics at the factor and item level were computed.
In addition, frequency statistics of each item were computed. To do this, the
categories of ‘strongly agree’, ‘agree’, and ‘somewhat agree’ were merged into one
overall ‘agree’ category, as were the categories of ‘strongly disagree’, ‘disagree’, and
‘somewhat disagree’ into a single ‘disagree’ category. Then a non-parametric
Chi-square difference test was run on the observed frequencies to determine
whether the differences in participants’ responses were statistically different.
On some occasions, paired-samples t-tests were performed to investigate whether
the mean differences in participants’ responses were statistically significant.
c) To address RQ2, we first of all added all the items in the questionnaire to represent
test takers’ overall attitude to the VET. Then, based on the median of overall
attitude, we divided the cohort into ‘more positively’ and ‘more negatively’ oriented
Figure 2 The mixed-methods sequential explanatory design in this study.

Fan Language Testing in Asia 2014, 4:6 Page 8 of 17http://www.languagetestingasia.com/content/4/1/6
groups. Finally, cross-tabulations were run to find out whether test takers’ gender
and background had any significant effect on the tendency of their reported
attitude to the VET.
The qualitative component, according to Figure 2, followed the quantitative phase of
this study. To address RQ3, the qualitative data collected through individual interviews
and focus-group discussions were coded and analyzed, adopting an inductive approach
(Given, 2008). To do this, a coding scheme was developed for this study after the re-
searcher conducted several preliminary readings to identify the salient and recurring
themes in the data. Then based on the coding scheme, two researchers coded the tran-
scriptions of the interview and focus-group data independently. Inter-coder agreement
was confirmed by calculating both Cohen’s kappa statistic (k = 0.81) and the percentage
of agreement between the two coders (93.17%). Quantitative analyses in this study were
performed in IBM SPSS 21.0 (IBM, 2012), and the level of all tests of significance was
set at 0.05. The qualitative data in this study were analyzed with the aid of NVivo 8.0
(Richards, 2005).
ResultsExploratory factory analysis and reliability estimates
Principal axis factoring with oblimin rotation was performed on the 20 items in the
questionnaire. Oblimin rotation was adopted to enhance the interpretability of factor
solutions because this questionnaire was basically measuring one overall construct, i.e.
test takers’ attitude to the VET and its dimensions should be correlated. Prior to EFA,
skewness and kurtosis of all items in the questionnaire were checked, demonstrating
that the data satisfied the criterion of univariate normality. The Kaiser-Meyer-Olkin
measure (0.79) and Bartlett’s test of sphericity (p < 0.001) were examined, both suggesting
the suitability of the data for factor analysis. The Kaiser Criterion was adopted which
meant only factors with eigenvalues over one would be extracted (Field, 2009). Results of
EFA indicated that five factors had eigenvalues over Kaiser’s criterion of one, which in
combination explained 56.78% of the variance. No items were deleted from this analysis
since each of them had factor loadings over 0.4 and none of them had double loadings
over 0.4 on two different factors (Stevens, 2002).
Based on item loadings on the five factors, Factor 1 was interpreted as ‘test takers’
perceived validity of the VET’ (hereafter ‘face validity’, Item 1, 2, 3, 4, 8, Cronbach’s
α = 0.87), Factor 2 was interpreted as ‘extrinsic motivation in taking the VET’
(hereafter ‘extrinsic motivation’, Item 12, 13, 14, Cronbach’s α = 0.88), Factor 3 was
interpreted as ‘test takers’ perceived interestingness of the tasks in the VET’ (hereafter
‘interestingness’, Item 15, 16, 17, 18, 19, 20, Cronbach’s α = 0.86), Factor 4 was interpreted
as ‘test takers’ views on the VET delivery’ (hereafter ‘test delivery’, Item 5, 6, 7, Cronbach’s
α = 0.70), and Factor 5 was interpreted as ‘intrinsic motivation in taking the VET’
(hereafter ‘intrinsic motivation’, Item 9, 10, 11, Cronbach’s α = 0.63). Cronbach’s α for the
whole questionnaire was 0.88. The results of EFA are summarized in Table 2 together
with Pearson’s correlations between the five attitudinal factors. As can be seen from
Table 2, the questionnaire was a reliable instrument (factor-level α from 0.63 to 0.87)
which measured different dimensions of test takers’ attitude towards the VET. Results of
inter-factor correlations demonstrate that except the correlations between extrinsic

Table 2 Summary of EFA results and inter-factor correlations
Factor No of item α F1 F2 F3 F4 F5
1. Face validity 1, 2, 3, 4, 8 0.87 1 0.13 0.50** 0.39** 0.30**
2. Extrinsic motivation 12, 13, 14 0.88 1 0.26** 0.16 0.26**
3. Interestingness 15, 16, 17, 18, 19, 20 0.86 1 0.35** 0.32**
4. Test delivery 5, 6, 7 0.70 1 0.27**
5. Intrinsic motivation 9, 10, 11 0.63 1
Notes. **correlations are significant at p < 0.01 level. F1: face validity; F2: extrinsic motivation; F3: interestingness; F4: testdelivery; F5: intrinsic motivation.
Fan Language Testing in Asia 2014, 4:6 Page 9 of 17http://www.languagetestingasia.com/content/4/1/6
motivation (F2) and face validity (F1) and test delivery (F4), all other correlations are sig-
nificant at the p < 0.01 level, suggesting that the five attitudinal factors are closely related.
The low correlations between extrinsic motivation and other two attitudinal factors (i.e.
face validity and test delivery) can probably be explained by the fact that all participants of
this study were voluntary.
The pattern of test takers’ attitude to the VET (RQ1)
To investigate the pattern of test takers’ attitude towards the VET, descriptive statistics
at the factor level were first of all computed. This was done by adding all the items in
the factor, and then divided the item total by the number of items. The results demon-
strated that of the five attitudinal factors, test takers had the most positive attitude to
the delivery of the VET, and their views were quite uniform, as was suggested by the
small standard deviation (M = 4.82, SD = 0.80). In addition, test takers’ intrinsic motiv-
ation in taking the VET seemed much stronger than their extrinsic motivation (intrin-
sic: M = 4.26, SD = 0.82; extrinsic: M = 3.44, SD = 1.08), and the difference was shown
to be statistically significant by a paired-samples t-test (t = 7.62, df = 117, p < 0.05, d =
0.89). The mean values of the other two factors were comparable (face validity: M =
4.14, SD = 0.81; interestingness: M = 4.08, SD = 1.03), both suggesting a moderate ten-
dency towards positivity.
To investigate test takers’ attitude to the VET in more detail, descriptive statistics of
each item in the questionnaire were computed. In addition, frequencies and percent-
ages of participants’ responses to each individual item were calculated. A non-
parametric test of Chi-square was run on the observed frequencies in order to find out
if the differences in participants’ responses were statistically significant. The results of
item-level statistics are presented in Table 3. As can be seen from this table, the mean
magnitudes of most items are greater than 3.5, suggesting an overall tendency towards
positivity. This is particularly noticeable in the items that are related to test delivery
(Item 5, 6, 7) with only a small percentage of respondents expressing disagreement with
the statement in each item (from 5.9% to 11.9%, see frequency statistics in Table 3). In
addition, the overwhelming majority of the respondents (93.2%) agreed that they took
the VET with a view to assessing their spoken English ability, lending support to the
finding derived from factor-level statistics. Given the fact that all participants in this
study were voluntary, the finding came as no surprise to us.
According to Table 3, the lowest mean values mostly clustered in the factor of extrin-
sic motivation. For example, only 42.4% of the respondents agreed that they took the
VET because the VET certificate could be used for applying to study overseas. Again,
the finding came as not surprising because the VET is currently not widely known to
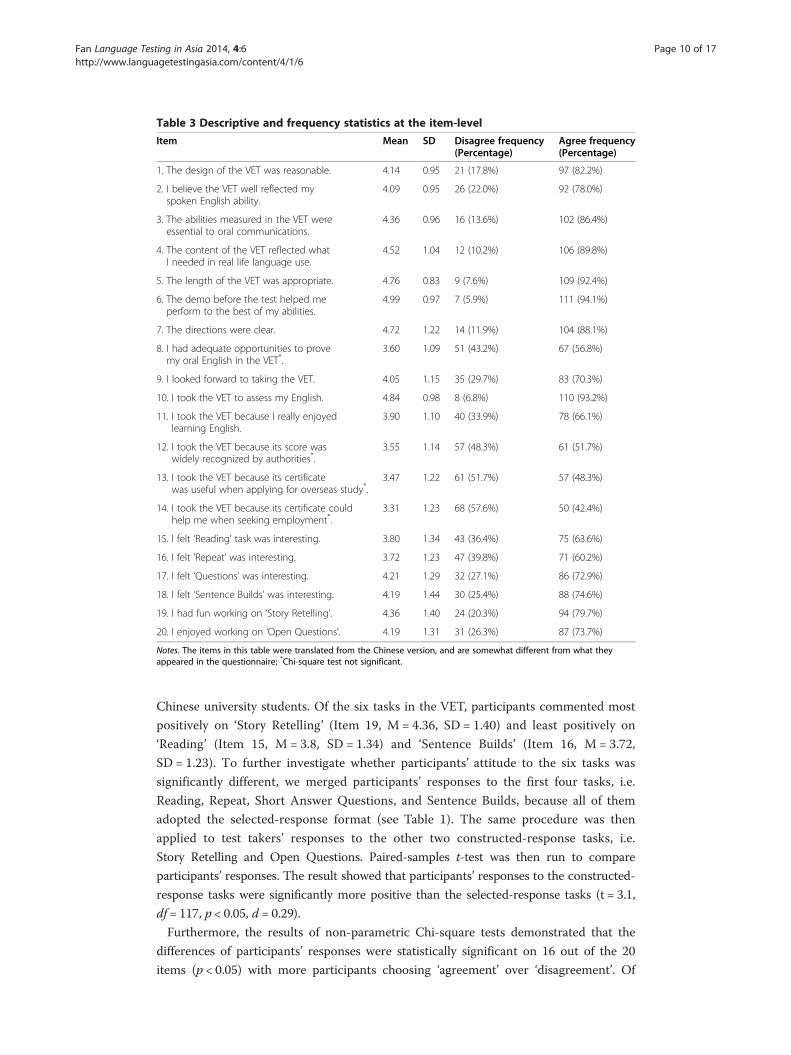
Table 3 Descriptive and frequency statistics at the item-level
Item Mean SD Disagree frequency(Percentage)
Agree frequency(Percentage)
1. The design of the VET was reasonable. 4.14 0.95 21 (17.8%) 97 (82.2%)
2. I believe the VET well reflected myspoken English ability.
4.09 0.95 26 (22.0%) 92 (78.0%)
3. The abilities measured in the VET wereessential to oral communications.
4.36 0.96 16 (13.6%) 102 (86.4%)
4. The content of the VET reflected whatI needed in real life language use.
4.52 1.04 12 (10.2%) 106 (89.8%)
5. The length of the VET was appropriate. 4.76 0.83 9 (7.6%) 109 (92.4%)
6. The demo before the test helped meperform to the best of my abilities.
4.99 0.97 7 (5.9%) 111 (94.1%)
7. The directions were clear. 4.72 1.22 14 (11.9%) 104 (88.1%)
8. I had adequate opportunities to provemy oral English in the VET*.
3.60 1.09 51 (43.2%) 67 (56.8%)
9. I looked forward to taking the VET. 4.05 1.15 35 (29.7%) 83 (70.3%)
10. I took the VET to assess my English. 4.84 0.98 8 (6.8%) 110 (93.2%)
11. I took the VET because I really enjoyedlearning English.
3.90 1.10 40 (33.9%) 78 (66.1%)
12. I took the VET because its score waswidely recognized by authorities*.
3.55 1.14 57 (48.3%) 61 (51.7%)
13. I took the VET because its certificatewas useful when applying for overseas study*.
3.47 1.22 61 (51.7%) 57 (48.3%)
14. I took the VET because its certificate couldhelp me when seeking employment*.
3.31 1.23 68 (57.6%) 50 (42.4%)
15. I felt ‘Reading’ task was interesting. 3.80 1.34 43 (36.4%) 75 (63.6%)
16. I felt ‘Repeat’ was interesting. 3.72 1.23 47 (39.8%) 71 (60.2%)
17. I felt ‘Questions’ was interesting. 4.21 1.29 32 (27.1%) 86 (72.9%)
18. I felt ‘Sentence Builds’ was interesting. 4.19 1.44 30 (25.4%) 88 (74.6%)
19. I had fun working on ‘Story Retelling’. 4.36 1.40 24 (20.3%) 94 (79.7%)
20. I enjoyed working on ‘Open Questions’. 4.19 1.31 31 (26.3%) 87 (73.7%)
Notes. The items in this table were translated from the Chinese version, and are somewhat different from what theyappeared in the questionnaire; *Chi-square test not significant.
Fan Language Testing in Asia 2014, 4:6 Page 10 of 17http://www.languagetestingasia.com/content/4/1/6
Chinese university students. Of the six tasks in the VET, participants commented most
positively on ‘Story Retelling’ (Item 19, M = 4.36, SD = 1.40) and least positively on
‘Reading’ (Item 15, M = 3.8, SD = 1.34) and ‘Sentence Builds’ (Item 16, M = 3.72,
SD = 1.23). To further investigate whether participants’ attitude to the six tasks was
significantly different, we merged participants’ responses to the first four tasks, i.e.
Reading, Repeat, Short Answer Questions, and Sentence Builds, because all of them
adopted the selected-response format (see Table 1). The same procedure was then
applied to test takers’ responses to the other two constructed-response tasks, i.e.
Story Retelling and Open Questions. Paired-samples t-test was then run to compare
participants’ responses. The result showed that participants’ responses to the constructed-
response tasks were significantly more positive than the selected-response tasks (t = 3.1,
df = 117, p < 0.05, d = 0.29).
Furthermore, the results of non-parametric Chi-square tests demonstrated that the
differences of participants’ responses were statistically significant on 16 out of the 20
items (p < 0.05) with more participants choosing ‘agreement’ over ‘disagreement’. Of

Fan Language Testing in Asia 2014, 4:6 Page 11 of 17http://www.languagetestingasia.com/content/4/1/6
the four items on which participants’ responses were statistically not significant
(p > 0.05), three were in the factor of extrinsic motivation (Item 12, 13. 14) while
the other one in the factor of face validity (Item 8, see Table 3). These results
suggest that there was an overall tendency towards positivity in test takers’ reported
attitude. However, their views seemed divergent when it came to extrinsic motivation and
the opportunities to demonstrate their English proficiency in the VET.
Gender, background, and test takers’ attitude (RQ2)
To investigate whether test takers’ gender and academic background had any significant
effect on their reported attitude, cross-tabulations on these two variables and test
takers’ overall attitude to the VET were performed. This investigation is worthwhile
because, as we argued earlier, test takers’ attitude is believed to be part of test impact,
and a fair test should function equally among different groups of test takers.
To run cross-tabulations, we first added all the items in the questionnaire to form
test takers’ overall attitude to the VET. Then the cohort was divided into two groups
based on the median of the overall attitude score (83): ‘more positively oriented group’
(those whose scores were over 83) and ‘more negatively oriented group’ (those whose
scores were below 83). Cross-tabulations were then performed to find out whether gender
and background were predictors of the tendency to fall into one or the other attitude
group. Results of the cross-tabulations are presented in Table 4. As can be seen in Table 4,
the two variables of test takers’ demographic and experiential variables, i.e. gender and
background, did not predict any significant difference among the participants in terms of
their overall attitude to the VET (p > 0.05 in both cases).
The sources of test takers’ attitude to the VET (RQ3)
To more accurately pinpoint the sources of test takers’ attitude to the VET, the qualita-
tive data were coded and analyzed with the aid of NVivo. The qualitative data in this
study, as explained earlier, consisted of 12 individual interviews and two focus group
discussions with three participants in each group. After the data were coded, we first of
all computed the frequencies of participants’ responses at each category in the coding
scheme, and the results are presented in Table 5. As can be seen from Table 5, partici-
pants’ responses were most frequently concentrated on the design of the VET and least
frequently on future improvement of the VET and their test-taking motivation. In the
category of the test design, participants commented most frequently on the face validity
of the VET.
Table 4 Results of cross-tabulations
Overall attitude Total x2
More positive More negative Asymp. sig. (2-sided)
Gender 0.82
Male 24 22 46
Female 36 36 72
Background 0.59
Humanities 28 26 54
Science 30 34 64

Table 5 Frequency of participants’ responses at each category
Category Frequency Percentage
1. The design of the VET 98 41.7%
a) Face validity 34 14.5%
b) Comparison with other tests 18 7.7%
c) Comparison with live interviews 17 7.2%
d) Difficulty 16 6.8%
e) Language abilities tested 13 5.5%
2. The six tasks in the VET 42 17.9%
a) Selected response tasks 24 10.2%
b) Constructed response tasks 18 7.7%
3. Personal affect 35 14.9%
4. Test delivery 26 11.1%
5. Future improvement 17 7.2%
6. Test-taking motivation 17 7.2%
Total 235 100%
Fan Language Testing in Asia 2014, 4:6 Page 12 of 17http://www.languagetestingasia.com/content/4/1/6
In terms of the test design, most participants commented positively on the overall
design of the VET because ‘it has six different tasks, and the change from one task to
another fills us with a sense of novelty’ (Participant 3). The other reason was attributed
to the progressively increasing level of difficulty for both the six tasks in the VET and
the sequence of items in each part of the test. As Participant 8 pointed out, this kind of
design ‘could help us gradually get used to the testing situation and perform to the best
of our abilities’. However, participants seemed to prefer live interview tests to automated
tests because, as Participant 6 argued, ‘in real life, we never talk to machines. Live
interviews are definitely more interactive than a computer-based test’. This participant
continued to point out that ‘such a computer-based speaking test (as the VET) can well
measure my pronunciation and vocabulary, but many more communicative features can
be assessed in a human test, including my reasoning ability’. Despite participants’ overall
preference for live interview tests, most of them still believed that the VET could reflect
from 70% to 90% of their spoken English ability, suggesting the satisfactory face validity of
the VET. That said, a few participants expressed their lack of confidence in automated
scoring that the VET adopted. A typical comment in this regard went like the following: ‘I
can’t believe that my spoken English performance can be rated by computers. The system
could probably rate my pronunciation, but how can it accurately rate my in-depth
thinking and ability in argumentation?’ (Participant 10) For some participants who had
experience in taking other spoken English tests such as the speaking sections of TOEFL
iBT and IELTS, they compared the VET with these tests, pointing out that the VET
appeared much less challenging. They mentioned that while the speaking sections in
TOEFL and IELTS could measure a wide range of spoken English abilities from fluency to
reasoning and argumentation, the VET as a whole seemed to tap into the relatively
superficial layer of English speaking ability including pronunciation, grammar,
vocabulary, and short-term memory. These abilities, as participants said, were
undoubtedly essential prerequisites to successful communication, but a mastery of
these abilities did not constitute a sufficient condition to become a proficient English
speaker.
Fan Language Testing in Asia 2014, 4:6 Page 13 of 17http://www.languagetestingasia.com/content/4/1/6
Generally speaking, the participants in interviews and focus-group discussions
seemed to enjoy their experience of taking the VET with most of them describing their
experience as ‘positive’ and ‘interesting’. The qualitative data revealed that four reasons
most likely explained the positivity in their experience. Firstly, the progressively
increasing level of difficulty, as we reported earlier, made it easier for test takers to
engage in the tasks; secondly, the overall difficulty of the VET was perceived as
low, thus greatly reducing test takers’ anxiety when responding to the items;
thirdly, the six tasks appeared novel to test takers, or as Participant 10 described, ‘I
have never seen such tasks before when taking English language examinations
developed in China’; fourthly, some participants mentioned that since they took the
VET voluntarily they didn’t have the heavy psychological burden which they often
experienced when taking other high-stakes English tests.
Of the six tasks in the VET, the first four tasks, i.e. Reading, Repeat, Short Answer
Questions, and Sentence Builds, were perceived to assess test takers’ listening ability,
speed of response, grammar, and memory while the other two tasks, i.e. Story Retelling
and Open Questions, were believed to assess more integrative abilities in English speaking
because ‘in these two parts we are really using English flexibly to express and organize our
ideas’ (Participant 2 in Focus Group 2). The first four parts, therefore, were intended to
‘pave the way for the other two tasks’ (Participant 10). Most participants commented that
compared with the first four parts, the other two tasks better reflected their English
ability, and they couldn’t reason why the last part, i.e. Open Questions, was not included
in the scoring procedures. Consistent with the findings derived from quantitative analyses,
most participants commented positively on the delivery of the VET, believing that the
length was appropriate and the directions were very clear. A few participants, however,
mentioned that some information should be made more transparent to test takers such as
the language abilities that each task was intended to assess and the rationales underpin-
ning the scoring procedures. As expected, the VET was not well known to participants,
many of whom said that they came to know about this test ‘only after reading the infor-
mation pack and visiting the official website of the VET’ (Participant 9). Though some
participants acknowledged that they took the VET because, according to the VET website,
the test scores were recognized by many institutions all over the world and could be
converted to scores on TOEFL iBT and IELTS, most of them said they took the test either
with a view to assessing their spoken English ability or because they had interest in
English learning and speaking.
Discussion and conclusionsThe necessity of soliciting stakeholders’ views in test development and validation has
been widely recognized and explicitly articulated by a number of language testing
researchers in recent years (e.g., AERA et al., 1999; Alderson, et al., 1995; Chun, 2008;
Messick, 1989). Shohamy (2001), for example, believes that stakeholder involvement
can help to democratize language testing practices and accomplish the goal of power-
sharing in language testing. Karelitz (2013) argues that public opinion of a test should
be studied routinely throughout the life cycle of a test because negative public views
‘create a unique threat to the existence of the test’ (p. 4). In this study, we investigated
a sample of Chinese test takers’ attitudes to the VET. Taking heed of the advice from
Murray et al. (2012), we not only investigated the pattern of test takers’ attitudes but

Fan Language Testing in Asia 2014, 4:6 Page 14 of 17http://www.languagetestingasia.com/content/4/1/6
also pinpointed the sources of the positivity and negativity in their reported attitudes.
Results of EFA indicate that five factors in combination represented test takers’ attitude
to the VET. The EFA results are consistent with the theoretical understanding of
attitude in social psychology (e.g., Baker, 1992; Eagly & Chaiken, 1993) which posits
that attitude is a unitary construct consisting of multiple dimensions. In addition, the
EFA results also find resonance in some previous empirical investigations of test takers’
attitude towards a language test (e.g., Jin & Cheng, 2013; Zhao & Cheng, 2010). Given
the fact that all VET test takers in this study were voluntary, it is understandable that
their motivation in taking the VET was divided into two separate factors (i.e. intrinsic
and extrinsic motivation, cf. Dornyei & Schmidt, 2001), and the cohort was more
intrinsically than extrinsically motivated to take the VET, as demonstrated by the
paired-samples t-test.
Following the EFA results, descriptive and frequency statistics of the questionnaire
data indicate that test takers on the whole held positive attitude to the VET, believing
that the VET to a large extent reflected their spoken English proficiency. The positivity
of test takers’ attitude, as the qualitative data revealed, could be attributed primarily to
the variety of tasks in the VET, the progressively increasing level of difficulty, test
delivery, and test takers’ low anxiety when taking the VET. These findings contradicted
the hypothesis that we formed at the beginning of this study based on the anecdotal
evidence which pointed to Chinese test takers’ more negative perceptions of automated
spoken English tests. Murray et al. (2012, p. 4) pointed out that ‘positive attitudes
towards the fairness and efficacy of a test can promote a sense of empowerment rather
than helplessness, and create conditions for learning opportunities to become more
effective.’ Taking into account that the VET is currently not widely known to Chinese
university students, these findings should be encouraging to the VET provider. Test
takers’ negative attitude, on the other hand, was mainly concentrated on the lack
authenticity of the tasks in the VET, and the relatively narrow range of language
abilities assessed in the VET.
Of the six tasks in the VET, test takers preferred the two tasks adopting the
constructed-response format, i.e. Story Retelling and Open Questions. As a matter of
fact, these two tasks are frequently used in live interview tests or non-automated
computer-based tests (e.g., the speaking section of TOEFL iBT, see Farhady, 2008). This
finding seems to suggest that despite test takers’ overall positive attitude to the VET,
they would still choose to take the more traditional speaking tests (i.e. live interview or
non-automated computer-based tests) if they were given the options. One of the
reasons, according to the qualitative data we collected, is the selected-response tasks
are far from authentic, or as one participant in Focus Group 2 remarked, ‘in real life we
are never required to use language that way’. Comparatively speaking, the two
constructed-response tasks appear much more authentic since test takers are required
to use English flexibly to express ideas. It is not surprising, therefore, that Participant
10 described the first four tasks as ‘paving the way’ for the other two constructed-
response tasks. Authenticity, according to the test usefulness framework proposed by
Bachman and Palmer (1996, p. 18), should be one of the essential qualities when
evaluating a language test. Also, as Leung and Lewkowicz (2006, p. 213) remarked, ‘the
debate over the past 15 years that is more relevant to ELT pedagogy and curriculum
concerns test authenticity’. For the provider of automated spoken English tests like the
Fan Language Testing in Asia 2014, 4:6 Page 15 of 17http://www.languagetestingasia.com/content/4/1/6
VET, how to improve the authenticity in test design without sacrificing the scientific
rigor in the scoring algorithm remains a grave challenge to address in the future (see
also Chun, 2006, 2008).
As perceived by the test takers in this study, the VET primarily tapped into such
language abilities as listening, pronunciation, grammar, vocabulary, speed of reaction
and short-term memory. These abilities are well reflected in the four diagnostic scores
reported by the VET provider, i.e. Sentence Mastery, Vocabulary, Fluency, and Pronun-
ciation. Also, these abilities largely conform to the theoretical reasoning that underpins
the VET construct (e.g., Balogh & Bernstein, 2006; Bernstein, et al., 2010; Pearson,
2008). The construct assessed in the VET, as explained earlier, is the facility in spoken
language which can be further explicated as ‘real-time receptive and productive
processing of spoken language forms’, ‘the control of core language processing
components, such as lexical access and syntactic encoding’, and ‘the ability to access
and retrieve lexical items, to build phrases and clause structures, and to articulate
responses without conscious attention to the linguistic code’ (Pearson, 2008, pp. 8–9).
To some extent, the findings of this study have lent support to the satisfactory face
validity of the VET. However, it should be acknowledged that whether the VET has
indeed tapped into these language abilities remains to be confirmed by future validation
studies.
In addition to the above findings, we also found that demographic or experiential
variables, i.e. gender and background did not predict the tendency of test takers’
attitude to the VET. This finding concurs with Rasti’s (2009) investigation of Iranian
test takers’ attitude to the IELTS but does not find resonance in Murray et al. (2012)
study of test takers’ attitudes towards the Professional English Assessment for Teachers
(PEAT) in Australia though their conceptualization of attitude was adopted in the
present study. Two reasons may explain the different findings. First, in Murray et al.’s
study, the participants were language teachers, not students. These two groups of
respondents might have very different perceptions of a test (e.g., Cheng, 2014). Second,
the two experiential variables which significantly predicted test takers’ attitude in
Murray et al.’s study were teaching experience and test experience while in our study
the two variables were gender and academic background. The different research results
seem to suggest that depending on the testing context, some demographic or experiential
variables may affect or predict test takers’ attitude but the effect of other variables is
negligible. Future research is necessary to further explore the role of demographic and/or
experiential variables in shaping test takers’ attitude.
Limitations and implications
A few limitations need to be addressed to support the accurate interpretations of
research results of this study. First, the VET is a test which is not targeted specifically
at university students. In fact, the VET is targeted at a wide range of potential test
takers, including students, staff, and officers (Pearson, 2008, p. 3). Therefore, this study
only represents how a particular group of the VET test takers view this test. Since some
demographic or experiential variables, as we discussed earlier, may affect test takers’
attitude, the results of this study may not be validly extrapolated to other groups of test
takers such as staff in business. Secondly, the participants in this study were not VET
test takers in real sense because all of them were recruited through emails and exempt
Fan Language Testing in Asia 2014, 4:6 Page 16 of 17http://www.languagetestingasia.com/content/4/1/6
from the test charges. Therefore, the findings of this study shall be interpreted and
accepted with caution, in particular when it comes to test-taking motivation. Thirdly,
though the questionnaire in this study was intended to be as comprehensible as
possible, some dimensions of test takers’ attitude were not included in our investigation
(e.g., test anxiety, see also Zhao & Cheng, 2010). Finally, due to practical problems, test
performance data were not included in our analysis. Future research is warranted to
investigate how these attitudinal factors interact with each other in shaping test takers’
performance on a language test (cf. Fan & Ji, 2014). These limitations notwithstanding,
this study contributes, in a timely manner, to the understanding about test takers’
feedback about this automated spoken English test, and the research results are
meaningful to both the VET provider and the other VET stakeholders.
The findings of this study have implications for the VET provider and the other
providers of computer-based speaking tests. First, it is necessary to use a variety of
tasks to elicit test takers’ spoken performance. As suggested by the current study, test
takers may develop more positive attitude towards a test if it employs a variety of task
formats in the assessment of English speaking. When multiple task types are employed
to elicit test takers’ performance, it is important for the test provider to arrange them
in the sequence of progressive difficulty. Second, it is essential for speaking test
providers to recognize the importance of improving the perceived interestingness of
the test tasks. If test takers view the tasks as more interesting, they may also tend to
view the test more positively and respond to it more actively. Finally, authenticity is an
essential quality for a language test, and this is particularly true for a speaking
test. Therefore, providers of computer-based speaking tests, be they automated or
non-automated, should always strive to make their tests as authentic as possible
because better authenticity of test tasks, as indicated by this study, is likely to induce
more positive attitudes from test takers.
Competing interestsThe author declares that he has no competing interests.
AcknowledgementsThe preparation of this manuscript was supported by the National Social Sciences Fund of the People’s Republic ofChina (Grant Number: 13CYY032) and a joint research project between the Language Testing Center of FudanUniversity and Pearson Knowledge Technologies. An earlier draft of this article was presented as a research paper atthe Pacific Rim Objective Measurement Symposium (PROMS) held in August, 2014 in Guangzhou, China. I would liketo express my gratitude to Prof. Peiying Ji, Prof. Jiangbo Wan, and Ms. Diana Hon for assisting me in collecting thedata for this study. In addition, thanks are due to Dr. Xiaoqiu Xu, Dr. Masanori Suzuki, and Dr. William Bonk for theirvery insightful comments on the previous draft of this article.
Received: 30 July 2014 Accepted: 30 September 2014
References
Alderson, JC, Clapham, C, & Wall, D. (1995). Language Test Construction and Evaluation. Cambridge: CambridgeUniversity Press.AERA, APA, & NCME. (1999). Standards for Educational and Psychological Testing. Washington D.C: AERA.Bachman, LF. (1990). Fundamental Considerations in Language Testing. Oxford: Oxford University Press.Bachman, LF, & Palmer, AS. (1996). Language Testing in Practice. Oxford: Oxford University Press.Baker, C. (1992). Attitudes and Language. Clevedon, UK: Multilingual Matters.Balogh, J, & Bernstein, J. (2006). Workable models of standard performance in English and Spanish. In Y Matsumoto, D
Oshima, OR Robinson, & P Sells (Eds.), Diversity in Language: Perspectives and Implications (pp. 20–41). Stanford: CSLIPublications.
Bernstein, J, Van Moere, A, & Cheng, J. (2010). Validating automated speaking tests. Language Testing, 27(3), 355–377.Brown, A. (1993). The role of test-taker feedback in the test development process: test-takers’ reactions to a
tape-mediated test of proficiency in spoken Japanese. Language Testing, 10, 277–303.Brown, DH. (2000). Principles of Language Learning and Teaching (4th ed.). New York: Longman.

Fan Language Testing in Asia 2014, 4:6 Page 17 of 17http://www.languagetestingasia.com/content/4/1/6
Cheng, L. (2014). Consequences, impact, and washback. In AJ Kunnan (Ed.), The Companion to Language Assessment(pp. 1130–1146). New York: John Wiley & Sons.
Chun, C. (2006). An analysis of a language test for employment: the authenticity of the PhonePass test. LanguageAssessment Quarterly, 3(3), 295–306.
Chun, C. (2008). Comments on ‘evaluation of the usefulness of the versant for english test: a response’: the authorresponds. Language Assessment Quarterly, 5(2), 168–172.
Dornyei, Z, & Schmidt, R. (2001). Motivation and Second Language Acquisition. Honolulu, Hawaii: National ForeignLanguage Research Center.
Dornyei, Z, & Taguchi, T. (2011). Questionnaires in Second Language Research: Construction, Administration and Processing.Beijing: Foreign Language Teaching and Research Press.
Eagly, AH, & Chaiken, S. (1993). The Psychology of Attitudes. New York: Handcourt Brace Jovanovich.Elder, C, Iwashita, N, & McNamara, T. (2002). Estimating the difficulty of oral proficiency tasks: what does the test taker
have to offer? Language Testing, 19(4), 347–368.Ellis, R. (1999). Understanding Second Language Acquisition. Shanghai: Shanghai Foreign Language Education Press.Fan, J, & Ji, P. (2014). Test candidates’ attitudes and their test performance: the case of the Fudan English Test.
University of Sydney Papers in TESOL, 9, 1–35.Farhady, H. (2008). Human operated, machine mediated, and automated tests of spoken english. Research paper
presented the American Association of Applied Linguistics (AAAL) Conference. Washington, DC.Field, A. (2009). Discovering Statistics Using SPSS (3rd ed.). London: SAGE Publications.Gardner, R. (1985). Social Psychology and Second Language Learning: The Role of Attitude & Motivation. London: Edward
Arnold.Given, LM. (2008). The SAGE Encyclopedia of Qualitative Research Methods (Volume 1 & 2). London: Sage Publications Ltd.IBM. (2012). IBM SPSS Statistics 21 Core System user’s Guide. New York: IMB Corp.Ingram, E. (1977). Basic concepts in testing. In JPB Allen & A Davies (Eds.), Edinburgh Course of Applied Linguistics
(Vol. 4). Oxford: Oxford University Press.Ivankova, N, Creswell, J, & Stick, S. (2006). Using mixed-method sequential explanatory design: from theory to practice.
Field Methods, 18(1), 3–20.Jin, Y, & Cheng, L. (2013). The effects of psychological factors on the validity of high-stakes tests. Modern Foreign
Languages, 36(1), 62–69.Kane, MT. (2006). Validation. In RL Brennan (Ed.), Educational Measurement (4th ed., pp. 17–64). Westport. CT: American
Council on Education/Praeger.Karelitz, TM. (2013). Using public opinion to inform the validation of test scores. Research report retrieved from
www.nite.org.il/files/reports/e387.pdf.Kunnan, AJ (Ed.). (2000). Fairness and Validation in Language Assessment. Cambridge: Cambridge University Press.Ladegaard, HJ. (2000). Language attitudes and sociolinguistic behavior: exploring attitude-behavior relations in
language. Journal of Sociolinguistics, 4(2), 214–233.Leung, C, & Lewkowicz, J. (2006). Expanding horizons and unresolved conundrums: language testing and assessment.
TESOL Quarterly, 40(1), 211–234.Messick, S. (1989). Validity. In RL Linn (Ed.), Educational Measurement (3rd ed., pp. 13–103). Macmillan: American Council
on Education.Murray, JC, Riazi, AM, & Cross, JL. (2012). Test candidates’ attitudes and their relationship to demographic and
experiential variables: the case of overseas trained teachers in NSW, Australia. Language Testing, 29(4), 577–595.Pearson. (2008). Versant English Test: test description and validation summary. Retrieved from www.versanttest.co.uk/
pdf/ValidationReport.pdf.Present-Thomas, R, & Van Moere, A. (2009). NRS classification consistency of two spoken english tests Research paper
presented at the East Coast Organization of Language Testers (ECOLT) Conference. Washington DC.Rasti, I. (2009). Iranian candidates’ attitudes towards IELTS. Asia EFL Journal, 11(3), 110–155.Richards, L. (2005). Handling Qualitative Data: A Practical Guide. London: Sage Publications.Shohamy, E. (1998). Critical language testing and beyond. Studies in Educational Evaluations, 24(4), 331–345.Shohamy, E. (2001). The Power of Tests: A Critical Perspective of the Uses of Language Tests. London: Pearson Education.Stevens, JP. (2002). Applied Multivariate Statistics for Social Sciences (4th ed.). Hillsdale, NJ: Erlbaum.Stevenson, DK. (1985). Authenticity, validity, and a tea party. Language Testing, 2(1), 41–47.Wu, J. (2008). Views of Taiwanese students and teachers on English language testing. University of Cambridge ESOL
Examinations Research Note, 34(2), 6–9.Zhao, J, & Cheng, L. (2010). Exploring the Relationship Between Chinese University students’ Attitude Towards the
College English Test and Their Test Performance. In L Cheng & A Curtis (Eds.), English Language Assessment and theChinese Learner. New York & London: Routledge, Taylor & Francis Group.
doi:10.1186/s40468-014-0006-9Cite this article as: Fan: Chinese test takers’ attitudes towards the Versant English Test: a mixed-methodsapproach. Language Testing in Asia 2014 4:6.