Embed Size (px)
Citation preview

Listening. Learning. Leading.®
Test Takers’ Attitudes About the TOEFL iBT™
Lawrence J. Stricker
Yigal Attali
ISSN 1930-9317
TOEFL iBT Research ReportTOEFLiBT-13January 2010

Test Takers’ Attitudes About the TOEFL iBT™
Lawrence J. Stricker and Yigal Attali
ETS, Princeton, New Jersey
RR-10-02

ETS is an Equal Opportunity/Affirmative Action Employer.
As part of its educational and social mission and in fulfilling the organization's non-profit Charter and Bylaws, ETS has and continues to learn from and also to lead research that furthers educational and measurement research to advance quality and equity in education and assessment for all users of the organization's products and services.
Copyright © 2010 by ETS. All rights reserved.
No part of this report may be reproduced or transmitted in any form or by any means, electronic or mechanical, including photocopy, recording, or any information storage and retrieval system, without permission in writing from the publisher. Violators will be prosecuted in accordance with both U.S. and international copyright laws.
ETS, the ETS logos, GRADUATE RECORD EXAMINATIONS, GRE, LISTENING, LEARNING. LEADING., TOEFL, and the TOEFL logo are registered trademarks of Educational Testing Service (ETS). TOEFL IBT is a trademark of ETS.
COLLEGE BOARD is a registered trademark of the College Entrance Examination Board.

i
Abstract
The principal aims of this study, a conceptual replication of an earlier investigation of the
TOEFL® computer-based test, or TOEFL CBT, in Buenos Aires, Cairo, and Frankfurt, were to
assess test takers’ reported acceptance of the TOEFL Internet-based test, or TOEFL iBT™, and
its associations with possible determinants of this acceptance and with test performance; evaluate
differences in the pattern of results for test takers from different countries; and compare the
findings with those for the TOEFL CBT. A questionnaire concerning attitudes about the test and
other relevant variables was administered by the Internet to TOEFL iBT examinees in 4 diverse
countries with large testing volumes: China, Colombia, Egypt, and Germany. Overall attitudes
about the TOEFL iBT were moderately positive in most countries, but neutral in Germany;
attitudes about the Listening and Writing sections of the test were uniformly favorable in every
country; but attitudes about the Speaking section were consistently less favorable in all countries
and were unfavorable in Germany and Colombia. Attitudes about the test had similar patterns of
relationships in the 4 countries: moderate correlations with attitudes about admissions tests in
general, slight and inconsistent correlations with TOEFL performance and computer anxiety, and
minimal correlations with other variables. All in all, these results were very similar to those in
the earlier investigation, with 1 exception: the previous study found uniformly moderate positive
attitudes about the TOEFL CBT in the 3 countries surveyed.
Key words: TOEFL iBT, attitudes, survey, China, Columbia, Egypt, Germany
ii
The Test of English as a Foreign Language™ (TOEFL®) was developed in 1963 by the National Council on the Testing of English as a Foreign Language. The Council was formed through the cooperative effort of more than 30 public and private organizations concerned with testing the English proficiency of nonnative speakers of the language applying for admission to institutions in the United States. In 1965, Educational Testing Service (ETS) and the College Board® assumed joint responsibility for the program. In 1973, a cooperative arrangement for the operation of the program was entered into by ETS, the College Board, and the Graduate Record Examinations® (GRE®) Board. The membership of the College Board is composed of schools, colleges, school systems, and educational associations; GRE Board members are associated with graduate education. The test is now wholly owned and operated by ETS.
ETS administers the TOEFL program under the general direction of a policy board that was established by, and is affiliated with, the sponsoring organizations. Members of the TOEFL Board (previously the Policy Council) represent the College Board, the GRE Board, and such institutions and agencies as graduate schools of business, two-year colleges, and nonprofit educational exchange agencies.
Since its inception in 1963, the TOEFL has evolved from a paper-based test to a computer-based test and, in 2005, to an Internet-based test, TOEFL iBT™. One constant throughout this evolution has been a continuing program of research related to the TOEFL test. From 1977 to 2005, nearly 100 research and technical reports on the early versions of TOEFL were published. In 1997, a monograph series that laid the groundwork for the development of TOEFL iBT was launched. With the release of TOEFL iBT, a TOEFL iBT report series has been introduced.
Currently this research is carried out in consultation with the TOEFL Committee of Examiners. Its members include representatives of the TOEFL Board and distinguished English as a second language specialists from the academic community. The Committee advises the TOEFL program about research needs and, through the research subcommittee, solicits, reviews, and approves proposals for funding and reports for publication. Members of the Committee of Examiners serve four-year terms at the invitation of the Board; the chair of the committee serves on the Board.
Current (2008-2009) members of the TOEFL Committee of Examiners are:
Alister Cumming (Chair) University of Toronto Geoffrey Brindley Macquarie University Frances A. Butler Language Testing Consultant Carol A. Chapelle Iowa State University John Hedgcock Monterey Institute of International Studies Barbara Hoekje Drexel University John M. Norris University of Hawaii at Manoa Pauline Rea-Dickins University of Bristol Steve Ross Kwansei Gakuin University Mikyuki Sasaki Nagoya Gakuin University Robert Schoonen University of Amsterdam Steven Shaw University of Buffalo
To obtain more information about the TOEFL programs and services, use one of the following:
E-mail: [email protected] Web site: www.ets.org/toefl

iii
Acknowledgments
Thanks are due to Mary K. Enright for encouraging this research; Burton Fried for adapting the
questionnaire for Internet administration and for collecting the questionnaire data; Linda
DeLauro for providing logistical support; Jill Carey, Anthony Ostrander, Gary Payne, and
Michael Wilcox for providing advice and information about the TOEFL program; Dhanushka D.
Happuthanthri and Senthil Natarajan for furnishing TOEFL test data; Min Hwei Wang for doing
the data analysis; and Fred Davidson, Robert Kantor, John A. Read, and Yasuyo Sawaki for
reviewing a draft of this report.

iv
Table of Contents
Page
Method ............................................................................................................................................ 1
Sample ..................................................................................................................................... 1
Measures .................................................................................................................................. 2
Procedure ................................................................................................................................. 4
Analysis ................................................................................................................................... 5
Results ............................................................................................................................................. 5
Comparisons of Participants and Nonparticipants ................................................................... 5
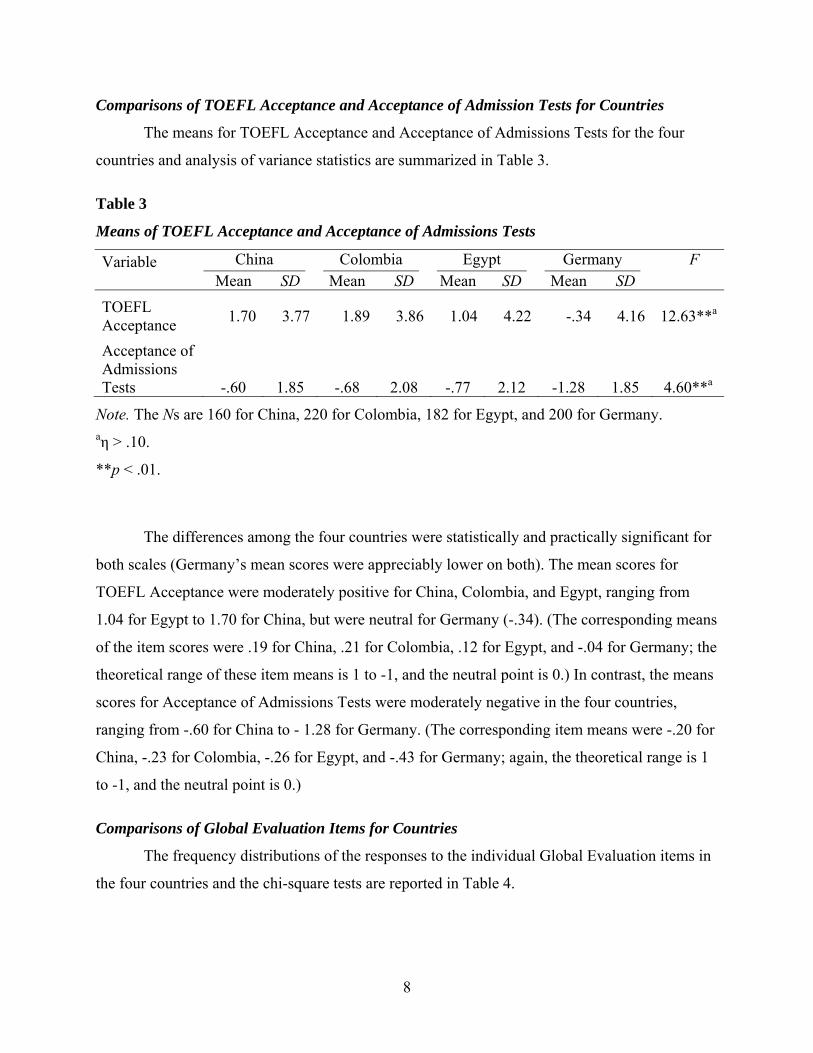
Comparisons of TOEFL Acceptance and Acceptance of Admission Tests for Countries ...... 8
Comparisons of Global Evaluation Items for Countries .......................................................... 8
Correlations of TOEFL Acceptance and Acceptance of Admissions Tests With
Questionnaire and Background Variables, and TOEFL Scores in Each Country ................. 11
Discussion ..................................................................................................................................... 13
Level of TOEFL Acceptance ................................................................................................. 13
Correlates of TOEFL Acceptance ......................................................................................... 14
Conclusion ............................................................................................................................. 15
References ..................................................................................................................................... 16

v
List of Tables
Pages
Table 1. Means of Age and TOEFL Scores for Participants and Nonparticipants
in Each Country ............................................................................................................. 6
Table 2. Percentage Distributions of Gender for Participants and Nonparticipants
in Each Country ............................................................................................................. 7
Table 3. Means of TOEFL Acceptance and Acceptance of Admissions Tests............................ 8
Table 4. Percentage Distributions of Responses to Global Evaluation Items
in Each Country ............................................................................................................. 9
Table 5. Correlations of TOEFL Acceptance and Acceptance of Admissions Tests
With Other Questionnaire and Background Variables, and TOEFL
Scores in Each Country ................................................................................................ 10
Table 6. Reliability of Questionnaire Scales in Each Country ................................................... 11
Table 7. Means for Questionnaire Variables in Each Country .................................................. 12

1
What are test takers’ attitudes about the TOEFL® Internet-based test, or TOEFL iBT™?
Test takers’ reactions may affect their motivation and, in turn, their performance, impacting the
tests’ validity. Equally important, these reactions may also affect test takers’ perceptions of
themselves and of the test users. The importance of test takers’ attitudes about school and
admissions tests, in particular, has been delineated by Nevo (1993). Acceptance by test takers,
test users, and the public is essential to the continued viability of the TOEFL.
Although attitudes about the TOEFL iBT have not been investigated heretofore, attitudes
about previous versions of the TOEFL have been studied. Jamieson, Taylor, Kirsch, and Eignor
(1999) found that a computer-administered tutorial on taking the TOEFL computer-based test
(CBT) increased test takers’ acceptance of the test. Stricker, Wilder, and Rock (2004), in a 1999
survey of TOEFL CBT test takers at major testing centers in Buenos Aires, Cairo, and Frankfurt,
found moderately positive attitudes about the test in the three cities, as well as similar
relationships between these attitudes and other variables: slight or moderate relationships with
test performance; moderate relationships with general attitudes about admissions tests; slight
relationships with test anxiety and computer anxiety; and minimal relationships with computer
familiarity, preparation for the test, and experience with admissions tests.
Given the dearth of information on attitudes about the TOEFL iBT, the purpose of the
present investigation was to replicate conceptually the Stricker et al. (2004) study with this test.
More specifically, the aims of the new investigation were threefold: (a) to assess examinees’
acceptance of the test, and the associations of this acceptance with possible determinants and
with test performance; (b) to evaluate differences in the results for test takers from different
countries; and (c) to compare the findings with those from the Stricker et al. study.
Method
Sample
The sample was drawn from registrants for the TOEFL iBT in the summer of 2008 in
four countries: China, Colombia, Egypt, and Germany. Two of these countries, Egypt and
Germany, had been used in the Stricker et al. (2004) study; the third country in that study,
Argentina, could not be used because of low testing volume. Colombia was added as a
replacement for Argentina; China was added to increase the range of language groups
represented. The four countries have large testing volumes and are diverse, spanning the world
and major language groups.

2
The sample consisted of registrants asked to participate who took the test on schedule,
completed the questionnaire within 10 days after the test administration (TOEFL scores are
reported 15 working days after the administration), and had usable questionnaire data: 160 test
takers in China, 220 in Colombia, 182 in Egypt, and 200 in Germany. The nonrespondents,
registrants asked to participate who took the test on schedule but did not complete the
questionnaire on time or had unusable questionnaire data, numbered 565 in China, 545 in
Colombia, 391 in Egypt, and 489 in Germany. The participation rates were 22% in China, 29%
in Colombia, 32% in Egypt, and 29% in Germany.
Measures
Questionnaire. The questionnaire (in English) from the Stricker et al. (2004) study was
used, augmented by attitude items concerning global evaluations of the test sections. The
questionnaire consisted of the five original scales, the two original single-item measures, and
four single-item measures for the sections. Details about the development of the original
questionnaire are described in Stricker et al. (2004). Descriptions of the measures follow:
1. TOEFL Acceptance. This is a nine-item scale (“These are statements about the Internet-
based TOEFL [Test of English as a Foreign Language]”—e.g., “The TOEFL tells how
well people can use English in school”), with Agree, Do Not Agree, and Do Not Know
options. (The instructions were to use the Do Not Know option “if you do not know
whether you agree with the statement or do not understand the statement.”)
2. Acceptance of Admissions Tests. This is a three-item scale (“These are statements about
all tests used for admission to universities [for example, TOEFL, SAT®, ACT, GRE®—
Graduate Record Examination®, GMAT—Graduate Management Admission Test]”—
e.g., “People who receive high scores on university admissions tests will be successful in
school”), with Agree, Disagree, and Do Not Know options.
3. Total Computer Attitude. This is the total score for two subscales adapted from factor
subscales (Bandalos & Benson, 1990on the Computer Attitude Scale (Loyd & Gressard,
1984): “These are statements about computers”—e.g., “I want to use computers” [five-
item Computer Liking subscale] and “I feel I know what I am doing when I use
computers” [seven-item Computer Confidence subscale]. The items on the scales have

3
Agree, Disagree, and Do Not Know options. Note that a high score represents low
anxiety.
4. Total Test Anxiety. This is the total score for four subscales adapted from the Revised
Test Anxiety Scale (Benson & El-Zahhar, 1994; “These are statements about all types of
tests: tests for admission to universities and all other types of tests used by schools and
employers”—e.g., “When I am taking a test, I often think how difficult the test is” [four-
item Worry subscale], “I am nervous about tests” [five-item Tension subscale], “When I
am taking a test, I think about things I will do after the test” [four-item Test-Irrelevant
Thinking subscale], and “My mouth becomes dry during a test” (five-item Bodily
Symptoms subscale]. The items on the scales have Agree, Do Not Agree, and Do Not
Know options.
5. Computer Familiarity. This is a six-item scale adapted from the Computer Familiarity
Questionnaire (Eignor, Taylor, Kirsch, & Jamieson, 1998; “These are statements about
how often you have a computer to use and how often you use a computer for different
things”—e.g., “How often do you use a computer?”) , with Never, Once a Week or Less,
More than Once a Week, and Do Not Know options.
6. Preparation for the TOEFL. This is a single-item measure: “About how many hours did
you prepare for the computer-based TOEFL?” with a seven-point scale (0 Hours-More
than 40 Hours) plus a Do Not Know option.
7. Admissions Tests Taken. This is a single-item measure: “About how many different
university admissions tests have you taken (for example, TOEFL, SAT, ACT, GRE,
GMAT)?” with a five-point scale (1 Test–5 or More Tests) plus a Do Not Know option.
8. Global Evaluation Items. These are four individual attitude items about global
evaluations of the TOEFL iBT sections (“These are statements about the Internet-based
TOEFL [Test of English as a Foreign Language]”—e.g., “The TOEFL gave me a good
opportunity to demonstrate my ability to read English” [Reading] , “The TOEFL gave me
a good opportunity to demonstrate my ability to understand spoken English” [Listening],
“The TOEFL gave me a good opportunity to demonstrate my ability to write in English”
[Writing], and “The TOEFL gave me a good opportunity to demonstrate my ability to
speak English” [Speaking]).The items have Agree, Disagree, and Do Not Know options.

4
In scoring items and obtaining total scores for all scales except Computer Familiarity,
items were scored 1 for the keyed response (Agree or Do Not Agree), -1 for the unkeyed
response (Agree or Do Not Agree), and 0 for the Do Not Know response. For Computer
Familiarity, items were scored 1 for the Never response to 4 for the More than Once a Week
response; Do Not Know responses were not scored. A total score for Computer Familiarity was
not obtained if a test taker had any Do Not Know responses for this scale.
In scoring the single-item measures, responses on Preparation for TOEFL were
dichotomized: 0 Hours - 21-30 Hours = 0, 31-40 Hours - More than 40 Hours = 1. Admissions
Tests Taken was scored: 1 Test = 1, 2 Tests = 2, 3 Tests = 3, 4 Tests = 4, and 5 or More Tests =
5; Do Not Know responses were not scored.
Age and gender. Age (age in years at the time of the test administration) and gender were
obtained from questions at the beginning of the TOEFL administration.
TOEFL scores. TOEFL scores were obtained from ETS files:
1. TOEFL Listening score. This is a scaled score, ranging from 0–30.
2. TOEFL Reading score. This is a scaled score, ranging from 0–30.
3. TOEFL Speaking score. This is a scaled score, ranging from 0–30.
4. TOEFL Writing score. This is a scaled score, ranging from 0–30.
5. TOEFL Total score. This is the sum of the TOEFL Listening, Reading, Speaking, and
Writing scores. The score ranges from 0–120.
Procedure
The survey was conducted via the Internet. Requests to participate in the study were e-
mailed to random samples, in the four countries, of registrants to specified TOEFL iBT
administrations. The three to six administrations per country (three in Germany, five in
Colombia, and six in China and Egypt) began with the May 30-31 administration and ended with
the August 23-24 administration. The e-mails, sent to registrants on the weekend of their
scheduled test administration, described the purpose of the survey, asked them to complete the
questionnaire on a separate Web site, assured them that their questionnaire responses would be
confidential and would not affect their TOEFL scores, and offered them, for their participation, a
$10 Amazon.com gift card and an opportunity to win a $100 Amazon.com gift card. The number

5
of requests for participation was 1,056 for China, 863 for Colombia, 856 for Egypt, and 881 for
Germany. The questionnaire took approximately 15 minutes to complete.
Analysis
Analyses of variance of the means for Age and the TOEFL scores for participants and
nonparticipants were carried out for each country. Parallel chi-square tests of the frequency
distributions for Gender were also carried out.
One-way analyses of variance of the means for TOEFL Acceptance and Acceptance of
Admissions Tests in the four countries were carried out.
Chi-square tests of the frequency distributions of responses for individual Global
Evaluation items in the four countries were carried out.
Product-moment correlations of TOEFL Acceptance and Acceptance of Admissions
Tests with the other questionnaire variables, Gender, Age, and the TOEFL scores were computed
separately for each country, using a pair-wise missing data program. In these analyses, dummy
codes were used for Gender (male = 0, female = 1).
The internal-consistency reliability of the questionnaire scales for each country was
computed by coefficient alpha.
Both statistical and practical significance were considered in evaluating the results. For
statistical significance, the .05 alpha level was used in all analyses. For practical significance,
indexes that reflect a small effect size, accounting for 1% of the variance, were used: an η of .10
in the analyses of variance, a W of .10 in the chi-square analyses, and an r .10 in the correlation
analyses (Cohen, 1988).
Results
Comparisons of Participants and Nonparticipants
The means for Age and TOEFL scores of participants and nonparticipants, and analyses
of variance statistics for each country, are summarized in Table 1. The frequency distributions of
Gender and chi-square tests are reported in Table 2.

6
Table 1
Means of Age and TOEFL Scores for Participants and Nonparticipants in Each Country
Variable Participants Nonparticipants F Mean SD Mean SD
China Age 21.78 2.96 21.56 3.21 .60 TOEFL Listening 19.21 7.42 17.90 7.71 3.66 TOEFL Reading 22.06 7.10 20.95 7.53 2.74 TOEFL Speaking 18.72 3.40 17.82 3.62 7.90**a TOEFL Writing 21.20 4.51 20.25 4.86 4.92* TOEFL Total 81.19 19.71 76.92 20.45 5.51*
Colombia Age 25.14 6.08 24.35 6.18 2.53 TOEFL Listening 23.40 7.38 19.68 8.96 29.83**a TOEFL Reading 22.69 7.64 18.62 8.61 37.31**a TOEFL Speaking 20.69 3.63 19.35 3.98 18.50**a TOEFL Writing 21.45 4.77 19.19 4.91 33.77**a TOEFL Total 88.24 20.32 76.85 22.99 41.05**a
Egypt Age 25.86 6.39 23.79 6.69 12.22**a TOEFL Listening 21.27 8.27 18.07 9.11 16.30**a TOEFL Reading 19.44 8.86 16.07 8.77 18.17**a TOEFL Speaking 20.64 3.91 20.08 3.98 2.45 TOEFL Writing 20.80 4.56 19.43 5.07 9.62** a TOEFL Total 82.15 22.16 73.66 23.17 17.17**a
Germany Age 23.46 4.50 23.06 4.27 1.17 TOEFL Listening 26.32 5.31 24.28 6.50 15.49**a TOEFL Reading 24.73 6.65 21.94 7.94 19.23**a TOEFL Speaking 24.26 3.41 22.81 3.90 21.14**a TOEFL Writing 24.70 3.66 23.10 4.08 23.25**a TOEFL Total 100.02 16.37 92.13 19.09 26.27**a
Note. The Ns for the participants and nonparticipants are 160 and 565 in China, 220 and 545 in
Colombia, 182 and 391 in Egypt, and 200 and 489 in Germany. a η > .10.
*p < .05;**p < .01.

7
Table 2
Percentage Distributions of Gender for Participants and Nonparticipants in Each Country
Variable Participants Nonparticipants χ2
China N 160 565 Male 40.0 49.6 4.57* Female 60.0 50.4
Colombia N 209 474 Male 54.5 51.3 .63 Female 45.5 48.7
Egypt N 170 368 7.00**a Male 72.4 60.6 Female 27.6 39.4
Germany N 190 422 1.41 Male 47.9 53.1 Female 52.1 46.9 a W > .10.
*p < .05; **p < .01.
In every country, differences between participants and nonparticipants were statistically
and practically significant for one or more TOEFL sections or the total score (participants always
had higher scores than nonparticipants). In China, the differences in Age and Gender were not
significant, but the difference in TOEFL Speaking was significant. In Colombia, the differences
in Age and Gender were not significant, but differences in all TOEFL scores were significant. In
Egypt, the differences in Age and Gender were significant (participants were older and more
were men) and differences in four TOEFL scores were significant: Listening, Reading, Writing,
and Total. In Germany, the differences in Age and Gender were not significant, but differences
in all TOEFL scores were significant.
8
Comparisons of TOEFL Acceptance and Acceptance of Admission Tests for Countries
The means for TOEFL Acceptance and Acceptance of Admissions Tests for the four
countries and analysis of variance statistics are summarized in Table 3.
Table 3
Means of TOEFL Acceptance and Acceptance of Admissions Tests
Variable China Colombia Egypt Germany F Mean SD Mean SD Mean SD Mean SD TOEFL Acceptance 1.70 3.77 1.89 3.86 1.04 4.22 -.34 4.16 12.63**a
Acceptance of Admissions Tests -.60 1.85 -.68 2.08 -.77 2.12 -1.28 1.85 4.60**a
Note. The Ns are 160 for China, 220 for Colombia, 182 for Egypt, and 200 for Germany. aη > .10.
**p < .01.
The differences among the four countries were statistically and practically significant for
both scales (Germany’s mean scores were appreciably lower on both). The mean scores for
TOEFL Acceptance were moderately positive for China, Colombia, and Egypt, ranging from
1.04 for Egypt to 1.70 for China, but were neutral for Germany (-.34). (The corresponding means
of the item scores were .19 for China, .21 for Colombia, .12 for Egypt, and -.04 for Germany; the
theoretical range of these item means is 1 to -1, and the neutral point is 0.) In contrast, the means
scores for Acceptance of Admissions Tests were moderately negative in the four countries,
ranging from -.60 for China to - 1.28 for Germany. (The corresponding item means were -.20 for
China, -.23 for Colombia, -.26 for Egypt, and -.43 for Germany; again, the theoretical range is 1
to -1, and the neutral point is 0.)
Comparisons of Global Evaluation Items for Countries
The frequency distributions of the responses to the individual Global Evaluation items in
the four countries and the chi-square tests are reported in Table 4.

9
Table 4
Percentage Distributions of Responses to Global Evaluation Items in Each Country
Item China Colombia Egypt Germany Participants in
countries
Do not
Do not
Do not
Do not
Do not
Do not
Do not
Do not
Agree agree know Agree agree know Agree agree know Agree Agree know χ2
The TOEFL gave me a good opportunity to demonstrate my ability to read English. 73.8 16.2 10.0 74.5 20.9 4.5 61.5 35.2 3.3 58.0 34.5 7.5 32.54**a
The TOEFL gave me a good opportunity to demonstrate my ability to understand spoken English. 81.2 13.1 5.6 85.0 12.3 2.7 86.8 12.6 .5 84.5 11.0 4.5 8.63
The TOEFL gave me a good opportunity to demonstrate my ability to write in English. 80.6 10.6 8.8 89.5 8.6 1.8 86.3 12.1 1.6 82.0 9.0 9.0 21.58**a
The TOEFL gave me a good opportunity to demonstrate my ability to speak English. 62.5 28.1 9.4 47.3 44.5 8.2 56.6 40.1 3.3 28.0 63.0 9.0 58.04**a
Note. The Ns are 160 for China, 220 for Colombia, 182 for Egypt, and 200 for Germany. aW > .10.
**p < .01.

10
Table 5
Correlations of TOEFL Acceptance and Acceptance of Admissions Tests With Other Questionnaire and Background Variables,
and TOEFL Scores in Each Country
Variable China Colombia Egypt Germany
TOEFL
Acceptance
Acceptance of
Admissions Tests
TOEFL Acceptance
Acceptance of
Admissions Tests
TOEFL Acceptance
Acceptance of
Admissions Tests
TOEFL Acceptance
Acceptance of
Admissions Tests
TOEFL Acceptance — .38** — .36** — .37** — .46** Acceptance of Admissions Tests .38** — .36** — .37** — .46** — Total Computer Attitude .25** .18* .18** .07 .03 -.02 .27** .13 Total Test Anxiety -.14 .02 -.09 -.04 -.22** .05 -.12 -.05 Computer Familiarity .17* .20* -.04 .00 -.11 -.09 .11 .14 Preparation for TOEFL -.03 -.06 -.08 -.03 -.14 .05 -.08 -.03 Admissions Tests Taken .00 -.06 .06 .01 -.03 .03 -.04 -.06 Age -.05 -.04 .02 .02 -.05 -.04 .04 .01 Sex -.02 -.02 -.07 -.05 .01 -.03 -.15 .07 TOEFL Listening .24** .04 .22** -.10 .17* -.15* .12 .02 TOEFL Reading .14 .08 .27** -.07 .25** -.19** .29** .06 TOFEL Speaking .10 -.03 .13 -.08 .11 -.10 .10 .10 TOEFL Writing .17* .09 .17** -.06 .23** -.11 .20** .05 TOEFL Total .20** .06 .24** -.09 .23** -.17* .22** .06
Note. Ns range from 147 to 160 for China, 204 to 220 for Colombia, 157 to 182 for Egypt, and 170 to 200 for Germany.
*p < .05 (two-tail); **p < .01 (two-tail).

11
The differences among the countries were statistically and practically significant for three
items (the Listening item was the exception), with appreciably fewer favorable responses to the
Reading item in Germany and Egypt and appreciably fewer favorable responses to the Speaking
item in Germany. Most test takers in the four countries gave favorable responses to the items,
with two exceptions: most examinees in Colombia and Germany gave unfavorable responses to
the Speaking item. Appreciably fewer favorable responses were made to the Speaking item than
to the Listening and Writing items in every country.
Correlations of TOEFL Acceptance and Acceptance of Admissions Tests With Questionnaire
and Background Variables, and TOEFL Scores in Each Country
The correlations of TOEFL Acceptance and Acceptance of Admissions Tests with the
other questionnaire and background variables, and TOEFL scores in the four countries, are
reported in Table 5. The internal-consistency reliability of the questionnaire scales is shown in
Table 6, and their means appear in Table 7.
Reliability of questionnaire scales. The reliability of all the questionnaire scales was
generally modest. The reliability of TOEFL Acceptance ranged from .67 to .73 for the four
countries; the reliability of Acceptance of Admissions Tests ranged from .45 to .72.
Table 6
Reliability of Questionnaire Scales in Each Country
Scale China Colombia Egypt Germany N rxx N rxx N rxx N rxx
TOEFL Acceptance 160 .67 220 .72 182 .73 200 .72
Acceptance of Admissions Tests 160 .45 220 .68 182 .72 200 .61
Total Computer Attitude 160 .77 220 .71 182 .80 200 .82
Total Test Anxiety 160 .75 220 .71 182 .78 200 .69
Computer Familiarity 148 .51 204 .54 161 .68 170 .54

12
Table 7
Means for Questionnaire Variables in Each Country
Variable China Colombia Egypt Germany N Mean SD N Mean SD N Mean SD N Mean SD
Total Computer Attitude
160 7.26 4.70 220 9.08 3.78 182 8.87 4.09 200 7.13 4.68
Total Test Anxiety
160 -3.90 6.89 220 -2.66 6.53 182 -2.93 7.45 200 -4.18 6.12
Computer Familiarity
148 15.90 1.44 204 16.51 1.47 161 15.94 1.89 170 15.52 1.65
Preparation for TOEFL
147 .78 .42 208 .40 .49 164 .60 .49 194 .29 .45
Admissions Test Taken
155 1.52 .67 204 1.43 .65 157 1.69 1.02 192 1.34 .75
Note. Corresponding statistics for TOEFL Acceptance and Acceptance of Admissions Tests appear in Table 3.

13
TOEFL Acceptance correlates. TOEFL Acceptance had statistically and practically
significant correlations in every country with three variables: Acceptance of Admissions Tests,
TOEFL Writing, and TOEFL Total. All of these correlations were positive. The scale’s other
significant correlations were less consistent, often involving Total Computer Attitude and
TOEFL sections. In China, TOEFL Acceptance correlated significantly and positively with Total
Computer Attitude, Computer Familiarity, and TOEFL Listening. In Colombia, it correlated
positively with Total Computer Attitude and TOEFL Listening. In Egypt, it correlated negatively
with Total Test Anxiety and positively with TOEFL Listening and TOEFL Reading. And in
Germany, it correlated positively with Total Computer Attitude and TOEFL Reading.
Acceptance of Admissions Tests correlates. Acceptance of Admissions Tests, besides its
consistent correlations with TOEFL Acceptance in the four countries, had few statistically and
practically significant correlations with other variables. In China, this scale correlated positively
with Total Computer Attitude and Computer Familiarity. And in Egypt, it correlated negatively
with TOEFL Listening, TOEFL Reading, and TOEFL Total.
Discussion
Level of TOEFL Acceptance
A key finding is that reported attitudes about the TOEFL iBT are not monolithic, but vary
markedly by country and by section of the test. The contrast is remarkable between the
moderately positive attitudes in most countries and the neutral or negative attitudes in Germany,
as well as between very favorable attitudes about the listening and writing components of the test
and the less favorable or even unfavorable attitudes about the speaking component.
The differences in attitudes about the sections of the test could not be anticipated, for the sections
had not been studied before. However, the national differences are surprising, in view of the
Stricker et al. (2004) findings of uniformly moderate positive attitudes in testing centers in
Buenos Aires, Cairo, and Frankfurt. Of course, any comparisons of the results for the two studies
are complicated by several potentially important differences. Besides a host of differences in the
two versions of the TOEFL themselves (most notably, the TOEFL CBT was computer adaptive
and did not have a speaking section), the participants in the Stricker et al. study had received
their test scores before they completed the questionnaire, whereas the participants in the present
study had not; there are a variety of cohort effects; and the Stricker et al. study used samples of

14
test takers from certain cities (e.g., Cairo, Frankfurt) and the present study used samples from
entire countries (e.g., Egypt, Germany).
These national differences are mirrored by the results for attitudes about admissions tests
in general, Germany again having the least favorable attitudes. However, in contrast to the
consistently negative attitudes across the four countries, the Stricker et al. (2004) study found
negative attitudes in only two of the three cities.
The divergent attitudes in Germany about the TOEFL and other admissions tests raise the
question, unanswerable at this point, of whether these attitudes are somehow peculiar to that
country and if so, why, or whether they are widespread in other European countries.
The less favorable attitudes about the Speaking section in all countries are noteworthy.
Again, the unanswered question is whether these attitudes are common to all speaking tests or
are triggered by unusual features of the TOEFL section, such as the absence of interaction.
It would be highly desirable to put these results about attitudes towards the TOEFL in
perspective by considering them in the context of attitudes about other English as- a second
language tests and other kinds of admissions tests. Unfortunately, relevant data about current
attitudes are sparse. It is noteworthy that attitudes about the TOEFL were more favorable than
those about admissions tests in general in all four countries in this study and in two of the three
countries (Egypt was the exception) in the Stricker et al. (2004) study. Only one study of another
specific admissions test is pertinent. A 1998 survey of the Graduate Management Admission
Test found moderately negatively attitudes about whether the test was valid (Stricker, Wilder, &
Bridgeman, 2006).
In interpreting the findings concerning the level of attitudes about the TOEFL, it is
important to realize that they overestimate, to some extent, how positive these attitudes are in the
TOEFL populations that were studied. Survey participants performed slightly better on the
TOEFL than other test takers, and test performance and attitudes are weakly related. (This same
phenomenon occurred in the Stricker et al. [2004] study.)
Correlates of TOEFL Acceptance
The moderate correlations between attitudes about the TOEFL and about admissions tests
in general (even when corrected for attenuation, they only ranged from .51 in Colombia to .70 in
Germany), accompanied by the different patterns of correlations with the other measures,

15
suggest, as in the Stricker et al. (2004) study, that the two kinds of attitudes are distinguishable.
This is remarkable, for many of the test takers’ firsthand experience with admissions tests is
confined to the TOEFL: between 47.3% in Egypt to 73.4% in Germany reported that they had
taken only a single admissions test, and that would have included the TOEFL. Attitudes about
admissions tests are in the air for students bound for college or graduate school, and hence their
attitudes about the TOEFL and about admissions tests in general need not be identical.
The slight and inconsistent correlations with other possible determinants of TOEFL
acceptance are congruent with the sparse correlations of these variables in the Stricker et al.
(2004) study.
And, like the equally slight or moderate but positive correlations of TOEFL Acceptance
with TOEFL scores in the Stricker et al. (2004) study, the slight correlations in the present study
seem to rule out the concern that test takers’ attitudes about the test represent an important source
of irrelevant variance in their performance on it. In any event, these correlations may also reflect,
to some degree, a self-serving bias: test takers attribute their poor performance to the test being
invalid (Chan, Schmitt, Jennings, Clause, & Delbridge, 1998).
Conclusion
An obvious lesson to be gleaned from this study is the need for fine-grained analyses of
test takers’ attitudes about the TOEFL. An investigation of the attitudes of test takers aggregated
across countries and focused on the test in general would miss important differences among
national groups and among sections of the test. An appraisal of the generality of the present
results to a wider sampling of countries is in order, followed, if warranted, by an examination of
the reasons for problems they spotlight and means of addressing them. Periodic monitoring of
these attitudes would be prudent; the present study and the Stricker et al. (2004) study can serve
as baselines for such efforts.

16
References
Bandalos, D., & Benson, J. (1990). Testing the factor structure invariance of a computer attitude
scale over two grouping conditions. Educational and Psychological Measurement, 50,
49-60.
Benson, J., & El-Zahhar, N. (1994). Further refinement and validation of the revised Test
Anxiety Scale. Structural Equation Modeling, 1, 203-221.
Chan, D., Schmitt, N., Jennings, D., Clause, C. S., & Delbridge, K. (1998). Applicant
perceptions of test fairness: Integrating justice and self-serving bias perspectives.
International Journal of Selection and Assessment, 6, 232-239.
Cohen, J. (1988). Statistical power analysis for the behavioral sciences (2nd ed.). Hillsdale, NJ:
Erlbaum.
Eignor, D., Taylor, C., Kirsch, I., & Jamieson, J. (1998). Development of a scale for assessing
level of computer familiarity of TOEFL examinees (TOEFL Research Rep. No. 60; ETS
Research Rep. No. RR-98-07). Princeton, NJ: ETS.
Jamieson, J., Taylor, C., Kirsch, I., & Eignor, D. (1999). Design and evaluation of a TOEFL
CBT tutorial (TOEFL Research Rep. No. 62; ETS Research Rep. No. 99-01). Princeton,
NJ: ETS.
Loyd, B. H., & Gressard, C. (1984). Reliability and factorial validity of computer attitude scales.
Educational and Psychological Measurement, 44, 501-505.
Nevo, B. (1993). The practical and theoretical value of Examinee Feedback Questionnaire
(EFeQ). In B. Nevo & R. S. Jager (Eds.), Educational and psychological testing: The test
taker’s outlook (pp. 85-113). Toronto: Hogrefe & Huber.
Stricker, L. J., Wilder, G. S., & Bridgeman, B. (2006). Test takers’ attitudes and beliefs about the
Graduate Management Admission Test. International Journal of Testing, 5, 255-268.
Stricker, L. J., Wilder, G. S., & Rock, D. A. (2004). Attitudes about the computer-based Test of
English as a Foreign Language. Computers in Human Behavior, 20, 37-54