Embed Size (px)
Citation preview

RESEARCH Open Access
PaCO2 and alveolar dead space are more relevantthan PaO2/FiO2 ratio in monitoring therespiratory response to prone position in ARDSpatients: a physiological studyCyril Charron1,2, Xavier Repesse1,2, Koceïla Bouferrache1,2, Laurent Bodson1,2, Samuel Castro1,2, Bernard Page1,2,François Jardin1,2 and Antoine Vieillard-Baron1,2*
Abstract
Introduction: Our aims in this study were to report changes in the ratio of alveolar dead space to tidal volume(VDalv/VT) in the prone position (PP) and to test whether changes in partial pressure of arterial CO2 (PaCO2) may bemore relevant than changes in the ratio of partial pressure of arterial O2 to fraction of inspired O2 (PaO2/FiO2) indefining the respiratory response to PP. We also aimed to validate a recently proposed method of estimation ofthe physiological dead space (VDphysiol/VT) without measurement of expired CO2.
Methods: Thirteen patients with a PaO2/FiO2 ratio < 100 mmHg were included in the study. Plateau pressure(Pplat), positive end-expiratory pressure (PEEP), blood gas analysis and expiratory CO2 were recorded with patientsin the supine position and after 3, 6, 9, 12 and 15 hours in the PP. Responders to PP were defined after 15 hoursof PP either by an increase in PaO2/FiO2 ratio > 20 mmHg or by a decrease in PaCO2 > 2 mmHg. Estimated andmeasured VDphysiol/VT ratios were compared.
Results: PP induced a decrease in Pplat, PaCO2 and VDalv/VT ratio and increases in PaO2/FiO2 ratios andcompliance of the respiratory system (Crs). Maximal changes were observed after six to nine hours. Changes inVDalv/VT were correlated with changes in Crs, but not with changes in PaO2/FiO2 ratios. When the response wasdefined by PaO2/FiO2 ratio, no significant differences in Pplat, PaCO2 or VDalv/VT alterations between responders(n = 7) and nonresponders (n = 6) were observed. When the response was defined by PaCO2, four patientswere differently classified, and responders (n = 7) had a greater decrease in VDalv/VT ratio and in Pplat and agreater increase in PaO2/FiO2 ratio and in Crs than nonresponders (n = 6). Estimated VDphysiol/VT ratiossignificantly underestimated measured VDphysiol/VT ratios (concordance correlation coefficient 0.19 (interquartileranges 0.091 to 0.28)), whereas changes during PP were more reliable (concordance correlation coefficient 0.51(0.32 to 0.66)).
Conclusions: PP induced a decrease in VDalv/VT ratio and an improvement in respiratory mechanics. Therespiratory response to PP appeared more relevant when PaCO2 rather than the PaO2/FiO2 ratio was used.Estimated VDphysiol/VT ratios systematically underestimated measured VDphysiol/VT ratios.
* Correspondence: [email protected] Care Unit, Section Thorax-Vascular Disease-Abdomen-Metabolism,Ambroise Paré University Hospital, AP-HP, 9 Av Charles de Gaulle, F-92104Boulogne-Billancourt Cedex, FranceFull list of author information is available at the end of the article
Charron et al. Critical Care 2011, 15:R175http://ccforum.com/content/15/4/R175
© 2011 Charron et al.; licensee BioMed Central Ltd. This is an open access article distributed under the terms of the Creative CommonsAttribution License (http://creativecommons.org/licenses/by/2.0), which permits unrestricted use, distribution, and reproduction inany medium, provided the original work is properly cited.

IntroductionSince its first description in 1967 [1], it has beenaccepted that acute respiratory distress syndrome(ARDS) includes a number of lung injuries of variousorigins whose consequences are decreased lung capacityavailable for ventilation, leading to the concept of “babylung” [2]. Considerable progress has been made over thepast decade in the ventilatory management of patientswith ARDS. In particular, a strict limitation of tidalvolume (VT) and plateau pressure (Pplat) below 30cmH2O reduces mortality [3]. The application of posi-tive end-expiratory pressure (PEEP) is recognized torecruit the lung and to restore functional residual capa-city [4], but its optimum level is still widely debated [5].The prone position (PP) may also be part of the venti-
latory strategy. This method was proposed more than30 years ago, initially in pathophysiological studies [6,7].Recently, Sud et al. [8] suggested, on the basis of pooleddata from randomized, controlled trials, that PP mayimprove survival in the subgroup of patients with themost severe ARDS, that is, those with a ratio of partialpressure of arterial O2 to fraction of inspired O2 (PaO2/FiO2) < 100 mmHg. Many questions remain unresolved.In particular, response to PP is usually defined accord-ing to changes in PaO2, with responders being those inwhom the PaO2/FiO2 ratio increases > 20 mmHg afterone to six hours in the PP [9-11]. However, we havepreviously reported that PP allows recruitment of a slowcompartment previously excluded from ventilation [12].This was associated with a decrease in partial pressureof arterial CO2 (PaCO2), an indirect reflection of thereduction of the alveolar dead space (VDalv) [12]. Gatti-noni et al. [10] also reported that the prognosis isimproved in patients in whom PaCO2 declines after aninitial PP session. Finally, VDalv appears to be an inde-pendent risk factor for mortality in patients with ARDS[13]. In a recent study, Siddiki et al. [14] proposed eval-uating the physiological dead space fraction (VDphysiol/VT) by using a rearranged alveolar gas equation forPaCO2 without any expired CO2 measurement.In this context, we conducted a prospective physiolo-
gical study to evaluate the impact of PP on ventilatorymechanics, gas exchange and VDalv. Our main objectivewas to validate our hypothesis that changes in PaCO2
and VDalv might be more relevant than changes in PaO2
in defining the respiratory response to PP. Our secondobjective was to validate the method of evaluation of theVDphysiol/VT proposed by Siddiki et al. [14].
Materials and methodsIn our unit, patients with a PaO2/FiO2 ratio < 100mmHg after 24 to 48 hours of mechanical ventilationare systematically turned to PP when hemodynamicallystable [15]. Our study was approved by the Ethics
Committee of the “Société de Réanimation de LangueFrançaise” (SRLF-CE 07-213). After obtaining informedconsent from the patients’ relatives, 15 patients wereincluded in the study between January 2008 and March2010. Inclusion criteria were (1) the presence of ARDSaccording to the definition of the Acute Respiratory Dis-tress Syndrome Network [3]; (2) persistence of severehypoxemia after 48 hours of mechanical ventilation,defined as a PaO2/FiO2 ratio < 100 mmHg; and (3)hemodynamic stability, defined as systolic blood pres-sure > 90 mmHg with norepinephrine infusion at a rate< 0.5 μg/kg/minute. Patients with chronic obstructivepulmonary disease were excluded.All patients were ventilated in volume-controlled
mode (Servo-i; Maquet SA, Ardon, France), sedated andparalyzed by infusion of atracurium. The heat andmoisture exchanger was routinely removed and replacedby a heated humidifier to reduce instrumental deadspace as previously reported [16]. The ventilator settingsincluded a “moderately restricted” VT of 6 to 8 mL/kgmeasured body weight, a respiratory rate allowing us tolimit hypercapnia without generating intrinsic PEEP andan inspiration/expiration ratio of 1:2 with an endinspiratory pause of 0.5 seconds. Pplat was strictly lim-ited < 30 cmH2O, and the PEEP selected was that whichcorrected the intrinsic PEEP, if any [17]. Ventilator set-tings were kept constant throughout the study. Arecruitment maneuver was never used, and suction wasnot systematically performed. All patients were continu-ously monitored in terms of blood pressure with anarterial catheter, heart rate and O2 saturation by pulseoximetry.The study was conducted during the first session of
PP. Our sessions routinely last 15 to 18 hours per day.Blood gas analysis, Pplat, total PEEP, end-tidal CO2
(PetCO2) and mixed expired CO2 (PECO2) were recordedwith the patient in the supine position, just before turn-ing the patient to the PP, and every 3 hours in the PPuntil 15 hours had elapsed. Expired CO2 was measuredby a sensor positioned between the proximal end of theendotracheal tube and the Y piece of the ventilator cir-cuit (COSMO; Novametrix, Wallingford, CT, USA). Theratio of VD/VT was calculated using the simplified Bohrequation [18] as follows: (1) VDalv/VT = 1 - PetCO2/PaCO2 and (2) VDphysiol/VT = 1 - PECO2/PaCO2.The estimated VDphysiol/VT ratio was calculated as 1 -
[(0.86 × VCO2est)/(VE × PaCO2)], where VCO2est is theestimated CO2 production calculated using the Harris-Benedict equation [19] and VE is the expired minuteventilation.Intrinsic PEEP was measured during a four-second
end-expiratory occlusion period. Pplat was measuredduring a 0.5-second end-inspiratory pause. Respiratorysystem compliance (Crs) was calculated as Crs = VT/
Charron et al. Critical Care 2011, 15:R175http://ccforum.com/content/15/4/R175
Page 2 of 10

(Pplat - PEEPtotal). Responders to PP were defined intwo different ways: (1) an increase in PaO2/FiO2 ratio >20 mmHg after 15 hours of PP or (2) a decrease inPaCO2 > 2 mmHg after 15 hours of PP.
Statistical analysisStatistical analysis was performed using StatView 5 soft-ware (SAS Institute Inc., Cary, NC, USA). The continu-ous variables were expressed as medians (1st to 3rdinterquartile range). Analysis of variance for repeatedmeasurements was used for each parameter, and P <0.05 was considered statistically significant. MeasuredVDphysiol/VT and estimated VDphysiol/VT were comparedaccording to Bland-Altman analysis, together with theconcordance correlation coefficient in 78 paired data.The same method was used to compare variations ofmeasured and estimated VDphysiol/VT every three hourswhile the patient was in PP.
ResultsTwo patients were excluded from the study because of ahistory of severe chronic obstructive pulmonary disease,which left a study population of 13 patients. Thepatients’ median age was 53 years (1st to 3rd interquar-tile range, 48 to 59 years), their median SimplifiedAcute Physiology Score II score was 62 (1st to 3rd inter-quartile range, 35 to 71) and their median SequentialOrgan Failure Assessment score was 11 (1st to 3rdinterquartile range, 8-13). All patients except one hadARDS of pulmonary origin. Eight patients had pneumo-nia, with six cases related to streptococcus pneumoniaand two due to influenza (H1N1 virus). Two patientshad aspiration, one had toxic shock syndrome and twohad ARDS due to miscellaneous causes. No patient hadabdominal hypertension or traumatic lung injury. Elevenpatients required norepinephrine infusion. Respiratoryparameters and blood gas analysis at the time of inclu-sion are reported in Table 1.A significant increase in PaO2/FiO2 ratio occurred
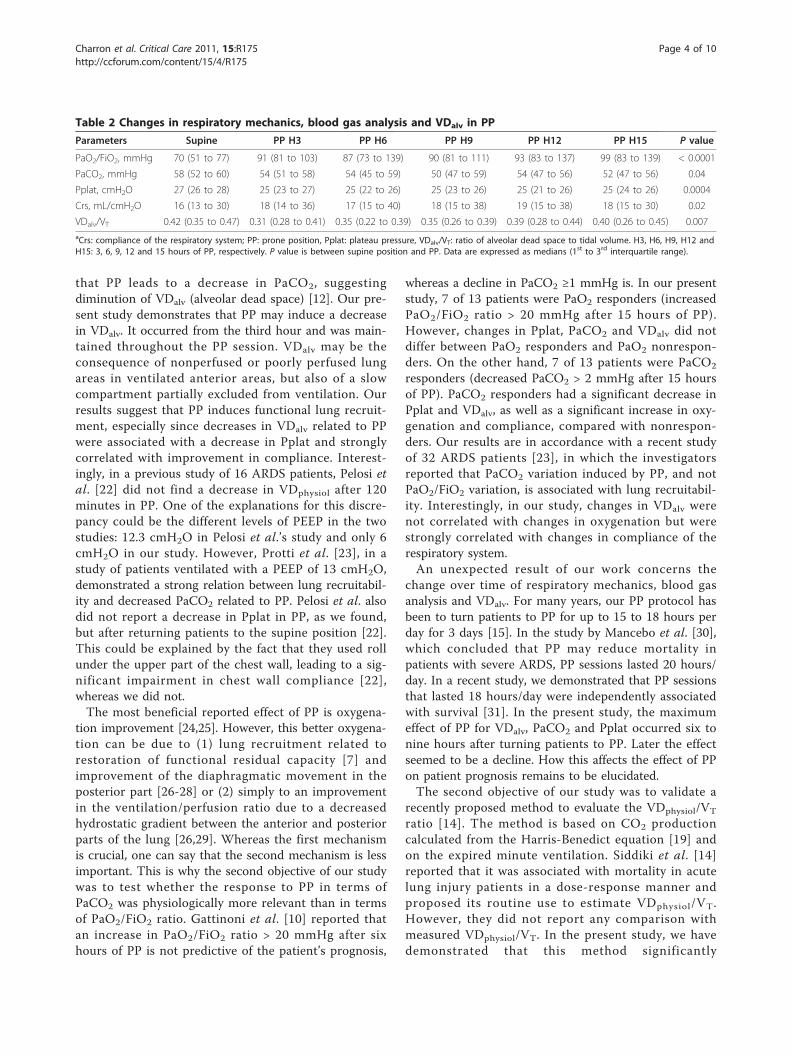
after 15 hours of PP, from 70 mmHg (51 to 77) in thesupine position to 99 mmHg in the prone (83 to 139) (P< 0.0001) (Table 2). A significant decrease in PaCO2 wasalso observed, from 58 mmHg (52 to 60) to 52 mmHg(47 to 56) (P = 0.04) (Table 2), with the lowest valueoccurring after nine hours of PP. As noted in Table 2,Pplat was significantly reduced (P = 0.0004) and Crsimproved (from 16 mL/cmH2O (13 to 30) to 18 mL/cmH2O (15 to 30); P = 0.02). Finally, the VDalv/VT ratiowas significantly reduced from 0.42 (0.35 to 0.47) to0.40 (0.26 to 0.45), with the lowest value occurring afterthree hours in PP (hour 3) (0.31) (Table 2).Seven patients were classified as “PaO2 responders” and
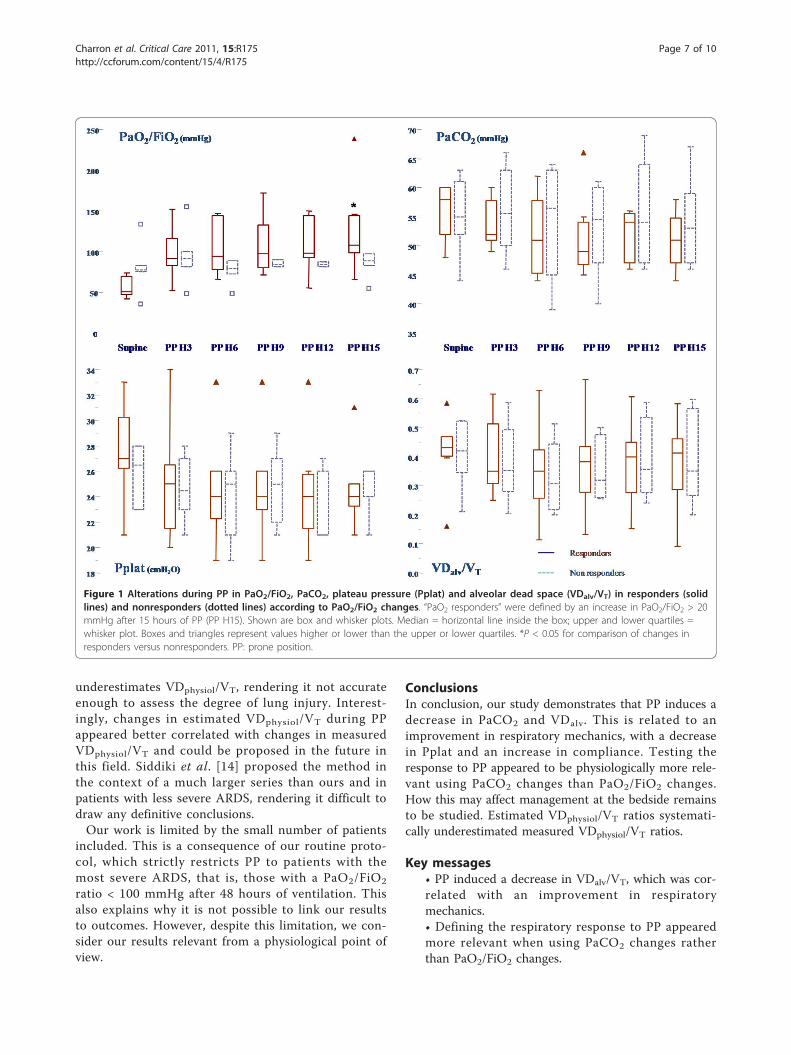
six were classified as “PaO2 nonresponders” according toPaO2/FiO2 ratio changes. No differences in VDalv/VT
ratios or PaCO2 or Pplat alterations during PP wereobserved between groups (Table 3 and Figure 1), whereasCrs increased more in the responders (Table 3). Sevenpatients were also classified as “PaCO2 responders” andsix as “PaCO2 nonresponders” according to the PaCO2
changes. However, when compared with the PaO2/FiO2
classification, four patients were classified differently. Asshown in Table 4 and Figure 2, VDalv/VT, PaO2/FiO2,PaCO2, Pplat and Crs were significantly more altered inresponders than in nonresponders. As shown in Figure 3,we found no correlation between changes in VDalv/VT
and changes in PaO2/FiO2 (P = 0.95), whereas we founda negative correlation between changes in VDalv/VT andchanges in Crs (r = 0.29, P = 0.03).As shown in Figure 4, estimated VDphysiol/VT systema-
tically underestimated measured VDphysiol/VT, with apoor concordance correlation coefficient of 0.19 (95%confidence interval (95% CI) 0.091 to 0.28), a bias of0.16 and an agreement between -0.05 and 0.37. Con-cerning changes in VDphysiol/VT during PP, estimatedVDphysiol/VT had a concordance correlation coefficientof 0.51 (95% CI 0.32 to 0.66) (Figure 4).
DiscussionOne of the objectives of our study was to describealterations in VDalv induced by PP. ARDS is character-ized by a heterogeneous lung with the existence of aslow compartment [18,20], defined as areas available for,but partially or totally excluded from, ventilation due inpart to a bronchiolar collapse [12,21]. In a previousstudy, we reported that PP may induce recruitment ofthis slow compartment, as suggested by its ability tocounteract intrinsic PEEP and to decrease the expiratorytime constant [12]. In the same study, we also reported
Table 1 Respiratory parameters and blood gas analysis atinclusiona
Parameters Median 1st to 3rd interquartile range
LIS 3.25 3 to 3.25
Tidal volume, mL/kg IDB 6.2 5.6 to 8.3
RR, breaths/minute 22 18 to 26
PEEP, cmH2O 6 5 to 7
FiO2, % 90 90 to 100
Pplat, cmH2O 27 26 to 28
PaO2/FiO2, mmHg 70 51 to 77
PaCO2, mmHg 58 52 to 60
Crs, mL/cmH2O 16 13 to 30
VDalv/VT 0.42 0.35 to 0.47
VDalv, mL 159 95 to 236aCrs: compliance of the respiratory system; IDB: ideal body weight; LIS: lunginjury score [32]; PaCO2: partial pressure of arterial CO2; PaO2/FiO2: ratio ofpartial pressure of arterial O2 to fraction of inspired O2; PEEP: positive end-expiratory pressure; Pplat: plateau pressure; RR: respiratory rate; VDalv/VT: ratioof alveolar dead space to tidal volume.
Charron et al. Critical Care 2011, 15:R175http://ccforum.com/content/15/4/R175
Page 3 of 10
that PP leads to a decrease in PaCO2, suggestingdiminution of VDalv (alveolar dead space) [12]. Our pre-sent study demonstrates that PP may induce a decreasein VDalv. It occurred from the third hour and was main-tained throughout the PP session. VDalv may be theconsequence of nonperfused or poorly perfused lungareas in ventilated anterior areas, but also of a slowcompartment partially excluded from ventilation. Ourresults suggest that PP induces functional lung recruit-ment, especially since decreases in VDalv related to PPwere associated with a decrease in Pplat and stronglycorrelated with improvement in compliance. Interest-ingly, in a previous study of 16 ARDS patients, Pelosi etal. [22] did not find a decrease in VDphysiol after 120minutes in PP. One of the explanations for this discre-pancy could be the different levels of PEEP in the twostudies: 12.3 cmH2O in Pelosi et al.’s study and only 6cmH2O in our study. However, Protti et al. [23], in astudy of patients ventilated with a PEEP of 13 cmH2O,demonstrated a strong relation between lung recruitabil-ity and decreased PaCO2 related to PP. Pelosi et al. alsodid not report a decrease in Pplat in PP, as we found,but after returning patients to the supine position [22].This could be explained by the fact that they used rollunder the upper part of the chest wall, leading to a sig-nificant impairment in chest wall compliance [22],whereas we did not.The most beneficial reported effect of PP is oxygena-
tion improvement [24,25]. However, this better oxygena-tion can be due to (1) lung recruitment related torestoration of functional residual capacity [7] andimprovement of the diaphragmatic movement in theposterior part [26-28] or (2) simply to an improvementin the ventilation/perfusion ratio due to a decreasedhydrostatic gradient between the anterior and posteriorparts of the lung [26,29]. Whereas the first mechanismis crucial, one can say that the second mechanism is lessimportant. This is why the second objective of our studywas to test whether the response to PP in terms ofPaCO2 was physiologically more relevant than in termsof PaO2/FiO2 ratio. Gattinoni et al. [10] reported thatan increase in PaO2/FiO2 ratio > 20 mmHg after sixhours of PP is not predictive of the patient’s prognosis,
whereas a decline in PaCO2 ≥1 mmHg is. In our presentstudy, 7 of 13 patients were PaO2 responders (increasedPaO2/FiO2 ratio > 20 mmHg after 15 hours of PP).However, changes in Pplat, PaCO2 and VDalv did notdiffer between PaO2 responders and PaO2 nonrespon-ders. On the other hand, 7 of 13 patients were PaCO2
responders (decreased PaCO2 > 2 mmHg after 15 hoursof PP). PaCO2 responders had a significant decrease inPplat and VDalv, as well as a significant increase in oxy-genation and compliance, compared with nonrespon-ders. Our results are in accordance with a recent studyof 32 ARDS patients [23], in which the investigatorsreported that PaCO2 variation induced by PP, and notPaO2/FiO2 variation, is associated with lung recruitabil-ity. Interestingly, in our study, changes in VDalv werenot correlated with changes in oxygenation but werestrongly correlated with changes in compliance of therespiratory system.An unexpected result of our work concerns the
change over time of respiratory mechanics, blood gasanalysis and VDalv. For many years, our PP protocol hasbeen to turn patients to PP for up to 15 to 18 hours perday for 3 days [15]. In the study by Mancebo et al. [30],which concluded that PP may reduce mortality inpatients with severe ARDS, PP sessions lasted 20 hours/day. In a recent study, we demonstrated that PP sessionsthat lasted 18 hours/day were independently associatedwith survival [31]. In the present study, the maximumeffect of PP for VDalv, PaCO2 and Pplat occurred six tonine hours after turning patients to PP. Later the effectseemed to be a decline. How this affects the effect of PPon patient prognosis remains to be elucidated.The second objective of our study was to validate a
recently proposed method to evaluate the VDphysiol/VT
ratio [14]. The method is based on CO2 productioncalculated from the Harris-Benedict equation [19] andon the expired minute ventilation. Siddiki et al. [14]reported that it was associated with mortality in acutelung injury patients in a dose-response manner andproposed its routine use to estimate VDphysiol/VT.However, they did not report any comparison withmeasured VDphysiol/VT. In the present study, we havedemonstrated that this method significantly
Table 2 Changes in respiratory mechanics, blood gas analysis and VDalv in PP
Parameters Supine PP H3 PP H6 PP H9 PP H12 PP H15 P value
PaO2/FiO2, mmHg 70 (51 to 77) 91 (81 to 103) 87 (73 to 139) 90 (81 to 111) 93 (83 to 137) 99 (83 to 139) < 0.0001
PaCO2, mmHg 58 (52 to 60) 54 (51 to 58) 54 (45 to 59) 50 (47 to 59) 54 (47 to 56) 52 (47 to 56) 0.04
Pplat, cmH2O 27 (26 to 28) 25 (23 to 27) 25 (22 to 26) 25 (23 to 26) 25 (21 to 26) 25 (24 to 26) 0.0004
Crs, mL/cmH2O 16 (13 to 30) 18 (14 to 36) 17 (15 to 40) 18 (15 to 38) 19 (15 to 38) 18 (15 to 30) 0.02
VDalv/VT 0.42 (0.35 to 0.47) 0.31 (0.28 to 0.41) 0.35 (0.22 to 0.39) 0.35 (0.26 to 0.39) 0.39 (0.28 to 0.44) 0.40 (0.26 to 0.45) 0.007aCrs: compliance of the respiratory system; PP: prone position, Pplat: plateau pressure, VDalv/VT: ratio of alveolar dead space to tidal volume. H3, H6, H9, H12 andH15: 3, 6, 9, 12 and 15 hours of PP, respectively. P value is between supine position and PP. Data are expressed as medians (1st to 3rd interquartile range).
Charron et al. Critical Care 2011, 15:R175http://ccforum.com/content/15/4/R175
Page 4 of 10
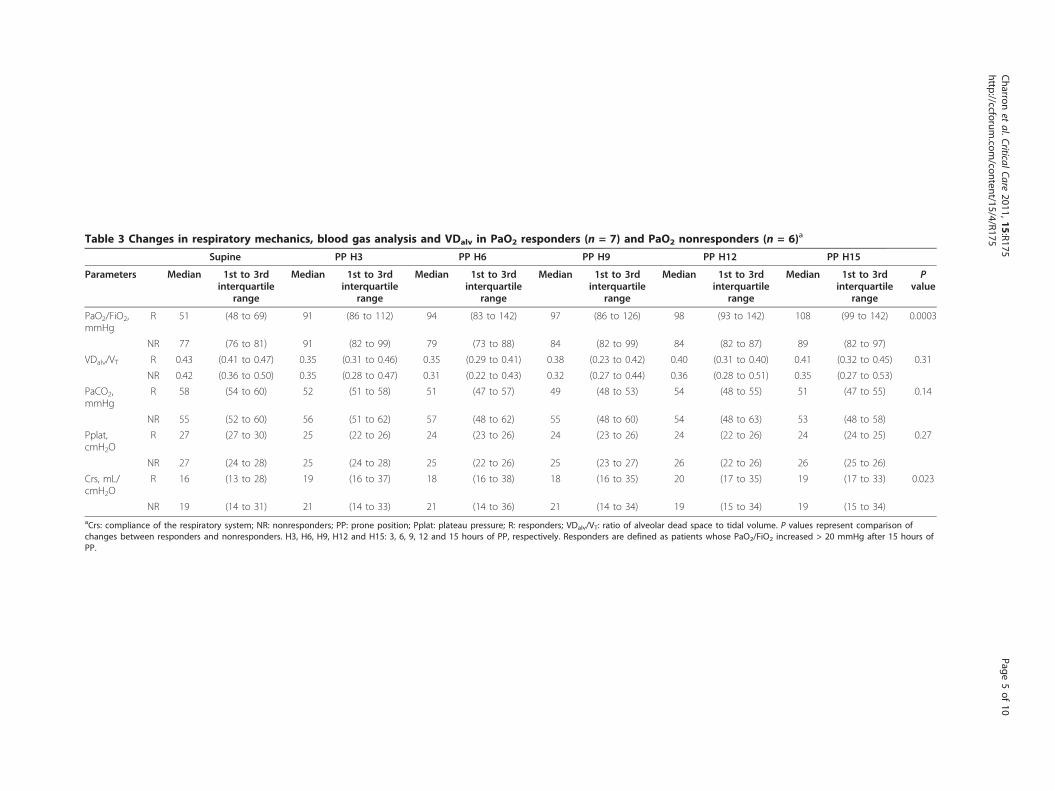
Table 3 Changes in respiratory mechanics, blood gas analysis and VDalv in PaO2 responders (n = 7) and PaO2 nonresponders (n = 6)a
Supine PP H3 PP H6 PP H9 PP H12 PP H15
Parameters Median 1st to 3rdinterquartile
range
Median 1st to 3rdinterquartile
range
Median 1st to 3rdinterquartile
range
Median 1st to 3rdinterquartile
range
Median 1st to 3rdinterquartile
range
Median 1st to 3rdinterquartile
range
Pvalue
PaO2/FiO2,mmHg
R 51 (48 to 69) 91 (86 to 112) 94 (83 to 142) 97 (86 to 126) 98 (93 to 142) 108 (99 to 142) 0.0003
NR 77 (76 to 81) 91 (82 to 99) 79 (73 to 88) 84 (82 to 99) 84 (82 to 87) 89 (82 to 97)
VDalv/VT R 0.43 (0.41 to 0.47) 0.35 (0.31 to 0.46) 0.35 (0.29 to 0.41) 0.38 (0.23 to 0.42) 0.40 (0.31 to 0.40) 0.41 (0.32 to 0.45) 0.31
NR 0.42 (0.36 to 0.50) 0.35 (0.28 to 0.47) 0.31 (0.22 to 0.43) 0.32 (0.27 to 0.44) 0.36 (0.28 to 0.51) 0.35 (0.27 to 0.53)
PaCO2,mmHg
R 58 (54 to 60) 52 (51 to 58) 51 (47 to 57) 49 (48 to 53) 54 (48 to 55) 51 (47 to 55) 0.14
NR 55 (52 to 60) 56 (51 to 62) 57 (48 to 62) 55 (48 to 60) 54 (48 to 63) 53 (48 to 58)
Pplat,cmH2O
R 27 (27 to 30) 25 (22 to 26) 24 (23 to 26) 24 (23 to 26) 24 (22 to 26) 24 (24 to 25) 0.27
NR 27 (24 to 28) 25 (24 to 28) 25 (22 to 26) 25 (23 to 27) 26 (22 to 26) 26 (25 to 26)
Crs, mL/cmH2O
R 16 (13 to 28) 19 (16 to 37) 18 (16 to 38) 18 (16 to 35) 20 (17 to 35) 19 (17 to 33) 0.023
NR 19 (14 to 31) 21 (14 to 33) 21 (14 to 36) 21 (14 to 34) 19 (15 to 34) 19 (15 to 34)aCrs: compliance of the respiratory system; NR: nonresponders; PP: prone position; Pplat: plateau pressure; R: responders; VDalv/VT: ratio of alveolar dead space to tidal volume. P values represent comparison ofchanges between responders and nonresponders. H3, H6, H9, H12 and H15: 3, 6, 9, 12 and 15 hours of PP, respectively. Responders are defined as patients whose PaO2/FiO2 increased > 20 mmHg after 15 hours ofPP.
Charron
etal.CriticalCare
2011,15:R175http://ccforum
.com/content/15/4/R175
Page5of
10

Table 4 Changes in respiratory mechanics, blood gas analysis and VDalv in PaCO2 responders (n = 7) and PaCO2 nonresponders (n = 6)a
Supine PP H3 PP H6 PP H9 PP H12 PP H15
Parameters Median 1st to 3rdinterquartile
range
Median 1st to 3rdinterquartile
range
Median 1st to 3rdinterquartile
range
Median 1st to 3rdinterquartile
range
Median 1st to 3rdinterquartile
range
Median 1st to 3rdinterquartile
range
Pvalues
PaCO2,mmHg)
R 58 (55 to 59) 57 (51 to 57) 54 (44 to 57) 50 (46 to 53) 50 (46 to 55) 50 (47 to 52) 0.005
NR 56 (49 to 60) 52 (49 to 60) 54 (49 to 62) 54 (49 to 60) 56 (51 to 62) 57 (49 to 59)
VDalv/VT R 0.40 (0.37 to 0.45) 0.31 (0.29 to 0.46) 0.23 (0.31 to 0.40) 0.26 (0.26 to 0.42) 0.28 (0.24 to 0.44) 0.28 (0.23 to 0.43) 0.005
NR 0.45 (0.42 to 0.51) 0.38 (0.32 to 0.47) 0.38 (0.35 to 0.43) 0.37 (0.33 to 0.45) 0.42 (0.39 to 0.51) 0.44 (0.39 to 0.54)
PaO2/FiO2,mmHg
R 70 (59 to 78) 103 (96 to 136) 138 (83 to 146) 111 (91 to 156) 136 (95 to 142) 139 (103 to 148) 0.0001
NR 63 (44 to 76) 83 (80 to 89) 79 (73 to 88) 83 (74 to 88) 84 (62 to 87) 89 (70 to 97)
Pplat,cmH2O
R 27 (24 to 27) 23 (22 to 25) 23 (20 to 25) 23 (22 to 25) 21 (21 to 25) 23 (21 to 25) 0.002
NR 28 (26 to 28) 26 (24 to 28) 26 (25 to 28) 26 (25 to 28) 26 (25 to 26) 26 (25 to 26)
Crs, mL/cmH2O
R 28 (15 to 30) 30 (18 to 36) 34 (17 to 41) 32 (18 to 38) 32 (19 to 39) 31 (18 to 39) 0.002
NR 15 (12 to 20) 15 (13 to 24) 15 (13 to 23) 15 (13 to 23) 15 (14 to 22) 15 (14 to 22)aCrs: compliance of the respiratory system; NR: nonresponders; PP: prone position; Pplat: plateau pressure; R: responders; VDalv/VT: ratio of alveolar dead space to tidal volume. P value represents comparison ofchanges between responders and nonresponders. H3, H6, H9, H12 and H15: 3, 6, 9, 12 and 15 hours of PP, respectively. Responders are defined as patients whose PaCO2 decreased > 2 mmHg after 15 hours of PP.
Charron
etal.CriticalCare
2011,15:R175http://ccforum
.com/content/15/4/R175
Page6of
10
underestimates VDphysiol/VT, rendering it not accurateenough to assess the degree of lung injury. Interest-ingly, changes in estimated VDphysiol/VT during PPappeared better correlated with changes in measuredVDphysiol/VT and could be proposed in the future inthis field. Siddiki et al. [14] proposed the method inthe context of a much larger series than ours and inpatients with less severe ARDS, rendering it difficult todraw any definitive conclusions.Our work is limited by the small number of patients
included. This is a consequence of our routine proto-col, which strictly restricts PP to patients with themost severe ARDS, that is, those with a PaO2/FiO2
ratio < 100 mmHg after 48 hours of ventilation. Thisalso explains why it is not possible to link our resultsto outcomes. However, despite this limitation, we con-sider our results relevant from a physiological point ofview.
ConclusionsIn conclusion, our study demonstrates that PP induces adecrease in PaCO2 and VDalv. This is related to animprovement in respiratory mechanics, with a decreasein Pplat and an increase in compliance. Testing theresponse to PP appeared to be physiologically more rele-vant using PaCO2 changes than PaO2/FiO2 changes.How this may affect management at the bedside remainsto be studied. Estimated VDphysiol/VT ratios systemati-cally underestimated measured VDphysiol/VT ratios.
Key messages• PP induced a decrease in VDalv/VT, which was cor-related with an improvement in respiratorymechanics.• Defining the respiratory response to PP appearedmore relevant when using PaCO2 changes ratherthan PaO2/FiO2 changes.
Figure 1 Alterations during PP in PaO2/FiO2, PaCO2, plateau pressure (Pplat) and alveolar dead space (VDalv/VT) in responders (solidlines) and nonresponders (dotted lines) according to PaO2/FiO2 changes. “PaO2 responders” were defined by an increase in PaO2/FiO2 > 20mmHg after 15 hours of PP (PP H15). Shown are box and whisker plots. Median = horizontal line inside the box; upper and lower quartiles =whisker plot. Boxes and triangles represent values higher or lower than the upper or lower quartiles. *P < 0.05 for comparison of changes inresponders versus nonresponders. PP: prone position.
Charron et al. Critical Care 2011, 15:R175http://ccforum.com/content/15/4/R175
Page 7 of 10
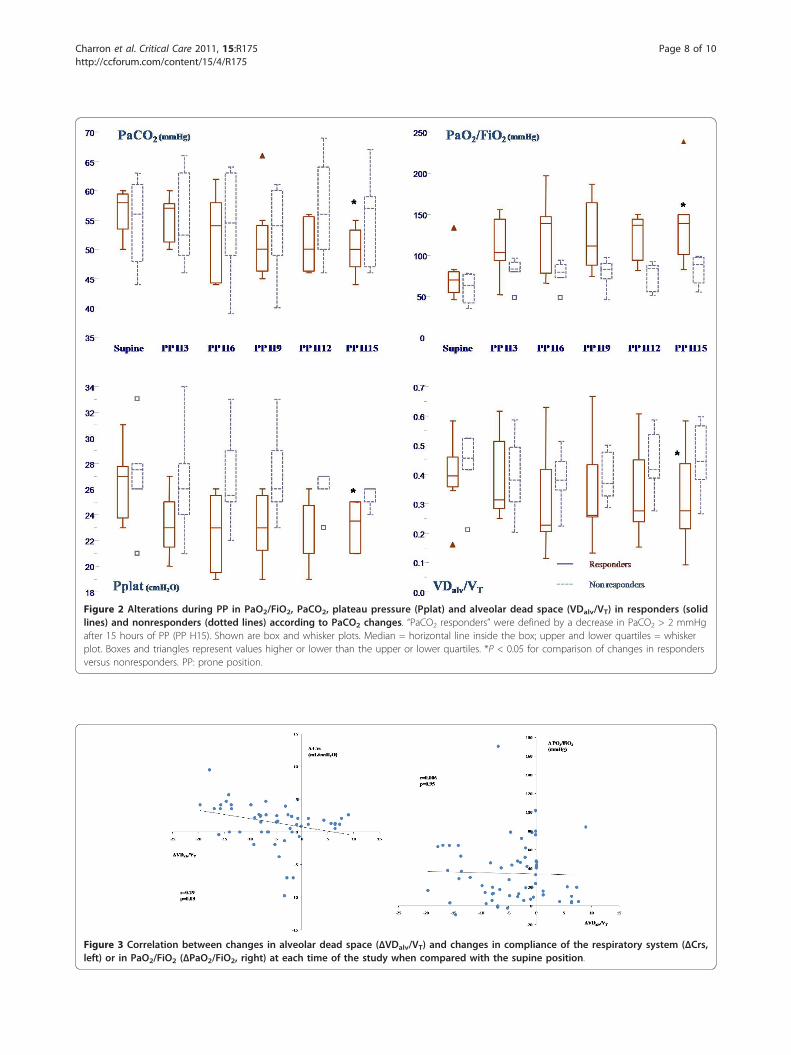
Figure 3 Correlation between changes in alveolar dead space (ΔVDalv/VT) and changes in compliance of the respiratory system (ΔCrs,left) or in PaO2/FiO2 (ΔPaO2/FiO2, right) at each time of the study when compared with the supine position.
Figure 2 Alterations during PP in PaO2/FiO2, PaCO2, plateau pressure (Pplat) and alveolar dead space (VDalv/VT) in responders (solidlines) and nonresponders (dotted lines) according to PaCO2 changes. “PaCO2 responders” were defined by a decrease in PaCO2 > 2 mmHgafter 15 hours of PP (PP H15). Shown are box and whisker plots. Median = horizontal line inside the box; upper and lower quartiles = whiskerplot. Boxes and triangles represent values higher or lower than the upper or lower quartiles. *P < 0.05 for comparison of changes in respondersversus nonresponders. PP: prone position.
Charron et al. Critical Care 2011, 15:R175http://ccforum.com/content/15/4/R175
Page 8 of 10

• Estimated VDphysiol/VT using the Harris-Benedictequation systematically underestimated measuredVDphysiol/VT.
AbbreviationsARDS: acute respiratory distress syndrome; PECO2: mixed expired PCO2; PEEP:positive end-expiratory pressure; PetCO2: end-tidal PCO2; PP: prone position;Pplat: plateau pressure; VDalv: alveolar dead space; VDphysiol: physiologicaldead space.
AcknowledgementsWe thank Maquet SA (Ardon, France) for covering the cost of publication.Maquet SA did not participate in the design or conduct of the study or inthe interpretation of the data.
Author details1Intensive Care Unit, Section Thorax-Vascular Disease-Abdomen-Metabolism,Ambroise Paré University Hospital, AP-HP, 9 Av Charles de Gaulle, F-92104Boulogne-Billancourt Cedex, France. 2Faculté de Paris Ile-de-France Ouest,Université de Versailles Saint Quentin en Yvelines, 9 boulevard d’Alembert, F-78280 Guyancourt, France.
Authors’ contributionsCC contributed to the acquisition of data, performed the data analysis,participated in the design of the study and the interpretation of the data,and wrote the manuscript. XR contributed to the acquisition of data,performed the data analysis and participated in the design of the study andthe interpretation of the data. KB, SC, VC and BP contributed to theacquisition of data. AVB performed the data analysis, participated in thedesign of the study and the interpretation of the data, and wrote themanuscript. FJ participated in the design of the study and the interpretationof the data. All authors read and approved the final manuscript.
Competing interestsThe authors declare that they have no competing interests, except that ofreceiving funds from Maquet SA (Ardon, France) to support the cost ofpublication.
Received: 27 April 2011 Revised: 28 June 2011 Accepted: 25 July 2011Published: 25 July 2011
References1. Ashbaugh DG, Bigelow DB, Petty TL, Levine BE: Acute respiratory distress
in adults. Lancet 1967, 2:319-323.2. Gattinoni L, Pesenti A: The concept of “baby lung”. Intensive Care Med
2005, 31:776-784.
Figure 4 Comparison between measured VDphysiol/VT and estimated VDphysiol/VT [14]using a Bland and Altman representation (left)and a linear correlation (right). (A) and (B) Comparison for each paired data set (n = 78) in the supine position and after 3, 6, 9, 12 and 15hours in the prone position. (C) and (D) Comparison of changes in VDphysiol/VT assessed according to the two methods between each time ofmeasurement and the previous one. VDphysiol/VT: ratio of physiological dead space to tidal volume.
Charron et al. Critical Care 2011, 15:R175http://ccforum.com/content/15/4/R175
Page 9 of 10

3. The Acute Respiratory Distress Syndrome Network: Ventilation with lowertidal volumes as compared with traditional tidal volumes for acute lunginjury and the acute respiratory distress syndrome. N Engl J Med 2000,342:1301-1308.
4. Puybasset L, Gusman P, Muller JC, Cluzel P, Coriat P, Rouby JJ: Regionaldistribution of gas and tissue in acute respiratory distress syndrome. III.Consequences for the effects of positive end-expiratory pressure. CTScan ARDS Study Group. Adult Respiratory Distress Syndrome. IntensiveCare Med 2000, 26:1215-1227.
5. Rouby JJ, Brochard L: Tidal recruitment and overinflation in acuterespiratory distress syndrome: yin and yang. Am J Respir Crit Care Med2007, 175:104-106.
6. Bryan AC: Conference on the scientific basis of respiratory therapy:pulmonary physiotherapy in the pediatric age group. Comments of adevil’s advocate. Am Rev Respir Dis 1974, 110:143-144.
7. Douglas WW, Rehder K, Beynen FM, Sessler AD, Marsh HM: Improvedoxygenation in patients with acute respiratory failure: the proneposition. Am Rev Respir Dis 1977, 115:559-566.
8. Sud S, Friedrich JO, Taccone P, Polli F, Adhikari NK, Latini R, Pesenti A,Guérin C, Mancebo J, Curley MA, Fernandez R, Chan MC, Beuret P,Voggenreiter G, Sud M, Tognoni G, Gattinoni L: Prone ventilation reducesmortality in patients with acute respiratory failure and severehypoxemia: systematic review and meta-analysis. Intensive Care Med 2010,36:585-599.
9. Chatte G, Sab JM, Dubois JM, Sirodot M, Gaussorgues P, Robert D: Proneposition in mechanically ventilated patients with severe acuterespiratory failure. Am J Respir Crit Care Med 1997, 155:473-478.
10. Gattinoni L, Vagginelli F, Carlesso E, Taccone P, Conte V, Chiumello D,Valenza F, Caironi P, Pesenti A: Decrease in PaCO2 with prone position ispredictive of improved outcome in acute respiratory distress syndrome.Crit Care Med 2003, 31:2727-2733.
11. Jolliet P, Bulpa P, Chevrolet JC: Effects of the prone position on gasexchange and hemodynamics in severe acute respiratory distresssyndrome. Crit Care Med 1998, 26:1977-1985.
12. Vieillard-Baron A, Rabiller A, Chergui K, Peyrouset O, Page B, Beauchet A,Jardin F: Prone position improves mechanics and alveolar ventilation inacute respiratory distress syndrome. Intensive Care Med 2005, 31:220-226.
13. Nuckton TJ, Alonso JA, Kallet RH, Daniel BM, Pittet JF, Eisner MD,Matthay MA: Pulmonary dead-space fraction as a risk factor for death inthe acute respiratory distress syndrome. N Engl J Med 2002,346:1281-1286.
14. Siddiki H, Kojicic M, Yilmaz M, Thompson TB, Humayr RD, Gajic O: Bedsidequantification of dead-space fraction using routine clinical data inpatients with acute lung injury: secondary analysis of two prospectivetrials. Crit Care 2010, 14:R141.
15. Page B, Vieillard-Baron A, Beauchet A, Aegerter P, Prin S, Jardin F: Lowstretch ventilation strategy in acute respiratory distress syndrome: eightyears of clinical experience in a single center. Crit Care Med 2003,31:765-769.
16. Prin S, Chergui K, Augarde R, Page B, Jardin F, Vieillard-Baron A: Ability andsafety of a heated humidifier to control hypercapnic acidosis in severeARDS. Intensive Care Med 2002, 28:1756-1760.
17. Vieillard-Baron A, Prin S, Schmitt JM, Augarde R, Page B, Beauchet A,Jardin F: Pressure-volume curves in acute respiratory distress syndrome:clinical demonstration of the influence of expiratory flow limitation onthe initial slope. Am J Respir Crit Care Med 2002, 165:1107-1112.
18. Nunn JF: Respiratory dead space and distribution of the inspired gas.Applied Respiratory Physiology London: Butterworth; 1969, 179.
19. Roza AM, Shizgal HM: The Harris Benedict equation reevaluated: restingenergy requirements and the body cell mass. Am J Clin Nutr 1984,40:168-182.
20. Rossi A, Gottfried SB, Higgs BD, Zocchi L, Grassino A, Milic-Emili J:Respiratory mechanics in mechanically ventilated patients withrespiratory failure. J Appl Physiol 1985, 58:1849-1858.
21. Koutsoukou A, Armaganidis A, Stavrakaki-Kallergi C, Vassilakopoulos T,Lymberis A, Roussos C, Milic-Emili J: Expiratory flow limitation and intrinsicpositive end-expiratory pressure at zero positive end-expiratory pressurein patients with adult respiratory distress syndrome. Am J Respir Crit CareMed 2000, 161:1590-1596.
22. Pelosi P, Tubiolo D, Mascheroni D, Vicardi P, Crotti S, Valenza F, Gattinoni L:Effects of the prone position on respiratory mechanics and gas
exchange during acute lung injury. Am J Respir Crit Care Med 1998,157:387-393.
23. Protti A, Chiumello D, Cressoni M, Carlesso E, Mietto C, Berto V, Lazzerini M,Quintel M, Gattinoni L: Relationship between gas exchange response toprone position and lung recruitability during acute respiratory failure.Intensive Care Med 2009, 35:1011-1017.
24. Albert RK, Leasa D, Sanderson M, Robertson HT, Hlastala MP: The proneposition improves arterial oxygenation and reduces shunt in oleic-acid-induced acute lung injury. Am Rev Respir Dis 1987, 135:628-633.
25. Lamm WJ, Graham MM, Albert RK: Mechanism by which the proneposition improves oxygenation in acute lung injury. Am J Respir Crit CareMed 1994, 150:184-193.
26. Blanch L, Mancebo J, Perez M, Martinez M, Mas A, Betbese AJ, Joseph D,Ballús J, Lucangelo U, Bak E: Short-term effects of prone position incritically ill patients with acute respiratory distress syndrome. IntensiveCare Med 1997, 23:1033-1039.
27. Guerin C, Badet M, Rosselli S, Heyer L, Sab JM, Langevin B, Philit F,Fournier G, Robert D: Effects of prone position on alveolar recruitmentand oxygenation in acute lung injury. Intensive Care Med 1999,25:1222-1230.
28. Krayer S, Rehder K, Vettermann J, Didier EP, Ritman EL: Position andmotion of the human diaphragm during anesthesia-paralysis.Anesthesiology 1989, 70:891-898.
29. Richter T, Bellani G, Scott Harris R, Vidal Melo MF, Winkler T, Venegas JG,Musch G: Effect of prone position on regional shunt, aeration, andperfusion in experimental acute lung injury. Am J Respir Crit Care Med2005, 172:480-487.
30. Mancebo J, Fernández R, Blanch L, Rialp G, Gordo F, Ferrer M, Rodríguez F,Garro P, Ricart P, Vallverdú I, Gich I, Castaño J, Saura P, Domínguez G,Bonet A, Albert RK: A multicenter trial of prolonged prone ventilation insevere acute respiratory distress syndrome. Am J Respir Crit Care Med2006, 173:1233-1239.
31. Charron C, Bouferrache K, Caille V, Castro S, Aegerter P, Page B, Jardin F,Vieillard-Baron A: Routine prone position in patients with severe ARDS:feasibility and impacts on prognosis. Intensive Care Med 2011, 37:796-800.
32. Murray J, Matthay M, Luce J, Flick M: An expanded definition of the adultrespiratory distress syndrome. Am Rev Respir Dis 1988, 138:720-723.
doi:10.1186/cc10324Cite this article as: Charron et al.: PaCO2 and alveolar dead space aremore relevant than PaO2/FiO2 ratio in monitoring the respiratoryresponse to prone position in ARDS patients: a physiological study.Critical Care 2011 15:R175.
Submit your next manuscript to BioMed Centraland take full advantage of:
• Convenient online submission
• Thorough peer review
• No space constraints or color figure charges
• Immediate publication on acceptance
• Inclusion in PubMed, CAS, Scopus and Google Scholar
• Research which is freely available for redistribution
Submit your manuscript at www.biomedcentral.com/submit
Charron et al. Critical Care 2011, 15:R175http://ccforum.com/content/15/4/R175
Page 10 of 10