Embed Size (px)
DESCRIPTION
Report on Opportunities and challenges in the Toronto Region Labour Market
Citation preview

RESEARCH &INNOVATION JOBSOOppppoorrttuunniittiieess aanndd cchhaalllleennggeess iinn tthhee TToorroonnttoo RReeggiioonn LLaabboouurr MMaarrkkeett
RESEARCH & INNOVATION JOBS WAS FUNDED BY IN PARTNERSHIP WITH
This Employment Ontario project is funded in part by the Government of Canada.

The Toronto Region Research Alliance (TRRA) is a public-private partnership supported by thegovernments of Ontario and Canada, and a wide range of regional stakeholders from the privatesector, universities, colleges and research hospitals.
MISSION
TRRA is a regional economic development organization promoting increased investment in research and innovation to further economic prosperity.
GOALS
VISION
To transform the Toronto Region into a top 5 global centre for research and research-intensive industry.
TORONTO REGION
TRRA defines the Toronto Region based on the location of key innovation clusters in a broadgeographic area anchored by the City of Toronto, and includes the surrounding regions of Durham,Guelph, Halton, Hamilton, Peel, York, Waterloo and Wellington.
ABOUT US
1. Increase awareness of the Toronto Regionamong global R&D decision-makers andinfluencers
2. Retain and grow foreign investment intoregional organizations, and attract innovativeforeign companies to locate here
3. Become the pre-eminent source ofintelligence on regional research assets and associated international trends
4. Promote enhanced research intensity amongregional businesses
5. Advance initiatives to strengthen research and innovation capacity
Toronto RegionFig. 1

CONTENTS
Authors 2
Executive Summary 3
Introduction 4Toronto Region’s Labour Market 5
Occupations in Study 7
Assessing the Demand for and Supply of Research and Innovation Jobs in the Toronto Region 9
Overview of the Chapter 10
Results 12
Occupations in Business & Commerce 16
Occupations in Sciences 18
Engineering Occupations 20
Information Technology Occupations 22
Architecture & Design Occupations 24
Occupations in Health 26
Conclusions 28
Region-based International Benchmarking 29Regions in Study 30
Regional Scientific Production: Patents 32
Rationale for patents 32
A system to compare regional patent outflows 32
Results per Region 34
Regional Scientific Production: Non-Patents 35
Rationale for non-patents 35
A rating system to compare non-patent outflows 35
Results per Region 37
Regional Scientific Production and Resources Available to Universities 38
Conclusions 40
General Conclusions and Recommendations 41
Appendices 42A. List of occupations studied 42
B. Programs of study linked with each occupation, for this study 44
Occupations in Business & Commerce 44
Occupations in Sciences 48
Occupations in Engineering 50
Occupations in Information Technology 57
Occupations in Architecture & Design 61
Occupations in Health 61
End Notes 65
1

RESEARCH & INNOVATION JOBS – Opportunities and challenges in the Toronto Region Labour Market2
AUTHORS
TRRA’s team
President & CEO – Patrick Draper
Project Manager & Lead Researcher – Leyden Martinez Fonte
Researchers – Po Ki Chau, Kelsey Norman, Namgoo Yoo
Youth Survey questionnaire designer – Jeannette Chan
Advisors – Chris Adams, Moran Friedman, Sam Lee, Ruth Lewkowicz, Juan Morales, Emina Veletanlic
Coordinator – Sandy Carvalho
Advisory Committee
Stephen Dibert – President & CEO, MEDEC
Diana Harper – Regional Program Advisor, Ministry of Training, Colleges and Universities
Sean Kelly – Director, Public Affairs, Pfizer Canada
Darren Lawless – Dean, Applied Research and Innovation, Sheridan Institute of Technology and Advanced Learning
Hadi Mahabadi – Vice President and Director, Xerox Research Centre of Canada
Cheryl Regehr – Vice Provost, Academic Programs, University of Toronto
Gordon Samuels – Vice President, National Accounts, TD Bank Group
David Ticoll – Executive Director, Canadian Coalition for Tomorrow’s ICT Skills
John Vespa – Director, Human Resources, University Health Network
Outsourced team
Youth Survey fielding – studentawards inc.
Employers’ Survey design, fielding & analysis – EKOS Research Inc.
Graphic design & printing – Weave Communications Inc.
Contact at the Ministry of Training, Colleges and Universities
Karima Murji, Employment and Training Consultant

3
EXECUTIVE SUMMARY
Toronto Region Research Alliance has conducted a one-year project on Research & Innovation Jobs. We havestudied over 60 occupations in business and commerce, sciences, engineering, information technology andhealth. In 2006, these occupations employed more than 400,000 persons in the Toronto Region, accounting for12 per cent of the region’s employed population.
A supply/demand analysis has been completed on these occupations. The demand was estimated in number of new jobs to be created in 2012, from the hiring intentions surveyed from local employers. The supply wasestimated from the actual number of graduates from colleges and universities in the region in 2010, providedby the Ministry of Training, Colleges and Universities.
Nowadays, both the persons trained to perform these occupations and the projects hiring them tend to behighly mobile. Therefore, an international region-based comparison was included. Nine regions were studiedin terms of their scientific production (patents and non-patents), number of post-secondary graduates andresources for universities. Both established and emerging regions were included, across four continents.
Main findings
– In the Toronto Region:
• Occupations in information technology and in engineering will be in high demand and undersupplied.
• Although with a lower demand, occupations in design are estimated to be undersupplied for this year.
• There is a high demand for technical sales skills in the region. Preparation in sales is generally absentfrom post-secondary programs in sciences, engineering, information technology and health, and iselective in most business programs. Short programs in sales are offered by local colleges and universitiesbut in 2010 they had very few graduates (41 graduates in 2010).
• Local youth interest in occupations, measured by a post-secondary students’ survey, is lowest forinformation technology and engineering, and highest in business and commerce.
– In scientific production, measured by recent U.S. patents cited at least once, the Toronto Region appears inseventh place with 153 cited patents. The top regions are Seoul (South Korea) and Bay Area (California,USA), both with 1,000 cited patents in 2010-2011.
– In scientific production, reflected by non-patent publications from the top three universities per region, theToronto Region appears in second place with 46,420 citations. The top region is Bay Area (California, USA)and the third one is Boston Region (Massachusetts, USA), with 73,319 and 45,699 citations, respectively.

RESEARCH & INNOVATION JOBS – Opportunities and challenges in the Toronto Region Labour Market4
INTRODUCTION
Leading economic regions worldwide are implementing fiscal, educational and economic initiatives tocapitalize on the opportunities being created by the new knowledge economy. The global demand forknowledge jobs will create significant competition for talent. Both cultivating and utilizing capabilities in research and innovation have proven to be of great advantage. Regions will vie for leadership in bothestablished and emerging industrial sectors including life sciences, information and communicationtechnology, agri-food, cleantech and alternative energy, and the environment.
This poses critical questions for the Toronto Region economy:
– Will the current educational system meet requirements for these jobs? – Is the region prepared to compete globally in the knowledge economy?
The Research & Innovation Jobs Project addressed these questions at a regional level to best reflect the local marketplace for hiring employers and job-seeking residents, and colleges and universities interested in attracting new students.
For the scope of this study, we used the following definitions:
Research involves studious inquiry or examination, especially investigation or experimentation aimed at thediscovery and interpretation of facts, revision of accepted theories or laws in light of new facts, or practicalapplication of such new or revised theories or laws. It also involves the systematic collecting of informationabout a particular subject.[1,2]
Innovation is the implementation of a new or significantly improved product (good or service), process ormethod. It is also important to remember that invention is not necessarily innovation. While a new inventionimplies that something is different and unique, it does not necessarily imply that the invention is ‘better.’ Atrue innovation is not only new; it’s also an improvement.[3]
Research and Innovation jobs (R&I jobs) are occupations that incorporate elements of either research or innovation (as defined above) in science and technology fields, and require university or college studies. R&I jobs fall within the broader scope of ‘knowledge economy’ jobs, which can be identified as those jobsrequiring higher levels of knowledge and/or training and a broadly based skill set.
Two main pieces of research are included in this document:
– Assessment of the supply/demand in the Toronto Region for over 60 occupations requiring university or college education.
– Comparison of the scientific production (patents and non-patent publications) of nine international regions,including the Toronto Region.
The development of the investigation has resulted in a new way of looking at our regional labour market, both internally and in an international framework. The internal analysis – the focus of the supply/demandassessment – takes into account three pillars: hiring needs from employers, the production of graduates by the post-secondary system, and career interests of local youth. The external analysis – investigated by theregional benchmarking for nine international regions – looks at the scientific production of each region andthat of its top three universities.
The Toronto Region specializes in services that canyield high productivity gains (e.g. finance, health,professional services). It ranks as the Canadian city with the largest share of headquarter functions (40 per cent of the nation’s headquarters), which aregenerally associated with high value-added activities,since headquarter functions tend to be connected tohigh-level services such as advertising, accounting and head-hunting.[4] Moreover, 21 out of the 50 fastestgrowing Canadian technology companies in 2011 werebased in the Toronto Region.[5]
(The relevance of each sector is estimated from itsLocation Quotient. For detailed information on howthese quotients are calculated and their implicationsfor the region, please refer to our recent report“Strategic sectors study – Phase I: LocationQuotients”[6]).
Figure 2 shows the relevance of business sectors in theToronto Census Metropolitan Area (excluding Hamilton,Waterloo and Guelph areas) with respect to theCanadian labour market. Sectors in the top-rightquarter of the figure represent the sectors currentlystronger in the area.
TORONTO REGION’S LABOUR MARKET
0.0 0.5 1.0 1.5 2.00.0
0.5
1.0
2.0
1.5
Employment LQ
Esta
blis
hmen
t LQ
Existing strengths, LQs > 1Potential for economic development, LQs < 1
Service subsectors
Mfg. subsectors11 Argiculture, Forestry, Fishing and Hunting
91 Public Administration
22 Utilities
62 Health Care and
Social Assistance
23 Construction
81 Other Services
(except Public Administration)
61 Educational Services
48-49 Transportation and Warehousing
31-33 Manufacturing
53 Real Estate and
Rental and Leasing51 Information and Cultural Industries
54 Professional, Scientific and Technical Services
52 Finance and Insurance
41 Wholesale Trade
56 Administrative and Support, Waste Management and Remediations Services
44-45 Retail Trade
72 Accommodation and Food Services
71 Arts, Entertainment and Recreation
21 Mining, Quarrying, and Oil and Gas Extraction
Toronto Census Metropolitan Area sectors’ relevance with respect to the Canadian labour market. Bubble sizeis based on total employment numbers per sector
Fig. 2
5
Source: Statistics Canada – Number of establishments 2010[7], Employment data 2011[8]

RESEARCH & INNOVATION JOBS – Opportunities and challenges in the Toronto Region Labour Market6
From these sectors, those considered within scope forthis study appear in Figure 3. Only establishments with20 or more employees have been represented as thiswas the requirement sample minimum for this study. It is important to note that, despite the crisis it hasexperienced in the last years, the manufacturing sector is the largest sector in the Toronto Region.
For those curious about sector 54 (Professional,Scientific and Technical Services) Figure 4 offers a glimpse into its composition in the Toronto Region.
Multiple fields of knowledge are included in this sector:accounting, law, advertising, computer systems designand others. As the figure shows, for the Toronto Regionthe largest subsectors are 5416 (Management, Scientificand Technical Consulting Services) and 5415 (ComputerSystems Design and Related Services). If only companieswith 20 or more employees are considered, subsector5415 is the largest (with 525 establishments), followed by5413 (Architectural, Engineering and Related Services)and 5416 (with 415 and 269 establishments, respectively).
31, 32, 33. Manufacturing
52. Finance & Insurance
54. Professional, Scientific and Technical Services
56. Administrative & Support, Waste Management and Remediation Services
62. Health Care and Social Assistance
81. Other services (except Public Administration)
55. Management of Companies and Enterprises
51. Information and Cultural Industries
71. Arts, Entertainment and Recreation
61. Educational Services
91. Public Administration
22. Utilities
0 1000 2000 3000 4000 5000
Number of establishments in the Toronto Region (with 20 or more employees) for the sectors within scope for this study
Fig. 3
Source: Statistics Canada 2010 [7]

7
5416 - Management, S
cientific and
Technical Consultin
g Services
5415 - Computer Systems Design
and Related Services
5413 - Archite
ctural, Engineering
and Related Services
5412 - Accountin
g, Tax Preparation,
Bookkeeping and Payroll Services
5411 - Legal S
ervices
5414 - Specialized Design Services
5419 - Other Professional, S
cientific
and Technical Services
5418 - Advertis
ing, Public Relatio
ns
and Related Services
5417 - Scientifi
c Research and
Development Services
0
5,000
10,000
15,000
20,000
25,000
30,000
Number of establishments in each subsector within sector 54. Professional, Scientific and Technical ServicesFig. 4
Over 60 occupations were included in this study (see Appendix A for the complete list of occupationsstudied). According to the 2006 Census, theseoccupations represented 12 per cent of the employedpopulation in the Toronto Region, and 10 per cent ofCanada’s employed population. In the Toronto Region, they represented over 400,000 jobs.
Three categories of occupations are distinguished:
– Influencers are those professionals defining theresearch and innovation strategy of the organization.Top managers are an example of influencers.
– Direct occupations are those involved in theconception or creation of new knowledge, products,processes, methods, and systems. An example ofthese occupations would be a software engineercreating a new mobile application.
– Support occupations are usually not directlyinvolved in the development of an innovation, but thescope of their job is vital to support the process. Anexample of supporting occupations would be aclinical laboratory technician analyzing bloodsamples from patients participating in a clinical trial for a new medicine.
The occupations in this study were grouped into fivegroups by fields of knowledge: Business & Commerce,Sciences, Engineering, Information Technology,Architecture & Design, and Health. Figure 5 shows the percentage of persons employed in the TorontoRegion for each of these occupational groups. Theabsolute number of employees per occupational groupcan be seen in Table 1.
OCCUPATIONS IN STUDY
Architecture & Design 6%
Health 19%
Information Technology 27%
Business & Commerce 28%
Sciences 6%
Engineering 14%
Percentage of persons employed in eachoccupational group, for occupations in study in the Toronto Region
Fig. 5
Source: Statistics Canada 2006 [9]
Source: Statistics Canada 2010 [7]

RESEARCH & INNOVATION JOBS – Opportunities and challenges in the Toronto Region Labour Market8
Business & Commerce
Sciences Engineering Information Technology
Architecture & Design
Health0%
10%
20%
30%
40%
50%
60%
70%
80%
90%
100%
Female
Male
Gender balance in the Toronto Region for the occupations in studyFig. 6
Source: Statistics Canada 2006 [9]
Table 1: Number of persons employed in the occupations in this study, in the Toronto Region
Occupational group Number of persons employed in the Toronto Region
Business & Commerce 112,070
Sciences 22,450
Engineering 57,315
Information Technology 109,015
Health 78,210
Architecture & Design 23,540
Source: Statistics Canada 2006 [9]

9
This chapter analyses the match between thenumber of graduates and the hiring needs for 2012 in a set of occupations within Business & Commerce,Sciences, Engineering, Information Technology,Architecture & Design, and Health.
Several goals are pursued by doing this:
– Inform the Toronto Region businesses on theregional hiring trends and the levels of supplyavailable to satisfy that demand.
– Inform the Toronto Region youth in high schooland post-secondary education on occupationswhere more graduates are needed, or which skillscould increase their hiring potential.
– Inform the Toronto Region universities andcolleges about local hiring needs, youth interests,and which areas need more (or less) graduates.
It is important to note that this study does not refer toindividual post-secondary institutions or programs ofstudy. Every parameter studied here is approachedfrom a regional perspective.
Highlights
• Which occupations are in high demand in our region?
• Which occupations might be facing an under-supply in the number of available local graduates?
• In which areas of knowledge is our region rich in new graduates? Can the overflow of newgraduates in certain occupations open upopportunities to create startups and attract foreign investments?
ASSESSING THE DEMAND FORAND SUPPLY OF RESEARCHAND INNOVATION JOBS IN THE TORONTO REGION

RESEARCH & INNOVATION JOBS – Opportunities and challenges in the Toronto Region Labour Market10
Occupations
This study focuses on over 60 occupations in five areas of knowledge: Business &Commerce, Engineering, Sciences, InformationTechnology, Architecture & Design, and Health.All these occupations require university orcollege education.
Occupations in this study are identified by theirNational Occupation Classification (NOC) 2006code.[10]
Statistics provided for each occupation
For each occupation in study, we provide thefollowing information:
- Number of persons employed in the TorontoRegion
- Estimated number of new jobs in the TorontoRegion in 2012
- Estimated number of graduates- Average monetary compensation in the
Toronto Region- Supply/demand analysis with respect to the
number of new graduates from the region- Youth interest in working in the occupation
Let’s look at some of the previously mentionedstatistics in more detail.
Number of persons employed in the TorontoRegion, per occupation of interest
This information was reported by the latestCanadian Census available, corresponding to a 20 per cent sample of the Canadianpopulation in 2006.[9]
The number of persons employed in theoccupations of interest for this study wascalculated by aggregating the values for thefollowing Census Metropolitan Areas: TorontoCMA, Hamilton CMA and Kitchener CMA.
Estimated number of new jobs in the TorontoRegion in 2012
From the hiring intentions per occupationrecorded by our employers’ survey in September2011, we estimated the number of new jobs to becreated in 2012 in local organizations with 20 ormore employees.
The employers’ survey collected responses from374 employers in the Toronto Region.
Estimated number of graduates per occupation
We developed a methodology to link programs ofstudy with the occupations in scope, allowing usto estimate the number of graduates trained foreach occupation. (See Appendix B for a detaileddescription of the programs of study associatedwith each occupation in study). The programsselected are those whose training was closer to the skills required by the occupation.
Once programs of study were linked to occupations,graduates were assigned to occupations by using aweight index. The weight index chosen was thenumber of persons actually employed in theToronto Region in 2006 (date of the last publishedCensus). The rationale behind this was thatoccupations that employ more persons are more likely to open new jobs.
From the over 145,000 graduates from localuniversities and community colleges, over 44,000were linked to the occupations in this study.
OVERVIEW OF THE CHAPTER
Special thanks
The numbers of graduates published byuniversities and colleges in the Toronto Regionare usually aggregated in groups of programsof study. For instance: one university publishesits yearly number of graduates in engineering.That number includes the graduates fromevery engineering program offered at theuniversity.
For this study, the Ministry of Training,Colleges and Universities kindly provided uswith graduation numbers aggregated for allthe universities[11] and for all the colleges[12]
in the Toronto Region but separated for eachdetailed program of study. For instance, howmany mechanical engineers graduated in theregion in 2010.
Having these numbers made it possible toestimate the number of graduates trained perindividual occupation, which we could not haveobtained from the data usually provided byindividual post-secondary centres in the region.

11
Average monetary compensation in the Toronto Region
The Economic Research Institute publishessalary data for a variety of occupations in severalcities including Toronto.[13] Average salaries areavailable for basic wages only, that is excludingbonuses, benefits and other ways of compensatingemployees. As the values are not classified byNOC occupations, we selected a set of jobs whichcould be classified under our occupations, andwe provided their average basic values for theToronto Region in 2011.
Supply/Demand analysis with respect to thenumber of new graduates from the region
The Supply/Demand analysis is provided as aratio between the number of graduates and thenumber of new jobs, per occupation, as follows:
Supply < Demand: Ratio is lower than 0.75 (the number of graduates can only cover lessthan 75 per cent of the new jobs)
Adequate Supply: Ratio between 0.75 and 1.25(the number of graduates is about the same asthe number of new jobs)
Supply > Demand: Ratio higher than 1.25 (the number of graduates is 1.25 times or higher than the number of new jobs)
Youth interest in the occupations
The Supply/Demand analysis will becomplemented with a look at local youth interestin the occupations in study and in broader fieldsof knowledge. Youth interest was measured bythe results of asking 260 university/collegestudents which of the occupations they wereinterested in pursuing. On a more general note,213 high school students were asked about theirinterest and intentions to pursue studies inbroader fields of knowledge.
How to read the Supply/Demand graphs
Each circle corresponds to one item.Depending on the graph, an item correspondsto one occupational group or to one occupation.
The vertical axis provides an indication of howin demand each occupation is, as it shows thenumber of new jobs estimated to be created in the Toronto Region in 2012. The higher anoccupation is located the more in demand it is in the region.
The horizontal axis indicates the ratio betweengraduates and new jobs. The area on the left side(in purple) shows undersupplied occupations.That is, where the number of graduates is lowerthan the number of new jobs to be created in2012. The right side area (in yellow) indicatesoccupations where the number of graduates ishigher than the number of new jobs. The centralarea (vertical, in green) indicates occupationswhere the number of graduates is about thesame as the number of new jobs.
The area of the circles is directly proportionalto the number of graduates being associatedwith the occupation. The bigger the circle, the more graduates are associated with it.
How to read the post-secondary studentinterest graphs
Students enrolled in post-secondaryeducation were asked to “indicate the specificoccupations you are interested in pursuing.”The percentages shown correspond to thepercentage of post-secondary students whoselected each occupation among his/herpreferences. There was no limit set for thenumber of occupations a student could select.
Post-secondary institutions included
The programs of study and number ofgraduates in this study correspond to the following post-secondary institutions:Centennial College, Conestoga College,Durham College, George Brown College,Humber College, McMaster University,Michener College, Mohawk College, OCADUniversity, Queen’s University, RyersonUniversity, Seneca College, Sheridan College,The University of Western Ontario, Universityof Guelph, University of Ontario Institute ofTechnology, University of Toronto, University of Waterloo, Wilfrid Laurier University, andYork University.
RESEARCH & INNOVATION JOBS – Opportunities and challenges in the Toronto Region Labour Market12
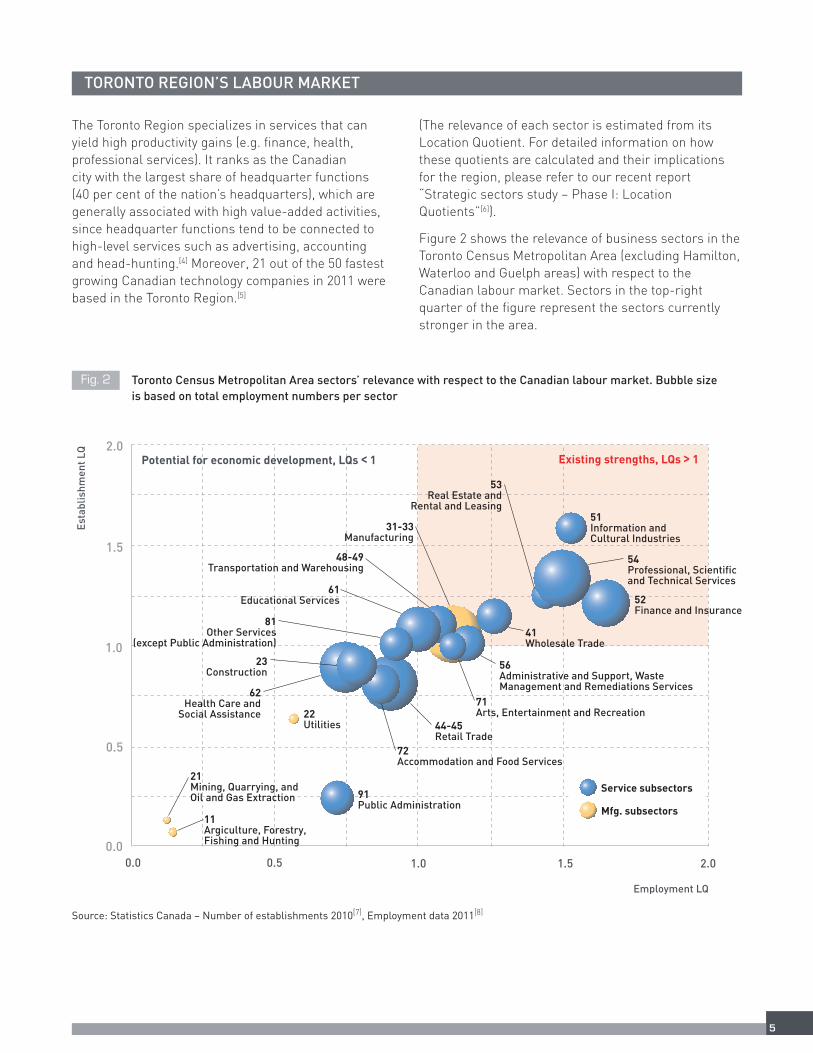
RESULTS
Table 2: Summary of statistics for occupational groups in study
Toronto Region
Estimated Estimated Percentage of post-Number of number of number of secondary students
Occupational group employees (2006) new jobs (2012) graduates (2010) interested (2011)
Business & Commerce 112,070 6,531 15,869 51%
Sciences 18,805 3,959 8,326 43%
Engineering 58,085 8,773 6,108 26%
Information Technology (IT) 109,015 9,499 3,740 26%
Architecture & Design 23,540 1,038 573 32%
Health 77,765 3,074 10,881 43%
0.01 0.10 1.00 10.000
2,000
4,000
6,000
10,000
8,000
Health
Architecture & Design
Sciences
Business & Commerce
Engineering
IT
Supply/Demand
Dem
and
Supply < Demand
Supply = Demand
Supply > Demand
Number of graduates 2010 (distributed by rate of employees per occupation in 2006)
Estimated number of new jobs for 2012
Esti
mat
ed n
umbe
r of
new
jobs
for
2012
(e
stim
ated
from
em
ploy
ers’
sur
vey)
Supply/Demand for occupational groups in studyFig. 7

13
Figure 7 shows the estimated supply/demand situationfor the occupational groups in study. At a glance, we cansee that IT and Engineering are the most demandedoccupations in the Toronto Region. Both seem to beundersupplied, particularly IT, where the number ofgraduates is only 40 per cent of the positions needed to be filled this year. Health and Sciences seem to be in less demand and counting on a generous supply ofgraduates. Finally, Architecture & Design seems to beundersupplied, despite being the least demanded group.
Post-secondary student interest per occupational group
Figure 8 shows the percentage of students interested in each occupational group. The most popular group is Business & Commerce, followed by Sciences andHealth. In Figure 7, we can see these are also thegroups with more graduates. IT and Engineering were less popular among surveyed students.
0%
10%
20%
30%
40%
50%
60%
Business & Commerce
Sciences EngineeringArchitecture & Design
Information Technology
Health
51%
43%
26%
32%
26%
43%
Post-secondary student interest per occupational groupFig. 8
Source: TRRA 2011 Youth Survey

RESEARCH & INNOVATION JOBS – Opportunities and challenges in the Toronto Region Labour Market14
When analysing individual responses we saw that 57 per cent of the students selected occupations inthree or more occupational groups. Given that thesestudents are already enrolled in a specific program ofstudy, this could be an indication that students have abroad vision of their professional future.
Some gender differences appear in the youth interestfor occupational groups. Those who selectedoccupations in sciences, engineering and IT are mostlymales. Those who selected health occupations aremostly females.
Table 3 adds information to this analysis. Fiveoccupational groups are represented in the top 11selected occupations; only Engineering is excluded.Business is still the group with more occupationsmentioned, but the second most popular groups areArchitecture & Design, IT and Health – with twooccupations each. This contrasts somehow with theapparently lower interest in IT.
High school student interest per occupational group
In high school, students looking to continue to post-secondary education are trying to define which areas ofknowledge to pursue. Considering that, we decided notto ask them which specific occupations they wanted towork in, but which areas of knowledge they wanted topursue. Therefore, high school student interest willonly be included for the analysis of occupationalgroups.
The preferred fields of knowledge for high schoolstudents were Sciences, Health and Business (48 per cent, 39 per cent and 32 per cent, respectively).The least preferred fields were Engineering (24 per cent)and IT (13 per cent).
The following gender differences were found:
- Those interested in and intending to apply forprograms in Engineering, Sciences & Mathematicsand IT were mostly male.
- Those who intend to apply for Nursing, Public Healthand Social Work were mainly female.

15
Table 3: Top 11 occupations by post-secondary student interest
Percentage of surveyed post-
secondary students Occupations interested
Sales, marketing and advertising managers
Senior managers – financial, communications and other business services
Senior government managers and officials
Senior managers – health, education, social and community services andmembership organizations
Graphic designers and illustrating artists
Biologists and related scientists (e.g. food scientist)
Architects
Web designers and developers
Dieticians and nutritionists
Computer programmers and interactive media developers
Pharmacists
28%
24%
21%
21%
21%
19%
17%
16%
15%
13%
13%

RESEARCH & INNOVATION JOBS – Opportunities and challenges in the Toronto Region Labour Market16
Occupations in Business & Commerce
Table 4: Statistics for Occupations in Business & Commerce
Toronto Region
Estimated Estimated Percentage of post-NOC Number of number of number of secondary studentscode NOC title employees (2006) new jobs (2012) graduates (2010) interested (2011)
Business & Commerce 112,070 6,531 15,869 51%
6221 Technical sales specialists 14,575 1,387 1,947 8%
0911 Manufacturing managers 20,915 450 2,551 6%
0611 Sales, marketing and advertising managers 52,320 2,007 7,570 28%
0012 Senior government managers and officials 2,090 194 312 21%
0013 Senior managers – financial, communications and other business services 18,085 1,918 2,848 24%
0014 Senior managers – health, education, social and community services and membership organizations 4,085 571 641 21%
Supply/Demand
Dem
and
0.01 0.10 1.00 10.000
500
1000
2,000
1,500
0013 Sr. managers finance, comm
0611 Sales, Marketing, advertising managers
6221 Technical Sales
0014 Sr. managers health, ed., social & community
0012 Sr. gov. managers & officials0911 Manufacturing managers
Number of graduates 2010 (distributed by rate of employees per occupation in 2006)
Estimated number of new jobs for 2012
Supply < Demand
Supply = Demand
Supply > Demand
Esti
mat
ed n
umbe
r of
new
jobs
for
2012
(e
stim
ated
from
em
ploy
ers’
sur
vey)
Supply/Demand for selected occupations in Business & CommerceFig. 9

17
Table 5: Average basic compensation for some jobs in Business & Commerce in the Toronto Region [13,14]
Source: ERI 2011 “The Salary Assessor® & Survey Software and Databases”
Several occupations in this group are among the mostdemanded in the Toronto Region, and in general theycan count on a good supply of graduates. However, thenumber of graduates matched to ‘Technical salesspecialists’ should be looked at with caution for thefollowing reasons:
– Ideal candidates for technical sales have training insome technical field and in sales techniques. Thissituation is particularly important in B2B sales. Inconversation with some executives in the region [15,16,17],persons with this background seem to be difficult to find. Although our study could not find out howmany business graduates have a previous degree inengineering, sciences or health, there exist businessprograms combining business and technology.Therefore, we matched this occupation with graduatesfrom Business & Commerce programs.
– Business & Commerce programs include courseson sales. In general, however, these are electives.This means the number of graduates with saleseducation could not be directly estimated.
Another element of interest for ‘Technical salesspecialists’ is that existing short programs specializedin sales have a very low number of graduates (41graduates in 2010). Bigger companies have their owntraining programs for sales staff, but startups mighthighly benefit from being able to hire technicalprofessionals already trained in sales. Technical salescould be a good career opportunity for studentsgraduating from engineering, IT, etc.
No gender differences were observed in the number ofgraduates or in the youth interest (Figure 10), except for“Manufacturing managers” where most of the studentsor graduates were male. In addition, in the labour force,several business occupations employ significantlyfewer females than males. ‘Sales managers’, ‘Technicalsales specialists’, ‘Senior managers – financial’, and‘Manufacturing managers’ employ 38 per cent, 29 per cent, 24 per cent and 18 per cent of females,respectively.
0611 Sales, marketin
g and
advertising m
anagers
6221 Technical sales specialists
0012 Senior government
managers and offic
ials
0911 Manufacturing m
anagers
0013 Senior managers - f
inancial,
communications and
other business servi
ces
0014 Senior managers - h
ealth, educatio
n,
social and community
services
and membership organizatio
ns
0%
10%
20%
30% 28%
8%
21%
6%
24%21%
Post-secondary student interest in selected Business occupationsFig. 10
Source: TRRA 2011 Youth Survey
Job title Toronto Region - Average basic compensation
Marketing manager $ 102,015
Sales manager - Brand or product $ 101,203
Manufacturing manager $ 99,954
Education manager $ 86,907
Director of social services $ 81,166
Sales representative – Aircraft $ 61,251

RESEARCH & INNOVATION JOBS – Opportunities and challenges in the Toronto Region Labour Market18
Table 6: Statistics for Occupations in Sciences
Toronto Region
Estimated Estimated Percentage of post-NOC Number of number of number of secondary studentscode NOC title employees (2006) new jobs (2012) graduates (2010) interested (2011)
Sciences 18,805 3,959 8,326 43%
2161 Mathematicians, statisticians and actuaries 2,310 711 1,506 8%
2111 Physicists and astronomers 350 224 230 11%
2112 Chemists 5,660 802 2,233 7%
2211 Chemical technologists and technicians 5,425 330 290 3%
2113 Geologists, geochemists and geophysicists 870 170 565 9%
2114 Meteorologists 185 23 12 7%
2213 Meteorological technicians 50 9 2 1%
2115 Other professional occupations in physical sciences 305 395 457 7%
2121 Biologists and related scientists 2,450 761 2,833 19%
2221 Biological technologists and technicians 950 416 154 6%
2122 Forestry professionals 160 12 34 4%
2223 Forestry technologists and technicians 90 12 10 3%
Occupations in Sciences
Supply/Demand
Dem
and
0.01 0.10 1.00 10.000
500
1000
2,000
1,500
2112 Chemists
2213 Meteorological technicians
2223 Forestry technicians
2221 Biological technicians
2211Chemistry technicians
2113Geologists, geochemists and geophysicists
2114 Meteorologists
2115 Other professional occupations
in physical sciences
2122 Forestry professionals
2161 Mathematicians
2121 Biologists
2111Physicists and astronomers
Number of graduates 2010 (distributed by rate of employees per occupation in 2006)
Estimated number of new jobs for 2012
Supply < Demand
Supply = Demand
Supply > Demand
Esti
mat
ed n
umbe
r of
new
jobs
for
2012
(e
stim
ated
from
em
ploy
ers’
sur
vey)
Supply/Demand for selected occupations in Sciences Fig. 11

19
Local demand for occupations in sciences seems to count on a good supply of graduates, except for“Biological technicians” (Figure 11). Also among youth,biological occupations are the most popular in thisgroup (Figure 12).
Perhaps the oversupply of graduates in sciences likebiology and chemistry in our region could be thestarting point for business opportunities. Both startupsand established global firms could benefit from thisabundant pool of professionals in biology, chemistryand other sciences.
Interestingly, the majority of employers hiring in Science (75 per cent) occupations strongly believe thattheir organization needs to look beyond the GTA to hirequalified people. Further study is needed on this issue to determine its specific causes.
Finally, this group is generally well balanced in termsof gender. The labour force in the region, the graduatesand the youth interest all have a good presence of bothmales and females.
Table 7: Average basic compensation for jobs in Sciences in the Toronto Region [13,14]
Job title Toronto Region - Average basic compensation
Astronomer $ 123,904
Mathematician statistician $ 92,035
Meteorologist $ 90,522
Mathematician $ 85,465
Geologist $ 80,122
Materials scientist $ 79,316
Chemist $ 74,127
Cartographer $ 70,695
Forest ecologist $ 68,525
Biologist $ 66,221
Forester $ 63,534
Technologist science $ 63,192
Research associate $ 58,948
Chemical technician $ 56,247
Chemical laboratory technician $ 56,247
Source: ERI 2011 “The Salary Assessor® & Survey Software and Databases”
2121 Biologists and related
scientists (e
.g. food scientis
t)
2221 Biological technologists
and technicians
2161 Mathematicians, statis
ticians
and actuaries
2122 Forestry professionals
2112 Chemists
2113 Geologists, geochemists
and geophysicists
2115 Other professional o
ccupations in physical
sciences (e.g. m
aterials scientis
ts)
2114 Meteorologists
2111 Physicists and astronomers
2211 Chemical technologists
and technicians
2223 Forestry te
chnologists
and technicians
0%
10%
20%
30%
19%
6%8%4%
7%9% 7% 7%11%
3% 3%
Top 11 Sciences occupations of interest for surveyed post-secondary studentsFig. 12
Source: TRRA 2011 Youth Survey

RESEARCH & INNOVATION JOBS – Opportunities and challenges in the Toronto Region Labour Market20
Table 8: Statistics for Occupations in Engineering
Toronto Region
Estimated Estimated Percentage of post-NOC Number of number of number of secondary studentscode NOC title employees (2006) new jobs (2012) graduates (2010) interested (2011)
Engineering 58,085 8,773 6,108 26%
2131 Civil engineers 9,030 697 742 5%
2231 Civil engineering technologists and technicians 1,570 512 616 3%
2132 Mechanical engineers 10,600 981 457 7%
2232 Mechanical engineering technologists and technicians 2,675 787 965 0%
2133 Electrical and electronics engineers 8,735 1,488 327 6%
2241 Electrical and electronics engineering technologists and technicians 6,560 1,099 853 5%
2134 Chemical engineers 2,255 459 636 3%
2141 Industrial and manufacturing engineers 5,405 457 145 4%
2233 Industrial engineering and manufacturing technologists and technicians 4,920 355 284 4%
2243 Industrial instrument technicians and mechanics 1,545 229 89 0%
2142 Metallurgical and materials engineers 485 331 242 0%
2143 Mining engineers 260 147 11 1%
2144 Geological engineers 245 237 149 3%
2255 Mapping and related technologists and technicians 770 279 41 1%
2145 Petroleum engineers 205 70 34 1%
2146 Aerospace engineers 1,355 150 140 9%
2244 Aircraft instrument, electrical and avionics mechanics, technicians and inspectors 995 150 223 4%
2148 Other professional engineers, n.e.c. 380 279 142 3%
2274 Engineer officers, water transport 95 67 12 2%
Engineering Occupations
0
500
1000
2,000
1,500
Supply/Demand
Dem
and
0.01 0.10 1.00 10.00
2133 Electrical and electronics engineers
2132 Mechanical engineers
2231 Civil engineering
technologists and technicians
2241 Electrical and electronics engineering technologists and technicians
2232 Mechanical engineering technologists and technicians
2134 Chemical engineers
2255 Mapping and related
technologists and technicians
2243 Industrial instrument
technicians
2244 Aircraft instrument technicians
2146 Aerospace engineers
2145 Petroleum engineers
2142 Metallurgical and materials engineers
2233 Industrial engineering and manufacturing
technologists and technicians
2131 Civil engineers
2141 Industrial and manufacturing engineers
2148 Other professional
engineers, n.e.c.
2143 Mining engineers
2274 Engineer officers,
water transport
2144 Geological engineers
Number of graduates 2010 (distributed by rate of employees per occupation in 2006)
Estimated number of new jobs for 2012
Supply < Demand
Supply = Demand
Supply > Demand
Esti
mat
ed n
umbe
r of
new
jobs
for
2012
(e
stim
ated
from
em
ploy
ers’
sur
vey)
Supply/Demand for selected occupations in Engineering Fig. 13

21
Table 9: Average basic compensation for jobs in Engineering in the Toronto Region [13,14]
Toronto Region - Average basic
Job title compensation
Petroleum engineer $ 123,964
Aeronautical engineer $ 99,684
Aerodynamics engineer $ 95,867
Materials engineer $ 95,697
Mining engineer $ 91,639
Electrical engineer $ 91,145
Chemical engineer $ 88,701
Manufacturing engineer $ 87,813
Marine engineer $ 87,791
Agricultural engineer $ 86,111
Industrial engineer $ 84,945
Mechanical engineer $ 83,779
Civil engineer $ 79,409
Chemical engineering technician $ 71,573
Industrial safety technician $ 69,127
Industrial engineering technician $ 67,659
Electrical engineering technician $ 63,295
Biomedical engineering technician $ 60,170
Avionics technician $ 57,796
Civil engineering technologist and technician $ 57,525
Mechanical engineering technologist $ 56,290
Source: ERI 2011 “The Salary Assessor® & Survey Software and Databases”
2146
Aerosp
ace engineers
2141
Industr
ial and m
anufacturin
g engineers
2131
Civi
l engineers
2132
Mech
anical e
ngineers
2241
Electrica
l and electr
onics engineerin
g
technologist
s and te
chnici
ans
2233
Industr
ial engineerin
g and manufactu
ring
technologist
s and te
chnici
ans
2244
Aircra
ft instr
ument, e
lectrica
l and avio
nics
mech
anics, te
chnici
ans and in
specto
rs
2133
Electrica
l and electr
onics engineers
2144
Geologica
l engineers
2231
Civi
l engineerin
g tech
nologists
and tech
nicians
2134
Chem
ical e
ngineers
2148
Oth
er pro
fessional e
ngineers
(e.g. biom
edical e
ngineer)
0%
10%
20%
30%
9%4%5%7% 5% 4% 4%6%
3% 3% 3% 3%
Top 12 Engineering occupations of interest for surveyed post-secondary studentsFig. 14
Most of the persons employed in this groupwork for the manufacturing sector, whichdespite its downturn in the last years is still one of the biggest sectors in the TorontoRegion. Occupations in engineering tend to beundersupplied or just supplied (see Figure 13)and, in general, youth interest is low (seeFigure 14).
The majority of employers hiring for Engineeringpositions (71 per cent) strongly believe that theirorganization needs to look beyond the GTA tohire qualified people. Further study is needed on this issue to determine its specific causes.
With respect to all the occupations in this study,this group is the one employing the lowestpercentage of females in the Toronto Region (13 per cent). The presence of women among thegraduates is also scarce (consisting of programswith five to 30 per cent of female graduates),with the exception of “Chemical engineers” and “Metallurgical and materials engineers”,where both genders are balanced in numbers.
Source: TRRA 2011 Youth Survey
RESEARCH & INNOVATION JOBS – Opportunities and challenges in the Toronto Region Labour Market22
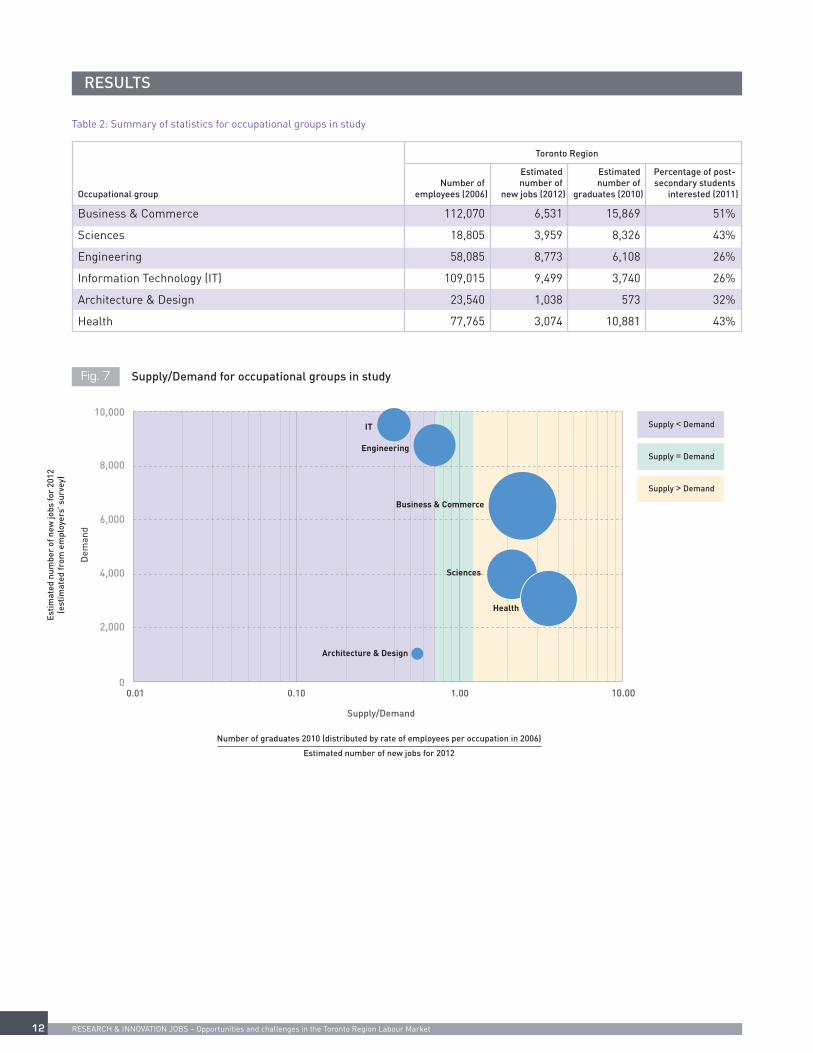
Table 10: Statistics for Occupations in IT
Toronto Region
Estimated Estimated Percentage of post-NOC Number of number of number of secondary studentscode NOC title employees (2006) new jobs (2012) graduates (2010) interested (2011)
IT 109,015 9,499 3,740 26%
2147 Computer engineers (except software engineers and designers) 8,145 397 261 7%
2171 Information systems analysts and consultants 48,680 1,866 857 9%
2172 Database analysts and data administrators 4,545 1,867 185 7%
2173 Software engineers and designers 9,950 1,902 439 9%
2174 Computer programmers and interactive media developers 31,635 1,884 1,883 13%
2175 Web designers and developers 6,060 1,583 115 16%
Information Technology Occupations
Supply/Demand
Dem
and
0.01 0.10 1.00 10.000
500
1000
2,000
1,500
2147 Computer engineers
2172 Database analysts and data administrators
2173 Software engineers and designers
2174 Computer programmers and interactive media developers
2171 Information systems analysts and consultants
2175 Web designers and developers
Number of graduates 2010 (distributed by rate of employees per occupation in 2006)
Estimated number of new jobs for 2012
Supply < Demand
Supply = Demand
Supply > Demand
Esti
mat
ed n
umbe
r of
new
jobs
for
2012
(e
stim
ated
from
em
ploy
ers’
sur
vey)
Supply/Demand for selected occupations in Information Technology Fig. 15

23
Table 11: Average basic compensation for jobs in IT in the Toronto Region [13,14]
Source: ERI 2011 “The Salary Assessor® & Survey Software and Databases”
2171 Inform
ation systems
analysts and co
nsultants
2175 Web designers and deve
lopers
2174 Computer programmers and
interactive m
edia developers
2173 Software engineers and designers
2147 Computer engineers (e
xcept
software engineers and designers)
2172 Database analysts and
data administrators
0%
5%
10%
15%
20%
9%
16%13%
9%7% 7%
Post-secondary student interest on selected IT occupationsFig. 16
In the Toronto Region, together with businessoccupations, information technology positions are the most in demand. But while there seems to be agood supply of graduates in business, IT occupationsare significantly undersupplied. For example, “Web designers” and “Database analysts” haveapproximately 10 times less than the number of graduates they need. (See Figure 15.)
The IT sector employs few females. In 2006, only onequarter of the labour force in IT for the Toronto Regionwas female. The recent 17 per cent of female ITgraduates indicates that this situation might notimprove in the near future.
Also in the youth survey (Figure 16), interest in IT was mostly from males, with the curious exception of ‘Web designers and developers’ where interest wasevenly divided between the genders. This may hint toopportunities to attract more young women to theprofession by better ‘advertising’ IT occupations to them.
Source: TRRA 2011 Youth Survey
Job title Toronto Region - Average basic compensation
Information systems manager $ 108,398
Software engineer $ 95,465
Software developer $ 93,846
Eng. computer hardware $ 93,359
Database analyst $ 92,334
Eng. telecommunications $ 89,466
Web designer and developer $ 86,479
Software programmer $ 76,407
Information systems representative $ 58,191

RESEARCH & INNOVATION JOBS – Opportunities and challenges in the Toronto Region Labour Market24
Table 12: Statistics for Occupations in Architecture & Design
Toronto Region
Estimated Estimated Percentage of post-NOC Number of number of number of secondary studentscode NOC title employees (2006) new jobs (2012) graduates (2010) interested (2011)
Architecture & Design 23,540 1,038 573 32%
2151 Architects 3,985 308 506 17%
5241 Graphic designers and illustrating artists 16,385 431 63 21%
5245 Patternmakers – textile, leather and fur products 180 0 0 5%
2252 Industrial designers 2,990 298 4 7%
Architecture & Design Occupations
Supply/Demand
Dem
and
0.01 0.10 1.00 10.000
500
1000
2,000
1,500
2151 Architects
5241 Graphic designers and illustrating artists2252
Industrial designers
Number of graduates 2010 (distributed by rate of employees per occupation in 2006)
Estimated number of new jobs for 2012
Supply < Demand
Supply = Demand
Supply > Demand
Esti
mat
ed n
umbe
r of
new
jobs
for
2012
(e
stim
ated
from
em
ploy
ers’
sur
vey)
Supply/Demand for selected occupations in Architecture & DesignFig. 17

25
Table 13: Average basic compensation for jobs in IT in the Toronto Region [13,14]
Job title Toronto Region - Average basic compensation
Architect $ 80,020
Industrial designer $ 65,392
Graphic designer $ 61,700
Graphic design supervisor $ 59,889
Patternmaker $ 58,241
5241 Graphic designers and
illustra
ting artists
2151 Architect
2252 Industrial designers
5245 Patternmakers – textile, le
ather
and fur products
21%
17%
7%5%
0%
5%
10%
15%
20%
25%
30%
Post-secondary student interest in selected Architecture & Design occupationsFig. 18
Two occupations of this group are quite undersupplied:“Graphic designers” and “Industrial designers” (seeFigure 17). The relatively higher demand for graphicdesigners could be explained by the presence of astrong sector in information technology and softwaredevelopment, as well as professional services in general.
Youth interest was relatively high for “Graphicdesigner” and “Architect”, but not so much for“Industrial designer” (see Figure 18).
In terms of gender, 37 per cent of persons employed inthis group in the Toronto Region are female. The levelof female graduates is lower: 33 per cent. In youth,however, both genders are interested in theseoccupations.
Source: ERI 2011 “The Salary Assessor® & Survey Software and Databases”
Source: TRRA 2011 Youth Survey

0
500
1000
2,000
1,500
Supply/Demand
Dem
and
0.01 0.10 1.00 10.00
3211 Medical laboratory
technologists and pathologists' assistants
3152 Registered nurses
3142 Physiotherapists
3122 Chiropractors
3131 Pharmacists
3213Veterinary and animal
health technologists and technicians
3214Respiratory therapists, clinical perfusionists and cardiopulmonary technologist
3121Optometrists3114
Veterinarians
3111 Specialist physicians
3216 Medical sonographers
3141 Audiologists and
speech-language pathologists
3218 Electroencephalographic and other diagnostic technologists, n.e.c.
3123 Other professional occupations
in health diagnosing and treating3215
Medical radiation technologists
3132 Dieticians and nutritionists
3219 Other medical technologists and
technicians (except dental health)
Number of graduates 2010 (distributed by rate of employees per occupation in 2006)
Estimated number of new jobs for 2012
Supply < Demand
Supply = Demand
Supply > Demand
Esti
mat
ed n
umbe
r of
new
jobs
for
2012
(e
stim
ated
from
em
ploy
ers’
sur
vey)
RESEARCH & INNOVATION JOBS – Opportunities and challenges in the Toronto Region Labour Market26
Table 14: Statistics for Occupations in Health
Toronto Region
Estimated Estimated Percentage of post-NOC Number of number of number of secondary studentscode NOC title employees (2006) new jobs (2012) graduates (2010) interested (2011)
Health 77,765 3,074 10,881 43%
3111 Specialist physicians 7,505 113 215 10%
3211 Medical laboratory technologists and pathologists' assistants 3,945 608 1,213 4%
3121 Optometrists 675 16 101 10%
3122 Chiropractors 1,670 152 826 7%
3219 Other medical technologists and technicians (except dental health) 570 228 296 4%
3131 Pharmacists 5,120 145 343 13%
3132 Dieticians and nutritionists 1,845 320 66 15%
3141 Audiologists and speech-language pathologists 1,355 112 71 5%
3142 Physiotherapists 3,245 348 1,603 12%
3152 Registered nurses 43,000 540 4,293 8%
3214 Respiratory therapists, clinical perfusionists and cardiopulmonary technologists 945 20 127 3%
3215 Medical radiation technologists 2,670 193 10 4%
3216 Medical sonographers 995 26 35 2%
3218 Electroencephalographic and other diagnostic technologists, n.e.c. 95 50 0 1%
3123 Other professional occupations in health diagnosing and treating 1,040 156 95 5%
3114 Veterinarians 1,150 0 1,325 8%
3213 Veterinary and animal health technologists and technicians 1,940 47 262 4%
Occupations in Health
Supply/Demand for selected occupations in HealthFig. 19

27
Table 15: Average basic compensation for jobs in Health in the Toronto Region [13,14]
Toronto Region - Average
Job title basic compensation
Physician anesthesiologist $ 285,426
Optometrist $ 115,636
Chiropractor $ 109,881
Veterinarian $ 96,094
Orthoptist $ 76,860
Audiologist $ 76,414
Medical sonographer $ 72,030
Medical technologist $ 63,627
Medical radiation technologist $ 61,006
Respiratory therapist $ 60,508
Cardiopulmonary technologist $ 60,400
Cardiovascular technologist $ 60,400
Dietician $ 60,241
Electroencephalographic technologist $ 54,619
Medical laboratory technician $ 46,987
Veterinary technician $ 38,424
Our employers’ survey included 32 health institutionsfrom which 18 institutions employed 250 or more persons.
The estimated hiring demand for health occupations in general is low, and for most of the occupations the number of graduates seems adequate or over-supplied. The occupations falling in the undersuppliedarea have very low hiring demand levels and numbers of graduates. Therefore, we prefer not to draw anygeneral conclusions.
In terms of youth interest, the most popularoccupations are Dieticians, Pharmacists andPhysiotherapists (see Figure 20).
No gender differences were observed in youthresponses. However, most of the graduates in healthin 2010 were female, ranging from 64 per cent(Veterinarians) to 93 per cent (Veterinary technicians).In the labour force, most of the employees in healthoccupations are female, with the exception ofveterinarians, optometrists and pharmacists (whichhave an even number of females and males) and ofspecialized physicians and chiropractors (only onethird are female).
Source: ERI 2011 “The Salary Assessor® & Survey Software and Databases”
3141 Audiologists and
speech-language pathologists
3122 Chiropractors
3111 Specialist p
hysicians
3142 Physiotherapists
3152 Registered nurses
3132 Dieticians and nutri
tionists
3121 Optometrists
3131 Pharmacists
3114 Veterinaria
ns
3123 Other profess
ional occ
upations
in health
diagnosing and treatin
g
0%
10%
20%
5%7%
10%12%
8%
15%
10%
13%
8%
5%
Top 10 Health occupations of interest for surveyed post-secondary studentsFig. 20

RESEARCH & INNOVATION JOBS – Opportunities and challenges in the Toronto Region Labour Market28
This chapter presented a series of labour marketstatistics focused on a set of 60 occupations in Business& Commerce, Sciences, Engineering, InformationTechnology, Architecture & Design and Health.
The Supply/Demand analysis carried out showed that:
- Information technology occupations are in very highdemand but are significantly undersupplied.
- Business occupations are in high demand and count on a good supply of local graduates (exceptperhaps on technical sales, but further study isneeded to confirm this).
- Several engineering occupations are in highdemand, but the number of graduates tends to be lower than needed.
- Health and Architecture & Design occupations don’thave a high demand, and in general count on a goodsupply of graduates. An exception to this is found ingraphic designers, where demand is almost tentimes higher than the number of graduates.
CONCLUSIONS

29
Nowadays, both the professionals working in theknowledge economy and the projects hiring themtend to be highly mobile. Industry professionalsbecome adjunct professors or full professors inuniversities, while professors in universities becomeresearch and development leaders in industry. Undersuch mobility conditions, research and innovationhubs are best reviewed not by sectors as industry andhigher education, but on a regional basis. Therefore,an international region-based comparison wasincluded in this project.
Two criteria were followed for the selection of theregions: having a strong post-secondary educationalsystem and being economically successful. Bothestablished and emerging regions were included,from four continents.
As a result, nine regions were studied in terms oftheir scientific production (patents and non-patents).
Their scientific production was also analysed withrespect to the resources available to universities(budget, number of professors, enrolment).
Regions in study:
• Bay Area, California (USA)
• Boston Region, Massachusetts (USA)
• Helsinki Region, Finland
• Israel
• Seoul Region, Korea
• Singapore
• Sydney Region , Australia
• Toronto Region, Ontario (Canada)
• Zurich Region, Switzerland
REGION-BASEDINTERNATIONALBENCHMARKING

RESEARCH & INNOVATION JOBS – Opportunities and challenges in the Toronto Region Labour Market30
Bay Area: Also known as the San Francisco BayArea, located in California, United States of
America. The region encompasses the metropolitanareas of San Francisco, Oakland and San Jose.[18]
Population: 7.15 millionArea: 18,088 km²Density: 395.29/km²
Boston Region: Located in Massachusetts,United States of America, the most restrictive
definition of the Greater Boston area is the regionadministered by the Metropolitan Area PlanningCouncil (MAPC). The MAPC is a regional planningorganization created by the Massachusetts legislatureto oversee transportation infrastructure and economicdevelopment concerns in the Boston area. The MAPCincludes 101 cities and towns. Main cities: Boston,Cambridge and Quincy.[19]
Population: 3.1 millionArea: 3,680 km² Density: 366/km² [20]
Helsinki Region: Corresponds to the HelsinkiMetropolitan Area, including the cities of Helsinki,
Vantaa, Espoo and Kauniainen.[21] Helsinki is the capitalof Finland.
Population: 1.05 millionArea: 770 km²Density: 1,358/km²
Israel Region: The whole State of Israel is included.[22]
Population: 7.825 millionArea: 22,072 km²Density: 365.3/km²
REGIONS IN STUDY
12
8 9
3
4
6
5
7
Regions in studyFig. 21
1
2
3
4

31
Seoul Region coincides with Seoul, the capitaland largest metropolis of the Republic of Korea -
officially the Seoul Special City.[23]
Population: 10.464 millionArea: 605.2 km²Density: 17,288/km²
Singapore Region includes the whole country ofSingapore.[24]
Population: 5.183 millionArea: 710 km²Density: 7,315/km²
Sydney Region includes all the districts within Sydney, Australia.[25]
Population: 4.6 millionArea: 12,144 km²Density: 2,058/km²
Toronto Region: The Toronto Region includes the Greater Toronto Area, plus surrounding
municipalities of Waterloo, Wellington and Hamilton. Toronto is the provincial capital of Ontario, Canada. [26,27,28,29]
Population: 6.6 millionArea: 12,213 km²Density: 541/km²
Zurich Region: Located in Switzerland, it corresponds to the Greater Zurich Area.
Its main cities are Zurich, Winterthur and Uster.[30]
Population: 3.8 millionArea: 2,103 km²Density: 1,806/km²
5
6
7
8
9
– Helsinki Region
• Aalto University
• Arcada University of Applied Sciences
• Uusimaa Regional Council/Helsinki-Uusimaa Region
– Israel
• The Hebrew University of Jerusalem
• The Open University of Israel
– Seoul Region
• Sungkyunkwan University
Special thanks
Initially, our study included a broader spectrum of universities per region. Despite a number of efforts along months,this approach had to be abandoned due to the lack of data available to us. Nevertheless, we wish to thank thefollowing institutions for providing information to this study:

RESEARCH & INNOVATION JOBS – Opportunities and challenges in the Toronto Region Labour Market32
REGIONAL SCIENTIFIC PRODUCTION: PATENTS
Rationale for patents
Among all the types of scientific production, patentsare the most strongly application-oriented kind. Thereare four primary incentives embodied in the patentsystem: to invent in the first place; to disclose theinvention once made; to invest the sums necessary to experiment, produce and market the invention; andto design around and improve upon earlier patents.[31]
According to supporters, patents provide incentives for efficient research and development (R&D). A studyconducted by the European Community shows that thelargest global companies invested more than €430billion in 2008[32] in their R&D departments. Theseinvestments are among the inputs of R&D, and patentsmay be included in its outcomes. Supporters of patentsargue that without patent protection, R&D spendingwould be significantly less, limiting possibletechnological advances. Enterprises would restrictR&D investments, as third parties would be free toexploit any developments.[33] In agreement with theoriginal definition of the term "patent," patentspromote public disclosure of innovations for thecommon good. If inventors do not have the legalprotection of patents, they would prefer to keep theirinventions as trade secrets. Patents make the details of new technology publicly available, leading to furtherimprovement by other inventors, and for exploitation by anyone after the patent expires.
Nevertheless, patents have been the object of criticism. As state-granted monopolies, patents have beencriticized as inconsistent with free trade. Patent Officeshave also been criticized for granting patents to knowninventions, thus allowing controversial patents to slipthrough the system.[34] Pharmaceutical patents preventgeneric alternatives to enter the market until thepatents expire, and thus maintain high prices formedication.[35] This can have significant effects in thedeveloping world, as those who are most in need ofbasic essential medicines are unable to afford suchhigh priced pharmaceuticals.[36] Other articles focus onthe problems of today’s medical research, posing thatwrong priorities in research and pricing may push thestate-run healthcare systems of even rich nations totheir limits.[37] Addressing these criticisms, one reviewconcluded that less than five per cent of medicines onthe World Health Organization's list of essential drugsare under patent. Also, the pharmaceutical industryhas contributed US$2 billion for healthcare in
developing countries, providing HIV/AIDS drugs atlower cost or even free of charge in certain countries,and has used differential pricing and parallel importsto provide medication to the poor.[38]
Some public campaigns have expressed a concern for"preventing the over-reach" of Intellectual Propertyprotection including patent protection, and "to retain a public balance in property rights" of this kind.Alternatives have been discussed on the issue offinancial incentives to replace patents. Mostly, they arerelated to some form of direct or indirect governmentfunding. Other groups are investigating how socialinclusion and equitable distribution of research anddevelopment findings can be obtained within theexisting intellectual property framework, althoughthese efforts have received less exposure.
A system to compare regional patent outflows
Being a key outcome of scientific research andtechnological innovation, every region in this reportcontinually produces a vast patent outflow. A ratingsystem intended to objectively compare these patentoutflows quantitatively and qualitatively was developedas part of the author’s supporting research and isproposed here.
The proposed system is based on the United Statespatents granted to authors residing in the regionscovered by this report during a given period. It is wellknown that most important inventions patented aroundthe globe are also patented in the United States, by far the wealthiest market in the world, and still thelargest economy.
To process the huge amount of website informationavailable on patents, the author chose world renownedPublish or Perish citation analysis software[39] ofscientific production, developed by Dr. Anne-WilHarzing, Professor and Associate Dean Research at theUniversity of Melbourne, Australia. The current version(3.5) of the software, applied in making this report, wasissued in January 2012.
The Publish or Perish software works downstream ofGoogle Scholar, a freely accessible web search enginethat indexes the full text of scholarly literature acrossan array of publishing formats and disciplines.Released in beta version in November 2004, the Google

33
Scholar index includes most peer-reviewed onlinejournals of Europe and America's largest scholarlypublishers, plus scholarly books, book chapters,conference proceedings, reports and patents. GoogleScholar is similar in function to the freely availableScirus from Elsevier, CiteSeerX, and getCITED, butwider in its field scope. Google Scholar is also similarto the subscription-based tools, Elsevier's Scopus andThomson Reuters’ Web of Science, but with widercoverage of journals, books, reports, patents andconference proceedings, which are important to fieldslike Business, Administration, Finance and Economics,Engineering, Social Sciences, Arts and Humanities.
For a long time, it has been known that both quantityand quality are important in the analysis of scientificproduction. In our proposed system—for this case—wetake as basic input the biggest possible sample of sizeSP ≤ 1,000 of the best US Patents granted to authorsresident in each region, during the last two years(2010-2011). For the most powerful regions, it is notdifficult to compile a sample of size 1,000. In contrast,less powerful regions may only afford samples of lesssize. Therefore, it is defined the size index SP of thepatent outflow, calculated and given by the Publish orPerish software in its Results pane, as the Papers value.
By the way, 1,000 is the limit imposed nowadays byGoogle Scholar for a single query. Set limit makespossible to retrieve and analyse a full region in onesingle Publish or Perish operation. These 1,000 or less patents are a best-selected sample of the patentoutflow of the given region in these two years, becauseeach patent is ranked according to the values ofinternationally-recognized citation metrics included in Publish or Perish, whose calculations are doneautomatically by the software with every query.Sometimes, a region comprises several cities. In thesecases, the sample may be composed of patents whoseinventors live in two or more cities of the region, if this makes the best sample for the region. On thecontrary, the sample is composed only of patentswhose inventors reside in the region’s city, whichallows the best sample.
Then, from the original sample—the first group ofpatents—a second, usually smaller group, is retained,containing only those patents that have received anycitation from January 2010 to January 2012. This maybe done in a simple and fast step, pressing the button“Uncheck 0 cites” on the user interface of the Publishor Perish software. The number of cited patents in theoriginal sample is an objective measure of the quantityof patents registered by the region that have proven
useful in the last two years, to scientists, engineers or other inventors in their research and innovationprojects. This number will be called worth index, WP ofthe patent outflow. This second index is automaticallycalculated and given by the Publish or Perish softwarein its Results pane, as the Papers value, after pressingthe button “Uncheck 0 cites”.
Of course, the worth index WP may reach a maximumvalue equal to the corresponding SP, meaning that inthe original sample, all patents have already proven tobe useful. For a deeper evaluation of the utility of thepatents in the second group of the outflow sample, athird index is devised: the mean number of citations inthe group. This number will be called quality index, QPof the patent outflow. The value of this index has noceiling, and is an indirect measure of the practicalapplication of the patents of the region outflow. When apatent is registered, there is no data in it that may beused to measure its future practical application; eventhe existence of an Assignee does not guarantee thatthe patent is going to be applied in a real-life product.On the contrary, a patent usually receives manycitations when it has been widely applied. This thirdindex is automatically calculated and given by thePublish or Perish software in its Results pane, as theCites/paper value, after the user presses the button“Uncheck 0 cites”.
The product of the worth index and the quality indexmay be termed the integral index IP of the patentoutflow of the given region, as given in (1).
(1)
The value of the integral index is equal to the totalnumber of citations received since the beginning of thechosen period of publication until the present, by thepatents contained in the second group. Thus, IP is anobjective measure of the absolute usefulness of thepatents of the second group, in the patent outflow of a given region. This fourth index is automaticallycalculated and given by the Publish or Perish softwarein its Results pane, as the Citations value afterpressing the button “Uncheck 0 cites”.
The above mentioned four indexes are calculated forevery possible set of cities of the given region. The setof cities of the region that gives the maximum value ofIP is taken as the set of cities that represent the patentoutflow of the given region. The indexes of such set ofcities become the indexes of the patent outflow of thegiven region.
RESEARCH & INNOVATION JOBS – Opportunities and challenges in the Toronto Region Labour Market34
In order to guarantee that the Publish or Perishsoftware only captures US Patents in its processing,the fields of the “General citation search” input pageshould be filled as follows:
Author: <void>
Publication: <void>
All of the words: “Patent No.:”, “Date ofPatent:”
Any of the words: <city1> (<country>),<city2> (<country>), …
None of the words:
The phrase:
Year of publication between <year1> and<year2>
Where <city1>, <city2>, … are important cities in theregion. The <country> is given by the two-letter codesused nowadays on the Internet. In regions within the
US it is necessary to include the <state> between eachcity and the country. The <state> in the US is coded bythe customary two-letter code used by the U.S. PostalService.
This way, for any US Patent, the residence of at leastsome of the Inventors in the key cities of a given regionwill be clearly marked, for an effective automatedsearch and processing.
Results per Region
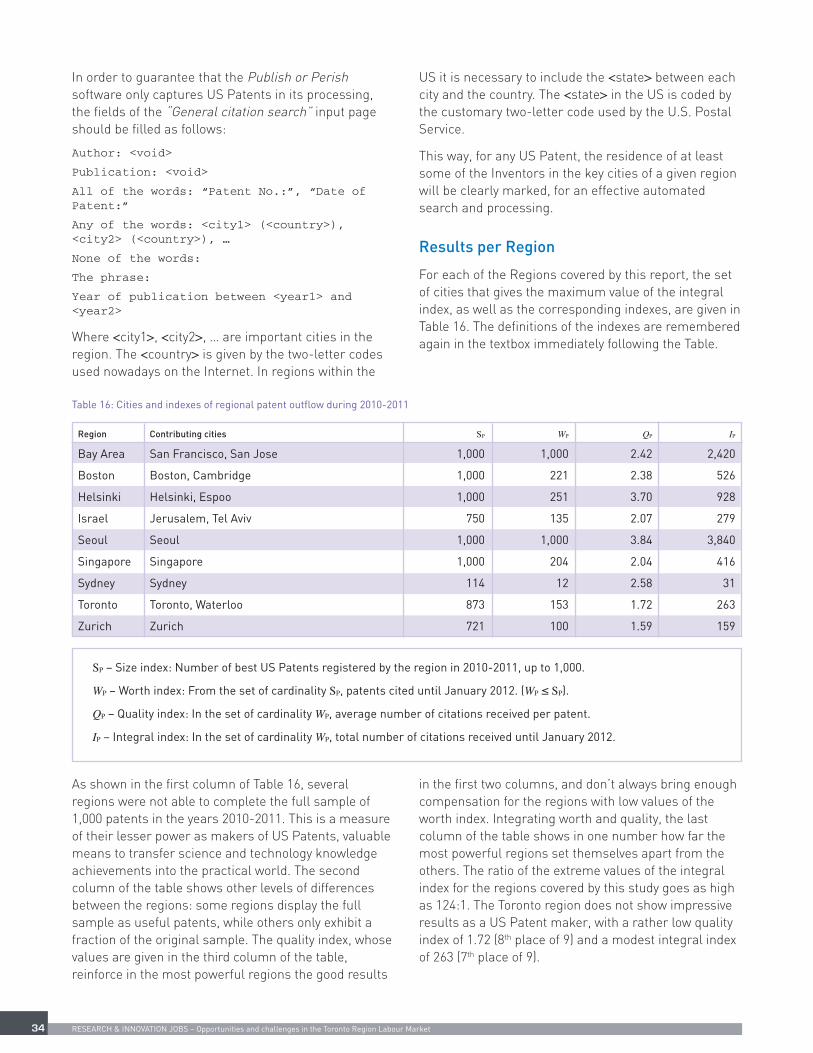
For each of the Regions covered by this report, the setof cities that gives the maximum value of the integralindex, as well as the corresponding indexes, are given inTable 16. The definitions of the indexes are rememberedagain in the textbox immediately following the Table.
Table 16: Cities and indexes of regional patent outflow during 2010-2011
Region Contributing cities SP WP QP IP
Bay Area San Francisco, San Jose 1,000 1,000 2.42 2,420
Boston Boston, Cambridge 1,000 221 2.38 526
Helsinki Helsinki, Espoo 1,000 251 3.70 928
Israel Jerusalem, Tel Aviv 750 135 2.07 279
Seoul Seoul 1,000 1,000 3.84 3,840
Singapore Singapore 1,000 204 2.04 416
Sydney Sydney 114 12 2.58 31
Toronto Toronto, Waterloo 873 153 1.72 263
Zurich Zurich 721 100 1.59 159
SP – Size index: Number of best US Patents registered by the region in 2010-2011, up to 1,000.
WP – Worth index: From the set of cardinality SP, patents cited until January 2012. (WP ≤ SP).
QP – Quality index: In the set of cardinality WP, average number of citations received per patent.
IP – Integral index: In the set of cardinality WP, total number of citations received until January 2012.
As shown in the first column of Table 16, several regions were not able to complete the full sample of1,000 patents in the years 2010-2011. This is a measureof their lesser power as makers of US Patents, valuablemeans to transfer science and technology knowledgeachievements into the practical world. The secondcolumn of the table shows other levels of differencesbetween the regions: some regions display the fullsample as useful patents, while others only exhibit afraction of the original sample. The quality index, whosevalues are given in the third column of the table,reinforce in the most powerful regions the good results
in the first two columns, and don’t always bring enoughcompensation for the regions with low values of theworth index. Integrating worth and quality, the lastcolumn of the table shows in one number how far themost powerful regions set themselves apart from theothers. The ratio of the extreme values of the integralindex for the regions covered by this study goes as high as 124:1. The Toronto region does not show impressiveresults as a US Patent maker, with a rather low qualityindex of 1.72 (8th place of 9) and a modest integral indexof 263 (7th place of 9).

35
Rationale for non-patents
According to the objectives of this study, the scientificproduction of the analysed regions has been divided in two parts: patents and non-patents. It may seem a gross decision to include in a single part the vastvariety of non-patent publications, for example:articles in magazines, papers in journals, monographbooks, book chapters, conference proceedings, andacademic or industrial reports. The rationale behindthis classification is that the weight of the patents is so great, due to their strongly application-orientedcharacter, that they may counterbalance all the otherforms of scientific production. At the end, the numberof citations, the contemporary objective measure ofthe utility of a publication given by its qualified users,is the key assessment criterion, over other evaluationnorms, such as the peer review typical of editorials ora number of prizes.
In this study, as in many others, we are talking aboutscientific production documents in English. Althoughthe publications in Chinese or Korean have beenincreasing lately in quantity and quality, it is also true that the number of publications in English hasbeen increasing at a higher rate, and that the mostimportant scientific production in other languages isalso published in English, to assure a higher visibility.
A rating system to compare non-patent outflows
Being a key outcome of scientific research andtechnological innovation, every region covered by thisreport continually produces a vast non-patent outflow.A rating system intended to objectively compare thesenon-patent outflows quantitatively and qualitatively wasdeveloped as part of the author’s supporting researchand is proposed here.
The proposed system is based on the non-patentpublications of authors working in the key universitiesof the regions covered by this report, during a givenperiod. It is well known that citation by peers is themain contemporary measure of the quality of thepublications derived from the scientific andtechnological research and innovation.
To process the huge amount of website informationavailable on non-patent publications, the author choseworld renowned Publish or Perish citation analysis
software of scientific production, developed by Dr. Anne-Wil Harzing, Professor and Associate DeanResearch at the University of Melbourne, Australia,previously mentioned in this report.
For a long time, it has been known that both quantityand quality are important in the analysis of scientificproduction. In our proposed system—for this case—wetake as basic input the biggest possible sample of sizesN ≤ 1,000 of the best non-patent publications of theauthors of every major university in each region, duringthe last two years (2010-2011). Therefore, it is definedthe specific size index sN of the non-patent outflow, forevery university in a region, calculated and given by thePublish or Perish software in its Results pane, as thePapers value.
By the way, 1,000 is the limit imposed nowadays byGoogle Scholar for a single query. Set limit makespossible to retrieve and analyse a full university in onesingle Publish or Perish operation. These 1,000 or lessnon-patent publications are a best-selected sample ofthe non-patent outflow of the given university in thesetwo years, because each non-patent publication isranked according to the values of internationally-recognized citation metrics included in Publish orPerish, whose calculations are done automatically by the software with every query.
Then, from the original sample of a given university—the first group—a second, usually smaller group, isretained, containing only those non-patents that havereceived any citation from January 2010 to January2012. This may be done in a simple and fast step,pressing the button “Uncheck 0 cites” on the userinterface of the Publish or Perish software. Thenumber of cited non-patents in the original sample of size sN is an objective measure of the quantity ofuseful non-patents published by the university in thelast two years. This number is the specific worth index,wN of the non-patent outflow of the university. Thissecond index is automatically calculated and given bythe Publish or Perish software in its Results pane, asthe Papers value. Of course, the specific worth indexwN may reach a maximum value of sN, meaning that inthe original sample, all non-patents are useful. Weconsider them useful because they were found useful—and therefore cited—at least once by otherprofessionals in their research or developmentprojects.
REGIONAL SCIENTIFIC PRODUCTION: NON-PATENTS

RESEARCH & INNOVATION JOBS – Opportunities and challenges in the Toronto Region Labour Market36
For a deeper evaluation of the utility of the non-patentsin the second group of the university outflow sample, athird index is devised: the mean number of citations inthe group. This number will be called specific qualityindex, qN of the non-patent outflow of the university.The value of this index has no ceiling, and is a measureof the degree of usefulness of the non-patents of theuseful group, in the non-patent outflow of a givenuniversity. This third index is automatically calculatedand given by the Publish or Perish software in itsResults pane, as the Cites/paper value.
A specific integral index iN for the non-patent outflow of a university may be obtained as the product of thespecific worth index and the specific quality index of the same university, as given in (2).
(2)
This fourth index is automatically calculated and givenby the Publish or Perish software in its Results pane,as the Citations value.
In order to guarantee that the Publish or Perishsoftware only captures non-patents in its processing,the fields of the “General citation search” input pageshould be filled as follows:
Author: <void>
Publication: <void>
All of the words:
Any of the words: <university, city>
None of the words: “Patent No.:”, “Date ofPatent:”
The phrase:
Year of publication between <year1> and<year2>
This way, non-patent publications from authorsworking in every major university of the region areclearly identified, to be processed automatically usingthe Publish or Perish software.
Following the aforementioned procedure, the specificintegral index iN is computed for every major universityof the given region, and the three universities with thehighest values of such index become the elements ofthe set of universities that is going to represent thenon-patent outflow of the given region.
The properties of the non-patent publications fromauthors of this set of universities are going to berepresented by four general indexes, calculated fromthe corresponding specific indexes of the individualuniversities members of the representative set.
The sample of non-patent publications of the region,with a size index sN is to be composed from the sum ofthe sizes of the samples of the three universities thatrepresent the region, as given in (3).
(3)
Obviously, the maximum possible value of this generalindex is given by (4).
(4)
The second group of non-patent publications of theregion, with a worth indexWN, is to be composed fromthe sum of the specific worth indexes of the threeuniversities that represent the region, as given in (5).
(5)
For this general index, the top possible value is alsoWN max = 3,000.
For a deeper evaluation of the utility of the secondgroup of non-patent publications of the region, it isintroduced a quality indexQN given by the weightedmean of the specific quality indexes of the threeuniversities that represent the region, as given in (6).
(6)
Clearly, the weight of each value of qN is thecorresponding value of wN. This general index has notop value but, obviously, its value will fall within theextreme values of the specific worth indexes qNconcerned, as given in (7).
(7)
For a fourth level of evaluation of non-patent regionalpublications, it is introduced the integral index IN givenby the product of the worth index and the quality indexof the same region, as given in (8).
(8)
This general index will represent the combined effect of general worth and general quality of the non-patentpublications from the three selected major universitiesthat represent the corresponding outflow of the region.

37
Results per Region
For each of the Regions covered by this report, thecities with at least one representative university, as well as the corresponding general indexes are given inTable 17. The definitions of the indexes are listed in thetextbox immediately following the Table.
As shown in the first column of Table 17, some regionswere not able to complete the full sample of 3,000 non-patents in the years 2010-2011. This is a measure oftheir lesser power as makers of these publications,valuable in the development of Science and Technology.The second column of the table shows no bigdifferences: most Regions display a number of non-
patents close to the size of the sample, and noneexhibit a small fraction of the same. On the contrary,the values of the quality index, in the third column of the table, show sensible differences between theregions. Integrating worth and quality, the last columnof the table shows in one number how far the mostpowerful regions set themselves apart from the others.The ratio of the extreme values of the integral index forthe Regions covered by this study goes as high as 8:1.The Toronto region shows pleasant results as a non-patent scientific production maker, with a high qualityindex of 18.28 (second place out of nine) and anelevated integral index of 46,420 (second place out of nine).
Table 17: Cities and indexes of regional non-patent outflow during 2010-2011
SN – Size index: Number of best non-patent publications by the region in 2010-2011, up to 3,000.
WN – Worth index: From the set of cardinality SN, non-patents cited until January 2012. (WN ≤ SN).
QN – Quality index: In the set of cardinality WP, average number of citations received per publication.
IN – Integral index: In the set of cardinality WP, total number of citations received until January 2012.
Region Contributing cities SN WN QN IN
Bay Area San Francisco, Berkeley, Stanford 3,000 2,116 34.65 73,320
Boston Cambridge, Boston 3,000 2,999 15.23 45,699
Helsinki Helsinki, Espoo 1,463 1,164 8.709 10,137
Israel Tel Aviv, Rehovot, Haifa 2,955 2,097 8.884 18,630
Seoul Seoul 3,000 2,439 6.677 16,286
Singapore Singapore 1,510 1,167 9.726 11,350
Sydney Sydney 3,000 2,752 8.023 22,079
Toronto Toronto, Hamilton 3,000 2,539 18.28 46,420
Zurich Zurich 2,049 1,336 6.854 9,157

RESEARCH & INNOVATION JOBS – Opportunities and challenges in the Toronto Region Labour Market38
REGIONAL SCIENTIFIC PRODUCTION AND RESOURCES AVAILABLE TO UNIVERSITIES
For each of the top three universities defined by thenon-patent publication analysis, data was collectedregarding budget, number of professors, enrolmentand number of graduates [Table 18]. The intention wasto find out if some of these factors, or combinationsthereof, influence the scientific production of thecorresponding region.
Yellow cells in Table 18 indicate the availableinformation is partial: data for one or two universitiesare missing. When no data at all could be gathered, thecell contains the word “Missing”. Several combinationsof the values in the same Table were visually plottedagainst the indexes qualifying the scientific productionof the regions (Table 16 and Table 17). Only two of thetried combinations provided some apparent relation,and they are briefly discussed as follows.
• Figure 22 shows an apparent relation between thefinancial resources available to universities andtheir non-patent scientific production. That is,universities with a better production are also thosecounting on a larger budget. Regions with a dottedborder in Figure 22 indicate that financial informationis missing for one of the top three universities. Thismeans their position in the graph is somewherefurther to the right, as indicated by the arrows.
• The number of patents assigned to universities isusually low, since most assignees are industries orbusinesses. Therefore, any link between universitiesand the production of patents within a region isindirect, as opposed to the direct link existent with non-patents. This study has not found clearrelation between the number of graduates and theproduction of patents. Also, no relation was found by using the number of post-graduate degreesawarded, or the per centage they represent from the total of graduates.
• Figure 23 shows one apparent relation that wasfound between students per professor and theproduction of patents. The number of students per professor may be linked to the quality of the graduates.
This study has only briefly analysed the relationbetween scientific productions of given regions—measured by patents and non-patents—and regionaluniversity resources. No final conclusions should bedrawn upon the apparent relations shown in Figure 22and Figure 23, but they pose open questions that otherstudies could further investigate. Also, the presentstudy does not rule out the presence of otherinteresting relations in this data.
Table 18: Annual resources available to a region’s top three universities, per non-patent publication
Region Financial resources (US$ millions) Number of professors Enrolment Number of graduates
Bay Area [40,41,42] 6,909 5,452 54,610 15,832
Boston [43,44,45] 9,513 6,396 57,245 19,203
Helsinki [46,47,48,49,50] 2,251 5,303 57,090 8,734
Israel [51,52,53] Missing Missing 43,565 Missing
Seoul [54,55,56] 3,935 10,387 90,174 7,158
Singapore [57,58,59] 2,518 4,369 77,977 20,084
Sydney [60,61,62] 2,816 8,361 135,726 52,516
Toronto [63,64,65,66] 4,400 4,810 138,980 33,633
Zurich [67,68,69] 2,278 1,565 51,269 7,758

39
Financial resources (in millions of dollars)
Non
-pat
ent s
cien
tific
pro
duct
ion
2010
-201
1 (I
nteg
ral i
ndex
, Ip)
4,000 10,0002,000 6,000 8,0005,000
50,000
Bay Area
Boston
Sydney
Toronto
Zurich
Seoul
Singapore
Regional non-patent scientific production versus financial resources available to top three universitiesFig. 22
Number of students per professor
Pat
ent s
cien
tific
pro
duct
ion
2010
-201
1 (I
nteg
ral i
ndex
, Ip)
5 200 10 15 25 4030 3510
1,000
100
Bay Area
Seoul
Toronto
Zurich
Sydney
SingaporeBoston
Helsinki
Regional patent scientific production versus number of students per professor at the top three universities Fig. 23

RESEARCH & INNOVATION JOBS – Opportunities and challenges in the Toronto Region Labour Market40
The classification of the scientific production of anumber of key regions into patents and non-patents isan unconventional move, which well serves thepurposes of the present study. The patents are anexpression of the research and innovation power of thecreative scientific workforce of every given region,especially of their members aimed at the solution ofimportant practical problems. Following the ideas ofDonald E. Stokes[2], it is rational to say that the patentsare an expression of the Pasteur and Edison quadrants.Pasteur’s quadrant houses researchers seeking thesolution of practical problems while questing for anunderstanding of the underlying basic laws. Edison’squadrant houses researchers and innovators focusedexclusively on the solution of practical problems,
without any interest in understanding the basic lawsunderlying the solutions. On the other hand, non-patent publications are an expression of both thePasteur and Bohr quadrants, where the latter housesthose researchers focused only in deepening theknowledge about the phenomena under study and notpaying any attention to their possible practicalapplications. It is interesting to note that both classesof scientific production include the Pasteur’s quadrant,where the most versatile professionals develop theiractivities. The results obtained are certainly interesting,and may be useful in the hands of the persons incharge of the management of the Research andInnovation potential of the Toronto Region.
CONCLUSIONS

41
GENERAL CONCLUSIONS AND RECOMMENDATIONS
This study has developed a methodology to estimate and analyse the supply/demand of the workforce inspecific occupations in the Toronto Region. Deliberately, this methodology has been designed so it can beapplied to other regions in Canada. We believe it could also be applied, with some variations, to regions in the United States and possibly in other OECD countries.
It would be interesting to repeat this analysis in a year or two in the Toronto Region, comparing the resultsagainst the latest 2011 census, analysing how the different variables evolved over time, verifying how manygraduates found employment in the analysed occupations, and going further into questions that could not beanswered at this time (e.g. Why most employers hiring engineering and science positions need to hire outsidethe Greater Toronto Area).
Another interesting extension of this study would be to include immigration in the analysis. It would beinteresting to see in which occupations newcomers contribute the most, and whether there are still cases of undersupplied skilled forces when we add those with international post-secondary education.

RESEARCH & INNOVATION JOBS – Opportunities and challenges in the Toronto Region Labour Market42
APPENDICES
A. List of occupations studied
Business & Commerce
6221. Technical sales specialists
0911. Manufacturing managers
0611. Sales, marketing and advertising managers
0012. Senior government managers and officials
0013. Senior managers - financial, communications and other business services
0014. Senior managers - health, education, social and community services and membership organizations
Sciences
2161. Mathematicians, statisticians and actuaries
2111. Physicists and astronomers
2112. Chemists
2211. Chemical technologists and technicians
2113. Geologists, geochemists and geophysicists
2114. Meteorologists
2213. Meteorological technicians
2115. Other professional occupations in physical sciences (e.g. materials scientists)
2121. Biologists and related scientists (e.g. food scientist)
2221. Biological technologists and technicians
2122. Forestry professionals
2223. Forestry technologists and technicians
Engineering
2131. Civil engineers
2231. Civil engineering technologists and technicians
2132. Mechanical engineers
2232. Mechanical engineering technologists and technicians
2133. Electrical and electronics engineers
2241. Electrical and electronics engineering technologists and technicians
2134. Chemical engineers
2141. Industrial and manufacturing engineers
2233. Industrial engineering and manufacturing technologists and technicians
2243. Industrial instrument technicians and mechanics
2142. Metallurgical and materials engineers
2143. Mining engineers
2144. Geological engineers

43
2255. Mapping and related technologists and technicians
2145. Petroleum engineers
2146. Aerospace engineers
2244. Aircraft instrument, electrical and avionics mechanics, technicians and inspectors
2148. Other professional engineers (e.g. biomedical engineer)
2274. Engineer officers, water transport
Information Technology
2147. Computer engineers (except software engineers and designers)
2171. Information systems analysts and consultants
2172. Database analysts and data administrators
2173. Software engineers and designers
2174. Computer programmers and interactive media developers
2175. Web designers and developers
Architecture & Design
2151. Architects
5241. Graphic designers and illustrating artists
5245. Patternmakers – textile, leather and fur products
2252. Industrial designers
Health
3111. Specialist physicians
3211. Medical laboratory technologists and pathologists' assistants
3121. Optometrists
3122. Chiropractors
3123. Other professional occupations in health diagnosing and treating
3131. Pharmacists
3132. Dieticians and nutritionists
3141. Audiologists and speech-language pathologists
3142. Physiotherapists
3152. Registered nurses
3214. Respiratory therapists, clinical perfusionists and cardiopulmonary technologists
3215. Medical radiation technologists
3216. Medical sonographers
3218. Electroencephalographic and other diagnostic technologists (e.g. electroencephalograph (EEG) technologist)
3219. Other medical technologists and technicians (except dental health) (e.g. dietary technician)
3114. Veterinarians
3213. Veterinary and animal health technologists and technicians

RESEARCH & INNOVATION JOBS – Opportunities and challenges in the Toronto Region Labour Market44
B. Programs of study linked with each occupation, for this study
Occupations in Business & Commerce
Program Degree(s)
0012. Senior government managers and officials
Accounting and Information Technology Graduate Certificate
Accounting in Canada for Internationally Trained Accountants Graduate Certificate
Bachelor of Applied Business (E-business Supply Chain Management) Bachelor
Bachelor of Applied Business (Financial Services Management) Bachelor
Bachelor of Applied Business (Financial Services) Bachelor
Bachelor of Applied Business (Hospitality Operations Management) Bachelor
Bachelor of Applied Business (Human Resources Strategy and Technology) Bachelor
Bachelor of Applied Business (International Accounting and Finance) Bachelor
Bachelor of Applied Business (International Commerce and Global Development) Bachelor
Business Degree Bridge Graduate Certificate
Business Management Graduate Certificate
Business Process Management Graduate Certificate
Commerce/Business/Administration Bachelor, Master, Ph.D.
Financial Services Compliance Administration Graduate Certificate
Forensic Accounting Graduate Certificate
Green Business Management Graduate Certificate
International Business Management Graduate Certificate
International Project Management Graduate Certificate
Logistics and Supply Chain Management Graduate Certificate
Marketing Management Graduate Certificate
Other Specialized Admin Studies Bachelor, Master
Professional Accounting Practice Graduate Certificate
Project Management Graduate Certificate
Quality Assurance - Manufacturing and Management Graduate Certificate
Research Commercialization and Innovation Graduate Certificate
Resource Management Bachelor, Master, Ph.D.
Sport Business Management Graduate Certificate
Sports Management Graduate Certificate
6221. Technical sales specialists
Advertising - Media Marketing and Sales Graduate Certificate
Business - Sales Diploma
Commerce/Business/Administration Bachelor, Diploma, Master, Ph.D.
Other Specialized Admin Studies Bachelor, Master
0013. Senior managers – financial, communications and other business services
Accounting and Information Technology Graduate Certificate
Accounting in Canada for Internationally Trained Accountants Graduate Certificate
Bachelor of Applied Business (E-business Supply Chain Management) Bachelor
Bachelor of Applied Business (Financial Services Management) Bachelor
Bachelor of Applied Business (Financial Services) Bachelor
Bachelor of Applied Business (Hospitality Operations Management) Bachelor
Bachelor of Applied Business (Human Resources Strategy and Technology) Bachelor
Bachelor of Applied Business (International Accounting and Finance) Bachelor
Bachelor of Applied Business (International Commerce and Global Development) Bachelor

45
Program Degree(s)
Business Degree Bridge Graduate Certificate
Business Management Graduate Certificate
Business Process Management Graduate Certificate
Commerce/Business/Administration Bachelor, Master, Ph.D.
Enterprise Database Management Graduate Certificate
Financial Services Compliance Administration Graduate Certificate
Forensic Accounting Graduate Certificate
Green Business Management Graduate Certificate
Information Systems Security Graduate Certificate
International Business Management Graduate Certificate
International Project Management Graduate Certificate
Logistics and Supply Chain Management Graduate Certificate
Marketing Management Graduate Certificate
Other Specialized Admin Studies Bachelor, Master
Payroll Management Graduate Certificate
Personal Financial Services Graduate Certificate
Professional Accounting Practice Graduate Certificate
Project Management Graduate Certificate
Research Commercialization and Innovation Graduate Certificate
Resource Management Bachelor, Master, Ph.D.
Small Business Administration Graduate Certificate
Sport Business Management Graduate Certificate
Sports Management Graduate Certificate
Wine Business Management Graduate Certificate
0014. Senior managers – health, education, social and community services and membership organizations
Accounting and Information Technology Graduate Certificate
Accounting in Canada for Internationally Trained Accountants Graduate Certificate
Bachelor of Applied Business (E-business Supply Chain Management) Bachelor
Bachelor of Applied Business (Financial Services Management) Bachelor
Bachelor of Applied Business (Financial Services) Bachelor
Bachelor of Applied Business (Hospitality Operations Management) Bachelor
Bachelor of Applied Business (Human Resources Strategy and Technology) Bachelor
Bachelor of Applied Business (International Accounting and Finance) Bachelor
Bachelor of Applied Business (International Commerce and Global Development) Bachelor
Business Degree Bridge Graduate Certificate
Business Management Graduate Certificate
Business Process Management Graduate Certificate
Commerce/Business/Administration Bachelor, Master, Ph.D.
Financial Services Compliance Administration Graduate Certificate
Forensic Accounting Graduate Certificate
Green Business Management Graduate Certificate
International Business Management Graduate Certificate
International Project Management Graduate Certificate
Logistics and Supply Chain Management Graduate Certificate
Marketing Management Graduate Certificate

RESEARCH & INNOVATION JOBS – Opportunities and challenges in the Toronto Region Labour Market46
Program Degree(s)
Other Specialized Admin Studies Bachelor, Master
Payroll Management Graduate Certificate
Personal Financial Services Graduate Certificate
Professional Accounting Practice Graduate Certificate
Project Management Graduate Certificate
Research Commercialization and Innovation Graduate Certificate
Resource Management Bachelor, Master, Ph.D.
Small Business Administration Graduate Certificate
Sport Business Management Graduate Certificate
Sports Management Graduate Certificate
Wine Business Management Graduate Certificate
0611. Sales, marketing and advertising managers
Accounting and Information Technology Graduate Certificate
Accounting in Canada for Internationally Trained Accountants Graduate Certificate
Advertising - Account Management Graduate Certificate
Advertising - Media Copywriting Graduate Certificate
Advertising - Media Marketing and Sales Graduate Certificate
Bachelor of Applied Business (E-business Supply Chain Management) Bachelor
Bachelor of Applied Business (Financial Services Management) Bachelor
Bachelor of Applied Business (Financial Services) Bachelor
Bachelor of Applied Business (Hospitality Operations Management) Bachelor
Bachelor of Applied Business (Human Resources Strategy and Technology) Bachelor
Bachelor of Applied Business (International Accounting and Finance) Bachelor
Bachelor of Applied Business (International Commerce and Global Development) Bachelor
Brand Management Graduate Certificate
Business Degree Bridge Graduate Certificate
Business Management Graduate Certificate
Business Process Management Graduate Certificate
Commerce/Business/Administration Bachelor, Master, Ph.D.
Financial Services Compliance Administration Graduate Certificate
Forensic Accounting Graduate Certificate
Green Business Management Graduate Certificate
Hotel and Food Administration Bachelor, Master
International Business Management Graduate Certificate
International Project Management Graduate Certificate
Logistics and Supply Chain Management Graduate Certificate
Marketing Management Graduate Certificate
Other Specialized Admin Studies Bachelor, Master
Research Commercialization and Innovation Graduate Certificate
Resource Management Bachelor, Master, Ph.D.
Small Business Administration Graduate Certificate
Sport Business Management Graduate Certificate
Sports Management Graduate Certificate
Sports Marketing Graduate Certificate
Strategic Relationship Marketing Graduate Certificate
Wine Business Management Graduate Certificate

47
Program Degree(s)
0911. Manufacturing managers
Bachelor of Applied Business (Automotive Management) Bachelor
Bachelor of Applied Business (E-business Supply Chain Management) Bachelor
Bachelor of Applied Business (Electronic Business) Bachelor
Bachelor of Applied Business (Human Resources Strategy and Technology) Bachelor
Bachelor of Applied Business (International Accounting and Finance) Bachelor
Bachelor of Applied Business (International Commerce and Global Development) Bachelor
Bachelor of Applied Technology (Industrial Design) Bachelor
Bachelor of Applied Technology (Industrial Management) Bachelor
Bachelor of Applied Technology (Integrated Advanced Manufacturing) Bachelor
Bachelor of Applied Technology (Integrated Environmental Site Remediation) Bachelor
Bachelor of Applied Technology (Process Automation) Bachelor
Business Degree Bridge Graduate Certificate
Business Management Graduate Certificate
Business Process Management Graduate Certificate
Electrical Engineering Bachelor, Master, Ph.D.
Electro Mechanical Design Graduate Certificate
Engineering Science Bachelor, Master, Ph.D.
Environmental Control Graduate Certificate
Green Business Management Graduate Certificate
Industrial Design Bachelor
Industrial Engineering Bachelor, Master, Ph.D.
Logistics and Supply Chain Management Graduate Certificate
Manufacturing Management Graduate Certificate
Mechanical Engineering Bachelor, Master, Ph.D.
Other engineering (biomedical, computer, environmental, geological, ocean, petroleum, agricultural, surveying) Bachelor, Master, Ph.D.
Other Specialized Admin Studies Bachelor, Master
Quality Assurance - Manufacturing and Management Graduate Certificate
Research Commercialization and Innovation Graduate Certificate
Resource Management Bachelor, Master, Ph.D.
Small Business Administration Graduate Certificate
Sports Management Graduate Certificate
Wine Business Management Graduate Certificate

RESEARCH & INNOVATION JOBS – Opportunities and challenges in the Toronto Region Labour Market48
Occupations in Sciences
Program Degree(s)
2111. Physicists and astronomers
Astronomy Bachelor, Master, Ph.D.
Biophysics Bachelor, Master, Ph.D.
General Science Bachelor
Other physics (atomic, chemical, electricity, magnetism, mathematical, mechanics, molecular, nuclear, optics, physical acoustics, physics of fluids, quantitative, quantum mechanics, solid state, theoretical, thermal, thermodynamics and statistical mechanics) Bachelor, Master, Ph.D.
2112. Chemists
Biochemistry Bachelor, Master, Ph.D.
Chemical Engineering Bachelor, Master, Ph.D.
Chemistry Bachelor, Master, Ph.D.
Environmental Studies Graduate Certificate
General Science Bachelor
Other basic sciences (medical toxicology) Bachelor, Master, Ph.D.
2113. Geologists, geochemists and geophysicists
Geographic Information Systems - Cartographic Specialist Graduate Certificate
Geography Bachelor, Master, Ph.D.
Geology and Related Bachelor, Master, Ph.D.
Mining Engineering Bachelor, Master, Ph.D.
Other engineering (biomedical, computer, environmental, geological, ocean, petroleum, agricultural, surveying) Bachelor, Master, Ph.D.
Soil Science Master, Ph.D.
2114. Meteorologists
Other Meteorology Diploma, Bachelor
2115. Other professional occupations in physical sciences
Biochemistry Bachelor, Master, Ph.D.
Biophysics Bachelor, Master, Ph.D.
Chemical Engineering Bachelor, Master, Ph.D.
Chemistry Bachelor, Master, Ph.D.
Environmental Studies Graduate Certificate
General Science Bachelor
Geographic Information Systems Graduate Certificate
Geographic Information Systems - Cartographic Specialist Graduate Certificate
Geography Bachelor, Master, Ph.D.
Geology and Related Bachelor, Master, Ph.D.
Metallurgical Engineering Bachelor, Master, Ph.D.
Metallurgy/Materials Science Bachelor, Master, Ph.D.
Mining Engineering Bachelor, Master, Ph.D.
Other engineering (biomedical, computer, environmental, geological, ocean, petroleum, agricultural, surveying) Bachelor, Master, Ph.D.
Other Meteorology Bachelor
Other physics (atomic, chemical, electricity, magnetism, mathematical, mechanics, molecular, nuclear, optics, physical acoustics, physics of fluids, quantitative, quantum mechanics, solid state, theoretical, thermal, thermodynamics and statistical mechanics) Bachelor, Master, Ph.D.
Research Analyst Graduate Certificate
Soil Science Master, Ph.D.

49
Program Degree(s)
2121. Biologists and related scientists
Anatomy Bachelor, Master, Ph.D.
Bachelor of Applied Technology (biotechnology) Bachelor
Biochemistry Bachelor, Master, Ph.D.
Bioinformatics Graduate Certificate
Biophysics Bachelor, Master, Ph.D.
Botany Bachelor, Master, Ph.D.
Environmental Studies Graduate Certificate
Microbiology Bachelor, Master, Ph.D.
Other basic sciences (medical toxicology) Bachelor, Master, Ph.D.
Other biology (programmes, majors or specializations in botany, zoology, biochemistry, biophysics, veterinary sciences) Bachelor, Master, Ph.D.
Physiology Bachelor, Master, Ph.D.
Plant Science Bachelor, Master, Ph.D.
2122. Forestry professionals
Forestry Bachelor, Master, Ph.D.
Soil Science Master, Ph.D.
2161. Mathematicians, statisticians and actuaries
Mathematics Bachelor, Master, Ph.D.
Mathematics/Physical Sciences Bachelor
2211. Chemical technologists and technicians
Chemical Engineering Technology Diploma
Chemical Laboratory Technician Diploma
Chemical Laboratory Technology Diploma
Chemical Production Engineering Technology Diploma
Environmental Technician Diploma
Environmental Techniques Certificate
Environmental Technology Diploma
Laboratory Assistant Certificate
2213. Meteorological technicians
Other Meteorology Diploma
2221. Biological technologists and technicians
Activation Co-ordinator/Gerontology Diploma
Bachelor of Applied Health Sciences (Athletic Therapy) Bachelor
Bachelor of Applied Health Sciences (Health Informatics Management) Bachelor
Bachelor of Applied Technology (Biotechnology) Bachelor
Bio-food Technician Diploma
Bio-food Technology Diploma
Biomedical Engineering Technology Diploma
Biotechnology Technician Diploma
Biotechnology Technologist Diploma
Environmental Biology Technology Diploma
Laboratory Assistant Certificate
Other biology (programmes, majors or specializations in botany, zoology, biochemistry, biophysics, veterinary sciences) Diploma
Plant Science Diploma
Preparatory Health Sciences Certificate

RESEARCH & INNOVATION JOBS – Opportunities and challenges in the Toronto Region Labour Market50
Program Degree(s)
2223. Forestry technologists and technicians
Forest Management Technology Diploma
Forest Recreation Technician Diploma
Forestry Technician Diploma
Forestry Technology Diploma
Urban Arboriculture Certificate
Program Degree(s)
2131. Civil engineers
Civil Engineering Bachelor, Master, Ph.D.
2132. Mechanical engineers
Bachelor of Applied Technology (Process Automation) Bachelor
Electro Mechanical Design Graduate Certificate
Engineering Science Master, Ph.D.
Mechanical Engineering Bachelor, Master, Ph.D.
2133. Electrical and electronics engineers
Advanced Lasers Graduate Certificate
Electrical Engineering Bachelor, Master, Ph.D.
Electro Mechanical Design Graduate Certificate
Engineering Science Master, Ph.D.
2134. Chemical engineers
Biochemistry Bachelor, Master, Ph.D.
Chemical Engineering Bachelor, Master, Ph.D.
Chemistry Bachelor, Master, Ph.D.
Environmental Studies Graduate Certificate
Other basic sciences (medical toxicology) Bachelor, Master
2141. Industrial and manufacturing engineers
Bachelor of Applied Technology (Industrial Design) Bachelor
Bachelor of Applied Technology (Industrial Management) Bachelor
Bachelor of Applied Technology (Integrated Advanced Manufacturing) Bachelor
Bachelor of Applied Technology (Integrated Environmental Site Remediation) Bachelor
Engineering Science Bachelor, Master, Ph.D.
Environmental Control Graduate Certificate
Industrial Design Bachelor
Industrial Engineering Bachelor, Master, Ph.D.
Manufacturing Management Graduate Certificate
Other engineering (biomedical, computer, environmental, geological, ocean, petroleum, agricultural, surveying) Bachelor, Master, Ph.D.
2142. Metallurgical and materials engineers
Engineering Science Bachelor, Master, Ph.D.
Geography Bachelor
Metallurgical Engineering Bachelor, Master, Ph.D.
Metallurgy/Materials Science Bachelor, Master, Ph.D.
Occupations in Engineering

51
Program Degree(s)
2143. Mining engineers
Engineering Science Bachelor, Master, Ph.D.
Mining Engineering Bachelor, Master, Ph.D.
Other engineering (biomedical, computer, environmental, geological, ocean, petroleum, agricultural, surveying) Bachelor, Master, Ph.D.
2144. Geological engineers
Engineering Science Bachelor, Master, Ph.D.
Geographic Information Systems Graduate Certificate
Geographic Information Systems - Cartographic Specialist Graduate Certificate
Geography Bachelor, Master, Ph.D.
Geology and Related Bachelor, Master, Ph.D.
Other engineering (biomedical, computer, environmental, geological, ocean, petroleum, agricultural, surveying) Bachelor, Master, Ph.D.
2145. Petroleum engineers
Bachelor of Applied Technology (Construction and Environment - Regulations and Compliance) Bachelor
Bachelor of Applied Technology (Construction Science and Management) Bachelor
Bachelor of Applied Technology (Integrated Environmental Site Remediation) Bachelor
Engineering Science Bachelor, Master, Ph.D.
Geographic Information Systems Graduate Certificate
Geology and Related Bachelor, Master, Ph.D.
Mining Engineering Bachelor, Master, Ph.D.
Other engineering (biomedical, computer, environmental, geological, ocean, petroleum, agricultural, surveying) Bachelor, Master, Ph.D.
2146. Aerospace engineers
Aeronautical/Aerospace Engineering Bachelor, Master, Ph.D.
Aerospace Sciences Bachelor, Master, Ph.D.
Bachelor of Applied Technology (Flight Program) Bachelor
2148. Other professional engineers, n.e.c.
Bachelor of Applied Technology (Process Automation) Bachelor
Electro Mechanical Design Graduate Certificate
Engineering Science Bachelor, Master, Ph.D.
Other engineering (biomedical, computer, environmental, geological, ocean, petroleum, agricultural, surveying) Bachelor, Master, Ph.D.
Other physics (atomic, chemical, electricity, magnetism, mathematical, mechanics, molecular, nuclear, optics, physical acoustics, physics of fluids, quantitative, quantum mechanics, solid state, theoretical, thermal, thermodynamics and statistical mechanics) Bachelor, Master, Ph.D.
2231. Civil engineering technologists and technicians
Bachelor of Applied Technology (Construction and Environment - Regulations and Compliance) Bachelor
Bachelor of Applied Technology (Construction Science and Management) Bachelor
Civil Engineering Technician Diploma
Civil Engineering Technology Diploma
Construction Engineering Technician Diploma
Construction Engineering Technology Diploma
Construction Techniques Certificate

RESEARCH & INNOVATION JOBS – Opportunities and challenges in the Toronto Region Labour Market52
Program Degree(s)
Engineering General Diploma
Engineering Science Diploma
Technology Foundations Certificate
2232. Mechanical engineering technologists and technicians
Alternative (Sustainable) Energy Engineering Technology Diploma
Auto Body Repair Techniques Certificate
Automation Engineering Technician Diploma
Automation Engineering Technology Diploma
Automation Technician Diploma
Bachelor of Applied Technology (Process Automation) Bachelor
Chemical Production and Power Engineering Technician Diploma
Electromechanical Engineering Technician Diploma
Electromechanical Engineering Technology Diploma
Energy Audit Techniques Certificate
Energy Systems Engineering Technician Diploma
Energy Systems Engineering Technology Diploma
Engineering General Diploma
Engineering Science Diploma
Geomatics Technician Diploma
Heating, Air Conditioning and Refrigeration Techniques Certificate
Heating, Air Conditioning and Refrigeration Technology Diploma
Heating, Refrigeration and Air Conditioning Techniques Certificate
Heating, Refrigeration and Air Conditioning Technician Diploma
Instrumentation Engineering Technician Diploma
Instrumentation Engineering Technology Diploma
Marine Engineering Technology Diploma
Marine Technology - Navigation Diploma
Mechanical Engineering Diploma
Mechanical Engineering Technician Diploma
Mechanical Engineering Technology Diploma
Mechanical Engineering Technology - Tool and Machine Design Diploma
Mechanical Technician Diploma
Mechanical Techniques Certificate
Motive Power Fundamentals Certificate
Motive Power Technician Diploma
Motive Power Techniques - Heavy Equipment Certificate
Motive Power Techniques - Small Powered Equipment Certificate
Stationary Engineering Certificate
Stationary Engineering Technology Diploma
Welding Engineering Technician Diploma
Welding Engineering Technology Diploma

53
Program Degree(s)
2233. Industrial engineering and manufacturing technologists and technicians
Alternative (Sustainable) Energy Engineering Technology Diploma
Bachelor of Applied Technology (Industrial Design) Bachelor
Bachelor of Applied Technology (Industrial Management) Bachelor
Bachelor of Applied Technology (Integrated Advanced Manufacturing) Bachelor
Bachelor of Applied Technology (Integrated Environmental Site Remediation) Bachelor
Blasting Techniques Certificate
Chemical Engineering Technology Diploma
Chemical Production and Power Engineering Technician Diploma
Energy Systems Engineering Technician Diploma
Energy Systems Engineering Technology Diploma
Engineering General Diploma
Engineering Science Diploma
Gas and Oil Burner Technician 2 Certificate
Gas Technician Certificate
Gas Technician 2 Certificate
Geological Engineering Technician Diploma
Geological Engineering Technology Diploma
Geomatics Technician Diploma
Heavy Equipment Operator Certificate
Heavy Equipment Technician Diploma
Industrial Design Diploma
Industrial Engineering Technician Diploma
Industrial Engineering Technology - Management Diploma
Industrial Management Diploma
Instrumentation Engineering Technician Diploma
Instrumentation Engineering Technology Diploma
Machine Shop Certificate
Manufacturing Engineering Technician Diploma
Manufacturing Engineering Technology Diploma
Motive Power Fundamentals Certificate
Motive Power Technician Diploma
Motive Power Techniques - Heavy Equipment Certificate
Motive Power Techniques - Small Powered Equipment Certificate
Plastics Engineering Technology Diploma
Stationary Engineering Certificate
Stationary Engineering Technology Diploma
2241. Electrical and electronics engineering technologists and technicians
Alternative (Sustainable) Energy Engineering Technology Diploma
Chemical Production and Power Engineering Technician Diploma
Electrical Engineering Diploma
Electrical Engineering Technician Diploma
Electrical Engineering Technology Diploma
Electrical Techniques Certificate
Electromechanical Engineering Technician Diploma
Electromechanical Engineering Technology Diploma
Electronics Engineering Technician Diploma

RESEARCH & INNOVATION JOBS – Opportunities and challenges in the Toronto Region Labour Market54
Program Degree(s)
Electronics Engineering Technology Diploma
Electronics Engineering Technology - Communications Diploma
Energy Audit Techniques Certificate
Energy Systems Engineering Technician Diploma
Energy Systems Engineering Technology Diploma
Engineering General Diploma
Engineering Science Diploma
Heating, Air Conditioning and Refrigeration Techniques Certificate
Heating, Air Conditioning and Refrigeration Technology Diploma
Heating, Refrigeration and Air Conditioning Techniques Certificate
Heating, Refrigeration and Air Conditioning Technician Diploma
Photonics Engineering Technician Diploma
Photonics Engineering Technology Diploma
Powerline Technician Diploma
Stationary Engineering Certificate
Stationary Engineering Technology Diploma
Technology Foundations Certificate
2243. Industrial instrument technicians and mechanics
Alternative (Sustainable) Energy Engineering Technology Diploma
Bachelor of Applied Technology (Industrial Design) Bachelor
Bachelor of Applied Technology (Industrial Management) Bachelor
Bachelor of Applied Technology (Integrated Advanced Manufacturing) Bachelor
Bachelor of Applied Technology (Integrated Environmental Site Remediation) Bachelor
Blasting Techniques Certificate
Chemical Engineering Technology Diploma
Chemical Production and Power Engineering Technician Diploma
Energy Systems Engineering Technician Diploma
Energy Systems Engineering Technology Diploma
Engineering General Diploma
Engineering Science Diploma
Gas and Oil Burner Technician 2 Certificate
Gas Technician Certificate
Gas Technician 2 Certificate
Geological Engineering Technician Diploma
Geological Engineering Technology Diploma
Geomatics Technician Diploma
Heavy Equipment Operator Certificate
Heavy Equipment Technician Diploma
Industrial Design Diploma
Industrial Engineering Technician Diploma
Industrial Engineering Technology - Management Diploma
Industrial Management Diploma
Instrumentation Engineering Technician Diploma
Instrumentation Engineering Technology Diploma
Machine Shop Certificate
Manufacturing Engineering Technician Diploma
Manufacturing Engineering Technology Diploma

55
Program Degree(s)
Motive Power Fundamentals Certificate
Motive Power Technician Diploma
Motive Power Techniques - Heavy Equipment Certificate
Motive Power Techniques - Small Powered Equipment Certificate
Plastics Engineering Technology Diploma
Stationary Engineering Certificate
Stationary Engineering Technology Diploma
2244. Aircraft instrument, electrical and avionics mechanics, technicians and inspectors
Air Carrier/Airport Management Technology Diploma
Aircraft Structural Repair Technician Certificate
Alternative (Sustainable) Energy Engineering Technology Diploma
Aviation Engineering Technician Diploma
Aviation Engineering Technology Diploma
Aviation Flight Technology Diploma
Aviation Technician - Aircraft Maintenance Diploma
Aviation Technician - Avionics Maintenance Diploma
Aviation Techniques - Aircraft Maintenance Certificate
Bachelor of Applied Technology (Flight Program) Bachelor
Chemical Production and Power Engineering Technician Diploma
Electrical Engineering Diploma
Electrical Engineering Technician Diploma
Electrical Engineering Technology Diploma
Electrical Techniques Certificate
Electromechanical Engineering Technician Diploma
Electromechanical Engineering Technology Diploma
Electronics Engineering Technician Diploma
Electronics Engineering Technology Diploma
Electronics Engineering Technology - Communications Diploma
Energy Audit Techniques Certificate
Energy Systems Engineering Technician Diploma
Energy Systems Engineering Technology Diploma
Engineering General Diploma
Engineering Science Diploma
Heating, Air Conditioning and Refrigeration Techniques Certificate
Heating, Refrigeration and Air Conditioning Techniques Certificate
Stationary Engineering Certificate
Technology Foundations Certificate
2255. Mapping and related technologists and technicians
Geographic Information Systems Technician Diploma
Geographic Information Systems Technology Diploma
Geography Diploma
Geological Engineering Technician Diploma
Geological Engineering Technology Diploma
Geology and Related Diploma
Geomatics Technician Diploma

RESEARCH & INNOVATION JOBS – Opportunities and challenges in the Toronto Region Labour Market56
Program Degree(s)
2274. Engineer officers, water transport
Automation Engineering Technician Diploma
Automation Engineering Technology Diploma
Automation Technician Diploma
Bachelor of Applied Technology (Process Automation) Bachelor
Electromechanical Engineering Technician Diploma
Electromechanical Engineering Technology Diploma
Energy Systems Engineering Technician Diploma
Energy Systems Engineering Technology Diploma
Engineering General Diploma
Engineering Science Diploma
Heating, Air Conditioning and Refrigeration Technology Diploma
Heating, Refrigeration and Air Conditioning Technician Diploma
Heavy Equipment Technician Diploma
Industrial Engineering Technician Diploma
Industrial Engineering Technology - Management Diploma
Instrumentation Engineering Technician Diploma
Instrumentation Engineering Technology Diploma
Marine Engineering Technology Diploma
Marine Technology - Navigation Diploma
Mechanical Engineering Diploma
Mechanical Technician Diploma
Motive Power Technician Diploma
Product Innovation Technician Diploma
Stationary Engineering Technology Diploma
Welding Engineering Technician Diploma
Welding Engineering Technology Diploma

57
Program Degree(s)
2147. Computer engineers (except software engineers and designers)
Bachelor of Applied Technology (Integrated Telecommunication and Computer Technology) Bachelor
Computer Science Bachelor, Master, Ph.D.
Design/Systems Engineering Bachelor, Master, Ph.D.
Engineering Science Bachelor, Master, Ph.D.
Geographic Information Systems Graduate Certificate
Other engineering (biomedical, computer, environmental, geological, ocean, petroleum, agricultural, surveying) Bachelor, Master, Ph.D.
2171. Information systems analysts and consultants
Bachelor of Applied Information Sciences (Computer and Communication Networking) Bachelor
Bachelor of Applied Information Sciences (Information Systems Security) Bachelor
Bachelor of Applied Information Sciences (Software Systems - Design, Development and Management) Bachelor
Bachelor of Applied Technology (Informatics and Security) Bachelor
Bachelor of Applied Technology (Integrated Telecommunication and Computer Technology) Bachelor
Bachelor of Applied Technology (Software Development) Bachelor
Computer Applications Development Graduate Certificate
Computer Programmer Analyst Diploma
Computer Science Diploma, Bachelor
Computer Systems Technology Diploma
Design/Systems Engineering Bachelor, Master, Ph.D.
Engineering Science Bachelor, Diploma, Master
Enterprise Database Management Graduate Certificate
Geographic Information Systems Graduate Certificate
Information Security Technology Diploma
Information Systems Business Analyst Graduate Certificate
Information Systems Security Graduate Certificate
Internet Management Graduate Certificate
Local Area Network Design and Administration Graduate Certificate
Software Engineering Technician Diploma
Software Engineering Technology Diploma
Telecommunications Technology Diploma
2172. Database analysts and data administrators
Bachelor of Applied Information Sciences (Computer and Communication Networking) Bachelor
Bachelor of Applied Information Sciences (Information Systems Security) Bachelor
Bachelor of Applied Information Sciences (Software Systems - Design, Development and Management) Bachelor
Bachelor of Applied Technology (Informatics and Security) Bachelor
Bachelor of Applied Technology (Integrated Telecommunication and Computer Technology) Bachelor
Bachelor of Applied Technology (Software Development) Bachelor
Occupations in Information Technology

RESEARCH & INNOVATION JOBS – Opportunities and challenges in the Toronto Region Labour Market58
Program Degree(s)
Computer Engineering Technician Diploma
Computer Engineering Technology Diploma
Computer Networking and Technical Support Diploma
Computer Programmer Diploma
Computer Programmer Analyst Diploma
Computer Science Bachelor, Master, Ph.D.
Computer Systems Technician Diploma
Computer Systems Technology Diploma
Design/Systems Engineering Bachelor, Master, Ph.D.
Engineering General Diploma
Engineering Science Bachelor, Diploma, Master
Enterprise Database Management Graduate Certificate
Geographic Information Systems Graduate Certificate
Information Security Technology Diploma
Information Systems Business Analyst Graduate Certificate
Information Systems Security Graduate Certificate
Internet Management Graduate Certificate
Local Area Network Design and Administration Graduate Certificate
Other engineering (biomedical, computer, environmental, geological, ocean, petroleum, agricultural, surveying) Bachelor, Master, Ph.D.
Software Engineering Technician Diploma
Software Engineering Technology Diploma
Technology of Website Development Diploma
Website Management Graduate Certificate
2173. Software engineers and designers
Bachelor of Applied Information Sciences (Computer and Communication Networking) Bachelor
Bachelor of Applied Information Sciences (Information Systems Security) Bachelor
Bachelor of Applied Information Sciences (Software Systems - Design, Development and Management) Bachelor
Bachelor of Applied Technology (Informatics and Security) Bachelor
Bachelor of Applied Technology (Integrated Telecommunication and Computer Technology) Bachelor
Bachelor of Applied Technology (Software Development) Bachelor
Computer Applications Development Graduate Certificate
Computer Networking and Technical Support Diploma
Computer Science Bachelor, Master, Ph.D.
Design/Systems Engineering Bachelor, Master, Ph.D.
Engineering General Diploma
Engineering Science Bachelor, Diploma, Master
Game Design and Development Diploma
Game Development Diploma
Game Programming Diploma
Geographic Information Systems Graduate Certificate
Geographic Information Systems Technician Diploma

59
Program Degree(s)
Information Security Technology Diploma
Information Systems Business Analyst Graduate Certificate
Information Systems Security Graduate Certificate
Internet Management Graduate Certificate
Local Area Network Design and Administration Graduate Certificate
Other engineering (biomedical, computer, environmental, geological, ocean, petroleum, agricultural, surveying) Bachelor, Master, Ph.D.
Software Engineering Technician Diploma
Software Engineering Technology Diploma
Technology of Website Development Diploma
Website Management Graduate Certificate
Wireless Telecommunications Graduate Certificate
Wireless/Mobility Telecommunications Engineering Technician Diploma
2174. Computer programmers and interactive media developers
Bachelor of Applied Information Sciences (Computer and Communication Networking) Bachelor
Bachelor of Applied Information Sciences (Information Systems Security) Bachelor
Bachelor of Applied Information Sciences (Software Systems - Design, Development and Management) Bachelor
Bachelor of Applied Technology (Informatics and Security) Bachelor
Bachelor of Applied Technology (Integrated Telecommunication and Computer Technology) Bachelor
Bachelor of Applied Technology (Software Development) Bachelor
Computer Animation Graduate Certificate
Computer Applications Development Graduate Certificate
Computer Applications Support Certificate
Computer Engineering Technician Diploma
Computer Engineering Technology Diploma
Computer Foundations Certificate
Computer Graphics Graduate Certificate
Computer Network Security Certificate
Computer Networking and Technical Support Diploma
Computer Operator Certificate
Computer Programmer Diploma
Computer Programmer Analyst Diploma
Computer Repair and Maintenance Certificate
Computer Science Bachelor, Master, Ph.D.
Computer Systems Technician Diploma
Computer Systems Technology Diploma
Computer Technical Support Certificate
Design/Systems Engineering Bachelor, Master, Ph.D.
Engineering Science Bachelor, Master, Ph.D.
Game Design and Development Diploma
Game Development Diploma
Game Programming Diploma

RESEARCH & INNOVATION JOBS – Opportunities and challenges in the Toronto Region Labour Market60
Program Degree(s)
Geographic Information Systems Graduate Certificate
Geographic Information Systems - Cartographic Specialist Graduate Certificate
Industrial Design Bachelor, Diploma
Information Security Technology Diploma
Information Systems Business Analyst Graduate Certificate
Information Systems Security Graduate Certificate
Internet Management Graduate Certificate
Internet Website Development Certificate
Local Area Network Design and Administration Graduate Certificate
Microcomputer Support Services Certificate
Other engineering (biomedical, computer, environmental, geological, ocean, petroleum, agricultural, surveying) Bachelor, Master, Ph.D.
Software Engineering Technician Diploma
Software Engineering Technology Diploma
Technology of Website Development Diploma
Telecommunications Technology Diploma
Website Management Graduate Certificate
Wireless Telecommunications Graduate Certificate
Wireless/Mobility Telecommunications Engineering Technician Diploma
2175. Web designers and developers
Bachelor of Applied Information Sciences (Computer and Communication Networking) Bachelor
Bachelor of Applied Information Sciences (Information Systems Security) Bachelor
Bachelor of Applied Information Sciences (Software Systems - Design, Development and Management) Bachelor
Bachelor of Applied Technology (Integrated Telecommunication and Computer Technology) Bachelor
Building Systems Engineering Technician Diploma
Computer Applications Support Certificate
Computer Engineering Technician Diploma
Computer Engineering Technology Diploma
Computer Foundations Certificate
Computer Network Security Certificate
Computer Networking and Technical Support Diploma
Computer Operator Certificate
Computer Programmer Diploma
Computer Programmer Analyst Diploma
Computer Repair and Maintenance Certificate
Computer Science Diploma
Computer Systems Technician Diploma
Computer Systems Technology Diploma
Computer Technical Support Certificate
Engineering General Diploma
Engineering Science Diploma
Internet Website Development Certificate
Technology of Website Development Diploma
Telecommunications Technology Diploma
Wireless/Mobility Telecommunications Engineering Technician Diploma
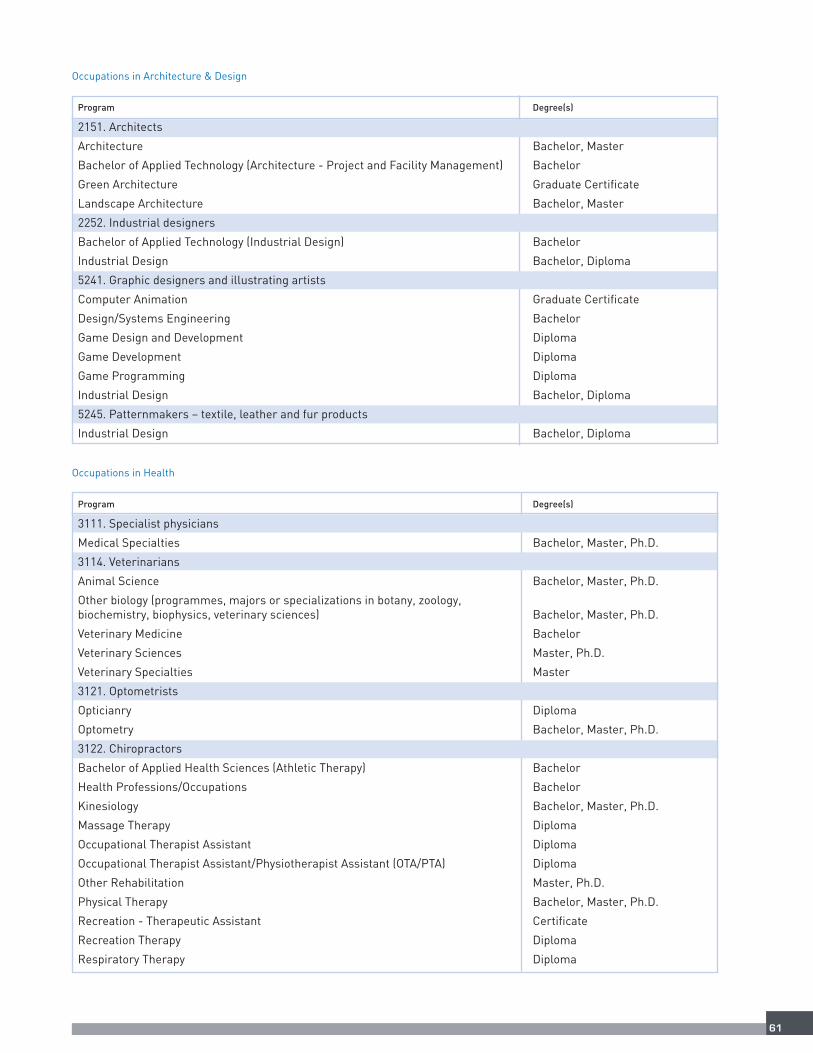
61
Program Degree(s)
2151. Architects
Architecture Bachelor, Master
Bachelor of Applied Technology (Architecture - Project and Facility Management) Bachelor
Green Architecture Graduate Certificate
Landscape Architecture Bachelor, Master
2252. Industrial designers
Bachelor of Applied Technology (Industrial Design) Bachelor
Industrial Design Bachelor, Diploma
5241. Graphic designers and illustrating artists
Computer Animation Graduate Certificate
Design/Systems Engineering Bachelor
Game Design and Development Diploma
Game Development Diploma
Game Programming Diploma
Industrial Design Bachelor, Diploma
5245. Patternmakers – textile, leather and fur products
Industrial Design Bachelor, Diploma
Occupations in Architecture & Design
Program Degree(s)
3111. Specialist physicians
Medical Specialties Bachelor, Master, Ph.D.
3114. Veterinarians
Animal Science Bachelor, Master, Ph.D.
Other biology (programmes, majors or specializations in botany, zoology, biochemistry, biophysics, veterinary sciences) Bachelor, Master, Ph.D.
Veterinary Medicine Bachelor
Veterinary Sciences Master, Ph.D.
Veterinary Specialties Master
3121. Optometrists
Opticianry Diploma
Optometry Bachelor, Master, Ph.D.
3122. Chiropractors
Bachelor of Applied Health Sciences (Athletic Therapy) Bachelor
Health Professions/Occupations Bachelor
Kinesiology Bachelor, Master, Ph.D.
Massage Therapy Diploma
Occupational Therapist Assistant Diploma
Occupational Therapist Assistant/Physiotherapist Assistant (OTA/PTA) Diploma
Other Rehabilitation Master, Ph.D.
Physical Therapy Bachelor, Master, Ph.D.
Recreation - Therapeutic Assistant Certificate
Recreation Therapy Diploma
Respiratory Therapy Diploma
Occupations in Health

RESEARCH & INNOVATION JOBS – Opportunities and challenges in the Toronto Region Labour Market62
Program Degree(s)
3123. Other professional occupations in health diagnosing and treating
Clinical Methods in Orthotics/Prosthetics Graduate Certificate
Health Professions/Occupations Bachelor
Immunology Bachelor, Master, Ph.D.
Other basic sciences (medical toxicology) Bachelor, Master, Ph.D.
Other health professions and occupations (art as applied to medicine, dental hygiene) Bachelor, Master, Ph.D.
Pathology Master, Ph.D.
Physiology Bachelor, Master, Ph.D.
Toxicology Bachelor
3131. Pharmacists
Pharmacology Bachelor, Master, Ph.D.
Pharmacy Bachelor, Master, Ph.D.
3132. Dietitians and nutritionists
Diabetes Education Graduate Certificate
Exercise Science and Lifestyle Management Graduate Certificate
Wellness and Lifestyle Management Graduate Certificate
3141. Audiologists and speech-language pathologists
Aural/Oral Rehabilitation Master, Ph.D.
Other health professions and occupations (art as applied to medicine, dental hygiene) Bachelor, Master, Ph.D.
3142. Physiotherapists
Bachelor of Applied Health Sciences (Athletic Therapy) Bachelor
Health Professions/Occupations Bachelor
Kinesiology Bachelor, Master, Ph.D.
Occupational Therapy Master
Other health professions and occupations (art as applied to medicine, dental hygiene) Bachelor, Master, Ph.D.
Other Rehabilitation Master, Ph.D.
Physical Therapy Bachelor, Master, Ph.D.
3152. Registered nurses
Advanced Care Paramedic Graduate Certificate
Anesthesia Assistant Graduate Certificate
Clinical Research Graduate Certificate
Complementary Care Graduate Certificate
Indigenous Community Health Approaches (Enionkwatakariteke) Graduate Certificate
Nursing Bachelor, Diploma, Master, Ph.D.
Orientation to Nursing in Ontario for Nurses Graduate Certificate
Practical Nursing Diploma
Registered Nurse - Critical Care Nursing Graduate Certificate
Registered Nurse - Emergency Nursing Graduate Certificate
Registered Nurse - Occupational Health Nursing Graduate Certificate
Registered Nurse - Oncology Nursing Graduate Certificate
Registered Nurse - Operating Room Graduate Certificate
Registered Nurse - Perinatal Nursing Graduate Certificate
Registered Nurse - Refresher Graduate Certificate
Registered Practical Nurse - Administration of Medications Graduate Certificate

63
Program Degree(s)
Registered Practical Nurse - Operating Room Graduate Certificate
Registered Practical Nurse - Psychiatric Nursing Graduate Certificate
3211. Medical laboratory technologists and pathologists' assistants
Activation Co-ordinator/Gerontology Diploma
Bachelor of Applied Health Sciences (Athletic Therapy) Bachelor
Bachelor of Applied Health Sciences (Health Informatics Management) Bachelor
Bachelor of Applied Technology (Biotechnology) Bachelor
Bio-food Technician Diploma
Bio-food Technology Diploma
Biomedical Engineering Technology Diploma
Biotechnology Technician Diploma
Biotechnology Technologist Diploma
Chemical Engineering Technology Diploma
Environmental Biology Technology Diploma
Laboratory Assistant Certificate
Nursing Diploma
Orientation to Nursing in Ontario for Practical Nurses Certificate
Other biology (programmes, majors or specializations in botany, zoology, biochemistry, biophysics, veterinary sciences) Diploma
Other health professions and occupations (art as applied to medicine, dental hygiene) Diploma
Other Paraclinical Sciences Diploma
Personal Support Worker Certificate
Plant Science Diploma
Practical Nursing Diploma
Preparatory Health Sciences Certificate
3213. Veterinary and animal health technologists and technicians
Animal Care Certificate
Other biology (programmes, majors or specializations in botany, zoology, biochemistry, biophysics, veterinary sciences) Diploma
Veterinary Medicine Diploma
Veterinary Technician Diploma
Veterinary Technology Diploma
3214. Respiratory therapists, clinical perfusionists and cardiopulmonary technologists
Nursing Diploma
Orientation to Nursing in Ontario for Practical Nurses Certificate
Personal Support Worker Certificate
Practical Nursing Diploma
3215. Medical radiation technologists
Other health professions and occupations (art as applied to medicine, dental hygiene) Diploma
Radiation Safety Certificate
3216. Medical sonographers
Diagnostic Cardiac Sonography Graduate Certificate
Medical Diagnostic - Ultrasonography Graduate Certificate
Other health professions and occupations (art as applied to medicine, dental hygiene) Diploma

RESEARCH & INNOVATION JOBS – Opportunities and challenges in the Toronto Region Labour Market64
Program Degree(s)
3218. Electroencephalographic and other diagnostic technologists, n.e.c.
Other health professions and occupations (art as applied to medicine, dental hygiene) Diploma
3219. Other medical technologists and technicians (except dental health)
Activation Co-ordinator/Gerontology Diploma
Bachelor of Applied Health Sciences (Athletic Therapy) Bachelor
Bachelor of Applied Health Sciences (Health Informatics Management) Bachelor
Bachelor of Applied Technology (Biotechnology) Bachelor
Bio-food Technician Diploma
Bio-food Technology Diploma
Biomedical Engineering Technology Diploma
Biotechnology Technician Diploma
Biotechnology Technologist Diploma
Environmental Biology Technology Diploma
Laboratory Assistant Certificate
Other biology (programmes, majors or specializations in botany, zoology, biochemistry, biophysics, veterinary sciences) Diploma
Other health professions and occupations (art as applied to medicine, dental hygiene) Diploma
Other Paraclinical Sciences Diploma
Plant Science Diploma
Preparatory Health Sciences Certificate

65
END NOTES1 “Research”. 2011. In Merriam-Webster.com. Retrieved July 8, 2011, from http://www.merriam-webster.com/dictionary/research.
2 Stokes, Donald, Pasteur's Quadrant - Basic Science and Technological Innovation, Brookings Institution Press, 1997.
3 Jindrick, Jim, “10 Thoughts About Innovation“. In On Innovation: The Best of IEEE-USA Today’s Engineer IEEE-USA, 2007:pg. 37-38.
4 OECD Territorial Reviews – Toronto, Canada 2009.
5 2011 Deloitte Technology Fast 50. The Globe and Mail, October 19, 2011. From: http://www.theglobeandmail.com/report-on-business/small-business/sb-money/valuation/canadas-50-fastest-growing-technology-companies/article2194884/(Accessed on October 19, 2011).
6 Toronto Region Research Alliance 2011. “Strategic sectors study – Phase I: Location quotients”.http://www.trra.ca/en/reports/resources/Phase1-StrategicSectors-Nov2011.pdf (Accessed on January 10, 2012).
7 Statistics Canada. Business Register, June 2010.
8 Statistics Canada, Labour Market Survey, Custom Tabulation 2011.
9 Statistics Canada - 2006 Census. Catalogue Number 97-559-XCB2006011. Accessed on November 17, 2011. (Occupation -National Occupational Classification for Statistics 2006) Note: The numbers shown in this study are the result ofaggregating the values for the following Census Metropolitan Areas: Toronto CMA, Hamilton CMA and Kitchener CMA.
10 The National Occupational Classification (NOC) 2006 was developed by Human Resources and Skills DevelopmentCanada in collaboration with Statistics Canada. From http://www.hrsdc.gc.ca/eng/workplaceskills/noc/index.shtml[Accessed on January 4, 2012].
11 Postsecondary Finance & Information Management Branch, University Finance Unit. Ministry of Training, Colleges andUniversities.
12 Graduation data from the Toronto Region colleges was provided by Ministry of Training, Colleges and Universities –Graduate Outcomes Surveys.
13 ERI Economic Research Institute, “The Salary Assessor® & Survey Software and Databases”, 2011, fromhttp://www.erieri.com/index.cfm?fuseaction=Home.Methodologies&M=SA.
14 Toronto Region Research Alliance 2011. Research & Innovation Jobs project: Definitions and occupations of interest.http://www.trra.ca/en/about/resources/TRRAResearchandInnovationJobsProject-DefinitionsandOccupationsJuly2011.pdf(Accessed on August 10, 2011).
15 Personal communication with Niall Wallace – CEO, Infonaut. August 10, 2011.
16 Personal communication with Dave Dobbin – CEO, Mobility. October 27, 2011.
17 Personal communication with David Findlay – Director of Sales, Toronto Region Research Alliance. December 12, 2011.
18 Bay Area. In Wikipedia. http://en.wikipedia.org/wiki/San_Francisco_Bay_Area (Accessed in August 2011).
19 Website of the Metropolitan Area Planning Council. http://www.mapc.org/ (Accessed in July 2011).
20 Population density in Greater Boston. In Wikipedia. http://en.wikipedia.org/wiki/Greater_Boston (Accessed in July 2011).
21 Greater Helsinki. In Wikipedia. http://en.wikipedia.org/wiki/Greater_Helsinki (Accessed in July 2011).
22 Israel. In Wikipedia. http://en.wikipedia.org/wiki/Israel (Accessed in July 2011).
23 Seoul. In Wikipedia. http://en.wikipedia.org/wiki/Seoul (Accessed in February 2012).
24 Singapore. In Wikipedia. http://en.wikipedia.org/wiki/Singapore (Accessed in July 2011).
25 Sydney. In Wikipedia. http://en.wikipedia.org/wiki/Sydney (Accessed in July 2011).
26 Greater Toronto Area. In Wikipedia. http://en.wikipedia.org/wiki/Greater_Toronto_Area (Accessed in January 2012).
27 Municipality of Waterloo. In Wikipedia. http://en.wikipedia.org/wiki/Regional_Municipality_of_Waterloo (Accessed inJanuary 2012).
28 Wellington County. In Wikipedia. http://en.wikipedia.org/wiki/Wellington_County,_Ontario (Accessed in January 2012).

RESEARCH & INNOVATION JOBS – Opportunities and challenges in the Toronto Region Labour Market66
29 Hamilton, Ontario. In Wikipedia. http://en.wikipedia.org/wiki/Hamilton,_Ontario (Accessed in January 2012).
30 Zurich Metropolitan Area. In Wikipedia. http://en.wikipedia.org/wiki/Zurich_metropolitan_area (Accessed in July 2011).
31 Markey HT (1975), “Special Problems in Patent Cases”. Foundation for Research Development 66, 529.
32 Institute for Prospective Technological Studies (2009), The 2009 EU Industrial R&D Investment Scoreboard.http://iri.jrc.es/research/scoreboard_2009.htm.
33 Corporate Invention Board (2010) Corporate Rankings. Available fromhttp://www.corporateinventionboard.eu/en/corporate-rankings.
34 Lemley MA (2001), “Rational Ignorance at the Patent Office”. Northwestern University Law Review, Vol. 95, No. 4.Available at doi:10.2139/ssrn.261400 SSRN.com.
35 Banta DH (2001), “Worldwide Interest in Global Access to Drugs”. Journal of the American Medical Association 285 (22):2844–46. doi:10.1001/jama.285.22.2844. PMID 11401589.
36 Ferreira L (2002), “Access to Affordable HIV/AIDS Drugs: The Human Rights Obligations of Multinational PharmaceuticalCorporations”. Fordham Law Review 71 (3): 1133–79. PMID 12523370.
37 Schaaber J (2010), “Misguided Research”. http://www.inwent.org/ez/articles/182681/index.en.shtml.
38 Ghafele R (2008), “Perceptions of Intellectual property: A Review”. London: Intellectual Property Institute. http://www.ip-institute.org.uk/pdfs/Perceptions%20of%20IP.pdf.
39 Harzing AW (2007), Publish or Perish. Available from http://www.harzing.com/pop.htm.
40 Website of Stanford University. http://www.stanford.edu/ (Accessed on January 9, 2012).
41 Website of University of California, Berkeley. http://berkeley.edu/ (Accessed on January 9, 2012).
42 Website of University of California, San Francisco. http://www.ucsf.edu/about/about-ucsf (Accessed on January 9, 2012).
43 Website of Harvard University. http://www.provost.harvard.edu/institutional_research/harvard_fact_book_2010-11_web.pdf (Accessed on January 9, 2012).
44 Website of Massachusetts Institute of Technology. http://web.mit.edu/facts/faculty.html (Accessed on January 9, 2012).
45 Website of Boston University. http://www.bu.edu/oir/files/2011/05/G3b-Fact-Sheet-FY2011.pdf (Accessed on January 9, 2012).
46 Website of University of Helsinki. http://www.helsinki.fi/inbrief/2009/basic_facts.html (Accessed on January 10, 2012).
47 Website of Aalto University. https://into.aalto.fi/display/enaalto/Key+Facts (Accessed on January 10, 2012).
48 Website of Aalto University - Key facts 2011. http://www.aalto.fi/en/about/Aalto_slides_EN_20110929.pdf (Accessed onJanuary 10, 2012).
49 Electronic message from Rita Rekonen - “Policy and Foresight”, Aalto University. Received on November 9, 2012.
50 Website of Hanken School of Economics. http://issuu.com/hanken/docs/hanken_annual_report2010 (Accessed onJanuary 10, 2012).
51 Website of Weizmann Institute of Science. http://www.weizmann.ac.il/pages/facts-and-figures (Accessed on January 10,2012).
52 Website of Tel Aviv University. http://www.tau.ac.il/about-eng.html (Accessed on January 10, 2012).
53 Website of University of Haifa. http://www.haifa.ac.il/ (Accessed on January 10, 2012).
54 Website of Seoul National University. http://www.useoul.edu/about/ab0103.jsp (Accessed on January 11, 2012).
55 Website of Yonsei University. http://www.yonsei.ac.kr/eng/about/stats/vital/ (Accessed on January 11, 2012).
56 Website of Hanyang University. http://www.hanyang.ac.kr/english/ (Accessed on January 11, 2012).
57 Website of National University of Singapore. http://www.nus.edu.sg/aboutus/factsfigures.php (Accessed on January 11, 2012).
58 Website of Nanyang Technological University. http://www.ntu.edu.sg/AboutNTU/NTUataglance/Pages/Ourhistory.aspx(Accessed on January 11, 2012).
59 Website of Singapore Management University. http://www.smu.edu.sg/ (Accessed on January 11, 2012).

67
60 Website of University of Sydney, Australia. http://sydney.edu.au/about/profile/facts_figures.shtml (Accessed on January 11, 2012).
61 Website of University of Technology, Sydney, Australia. http://www.uts.edu.au/ (Accessed on January 11, 2012).
62 Website of University of New South Wales, Australia. http://www.unsw.edu.au/about/pad/aboutfacts.html (Accessed onJanuary 12, 2012).
63 Website of University of Toronto. http://www.utoronto.ca/about-uoft/quickfacts.htm (Accessed on January 12, 2012).
64 Website of University of Toronto - Facts Report.http://www.utoronto.ca/__shared/assets/UofT_2010_FactsFiguresReport_D4320.pdf (Accessed on January 12, 2012).
65 Website of York University. http://www.yorku.ca/factbook/factbook.asp?Year=2010+-+2011 (Accessed on January 12, 2012).
66 Website of McMaster University. http://mcmaster.ca/avpira/documents/factbook/FactBook20102011.pdf (Accessed onJanuary 12, 2012).
67 Website of Swiss Federal Institute of Technology Zurich.http://www.ethz.ch/about/publications/annualreports/eth_jahresbericht_2010_en.pdf (Accessed on January 12, 2012).
68 Website of University of Zurich. http://www.uzh.ch/about/portrait/figures_en.html (Accessed on January 12, 2012).
69 Website of Zurich University of Applied Sciences. http://www.zhaw.ch/en/zurich-university-of-applied-sciences/about-the-zhaw/facts-and-figures.html (Accessed on January 12, 2012).

RESEARCH & INNOVATION JOBS – Opportunities and challenges in the Toronto Region Labour Market68
Copyright
All information in this publication is protected by copyright, pursuant to Canadian copyright laws, internationalconventions, and other copyright laws. All rights reserved. Any reproduction, modification, publication,transmission, transfer, sale, distribution, display or exploitation of the information, in any form or by anymeans, or its storage in a retrieval system, whether in whole or in part, without the express written permissionof the Toronto Region Research Alliance is prohibited.
Disclaimer
While efforts have been made to verify the accuracy of the information contained in this publication, neither theauthors nor TRRA make any representations or warranty, express or implied, including without limitations, asto the quality and merchantability and fitness for use of any material contained in this document. Theinformation is provided “As Is” and TRRA cannot warrant that any of the materials posted will be accurate andup to date at any particular point in time.
Proprietary information of others is used by permission and may have further use restricted as noted.References to any items supplied or manufactured by a third party does not constitute endorsement by TRRA ofthose items. References or links to websites belonging to entities other than TRRA are provided forinformational purposes and do not constitute either implied or expressed endorsement by TRRA of thematerials posted on those websites.
How to cite this report
Martinez Fonte, L., Draper P., Chau, P.K., Norman, K., Yoo, N., Chan, J. Research & Innovation Jobs -Opportunities and challenges in the Toronto Region Labour Market. Report sponsored by Employment Ontario,the Government of Canada, University of Toronto and TD Bank Group. Toronto Region Research Alliance.February 2012, 72 pages. (http://www.trra.ca/RIjobs)

TRRA is committed to reducing its environmentalimpact through the increased use of certifiedenvironmental processes and products.
This paper contains FSC certified fibre and 10% post-consumer recycled fibre. The pulp bleaching processis ECF (elemental chlorine free). The report is 100%recyclable.
FSCLogo

Toronto Region Research Alliance
20 Bay Street, Suite 1100Toronto, ON M5J 2N8
Tel 416 673 6670Fax 416 673 6671Email [email protected]
Visit us at www.trra.caFollow us @torontoresearch
© 2012 Toronto Region Research Alliance