Embed Size (px)
Citation preview

Research Consortium on Educational Outcomes
and Poverty
(RECOUP)International Director – Professor Christopher Colclough

• Centre for Commonwealth Education, University of Cambridge – lead partner
• School of Social and Political Studies, University of Edinburgh
• Centre for the Study of African Economies (CSAE), University of Oxford
• Collaborative Research and Dissemination (CORD), New Delhi, India
• Mahbub Ul Haq Human Development Centre, Islamabad, Pakistan
• Associates for Change, Accra, Ghana
• Kenyatta University, Nairobi, Kenya
Partners:

•To understand what explains the relationships between education and poverty
•To understand how better outcomes of education can best be promoted
•To elucidate how educational policy can be optimised to help achieve social and economic transformation
Research Objectives
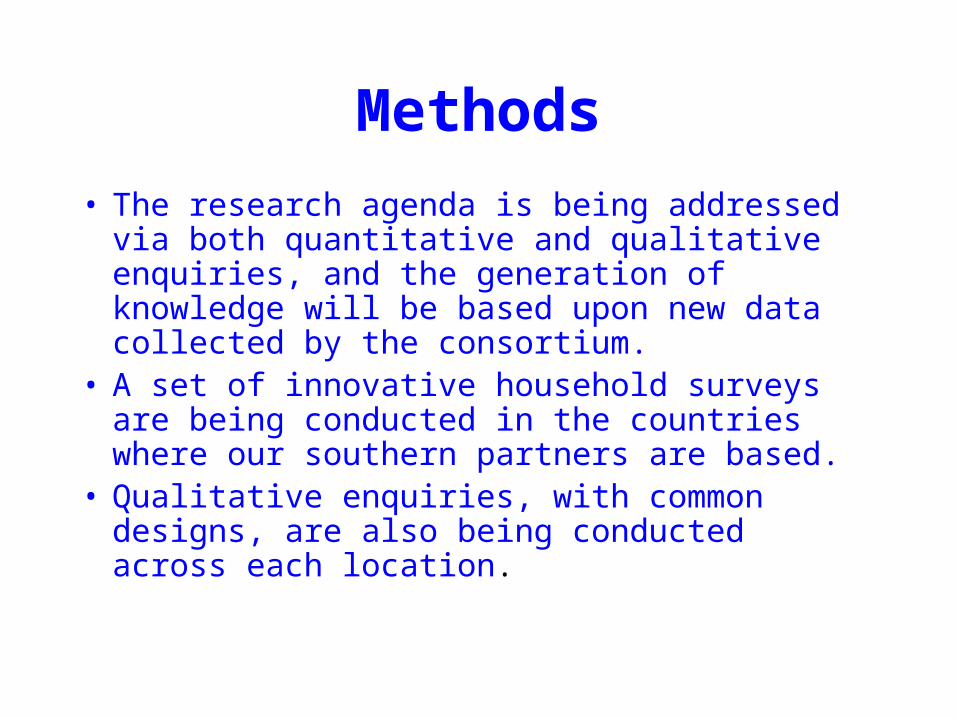
Methods
• The research agenda is being addressed via both quantitative and qualitative enquiries, and the generation of knowledge will be based upon new data collected by the consortium.
• A set of innovative household surveys are being conducted in the countries where our southern partners are based.
• Qualitative enquiries, with common designs, are also being conducted across each location.

• Social and human development outcomes of education• Disability and poverty study
• Health and fertility study
• Youth gender and citizenship study
• Education and market outcomes• Skill acquisition and its impact on livelihoods
• Outcomes from different national and international partnerships• Outcomes of Public private partnerships
• Aid partnerships and educational outcomes
Themes and Projects

Does more money for education help the poor?
-Education and income – which way do the linkages go
-Educational expenditures and outcomes
-Education and its returns
-National and International Policies
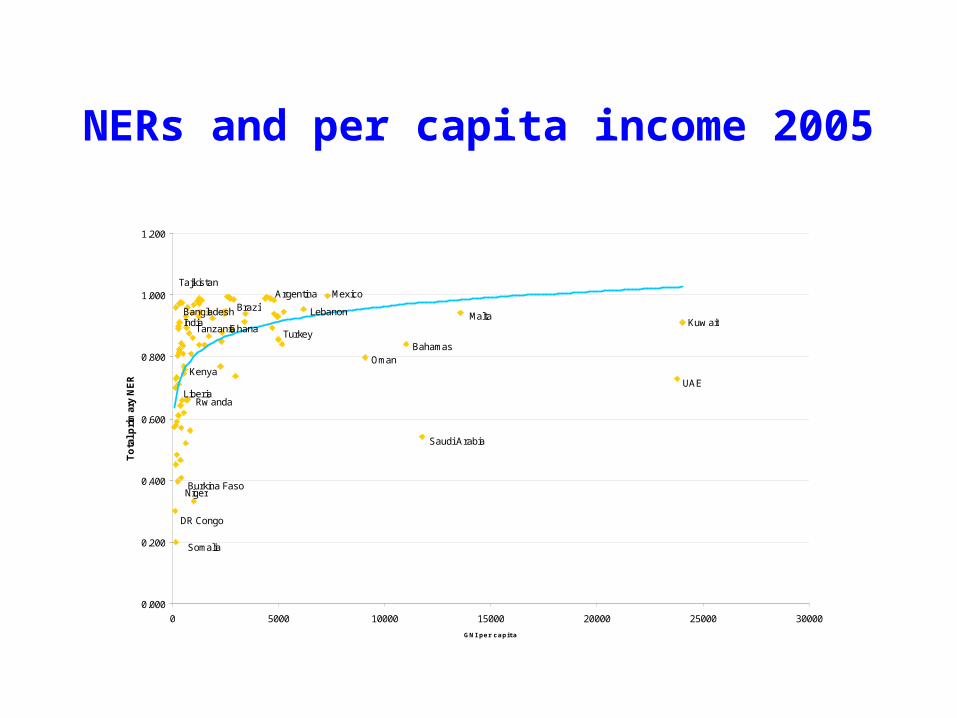
0.000
0.200
0.400
0.600
0.800
1.000
1.200
0 5000 10000 15000 20000 25000 30000
GNI per capita
To
tal p
rim
ary
NE
R
MaltaKuw ait
UAE
Saudi Arabia
BahamasOman
Mexico
Lebanon
TajikistanArgentina
Brazil
TanzaniaIndia
Somalia
DR Congo
NigerBurkina Faso
Liberia
Bangladesh
Ghana
Rw anda
Kenya
Turkey
NERs and per capita income 2005

Links between Expenditures, Enrolments and Unit Costs
E = (Xg + Xp)/ C
Where E = Enrolments
Xg= Public spending on Education
Xp= Private spending on Education
C = Costs per student
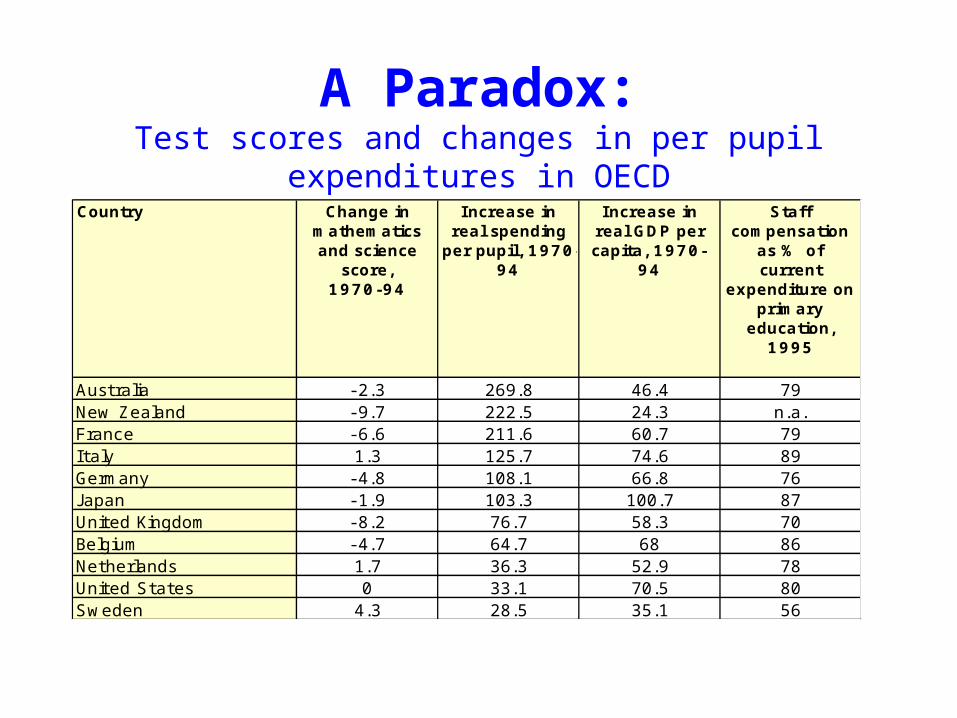
Country Change in mathematics and science
score, 1970-94
Increase in real spending
per pupil, 1970-94
Increase in real GDP per capita, 1970-
94
Staff compensation
as % of current
expenditure on primary
education, 1995
Australia - 2.3 269.8 46.4 79New Zealand - 9.7 222.5 24.3 n.a.France - 6.6 211.6 60.7 79Italy 1.3 125.7 74.6 89Germany - 4.8 108.1 66.8 76J apan - 1.9 103.3 100.7 87United Kingdom - 8.2 76.7 58.3 70Belgium - 4.7 64.7 68 86Netherlands 1.7 36.3 52.9 78United States 0 33.1 70.5 80Sweden 4.3 28.5 35.1 56
A Paradox:Test scores and changes in per pupil
expenditures in OECD

Argentina
Brazil
Chile
Indonesia
Peru
AustraliaAustria
Belgium
Canada
Czech Rep.Denmark
Finland
France
Germany
Greece
Hungary
Ireland
Italy
JapanRep. of Korea
Mexico
Norway
PolandPortugal
Spain
SwedenUK
USA
300
350
400
450
500
550
600
0 10 000 20 000 30 000 40 000 50 000 60 000 70 000 80 000 90 000
Cumulative education expenditure per pupil (PPP US$)
Av
era
ge
co
mb
ine
d li
tera
cy
sc
ore
Students in countries that invest more in education tend to have better literacy skills. In high-income states, the
impact of additional resources is less clear
National resources: finance and quality

Only one-third of students reach last grade of primary education where pupil/teacher ratios are high
Iraq
Mauritania
Cambodia
Bolivia
Colombia
Cuba
GuatemalaNicaragua
Bangladesh
India
Burkina Faso
Chad
Ethiopia
LesothoMadagascar
MalawiMozambique
Niger
Senegal
South Africa
0
10
20
30
40
50
60
70
80
30 40 50 60 70 80 90 100
Survival to last grade (%)
PT
R
Primary education: pupil/teacher ratios and survival to the last grade, 2001
Survival in school and PTR

Relationship between GER and teacher salary

Study Country Cohort
% that has ever enrolled
(ages 6-14)
% that survived to
grade 5
% that achieved minimum mastery
NER in primary for the period before the test
SACMEQ Malawi 100 91 31 7 69(1995) Mauritius 100 99 98 52 99
Grade 6 Reading testNamibia 100 97 74 19 84U. R.Tanzania 100 87 70 18 54
PIRLS (2001) Colombia 100 98 60 27 87Grade 4 Reading testMorocco 100 99 77 59 81
PASEC Burkina Faso 100 35 25 21 28(mid 1990s) Cameroon 100 88 45 33 73Grade 5 French test Côte d’Ivoire 100 65 45 38 49
Guinea 100 48 32 21 36Madagascar 100 78 31 20 63Senegal 100 48 42 25 51Togo 100 82 49 40 66
Quantitative versus qualitative indicators of participation in primary schooling
Measuring Quantity is insufficient

• The case thus far:• Ed is productive so it helps growth• Ed at all levels brings personal returns,
and highest at prim. Balance needed, but even primary level helps all society and directly helps the poor
• Non-market effects and externalities (literacy, numeracy, health and fertility behaviour) are delivered even by primary and particularly for girls
• So UPE is a pro-poor, pro-growth strategy
Growth, Skills and Education

• Evidence that private returns to sec/higher ed are increasing, and often greater than those at primary
• Evidence that some behavioural changes are increasingly associated with secondary
• Why? Supply-side changes in quantity and quality reduce returns at primary and increase returns at higher levels
Do changes to the pattern of returns change the earlier
logic?
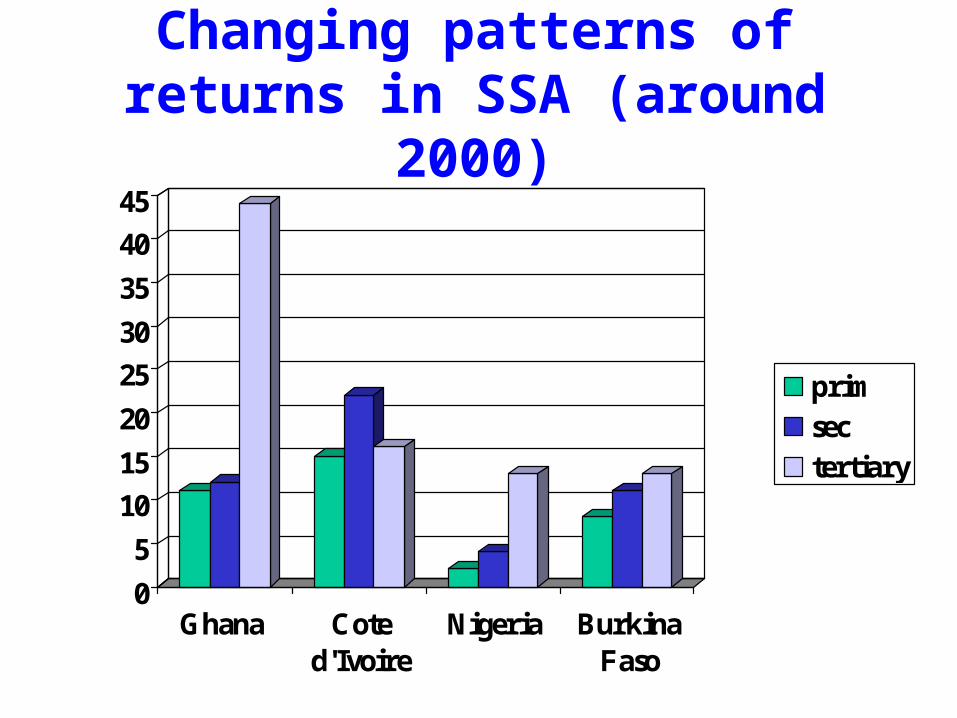
0
5
10
15
20
25
30
35
40
45
Ghana Coted'Ivoire
Nigeria BurkinaFaso
primsectertiary
Changing patterns of returns in SSA (around 2000)

Literacy rate of 22 to 44 year-olds in Central African Republic, according
to years of schooling (2000)

Personal Earnings
concave
convex
S1 S2 S3 S4 Years of Schooling
Possible relationships between schooling and
earningsPositive returns to primary mean that primary schooling reduces poverty and supports growth.

• High sec/tertiary returns may imply under-expansion and skill constraint. Increased supply may boost production and employment, thereby increasing opportunities for the poor. Balance obviously required
• Emphasis on quantity will not solve the quality crisis • True returns depend on costs, which are tiny for
primary, very high for tertiary. Most data cover only the wage-employed. Returns in self-employment may be different, and higher for primary.
• Where returns to primary remain positive, priority for EFA/primary remains necessary on poverty and growth grounds. Some obsolescence over time, but human capital, once given to the poor, cannot be taken away. Its advantage is there for life
• The rights case remains fundamental
Policy Choices in Education

• Aid to basic ed doubled from $2.2 to $4.4bn, 2000-’04. But this was 1/3 of projected additional needs.
• Slow start means that an additional $10bn now needed annually to 2015
• Gleneagles promised an extra $50bn total by 2010, of which $10bn to education
• DFID will increase aid to ed from £0.5 to £1bn by 2010. This doubling over 4yrs is the scaling-up problem
Does Aid to Education Help the Poor?
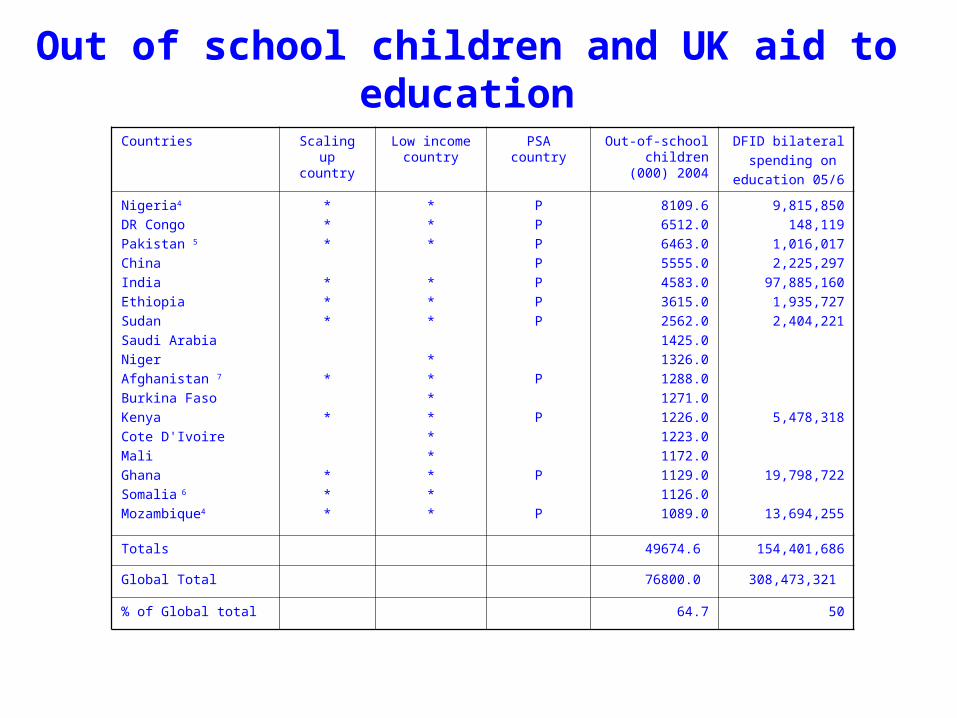
Countries Scaling up country
Low income country
PSA country Out-of-school children (000)
2004
DFID bilateralspending on
education 05/6
Nigeria4
DR CongoPakistan 5 ChinaIndiaEthiopiaSudanSaudi ArabiaNigerAfghanistan 7
Burkina FasoKenyaCote D'IvoireMaliGhanaSomalia 6
Mozambique4
*** *** * * ***
*** *** *********
PPPPPPP P P P P
8109.66512.06463.05555.04583.03615.02562.01425.01326.01288.01271.01226.01223.01172.01129.01126.01089.0
9,815,850148,119
1,016,0172,225,297
97,885,1601,935,7272,404,221
5,478,318
19,798,722
13,694,255
Totals 49674.6 154,401,686
Global Total 76800.0 308,473,321
% of Global total 64.7 50
Out of school children and UK aid to education

0
1000
2000
3000
4000
5000
6000
7000
8000
9000
0 20000000 40000000 60000000 80000000 100000000 120000000
UK education aid
ou
t-o
f-s
ch
oo
l ch
ildre
n
Bangladesh
Uganda
Ghana
Nigeria
Kenya
India
Mozambique
Rw anda
Pakistan
South AfricaMalaysia
Cambodia
China
Ethiopia
Sudan
UK aid to education 2005/6 and out-of- school children

0.0
1000.0
2000.0
3000.0
4000.0
5000.0
6000.0
7000.0
8000.0
9000.0
0 5,000,000 10,000,000 15,000,000 20,000,000 25,000,000 30,000,000
UK education aid
ou
t-o
f-s
ch
oo
l ch
ildre
n
Bangladesh
Tanzania
Ghana
Rw anda
Mozambique
Zambia
UgandaVietnam
Malaw i
Kenya
Nepal
South Africa
Nigeria
DR Congo
Pakistan
China
Sierra Leone
YemenColumbia
The GambiaIndonesia
Ethiopia
Sudan
UK aid to education 2005/6 and out-of-school children (excl.
India)

0.00
0.20
0.40
0.60
0.80
1.00
1.20
0 5,000,000 10,000,000 15,000,000 20,000,000 25,000,000 30,000,000
DFID aid to education
Ind
ex 3 BangladeshTanzania
GhanaRw anda
MozambiqueNigeria
ZambiaVietnam
Malaw i
South Africa
NepalKenya
DR Congo
PakistanEthiopia
SudanSierra Leone
Burundi
Zimbabw eLiberia
Columbia
The GambiaIndonesia
Bahamas
Botsw anaPeru
Shri LankaTajikistan
Uganda
China
UK aid to ed and NER/Survival/out-of-school
children

• Continued core support for primary/basic cycle with shift to mid-secondary where UPE within reach
• Strong support to quality –inputs do matter
• Support to fee-free policies, with gender emphasis, in basic cycle
• Advocacy of balanced ed provision in light of economies’ needs
Aid Policy