Embed Size (px)
Citation preview

Hindawi Publishing CorporationComputational and Mathematical Methods in MedicineVolume 2013 Article ID 179761 13 pageshttpdxdoiorg1011552013179761
Research ArticleThe Number of Candidate Variants in Exome Sequencing forMendelian Disease under No Genetic Heterogeneity
Jo Nishino1 and Shuhei Mano2
1 Center for Information Biology and DNA Data Bank of Japan National Institute of GeneticsResearch Organization of Information and Systems 1111 Yata Mishima Shizuoka 411-8540 Japan
2Department of Mathematical Analysis and Statistical Inference The Institute of Statistical MathematicsResearch Organization of Information and Systems 10-3 Midori-cho Tachikawa Tokyo 190-8562 Japan
Correspondence should be addressed to Jo Nishino jnishinonigacjp
Received 30 January 2013 Revised 25 March 2013 Accepted 29 March 2013
Academic Editor Shigeyuki Matsui
Copyright copy 2013 J Nishino and S Mano This is an open access article distributed under the Creative Commons AttributionLicense which permits unrestricted use distribution and reproduction in any medium provided the original work is properlycited
There has been recent success in identifying disease-causing variants in Mendelian disorders by exome sequencing followed bysimple filtering techniques Studies generally assume complete or high penetrance However there are likely many failed andunpublished studies due in part to incomplete penetrance or phenocopy In this study the expected number of candidate single-nucleotide variants (SNVs) in exome data for autosomal dominant or recessive Mendelian disorders was investigated under theassumption of ldquono genetic heterogeneityrdquo All variants were assumed to be under the ldquonull modelrdquo and sample allele frequencieswere modeled using a standard population genetics theory To investigate the properties of pedigree data full-sibs were consideredin addition to unrelated individuals In both cases particularly regarding full-sibs the number of SNVs remained very high withoutcontrols The high efficacy of controls was also confirmed When controls were used with a relatively large total sample size (eg119873 = 20 50) filtering incorporating of incomplete penetrance and phenocopy efficiently reduced the number of candidate SNVsThis suggests that filtering is useful when an assumption of no ldquogenetic heterogeneityrdquo is appropriate and could provide generalguidelines for sample size determination
1 Introduction
Understanding associations between human genetic varia-tions and phenotypes including risk of disease is importantfor successful realization of personalizedmedicine Such vari-ants can be used as biomarkers Recent advances in high-throughput sequencing technology (ldquonext-generation DNAsequencingrdquo (NGS)) enable exploration of human geneticvariations on genome-wide and individual levels
The international ldquo1000-Genome Projectrdquo which usesNGS technology was launched in 2008 The project aimsto create a detailed catalog of human genetic variations bysequencing at least 1000 individuals [1] This type of catalogwould provide a basis for studies on disease-causing variantsor genes In the last decade genome-wide association studies(GWAS) using single-nucleotide polymorphism (SNP) geno-typing arrays have been successful although genetic variantsidentified by GWAS only explain a small proportion of
heritability formany complex diseases [2] Amajor reason forthis limitation is that the ldquocommon disease common variantrdquohypothesis is a prerequisite forGWAS [2]Thehypothesis thatmany common diseases are caused by ldquocommon variantsrdquo(ie variants present in more than 1ndash5 of a population)as detected by SNP genotyping arrays is not likely realisticAttention has been gradually turned to ldquorare variantsrdquo whichcan be detected by NGS technology
The cost of DNA sequencing is continuously beingreduced However whole genome sequencing is still tooexpensive Recently sequencing the exome (all protein-coding regions in the genome) has been considered foridentifying disease-causing genes or variants The humanexome sequence consists of approximately 30Mb pairs(nucleotides) corresponding to approximately 1 of the totalgenome Thus exome sequencing is cost effective Ng et al[3] provided a proof of concept that exome sequencing canbe used to identify disease-causing genes or variants using
2 Computational and Mathematical Methods in Medicine
a simple filtering approach To date more than 100 disease-causing genes for Mendelian disorders have been identifiedusing exome sequencing [4]
Analyses of exome data for Mendelian disorders are con-ducted in a simple intuitive manner For example Ng et al[3] ldquoreidentifiedrdquo the MYH3 gene which is known to causethe rare autosomal dominant disorder Freeman-Sheldon syn-drome as follows (1) retention of genes in which at least onenonsynonymous single-nucleotide variant (SNV) splice-sitevariation or indel was present in four unrelated affected indi-viduals and (2) filtering out (removing) variants present in theexomes of eight control individuals or samples from a publicdatabase (dbSNP) As an example of using whole genomesequencing for a single patient in a pedigree Sobreira et al [5]identified the causative gene of the rare autosomal dominantdisease metachondromatosis In advance linkage analysisusing SNP genotyping arrays was conducted and wholegenomes of a single patient and eight unrelated controls weresequenced The researchers focused on regions with highpositive LOD scores and used sequences from the eight con-trols and dbSNP data as filters to remove variants They thenidentified a patient-specific deletion in an exon of PTPN11
Exome sequencing is an effective method for identifyingdisease-causing variants in Mendelian disorders Howeverthere are likely a large number of failed and unpublishedstudies due to incomplete penetrance phenocopy or geno-typing error (including sequencing error) Is exome analysisfor Mendelian disease actually applicable under assumptionsof incomplete penetrance and phenocopy What is thenecessary sample size To answer such questions theoreticalsimple model studies are suitable Theoretical research israrely used for exome analysis in Mendelian disease even incases of complete penetrance and no phenocopy
In exome sequencing short reads produced by NGSare mapped to the reference sequence which is the stan-dard human genome sequence and variants are detectedagainst the reference (Figure 1(a)) Disease-causing variantsare searched for based on variants detected in affectedindividuals In this study the number of candidate SNVs fordiseases following Mendelian inheritance modes includingautosomal dominant and recessive was investigated underthe assumption of ldquono genetic heterogeneityrdquo (ie no allelicor locus heterogeneity or situations in which a genetic diseaseis caused by a variant on a gene instead of several variants onone or more genes) It was assumed that allelic types of allvariants are independent of the affected status (ie all variantsare under the ldquonull modelrdquo)This is valid because there is onlyone disease-causing variant Allelic frequencies in a samplewere modeled using a standard population genetics theoryExome sequences with andwithout controls were consideredand incomplete penetrance and phenocopy were incorpo-rated as filtering conditions (Figures 1(b) 1(c) and 1(d))Differences between data from unrelated individuals andpedigrees were also evaluated (Figures 1(e) and 1(f)) Publicdatabases (eg dbSNP or 1000 Genome Project database)which can include errors and generally do not providephenotype information are often used to filter out SNVs inexome analysis but were not considered in this study Zhiand Chen [6] modeled an analysis of exome sequencing
The authors investigated the power of various conditionsincluding the number of mutations identified after filtering(corresponding to the number of SNVs after filtering inthis study) inheritance modes of disease (ie autosomaldominant and recessive) locus heterogeneity gene lengthsample size and others Common or low quality variantswere filtered out in advance and disease-causing genes wereexplored under genetic heterogeneityThe authors treated thenumber of SNVs after filtering as a known constant In con-trast we directly filtered disease-causing variants accordingto modes of inheritance under the assumption of ldquono geneticheterogeneityrdquo and evaluated the number of candidateSNVs after filtering In addition although the term ldquoSNVrdquomeans ldquosingle-nucleotide variantrdquo as shown in Figure 1(a)it can be interpreted simply as a ldquovariantrdquo including ldquosplice-site variantrdquo or ldquoindelrdquo The term ldquoSNVrdquo is used in this studybecause there are fewer splice-site variants or indels thanSNVs in exome sequences [3]
2 Method
There are roughly 20000 SNVs in a single human exome[3] That is diploid exome sequences (two haploid exomesequences) have different allelic types (alternative types 119860)from haploid reference sequences (reference types 119877) atsim20000DNA sites (Figure 1(a)) According to the populationgenetics theory described below the expected number ofSNVs with 119894 mutant and 119899 minus 119894 ancestral alleles in 119899 haploidsequences randomly sampled from a population can beobtained using a simple formula In Section 21 we used thisformula to derive an expression for the expected number ofSNVs with 119899
119860alternative and 119899 minus 119899
119860reference alleles in 119899
haploid sequences randomly sampled from a population InSection 22 exome sequences of119873unrelated affected individ-uals (Figure 1(e)) were considered and the expected numberof SNVs for individuals with genotypes119877119877119877119860 and119860119860 (119899
119877119877
119899119877119860
and 119899119860119860
resp) was obtained This enabled calculationof the expected number of SNVs after filtering as illustratedin Figures 1(b) and 1(c) In Section 23 a case with addi-tional controls was considered (Figure 1(d)) In Section 24we considered data from full-sibs with and without controlsin a nuclear family to investigate the properties of the expect-ed number of SNVs using exome sequences from a pedigree(Figure 1(f))
21 Site Frequency Spectrum of the Alternative Allele We con-sidered 119899 haploid sequences randomly sampled from a popu-lation under theWright-Fisher diffusion modelThe infinite-site model of neutral mutations was assumed We denotedthe diploid population size and mutation rate per haploidsequence per generation by PopSize and 120583 respectively 119872
119894
indicates the number of SNVs with 119894 mutant (derived) and119899 minus 119894 ancestral alleles in 119899 haploid sequences 119872
119894is the ldquosite
frequency spectrumrdquo of the mutant (derived) allele in a sam-ple According to Fu [7] the expectation of119872
119894is the result of
119864 [119872119894] =
120579
119894 1 le 119894 le 119899 minus 1 (1)
Computational and Mathematical Methods in Medicine 3
ATGGAGCGGTAG
ATGGGGCGGCAG
ACGGGGTGGCAG
middot middot middot
middot middot middot
middot middot middot
middot middot middot
middot middot middot
middot middot middot
Alternative allele (A)Others Reference alleles (R)
A diploid sequence(or two haploid sequences)
A reference sequence
A reference sequence
Affected individuals
RRRRRRRRRRRRRRRRRRRRRARRRRRRARRRRARRRARRARRRRARRRARRARARRARR
middot middot middotmiddot middot middot
middot middot middot
middot middot middotmiddotmiddot middot
middot middot middotmiddot middot middot
middot middot middot
middot middot middotmiddot middot middot
middot middot middot
middot middot middot
middot middot middot
middot middot middot
middot middot middot
middot middot middot
middot middot middot
middot middot middot
middot middot middot
middot middot middot
middot middot middot
middot middot middot
middot middot middot
middot middot middot
middot middot middot
middot middot middot
middot middot middot
middot middot middot
middot middot middot
middot middot middot
Stringent filteringfor a dominant diseaseAll individuals have AA or RA
Stringent filteringfor a recessive diseaseAll individuals have AA
RRRRRRRRRRRR
RRRRRRRRRARR
RRRRARRRRARR
RARRARRRRARR
RARRARARRARR
RRRRRRRRRRRR
RRRRRRRRRARR
RRRRARRRRARR
RARRARRRRARR
RARRARARRARR
RRRRRRRRRRRRRRRRRRRRRARRRRRRARRRRARRRARRARRRRARRRARRARARRARRRRRRARRRRARRRARRARARRARA
middot middot middotmiddot middot middot
middot middot middot
middot middot middot
middot middot middot
middot middot middot
middot middot middot
middot middot middotmiddot middot middot
middot middot middot
middot middot middot
middot middot middot
middot middot middot
middot middot middot
A reference sequence
Affected individuals
Filtering for a recessive diseaseAt least 119883 = 2 individuals have AA
middot middot middot
middot middot middot
middot middot middot
middot middot middot
middot middot middot
middot middot middot
middot middot middot
middot middot middot
middot middot middot
middot middot middot
middot middot middot
middot middot middot
middot middot middot
middot middot middot
RRRRRRRRRRRR
RRRRRRRRRARR
RRRRARRRRARR
RARRARRRRARR
RARRARARRARR
RRRRARRRRARR
RARRARARRARA
middot middot middot
middot middot middotmiddot middot middot
middot middot middot
middot middot middotmiddot middot middot
middot middot middot
middot middot middot
middot middot middotmiddot middot middot
middot middot middot
middot middot middot
middot middot middot
middot middot middot
Filtering for a dominant diseaseAt least 119883 = 2
individuals have AA or RA
RRRRRRRRRRRRRRRRRRRRRARRRRRRARRRRARRRARRARRRRARRRARRARARRARRRRRRARRRRARRRARRARARRARA
Control
RRRRRRRRRRRRRRRRRRRRRARRRRRRARRRRARRRARRARRRRARRRARRARARRARRRRRRARRRRRRRRARRARRRRRRA
middot middot middotmiddot middot middot
middot middot middot
middot middot middot
middot middot middot
middot middot middot
middot middot middot
middot middot middotmiddot middot middot
middot middot middot
middot middot middot
middot middot middot
middot middot middot
middot middot middot
A reference sequence
Affected individuals
Filtering for a recessive disease At least119883 = 1 affected individuals have
AA and no(at most 119884 = 0) control have AA
Filtering for a dominant disease At least119883 = 1 affected individuals have
AA or RA andno (at most 119884 = 0) control have AA or RA
RRRRRRRRRRRRRRRRRRRRRARRRRRRARRRRARRRARRARRRRARRRARRARARRARRRRRRARRRRRRRRARRARRRRRRA
RRRRRRRRRRRRRRRRRRRRRARRRRRRARRRRARRRARRARRRRARRRARRARARRARRRRRRARRRRRRRRARRARRRRRRA
middot middot middotmiddot middot middotmiddot middot middotmiddot middot middotmiddot middot middotmiddot middot middotmiddot middot middot
middot middot middotmiddot middot middotmiddot middot middotmiddot middot middotmiddot middot middotmiddot middot middotmiddot middot middot
middot middot middotmiddot middot middotmiddot middot middotmiddot middot middotmiddot middot middotmiddot middot middotmiddot middot middot
middot middot middotmiddot middot middotmiddot middot middotmiddot middot middotmiddot middot middotmiddot middot middotmiddot middot middot
N sampledindividuals
WF model
Not sampled
Sampled reference
Sampled reference
WF model
N sampled sibs
(a) (b)
(c) (d)
(e) (f)
Figure 1 Setting for our study (a) Alternative (119860) allele and reference (119877) allele (b) Stringent filtering for affected individuals (c) Filteringincorporating phenocopy (d) Filtering incorporating incomplete penetrance and phenocopy (e) Case of unrelated individual (f) Case offull-sibs
where 120579 = 4 times 119875119900119901119878119894119911119890 times 120583 This simple formula does notinclude the sample size 119899 As described in the followingsection the point estimate of 120579 for the human exome issim13333 For example when considering four haploid exomes(equivalent to two unrelated diploid exomes) the number ofSNVs with one two and three mutant alleles is expected tobe 13333 666650 and 444433 respectively
However in practice it is often not known if the DNAtype at a segregating site is mutant or ancestral In exome
analysis DNA types are generally expressed as ldquoreference(119877)rdquo or ldquoalternative (119860)rdquo because variants in exome sequencesare detected based on comparison with a reference genomesequence (Figure 1(a)) This study was also carried out interms of ldquoReference type (119877)rdquo or ldquoAlternative type (119860)rdquo Thusas a first step we defined 119872
1015840
119899119860in place of 119872
119894to derive the
expression 119864[1198721015840
119899119860]
In addition to 119899 haploid sequences we considered thata reference sequence was also randomly sampled from a
4 Computational and Mathematical Methods in Medicine
population (119899+1 sequences) We defined1198721015840
119899119860as the number
of SNVs with 119899119860alternative and 119899minus119899
119860reference alleles in the
119899 haploid sequences In a segregating site in 119899 + 1 sequencesreference DNA is either mutant or ancestral The expectednumber of SNVs in which reference DNA is mutant and119899119877reference alleles in the 119899 haploid sequences is derived by
the product of the expected number of SNVs with 119899119877+ 1
mutant alleles in 119899+1 sequences 120579(119899119877+1) based on (1) and
the probability that a mutant allele is chosen as a referencefrom 119899 + 1 alleles with 119899
119877+ 1mutant alleles (119899
119877+ 1)(119899 + 1)
This is represented as
120579
119899119877+ 1
119899119877+ 1
119899 + 1=
120579
119899 + 1 (2)
Similarly the expected number of SNVs in which refer-ence DNA is ancestral and 119899
119877reference alleles in 119899 haploid
sequences was obtainedThe expectation is represented as theproduct of the expected number of SNVs with (119899 + 1) minus (119899
119877+
1) = (119899 minus 119899119877) mutant alleles in (119899 + 1) sequences 120579(119899 minus 119899
119877)
based on (1) and the probability that amutant allele is chosenas a reference from 119899 + 1 alleles with 119899
119877+ 1 mutant alleles
(119899119877+ 1)(119899 + 1) The resulting equation is
120579
119899 minus 119899119877
119899119877+ 1
119899 + 1 (3)
The expectation of 1198721015840119899119860 119864[1198721015840
119899119860] is equal to the sum of
(2) and (3) resulting in
119864 [1198721015840
119899119860] =
120579
119899 + 1+
120579
119899 minus 119899119877
119899119877+ 1
119899 + 1=
120579
119899 minus 119899119877
=120579
119899119860
1 le 119899119860le 119899
(4)
The formula does not include sample size Interestinglythis result is obtained by (1) assuming that the alternativealleles are a mutant Note that 119899
119860can be equal to 119899 at most
in (4) (119899 alleles are all alternatives at a particular DNA site)
22 Unrelated 119873 Affected Individuals Next consider exomesequences of unrelated 119873 affected individuals under theWright-Fisher diffusion model (Figure 1(e)) The infinite-sitemodel of neutral mutations was assumed again Assumingthat119873 diploid exome sequences and a reference sequence areldquorandomly sampledrdquo from the population we obtained theexpected number of SNVs in which the number of individ-uals with genotypes 119877119877 119877119860 and 119860119860 is 119899
119877119877 119899119877119860 and 119899
119860119860
respectively Here ldquorandomly sampledrdquomeans that119873 diploidexome sequences and a reference sequence are ldquorandomlysampledrdquo (119873+1 times) which is equivalent to 2119873+1 haploidexome sequences that are ldquorandomly sampledrdquo (2119873+1 times)followed by one sequence chosen as a reference from the2119873+1 sequencesThe remaining 2119873 sequences are randomlyjoined to form 119873 diploids The latter is used for illustrativepurposes
Conditions of the variables were collected As inSection 21 119899
119877and 119899
119860denote the number of reference and
alternative alleles in a site respectively One has
119899119877 119899119860 119899119877119877
119899119877119860
119899119860
isin nonnegative integers (5a)
2119873 = 119899119877+ 119899119860 (5b1)
119873 = 119899119877119877
+ 119899119877119860
+ 119899119860119860
(5b2)
119899119877= 2119899119877119877
+ 119899119877119860
(5b3)
119899119860= 2119899119860119860
+ 119899119877119860
(5b4)
(5b)
Note that given 119899119860or 119899119877(and constant 119873) there is only one
independent variable among 119899119877119877 119899119877119860
and 119899119860119860
For exampleif 119899119860 and 119899
119860119860are fixed the other two variables 119899
119877119877and 119899119877119860
are automatically determinedLet 119870(119873 119899
119877 119899119860 119899119877119877
119899119877119860
119899119860119860
) be the number of SNVsin which the number of reference and alternative allelesis 119899119877and 119899
119860 respectively and the number of individuals
with genotypes 119877119877 119877119860 and 119860119860 is 119899119877119877 119899119877119860 and 119899
119860119860
respectively in total 119873 individuals The expected number ofSNVs 119864[119870(119873 119899
119877 119899119860 119899119877119877
119899119877119860
119899119860119860
)] is defined only whenall conditions of (5a) and (5b) are met First we consid-ered 2119873 haploid exome sequences and a reference to beldquorandomly sampledrdquo (2119873 + 1 times) The number of SNVswith 119899
119860alternative and 119899 minus 119899
119860reference alleles in the
2119873 + 1 haploid samples can be readily obtained by (4) Theprobability that the genotype configuration (119899
119877119877 119899119877119860
119899119860119860
)
was determined given that a DNA site has 119899119860alternative
alleles was denoted as Prob(119899119877119877
119899119877119860
119899119860119860
| 119899119860) The number
of distinct permutations of 2119873 is given by (2119873)(119899119877119899119860)
How many permutations result in the genotype configura-tion (119899
119877119877 119899119877119860
119899119860119860
) The number of ways to determine thegenotype of each individual in distinct 119873 individuals andgenerate a genotype configuration of (119899
119877119877 119899119877119860
119899119860119860
) is equalto 119873(119899
119877119877119899119877119860
119899119860119860
) The genotype 119877119860 can be generatedfrom the two runs 119877119860 and 119860119877 Therefore the number ofpermutations used to generate the genotype configuration(119899119877119877
119899119877119860
119899119860119860
) is derived from (2119899119877119860119873)(119899
119877119877119899119877119860
119899119860119860
) andProb(119899
119877119877 119899119877119860
119899119860119860
| 119899119860) = (2
119899119877119860119873)(119899119877119877
119899119877119860
119899119860119860
) times
(119899119877119899119860)(2119873) The expression of Prob(119899
119877119877 119899119877119860
119899119860119860
| 119899119860)
was shown elsewhere and used to perform the exact test ofHardy-Weinberg equilibrium [8] Let us give a proof of thefollowing proposition
Proposition 1 119864[119870(119873 119899119877 119899119860 119899119877119877
119899119877119860
119899119860119860
)] = 119864[1198721015840
119899119860] times
Prob (119899119877119877
119899119877119860
119899119860119860
| 119899119860)
Proof 119864[119870] = 119864diff[119864samp[119870 | 1198721015840
119899119860]] where 119864diff is
the expectation with respect to the diffusion model and119864samp is the expectation with respect to the binomial sam-pling Binomial sampling is 119872
1015840
119899119860-times Bernoulli trial ad-
dressing whether a site indicates genotype counts of (119899119877119877
119899119877119860
119899119860119860
) Probability of the Bernoulli trial is Prob(119899119877119877
119899119877119860
119899119860119860
| 119899119860) Therefore 119864diff[119864samp[ 119870 | 119872
1015840
119899119860]] = 119864diff[119872
1015840
119899119860times
Prob(119899119877119877
119899119877119860
119899119860119860
| 119899119860)] = 119864diff[119872
1015840
119899119860] Prob(119899
119877119877 119899119877119860
119899119860119860
|
119899119860) 119864diff[119872
1015840
119899119860] is represented by (4) and the proposition
follows
Computational and Mathematical Methods in Medicine 5
Then we have
119864 [119870 (119873 119899119877 119899119860 119899119877119877
119899119877119860
119899119860119860
)]
= 119864 [1198721015840
119899119860] times Prob (119899
119877119877 119899119877119860
119899119860119860
| 119899119860)
=120579
119899119860
times2119899119877119860119873
119899119877119877
119899119877119860
119899119860119860
119899119877119899119860
(2119873)
(6)
Here 119864[119870(119873 119899119877 119899119860 119899119877119877
119899119877119860
119899119860119860
)] is not defined if (5a)and (5b) are not satisfied For example in the case of 119873 =
2 (4 haploid sequences) the expected number of SNVsfor (119873 119899
119877 119899119860 119899119877119877
119899119877119860
119899119860119860
) = (2 3 1 1 1 0) (2 2 2 0 2 0)(2 2 2 1 0 1) (2 1 3 0 1 1) (2 0 4 0 0 2) satisfying (5a)and (5b) is 120579 1205793 1205796 1205793 and 1205794 respectively If we use13333 as human exome 120579 119864[119870(119873 119899
119877 119899119860 119899119877119877
119899119877119860
119899119860119860
)] is13333 444433 222217 444433 and 333325 respectivelyIf both individuals are affected by a certain recessive diseasewith the genotype 119860119860 at a causal DNA site we can usea filter to retain variants in which both individuals havethe genotype 119860119860 The expected number of SNVs afterfiltering is 119864[119870(2 0 4 0 0 2)] = 333325 Similarly whenboth individuals are affected by a dominant disease withgenotypes 119860119860 or 119877119860 at a causal DNA site the expectednumber of SNVs after filtering is 119864[119870(2 2 2 0 2 0)] + 119864
[119870(2 1 3 0 1 1)]+119864[119870(2 0 4 0 0 2)] = 444433 + 444433+ 333325 = 1222191 In thisway by summing119864[119870(119873 119899
119877 119899119860
119899119877119877
119899119877119860
119899119860119860
)] for all sets of (119873 119899119877 119899119860 119899119877119877
119899119877119860
119899119860119860
) thatsatisfy (5a) and (5b) and including a filtering condition theexpected number of SNVs after filtering can be calculated
In some cases factors such as reduced penetrance pheno-copy (including misdiagnosis) or genotyping errors shouldbe taken into account So consider filtering to retain onlySNVs in which at least119883(ge119883) of119873 affected individuals have119860119860 in cases of recessive disease or 119860119860 or 119877119860 in cases ofdominant disease (Figure 1(c)) At the disease-causing variantsite this allows the phenocopy (or genotyping error) fromgenotype119877119877 or119877119860 to119860119860 in cases of recessive disease or fromgenotype 119877119877 to 119860119860 or 119877119860 in cases of dominant disease Thefollowing are detailed methods of calculating the expectednumber of SNVs after filtering
As noted given 119899119860or 119899119877(and constant 119873) there is only
one independent variable in the conditions of (5b) In case ofrecessive disease we can express 119870(119873 119899
119877 119899119860 119899119877119877
119899119877119860
119899119860119860
)
as a function of 119873 119899119860 119899119860119860
using (5b) denoted by119864[119870(119873 119899
119860 119899119860119860
)] Specifically this can be expressed as
119864 [119870 (119873 119899119860 119899119860119860
)]
=120579
119899119860
2(119899119860minus2119899119860119860)119873
(119873 minus 119899119860+ 119899119860119860
) (119899119860minus 2119899119860119860
)119899119860119860
times(2119873 minus 119899
119860)119899119860
(2119873)
(7)
119864[119870(119873 119899119860 119899119860119860
)] is not defined if (5a) is not satisfiedAfter filtering the expected number of SNVs in which at least119883(ge119883) of119873 affected individuals have 119860119860 is calculated by
sum
119899119860 119883le119899119860119860
119864 [119870 (119873 119899119860 119899119860119860
)] (8)
In cases of dominant disease denoting 119899119860119860+119877119860
as thenumber of individuals with genotypes 119860119860 or 119877119860 (119899
119860119860+119877119860=
119899119860119860
+119899119877119860
) can be expressed as119864[119870(119873 119899119877 119899119860 119899119877119877
119899119877119860
119899119860119860
)]
as a function of 119873 119899119860 119899119860119860+119877119860
using (5b) denoted by119864[119870(119873 119899
119860 119899119860119860+119877119860
)] This results in
119864 [119870 (119873 119899119860 119899119860119860+119877119860
)]
=120579
119899119860
2(2119899119860119860+119877119860minus119899119860)119873
(119873 minus 119899119860119860+119877119860
) (2119899119860119860+119877119860
minus 119899119860) (119899119860minus 119899119860119860+119877119860
)
times(2119873 minus 119899
119860)119899119860
(2119873)
(9)
119864[119870(119873 119899119860 119899119860119860+119877119860
)] is not defined if (5a) is not satisfiedAfter filtering the expected number of SNVs in which at least119883(ge119883) of119873 affected individuals have119860119860 or119877119860 is calculatedby
sum
119899119860 119883le119899119860119860+119877119860
119864 [119870 (119873 119899119860 119899119860119860+119877119860
)] (10)
23 Unrelated119873119886Affected Individuals with119873
119888Controls Con-
sider exome sequences of unrelated119873 individuals consistingof 119873119886affected individuals and 119873
119888controls In cases of
recessive disease we considered a filter to retain only SNVsin which at least 119883(ge119883) of 119873
119886affected and at most 119884(le119884)
of 119873119888control individuals have 119860119860 (Figure 1(d) left) This
allows the phenocopy (or genotyping error) from genotype119877119877 or 119877119860 to 119860119860 andor the reduced penetrance of 119860119860 at adisease-causing variant site Similarly in cases of dominantdisease we considered a filter to retain only SNVs in which atleast119883(ge119883) of119873
119886affected and at most 119884(le119884) of119873
119888control
individuals have 119860119860 or 119877119860 (Figure 1(d) right)First we did not distinguish affected individuals from
controls in total 119873 individuals The expected number ofSNVs in which the number of alternative alleles is 119899
119860and
the number of individuals with genotype 119860119860 is 119899119860119860
is stillgiven by (7) Next we assumed that 119873
119886affected individuals
and119873119888controls were randomly selected from119873 individuals
Considering recessive diseases for a given 119899119860119860
the numberof individuals with genotypes 119860119860 119899
119860119860(119886) in 119873
119886affected
individuals follows a hypergeometric distribution As a resultthe expected number of SNVs119864[119870
2(119873119873
119886 119899119860 119899119860119860
119899119860119860(119886)
)]in which the number of alternative alleles is 119899
119860and the
6 Computational and Mathematical Methods in Medicine
number of individuals with genotype 119860119860 is 119899119860119860(119886)
in 119873119886
affected individuals is represented as
119864 [1198702(119873119873
119886 119899119860 119899119860119860
119899119860119860(119886)
)]
= Prob (119899119860119860(119886)
| 119899119860119899119860119860
) times 119864 [119870 (119873 119899119860 119899119860119860
)]
=
(119899119860119860119899119860119860(119886)
) times (119873minus119899119860119860
119873119886minus119899119860119860(119886))
(119873
119873119886)
119864 [119870 (119873 119899119860 119899119860119860
)]
(11)
After filtering the expected number of SNVs in which atleast119883(ge 119883) of119873
119886affected individuals and at most 119884(le119884) of
119873119888control individuals have the 119860119860 genotype is obtained by
summing 119864[1198702]
sum
119899119860 119899119860119860 119899119860119860(119886)
119864 [1198702(119873119873
119886 119899119860 119899119860119860
119899119860119860(119886)
)] (12)
where the sum of 119899119860119860(119886)
is over the value satisfying the fil-tering condition 119899
119860119860(119886) 119883 le 119899
119860119860(119886)and 119899119860119860(119888)
= (119899119860119860
minus
119899119860119860(119886)
) le 119884 119899119860119860(119888)
denotes the number of individuals with119860119860 genotypes in the119873
119888controls
Similarly considering dominant diseases the expectednumber of SNVs in which the number of alternative allelesis 119899119860and the number of individuals with genotypes 119860119860 or
119877119860 (119899119860119860+119877119860(119886)
) in119873119886affected individuals is represented by
119864 [1198702(119873119873
119886 119899119860 119899119860119860+119877119860
119899119860119860+119877119860(119886)
)]
= Prob (119899119860119860+119877119860(119886)
| 119899119860 119899119860119860+119877119860
) times 119864 [119870 (119873 119899119860 119899119860119860+119877119860
)]
=
(119899119860119860+119877119860119899119860119860+119877119860(119886)
) times (119873minus119899119860119860+119877119860
119873119886minus119899119860119860+119877119860(119886))
(119873
119873119886)
119864 [119870 (119873 119899119860 119899119860119860+119877119860
)]
(13)
After filtering the expected number of SNVs in which atleast 119883(ge119883) of 119873
119886affected individuals and at most 119884(le119884)
of 119873119888control individuals have the 119860119860 or 119877119860 genotypes is
obtained by summing 119864[1198702]
sum
119899119860 119899119860119860 119899119860119860+119877(119886)
119864 [1198702(119873119873
119886 119899119860 119899119860119860+119877119860
119899119860119860+119877119860(119886)
)] (14)
where the sum of 119899119860119860+119877119860(119886)
is over the value satisfying thefiltering condition 119899
119860119860+119877119860(119886) 119883 le 119899
119860119860+119877119860(119886)and 119899119860119860+119877119860(119888)
=
(119899119860119860+119877119860
minus 119899119860119860+119877119860(119886)
) le 119884 Here 119899119860119860+119877119860(119888)
denotes thenumber of individuals with 119860119860 or 119877119860 genotypes in 119873
119888
controls
24 119873 Full-Sibs with and without Controls To investigatethe properties of the number of SNVs using exomes from apedigree we considered119873 full-sibswith andwithout controlsin a nuclear family (Figure 1(f)) Assumptions were that fourhaploid exome sequences of both parents and a referencesequence were randomly sampled from a population undertheWright-Fisher diffusion modelThe infinite-site model ofneutral mutations was also assumed
The expected number of SNVs with a particular genotypeconfiguration from both parents was obtained by (6) Other-wise using formula (4) the expected number was obtained
as follows the expected number of SNVs with both parentsgenotypes 119877119877 times 119877119860 119877119860 times 119860119860 and 119860119860 times 119860119860 is readilyobtained by substituting 119899
119860= 1 3 and 4 into (4) to be 120579
1205793 and 1205794 respectively Here 119877119877 times 119877119860 indicates that thegenotype of one parent is 119877119877 and that of the other is 119877119860and so on Although the expected number of SNVs in which119899119860= 2 in four haploid sequences is 1205792 by substituting 119899
119860= 2
into (4) SNVs likely result in two genotype configurations119877119877 times 119860119860 and 119877119860 times 119877119860 Considering random combinationsof 119877 119877 119860 119860 the expected number of SNVs with 119877119877 times 119860119860
and 119877119860 times 119877119860 is represented by 1205792 times 2 times (2
2) (4
2) = 16120579
1205792 times 2 (4
2) = 13120579 Given the genotype configuration of
both parents the number of sibs with genotypes 119877119877 119877119860 and119860119860 follows a polynomial distribution For possible genotypeconfigurations of both parents Table 1 shows the expectednumber of SNVs and probabilities that a sib with a particulargenotype would be born (ie parameters of a polynomialdistribution)
The expected number 119864[119870sib(119899119877119877 119899119877119860 119899119860119860)] of SNVs inwhich the number of sibs with genotypes 119877119877 119877119860 and 119860119860 is119899119877119877 119899119877119860 and 119899
119860119860 respectively is represented as
119864 [119870sib (119899119877119877 119899119877119860 119899119860119860)]
= 119864 [119870119877119877times119877119860
] times Prob (119899119877119877
119899119877119860
119899119860119860
| 119877119877 times 119877119860) + sdot sdot sdot
+ 119864 [119870119860119860times119860119860
] times Prob (119899119877119877
119899119877119860
119899119860119860
| 119860119860 times 119860119860)
= 120579 times119873
119899119877119877
119899119877119860
119899119860119860
times
1
2
119899119877119877 1
2
119899119877119860
0119899119860119860
+1
6120579 times
119873
119899119877119877
119899119877119860
119899119860119860
times 011989911987711987711198991198771198600119899119860119860
+1
3120579 times
119873
119899119877119877
119899119877119860
119899119860119860
times
1
4
119899119877119877 1
2
119899119877119860 1
4
119899119860119860
+1
3120579 times
119873
119899119877119877
119899119877119860
119899119860119860
times 0119899119877119877
1
2
119899119877119860 1
2
119899119860119860
+1
4120579 times
119873
119899119877119877
119899119877119860
119899119860119860
times 011989911987711987701198991198771198601119899119860119860
(15)
where 119899119877119877
+ 119899119877119860
+ 119899119860119860
= 119873 00 = 1 and 01= 02= sdot sdot sdot = 0
Being simplified this is shown as
119864 [119870sib (119899119877119877 119899119877119860 119899119860119860)]
=119873
119899119877119877
119899119877119860
119899119860119860
120579
times 1
2
119899119877119877+119899119877119860
0119899119860119860 +
1
60
119899119877119877+119899119860119860
+1
3
1
2
2119899119877119877+119899119877119860+2119899119860119860
+1
30
119899119877119877 1
2
119899119877119860+119899119860119860
+1
40119899119877119877+119899119877119860
(16)
Here 119899119877119877 119899119877119860 119899119860119860
isin nonnegative integers and 119873 =
119899119877119877
+ 119899119877119860
+ 119899119860119860
Using (16) the expected number of SNVs
Computational and Mathematical Methods in Medicine 7
Table 1 Expected numbers of SNVs for the parents genotypes andprobabilities for sibs genotypes
Genotypeconfigurationof the parents
Expected numberof SNVs
Genotypeof sib
Probabilityfor genotype
119877119877 times 119877119860 119864 [119870119877119877times119877119860
] 120579 119877119877 12
119877119860 12
119877119877 times 119860119860 119864 [119870119877119877times119860119860
] 1205796 119877119860 1
119877119860 times 119877119860 119864 [119870119877119860times119877119860
] 1205793119877119877 14
119877119860 12
119860119860 14
119877119860 times 119860119860 119864 [119870119877119860times119860119860
] 1205793 119877119860 12
119860119860 12
119860119860 times 119860119860 119864 [119870119860119860times119860119860
] 1205794 119860119860 1
after filtering is calculated as shownThis calculation is easierthan that in unrelated individuals In recessive diseases theexpected number of SNVs in which at least 119883(ge 119883) of 119873affected individuals have 119860119860 after filtering is calculated as
sum119864[119870sib (119899119877119877 119899119877119860 119899119860119860)] (17)
where the summation is over (119899119877119877
119899119877119860
119899119860119860
) satisfying thefilter condition (119899
119877119877 119899119877119860
119899119860119860
) 119883 le 119899119860119860
Similarly incases of dominant disease the expected number of SNVsin which at least 119883(ge119883) of 119873 affected individuals have an119860119860 genotype after filtering is calculated using (17) where if119899119860119860+119877119860
= 119899119860119860
+ 119899119877119860 the summation is over (119899
119877119877 119899119877119860
119899119860119860
)satisfying the filter condition (119899
119877119877 119899119877119860
119899119860119860
) 119883 le 119899119860119860+119877119860
We considered 119873
119886affected sibs with 119873
119888control sibs
Given genotype configurations of both parents at a site thenumber of 119873
119886and 119873
119888sibs with genotypes 119877119877 119877119860 and
119860119860 at the site follows independent polynomial distribution119899119877119877(119886)
119899119877119860(119886)
and 119899119860119860(119886)
were the number of 119877119877 119877119860 and119877119860 respectively in 119873
119886affected sibs and 119899
119877119877(119888) 119899119877119860(119888)
and119899119860119860(119888)
were the number of 119877119877 119877119860 and 119860119860 respectively in119873119888control sibs The expected number 119864[119870sib2(119899119877119877(119886) 119899119877119860(119886)
119899119860119860(119886)
119899119877119877(119888)
119899119877119860(119888)
119899119860119860(119888)
)] of SNVs with the genotype con-figuration of sibs (119899
119877119877(119886) 119899119877119860(119886)
119899119860119860(119886)
119899119877119877(119888)
119899119877119860(119888)
119899119860119860(119888)
) isrepresented as
119864 [119870sib2 (119899119877119877(119886) 119899119877119860(119886) 119899119860119860(119886) 119899119877119877(119888) 119899119877119860(119888) 119899119860119860(119888))]
= 120579 times119873(119886)
119899119877119877(119886)
119899119877119860(119886)
119899119860119860(119886)
119873(119888)
119899119877119877(119888)
119899119877119860(119888)
119899119860119860(119888)
times 1
2
119899119877119877+119899119877119860
0119899119860119860 +
1
60
119899119877119877+119899119860119860
+1
3
1
2
2119899119877119877+119899119877119860+2119899119860119860
+1
30
119899119877119877 1
2
119899119877119860+119899119860119860
+1
40119899119877119877+119899119877119860
(18)
where 119899119877119877
= 119899119877119877(119886)
+ 119899119877119877(119888)
119899119877119860
= 119899119877119860(119886)
+ 119899119877119860(119888)
119899119860119860
=
119899119860119860(119886)
+ 119899119860119860(119888)
119899119877119877(a) 119899119877119860(119886) 119899119860119860(a) 119899119877119877(c) 119899119877119860(119888) 119899119860119860(c) isin
nonnegative integers 119873(119886)
= 119899119877119877(a) + 119899
119877119860(a) + 119899119860119860(a) and
119873(119888)
= 119899119877119877(c) + 119899
119877119860(c) + 119899119860119860(c) The expected number of SNVs
after filtering is calculated as shown just below In cases ofrecessive disease the expected number of SNVs in which atleast119883(ge119883) of119873
119886affected and at most 119884(le119884) of119873
119888control
individuals have the genotype 119860119860 after filtering is obtainedby
sum119864[119870sib2 (119899119877119877(119886) 119899119877119860(119886) 119899119860119860(119886) 119899119877119877(119888) 119899119877119860(119888) 119899119860119860(119888))]
(19)
where the summation is over (119899119877119877(119886)
119899119877119860(119886)
119899119860119860(119886)
119899119877119877(119888)
119899119877119860(119888)
119899119860119860(119888)
) satisfying the filter condition 119899119860119860(119886)
119883 le
119899119860119860(119886)
and 119899119860119860(119888)
le 119884 Similarly in cases of dominant diseasethe expected number of SNVs in which at least 119883(ge 119883) of119873119886affected and at most 119884(le119884) of 119873
119888control individuals
have 119860119860 or 119877119860 after filtering is calculated using (18) whereif 119899119860+119877119860(119886)
= 119899119860119860(119886)
+ 119899119877119860(119886)
and 119899119860119860+119877119860(119888)
= 119899119860119860(119888)
+
119899119877119860(119888)
the summation is over (119899119877119877(119886)
119899119877119860(119886)
119899119860119860(119886)
119899119877119877(119888)
119899119877119860(119888)
119899119860119860(119888)
) satisfying the filter condition (119899119877119877
119899119877119860
119899119860119860
)
119883 le 119899119860119860+119877119860(119886)
and 119899119860119860+119877119860(119888)
le 119884
3 Results and Discussion
31 An Estimator of 120579 for Human Exome According to Table2 in Ng et al [3] there are roughly 20000 SNVs in a singlehuman exome including synonymous and non-synonymousvariants All results in this study are based on the estimate120579 = 13333 which was obtained based on 20000 SNVs perindividual as follows the expected number of SNVs detectedin one human is represented as 119864[1198721015840
119899119860=1] + 119864[119872
1015840
119899119860=2] = 31205792
using (4) with possible 119899 = 2 values of 119899119860
isin 1 2 If theobserved number of SNVs detected in one human is 20000then 31205792 = 20000 is used to obtain 120579 = 13333 Note thatthe number of SNVs per single human exome (20000) variesbetween races and is based on different methods of exomecapture mapping to a reference genome genotype callingalgorithms or by definition of an exome The results of thisstudy also varied slightly based on the 120579 estimators used
32 Unrelated Individuals without Controls in Dominant Dis-ease The expected number of SNVs after filtering in cases ofdominant disease and unrelated individuals without controlsis plotted in Figure 2(a) Several values used in Figure 2are listed in Table 2 When a stringent filter (ie set to retainonly SNVs in which 100 of individuals sampled have thegenotype 119860119860119877119860) was used the number of SNVs appearedto decay exponentially with sample size 119873 However thedecrease in the number of SNVs was slower as 119873 increasedAs shown in Table 2 the expected number of SNVs for 119873 =
1 2 3 4 50 and 51 were 1999950 1222192 (6111) 933310(7636) 776171 (8316) 180856 and 178936 (9894)respectively with ratios of the expected SNVs for 119873 to thosefor119873minus1 shown in parenthesesThe first few individuals werehighly effective in removing SNVs but additional individualswere not This was obvious when nonstringent filters (ieremaining SNVs in which at least 90 or 80 of individualshave the genotype119860119860119877119860) were used In those cases certainasymptotic values likely exist For example ge90 of thefiltered expected number of SNVswas 554039 for119873 = 50 butonly 530636 for119873 = 100 From the perspective of identifying
8 Computational and Mathematical Methods in Medicine
0 20 40 60 80 100
0
5000
10000
15000
20000
119873
AARA 100AARA ge 90AARA ge 80
E[S
NV
s]
(a)
0 20 40 60 80 100
0
2000
4000
6000
8000
119873
119873119886 = 1198732 119873119888 = 1198732AARA 100 (a) 0 (c)119873119886 = 119873 minus 1 119873119888 = 1AARA 100 (a) 0 (c)
119873119886 = 119873 minus 1 119873119888 = 1AARA ge 80 (a) 0 (c)
119873119886 = 119873 minus 3 119873119888 = 3AARA ge 80 (a) 0 (c)119873119886 = 1198732 119873119888 = 1198732AARA ge 80 (a) le 20 (c)
E[S
NV
s]
(b)
Figure 2The expected number of SNVs after filtering in dominant disease using unrelated individuals (a) without controls (b) with controlsFor example crossmarks represent the expected number of SNVs in whichge80 individuals have the genotype119860119860119877119860 of119873
119886= 1198732 affected
individuals and le20 individuals have the genotype 119860119860119877119860 of119873119888= 1198732 controls
Table 2 The expected number of SNVs after filtering in dominant disease using unrelated individuals
119873
119873119886= 119873
119873119886= 1198732
119873119888= 1198732
119873119886= 119873 minus 1
119873119888= 1
119873119886= 119873 minus 1
119873119888= 1
119873119886= 119873 minus 3
119873119888= 3
119873119886= 1198732
119873119888= 1198732
119860119860119877119860100 119860119860119877119860 90 119860119860119877119860 80
119860119860119877119860100 (119886)0 (119888)
119860119860119877119860100 (119886)0 (119888)
119860119860119877119860ge 80 (119886)0 (119888)
119860119860119877119860ge80 (119886)0 (119888)
119860119860119877119860ge80 (119886)le20 (119888)
1 1999950 mdash mdash mdash mdash mdash mdash mdash2 1222192 mdash mdash 777758 777758 mdash mdash mdash3 933310 mdash mdash mdash 288882 mdash mdash mdash4 776171 mdash mdash 131743 157139 mdash mdash mdash5 675115 mdash 1180394 mdash 101056 mdash mdash mdash10 445020 729289 989974 1268 28427 mdash mdash 4876911 420942 mdash mdash mdash 24077 132527 mdash mdash13 382165 mdash mdash mdash 18060 mdash 11107 mdash20 299204 622039 891541 001 8751 mdash mdash 285121 291132 mdash mdash mdash 8072 94479 mdash mdash23 276709 mdash mdash mdash 6948 mdash 4577 mdash50 180856 554039 831192 mdash 1982 mdash mdash 00251 178936 mdash mdash mdash mdash 73685 mdash mdash53 175268 mdash mdash mdash mdash mdash 2174 mdash100 124975 530636 810838 mdash mdash mdash mdash mdash
Computational and Mathematical Methods in Medicine 9
disease-causing variants it is clear that nonstringent filtersthat take phenocopy into account do not work well even if thesample size is very large However using stringent filters theexpected number of SNVs remains high even if the samplesize is large (124975 SNVs for 119873 = 100) This shows that itis generally difficult to identify a disease-causing variant byfiltering without a control
33 Unrelated Individuals with Controls in Dominant DiseaseAs shown in Figure 2(b) filtering with controls is highlyeffective in removing SNVs When half of the samples werecontrols and a stringent filter was used the expected numberof SNVs was less than one at 119873 = 14 and 0001 at 119873 = 20Even with a single control the situation changed drasticallycompared to cases without controls For example for 119873 =
10 the expected number of SNVs was 44502 without acontrol which dropped to 28427 with one control Usingnonstringent filters that take phenocopy into account (ieremaining SNVs in which 80 of affected individuals havethe genotype 119860119860119877119860) an asymptotic value of approximately700 may occur with one control but filtering efficiency isimproved if the number of controls totals 3 (2174 SNVsfor 119873 = 53) In addition to phenocopy filters that takereduced penetrance into account also work reasonably well ifhalf of the exome samples (1198732) are controls For examplethe expected number of SNVs in which 80 of affectedindividuals and 20 of controls have the genotype 119860119860119877119860
was 2851 and 002 for119873 = 20 and 50 respectively
34 Unrelated Individuals and Recessive Disease Thenumberof SNVs after filtering in recessive disease shows a similartendency to SNVs in dominant disease as shown in Figures3(a) and 3(b) Table 3 lists some of the values used in Figure 3Without controls filtering does not work well particularlywhen phenocopy is taken into account With controlsfiltering efficiency is highly improved even when phenocopyand reduced penetrance are considered However filteringefficiency for recessive disease is at most ten times highercompared to dominant disease For example stringent filter-ing of 119873 = 100 without a control resulted in an expectednumber of SNVs of 124975 for dominant disease but only6667 for recessive disease Using stringent filtering theexpected number of SNVs for recessive disease was
120579
2119873 (20)
which is derived from (7) or directly from (4) by substituting119899119860
= 2119873 In contrast the expected number of SNVs fordominant disease is represented as
2119873
sum
119894=119873
120579
119894
2(2119873minus119894)
(2119873
2119873minus119894)
(2119873
2119873minus119894)
(21)
which is derived from (9) and (10)
35 Full-Sibs with and without Controls The expected num-ber of SNVs after filtering in the case of full-sibs for dominantdisease is shown in Figure 4 Table 4 lists several of the
values used in Figure 4 Filtering efficacy in sibs was clearlyworse than that in unrelated individuals (cf Figure 4(a) withFigure 2(a)) For a given sample size119873 the expected numberof SNVs for 100 90 and 80 filtering was relativelysimilar compared to unrelated individuals There was also ahigher asymptotic value for 100 90 and 80 filteringTheasymptotic value was 31205794 = 999975 as explained belowbased on 100 filtering When the sample size 119873 is largeDNA sites in which the parents have genotypes 119877119877 times 119877119860 or119877119860times119877119860 are removed by filtering because a certain proportionof sibs have the genotype 119860119860 (Table 1) In contrast even ifthe sample size is large DNA sites in which the parents havegenotypes of119877119877times119860119860119877119860times119860119860 or119860119860times119860119860 are not removedand the expected site is shown as 1205796 + 1205793 + 1205794 = 31205794
(Table 1) With 90 and 80 filtering this is correctHowever the situation drastically improved when we
used controls (Figure 4(b)) For a given sample size 119873 theexpected number of SNVs in sibs was comparable to theexpected number in unrelated individuals For example ifhalf of the exome samples were controls the expected SNVsin which at least 80 of affected individuals and at most 20of controls have the genotype 119860119860119877119860 were 48769 (119873 = 10)2851 (119873 = 20) and 002 (119873 = 50) when unrelated exomeswere used and 51268 (119873 = 10) 4085 (119873 = 20) and 006 (119873 =
50) when full-sibs exomes were usedThe number of SNVs after filtering in sibs for recessive
disease shows a similar tendency to dominant disease asshown in Figures 5(a) and 5(b) Table 5 lists some of thevalues used in Figure 5 Without controls the efficiency offiltering in sibs was clearly worse The asymptotic value forrecessive disease was 1205794 = 333325 which was obtained thesame way as for dominant disease The number of SNVs forrecessive disease reached asymptotic values for 100 90and 80 filtering faster than for dominant disease The effectof controls in recessive and dominant disease was high Fora given sample size 119873 the expected number of SNVs in sibswas comparable to that in unrelated individuals For exampleif half of the exome samples were controls the expected SNVsin which at least 80 of affected individuals and at most 20of controls have the genotype 119860119860 were 20370 (119873 = 10) 1186(119873 = 20) and 001 (119873 = 50) when unrelated exomes wereused and 20009 (119873 = 10) 1426 (119873 = 20) and 002 (119873 = 50)when full-sibs exomes were used
36 Assumptions We assumed that 119899 + 1 haploid sequenceswere randomly sampled from a population under theWright-Fisher diffusion model with a constant population size with119899 = 2119873 in 119873 unrelated individuals and 119899 = 2 infull-sibs (Figures 1(e) and 1(f)) The infinite-site model ofneutral mutations was also assumedThe expected frequencyspectrum of 119899 + 1 sequences is represented by formula (1)All of the results derived from this method are based on thisformula However human populations have expanded andmutations in non-synonymous sites are not at least strictlyneutral but might be averagely deleterious which may skewthe frequency spectrum toward rare variants (eg see [9] forpopulation expansion and [10] for non-synonymous muta-tions) The skew is more pronounced when the sample size islarge (eg 500) but not when the sample size is small [9] In
10 Computational and Mathematical Methods in Medicine
0 20 40 60 80 100
0
2000
4000
6000
8000
10000
119873
AA 100AA 90AA 80
E[S
NV
s]
(a)
0 20 40 60 80 100
0
1000
2000
3000
4000
119873
119873119886 = 1198732 119873119888 = 1198732AA 100 (a) 0 (c)119873119886 = 119873 minus 1 119873119888 = 1AA 100 (a) 0 (c)
119873119886 = 119873 minus 1 119873119888 = 1AA ge 80 (a) 0 (c)
119873119886 = 119873 minus 3 119873119888 = 3AA ge 80 (a) 0 (c)119873119886 = 1198732 119873119888 = 1198732AA ge 80 (a) le 20 (c)
E[S
NV
s]
(b)
Figure 3The expected number of SNVs after filtering in recessive disease using unrelated individuals (a) without control using and (b) withcontrols
Table 3 The expected number of SNVs after filtering in recessive disease using unrelated individuals
119873
119873119886= 119873
119873119886= 1198732
119873119888= 1198732
119873119886= 119873 minus 1
119873119888= 1
119873119886= 119873 minus 1
119873119888= 1
119873119886= 119873 minus 3
119873119888= 3
119873119886= 1198732
119873119888= 1198732
119860119860 100 119860119860 90 119860119860 80 119860119860 100 (119886)0 (119888)
119860119860 100 (119886)0 (119888)
119860119860 ge80 (119886)0 (119888)
119860119860 ge80 (119886)0 (119888)
119860119860 ge80 (119886)le20 (119888)
1 666650 mdash mdash mdash mdash mdash mdash mdash2 333325 mdash mdash 333325 333325 mdash mdash mdash3 222217 mdash mdash mdash 111108 mdash mdash mdash4 166663 mdash mdash 55554 55554 mdash mdash mdash5 133330 mdash 299993 mdash 33333 mdash mdash mdash10 66665 140737 224068 529 7407 mdash mdash 2037011 60605 mdash mdash mdash 6060 42255 mdash mdash13 51281 mdash mdash mdash 4273 mdash 4183 mdash20 33333 105455 186336 000 1754 mdash mdash 118621 31745 mdash mdash mdash 1587 27610 mdash mdash23 28985 mdash mdash mdash 1317 mdash 1573 mdash50 13333 84318 163771 mdash 272 mdash mdash 00151 13072 mdash mdash mdash mdash 19984 mdash mdash53 12578 mdash mdash mdash mdash mdash 680 mdash100 6667 77277 156262 mdash mdash mdash mdash mdash
Computational and Mathematical Methods in Medicine 11
0 20 40 60 80 100
0
5000
10000
15000
20000
119873
AARA 100AARA 90AARA 80
E[S
NV
s]
(a)
0 20 40 60 80 100
0
2000
4000
6000
8000
119873
119873119886 = 1198732 119873119888 = 1198732AARA 100 (a) 0 (c)119873119886 = 119873 minus 1 119873119888 = 1AARA 100 (a) 0 (c)
119873119886 = 119873 minus 1 119873119888 = 1AARA ge 80 (a) 0 (c)
119873119886 = 119873 minus 3 119873119888 = 3AARA ge 80 (a) 0 (c)119873119886 = 1198732 119873119888 = 1198732AARA ge 80 (a) le 20 (c)
E[S
NV
s]
(b)
Figure 4 The expected number of SNVs after filtering in dominant disease using full-sibs (a) without control using and (b) with controls
Table 4 The expected number of SNVs after filtering in dominant disease using full-sibs
119873
119873119886= 119873
119873119886= 1198732
119873119888= 1198732
119873119886= 119873 minus 1
119873119888= 1
119873119886= 119873 minus 1
119873119888= 1
119873119886= 119873 minus 3
119873119888= 3
119873119886= 1198732
119873119888= 1198732
119860119860119877119860100 119860119860119877119860 90 119860119860119877119860 80 119860119860119877119860 100 (119886)
0 (119888)119860119860119877119860 100 (119886)
0 (119888)
119860119860119877119860ge80 (119886)0 (119888)
119860119860119877119860ge80 (119886)0 (119888)
119860119860119877119860ge80 (119886)le20 (119888)
1 1999950 mdash mdash mdash mdash mdash mdash mdash2 1583294 mdash mdash 416656 416656 mdash mdash mdash3 1354133 mdash mdash mdash 229161 mdash mdash mdash4 1223928 mdash mdash 98956 130205 mdash mdash mdash5 1147107 mdash 1531212 mdash 76821 mdash mdash mdash10 1026305 1122751 1306481 1405 9645 mdash mdash 5126811 1019397 mdash mdash mdash 6908 94855 mdash mdash13 1010696 mdash mdash mdash 3682 mdash 12764 mdash20 1001386 1040802 1192223 001 471 mdash mdash 408521 1001033 mdash mdash mdash 353 50032 mdash mdash23 1000570 mdash mdash mdash 198 mdash 3866 mdash50 999975 1003107 1116522 mdash 000 mdash mdash 00651 999975 mdash mdash mdash mdash 29141 mdash mdash53 999975 mdash mdash mdash mdash mdash 1823 mdash100 999975 1000036 1066120 mdash mdash mdash mdash mdash
12 Computational and Mathematical Methods in Medicine
0 20 40 60 80 100
0
2000
4000
6000
8000
10000
119873
AA 100AA 90AA 80
E[S
NV
s]
(a)
0 20 40 60 80 100
0
1000
2000
3000
4000
119873
119873119886 = 1198732 119873119888 = 1198732AA 100 (a) 0 (c)119873119886 = 119873 minus 1 119873119888 = 1AA 100 (a) 0 (c)
119873119886 = 119873 minus 1 119873119888 = 1AA ge 80 (a) 0 (c)
119873119886 = 119873 minus 3 119873119888 = 3AA ge 80 (a) 0 (c)119873119886 = 1198732 119873119888 = 1198732AA ge 80 (a) le 20 (c)
E[S
NV
s]
(b)
Figure 5 The expected number of SNVs after filtering in recessive disease using full-sibs (a) without control using and (b) with controls
Table 5 The expected number of SNVs after filtering in recessive disease using full-sibs
119873
119873119886= 119873
119873119886= 1198732
119873119888= 1198732
119873119886= 119873 minus 1
119873119888= 1
119873119886= 119873 minus 1
119873119888= 1
119873119886= 119873 minus 3
119873119888= 3
119873119886= 1198732
119873119888= 1198732
119860119860 100 119860119860 90 119860119860 80 119860119860 100 (119886)0 (119888)
119860119860 100 (119886)0 (119888)
119860119860 ge80 (119886)0 (119888)
119860119860 ge80 (119886)0 (119888)
119860119860 ge80 (119886)le20 (119888)
1 666650 mdash mdash mdash mdash mdash mdash mdash2 472210 mdash mdash 194440 194440 mdash mdash mdash3 395823 mdash mdash mdash 76387 mdash mdash mdash4 362838 mdash mdash 43402 32985 mdash mdash mdash5 347648 mdash 423601 mdash 15191 mdash mdash mdash10 333759 338112 357815 537 435 mdash mdash 2001911 333542 mdash mdash mdash 217 12291 mdash mdash13 333379 mdash mdash mdash 054 mdash 3116 mdash20 333325 333414 335951 000 000 mdash mdash 142621 333325 mdash mdash mdash 000 1313 mdash mdash23 333325 mdash mdash mdash 000 mdash 328 mdash50 333325 333325 333330 mdash 000 mdash mdash 00251 333325 mdash mdash mdash mdash 003 mdash mdash53 333325 mdash mdash mdash mdash mdash 001 mdash100 333325 333325 333325 mdash mdash mdash mdash mdash
Computational and Mathematical Methods in Medicine 13
addition the reference sequence is known to be a mosaic of anumber of humanDNAThe fact does not affect the expectednumber of candidate SNVs since any small chromosomalregion or anyDNA site of the reference sequence is still a hap-loid sample from a population On the other hand our resultsmay be affected by the fact that the reference sequence and theexome sequences have different ethnic background But it issurely that those are derived from a human population As awhole the expected frequency spectrum given by (1) is roughapproximation and the effect of various filtering mannerincorporating modes of inheritance incomplete penetranceor phenocopy and control on the number of candidate SNVscan be assessed as described above
4 Conclusions and Practical Implications
Using a standard population genetics model we modeledexome analysis for Mendelian disease and developed amethod for calculating the expected number of candidateSNVs after filtering under a ldquono genetic heterogeneityrdquoassumption Exome sequences of unrelated individuals andfull-sibs were considered with and without controls for dom-inant and recessive diseases Without controls particularlyfor full-sibs the filtering approach had poor efficiency inreducing the number of candidate SNVs even when using astringent filter (Figures 2(a) 3(a) 4(a) and 5(a)) With con-trols the filtering efficacy was considerably improved evenwhen incorporating phenocopy or incomplete penetrance(Figures 2(b) 3(b) 4(b) and 5(b)) This was true in cases ofunrelated individuals and full-sibs for dominant and recessivediseases
For rare dominant diseases it is plausible that affectedindividuals in a pedigree share one disease-causing vari-ant even if the disease shows genetic heterogeneity Thisindicates that the assumption of ldquono genetic heterogeneityrdquois appropriate because the frequencies of variants of therare disease are also rare in a population and only onefounder in the pedigree should have one of the disease-causing variants (eg see Sobreira et al [5] or Wang etal [11]) For rare recessive diseases affected members in apedigree generally do not share one disease-causing variantIt is possible that affected individuals in the pedigree may beldquocompound heterozygotesrdquo at a disease locus or heterozygoticfor two disease-causing variants in a gene (eg Lalonde etal [12]) For a consanguineous pedigree with a rare recessivedisease the assumption of ldquono genetic heterogeneityrdquo is stillappropriate in that affected individuals in the pedigree areexpected to be autozygous for the disease-causing variant(eg see Walsh et al [13])
As described in Section 35 and shown in Figure 4(b)filtering by incorporating incomplete penetrance and pheno-copy can efficiently reduce the number of candidate SNVswhen the sample size is relatively large If the property ofresults for full-sibs is extrapolatable to those for general pedi-grees this means that filtering approach works well in caseof a pedigree data for dominant disease or a consanguineouspedigree data for recessive disease even in cases of incompletepenetrance and phenocopy The approach presented in this
study could provide general guidelines for sample size deter-mination in exome sequencing for Mendelian disease
Acknowledgments
The authors are grateful to Shigeki Nakagome for valuablecomments and discussions This work was supported byhealth labor sciences research Grant from The Ministry ofHealth Labour and Welfare (H23-jituyouka(nanbyou)-006and H23-kannen-005) and by the Grant of National Centerfor Global Health and Medicine (H22-302)
References
[1] The 1000 Genomes Project Consortium ldquoAn integrated map ofgenetic variation from 1092 human genomesrdquo Nature vol 491pp 56ndash65 2012
[2] T AManolio F S Collins N J Cox et al ldquoFinding themissingheritability of complex diseasesrdquo Nature vol 461 no 7265 pp747ndash753 2009
[3] S B Ng E H Turner P D Robertson et al ldquoTargeted captureandmassively parallel sequencing of 12 human exomesrdquoNaturevol 461 no 7261 pp 272ndash276 2009
[4] B Rabbani N Mahdieh K Hosomichi H Nakaoka and IInoue ldquoNext-generation sequencing impact of exome sequenc-ing in characterizing Mendelian disordersrdquo Journal of HumanGenetics vol 57 no 10 pp 621ndash632 2012
[5] N L Sobreira E T Cirulli D Avramopoulos et al ldquoWhole-genome sequencing of a single proband together with linkageanalysis identifies aMendelian disease generdquo PLoSGenetics vol6 no 6 Article ID e1000991 2010
[6] D Zhi and R Chen ldquoStatistical guidance for experimentaldesign and data analysis of mutation detection in rare mono-genic Mendelian diseases by exome sequencingrdquo PLoS ONEvol 7 no 2 Article ID e31358 2012
[7] Y X Fu ldquoStatistical properties of segregating sitesrdquo TheoreticalPopulation Biology vol 48 no 2 pp 172ndash197 1995
[8] B SWeirGenetic Data Analysis II Sinauer Associates Sunder-land Mass USA 1996
[9] AKeinan andAGClark ldquoRecent explosive humanpopulationgrowth has resulted in an excess of rare genetic variantsrdquoScience vol 336 no 6082 pp 740ndash743 2012
[10] Y Li N Vinckenbosch G Tian et al ldquoResequencing of 200human exomes identifies an excess of low-frequency non-synonymous coding variantsrdquo Nature Genetics vol 42 no 11pp 969ndash972 2010
[11] J L Wang X Yang K Xia et al ldquoTGM6 identified as a novelcausative gene of spinocerebellar ataxias using exome sequen-cingrdquo Brain vol 133 pp 3510ndash3518 2010
[12] E Lalonde S Albrecht K C H Ha et al ldquoUnexpected allelicheterogeneity and spectrum of mutations in fowler syndromerevealed by next-generation exome sequencingrdquoHumanMuta-tion vol 31 pp 1ndash6 2010
[13] T Walsh H Shahin T Elkan-Miller et al ldquoWhole exomesequencing and homozygosity mapping identify mutation inthe cell polarity protein GPSM2 as the cause of nonsyndromichearing loss DFNB82rdquo American Journal of Human Geneticsvol 87 no 1 pp 90ndash94 2010
Submit your manuscripts athttpwwwhindawicom
Stem CellsInternational
Hindawi Publishing Corporationhttpwwwhindawicom Volume 2014
Hindawi Publishing Corporationhttpwwwhindawicom Volume 2014
MEDIATORSINFLAMMATION
of
Hindawi Publishing Corporationhttpwwwhindawicom Volume 2014
Behavioural Neurology
EndocrinologyInternational Journal of
Hindawi Publishing Corporationhttpwwwhindawicom Volume 2014
Hindawi Publishing Corporationhttpwwwhindawicom Volume 2014
Disease Markers
Hindawi Publishing Corporationhttpwwwhindawicom Volume 2014
BioMed Research International
OncologyJournal of
Hindawi Publishing Corporationhttpwwwhindawicom Volume 2014
Hindawi Publishing Corporationhttpwwwhindawicom Volume 2014
Oxidative Medicine and Cellular Longevity
Hindawi Publishing Corporationhttpwwwhindawicom Volume 2014
PPAR Research
The Scientific World JournalHindawi Publishing Corporation httpwwwhindawicom Volume 2014
Immunology ResearchHindawi Publishing Corporationhttpwwwhindawicom Volume 2014
Journal of
ObesityJournal of
Hindawi Publishing Corporationhttpwwwhindawicom Volume 2014
Hindawi Publishing Corporationhttpwwwhindawicom Volume 2014
Computational and Mathematical Methods in Medicine
OphthalmologyJournal of
Hindawi Publishing Corporationhttpwwwhindawicom Volume 2014
Diabetes ResearchJournal of
Hindawi Publishing Corporationhttpwwwhindawicom Volume 2014
Hindawi Publishing Corporationhttpwwwhindawicom Volume 2014
Research and TreatmentAIDS
Hindawi Publishing Corporationhttpwwwhindawicom Volume 2014
Gastroenterology Research and Practice
Hindawi Publishing Corporationhttpwwwhindawicom Volume 2014
Parkinsonrsquos Disease
Evidence-Based Complementary and Alternative Medicine
Volume 2014Hindawi Publishing Corporationhttpwwwhindawicom
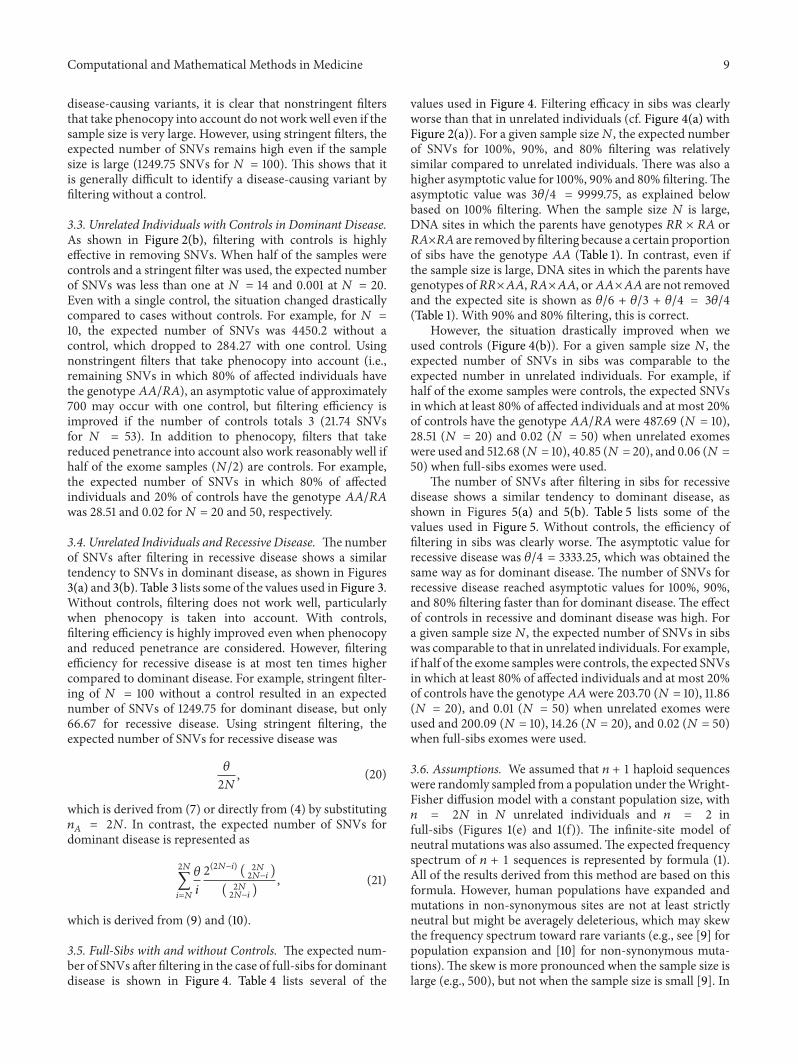


![A Genome-Wide Association Scan on the Levels of Markers of … · 2013. 12. 10. · the ImmunoChip (151,085 variants) [12] and the MetaboChip (142,790 variants, of which 9,920 overlapped](https://img.dokumen.tips/doc/110x75/60a4d4c7911a634e2c75ef62/a-genome-wide-association-scan-on-the-levels-of-markers-of-2013-12-10-the-immunochip.jpg)


![Structural Variants in the Soybean Genome Localize to · PDF fileGenome Analysis Structural Variants in the Soybean Genome Localize to Clusters of Biotic Stress-Response Genes1[W][OA]](https://img.dokumen.tips/doc/110x75/5ab8426c7f8b9ad5338c9ea4/structural-variants-in-the-soybean-genome-localize-to-analysis-structural-variants.jpg)

![Small Variants Frequently Asked Questions (FAQ)Variants+FAQ.pdf · How do I identify somatic small variants? ... coverage-[ASM-ID].tsv: Reports number of bases in the reference genome](https://img.dokumen.tips/doc/110x75/5aa87f797f8b9a90188b9758/small-variants-frequently-asked-questions-faq-variantsfaqpdfhow-do-i-identify.jpg)


![Genome-Wide Association Study Reveals Genetic …pure.au.dk/...al_1013_Genome_Wide_study...PLOS_One.pdfvariants, not ideal for accurate mapping of potential causal variants [5–7]](https://img.dokumen.tips/doc/110x75/5f0491ab7e708231d40e9e29/genome-wide-association-study-reveals-genetic-pureaudkal1013genomewidestudyplosonepdf.jpg)