Embed Size (px)
Citation preview

Research ArticleThe Friction of Saline Ice on Aluminium
Christopher Wallen-Russell1 and Ben Lishman1,2
1 Institute for Risk and Disaster Reduction, University College London, Gower Street, London WC1E6BT, UK2Department of Engineering, Portsmouth University, Anglesea Building, Anglesea Road, Portsmouth PO13DJ, UK
Correspondence should be addressed to Ben Lishman; [email protected]
Received 29 October 2015; Revised 29 February 2016; Accepted 23 March 2016
Academic Editor: Meng Hua
Copyright © 2016 C. Wallen-Russell and B. Lishman. This is an open access article distributed under the Creative CommonsAttribution License, which permits unrestricted use, distribution, and reproduction in any medium, provided the original work isproperly cited.
The friction of ice on other materials controls loading on offshore structures and vessels in the Arctic. However, ice friction iscomplicated, because ice in nature exists near to its melting point. Frictional heating can cause local softening and perhaps meltingand lubrication, thus affecting the friction and creating a feedback loop. Ice friction is therefore likely to depend on sliding speedand sliding history, as well as bulk temperature. The roughness of the sliding materials may also affect the friction. Here we presentresults of a series of laboratory experiments, sliding saline ice on aluminium, and controlling for roughness and temperature. Wefind that the friction of saline ice on aluminium 𝜇ice-al = 0.1 typically, but that this value varies with sliding conditions. We proposephysical models which explain the variations in sliding friction.
1. Introduction
Studies of the mechanisms behind the friction of ice affecta range of research areas, including winter sports [1], Arcticshipping and offshore structure design [2, 3], vehicle designfor ice road conditions [4], and glacier advance [5].The abilityto predict (and perhaps control) ice friction therefore haseconomic value and can improve our understanding of thecryosphere.
Ice friction is more difficult to model than dry friction,since the work done against friction releases heat, whichsoftens and sometimes melts the ice surface, changing thefriction coefficient and creating a feedback loop. A numberof recent studies have shown that the friction of ice on icedepends on temperature, on the speed of sliding, and alsoon the history of sliding but is independent of normal load[6–8]. Models of the friction of ice on ice incorporate the icehardness, the thermal properties of the ice, and assumptionsabout the nature of the asperity-asperity contacts whichgovern dry friction [7, 9, 10].
In this paper we investigate how the friction of sea iceon aluminium varies with temperature, surface roughness,sliding speed, and sliding history. We aim to improve theunderstanding of the nature of ice friction, and we choosealuminium as our secondary material for two reasons. First,
aluminium and its alloys are used in ships (e.g., the S. VPolaris, an aluminium-hulled vessel which has overwinteredin the Arctic), offshore structures, and other salt-water-sensitive coastal structures, but its friction on ice has notbeen studied (unlike, e.g., steel and concrete [11–13]). TheISO standard for Arctic Offshore Structures (ISO19906, [14])contains information on the friction of ice on steel andconcrete but not on other materials, so this research may addto the knowledge base for Arctic practitioners. Aluminium isalso used to make experimental equipment for research onsea ice [15] and its friction here is needed to interpret otherresults. Secondly, aluminium is significantly harder andmorethermally conductive than ice and thus provides a usefulcomparison to more conventional ice-ice sliding friction.Models of ice friction rely on comparisons between differentmaterials to distinguish the importance of various materialproperties [9] and so new experimental results, on previouslyunstudied materials, can provide supporting evidence fortheories of ice friction.
2. Materials and Methods
2.1. Ice Preparation. Discs of vertically orientated columnarsaline ice were grown in insulated (20 cm thick polystyrene)
Hindawi Publishing CorporationAdvances in TribologyVolume 2016, Article ID 1483951, 7 pageshttp://dx.doi.org/10.1155/2016/1483951

2 Advances in Tribology
10mm
x
y
60mm
x
z
Figure 1: Ice thin sections in the 𝑥-𝑦 plane and in the 𝑥-𝑧 plane,showing a columnar structure.
acrylic cylindrical tanks in the Rock and Ice Physics coldroom facilities at UCL. Discs were grown to ∼100–110mmin depth with an air temperature of −10∘C [6, 16]. The icehad typical grain dimensions 10mm in the horizontal (𝑥-𝑦)plane and 50mm in the vertical (𝑧) direction. The insulationmeant that only the upper surface of the ice was exposed tothe cold environment, leading to unidirectional cooling likethat observed in natural sea ice growth. Heating elementsunderneath the tanks kept the saline water reservoir around−2∘C. The ice was frozen from a mixture of water and 33 g/Lsalt, leading to bulk ice salinity close to 8 ppt.Thin sections ofthe ice, showing the crystal structure, are shown in Figure 1.Oblong blocks of dimensions 240mm × 90mm × 90mmwere cut using a bandsaw. These blocks were then refined ona mill to give two pairs of polished parallel surfaces.
2.2. Experimental Setup. Figure 2 shows the experimentalsetup: a double shear configuration, with the central sliderblock made out of saline ice, flanked on either side by alu-minium blocks sitting on pedestals. A hydraulic load frame(the black frame in Figure 2) is used to create a side load (alsocalled the normal load), and a hydraulic actuator providesthe load to slide the central block between the aluminiumones.This is also referred to as a shear load.The instantaneouscoefficient of friction is then given by the shear load dividedby twice the normal load (since the normal load acts on twofaces). The entire load frame with blocks sits in an environ-mental chamber to allow the temperature to be controlled.
Two types of experiments were performed: “hold time”and “staggered speed.” These experiments allow us to under-stand how static friction evolves and how dynamic frictionchanges with sliding speed. Overall, 16 “hold time” exper-iments were conducted under different conditions and 22“staggered speed” experiments.
2.2.1. Hold Time Tests. For “hold time” tests, the central iceblock is moved at constant speed (5 × 10⁻⁴ms−1) for 20 s,interspersedwith periodswhere the block is notmoved. Typi-cally, the longer the block is left static, the greater the
force required to restart motion is. In these experimentswe investigate the effects of holding for 1 s, 10 s, 100 s, and1000 s. The static friction is then given as the maximummeasured friction during the higher loading which occursafter reinitiating movement.
2.2.2. Staggered Speed Tests. The central ice block is slidpast the aluminium blocks at velocities of 1 × 10⁻⁶ms−1, 1 ×10⁻⁵ms−1, 1 × 10⁻⁴ms−1, 1 × 10⁻³ms−1, and 1 × 10⁻²ms−1 con-secutively, for 100 s each. Friction is averaged over the periodduring which sliding is in steady-state (or across stick-slipcycles, discussed below).
Typical friction series for two different sliding speeds andfor a hold time test are shown in Figure 3. Stick-slip behaviouris clearly seen at a sliding speed of 1 × 10⁻⁴ms−1 in Figure 3(a).
In total, 5 ice blocks were used. We observed no cor-relation between results and the number of times a blockwas used. Normal/side load is applied shortly (<10 s) beforethe start of experiments. All loads and displacements arelogged at intervals of less than 100ms using load cells and dis-placement transducers which have been externally calibratedbefore use.
The aluminium blocks were polished with two differentgrades of abrasive paper on two sides to give two controlledtypes of roughness. The “polished” aluminium was scrubbedwith silicon carbide waterproof electrocoated abrasivepaper of roughness CW-600. “Rough” aluminium was handscrubbed with abrasive paper of P120 roughness. The blockshad dimensions of 300 × 100 × 100mm. Depending on thedesired conditions of the experiment, the aluminium blockswere rotated to have either “rough” or “polished” sides incontact with the central sliding ice block. In all experiments,the direction of sliding of the ice was perpendicular to thecolumnar ice grains (cf. [10]).
3. Results
We run hold time tests and staggered speed tests for two dif-ferent temperatures (−2∘C and −10∘C) and two different typesof aluminium roughness. The (time-varying) friction coeffi-cient was calculated as the shear load divided by twice thenormal load (since friction occurs over two separate contactplanes). Side loads throughout were approximately 1 kN,applied with a lockable manual hydraulic pump. The normalload was observed to decrease during experiments, probablybecause of a slight leak of hydraulic oil. This decrease wasnever greater than 10% of the original normal load and wasaccounted for in the results presented.
3.1. Hold Time Experiments
3.1.1. Effect of Varying Aluminium Roughness. Figure 4 showsa comparison of the effects of hold time on polished andrough aluminium at −2∘C. Figure 5 shows the same com-parison at −10∘C. Markers on the plots are equivalent to themarkers shown in Figure 3(c).The lines represent logarithmicbest fits and allow comparison with other hold time experi-ments [6, 10]. At−2∘C, the roughness of the surface has a cleareffect on the coefficient of static friction: the static friction on

Advances in Tribology 3
xz
y
(a)
x
z
y
Actuator
Aluminiumblocks
Hydraulic sideload plates
Ice block
(b)
Figure 2: (a) shows the loading apparatus, comprising a 20 T uniaxial compression rig, an environmental chamber, and a shear loading frame;(b) shows a close-up of the shear load frame.
10−4 ms−1
30 60 90 1200Time (s)
0.04
0.06
0.08
0.1
0.12
0.14
Coe
ffici
ent o
f slid
ing
fric
tion,
𝜇
(a)
10−2 ms−1
0.04
0.06
0.08
0.1
0.12
0.14C
oeffi
cien
t of s
lidin
g fr
ictio
n,𝜇
10 20 30 40 500Time (s)
(b)
10 20 30 40 50 600Displacement (mm)
Coe
ffici
ent o
f fric
tion,
𝜇
0
0.02
0.04
0.06
0.08
(c)
Figure 3: Example plots showing variations in the coefficient of friction. (a) Friction against time, V𝑠
= 10−4ms−1, rough aluminium at −2∘C;(b) friction against time, V
𝑠
= 10−2ms−1, rough aluminium at −2∘C; (c) friction against displacement from a typical hold time test (−2∘C,polished aluminium). Increases in static friction following periods of static contact are clear at 20, 29, 38, and 47mm of displacement and aremarked on the plot.
the rougher surface is approximately double that on thesmoother surface. At −10∘C, no such difference is observed:the behaviour is almost independent of aluminium roughness.
3.1.2. Effect of Varying Temperature. In Figures 6 and 7 wereplot the data from Figures 4 and 5 to show the effects of
varying temperature. Figure 6 shows a comparison of frictionon polished aluminiumat−10∘Cand−2∘C, and it is clear fromthis figure that static friction is higher at lower temperatures.Figure 7 shows a similar comparison for rough aluminium.Here the effects of varying temperature are less pronounced,but the static friction is still higher at lower temperatures.
4 Advances in Tribology
1 10 100 1000 100000.1Hold time (s)
Coe
ffici
ent o
f sta
tic fr
ictio
n,𝜇
−2∘C rough aluminium−2∘C polished aluminium
0
0.04
0.08
0.12
0.16
0.2
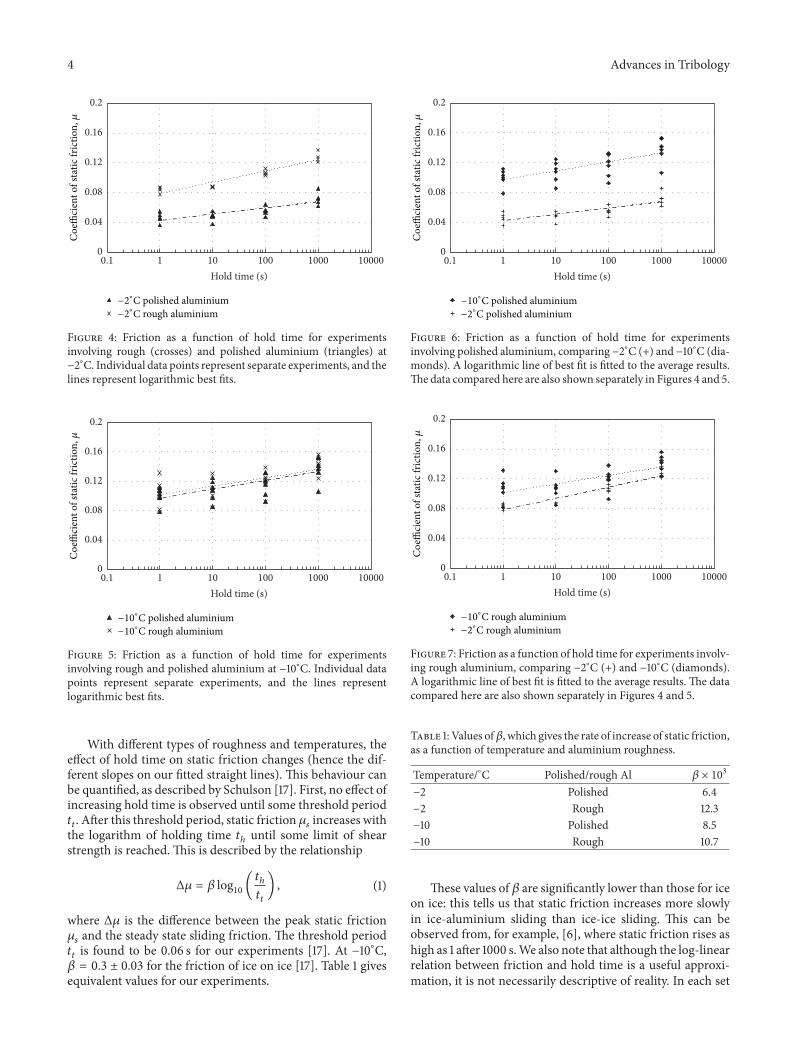
Figure 4: Friction as a function of hold time for experimentsinvolving rough (crosses) and polished aluminium (triangles) at−2∘C. Individual data points represent separate experiments, and thelines represent logarithmic best fits.
1 10 100 1000 100000.1Hold time (s)
Coe
ffici
ent o
f sta
tic fr
ictio
n,𝜇
−10∘C rough aluminium−10∘C polished aluminium
0
0.04
0.08
0.12
0.16
0.2
Figure 5: Friction as a function of hold time for experimentsinvolving rough and polished aluminium at −10∘C. Individual datapoints represent separate experiments, and the lines representlogarithmic best fits.
With different types of roughness and temperatures, theeffect of hold time on static friction changes (hence the dif-ferent slopes on our fitted straight lines). This behaviour canbe quantified, as described by Schulson [17]. First, no effect ofincreasing hold time is observed until some threshold period𝑡𝑡. After this threshold period, static friction 𝜇
𝑠increases with
the logarithm of holding time 𝑡ℎuntil some limit of shear
strength is reached. This is described by the relationship
Δ𝜇 = 𝛽 log10
(𝑡ℎ
𝑡𝑡
) , (1)
where Δ𝜇 is the difference between the peak static friction𝜇𝑠and the steady state sliding friction. The threshold period𝑡𝑡is found to be 0.06 s for our experiments [17]. At −10∘C,𝛽 = 0.3 ± 0.03 for the friction of ice on ice [17]. Table 1 givesequivalent values for our experiments.
Coe
ffici
ent o
f sta
tic fr
ictio
n,𝜇
1 10 100 1000 100000.1Hold time (s)
0
0.04
0.08
0.12
0.16
0.2
−10∘C polished aluminium−2∘C polished aluminium
Figure 6: Friction as a function of hold time for experimentsinvolving polished aluminium, comparing −2∘C (+) and −10∘C (dia-monds). A logarithmic line of best fit is fitted to the average results.The data compared here are also shown separately in Figures 4 and 5.
Coe
ffici
ent o
f sta
tic fr
ictio
n,𝜇
1 10 100 1000 100000.1Hold time (s)
0
0.04
0.08
0.12
0.16
0.2
−2∘C rough aluminium−10∘C rough aluminium
Figure 7: Friction as a function of hold time for experiments involv-ing rough aluminium, comparing −2∘C (+) and −10∘C (diamonds).A logarithmic line of best fit is fitted to the average results. The datacompared here are also shown separately in Figures 4 and 5.
Table 1: Values of𝛽, which gives the rate of increase of static friction,as a function of temperature and aluminium roughness.
Temperature/∘C Polished/rough Al 𝛽 × 103
−2 Polished 6.4−2 Rough 12.3−10 Polished 8.5−10 Rough 10.7
These values of 𝛽 are significantly lower than those for iceon ice: this tells us that static friction increases more slowlyin ice-aluminium sliding than ice-ice sliding. This can beobserved from, for example, [6], where static friction rises ashigh as 1 after 1000 s.We also note that although the log-linearrelation between friction and hold time is a useful approxi-mation, it is not necessarily descriptive of reality. In each set

Advances in Tribology 5
0.030
0.079 0.089 0.073 0.083
0.026 0.039 0.054 0.054 0.037
−2∘C rough aluminium−2∘C polished aluminium
0
0.05
0.1
0.15
0.2
0.25
Coe
ffici
ent o
f fric
tion,
𝜇
1E − 011E − 05 1E − 04 1E − 03 1E − 021E − 061E − 07
Sliding velocity (ms−1)
Figure 8: Friction as a function of sliding speed for ice on alu-minium, showing results for rough and polished aluminium at−2∘C.
1E − 06 1E − 05 1E − 04 1E − 03 1E − 02 1E − 011E − 07
Sliding velocity (ms−1)
0
0.05
0.1
0.15
0.2
0.25
Coe
ffici
ent o
f fric
tion,
𝜇
0.055
0.121
0.140
0.108 0.120
0.054
0.1220.134
0.130 0.127
−10∘C rough aluminium−10∘C polished aluminium
Figure 9: Friction as a function of sliding speed for ice onaluminium, showing results for rough and polished aluminium at−10∘C.
of hold time results shown here, the average value for frictionafter 10 s hold falls below the log-linear best fit line, suggestingthat the true relationship curves upwards (in log-linear space)with hold time. Finally, we note that these results are limitedto static hold times up to 1000 s and may not be valid forlonger contact times. One limit is clear: the frictional strengthof the contact cannot be greater than the shear strength of theice, or the ice would fail in shear rather than frictional sliding.
3.2. Staggered Speed Experiments. Figures 8–11 show thefriction of ice on aluminium measured during our stag-gered speed experiments, as described above. Stick-slip typebehaviour, in which loads cyclically build up and then col-lapse as the ice block moves, was observed inmany of the lowspeed (V
𝑠≤ 10−4ms−1) experiments. The vertical bars on data
points represent the extent of the largest stick-slip deviationfrom the mean (typically the stick-slip cycles are approxi-mately symmetric about the mean), while the main markerrepresents the time-averaged force. At higher speeds, slidingis smoother.
1E − 06 1E − 05 1E − 04 1E − 03 1E − 02 1E − 011E − 07
Sliding velocity (ms−1)
−10∘C rough aluminium
0.0554
0.12130.1398
0.1080 0.1204
0.030
0.079 0.0890.073 0.083
−2∘C rough aluminium
0
0.05
0.1
0.15
0.2
0.25
Coe
ffici
ent o
f fric
tion,
𝜇
Figure 10: Friction as a function of sliding speed for ice on alu-minium, showing results for rough aluminium at −10∘C and −2∘C.The data compared here are also shown separately in Figures 8 and 9.
1E − 06 1E − 05 1E − 04 1E − 03 1E − 02 1E − 011E − 07
Sliding velocity (ms−1)
0.054
0.1220.134 0.130 0.127
0.0260.039
0.054 0.054 0.037
−10∘C polished aluminium−2∘C polished aluminium
0
0.05
0.1
0.15
0.2
0.25
Coe
ffici
ent o
f fric
tion,
𝜇
Figure 11: Friction as a function of sliding speed for ice on alu-minium, showing results for polished aluminium at−10∘Cand−2∘C.The data compared here are also shown separately in Figures 8 and 9.
3.2.1. Effect of Varying Aluminium Roughness. Figure 8 showsthe dynamic friction coefficient of ice against rough andpolished aluminium at −2∘C. Friction (as a function ofsliding speed) peaks around 10−4ms−1 and is higher on roughaluminium than on smooth aluminium. Figure 9 shows thesame experiments at −10∘C. Again, friction is highest around10−4ms−1, but here the roughness of the aluminium has littleeffect on the sliding friction.
3.2.2. Effect of Varying Temperature. In Figures 10 and 11 wereplot the data from Figures 8 and 9 to show the effects ofvarying temperature. We find, for both rough and smoothaluminium, that dynamic friction is higher at −10∘C than at−2∘C.
4. Discussion
The results presented above demonstrate several generalprinciples.

6 Advances in Tribology
TheFrictionCoefficient of Ice onAluminium Is around 0.1.Thisobservation appears to hold broadly. In many applications,the roughness, temperature, sliding speed, and sliding historyare not known, or a single figure is needed to cover a range ofconditions. For simplicity, in such situations, we recommendthat 𝜇 = 0.1. If higher friction values are more conservative(which may not always be the case) and a conservative valuefor friction is needed, then a choice of 𝜇 = 0.2 wouldencompass all of our results.
The Dynamic Friction of Ice on Aluminium Is QualitativelySimilar to the Friction of Ice on Ice. At very low speeds,ice friction increases with increasing speed. In this regimefrictional heating plays aminimal role. Interlocking asperitieson the ice surface resist sliding and must be sheared ordeformed.When the slip rate increases, dislocations have lesstime to align, and so the asperities are stronger and frictionis correspondingly higher [17]. At some speed peak frictionis reached. Above this speed, the energy of friction warmsthe ice, which causes it to soften and may lead to lubricationat the sliding interface and also at grain boundaries near thesliding interface. In this regime, increasing the sliding speedleads to more energy dissipation, more softening or melt, andhence lower friction [6]. This behaviour has been repeatedlyobserved in ice-ice friction [6–8, 18], and here we see similarbehaviour in the friction of ice on aluminium.
In all our experiments we measure maximum friction atsliding speeds of 10−4ms−1, which suggests that maximumfriction occurs between 10−5 and 10−3ms−1.
Static Friction between Ice and Aluminium Increases withContact Time. If an interface is left under normal loadingfor some length of time, then the force required to reinitiatemovement increases with the log of contact time. The mech-anism which causes this is that asperities creep over time,becoming broader, and increasing the true contact area. Thisincreased true contact area leads to increased friction [10].
Our static friction results are quantified by the parameter𝛽, whichmeasures the extent to which friction increases withthe log of contact time (this is equivalent to the slope of thebest-fit lines on the graphs under “hold time experiments”).In experiments measuring the friction of ice on ice, 𝛽 wasfound to be around 0.3, and𝛽has been shown to be around 0.1for the friction of ice on steel and ice on PMMA (plexiglass)[19]. Our measured values for 𝛽 are significantly lower,around 0.01: we find that even 1000 s hold (around quarterof an hour) leads to an increase in friction of less than 0.1.Similar hold times for ice-ice friction lead to static frictionwhich is higher than kinetic friction by 0.5–1. Healing andstrengthening in our experiments are considerably lowerthan in comparable experiments with other materials. Onepossible explanation for this is that aluminium, which hasa high thermal conductivity (∼200Wm−1K−1, comparedto ∼20Wm−1K−1 for steel, ∼2Wm−1K−1 for ice, and ∼0.2Wm−1K−1 for PMMA), conducts heat away from the slid-ing interface more quickly, and thus the contacting asperitiesare colder and deform less under normal load.
Friction Is Higher at −10∘C than at −2∘C. This is perhapsnot surprising: at −2∘C more softening occurs and melting ismore likely, so the higher temperature leads to lower friction.
The Importance of Roughness Is More Pronounced at −2∘Cthan at −10∘C. In both our hold time experiments andour staggered-speed experiments, rough aluminium leads tomarkedly higher friction than polished aluminium at −2∘Cbut roughness has little effect at −10∘C.This may be related tosoftening effects. The rougher material has larger asperities(this is what causes roughness). At temperatures close tomelting, these asperities in the harder material (aluminium)indent the softer material (ice) and cause a high true contactarea, leading to higher friction. At lower temperatures, theice is less ductile, so indentation may be lower and truecontact area (and friction) less affected by the roughness ofthe aluminium. We note here that ice, as the softer material,is abraded more quickly, and so the initial roughness of theice is less likely to affect the steady-state friction [20].
Critical Slip. Critical slip is a measurement of the durationof the effects of static friction [21]. The friction decays withsliding, from the peak static friction to the steady-state kineticsliding friction, and critical slip defines the point at whichfriction is equal to kinetic friction plus 1/𝑒 of this range. Herewe use only one sliding speed in our hold time experiments,so we are unable to determine whether critical slip is betterrepresented as a time or a distance: on average it occurs over1.57mmor 3.36 s, which is in good agreementwith the criticalslip time of 3 s reported in Lishman et al. [21].
Stick-Slip Friction. Stick-slip frictionwas frequently observed,particularly during experiments at 10−4ms−1 or less (see Fig-ure 3). Stick-slip is usually understood as a system propertyand depends on the stiffness of the actuator system [19,22]. Forces rise as the sliding block remains stationary andelastic energy is built up in the actuator. At some stage theseforces are sufficient to overcome the static friction, leading todynamic sliding with lower friction and a relaxation of theactuator. This pattern repeats cyclically. At speeds measuredin mms−1 and cms−1 we do not see stick-slip, so it seems thatstick-slip behaviour is more likely to be seen in controlledlaboratory experiments than in faster-moving sliding in theArctic.
5. Conclusions
The friction of ice on aluminium is qualitatively similar to thefriction of ice on ice: it shows slip-rate-strengthening at lowspeeds, where frictional warming is negligible, and slip-rate-weakening at high speeds once warming leads to softeningof the ice (and possible increased lubrication). Further, staticfriction is higher thandynamic friction, probably due to creepof asperities during static contact. Static friction increasesmore slowly (i.e., increases less with hold time) for ice onaluminium than for ice on ice, ice on steel, or ice on PMMA(plexiglass). Friction varieswith temperature andwith rough-ness of the harder material, as predicted by intuitive models.

Advances in Tribology 7
Stick-slip friction was observed between sea ice and alu-minium. These results may inform experiments where iceinteracts with aluminium andmay also prove useful to Arcticdesigners and practitioners. Further, the results show that thealuminium roughness affects the friction, particularly at tem-peratures close to melting: this result is likely to remain truefor ice sliding on othermetals and relatively hardmaterials. Incases where one number is needed to represent𝜇ice-al, the fric-tion of ice on aluminium, we recommend a value of 𝜇 = 0.1.
Competing Interests
The authors declare that they have no competing interests.
References
[1] P. A. Federolf, R. Mills, and B. Nigg, “Ice friction of flared icehockey skate blades,” Journal of Sports Sciences, vol. 26, no. 11,pp. 1201–1208, 2008.
[2] I. Metrikin, S. Løset, N. A. Jenssen, and S. Kerkeni, “Numericalsimulation of dynamic positioning in ice,” Marine TechnologySociety Journal, vol. 47, no. 2, pp. 14–30, 2013.
[3] L. Zhou, K. Riska, T. Moan, and B. Su, “Numerical modeling ofice loads on an icebreaking tanker: comparing simulations withmodel tests,” Cold Regions Science and Technology, vol. 87, pp.33–46, 2013.
[4] S. Ella, P.-Y. Formagne, V. Koutsos, and J. R. Blackford,“Investigation of rubber friction on snow for tyres,” TribologyInternational, vol. 59, pp. 292–301, 2013.
[5] J. Faillettaz, D. Sornette, and M. Funk, “Numerical modeling ofa gravity-driven instability of a cold hanging glacier: reanalysisof the 1895 break-off of Altelsgletscher, Switzerland,” Journal ofGlaciology, vol. 57, no. 205, pp. 817–831, 2011.
[6] B. Lishman, P. Sammonds, and D. Feltham, “A rate and statefriction law for saline ice,” Journal of Geophysical Research:Oceans, vol. 116, no. 5, Article ID C05011, 2011.
[7] E. M. Schulson and A. L. Fortt, “Friction of ice on ice,” Journalof Geophysical Research: Solid Earth, vol. 117, no. 12, 2012.
[8] S. Sukhorukov and S. Løset, “Friction of sea ice on sea ice,” ColdRegions Science and Technology, vol. 94, pp. 1–12, 2013.
[9] L. Makkonen andM. Tikanmaki, “Modeling the friction of ice,”Cold Regions Science and Technology, vol. 102, pp. 84–93, 2014.
[10] E. M. Schulson and A. L. Fortt, “Static strengthening offrictional surfaces of ice,”ActaMaterialia, vol. 61, no. 5, pp. 1616–1623, 2013.
[11] H. Saeki, T. Ono, N. Nakazawa, M. Sakai, and S. Tanaka, “Thecoefficient of friction between sea ice and variousmaterials usedin offshore structures,” Journal of Energy Resources Technology,vol. 108, no. 1, pp. 65–71, 1986.
[12] R. J. Frederking and A. Barker, “Friction of sea ice on steelfor condition of varying speeds,” in Proceedings of the TwelfthInternational Offshore and Polar Engineering Conference, Inter-national Society of Offshore and Polar Engineers, Kitakyushu,Japan, May 2002.
[13] B. Fiorio, J. Meyssonnier, and M. Boulon, “Experimental studyof the friction of ice over concrete under simplified ice-structureinteraction conditions,” Canadian Journal of Civil Engineering,vol. 29, no. 3, pp. 347–359, 2002.
[14] International Standards Organisation, “Petroleum and naturalgas industries—arctic offshore structures,” ISO 19906, Interna-tional Standards Organisation, 2010.
[15] R. Gagnon, “First lab tests of the Blade Runners concept forreducing ice induced vibration of structures,” in Proceedings ofthe 22nd IAHR Internation Symposiumon Ice, Singapore, August2014.
[16] E. Bailey, P. R. Sammonds, and D. L. Feltham, “The consolida-tion and bond strength of rafted sea ice,” Cold Regions Scienceand Technology, vol. 83-84, pp. 37–48, 2012.
[17] E. M. Schulson, “Low-speed friction and brittle compressivefailure of ice: fundamental processes in ice mechanics,” Inter-national Materials Reviews, vol. 60, no. 8, pp. 451–478, 2016.
[18] N. Maeno, M. Arakawa, A. Yasutome, N. Mizukami, and S.Kanazawa, “Ice-ice friction measurements, and water lubri-cation and adhesion-shear mechanisms,” Canadian Journal ofPhysics, vol. 81, no. 1-2, pp. 241–249, 2003.
[19] J. R. Blackford, G. Skouvaklis, M. Purser, and V. Koutsos,“Friction on ice: stick and slip,” Faraday Discussions, vol. 156,pp. 243–254, 2012.
[20] D. C. Hatton, P. R. Sammonds, and D. L. Feltham, “Iceinternal friction: Standard theoretical perspectives on frictioncodified, adapted for the unusual rheology of ice, and unified,”Philosophical Magazine, vol. 89, no. 31, pp. 2771–2799, 2009.
[21] B. Lishman, P. R. Sammonds, and D. L. Feltham, “Critical slipand time dependence in sea ice friction,” Cold Regions Scienceand Technology, vol. 90-91, pp. 9–13, 2013.
[22] M. Beeman, W. B. Durham, and S. H. Kirby, “Friction of ice,”Journal of Geophysical Research: Solid Earth, vol. 93, no. 7, pp.7625–7633, 1988.

International Journal of
AerospaceEngineeringHindawi Publishing Corporationhttp://www.hindawi.com Volume 2014
RoboticsJournal of
Hindawi Publishing Corporationhttp://www.hindawi.com Volume 2014
Hindawi Publishing Corporationhttp://www.hindawi.com Volume 2014
Active and Passive Electronic Components
Control Scienceand Engineering
Journal of
Hindawi Publishing Corporationhttp://www.hindawi.com Volume 2014
International Journal of
RotatingMachinery
Hindawi Publishing Corporationhttp://www.hindawi.com Volume 2014
Hindawi Publishing Corporation http://www.hindawi.com
Journal ofEngineeringVolume 2014
Submit your manuscripts athttp://www.hindawi.com
VLSI Design
Hindawi Publishing Corporationhttp://www.hindawi.com Volume 2014
Hindawi Publishing Corporationhttp://www.hindawi.com Volume 2014
Shock and Vibration
Hindawi Publishing Corporationhttp://www.hindawi.com Volume 2014
Civil EngineeringAdvances in
Acoustics and VibrationAdvances in
Hindawi Publishing Corporationhttp://www.hindawi.com Volume 2014
Hindawi Publishing Corporationhttp://www.hindawi.com Volume 2014
Electrical and Computer Engineering
Journal of
Advances inOptoElectronics
Hindawi Publishing Corporation http://www.hindawi.com
Volume 2014
The Scientific World JournalHindawi Publishing Corporation http://www.hindawi.com Volume 2014
SensorsJournal of
Hindawi Publishing Corporationhttp://www.hindawi.com Volume 2014
Modelling & Simulation in EngineeringHindawi Publishing Corporation http://www.hindawi.com Volume 2014
Hindawi Publishing Corporationhttp://www.hindawi.com Volume 2014
Chemical EngineeringInternational Journal of Antennas and
Propagation
International Journal of
Hindawi Publishing Corporationhttp://www.hindawi.com Volume 2014
Hindawi Publishing Corporationhttp://www.hindawi.com Volume 2014
Navigation and Observation
International Journal of
Hindawi Publishing Corporationhttp://www.hindawi.com Volume 2014
DistributedSensor Networks
International Journal of


![Experimental study of friction in aluminium bolted joints Experimental study of friction in aluminium bolted joints D . Croccolo 1,a, M . De Agostinis 1, N . ... Motosh [7] and VDI2230](https://img.dokumen.tips/doc/110x75/5b9967e509d3f29c338c3f23/experimental-study-of-friction-in-aluminium-bolted-joints-experimental-study-of.jpg)


