Embed Size (px)
Citation preview

Research ArticlePhotosynthetic and Canopy Characteristics ofDifferent Varieties at the Early Elongation Stage and TheirRelationships with the Cane Yield in Sugarcane
Jun Luo,1 Yong-Bao Pan,2 Liping Xu,1 Yuye Zhang,1 Hua Zhang,1
Rukai Chen,1 and Youxiong Que1
1 Key Laboratory of Sugarcane Biology and Genetic Breeding, Ministry of Agriculture, Fujian Agriculture and Forestry University,Fuzhou 350002, China
2USDA-ARS, Sugarcane Research Laboratory, Houma, LA 70360, USA
Correspondence should be addressed to Liping Xu; [email protected] and Youxiong Que; [email protected]
Received 15 January 2014; Revised 28 May 2014; Accepted 5 June 2014; Published 22 June 2014
Academic Editor: Carlo Calfapietra
Copyright © 2014 Jun Luo et al. This is an open access article distributed under the Creative Commons Attribution License, whichpermits unrestricted use, distribution, and reproduction in any medium, provided the original work is properly cited.
During sugarcane growth, the Early Elongation stage is critical to cane yield formation. In this study, parameters of 17 sugarcanevarieties were determined at the Early Elongation stage using CI-301 photosynthesis measuring system and CI-100 digital plantcanopy imager. The data analysis showed highly significant differences in leaf area index (LAI), mean foliage inclination angle(MFIA), transmission coefficient for diffused light penetration (TD), transmission coefficient for solar beam radiation penetration(TR), leaf distribution (LD), net photosynthetic rate (PN), transpiration rate (𝐸), and stomatal conductance (GS) among sugarcanevarieties. Based on the photosynthetic or canopy parameters, the 17 sugarcane varieties were classified into four categories.Through the factor analysis, nine parameters were represented by three principal factors, of which the cumulative rate of variancecontributions reached 85.77%. A regression for sugarcane yield, with relative error of yield fitting less than 0.05, was successfullyestablished: sugarcane yield =−27.19− 1.69×PN+0.17× 𝐸+90.43×LAI− 408.81×LD+0.0015×NSH+ 101.38× 𝐷 (𝑅2 = 0.928∗∗).This study helps provide a theoretical basis and technical guidance for the screening of new sugarcane varieties with high netphotosynthetic rate and ideal canopy structure.
1. Introduction
Photosynthesis is the basis of yield formation. It is generallyrecognized that about 90%–95% of crop yield is formedfrom the assimilated carbons. Therefore, how to improvecrops’ photosynthetic capacity is one of the most importanttargets in the studies of genetics and breeding [1–4]. Thecanopy structure of a crop should be optimized so that anincreased proportion of light can reach the leaves at the baseof the plants [5, 6]. Studies on photosynthetic characteristicsof crops such as Zea mays [7–9], Oryza sativa [10–12],and Glycine max [13, 14] have been extensively performed.Also, inheritance of photosynthetic characteristics [15–17],diurnal variation of net photosynthetic rate [18, 19], andseasonal variation [20, 21] have been reported in the separatedsugarcane seedling populations. Indices such as shape, size,
quantity, and spatial distribution of leaves are directly relatedto the light environment and light utilization rate of thepopulation. They are the important factors affecting the lightdistribution in crop population and photosynthesis [22].
Optimizing a reasonable population structure, improvingthe light distribution in the population, and increasing therate of light utilization are all effective ways in obtaininghigh crop yields. Leaf area index (LAI) determines canopylight interception, which affects the photosynthetic rate of acrop population. When LAI is at the optimal level, canopylight interception reaches the highest level for improvedphotosynthetic capacity and potential yield increase [23].Therelations between sugarcane leaf morphology and cane yieldand between sucrose content and transpiration rate of leaveshave been studied [24–27]. However, studies on the canopycharacteristics of sugarcane were rarely reported [28, 29],
Hindawi Publishing Corporatione Scientific World JournalVolume 2014, Article ID 707095, 9 pageshttp://dx.doi.org/10.1155/2014/707095

2 The Scientific World Journal
although there are many yield-related traits and indices con-trolling photosynthesis and canopy structure of sugarcane.The interactions between these indices are complicated dueto the influences of genetic characteristics, environmentalfactors, and sample selections. The factor analysis methodallows the categorization of a large number of correlatedagronomic traits into several groups based on principalfactors. It has been widely used in studies of crop germplasmresources. In sugarcane, a correlation analysis of seasonalvariation of the canopy structure parameters to yield-relatedtraits was conducted [21]; however, there has been no reporton the application of factor analysis to the classification ofphotosynthetic and canopy parameters and their effects oncrop yield in sugarcane [30, 31].
During sugarcane growth, Early Elongation stage is acritical period for cane yield formation. During this period,an appropriate number of stalks per unit area are controlledthrough timely cultivation to achieve high yield [25]. In thisstudy, we aimed to investigate the effects of photosyntheticand canopy characteristics of 17 sugarcane varieties at theEarly Elongation stage on cane yield. The results of this studywould provide the scientific basis for breeding of sugarcanevarieties with high photosynthetic efficiency and for improv-ing cultivation technique. Hierarchical cluster analysis wasperformed by the numerical classification method on thephotosynthetic and canopy parameters of the involved sug-arcane varieties. The relationship and the stepwise regressionanalysis between canopy and photosynthetic characteristicsand cane yield were also conducted, in order to screen newsugarcane varieties with high net photosynthetic rate (PN)and ideal canopy structure.
2. Materials and Methods
2.1. Sugarcane Varieties. Seventeen sugarcane varieties weretested, namely, FN94-0403, FN94-0744, FN95-1726, FN96-0907, FN98-10100, ROC10, GT94-116, GT95-118, GT96-211,GT96-44, GT97-18, MT70-611, YT92-1287, YT96-107, YT96-794, YT96-835, and YT96-86.
2.2. Field Experiment Design and Cane Yield Traits. Fieldexperiment was conducted on the Experimental Farm of theKey Laboratory of Sugarcane Biology and Genetic Breeding,Ministry of Agriculture/Fujian Agriculture and ForestryUniversity located at Jianxin, Cangshan District, Fuzhou,Fujian (longitude: 119.23E, latitude: 26.08N). A randomizedblock design with three replications was adopted. Plot areawas 33m2, with three rows at 1.1m row spacing. Plantingdensity was 45,000 two-bud setts ha−1. The preceding cropwas sugarcane, and the soil type was sandy loam soil. Thenutrients of the arable layer before sowing included organicmatter of 10.5 g/kg, total nitrogen of 0.91 g/kg, alkalinehydrolysis nitrogen of 90.01mg/kg, available phosphorus of110.4mg/kg, and rapidly available potassium of 369.5mg/kg.The rowswere covered by plastic films after planting. Plantingwas performed in a scheme of double buds and doublerows. Herbicides were applied before planting and plasticfilm mulching. Weed control was repeatedly performed as
needed. The basal fertilizer Calcium Super Phosphate at750 kg ha−1 was applied during planting. During growingseason, 975 kg ha−1 and 600 kg ha−1 KCl were applied fortwo times as topdressing. Field management level was onlyslightly more intensive than that of the local standard opera-tions on cultivation, fertilization, irrigation, and pest control.Each applicationwas completed covering all the experimentalplots on the same day.
In Fuzhou, sugarcane elongation period lasts from lateJune to early November, while Early Elongation stage com-mences from late June and ends in early July. Measurementsof photosynthetic characteristics and canopy parameterswere conducted in early July when sugarcane seedlingsreached an average height of 80.9 cm. Data on yield-relatedtraits, including plant height (𝐻), stalk diameter (𝐷), singlestalk weight (SSW), and the number of effective stalks perhectare (NSH),were collected before harvesting.All the stalksin the middle row of each plot were cut and weighed. Thesampled sugarcane areas were measured. The number ofmillable stalks within the sampling area was also counted.Single stalk weight and cane yield were calculated by thefollowing formulae [25]:
Single stalk weight = (plant height× stalk diameter2 ×0.785)/1000; Cane yield = single stalk weight × thenumber of effective stalks per hectare.
2.3. Determination of Photosynthetic Parameters. Photosyn-thetic parameter data were collected between 8:30–11:30AMon a sunnymorning in early July, using aCI-301 photosynthe-sis system (CIDCo., Ltd,Vancouver,WA,USA) under naturallight conditions. The data included net photosynthetic rate(PN, 𝜇molm−2 s−1), transpiration rate (𝐸, mmolm−2 s−1), andstomatal conductivity (GS, mmolm−2 s−1).The PN equals therate of photosynthetic CO
2fixation minus the rate of CO
2
loss during respiration. The 𝐸 is the amount of evaporationper unit time from a leaf surface. The GS is the rate of CO
2
entering stomata [17, 22].Themeasurements were taken threetimes on each variety following the protocol described earlierwith minor modifications [17, 22, 31]. The first youngest fullyexpanded (+1) leaves at the top canopy were measured recip-rocally at the middle to upper section excluding the midrib.The direction of leaf chamber was adjusted towards sunlightto ensure that measurements were done under a uniformlight intensity. A total of 18 plants were measured for eachvariety under the following natural conditions: light intensity(1,781.17 ± 103.21 𝜇molm−2 s−1), ambient temperature (T
𝑎)
(28.07 ± 2.44∘C), leaf temperature (30.14 ± 2.26∘C), ambientrelative humidity (RH) (47.71 ± 4.88%), and ambient CO
2
concentration (C𝑎) (331.02 ± 25.35 𝜇L⋅L−1).
Several parameterswere recorded simultaneously, includ-ing effective photosynthetic radiation (PAR), relative humid-ity (RH), ambient temperature (T
𝑎), ambient CO
2concen-
tration (C𝑎), stomatal conductivity (GS), evaporation rate
(𝐸), and between cell CO2concentrations (C
𝑖). Because all
determinations were done under the natural sunlight, onlythose measurements were kept when natural light intensityis at 1,600 𝜇mol/M2⋅Sec, while measurements taken under

The Scientific World Journal 3
Table 1: Cane yield traits of 17 sugarcane varieties.
Variety NSH H/cm D/cm SSW/kg CY/t ha−1
FN94-0403 81755 ± 2034cde
301.98 ± 8.91abc
2.85 ± 0.04bcde
1.93 ± 0.02abc
157.33 ± 5.52ab
FN94-0744 68151 ± 13935de
293.37 ± 16.2abcd
3.01 ± 0.04ab
2.08 ± 0.05a
142.13 ± 31.19abc
FN95-1726 68690 ± 5299de
284.33 ± 4.98bcd
2.95 ± 0.06ab
1.94 ± 0.09abc
133.00 ± 4.32abcd
FN96-0907 74886 ± 4505cde
290.13 ± 10.47abcd
2.89 ± 0.14bc
1.90 ± 0.21abc
142.73 ± 15.49abc
FN98-10100 107480 ± 13756a
272.62 ± 12.62d
2.56 ± 0.02g
1.40 ± 0.06ef
150.33 ± 15.09abc
GT94-116 104113 ± 18667ab
285.3 ± 10.9bcd
2.30 ± 0.13h
1.19 ± 0.18f
121.77 ± 5.96bcd
GT95-118 65862 ± 3591e
310.63 ± 21.9ab
2.70 ± 0.06efg
1.78 ± 0.09bcd
117.23 ± 11.46cd
GT96-211 72192 ± 15672cde
302.33 ± 19.74abc
2.75 ± 0.05cdef
1.79 ± 0.11bcd
130.37 ± 34.78abcd
GT96-44 86738 ± 8323bcd
282.75 ± 13.89cd
2.64 ± 0.09fg
1.55 ± 0.13de
134.20 ± 8.94abcd
GT97-18 81890 ± 3484cde
314.48 ± 18.44a
2.64 ± 0.04fg
1.72 ± 0.06cd
140.73 ± 9.85abc
MT70-611 70441 ± 8782cde
303.88 ± 8.48abc
2.73 ± 0.05def
1.78 ± 0.11bcd
124.57 ± 8.21bcd
ROC10 70037 ± 9851cde
280.83 ± 9.21cd
2.55 ± 0.12g
1.44 ± 0.16e
100.40 ± 14.09d
YT92-1287 74347 ± 7740cde
287.03 ± 6.94bcd
2.87 ± 0.11bcd
1.86 ± 0.18abc
137.40 ± 8.14abc
YT96-107 80812 ± 16699cde
287.58 ± 24.33bcd
2.54 ± 0.09g
1.47 ± 0.2e
120.57 ± 37.88bcd
YT96-794 62764 ± 5456e
279.97 ± 13.09cd
2.93 ± 0.05ab
1.89 ± 0.13abc
118.63 ± 13.96cd
YT96-835 88759 ± 3266bc
270.3 ± 9.88d
2.72 ± 0.11def
1.57 ± 0.16de
139.63 ± 12.64abc
YT96-86 81216 ± 9134cde
271.8 ± 5.42d
3.06 ± 0.14a
2.00 ± 0.19ab
163.53 ± 31.03a
Notes: (1) NSH: stalk number per hectare; H: plant height; D: stalk diameter; SSW: fresh single stalk weight; CY: cane yield. (2) Different letters in the samecolumn indicate significant difference among different treatments at 0.05 level (Duncan Test).
1,600 𝜇mol/M2⋅Sec light intensity were discarded. CO2con-
centrations were collected from the upper level of canopyafter passing through the dual-bottle apparatus and wereslightly lower than those collected above the ground level.This is due to the fact that sugarcane is a highly efficient C
4
crop. Only mean values and standard deviations were shownin the text.
2.4. Determination of Canopy Parameters. A fisheye lensof the CI-100 digital plant canopy imager (CID Co., Ltd,Vancouver, WA, USA) was attached to an observation rodand placed in the center of the rows in a cloudless twilightafternoon with a little sunshine in early July. The rod wasadjusted to the horizontal direction for taking photos whenthere was no shadow or any other external influences.Fifteen testing points were selected for each variety and fiveimages were taken from each plot. LD was represented bydistribution frequency of the leaf within each azimuth. Thecanopy indicators such as leaf area index (LAI), mean foliageinclination angle (MFIA), transmission coefficient for diffuselight penetration (TD), transmission coefficient for solarbeam radiation penetration (TR), and leaf distribution (LD)were calculated by Plant Canopy Analysis software providedby CID Company (CID Co., Ltd, Vancouver, WA, USA) [21].
2.5. Statistical Methods. Variance analysis, cluster analysis,factor analysis, and regression analysis were performed usingDPS software (Zhejiang University, Hangzhou, China) [30].After standardization of original data, the distance coefficientwas determined as the chi-square distance and cluster anal-ysis by Ward’s method [30]. Varimax rotation was used tochange the coordinates used in principal component analysisand factor analysis [21, 30]. A stepwise regression analysis was
also conducted for the photosynthetic and canopy parametersand their correlation with cane yield [21, 30].
3. Results
3.1. Estimated Cane Yield Trait Data. Estimated cane yieldtrait data are shown in Table 1.
3.2. Differences in Photosynthetic Parameters among 17 Sug-arcane Varieties. There were extremely significant differ-ences in the mean PN, 𝐸, and GS among the 17 sugar-cane varieties (Table 2). Based on PN, the 17 sugarcanevarieties were classified into four categories. Category I(high PN) included five varieties, namely, FN98-10100,GT94-116, GT96-211, YT96-794, and YT96-86, with a meanPN value of 37.09 𝜇molm−2 s−1. Category II included fourvarieties (FN94-0403, FN95-1726, FN96-0907, and YT96-107) with a mean PN value of 35.68 𝜇molm−2 s−1. Cate-gory III included six varieties (GT95-118, GT97-18, MT70-611, ROC10, YT92-1287, and YT96-835) with a mean PNvalue of 34.24𝜇molm−2 s−1. Category IV included two vari-eties, FN94-0744 and GT96-44, with a mean PN valueof 34.24 𝜇molm−2 s−1. The 17 sugarcane varieties could beclassified into three groups based on the 𝐸 values. Group I(high𝐸) included 12 varieties, namely,MT70-611, FN94-0744,GT96-211, ROC10, YT96-107, YT96-835, FN94-0403, FN95-1726, FN96-0907, FN98-10100, YT96-794, and YT96-86, witha mean 𝐺 value of 4.11mmolm−2 s−1. Group II (mid-𝐸)included fourmiddle𝐸 varieties (GT94-116, GT95-118, GT97-18, andYT92-1287) with amean𝐺 value of 3.65mmolm−2 s−1.The variety GT96-44 alone represented Group III (low 𝐸)with a 𝐺 value of only 3.10mmolm−2 s−1. The 17 sugarcanevarieties were classifiable into four categories based on GS.

4 The Scientific World Journal
Table 2: Photosynthesis rate (PN), transpiration rate (𝐸), and stomatal conductivity (GS) of 17 sugarcane varieties.
Variety PN/𝜇molm−2 s−1 CO2 E/mmolm−2 s−1 H2O GS/mmolm−2 s−1
FN94-0403 36.09 ± 5.75abcd
4.38 ± 0.83a
143.97 ± 38.35bcde
FN94-0744 33.23 ± 7.33de
3.98 ± 1.06abcde
128.90 ± 45.75def
FN95-1726 35.5 ± 6.25abcde
4.35 ± 0.85ab
139.54 ± 41.69bcdef
FN96-0907 35.57 ± 5.70abcde
4.36 ± 0.78ab
146.03 ± 49.61abc
FN98-10100 37.53 ± 8.40a
4.24 ± 1.05abc
140.55 ± 47.46bcdef
GT94-116 36.66 ± 6.89abc
3.68 ± 1.30ef
126.61 ± 50.49f
GT95-118 33.87 ± 7.38cde
3.62 ± 0.97ef
125.37 ± 45.27f
GT96-211 37.34 ± 7.36ab
3.96 ± 1.09bcde
161.28 ± 67.16a
GT96-44 32.56 ± 5.77e
3.10 ± 1.10g
109.70 ± 43.36g
GT97-18 34.47 ± 5.57abcde
3.76 ± 0.74def
134.12 ± 30.17cdef
MT70-611 34.39 ± 7.78abcde
3.93 ± 1.03cdef
144.71 ± 59.02abcd
ROC10 34.00 ± 6.19bcde
3.94 ± 0.60cde
155.39 ± 42.52ab
YT92-1287 34.59 ± 8.32abcde
3.54 ± 1.35f
127.32 ± 51.43ef
YT96-107 35.56 ± 7.09abcde
3.93 ± 1.14cdef
150.28 ± 49.79abc
YT96-794 37.04 ± 7.36abc
4.10 ± 0.88abcd
156.77 ± 53.82ab
YT96-835 34.14 ± 7.26abcde
4.02 ± 0.74abcde
139.60 ± 43.54bcdef
YT96-86 36.90 ± 6.78abc
4.14 ± 0.62abcd
150.54 ± 41.82abc
Notes: (1) PN: photosynthesis rate, 𝜇molm−2 s−1; E: transpiration rate, mmolm−2 s−1; GS: stomatal conductance, mmolm−2 s−1. (2) Different letters in the samecolumn indicate significant difference among different treatments at 0.05 level (Duncan test).
Table 3: Differences among different photosynthetic gas exchange parameters among 17 sugarcane varieties.
Cluster PN E GS VarietyI 36.58 4.22 148.38 FN94-0403, FN95-1726, FN96-0907, FN98-10100, GT96-211, YT96-794, YT96-86II 34.52 3.96 147.50 FN94-0744, GT94-116, GT95-118, GT97-18, YT92-1287III 34.56 3.72 128.46 MT70-611, ROC10, YT96-107, YT96-835IV 32.56 3.1 109.7 GT96-44Notes: PN: photosynthesis rate, 𝜇molm−2 s−1; E: transpiration rate, mmolm−2 s−1; GS: stomatal conductance, mmolm−2 s−1.
Category I (high GS) included five varieties (GT96-211,ROC10, YT96-107, YT96-794, and YT96-86) with a mean GSvalue of 154.85mmolm−2 s−1. Category II (mid-GS) includedsix varieties (FN94-0403, FN95-1726, FN96-0907, FN98-10100, MT70-611, and YT96-835) with a mean GS valueof 142.4mmolm−2 s−1. Category III (low GS) included fivevarieties (FN94-0744, GT94-116, GT95-118, GT97-18, andYT92-1287), with a mean GS value of 128.46mmolm−2 s−1.The variety GT96-44 alone formed Category IV with thelowest GS value of 109.7mmolm−2 s−1.
The result of cluster analysis showed that these 17 varietiescould be grouped into four clusters (Table 3, Figure 1). ClusterI included seven varieties, namely, FN94-0403, FN95-1726,FN96-0907, FN98-10100,GT96-211, YT96-794, andYT96-86,which shared relatively high PN, 𝐸, and GS values. Cluster IIincluded five varieties, that is, FN94-0744, GT94-116, GT95-118, GT97-18, and YT92-1287.The PN values of these varietieswere at middle levels, while all had high 𝐸 and GS values.Cluster III included four varieties (MT70-611, ROC10, YT96-107, and YT96-835) with middle PN, low 𝐸, and low GSvalues. Cluster IV only had one variety, GT96-44, with lowvalues of PN, 𝐸, and GS.
3.3. Differences in the Canopy Parameters among 17 SugarcaneVarieties. There were highly significant differences in LAI,MFIA, TD, TR, and LD among the 17 sugarcane varietiesat the Early Elongation stage (Table 4). According to LAI,17 sugarcane varieties were classified into three categories.Category I included six large LAI varieties FN94-0403,GT94-116, FN96-0907, FN98-10100, GT96-44, andMT70-611, with amean value 1.35. Category II included 4 middle LAI varietiesFN94-0744, GT96-211, GT97-18, and YT92-1287, with ameanvalue 1.155. Category III included seven low LAI varietiesFN95-1726, GT95-118, ROC10, YT96-107, YT96-794, YT96-835, and YT96-86, with a mean value 1.033.
Hierarchical cluster analysis was performed by mergingall canopy parameters’ data, that is, LAI, MFIA, TD, TR, andLD, and the output was shown in Figure 2. The 17 varietiesagain were grouped into four clusters (Table 5, Figure 2).Cluster I included two varieties, FN94-0403 and FN98-10100,with largemean LAI and relatively small meanMFIA and TDvalues. Cluster II included four varieties, namely, FN96-0907,GT94-116, GT96-44, and MT70-611. Cluster III containedfive varieties, that is, FN94-0744, GT96-211, GT97-18, YT92-1287, and YT96-86, with medium LAI, MFIA, TD, TR, and

The Scientific World Journal 5
Table 4: Difference of canopy parameters among 17 sugarcane varieties.
Variety LAI MFIA TD TR LDFN94-0403 1.487 ± 0.230
a43.27 ± 13.59
c0.33 ± 0.06
ab0.277 ± 0.16
f0.783 ± 0.08
ab
FN94-0744 1.160 ± 0.214bcde
50.56 ± 11.90bc
0.39 ± 0.07ab
0.354 ± 0.19cde
0.748 ± 0.09abc
FN95-1726 1.050 ± 0.072de
62.94 ± 6.55ab
0.44 ± 0.02ab
0.410 ± 0.23abc
0.722 ± 0.09bc
FN96-0907 1.247 ± 0.064abcde
55.99 ± 12.51abc
0.37 ± 0.02ab
0.351 ± 0.20cde
0.770 ± 0.09ab
FN98-10100 1.420 ± 0.035ab
50.19 ± 9.93bc
0.32 ± 0.04b
0.291 ± 0.16ef
0.799 ± 0.06a
GT94-116 1.323 ± 0.086abcd
49.82 ± 4.23bc
0.37 ± 0.04ab
0.325 ± 0.17def
0.761 ± 0.11ab
GT95-118 0.987 ± 0.316e
71.29 ± 11.89a
0.51 ± 0.13a
0.460 ± 0.28a
0.684 ± 0.13c
GT96-211 1.180 ± 0.125bcde
60.37 ± 4.78abc
0.41 ± 0.07ab
0.374 ± 0.21bcd
0.736 ± 0.07abc
GT96-44 1.367 ± 0.076abc
57.23 ± 4.90abc
0.37 ± 0.04ab
0.322 ± 0.19def
0.776 ± 0.05ab
GT97-18 1.127 ± 0.211cde
58.64 ± 13.19abc
0.44 ± 0.11ab
0.381 ± 0.23bcd
0.719 ± 0.10bc
MT70-611 1.267 ± 0.096abcde
43.16 ± 5.30c
0.37 ± 0.02ab
0.316 ± 0.15def
0.756 ± 0.12abc
ROC10 1.063 ± 0.087de
67.57 ± 1.03ab
0.47 ± 0.03ab
0.425 ± 0.25ab
0.708 ± 0.06bc
YT92-1287 1.153 ± 0.154bcde
52.96 ± 11.11abc
0.41 ± 0.05ab
0.371 ± 0.20bcd
0.735 ± 0.12abc
YT96-107 1.027 ± 0.085e
61.00 ± 16.68abc
0.45 ± 0.10ab
0.415 ± 0.23abc
0.712 ± 0.10bc
YT96-794 1.023 ± 0.106e
60.15 ± 12.02abc
0.44 ± 0.06ab
0.409 ± 0.23abc
0.718 ± 0.10bc
YT96-835 0.993 ± 0.090e
58.57 ± 7.32abc
0.45 ± 0.06ab
0.419 ± 0.22abc
0.715 ± 0.10bc
YT96-86 1.087 ± 0.080de
54.40 ± 5.16abc
0.43 ± 0.04ab
0.383 ± 0.20bcd
0.726 ± 0.11abc
Notes: (1) LAI: leaf area index; MFIA: mean leaf angle degree; TD: transmission coefficient for diffuse penetration; TR: transmission coefficient for solar beamradiation penetration; LD: leaf distribution; (2) Different letters in the same column indicate significant difference among different treatments at 0.05 level(Duncan test).
FN94-0403FN96-0907FN95-1726FN98-10100GT96-211YT96-794YT96-86
FN94-0744GT95-118YT92-1287GT97-18GT94-116MT70-611YT96-835
ROC10YT96-107GT96-44
0.00 0.23 0.46 0.70 0.93 1.16
III
II
IV
I
Figure 1: A clustering dendrogram based on photosynthetic param-eters of 17 sugarcane varieties.
LD values. Cluster IV had six varieties, namely, FN95-1726,ROC10, YT96-107, YT96-835, GT95-118, and YT96-794, withsmall LAI values but relatively large MFIA and TD values.
3.4. Relationships between Photosynthetic and Canopy Param-eters and Cane Yield. Cane yield-related trait values includ-ing photosynthetic parameters (PN, 𝐸, and GS), canopyparameters (LAI, MFIA, TD, TR, and LD), and other traits(NSH, SSW) corresponding to the first three principal factors,joint degree (JD), and special variances (SV) are listed in
FN94-0403FN98-10100FN96-0907GT96-44GT94-116MT70-611FN94-0744YT92-1287GT96-211GT97-18YT96-86
FN95-1726YT96-107YT96-794YT96-835
ROC10GT95-118
0.0 0.41 0.83 1.24 1.66 2.07
I
II
III
IV
Figure 2: A clustering dendrogram based on canopy parameters of17 sugarcane varieties.
Table 6. The cumulative contribution rates of the character-istic values of the first three principal factors reached 85.77%.Table 6 also indicates that the essential information of the firstthree principal factors can reflect most of the informationof these photosynthetic gas exchange parameters, canopyparameters, and yield-related traits.The nine traits hadmuchin common with a high degree of freedom. It also revealedthat these three principal factors represented the nine traitswell.
The factor loading matrices after varimax rotation inthree principal factors were shown in Table 7. By comparisonbetween the factor loading matrices of postvarimax rotation
6 The Scientific World Journal
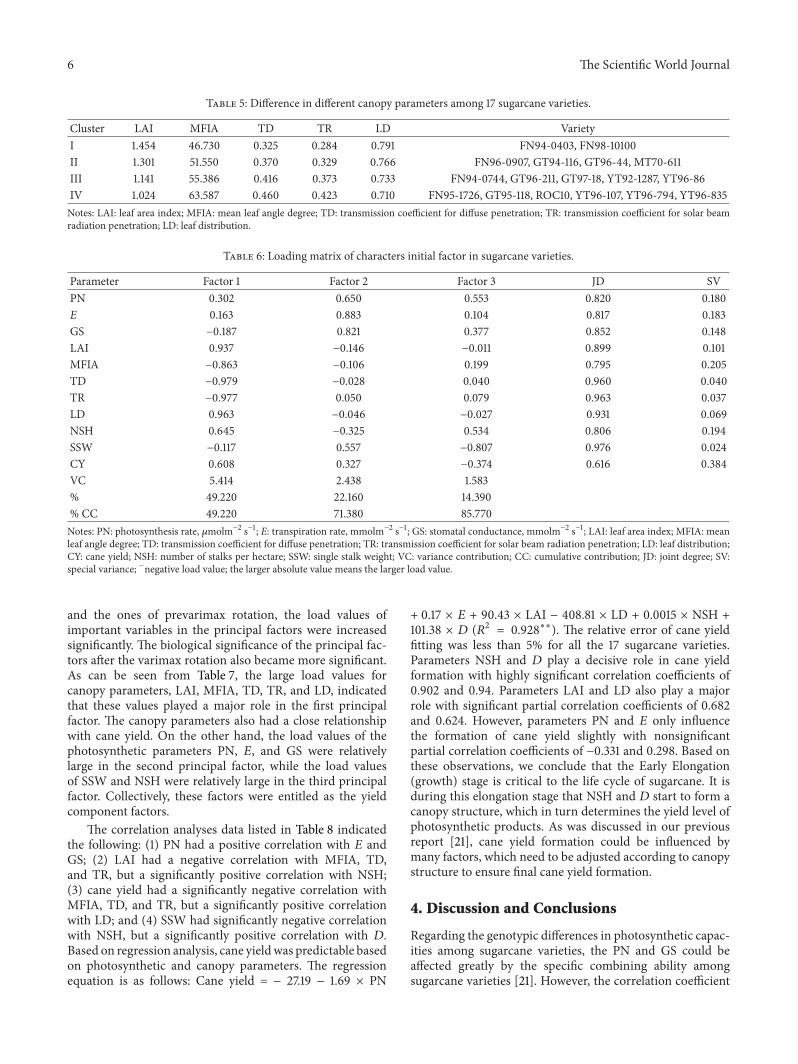
Table 5: Difference in different canopy parameters among 17 sugarcane varieties.
Cluster LAI MFIA TD TR LD VarietyI 1.454 46.730 0.325 0.284 0.791 FN94-0403, FN98-10100II 1.301 51.550 0.370 0.329 0.766 FN96-0907, GT94-116, GT96-44, MT70-611III 1.141 55.386 0.416 0.373 0.733 FN94-0744, GT96-211, GT97-18, YT92-1287, YT96-86IV 1.024 63.587 0.460 0.423 0.710 FN95-1726, GT95-118, ROC10, YT96-107, YT96-794, YT96-835Notes: LAI: leaf area index; MFIA: mean leaf angle degree; TD: transmission coefficient for diffuse penetration; TR: transmission coefficient for solar beamradiation penetration; LD: leaf distribution.
Table 6: Loading matrix of characters initial factor in sugarcane varieties.
Parameter Factor 1 Factor 2 Factor 3 JD SVPN 0.302 0.650 0.553 0.820 0.180E 0.163 0.883 0.104 0.817 0.183GS −0.187 0.821 0.377 0.852 0.148LAI 0.937 −0.146 −0.011 0.899 0.101MFIA −0.863 −0.106 0.199 0.795 0.205TD −0.979 −0.028 0.040 0.960 0.040TR −0.977 0.050 0.079 0.963 0.037LD 0.963 −0.046 −0.027 0.931 0.069NSH 0.645 −0.325 0.534 0.806 0.194SSW −0.117 0.557 −0.807 0.976 0.024CY 0.608 0.327 −0.374 0.616 0.384VC 5.414 2.438 1.583% 49.220 22.160 14.390% CC 49.220 71.380 85.770Notes: PN: photosynthesis rate, 𝜇molm−2 s−1; E: transpiration rate, mmolm−2 s−1; GS: stomatal conductance, mmolm−2 s−1; LAI: leaf area index; MFIA: meanleaf angle degree; TD: transmission coefficient for diffuse penetration; TR: transmission coefficient for solar beam radiation penetration; LD: leaf distribution;CY: cane yield; NSH: number of stalks per hectare; SSW: single stalk weight; VC: variance contribution; CC: cumulative contribution; JD: joint degree; SV:special variance; −negative load value; the larger absolute value means the larger load value.
and the ones of prevarimax rotation, the load values ofimportant variables in the principal factors were increasedsignificantly. The biological significance of the principal fac-tors after the varimax rotation also became more significant.As can be seen from Table 7, the large load values forcanopy parameters, LAI, MFIA, TD, TR, and LD, indicatedthat these values played a major role in the first principalfactor. The canopy parameters also had a close relationshipwith cane yield. On the other hand, the load values of thephotosynthetic parameters PN, 𝐸, and GS were relativelylarge in the second principal factor, while the load valuesof SSW and NSH were relatively large in the third principalfactor. Collectively, these factors were entitled as the yieldcomponent factors.
The correlation analyses data listed in Table 8 indicatedthe following: (1) PN had a positive correlation with 𝐸 andGS; (2) LAI had a negative correlation with MFIA, TD,and TR, but a significantly positive correlation with NSH;(3) cane yield had a significantly negative correlation withMFIA, TD, and TR, but a significantly positive correlationwith LD; and (4) SSW had significantly negative correlationwith NSH, but a significantly positive correlation with 𝐷.Based on regression analysis, cane yieldwas predictable basedon photosynthetic and canopy parameters. The regressionequation is as follows: Cane yield = − 27.19 − 1.69 × PN
+ 0.17 × 𝐸 + 90.43 × LAI − 408.81 × LD + 0.0015 × NSH +101.38 × 𝐷 (𝑅2 = 0.928∗∗). The relative error of cane yieldfitting was less than 5% for all the 17 sugarcane varieties.Parameters NSH and 𝐷 play a decisive role in cane yieldformation with highly significant correlation coefficients of0.902 and 0.94. Parameters LAI and LD also play a majorrole with significant partial correlation coefficients of 0.682and 0.624. However, parameters PN and 𝐸 only influencethe formation of cane yield slightly with nonsignificantpartial correlation coefficients of −0.331 and 0.298. Based onthese observations, we conclude that the Early Elongation(growth) stage is critical to the life cycle of sugarcane. It isduring this elongation stage that NSH and 𝐷 start to form acanopy structure, which in turn determines the yield level ofphotosynthetic products. As was discussed in our previousreport [21], cane yield formation could be influenced bymany factors, which need to be adjusted according to canopystructure to ensure final cane yield formation.
4. Discussion and Conclusions
Regarding the genotypic differences in photosynthetic capac-ities among sugarcane varieties, the PN and GS could beaffected greatly by the specific combining ability amongsugarcane varieties [21]. However, the correlation coefficient

The Scientific World Journal 7
Table 7: Loading matrix of varimax orthogonal rotation factor in sugarcane varieties.
Parameter Factor 1 Factor 2 Factor 3 JD SVPN 0.204 0.854 −0.221 0.820 0.180E 0.155 0.838 0.301 0.817 0.183GS −0.241 0.886 0.097 0.852 0.148LAI 0.920 −0.064 −0.222 0.899 0.101MFIA −0.886 −0.064 −0.073 0.795 0.205TD −0.969 −0.079 0.122 0.960 0.040TR −0.974 0.008 0.124 0.963 0.037LD 0.950 0.019 −0.165 0.931 0.069NSH 0.528 0.013 −0.726 0.806 0.194SSW 0.046 0.103 0.981 0.976 0.024CY 0.673 0.158 0.372 0.616 0.384VC 5.278 2.267 1.890% CC 47.982 68.588 85.768Notes: PN: photosynthesis rate, 𝜇molm−2 s−1; E: transpiration rate, mmolm−2 s−1; GS: stomatal conductance, mmolm−2 s−1; LAI: leaf area index; MFIA: meanleaf angle degree; TD: transmission coefficient for diffuse penetration; TR: transmission coefficient for solar beam radiation penetration; LD: leaf distribution;CY: cane yield; NSH: number of stalks per hectare; SSW: single stalk weight; VC: variance contribution; CC: cumulative contribution; JD: joint degree; SV:special variance; −negative load value; the larger absolute value means the larger load value.
Table 8: Correlation matrix among the traits in sugarcane varieties.
Parameter PN E GS LAI MFIA TD TR LD NSH D SSW CYPN 1.000E 0.565∗ 1.000GS 0.608∗∗ 0.679∗∗ 1.000LAI 0.176 0.014 −0.258 1.000MFIA −0.192 −0.187 0.099 −0.739∗∗ 1.000TD −0.273 −0.181 0.142 −0.933∗∗ 0.851∗∗ 1.000TR −0.206 −0.085 0.201 −0.963∗∗ 0.878∗∗ 0.978∗∗ 1.000LD 0.220 0.133 −0.204 0.942∗∗ −0.769∗∗ −0.986∗∗ −0.957∗∗ 1.000NSH 0.290 −0.083 −0.284 0.549∗ −0.390 −0.533∗ −0.529∗ 0.561∗ 1.000D 0.006 0.404 0.195 −0.219 −0.078 0.057 0.105 −0.089 −0.600 1.000SSW −0.056 0.349 0.151 −0.176 −0.093 0.069 0.081 −0.116 −0.689∗∗ 0.953∗∗ 1.000CY 0.248 0.340 −0.100 0.422 −0.551∗ −0.522∗ −0.510∗∗ 0.503∗ 0.342 0.484 0.428 1.000Notes: (1) PN: photosynthesis rate,𝜇molm−2 s−1;E: transpiration rate,mmolm−2 s−1; GS: stomatal conductance,mmolm−2 s−1; LAI: leaf area index;MFIA:meanleaf angle degree; TD: transmission coefficient for diffuse penetration; TR: transmission coefficient for solar beam radiation penetration; LD: leaf distribution;CY: cane yield; NSH: number of stalks per hectare; D: diameter; SSW: fresh single stalk weight. (2) −Negative load value; the larger absolute value means thelarger load value. (3) ∗Significant differences at the level of 0.05; ∗∗significant differences at the level of 0.01.
between F1hybrids and their parents reached a signifi-
cant level in terms of general combining ability. Therefore,parental varieties with high photosynthetic efficiency shouldbe selected in sugarcane breeding [22]. Sugarcane breedingpractice demonstrates that PN and GS (water use efficiency)can be combined. Although the photosynthetic parametersPN, 𝐸, and GS had high degrees of separations in F
1seedling
populations [17], the high photosynthetic efficiency, oncegenerated upon cross-recombination, can be immobilized byasexual reproduction, which is a unique feature of sugarcaneproduction. This is why all the advanced varieties possessgood PN, 𝐸, and GS parameters [31].
In the present study, there were significant differences inthe photosynthetic parameters among the 17 sugarcane vari-eties at the Early Elongation stage, including PN, 𝐸, and GS,
which are in accordance with the previous reports [17, 22, 31].The sugarcane varieties were classified according to the threephotosynthetic traits, respectively, and the comprehensivetraits and natural types were well reflected. The clusteringpatterns were relatively stable, although the masking ofsome traits by others and some ambiguous intercategorydifferences did exist. Therefore, single and integrated traitsshould be combined in photosynthetic efficiency breeding toobtain a better product [8].
Leaf area determines the canopy light interception. Thedistribution of leaf area within canopy is an important indexof crop canopy structure [32]. Previous studies showed thatthere were significant differences in canopy parameters LAI,MFIA, and TD at the seedling stage among different geno-types. Varieties with large LAI and small TD at the seedling

8 The Scientific World Journal
stage had a higher number of leaves per unit space. Apositive relationship exists between even leaf spatial distribu-tion and light interception efficiency of the population andhence higher cane yield [33]. Leaf canopy structure directlyaffects the canopy light interception and light distributionat different layers. Researches on morphology and anatomyrevealed that sugarcane populations with transparent canopyof short, narrow, thick, and straight leaves had a larger yieldpotential. In addition, LAI has a very close relationship withdry matter accumulation. Therefore, a proper increase ofthe population LAI can increase dry matter accumulation[32–36]. In the present study, MFIA affects the receiving ofsolar radiation and light distribution in canopy.The ideal leafpopulation structure has the most effective leaf area with thecharacteristics of continuously changing the inclination angledistribution.
Canopy structure and light distribution of sugarcane atthe Early Elongation stage play a crucial role in the accu-mulation and distribution of photosynthetic products, in thegrowth and development of population, and in the formationof final products [27–30]. This has been clearly explainedby the correlations between the main canopy parametersand cane yield in this study. Zhang et al. [35] showed thatcanopy MFIA of winter wheat decreased with the increase ofnitrogen content of soil. The light distributions of two croppopulations with the same LAI are different, if the spatialdistributions of MFIA and leaves are different. They canlead to different photosynthetic rates of canopy and differentamounts of dry matters were produced by populations perunit time [35]. However, further optimization is still requiredwhen the yield-related traits are indirectly selected based onthe main canopy parameters since the yield of sugarcanehas a negative correlation with quality-related traits in thisstudy. What should also be stressed is that, for those varietieswith large LAI at the Early Elongation stage, the LAI shouldbe adjusted to be within a certain range at the middle tolate stages. Mutual shading among leaves should be avoided,which weakens light intensity, reduces light interception,and decreases photosynthetic efficiency. Therefore, rapidand accurate diagnosis of canopy structure of sugarcaneand a timely, reasonable regulation of population size playimportant roles in the cultivation of high-quality and high-yield sugarcane varieties [32, 33].
During the Early Elongation stage, the photosyntheticand canopy parameters play a crucial role in cane yieldformation [21, 25]. In this study, highly significant differencesin LAI, MFIA, TD, TR, LD, PN, 𝐸, and GS were observedamong 17 sugarcane varieties at the Early Elongation stage.However, during the factor analysis process, nine parameterswere expressed by three principal factors, of which thecumulative variance contribution rate reached 85.77%. Bothcorrelation analysis and factor analysis showed that, at theEarly Elongation stage, therewere close relationships betweenphotosynthetic and canopy parameters and cane yield. Basedon regression analysis for sugarcane yield, with relative errorof yield fitting less than 5%, a cane yield prediction formulawas established: Cane yield = − 27.19 − 1.69 × PN + 0.17 × 𝐸+ 90.43 × LAI − 408.81 × LD + 0.0015 × NSH + 101.38 × 𝐷(𝑅2 = 0.928∗∗), in which photosynthetic parameters, such as
PN and 𝐸, and canopy parameters, such as LAI and LD, areused as the indirect indices for selecting better yield-relatedtraits at the Early Elongation stage. From all the above, thisstudy should provide the theoretical foundation and technicalguidance for identifying new sugarcane varieties with highphotosynthetic rates and ideal canopy structures.
Conflict of Interests
The authors declare no conflict of interests.
Acknowledgments
This study was supported by the 948 Program on theIntroduction of International Advanced Agricultural Scienceand Technique of Department of Agriculture (2014-S18),the Public Welfare Industrial Research Project of China(201003009-2), and the earmarked fund for the ModernAgriculture Technology of China (CARS-20). The authorsespecially thank Luguang Wu at School of Agriculture andFood Sciences,University ofQueensland, Brisbane,Australia,for valuable editorial comments during paper preparation.
References
[1] K. R.Wang, S. K. Li, G. J. Song, G. Chen, and S. Z. Cao, “Studieson cultivated physiological indexes for high-yielding cotton inXinjiang,” ScientiaAgricultura Sinica, vol. 35, no. 6, pp. 638–644,2002.
[2] M. Zhao, J. G. Li, B. Zhang, Z. Q. Dong, and M. Y. Wang,“The compensatory mechanism in exploring crop productionpotential,”ActaAgronomica Sinica, vol. 32, no. 10, pp. 1566–1573,2006.
[3] S. B. Peng, G. S. Khush, P. Virk, Q. Tang, and Y. Zou, “Progressin ideotype breeding to increase rice yield potential,” Field CropsResearch, vol. 108, no. 1, pp. 32–38, 2008.
[4] S. Hua, S. Yuan, I. H. Shamsi et al., “A comparison of threeisolines of cotton diff ering in fiber color for yield, quality, andphotosynthesis,” Crop Science, vol. 49, no. 3, pp. 983–989, 2009.
[5] G. Y. Feng, H. H. Luo, Y. D. Yao et al., “Spatial distribution ofleaf and boll in relation to canopy photosynthesis of super high-yielding cotton in xinjiang,” Scientia Agricultura Sinica, vol. 45,no. 13, pp. 2607–2614, 2012.
[6] S. P. Long, X.-G. Zhu, S. L. Naidu, and D. R. Ort, “Canimprovement in photosynthesis increase crop yields?” Plant,Cell and Environment, vol. 29, no. 3, pp. 315–330, 2006.
[7] L. B. Jin, J. W. Zhang, B. Li et al., “Canopy structure andphotosynthetic characteristics of high yield and high nitrogenefficiency summer maize,” Scientia Agricultura Sinica, vol. 46,no. 12, pp. 2430–2439, 2013.
[8] M. Zhao, S. A.Wang, M. Y.Wang, and S. K. Li, “Cluster analysisfor photosynthetic characters of inbred lines of maize in china,”Acta Agronomica Sinica, vol. 25, no. 6, pp. 733–741, 1999.
[9] X. Q. Guo, M. Zhao, and S. K. Li, “Studies on photosyntheticproperties of different maize inbred lines,”Maize Science, vol. 5,no. 3, pp. 46–49, 1997.
[10] X. Li, J. M. Yan, B. H. Ji, and D. M. Jiao, “Varietal difference inphotosynthetic characteristics of rice under photooxidation andshading,” Acta Agronomica Sinica, vol. 23, no. 3, pp. 301–308,1999.

The Scientific World Journal 9
[11] T. R. Sinclair and J. E. Sheehy, “Erect leaves and photosynthesisin rice,” Science, vol. 283, no. 5407, pp. 1455–1457, 1999.
[12] H. Q. Zhai, S. Q. Cao, and Y. L. Tang, “Analysis on combiningability and heritability of photosynthetic characters in indicahybrid rice,” Acta Agronomica Sinica, vol. 28, no. 2, pp. 154–160,2002.
[13] W. G. Du, G. R. Zhang, W. Q. Man et al., “Development of soy-bean cultivars (germplasm) with high photosynthetic efficiency(HPE) and rediscussion of breeding for HPE,” Soybean Science,vol. 20, no. 2, pp. 110–115, 2001.
[14] W. H. Li, Q. T. Lu, N. B. Hao, Q. D. Zhang, Q. Y. Ge, and T.Y. Kuang, “The high photosynthetic efficiency characteristics ofhigh-yield varieties in soybean,” Acta Biophysica Sinica, vol. 16,no. 2, pp. 421–426, 2000.
[15] M. Q. Zhang, R. K. Chen, J. Luo, J. L. Lu, and J. S. Xu, “Analysesfor inheritance and combining ability of photochemical activ-ities measured by chlorophyll fluorescence in the segregatinggeneration of sugarcane,” Field Crops Research, vol. 65, no. 1, pp.31–39, 2000.
[16] S. J. Gao, R. K. Chen, M. Q. Zhang, and J. F. Liao, “Genetic vari-ation of net photosynthetic rate in sugarcane hybrid progenies,”Journal of Fujian Agricultural University, vol. 28, no. 1, pp. 108–114, 1999.
[17] J. L. Lu, R. K. Chen, M. Q. Zhang, J. Luo, Y. Q. Lin, and W.C. Fang, “Study on the genetic analysis of parents with highphotosynthetic efficiency in sugarcane,” Scientia AgriculturaSinica, vol. 33, no. 6, pp. 95–97, 2000.
[18] M. Q. Zhang, J. L. Lu, and R. K. Chen, “Diurnal variation ofphotosynthetic rate in sugarcane and its responses to light andtemperature,” Journal of Fujian Agricultural University, vol. 27,no. 4, pp. 397–401, 1998.
[19] Y. X. Xing, L. T. Yang, and Y. R. Li, “Effect of ethephon onrespiratory exchange in different sugarcane varieties,” ChineseJournal of Tropical Crops, vol. 23, no. 3, pp. 66–72, 2002.
[20] J. L. Lu, R. K. Chen, M. Q. Zhang, C. M. Li, and J. F. Liao,“Seasonal change of the net photosynthesis rate, chlorophyllcontent and specific weight of leaf of sugarcane and theirrelationships,” Journal of Fujian Agricultural University, vol. 27,no. 3, pp. 285–290, 1998.
[21] J. Luo, Y. X. Que, H. Zhang, and L. P. Xu, “Seasonal variation ofthe canopy structure parameters and its correlation with yield-related traits in sugarcane,” The Scientific World Journal, vol.2013, Article ID 801486, 10 pages, 2013.
[22] J. Luo, H. Zhou, M. Q. Zhang, R. K. Chen, and H. Zhang,“Genetic analysis ofmain economic and photosynthetic traits inenergy sugarcane,” Chinese Journal of Applied & EnvironmentalBiology, vol. 10, no. 3, pp. 268–273, 2004.
[23] H. J. Zhao, Q. Zou, T. C. Guo, Z. W. Yu, and Y. H. Wang,“Regulating effects of density and top-dressing time of nitrogenon characterstics of radiation transmission and photosynthesisin canopy of massive-spike winter wheat variety L906,” ActaAgronimica Sinica, vol. 28, no. 2, pp. 270–277, 2002.
[24] S. J. Gao, J. Luo, R. K. Chen, and J. L. Lu, “Mathematical analysison leaf morphology of sugarcane varieties,” Journal of PlantGenetic Resources, vol. 3, no. 3, pp. 21–25, 2002.
[25] R. K. Chen, L. P. Xu, Y. Q. Lin et al.,Modern Sugarcane GeneticBreeding, China Agriculture Press, Beijing, China, 2011.
[26] Z. W. Tan, J. N. Liang, J. P. Chen, and P. S. Chen, “Studieson the relationship of morphological, anatomical characters inseedling stage and juice sugar, yield on sugarcane genotypes,”Journal of South China Agricultural University, vol. 22, no. 1, pp.5–8, 2001.
[27] M. Q. Zhang, R. K. Chen, S. J. Gao, J. L. Lu, F. Fang, and N. N.Xu, “Morphophysiological responses of sugarcane genotypes towater stress,” Scientia Agricultura Sinica, vol. 30, no. 6, pp. 72–77,1997.
[28] S. J. Gao, R. K. Chen, H. Zhang, N. N. Xu, Z. H. Deng, and J.Luo, “Factor and clustering analysis of economic characters insugarcane(Saccharum spp.),” Journal of Fujian Agriculture andForestry University, vol. 35, no. 2, pp. 113–116, 2006.
[29] R. H. Zhang, T. H. Chen, Y. F. Zheng, and Q. M. Wang,“Interspecific variation in physiology of conifer and analysis byfuzzy cluster,” Journal of Nanjiang Forestry University, vol. 22,no. 3, pp. 95–98, 1998.
[30] Q. Y. Tang and C. X. Zhang, “Data Processing System (DPS)software with experimental design, statistical analysis and datamining developed for use in entomological research,” InsectScience, vol. 20, no. 2, pp. 254–260, 2013.
[31] J. Luo, Q. Wang, H. Zhang, Y. Lin, and Y. Chen, “Phenetic clas-sification for photosynthetic characters of different sugarcanevarieties,”Chinese Journal of Applied andEnvironmental Biology,vol. 13, no. 4, pp. 461–465, 2007.
[32] J. Luo, H. Zhang, Z. Deng et al., “Relationship between canopycharacters and leaf morphology at different positions of sug-arcane,” Chinese Journal of Applied and Environmental Biology,vol. 11, no. 1, pp. 28–31, 2005.
[33] J. Luo, H. Zhang, Y. Q. Lin, Z. H. Deng, and R. K. Chen, “TheRelationship of canopy structure characters in the seedling andyield characters on sugarcane genotypes,” Chinese Journal ofTropical Crops, vol. 25, no. 3, pp. 24–28, 2004.
[34] Y. Q. Zhang, H. S. Yang, J. L. Gao et al., “Study on canopystructure and physiological characteristics of super-high yieldspring maize,” Scientia Agricultura Sinica, vol. 44, no. 21, pp.4367–4376, 2011.
[35] X. Y. Zhang, J. D. Du, and D. F. Zheng, “Effect of density oncanopy structure and photosynthetic characteristics in soybeanpopulation,” Agricultural Research in the Arid Areas, vol. 29, no.4, pp. 75–80, 2011.
[36] Y.M. Zhang, J. S. Li, andW. P. Qian, “Canopy structure and lightdistribution in winter wheat,” Acta Agriculturae Boreali-Sinica,vol. 11, no. 1, pp. 54–58, 1996.

Submit your manuscripts athttp://www.hindawi.com
Nutrition and Metabolism
Journal of
Hindawi Publishing Corporationhttp://www.hindawi.com Volume 2014
Hindawi Publishing Corporationhttp://www.hindawi.com Volume 2014
Food ScienceInternational Journal of
Agronomy
Hindawi Publishing Corporationhttp://www.hindawi.com Volume 2014
International Journal of
Hindawi Publishing Corporationhttp://www.hindawi.com Volume 2014
International Journal of
Microbiology
The Scientific World JournalHindawi Publishing Corporation http://www.hindawi.com Volume 2014
Hindawi Publishing Corporationhttp://www.hindawi.com
Applied &EnvironmentalSoil Science
Volume 2014
AgricultureAdvances in
Hindawi Publishing Corporationhttp://www.hindawi.com Volume 2014
PsycheHindawi Publishing Corporationhttp://www.hindawi.com Volume 2014
BiodiversityInternational Journal of
Hindawi Publishing Corporationhttp://www.hindawi.com Volume 2014
ScientificaHindawi Publishing Corporationhttp://www.hindawi.com Volume 2014
GenomicsInternational Journal of
Hindawi Publishing Corporationhttp://www.hindawi.com Volume 2014
Plant GenomicsInternational Journal of
Hindawi Publishing Corporationhttp://www.hindawi.com Volume 2014
Biotechnology Research International
Hindawi Publishing Corporationhttp://www.hindawi.com Volume 2014
Forestry ResearchInternational Journal of
Hindawi Publishing Corporationhttp://www.hindawi.com Volume 2014
Journal of BotanyHindawi Publishing Corporationhttp://www.hindawi.com Volume 2014
EcologyInternational Journal of
Hindawi Publishing Corporationhttp://www.hindawi.com Volume 2014
Veterinary Medicine International
Hindawi Publishing Corporationhttp://www.hindawi.com Volume 2014
Cell BiologyInternational Journal of
Hindawi Publishing Corporationhttp://www.hindawi.com Volume 2014
Evolutionary BiologyInternational Journal of
Hindawi Publishing Corporationhttp://www.hindawi.com Volume 2014