Embed Size (px)
Citation preview
Bocklitz et al. BMC Cancer (2016) 16:534 DOI 10.1186/s12885-016-2520-x
RESEARCH ARTICLE Open Access
Pseudo-HE images derived fromCARS/TPEF/SHGmultimodal imaging incombination with Raman-spectroscopyas a pathological screening toolThomas W. Bocklitz1,2* , Firas Subhi Salah3,4, Nadine Vogler2, Sandro Heuke1,2, Olga Chernavskaia1,2,Carsten Schmidt5, Maximilian J. Waldner6,7, Florian R. Greten8, Rolf Bräuer4, Michael Schmitt1,Andreas Stallmach5, Iver Petersen4 and Jürgen Popp1,2*
Abstract
Background: Due to the steadily increasing number of cancer patients worldwide the early diagnosis and treatmentof cancer is a major field of research. The diagnosis of cancer is mostly performed by an experienced pathologist viathe visual inspection of histo-pathological stained tissue sections. To save valuable time, low quality cryosections arefrequently analyzed with diagnostic accuracies that are below those of high quality embedded tissue sections. Thus,alternative means have to be found that enable for fast and accurate diagnosis as the basis of following clinicaldecision making.
Methods: In this contribution we will show that the combination of the three label-free non-linear imagingmodalities CARS (coherent anti-Stokes Raman-scattering), TPEF (two-photon excited autofluorescence) and SHG(second harmonic generation) yields information that can be translated into computational hematoxylin and eosin(HE) images by multivariate statistics. Thereby, a computational HE stain is generated resulting in pseudo-HE overviewimages that allow for identification of suspicious regions. The latter are analyzed further by Raman-spectroscopyretrieving the tissue’s molecular fingerprint.
Results: The results suggest that the combination of non-linear multimodal imaging and Raman-spectroscopypossesses the potential as a precise and fast tool in routine histopathology.
Conclusions: As the key advantage, both optical methods are non-invasive enabling for further pathologicalinvestigations of the same tissue section, e.g. a direct comparison with the current pathological gold-standard.
Keywords: Cancer detection, Multimodal imaging, Pseudo HE-images, Raman spectroscopy
*Correspondence: [email protected]; [email protected] of Physical Chemistry and Abbe Center of Photonics,Friedrich-Schiller University Jena, Helmholtzweg 4, Jena, Germany2Leibniz-Institute of Photonic Technology, Albert-Einstein-Str. 9, 07745, Jena,GermanyFull list of author information is available at the end of the article
© 2016 The Author(s). Open Access This article is distributed under the terms of the Creative Commons Attribution 4.0International License (http://creativecommons.org/licenses/by/4.0/), which permits unrestricted use, distribution, andreproduction in any medium, provided you give appropriate credit to the original author(s) and the source, provide a link to theCreative Commons license, and indicate if changes were made. The Creative Commons Public Domain Dedication waiver(http://creativecommons.org/publicdomain/zero/1.0/) applies to the data made available in this article, unless otherwise stated.

Bocklitz et al. BMC Cancer (2016) 16:534 Page 2 of 11
BackgroundThe WHO expects the annual incidences of cancer toalmost double to 21.6 million by 2030 [1]. Evidently, anearly cancer diagnosis is the key factor for the survivalof patients. The diagnosis of cancer after initial suspicionis complex and involves a number of elaborated diagnos-tic approaches such as genomics and proteomics [2–4]. Ahistopathological examination of the excised tissue is thecurrent gold-standard for deriving the final diagnosis [5].In the majority of cases, the pathologist works with fix-ated and embedded tissue samples. In order to save time,also native frozen sections are evaluated as part of a quickfrozen section analysis. The analysis of frozen sections,however, is challenging and sometimes deviates from theresults of an analysis of fixated and embedded sections[5]. To overcome the current limitation of frozen sectiondiagnostics, new pathological tools are required allowingfor fast and accurate ex corpore in vivo diagnosis of malig-nant transformed tissue. Thereby, the term ex corpore invivo refers to fresh biopsy tissue. Ideally, these techniquesare also applicable for in vivo investigations adding thenecessity to work non-invasive, i.e. preserving the tissue’sintegrity.Within the last years the development and application
of optical methods for clinical pathology that potentiallymeet these requirements has rapidly increased [5]. Amongthese methods, spectroscopic imaging approaches are ofparticular significance [6–9]. Ex vivo reflectance confo-cal microscopy (CRM) was used to detect residuals ofnon-melanoma skin cancer (NMSC) duringMoh’s surgery[10]. Optical coherence tomography (OCT) demon-strated its potential to differentiate between malignantand benign tissue areas in head and neck, skin, genitaland bladder cancer [11]. The potential of photo acous-tic imaging (PAI) for cancer diagnostics was evaluatedfor melanoma [12] and breast cancer [13]. One-photonexcited autofluorescence (OPEF) was utilized to inves-tigate fibrosarcoma, lung cancer and NMSC [14]. Lin-ear Raman-microscopy was applied for differentiation ofhealthy tissue from cancerous epithelium within humanskin, colon, brain and breast [15]. Further, various non-linear microscopy methods were shown to enable fordetection of NMSC as well as head and neck, brain orlung cancer [16]. However, most of these studies repre-sent proof-of-concept studies and except of OCT thesemethods have not been transferred into routine clini-cal applications. The delay of technology transfer maybe attributed – among other reasons – to the increasingcomplexity of state of the art cancer diagnostics reducingphysician’s available time to familiarize with new imagingtechnologies as well as its image contrast and significance.Thus, it is the task of scientists to reduce the complexityof new technologies by translating the image informationinto a format that physicians are accustomed to such as
hematoxylin and eosin (HE) stained images or by directprediction of the tissue’s malignancy state. Ideally, thisimage translation is achieved entirely by computationalimage analysis requiring no assistance of scientists orphysicians.To automate such a translation of optical microscopy
data, the image contrast is required to provide cancerspecific information in the first place. Since the infor-mation transferred by a single modality is limited, var-ious optical methods are frequently combined such asRaman-spectroscopy and OCT for skin cancer detection[17]. These multimodal approaches can be grouped intothose that gather techniques with similar image acquisi-tion times and experimental equipment and combinationsthat merge sensitivity with specificity by coupling fastimaging tools with techniques of high information densityper pixel. Here, we combine both multimodal conceptsto maximize the image acquisition speed and informa-tion depth in order to improve the accuracy of imagetranslation and diagnostic results.First, the fast non-linear microscopy methods CARS =
coherent anti-Stokes Raman-scattering, SHG = secondharmonic generation and TPEF = two-photon excitedautofluorescence were jointly applied to characterizethe architecture and biochemical composition of frozentissue sections. For the selection of regions of inter-est (ROI), we demonstrate for the first time the pos-sibility to derive computationally pseudo-HE imagesfrom CARS/SHG/TPEF-images by applying multivariatestatistics. The pseudo-HE image can be analyzed by apathologist in the same manner as a normal HE image.Following the selection of ROI based on pseudo-HEimages we applied Raman-spectroscopy for the predictionof the diagnosis. Though compromised by its poor sensi-tivity, Raman-spectroscopy is unprecedented for its highspecificity yielding information based on inherent molec-ular vibrations that - like fingerprints - specifically charac-terize chemical structures and biochemical compositionsof e.g. biological cells, tissues etc.The non-invasiveness of non-linearmultimodal imaging
and Raman-spectroscopy enables for the direct compari-sonwith the pathological gold standard requiring staining.Thus, further analyses can be performed on the samplespre-characterized by combining multimodal imaging andRaman-spectroscopy. This new approach, the combina-tion of non-linear multimodal images and Raman-spectraof selected regions, was evaluated for ex vivo sections ofcolon tissue that arose from p53 knockout mice [18]. Themouse model was selected to investigate a single typeof tumor while minimizing the variance between indi-viduals (mice). The results, therefore, allow for a reliableestimation of the generalizability of the proposed opticalpathological tool with respect to the adenoma-carcinoma-sequence and its diagnostic value.
Bocklitz et al. BMC Cancer (2016) 16:534 Page 3 of 11
MethodsSample preparationMice with an intestinal epithelial cell (IEC)-specific dele-tion of the tumor suppressor gene p53 were receivedby crossing of floxed p53 mice with villin-Cre mice(Tp53�IEC) [19]. As controls Tp53F/F mice were utilized.These mice were treated intraperitoneally once a weekfor 6 weeks with the carcinogen azoxymethane (AOM; 10mg/kg). For histological and Raman-spectroscopic inves-tigations mice were sacrificed at different time points afterthe AOM application. The specific loss of p53 in the intes-tine markedly enhances the carcinogen-induced tumorincidence and leads to the development of invasive col-orectal tumors beginning about 12 weeks after the firstAOM treatment.Full preparation of colon and rectum was performed
for 47 individuals. Biopsies were acquired from 8 out ofthese 47 individuals. Another cohort of 22 individualswas divided into two groups of which biopsies were takenin an alternating fashion every two weeks. In total, 69individuals contributed to the complete training Raman-dataset. For the present study, 6 individuals (2 males,4 females) were selected randomly covering the wholespectrum of diagnoses. In total 34 Raman-maps (46240spectra) and the respective non-linear multimodal imageswere acquired to investigate this reduced cohort.Cryosections for the histo-pathological evaluation were
obtained following the standard procedure of washing thespecimens with phosphate buffered saline (PBS Buffer),fixation using paraformaldehyde, embedding in paraffinand cutting the sample in 10 μm slices which were stainedwith hematoxylin and eosin (HE staining). For the Raman-spectroscopic analysis, the specimens were washed withPBS buffer and immediately frozen in liquid nitrogen.Distilled water was used as embedding medium for thecryosectioning step resulting in 20 μm thick slices. Thus,
a native sample - preserving the lipid distribution - isobtained.Brightfield images of the parallel HE stained as
well as Raman-spectroscopically examined sections wererecorded using a halogen illuminated Leica DM2500microscope (Leica Microsystems, Wetzlar, Germany)equipped with a Nikon Digital Sight (DS) camera systemusing the DS-Fi1 CCD camera head (Nikon InstrumentsEurope B.V., Germany). To superimpose the measuredRaman-maps with the their corresponding histopatholog-ical assessment, all HE stained scan areas were imagedusing five different Leica objectives in the range of 1.25×to 40× (1.25× HCX PL Fluotar (NA 0.04), 5× N Plan (NA0.12), 10× N Plan (NA 0.25), 20× N Plan (NA 0.4), 40× NPlan (NA 0.65)).
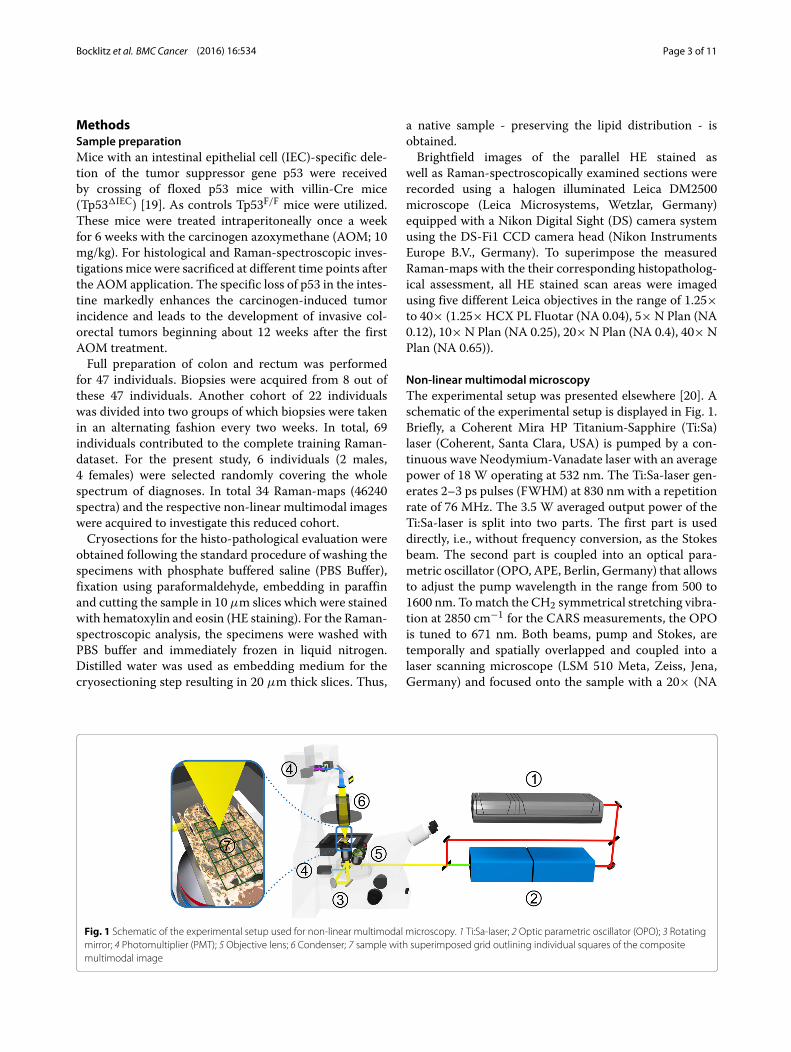
Non-linear multimodal microscopyThe experimental setup was presented elsewhere [20]. Aschematic of the experimental setup is displayed in Fig. 1.Briefly, a Coherent Mira HP Titanium-Sapphire (Ti:Sa)laser (Coherent, Santa Clara, USA) is pumped by a con-tinuous wave Neodymium-Vanadate laser with an averagepower of 18 W operating at 532 nm. The Ti:Sa-laser gen-erates 2–3 ps pulses (FWHM) at 830 nm with a repetitionrate of 76 MHz. The 3.5 W averaged output power of theTi:Sa-laser is split into two parts. The first part is useddirectly, i.e., without frequency conversion, as the Stokesbeam. The second part is coupled into an optical para-metric oscillator (OPO, APE, Berlin, Germany) that allowsto adjust the pump wavelength in the range from 500 to1600 nm. Tomatch the CH2 symmetrical stretching vibra-tion at 2850 cm−1 for the CARS measurements, the OPOis tuned to 671 nm. Both beams, pump and Stokes, aretemporally and spatially overlapped and coupled into alaser scanning microscope (LSM 510 Meta, Zeiss, Jena,Germany) and focused onto the sample with a 20× (NA
Fig. 1 Schematic of the experimental setup used for non-linear multimodal microscopy. 1 Ti:Sa-laser; 2 Optic parametric oscillator (OPO); 3 Rotatingmirror; 4 Photomultiplier (PMT); 5 Objective lens; 6 Condenser; 7 sample with superimposed grid outlining individual squares of the compositemultimodal image

Bocklitz et al. BMC Cancer (2016) 16:534 Page 4 of 11
0.8) achromatic objective (Zeiss). The optical non-linearresponse of the sample is wavelength filtered by means ofvarious dielectric filters and detected by photomultipliertubes (PMT, Hamamatsu Photonics, Hamamatsu, Japan)in forward (CARS, SHG) and backward direction (TPEF).Large area scans of the samples of up to 15×15 tile-scans,each having a size of 450 μm × 450 μm, were recorded.Every tile-scan was acquired with a resolution of 1,024 x1,024 pixels and a pixel time of 1.6 μs. By averaging twicethe total acquisition the time per tile-scan does not exceed16 s for all three modalities, i.e. CARS, TPEF and SHG.Thus, the acquisition time for an image of 15× 15 squarescorresponding to a size of 6.75 mm × 6.75 mm is about1 hour. The average power at the sample was 25 mW and50 mW for the pump and Stokes beam, respectively. Adiscussion about the applied power and potential linearas well as non-linear tissue photo-damage can be foundelsewhere [21].
Linear Raman-microspectroscopyRaman-spectra of 20 μm thick cryosections from colonand rectum of mice as well as from biopsies on CaF2 slideswere recorded with an upright micro-Raman-setup (CRM300, WITec GmbH, Ulm, Germany) equipped with a300 g/mm grating (7 cm−1 resolution) and a Deep Deple-tion CCD camera (DU401 BR-DD, ANDOR, 1024 × 127pixels) cooled down to −65°C. The tissue Raman-spectrawere recorded with a 785 nm diode laser which wasfocused through a Zeiss 50× objective (NA 0.7) onto thesections. For the herein described study 34 Raman-scanswere recorded in scanning mode with a step size of 5 μmand an integration time of 2 s per spectrum. The scandimensionwas chosen to be around 34×40 pixels (170μm× 200 μm), so every scan consists of approximately 1360Raman-spectra. As a standard for the subsequent pro-cessing of the spectra a time series comprising 50 spectraof 4-acetamidophenol was collected with an integrationtime of 1 s per spectrum. Based on HE stained parallelsections a trained pathologist selected the areas to bemea-sured. Here we measured the Raman-spectra before themultimodal images in order to check if burning effectsoccurred. In the presented data set burning effects werenot observed.
Ethical approvalAll animal studies were approved by the governmentalcommission for animal protection (No. 02-007/13).
ResultsGeneration of pseudo-HE images out of CARS/TPEF/SHGmultimodal images22 multimodal images were measured and the TPEF,CARS and SHG channel were combined in false-colors.Here we used green to represent TPEF, red for CARS and
SHG was coded in shades of blue. The images were pre-treated separately: First the images were down-sampledby a factor of 4. Then the uneven illumination of thetile-scans was removed within the images and the con-trast was adjusted (CARS:[0.05-0.015], TPEF:[0.05-0.04],SHG:[0.001-0.001]) [22]. The resulting images are givenin Fig. 2 in row A. The workflow for pseudo-HE genera-tion is sketched in Fig. 3. The pseudo-HE stained imagesare generated using a partial least squares regression (PLS)model with 3 components [23], which was trained withone image (data not shown). PLS is a multivariate regres-sion method that estimates the relationship between twodatasets and differs from traditional least squares regres-sion in utilizing information of the independent and thedependent variables. The RGB-values of an HE stainedimage was modeled using the three color channels ofthe multimodal image. Afterwards, regions with a certainfingerprint of CARS, TPEF and SHG intensities were pre-dicted to feature cell nuclei (dark violet) and thus this colorwas added. This procedure was based on a linear discrim-inant analysis model (LDA). The main idea of this classifi-cation method is to find the optimal linear combination ofvariables that maximizes the variations between differentclasses and minimizes the variations within these classes.This additional model was necessary as cell nuclei hadnegative contrast in the multimodal images. The resultis referred to as computational HE stained or pseudo-HE image. Its generation is performed automatically and,therefore, allows for a fast screening. After the calculationof the computational HE stain was performed, the back-ground was determined and set to white. The backgroundwas estimated by a sequence of steps. First the originalmultimodal image (RGB) was segmented by k-means clus-tering with k = 6. The pixels of the darkest class, i.e.the class with the lowest value of sum over squared classcenter, are considered as background contribution. Basedon this annotation a background mask was calculated. Toremove noise contributions in the segmentation result,the estimated background mask was filtered by a medianfilter. Thereafter morphological closing was applied tofill gaps in the foreground and extending the foregroundarea. Finally, the background mask was morphologicallyopened in order to remove small foreground areas andsmooth the background edges (or specimen contour). Theresultingmaskwasmean filteredandusedasaweightingmaskallowing for a smooth removal of large background areas.
Spectral histopathology— statistical analysis ofRaman-spectraThe data preprocessing in case of the Raman-spectra andstatistical modeling were performed using the softwarepackage R [24]. The packages used were ‘MASS’ [25], ‘pls’[23], ‘KKNN’ [26] and ‘Peaks’ [27]. Several multivariatestatistical tools were applied, such as principal component
Bocklitz et al. BMC Cancer (2016) 16:534 Page 5 of 11
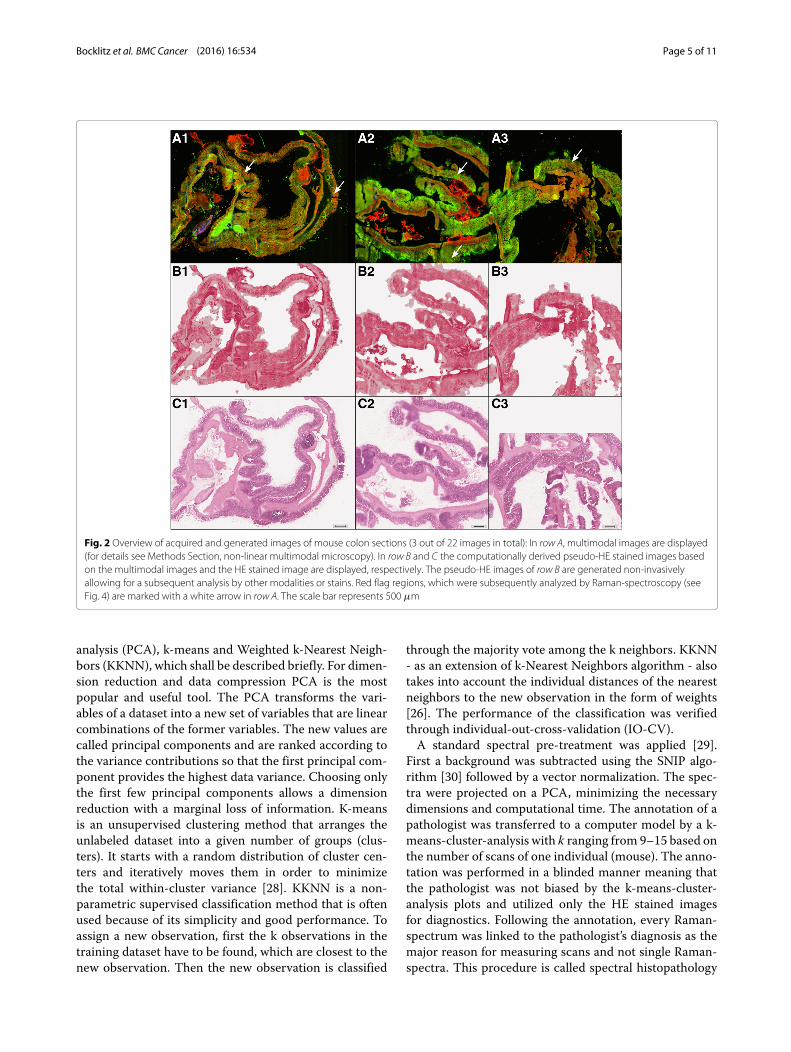
Fig. 2 Overview of acquired and generated images of mouse colon sections (3 out of 22 images in total): In row A, multimodal images are displayed(for details see Methods Section, non-linear multimodal microscopy). In row B and C the computationally derived pseudo-HE stained images basedon the multimodal images and the HE stained image are displayed, respectively. The pseudo-HE images of row B are generated non-invasivelyallowing for a subsequent analysis by other modalities or stains. Red flag regions, which were subsequently analyzed by Raman-spectroscopy (seeFig. 4) are marked with a white arrow in row A. The scale bar represents 500 μm
analysis (PCA), k-means and Weighted k-Nearest Neigh-bors (KKNN), which shall be described briefly. For dimen-sion reduction and data compression PCA is the mostpopular and useful tool. The PCA transforms the vari-ables of a dataset into a new set of variables that are linearcombinations of the former variables. The new values arecalled principal components and are ranked according tothe variance contributions so that the first principal com-ponent provides the highest data variance. Choosing onlythe first few principal components allows a dimensionreduction with a marginal loss of information. K-meansis an unsupervised clustering method that arranges theunlabeled dataset into a given number of groups (clus-ters). It starts with a random distribution of cluster cen-ters and iteratively moves them in order to minimizethe total within-cluster variance [28]. KKNN is a non-parametric supervised classification method that is oftenused because of its simplicity and good performance. Toassign a new observation, first the k observations in thetraining dataset have to be found, which are closest to thenew observation. Then the new observation is classified
through the majority vote among the k neighbors. KKNN- as an extension of k-Nearest Neighbors algorithm - alsotakes into account the individual distances of the nearestneighbors to the new observation in the form of weights[26]. The performance of the classification was verifiedthrough individual-out-cross-validation (IO-CV).A standard spectral pre-treatment was applied [29].
First a background was subtracted using the SNIP algo-rithm [30] followed by a vector normalization. The spec-tra were projected on a PCA, minimizing the necessarydimensions and computational time. The annotation of apathologist was transferred to a computer model by a k-means-cluster-analysis with k ranging from 9–15 based onthe number of scans of one individual (mouse). The anno-tation was performed in a blinded manner meaning thatthe pathologist was not biased by the k-means-cluster-analysis plots and utilized only the HE stained imagesfor diagnostics. Following the annotation, every Raman-spectrum was linked to the pathologist’s diagnosis as themajor reason for measuring scans and not single Raman-spectra. This procedure is called spectral histopathology

Bocklitz et al. BMC Cancer (2016) 16:534 Page 6 of 11
Fig. 3 Schematic of the pseudo-HE image generation algorithm. CARS, TPEF and SHG images of the samples were acquired and combined intomultimodal images using a RGB color model. The multimodal images were preprocessed as follows. First, noise was removed by median filteringand the images were down-sampled by a factor of 4. After that the uneven illumination of the single tile-scans was corrected and the contrast wasadjusted. For generation of the pseudo-HE stained images, a RGB color image and two masks were calculated. To convert a multimodal image intoRGB values of pseudo-HE image, a partial-least-square regression (PLS) method with 3 components was used which was trained with one image.The mask of cell nuclei was predicted by a pre-trained LDA model and was used to color cell nuclei regions within the pseudo-HE stained image indark violet. Moreover, a background mask was estimated and used to color the background area of the pseudo-HE image in white
(SHP) and described elsewhere in full detail [31, 32].The Weighted k-Nearest Neighbors (KKNN) model wastrained with one neighbor to be used for prediction andthe Minkowski distance in combination with the kernel‘optimal’. The evaluation was done by an individual-out-cross-validation. This approach incorporates the biolog-ical variance in the performance estimation. Only withsuch an approach a robust estimate of how the modelwill perform in future applications, e.g. the generalizationperformance of the model, can be derived. Shortly, theRaman-spectra of one individual were excluded from themodel building and a classification model for the groups‘adenoma’, ‘carcinoma’ and ‘normal’ was constructed. TheRaman-spectra of the individual currently excluded werepredicted using the classifier and the outcome was stored.Accordingly, the Raman-spectra of all individuals wereonce used as a test set. The result is put together in Table 1.It should be noted that hyperplasia occured only once andthe corresponding region was excluded from the dataset.
DiscussionIn this contribution we combined two optical imagingapproaches for a fast and precise pathological tissue
assessment. The first approach is used to generatean unspecific overview. Therefore multimodal imagingquickly generates large tissue images, which were trans-lated into a pseudo-HE image for identification of suspi-cious areas. These red flag areas were further analyzedin more detail using Raman-spectroscopy to receive abio-spectroscopic fingerprint of these suspicious areas.With the help of these fingerprints we were able to con-struct a model for cancer diagnosis achieving a highsensitivity.
Table 1 Individual-Out-Cross-Validation (IO-CV) of a KKNNmodel; the model has a mean sensitivity of 100 % for theclassification between tumor and normal regions, but the meansensitivity drops to 80.16 % for a differential diagnosis, e.g. for theclassification task normal-adenoma-carcinoma
Annotated classes Characteristics
Predicted class Adenoma Carcinoma Normal Sensitivity / % Specificity / %
Adenoma 4 1 0 80 87.5
Carcinoma 3 5 0 62.5 95.2
Normal 0 0 16 100 100

Bocklitz et al. BMC Cancer (2016) 16:534 Page 7 of 11
Multimodal imaging – an overviewThe first step of the proposed diagnostic workflow (Fig. 3)consisted of recording a multimodal image, which is uti-lized to derive a pseudo-HE image by multivariate statis-tics. For exemplification, the first row (A) in Fig. 2 displaysmultimodal images of mouse colon sections (for sampledetails see “Methods” Section, sample preparation). False-colors code CARS in red, TPEF in green and SHG inblue. CARS was adjusted to map the CH2-distributionoutlining mostly lipids, while the CARS signal originat-ing from proteins is weaker as their molecular mass-to-methylene group ratio is comparably decreased. TheTPEF signal was collected in the spectral range between426–490 nm, thereby, highlighting the distribution ofstrong auto-fluorophores such as elastin, NAD(P)H andkeratin, while SHG collected at 415 nm visualizes thefibrous collagen network.Proving the similarity of the information content of non-
linear multimodal and classical HE stained images, weapplied multivariate statistics in order to generate a com-putational HE stain image out of the multimodal dataset.The results are exemplified in row B of Fig. 2. For theprediction of pseudo-HE images, we utilized a modelcombining partial-least-square (PLS) regression with alinear-discriminant-analysis (LDA) that was trained usinga single HE image. Subsequent to all multimodal mea-surements, the samples were HE stained and imaged.The corresponding HE images are depicted in row C ofFig. 2. Apparently, morphological information are readilyretrieved from both set of images, i.e. in the pseudo-HEimages derived from the multimodal images (Fig. 2b) andthe real HE images (Fig. 2c). Some information, however,is missing in the pseudo-HE images (Fig. 2b). In particularthe cell nuclei are at certain areas not optimally resolvedpossibly due to signal intensity variations resulting in anon-uniform brightness of the images. It shall be notedthat nuclei may be resolved in future pseudo-HE imagesif stimulated Raman scattering at DNA specific Ramanresonances is applied featuring the required high signal-to-noise ratio [33]. From Fig. 2b and c differences in thecolor composition and brightness are visible. For exam-ple, the submucosa appears darker within the pseudo-HEimages than in the corresponding HE images. Furtherdeviations result from the ethanol washing step duringthe staining procedure removing soluble components.Consequently, some soluble components were imagedby non-linear multimodal microscopy but were removedin advance to the acquisition of the HE images. Theadvantage of the generated pseudo-HE images is that themeasurement is non-invasive, therefore allowing for fur-ther analysis. Here, a HE stain was applied afterwards forcomparison, but the employment of other stains or mea-surement modalities is also possible. Due to its speed andnon-invasiveness, the pseudo-HE stain can be applied in
a cryosection analysis setting or potentially even in-vivo.Based on the pseudo-HE images a pathologist can identifyor define suspicious areas (red flags). These small red flagareas can be further investigated by various approacheslike e.g. immunostains, or by other label-free spectro-scopic techniques featuring a higher molecular sensitivitythan non-linear multimodal imaging. In this contributionwe applied Raman-spectroscopy as a second diagnos-tic technique, offering molecular fingerprint information.The results of the Raman-study are summarized in thefollowing section.
Raman-microspectroscopic imaging – diagnosisAs mentioned in the previous section certain areas (redflags) were further characterized by means of Raman-spectroscopy. These red flag regions are marked with awhite arrow in Figs. 2a and 4a. To prove whether Raman-spectroscopy can be utilized as a molecular selectivediagnostic platform, the Raman-spectroscopically char-acterized regions were annotated and diagnosed by anexperienced pathologist in a blinded manner. The adjec-tive ’blinded’ means here that the multimodal imagesand the Raman-spectroscopic generated image wereunknown to the pathologist. The test of the diagnosticvalue of Raman-spectroscopy was achieved by applicationof a recently reported workflow termed as spectral-histo-pathology (SHP) [31, 32, 34]. In that approach everyRaman-scan is clustered and the diagnosis of the patholo-gist is transferred to a computer model. Figure 4d displayssuch a cluster-analysis. This cluster scan is subsequentlyannotated using the groups displayed in Fig. 4e. Basedon this annotation mean Raman-spectra of differentregions can be derived. Figure 4f shows as an examplethe mean Raman-spectrum of normal epithelial tissue.Thereafter, a supervised classification can be applied inorder to discriminate between normal, adenoma andcarcinoma tissue. A hyperplastic area was only presentonce in the data set, therefore the corresponding regionwas excluded from further analysis. In the same mannerRaman-spectra of other morphologic areas (muscle,connective tissue) or artefacts (background, spikes) wereexcluded.First, a univariate statistical test was applied to verify
whether the groups feature statistical significant differ-ences. The statistical significance of the Raman-spectrafor the differentiation of tumor against normal tissueand carcinoma against normal tissue were investigated byapplying a two-sample Wilcoxon test. The principal com-ponent (PC) scores of the components 3, 4 and 5 wereproven to be significant for the task normal against tumortissue. The p-values were 0.001005, 0.019 and 0.003,respectively. The scores of the fourth and fifth componentwere significant for the task ’normal against carcinoma’(p-value 0.027 and 0.00039). A boxplot of the scores of PC

Bocklitz et al. BMC Cancer (2016) 16:534 Page 8 of 11
Fig. 4Workflow: aMultimodal image of a mouse colon section (for color code see Fig. 2); b Pseudo-HE stained image derived from the multimodalimage shown in a, c HE stained image of the same section as investigated in a, d a k-means-cluster-analysis (k = 9) of the Raman-measured region,marked with a white arrow in a, e pathologist’s annotation; Here, normal epithelial tissue with non-epithelial components (other morphologicaltissue types) and background contributions (left corner) are present; f pre-treated mean Raman-spectra of the region annotated as normal epithelialtissue in e; the scale bar represents 500 μm. The colors within panel d were assigned arbitrary due to the k-means clustering, while the legendapplies only to panel e. The color selection in panel e is related to bio-medical information
3 is visualized in Fig. 5 together with the mean Raman-spectra of the groups. The band assignment for interpret-ing these Raman-spectra can be found in a number ofpublications [35, 36]. Here, we assigned the bands for visu-alization of the biggest differences and marked them inFig. 5. The band at 785 cm−1 can be attributed to the phos-phate backbone vibration of DNA [35]. The other threebands at 1003, 1449, 1657 cm−1 can be assigned to pro-tein vibrations [35, 36]. The band at 1003 cm−1 originatesfrom the symmetric ring breathing of phenylalanine [35],while the Raman-resonances at 1449 and 1657 cm−1 canbe attributed to the CH2 deformation vibration [36] andAmide I vibration [35, 36], respectively.The mean Raman-spectra were subsequently tested
for their diagnostic value. Therefore, the Raman-spectrawere pre-treated and a Weighted k-Nearest Neighbors(KKNN) classifier was trained and evaluated. In order to
estimate the generalization performance of the classifier,the biological variations between the different mice hasto be accounted for. To do so, we used an individual-out-cross-validation scheme (IO-CV), where all Raman-spectra of one individual were excluded from trainingand then predicted. This procedure was iterated and theresult is shown in Table. 1. The confusion table showsthat the diagnosis of tumor regions, e.g. the classifi-cation between tumor regions and normal regions, isaccomplished with 100 % mean sensitivity. The differen-tial diagnosis, e.g. the discrimination between adenomaand carcinoma regions, is also possible, but with a lowersensitivity. Here, mis-classifications between adenomaand carcinoma regions occurred. Nevertheless, the over-all mean sensitivity for the differential diagnosis is 80.16 %and may be increased in future experiments by improv-ing the detection scheme using, e.g. shifted-excitation

Bocklitz et al. BMC Cancer (2016) 16:534 Page 9 of 11
Fig. 5 The mean Raman-spectra of adenoma, carcinoma and normal tissue: The mean Raman-spectra corresponding to the classification system arevisualized. Selected peaks featuring large difference for distinct classes are marked by gray lines - see text for band assignment. In the upper leftcorner a boxplot of PC 3 is given, which shows the highest significance (p= 0.001005) for the separation of normal and tumor tissue
Raman-difference-spectroscopy (SERDS) [37]. In a nut-shell: the presented workflow allows for a robust andobjective diagnosis at least for tumorous and normalepithelial tissue.
ConclusionIn the present study a combination of multimodal imag-ing and Raman-microspectroscopy is suggested as a fastand precise pathological screening tool. This combi-nation of optical approaches bundles a fast overviewtechnique (multimodal imaging) for identification of sus-picious regions (red flags) that are diagnosed by a highlymolecular sensitive but rather slow method (Raman-spectroscopy). By applying multivariate statistical meth-ods the multimodal images could be converted intopseudo-HE stain images, which can be analyzed by apathologist in the same manner as normal HE images.The comparison of pseudo-HE images derived from mul-timodal images with real HE images proofs that bothHE staining and multimodal imaging (TPEF, SHG andCARS) feature similar information. This pseudo-HE stainimage can be used by a pathologist to highlight suspi-cious areas and mark them with red-flags. These red-flagareas can be further analyzed with other techniques fea-turing a higher sensitivity than non-linear multimodalimaging. In this contribution, the slow but molecularselective technique Raman-spectroscopy was tested fora precise and robust diagnosis. Compared to a gold-standard diagnosis of an experienced pathologist, theRaman-based diagnostics featured 100 % mean sensitivityfor the prediction of normal and tumor tissue. The
differential diagnosis, the prediction of adenoma, car-cinoma and normal epithelium, exhibits a mean sen-sitivity of around 80 %. Thus, further improvement isrequired if a differential diagnosis is desired. Never-theless, the combination of multimodal imaging andRaman-microspectroscopy as a fast, reliable tool to screenlarge tissue areas and to diagnose normal epithelial tis-sue from malignant tissue (adenoma, carcinoma) couldbe demonstrated.The presented combination of multimodal imaging and
Raman spectroscopy can support a pathologist especiallyin a setting where the preparation of high quality fix-ated and embedded tissue sections is hardly possible, likefor an intraoperative cryosection analysis. As both opticalimaging methods are non-invasive, a subsequent stainingwith conventional HE stain remains feasible, allowing fora direct comparison with the current pathological gold-standard or other stains and methods. The non-invasivecharacter of the methodology introduced within this arti-cle also allows for further in-vivo applications. The tech-nical transformation of the combination of multimodalimaging and Raman-spectroscopy into an operation the-ater for in-vivo studies during an operation is possible andsubject to current efforts of us. Such an in-vivo applica-tion would increase the possibilities of cancer diagnosisand treatment, since an online-monitoring of certain areascan be performed.
AbbreviationsPCA, principal component analysis; SNIP, statistics-sensitive non-linear iterativepeak-clipping; KKNN, weighted k-nearest neighbors; IO-CV,individual-out-cross-validation; NAD, Nicotinamide adenine dinucleotide; LDA,

Bocklitz et al. BMC Cancer (2016) 16:534 Page 10 of 11
linear discriminant analysis model; OCT, optical coherence tomography; SHP,spectral-histo-pathology; CARS, coherent anti-Stokes Raman-scattering; TPEF,two-photon excited autofluorescence; SHG, second harmonic generation; HE,hematoxylin and eosin
AcknowledgmentsThe authors thank Tiantian Cui, Cornelia Hüttich and Renate Stöckigt for theexcellent technical assistance.
FundingFinancial support of the German Research Foundation (DFG) for the researchprojects PO 563/13-1, PE 602/6-1 and STA 295/9-1 is gratefully acknowledged.Funding of the Bundesministerium für Bildung und Forschung for the projectFiber Health Probe (FKZ: 13N12525, 13N12526) and support of the Carl-ZeissFoundation are highly acknowledged. The publication of this article wasfunded by the Open Access Fund of the Leibniz Association.
Availability of data andmaterialsThe data can be requested from Prof. Juergen Popp ([email protected])and Dr. Thomas Bocklitz ([email protected]) as no repositories areavailable for this kind of data.
Authors’ contributionsTB, CS, AS, IP, RB, MW, MS, FRG, JP initiated the study. IP, TB, FSS and NVanalyzed the HE images. TB and OC did the image analysis, while TB did thechemometrics. SH recorded the multimodal images and NV recorded theRaman spectra. RB coordinated the animal facility. All authors prepared themanuscript and reviewed it. All authors read and approved the finalmanuscript.
Competing interestsThe authors declare that they have no competing interests.
Consent for publicationNot applicable
Ethics approval and consent to participateAll animal studies were approved by the governmental commission for animalprotection (No. 02-007/13).
Author details1Institute of Physical Chemistry and Abbe Center of Photonics,Friedrich-Schiller University Jena, Helmholtzweg 4, Jena, Germany.2Leibniz-Institute of Photonic Technology, Albert-Einstein-Str. 9, 07745, Jena,Germany. 3Iraqi Centre for Cancer and Medical Genetics Research,Al-Mustansiriya University, Baghdad, Iraq. 4Institute of Pathology, UniversityHospital - Friedrich Schiller University Jena, Ziegelmühlenweg 1, Jena D-07743,Germany. 5Clinic for Internal Medicine IV, Jena University Hospital, 07747, Jena,Germany. 6Department of Medicine 1, Friedrich-Alexander-University, 91054,Erlangen, Germany. 7Erlangen Graduate School in Advanced OpticalTechnologies (SAOT), Friedrich-Alexander Universität Erlangen-Nürnberg,Erlangen, Germany. 8Institute for Tumor Biology and Experimental Therapy,Georg-Speyer-Haus, Paul-Ehrlich-Straße 42-44, 60596, Frankfurt, Germany.
Received: 18 December 2015 Accepted: 5 July 2016
References1. World Health Organization. Global Battle Against Cancer Won’t Be Won
with Treatment Alone Effective Prevention Measures Urgently Needed toPrevent Cancer Crisis. PRESS RELEASE No 224. http://www.iarc.fr/en/publications/books/wcr/wcr-order.php. Accessed 13 Jul 2016.
2. Bombonati A, Sgroi DC. The molecular pathology of breast cancerprogression. J Pathol. 2011;223(2):308–18.
3. Netto GJ, Saad R. Diagnostic molecular pathology, part 2: Proteomics andclinical applications of molecular diagnostics in hematopathology. Proc(Bayl Univ Med Cent). 2005;18(1):7.
4. Netto GJ, Saad RD, Dysert PA. Diagnostic molecular pathology: currenttechniques and clinical applications, part i. Proc (Bayl Univ Med Cent).2003;16(4):379.
5. In: Popp J, editor. Ex-vivo and In-vivo Optical Molecular Pathology.Boschstr. 12, 69469 Weinheim, Germany: Wiley-VCH Verlag GmbH & Co.KGaA; 2014.
6. Ntziachristos V. Going deeper than microscopy: the optical imagingfrontier in biology. Nat Methods. 2010;7(8):603–14.
7. Meyer T, Bergner N, Bielecki C, Krafft C, Akimov D, Romeike BFM,Reichart R, Kalff R, Dietzek B, Popp J. Nonlinear microscopy, infrared, andRaman microspectroscopy for brain tumor analysis. J Biomed Opt.2011;16:021113.
8. Weissleder R. A clearer vision for in vivo imaging. Nat Biotechnol.2001;19(4):316–6.
9. Weissleder R. Molecular imaging in cancer. Science. 2006;312(5777):1168–71.
10. Chung VQ, Dwyer PJ, Nehal KS, Rajadhyaksha M, Menaker GM, CharlesC, Jiang SB. Use of ex vivo confocal scanning laser microscopy duringmohs surgery for nonmelanoma skin cancers. Dermatol Surg.2004;30(12p1):1470–8.
11. Wessels R, De Bruin D, Faber D, Van Leeuwen T, Van Beurden M, RuersT. Optical biopsy of epithelial cancers by optical coherence tomography(oct). Lasers Med Sci. 2014;29(3):1297–305.
12. Zhou Y, Xing W, Maslov KI, Cornelius LA, Wang LV. Handheldphotoacoustic microscopy to detect melanoma depth in vivo. OpticsLett. 2014;39(16):4731–4.
13. Kitai T, Torii M, Sugie T, Kanao S, Mikami Y, Shiina T, Toi M. Photoacousticmammography: initial clinical results. Breast Cancer. 2014;21(2):146–53.
14. Berezin MY, Achilefu S. Fluorescence lifetime measurements andbiological imaging. Chem Rev. 2010;110(5):2641–84.
15. Vogler N, Heuke S, Bocklitz TW, Schmitt M, Popp J. Multimodal imagingspectroscopy of tissue. Annu Rev Anal Chem. 2015;8:.doi:10.1146/ANNUREV-ANCHEM-071114-040352.
16. Meyer T, Schmitt M, Dietzek B, Popp J. Accumulating advantages,reducing limitations: Multimodal nonlinear imaging in biomedicalsciences–the synergy of multiple contrast mechanisms. J Biophoton.2013;6(11–12):887–904.
17. Patil CA, Kirshnamoorthi H, Ellis DL, van Leeuwen TG,Mahadevan-Jansen A. A clinical instrument for combined ramanspectroscopy-optical coherence tomography of skin cancers. Lasers SurgMed. 2011;43(2):143–51.
18. Schwitalla S, Ziegler PK, Horst D, Becker V, Kerle I, Begus-Nahrmann Y,Lechel A, Rudolph L, Langer R, Slotta-Huspenina J, Bader FG,Prazeres da Costa O, Neurath M, Meining A, Kirchner T, Greten FR. Lossof p53 in enterocytes generates an inflammatory microenvironmentenabling invasion and lymph node metastasis of carcinogen-inducedcolorectal tumors. Cancer Cell. 2013;23(1):93–106.
19. Schwitalla S, Fingerle AA, Cammareri P, Nebelsiek T, Göktuna SI, ZieglerPK, Canli O, Heijmans J, Huels DJ, Moreaux G, Rupec RA, Gerhard M,Schmid R, Barker N, Clevers H, Lang R, Neumann J, Kirchner T, TaketoMM, van den Brink GR, Sansom OJ, Arkan MC, Greten FR. Intestinaltumorigenesis initiated by dedifferentiation and acquisition ofstem-cell-like properties. Cell. 2013;152(1):25–38.
20. Heuke S, Vogler N, Meyer T, Akimov D, Kluschke F, Röwert-Huber HJ,Lademann J, Dietzek B, Popp J. Multimodal mapping of human skin.Br J Dermatol. 2013;169(4):794–803.
21. Meyer T, Baumgartl M, Gottschall T, Pascher T, Wuttig A, Matthäus C,Romeike BF, Brehm BR, Limpert J, Tünnermann A, Guntinas-Lichius O,Dietzek B, Schmitt M, Popp J. A compact microscope setup formultimodal nonlinear imaging in clinics and its application to diseasediagnostics. Analyst. 2013;138(14):4048–57.
22. Gonzalez RC, Woods RE, Eddins SL, Vol. 2. Digital Image Processing UsingMATLAB. Knoxville: Gatesmark Publishing; 2009.
23. Wehrens R, Mevik BH. Pls: Partial Least Squares Regression (PLSR) andPrincipal Component Regression (PCR). 2007. R package version 2.1-0.http://mevik.net/work/software/pls.html. Accessed 13 Jul 2016.
24. R Development Core Team. R: A Language and Environment for StatisticalComputing. Vienna, Austria: R Foundation for Statistical Computing; 2007.R Foundation for Statistical Computing. http://www.R-project.org.Accessed 13 Jul 2016.
25. Venables WN, Ripley BD. Modern Applied Statistics with S, 4th. New York:Springer; 2002. http://www.stats.ox.ac.uk/pub/MASS4. Accessed 13 Jul2016.

Bocklitz et al. BMC Cancer (2016) 16:534 Page 11 of 11
26. Hechenbichler KSK. Kknn: Weighted k-Nearest Neighbors. 2013. Rpackage version 1.2-2. http://CRAN.R-project.org/package=kknn.Accessed 13 Jul 2016.
27. Morhac M. Peaks: Peaks. 2008. R package version 0.2, https://cran.r-project.org/web/packages/Peaks/index.html. Accessed 13 Jul 2016.
28. Hastie T, Tibshirani R, Friedman J. The Elements of Statistical Learning –Data Mining, Inference, and Prediction. Heidelberg: Springer; 2008.
29. Bocklitz T, Walter A, Hartmann K, Rösch P, Popp J. How to pre-processRaman spectra for reliable and stable models? Anal Chim Acta. 2011;704:47–56. doi:10.1016/j.aca.2011.06.043.
30. Ryan CG, Clayton E, Griffin WL, Sie SH, Cousens DR. SNIP, astatistics-sensitive background treatment for the quantitative analysis ofpixe spectra in geosience aplications. Nucl Instrum Methods Phys ResSect B. 1988;34:396–402.
31. Bielecki C, Bocklitz TW, Schmitt M, Krafft C, Marquardt C, Gharbi A,Knösel T, Stallmach A, Popp J. Classification of inflammatory boweldiseases by means of Raman spectroscopic imaging of epithelium cells.J Biomed Opt. 2012;17(7):076030. doi:10.1117/1.JBO.17.7.076030.
32. Diem M, Mazur A, Lenau K, Schubert J, Bird B, Miljkovic M, Krafft C,Popp J. Molecular pathology via IR and Raman spectral imaging.J Biophoton. 2013;6(11–12):855–86.
33. Zhang X, Roeffaers MB, Basu S, Daniele JR, Fu D, Freudiger CW, HoltomGR, Xie XS. Label-free live-cell imaging of nucleic acids using stimulatedraman scattering microscopy. ChemPhysChem. 2012;13(4):1054–9.
34. Mavarani L, Petersen D, El-Mashtoly SF, Mosig A, Tannapfel A, Kötting C,Gerwert K. Spectral histopathology of colon cancer tissue sections byRaman imaging with 532 nm excitation provides label free annotation oflymphocytes, erythrocytes and proliferating nuclei of cancer cells. Analyst.2013;138:4035–9. doi:10.1039/c3an00370a.
35. Notingher I, Hench LL. Raman microspectroscopy: a noninvasive tool forstudies of individual living cells in vitro. Expert Rev Med Devices.2006;3(2):215–34.
36. Krafft C, Knetschke T, Siegner A, Funk RHW, Salzer R. Mapping of singlecells by near infrared Raman microspectroscopy. Vib Spectrosc.2003;32(1):75–83.
37. Knipfer C, Motz J, Adler W, Brunner K, Tesfay GM, Hankel R, Agaimy A,Will S, Braeuer A, Wilhelm NF, Stelzle F. Raman difference spectroscopy:a non-invasive method for identification of oral squamous cell carcinoma.Biomed Optics Express. 2014;5(9):3252–65.
Submit your next manuscript to BioMed Centraland take full advantage of:
• Convenient online submission
• Thorough peer review
• No space constraints or color figure charges
• Immediate publication on acceptance
• Inclusion in PubMed, CAS, Scopus and Google Scholar
• Research which is freely available for redistribution
Submit your manuscript at www.biomedcentral.com/submit