Embed Size (px)
Citation preview
RESEARCH ARTICLE Open Access
High-frequency ultrasound for intraoperativemargin assessments in breast conservationsurgery: a feasibility studyTimothy E Doyle1*, Rachel E Factor2, Christina L Ellefson3, Kristina M Sorensen4, Brady J Ambrose5,Jeffrey B Goodrich5, Vern P Hart5, Scott C Jensen5, Hemang Patel6 and Leigh A Neumayer3
Abstract
Background: In addition to breast imaging, ultrasound offers the potential for characterizing and distinguishingbetween benign and malignant breast tissues due to their different microstructures and material properties. Theaim of this study was to determine if high-frequency ultrasound (20-80 MHz) can provide pathology sensitivemeasurements for the ex vivo detection of cancer in margins during breast conservation surgery.
Methods: Ultrasonic tests were performed on resected margins and other tissues obtained from 17 patients,resulting in 34 specimens that were classified into 15 pathology categories. Pulse-echo and through-transmissionmeasurements were acquired from a total of 57 sites on the specimens using two single-element 50-MHztransducers. Ultrasonic attenuation and sound speed were obtained from time-domain waveforms. The waveformswere further processed with fast Fourier transforms to provide ultrasonic spectra and cepstra. The ultrasonicmeasurements and pathology types were analyzed for correlations. The specimens were additionally re-classifiedinto five pathology types to determine specificity and sensitivity values.
Results: The density of peaks in the ultrasonic spectra, a measure of spectral structure, showed significantly highervalues for carcinomas and precancerous pathologies such as atypical ductal hyperplasia than for normal tissue. Theslopes of the cepstra for non-malignant pathologies displayed significantly greater values that differentiated themfrom the normal and malignant tissues. The attenuation coefficients were sensitive to fat necrosis, fibroadenoma,and invasive lobular carcinoma. Specificities and sensitivities for differentiating pathologies from normal tissue were100% and 86% for lobular carcinomas, 100% and 74% for ductal carcinomas, 80% and 82% for benign pathologies,and 80% and 100% for fat necrosis and adenomas. Specificities and sensitivities were also determined fordifferentiating each pathology type from the other four using a multivariate analysis. The results yielded specificitiesand sensitivities of 85% and 86% for lobular carcinomas, 85% and 74% for ductal carcinomas, 100% and 61% forbenign pathologies, 84% and 100% for fat necrosis and adenomas, and 98% and 80% for normal tissue.
Conclusions: Results from high-frequency ultrasonic measurements of human breast tissue specimens indicatethat characteristics in the ultrasonic attenuation, spectra, and cepstra can be used to differentiate between normal,benign, and malignant breast pathologies.
BackgroundIn breast conservation surgery (BCS), obtaining negative(cancer free) margins is critically important for localcontrol of breast cancer in the treated breast [1,2]. Con-sequently, failure to obtain negative margins during the
initial surgery results in re-excision for 30-50% ofpatients [1-5]. A recent study of 994 women diagnosedwith ductal carcinoma in situ (DCIS) showed that bothtreatment strategy (BCS alone, BCS with radiation ther-apy, or mastectomy) and margin status strongly corre-lated with long-term ipsilateral disease-free survival, butthat positive or close margins following the last surgicaltreatment significantly reduced 5-year and 10-year
* Correspondence: [email protected] of Physics, Utah Valley University, Orem, UT 84058, USAFull list of author information is available at the end of the article
Doyle et al. BMC Cancer 2011, 11:444http://www.biomedcentral.com/1471-2407/11/444
© 2011 Doyle et al; licensee BioMed Central Ltd. This is an Open Access article distributed under the terms of the Creative CommonsAttribution License (http://creativecommons.org/licenses/by/2.0), which permits unrestricted use, distribution, and reproduction inany medium, provided the original work is properly cited.
ipsilateral event-free survival independent of treatmentstrategy [6].Several approaches are therefore being investigated for
the pre-operative and intraoperative estimation of mar-gin sizes as well as for the intraoperative detection ofcancer in surgical margins. Methods studied for the esti-mation of margin sizes include pre-operative CT andMRI and intraoperative ultrasonic imaging with conven-tional medical ultrasound instrumentation [4,7,8]. Anumber of electromagnetic and optical methods are alsobeing developed for the intraoperative detection of can-cer in margins. These include terahertz imaging [9],Raman spectroscopy [10], optical coherence tomography[11], and diffuse reflectance spectroscopy [12]. Intrao-perative pathology methods currently being used formargin assessments include touch preparation cytologyand frozen section analyses. These methods have limita-tions, however, including the requirement for an on-sitetrained pathologist, the inability to identify close mar-gins (touch preparation cytology), and the ability tosample only a small portion of the margin (frozen sec-tion analyses) [12].Many studies have shown that ultrasonic wave propa-
gation in tissues is strongly dependent on histologicalfeatures including cell structure, cell number density,tissue microstructure, and tissue heterogeneity [13-24].Ultrasound therefore presents the potential of being ableto differentiate between normal, benign, and malignantpathologies in breast tissue [25,26]. Of specific relevanceto margin assessments was a study performed on eightmastectomy specimens using ultrasound transmissiontomography from 2-10 MHz [27]. The frequency depen-dent attenuation was used to classify regions of eachspecimen into three types of tissue: Normal, benignchanges, and invasive carcinoma. The high spatial reso-lution of the scans (≤ 1 mm) permitted a high degree ofcorrelation to pathology micrographs, and yielded an80% sensitivity, 90% specificity, and 86% accuracy forthe three-way classification method.High-frequency (HF) ultrasound has also been shown
to be sensitive to changes in cell and tissue histologyassociated with mouse mammary tumors [22], apoptosisof malignant cells in centrifuged and dilute cell suspen-sions in vitro [28-30], apoptosis of malignant cells in rattissues ex vivo and in vivo [31], and apoptosis in mousetumors following photodynamic and radiation therapies[32,33]. Normal and malignant human breast epithelialcells have additionally been differentiated in vitro inmonolayer cell cultures using 20-50 MHz ultrasound[34], and tumor size and margin status in 2-5 mm thickductal carcinoma specimens have been determined with15-50 MHz scanning acoustic microscopy [35].In addition to experimental measurements, numerical
models of ultrasonic wave propagation at the
microstructural level have shown that HF ultrasoundmay be sensitive to tissue pathology [34,36-38]. Experi-mental studies using normal and malignant monolayercultures of human breast epithelial cells as well asmouse liver specimens have validated the modelingapproaches [34,38].The objective of this study was to determine if HF
ultrasound (20-80 MHz) could provide pathology sensi-tive measurements for the ex vivo detection of cancer insurgical margins obtained during breast conservationsurgery. Both pulse-echo and through-transmission mea-surements were performed on the breast tissue speci-mens. The data analysis included examiningconventional ultrasonic parameters such as ultrasonicsound speed and attenuation for correlations to pathol-ogy, as well as developing new approaches to analyzeultrasonic spectra and cepstra.
MethodsA HF ultrasonic test system, Figure 1a, was developed tocollect simultaneous pulse-echo and through-transmis-sion measurements from margins and other tissue speci-mens following resection from BCS. The data wereanalyzed with a variety of methods to search for correla-tions to tissue pathology.
Clinical protocolThe ultrasonic testing of tissue specimens obtained dur-ing the course of routine breast conservation surgerywas approved by the University of Utah InstitutionalReview Board on October 14, 2009, as a minimal riskstudy (IRB #00037350). Informed consent was obtainedfrom patients for the use of their tissues for researchpurposes. Surgeries were performed on 17 patients bythe collaborating surgeon and coauthor (LAN) at theHuntsman Cancer Hospital, Salt Lake City, Utah. Thesurgeries provided 34 resected specimens consisting ofmargins and other tissues such as lymph nodes and ade-nomas. The samples ranged from 1-5 cm in length andwidth, 0.1-1.5 cm in thickness, comprised a spectrum ofboth benign and malignant tissue pathologies, and didnot require any additional procedures or resection thataffected the patient or surgical outcome. Table 1 liststhe range of pathologies provided by the specimens. Forthe purposes of this study the pathologies were categor-ized into 15 classifications. Immediately following resec-tion, the surgeon placed each specimen inside a re-sealable plastic storage bag for ultrasonic testing (Figure1b), and labeled the bag with a de-identified specimennumber and, if applicable, the orientation of the margin.During the ultrasonic testing, the outside of the bag
was coupled to the ultrasonic transducers with ultra-sound scanning gel (Sonotech® Clear Image). The sur-face moisture of the tissue provided sufficient coupling
Doyle et al. BMC Cancer 2011, 11:444http://www.biomedcentral.com/1471-2407/11/444
Page 2 of 15
of the specimen to the inside of the bag for ultrasonictransmission. The bag therefore prevented contamina-tion of the specimen with coupling fluid and additionallyprovided improved transmission of ultrasound betweenthe transducers and specimen. One to four sites weretested on each specimen depending on the specimensize, resulting in a total of 57 sites tested. Triplicatewaveforms were acquired from each test site on a speci-men. After ultrasonic testing, routine pathology analyses
were performed on the specimens. Ultrasonic resultswere correlated to pathology reports for each specimen.
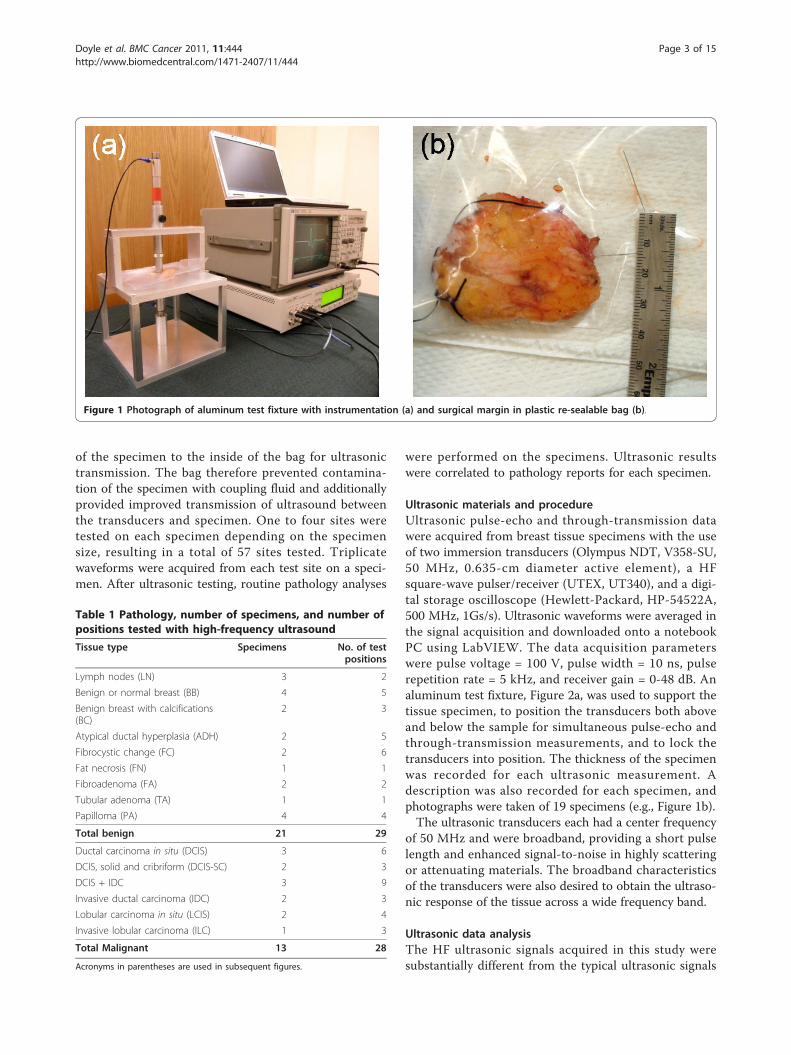
Ultrasonic materials and procedureUltrasonic pulse-echo and through-transmission datawere acquired from breast tissue specimens with the useof two immersion transducers (Olympus NDT, V358-SU,50 MHz, 0.635-cm diameter active element), a HFsquare-wave pulser/receiver (UTEX, UT340), and a digi-tal storage oscilloscope (Hewlett-Packard, HP-54522A,500 MHz, 1Gs/s). Ultrasonic waveforms were averaged inthe signal acquisition and downloaded onto a notebookPC using LabVIEW. The data acquisition parameterswere pulse voltage = 100 V, pulse width = 10 ns, pulserepetition rate = 5 kHz, and receiver gain = 0-48 dB. Analuminum test fixture, Figure 2a, was used to support thetissue specimen, to position the transducers both aboveand below the sample for simultaneous pulse-echo andthrough-transmission measurements, and to lock thetransducers into position. The thickness of the specimenwas recorded for each ultrasonic measurement. Adescription was also recorded for each specimen, andphotographs were taken of 19 specimens (e.g., Figure 1b).The ultrasonic transducers each had a center frequency
of 50 MHz and were broadband, providing a short pulselength and enhanced signal-to-noise in highly scatteringor attenuating materials. The broadband characteristicsof the transducers were also desired to obtain the ultraso-nic response of the tissue across a wide frequency band.
Ultrasonic data analysisThe HF ultrasonic signals acquired in this study weresubstantially different from the typical ultrasonic signals
Figure 1 Photograph of aluminum test fixture with instrumentation (a) and surgical margin in plastic re-sealable bag (b).
Table 1 Pathology, number of specimens, and number ofpositions tested with high-frequency ultrasound
Tissue type Specimens No. of testpositions
Lymph nodes (LN) 3 2
Benign or normal breast (BB) 4 5
Benign breast with calcifications(BC)
2 3
Atypical ductal hyperplasia (ADH) 2 5
Fibrocystic change (FC) 2 6
Fat necrosis (FN) 1 1
Fibroadenoma (FA) 2 2
Tubular adenoma (TA) 1 1
Papilloma (PA) 4 4
Total benign 21 29
Ductal carcinoma in situ (DCIS) 3 6
DCIS, solid and cribriform (DCIS-SC) 2 3
DCIS + IDC 3 9
Invasive ductal carcinoma (IDC) 2 3
Lobular carcinoma in situ (LCIS) 2 4
Invasive lobular carcinoma (ILC) 1 3
Total Malignant 13 28
Acronyms in parentheses are used in subsequent figures.
Doyle et al. BMC Cancer 2011, 11:444http://www.biomedcentral.com/1471-2407/11/444
Page 3 of 15
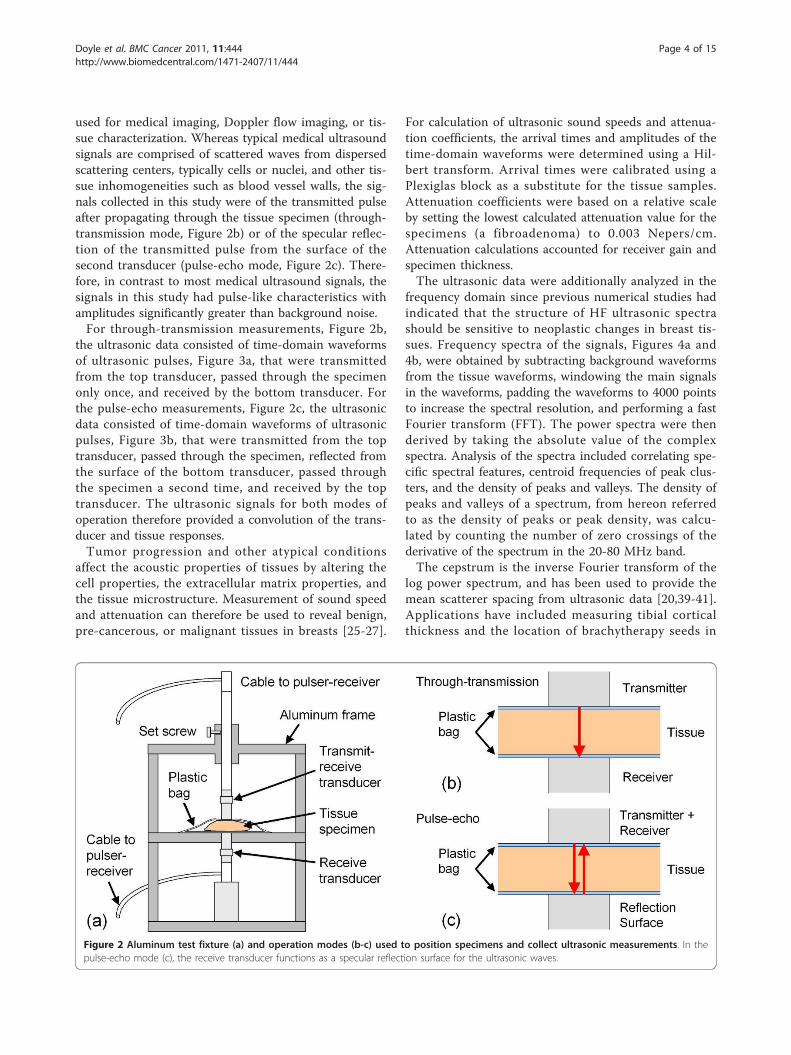
used for medical imaging, Doppler flow imaging, or tis-sue characterization. Whereas typical medical ultrasoundsignals are comprised of scattered waves from dispersedscattering centers, typically cells or nuclei, and other tis-sue inhomogeneities such as blood vessel walls, the sig-nals collected in this study were of the transmitted pulseafter propagating through the tissue specimen (through-transmission mode, Figure 2b) or of the specular reflec-tion of the transmitted pulse from the surface of thesecond transducer (pulse-echo mode, Figure 2c). There-fore, in contrast to most medical ultrasound signals, thesignals in this study had pulse-like characteristics withamplitudes significantly greater than background noise.For through-transmission measurements, Figure 2b,
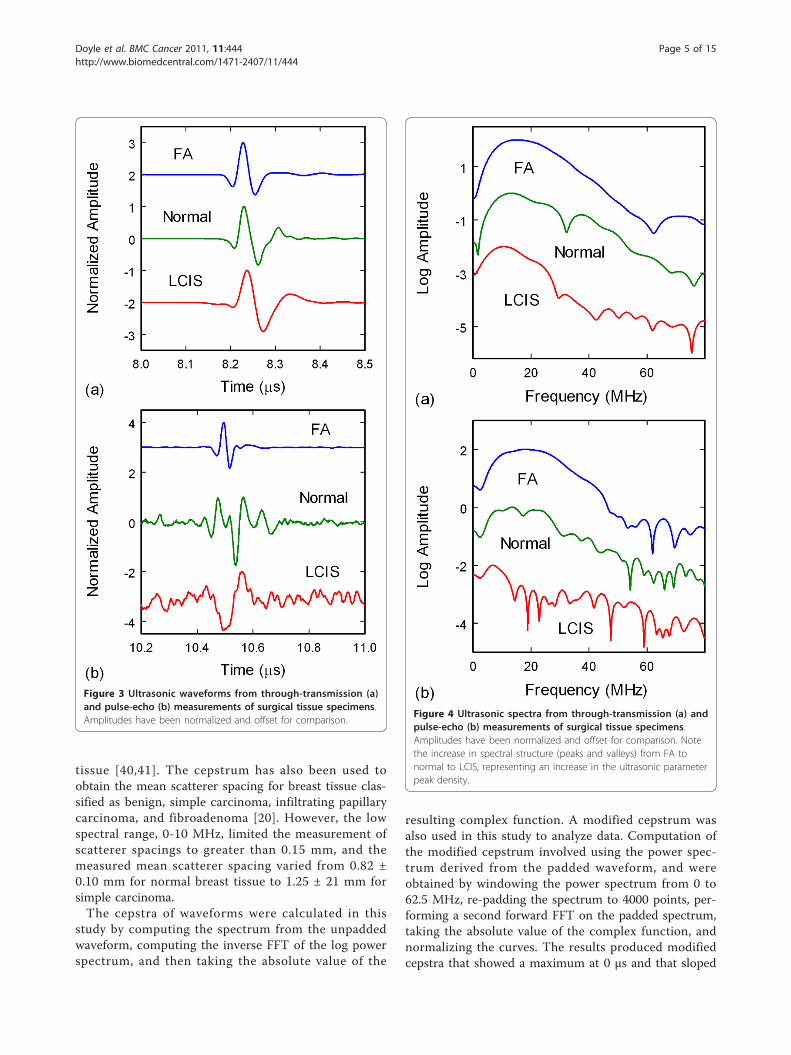
the ultrasonic data consisted of time-domain waveformsof ultrasonic pulses, Figure 3a, that were transmittedfrom the top transducer, passed through the specimenonly once, and received by the bottom transducer. Forthe pulse-echo measurements, Figure 2c, the ultrasonicdata consisted of time-domain waveforms of ultrasonicpulses, Figure 3b, that were transmitted from the toptransducer, passed through the specimen, reflected fromthe surface of the bottom transducer, passed throughthe specimen a second time, and received by the toptransducer. The ultrasonic signals for both modes ofoperation therefore provided a convolution of the trans-ducer and tissue responses.Tumor progression and other atypical conditions
affect the acoustic properties of tissues by altering thecell properties, the extracellular matrix properties, andthe tissue microstructure. Measurement of sound speedand attenuation can therefore be used to reveal benign,pre-cancerous, or malignant tissues in breasts [25-27].
For calculation of ultrasonic sound speeds and attenua-tion coefficients, the arrival times and amplitudes of thetime-domain waveforms were determined using a Hil-bert transform. Arrival times were calibrated using aPlexiglas block as a substitute for the tissue samples.Attenuation coefficients were based on a relative scaleby setting the lowest calculated attenuation value for thespecimens (a fibroadenoma) to 0.003 Nepers/cm.Attenuation calculations accounted for receiver gain andspecimen thickness.The ultrasonic data were additionally analyzed in the
frequency domain since previous numerical studies hadindicated that the structure of HF ultrasonic spectrashould be sensitive to neoplastic changes in breast tis-sues. Frequency spectra of the signals, Figures 4a and4b, were obtained by subtracting background waveformsfrom the tissue waveforms, windowing the main signalsin the waveforms, padding the waveforms to 4000 pointsto increase the spectral resolution, and performing a fastFourier transform (FFT). The power spectra were thenderived by taking the absolute value of the complexspectra. Analysis of the spectra included correlating spe-cific spectral features, centroid frequencies of peak clus-ters, and the density of peaks and valleys. The density ofpeaks and valleys of a spectrum, from hereon referredto as the density of peaks or peak density, was calcu-lated by counting the number of zero crossings of thederivative of the spectrum in the 20-80 MHz band.The cepstrum is the inverse Fourier transform of the
log power spectrum, and has been used to provide themean scatterer spacing from ultrasonic data [20,39-41].Applications have included measuring tibial corticalthickness and the location of brachytherapy seeds in
Figure 2 Aluminum test fixture (a) and operation modes (b-c) used to position specimens and collect ultrasonic measurements. In thepulse-echo mode (c), the receive transducer functions as a specular reflection surface for the ultrasonic waves.
Doyle et al. BMC Cancer 2011, 11:444http://www.biomedcentral.com/1471-2407/11/444
Page 4 of 15
tissue [40,41]. The cepstrum has also been used toobtain the mean scatterer spacing for breast tissue clas-sified as benign, simple carcinoma, infiltrating papillarycarcinoma, and fibroadenoma [20]. However, the lowspectral range, 0-10 MHz, limited the measurement ofscatterer spacings to greater than 0.15 mm, and themeasured mean scatterer spacing varied from 0.82 ±0.10 mm for normal breast tissue to 1.25 ± 21 mm forsimple carcinoma.The cepstra of waveforms were calculated in this
study by computing the spectrum from the unpaddedwaveform, computing the inverse FFT of the log powerspectrum, and then taking the absolute value of the
resulting complex function. A modified cepstrum wasalso used in this study to analyze data. Computation ofthe modified cepstrum involved using the power spec-trum derived from the padded waveform, and wereobtained by windowing the power spectrum from 0 to62.5 MHz, re-padding the spectrum to 4000 points, per-forming a second forward FFT on the padded spectrum,taking the absolute value of the complex function, andnormalizing the curves. The results produced modifiedcepstra that showed a maximum at 0 μs and that sloped
Figure 3 Ultrasonic waveforms from through-transmission (a)and pulse-echo (b) measurements of surgical tissue specimens.Amplitudes have been normalized and offset for comparison.
Figure 4 Ultrasonic spectra from through-transmission (a) andpulse-echo (b) measurements of surgical tissue specimens.Amplitudes have been normalized and offset for comparison. Notethe increase in spectral structure (peaks and valleys) from FA tonormal to LCIS, representing an increase in the ultrasonic parameterpeak density.
Doyle et al. BMC Cancer 2011, 11:444http://www.biomedcentral.com/1471-2407/11/444
Page 5 of 15
downward with multiple peaks at various positions. Themodified cepstra were analyzed by calculating the slopeof the log of the modified cepstrum, which was approxi-mately linear in the 0-0.3 μs range. The value of themodified cepstrum at 0.3 μs was also calculated. Theintercept at 0.3 μs was chosen as a measurement para-meter due to the change in slope of the modified cep-strum at this point in the curve.The data were evaluated with bar charts using the
median for the bar height and the median absolutedeviation (MAD) of the analyzed parameters for theerror bars. After analyzing the data by the 15 pathol-ogy types as shown in Table 1, the data were reclassi-fied into 5 pathology types: (1) normal breast tissue,(2) FN-FA-TA (fat necrosis, fibroadenoma, and tubularadenoma), (3) benign pathologies (BC, ADH, FC, andPA), (4) ductal carcinomas (DCIS, DCIS-SC, DCIS +IDC, and IDC), and (5) lobular carcinomas (LCIS andILC). These categories were used to assess the efficacyof the preliminary measurements in this study for dif-ferentiating carcinoma in resected margins. Specifici-ties and sensitivities for pathology types (2)-(5) werecalculated with respect to normal tissue (1). Specifici-ties and sensitivities for the five pathology types wereadditionally determined using a two-parameter multi-variate analysis. Finally, t-tests and one-way ANOVAtests were performed to evaluate the significance levelof the results.
ResultsSound speed and attenuation measurementsThe ultrasonic sound speed measurements were widelyscattered and displayed large deviations, rendering a dif-ferentiation of pathology types difficult. Since the timemeasurements were accurate to 1 ns (through-transmis-sion) and 2 ns (pulse-echo), the principal cause for thesound speed variations was the error in the thicknessmeasurements, which were performed manually by mea-suring the displacement of the search tube that held thetop transducer from the test fixture. The error in thismeasurement was ± 0.5 mm, providing sound speederrors from 3.3% for the thickest samples (15.5 mm) to42% for the thinnest samples (1.2 mm). Since the meansample thickness was 5.0 mm, the average error inthickness and sound speed would be ± 10%. For glandu-lar breast tissue, this error would translate to a soundspeed measurement of approximately 1.52 ± 0.15 mm/μs [25,42]. Since the ultrasonic velocities of breast fat,cysts, and tumors lie within this range (1.46, 1.57, and1.55 mm/μs, respectively) [25], it would be difficult todifferentiate between different breast pathologies withsound speed measurements from this study.The ultrasonic attenuation measurements were prone
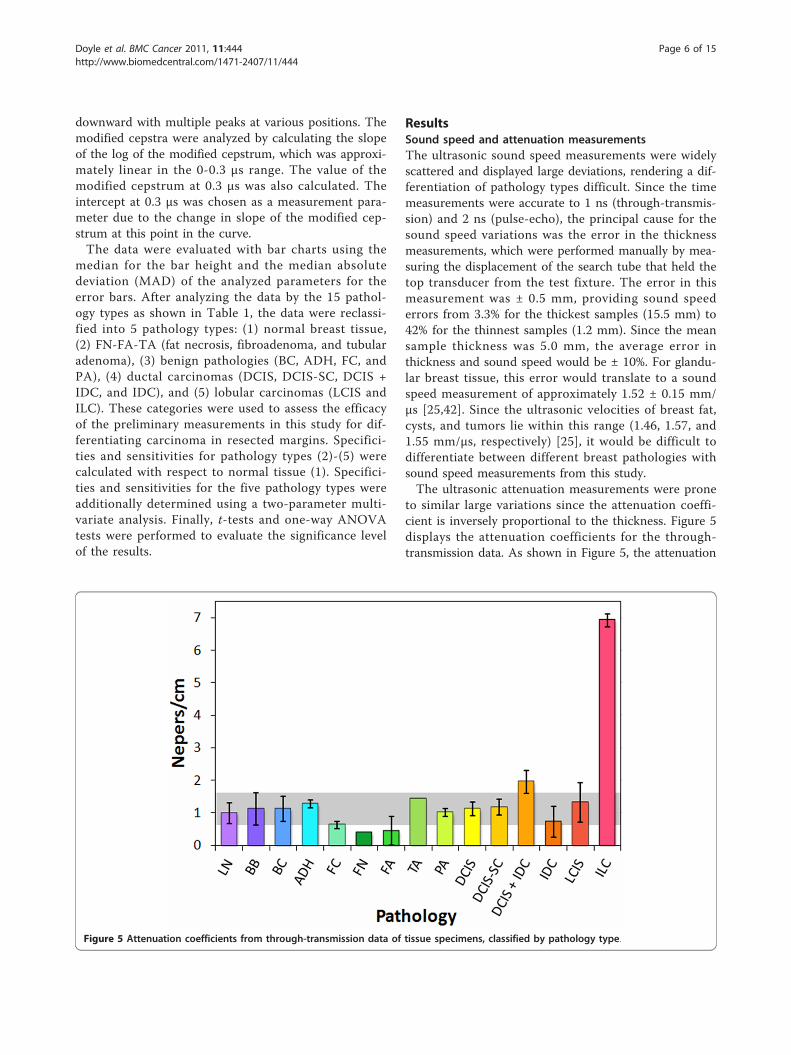
to similar large variations since the attenuation coeffi-cient is inversely proportional to the thickness. Figure 5displays the attenuation coefficients for the through-transmission data. As shown in Figure 5, the attenuation
Figure 5 Attenuation coefficients from through-transmission data of tissue specimens, classified by pathology type.
Doyle et al. BMC Cancer 2011, 11:444http://www.biomedcentral.com/1471-2407/11/444
Page 6 of 15
coefficients for most of the pathology classifications fallwithin the median absolute deviation range for the nor-mal breast tissue (gray band). The exceptions are (1) fatnecrosis and fibroadenoma, which fall below the grayband, (2) DCIS + IDC, which lies immediately above thegray band, and (3) ILC, with an attenuation substantiallyhigher than all of the other pathologies and withoutoverlapping deviations. These results are consistent withpublished data, which show lower attenuations for fatand cysts as compared to glandular breast tissue andconsiderably higher attenuations for tumors [25,42]. Theattenuation coefficients for the pulse-echo data were lessaccurate due to the double pass of the wave through thesample and plastic bag, giving rise to additional reflec-tion losses.
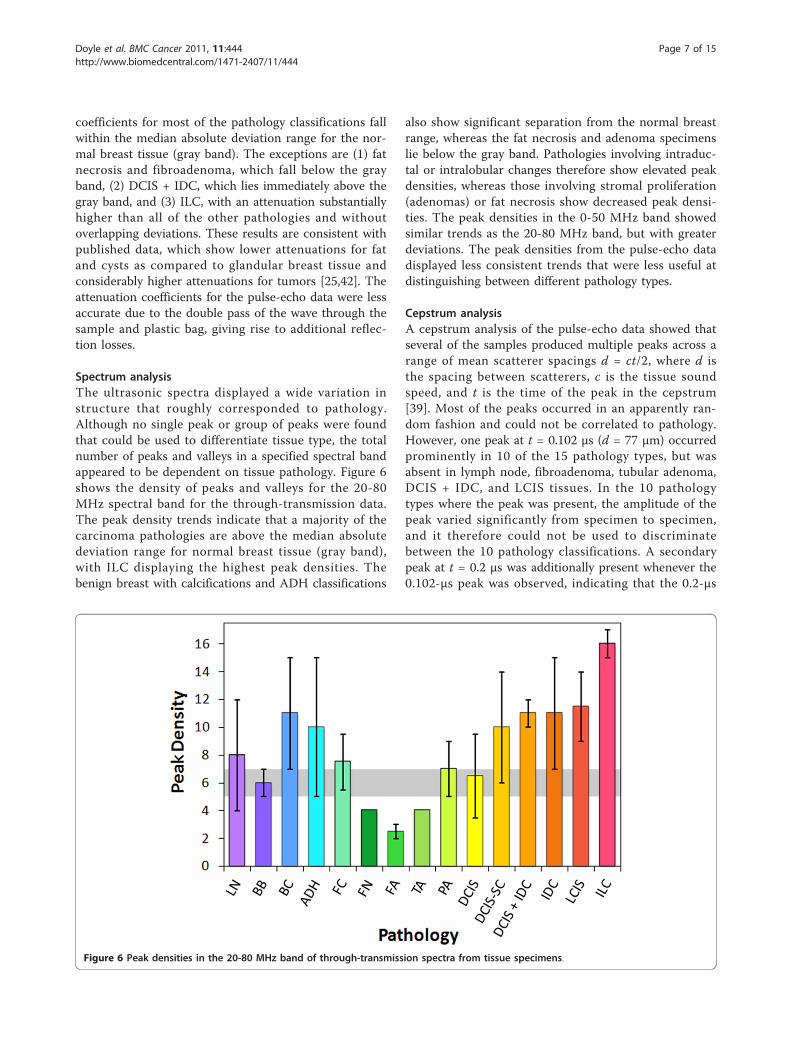
Spectrum analysisThe ultrasonic spectra displayed a wide variation instructure that roughly corresponded to pathology.Although no single peak or group of peaks were foundthat could be used to differentiate tissue type, the totalnumber of peaks and valleys in a specified spectral bandappeared to be dependent on tissue pathology. Figure 6shows the density of peaks and valleys for the 20-80MHz spectral band for the through-transmission data.The peak density trends indicate that a majority of thecarcinoma pathologies are above the median absolutedeviation range for normal breast tissue (gray band),with ILC displaying the highest peak densities. Thebenign breast with calcifications and ADH classifications
also show significant separation from the normal breastrange, whereas the fat necrosis and adenoma specimenslie below the gray band. Pathologies involving intraduc-tal or intralobular changes therefore show elevated peakdensities, whereas those involving stromal proliferation(adenomas) or fat necrosis show decreased peak densi-ties. The peak densities in the 0-50 MHz band showedsimilar trends as the 20-80 MHz band, but with greaterdeviations. The peak densities from the pulse-echo datadisplayed less consistent trends that were less useful atdistinguishing between different pathology types.
Cepstrum analysisA cepstrum analysis of the pulse-echo data showed thatseveral of the samples produced multiple peaks across arange of mean scatterer spacings d = ct/2, where d isthe spacing between scatterers, c is the tissue soundspeed, and t is the time of the peak in the cepstrum[39]. Most of the peaks occurred in an apparently ran-dom fashion and could not be correlated to pathology.However, one peak at t = 0.102 μs (d = 77 μm) occurredprominently in 10 of the 15 pathology types, but wasabsent in lymph node, fibroadenoma, tubular adenoma,DCIS + IDC, and LCIS tissues. In the 10 pathologytypes where the peak was present, the amplitude of thepeak varied significantly from specimen to specimen,and it therefore could not be used to discriminatebetween the 10 pathology classifications. A secondarypeak at t = 0.2 μs was additionally present whenever the0.102-μs peak was observed, indicating that the 0.2-μs
Figure 6 Peak densities in the 20-80 MHz band of through-transmission spectra from tissue specimens.
Doyle et al. BMC Cancer 2011, 11:444http://www.biomedcentral.com/1471-2407/11/444
Page 7 of 15
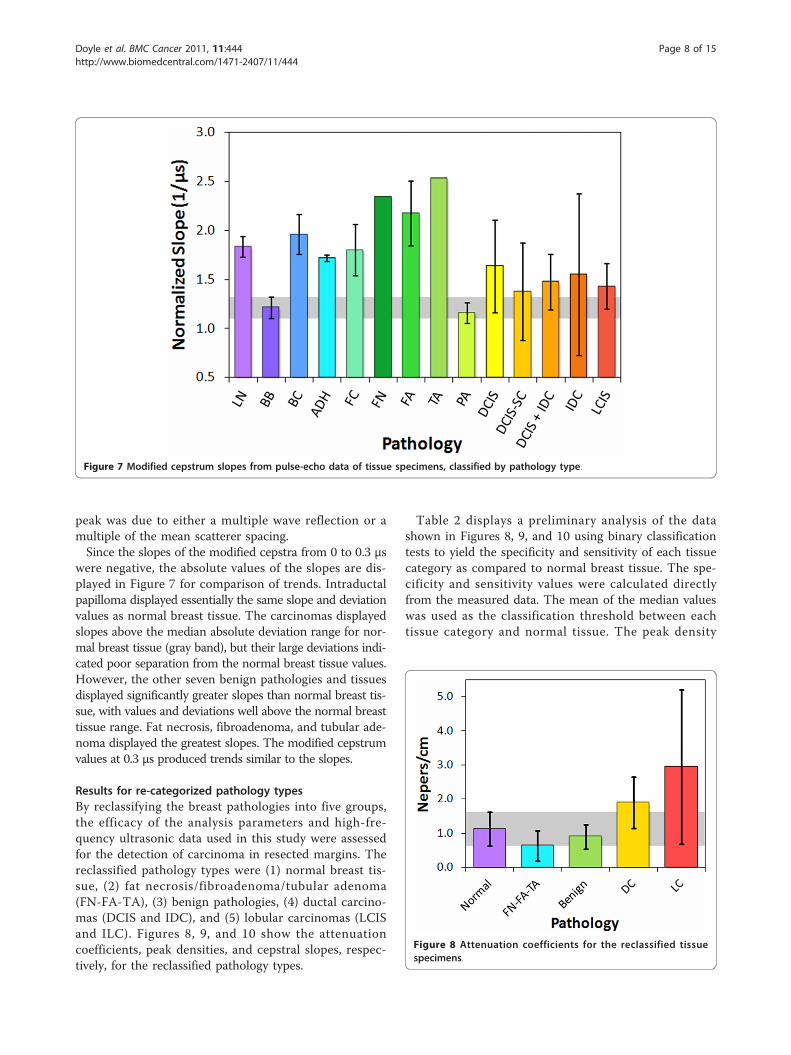
peak was due to either a multiple wave reflection or amultiple of the mean scatterer spacing.Since the slopes of the modified cepstra from 0 to 0.3 μs
were negative, the absolute values of the slopes are dis-played in Figure 7 for comparison of trends. Intraductalpapilloma displayed essentially the same slope and deviationvalues as normal breast tissue. The carcinomas displayedslopes above the median absolute deviation range for nor-mal breast tissue (gray band), but their large deviations indi-cated poor separation from the normal breast tissue values.However, the other seven benign pathologies and tissuesdisplayed significantly greater slopes than normal breast tis-sue, with values and deviations well above the normal breasttissue range. Fat necrosis, fibroadenoma, and tubular ade-noma displayed the greatest slopes. The modified cepstrumvalues at 0.3 μs produced trends similar to the slopes.
Results for re-categorized pathology typesBy reclassifying the breast pathologies into five groups,the efficacy of the analysis parameters and high-fre-quency ultrasonic data used in this study were assessedfor the detection of carcinoma in resected margins. Thereclassified pathology types were (1) normal breast tis-sue, (2) fat necrosis/fibroadenoma/tubular adenoma(FN-FA-TA), (3) benign pathologies, (4) ductal carcino-mas (DCIS and IDC), and (5) lobular carcinomas (LCISand ILC). Figures 8, 9, and 10 show the attenuationcoefficients, peak densities, and cepstral slopes, respec-tively, for the reclassified pathology types.
Table 2 displays a preliminary analysis of the datashown in Figures 8, 9, and 10 using binary classificationtests to yield the specificity and sensitivity of each tissuecategory as compared to normal breast tissue. The spe-cificity and sensitivity values were calculated directlyfrom the measured data. The mean of the median valueswas used as the classification threshold between eachtissue category and normal tissue. The peak density
Figure 7 Modified cepstrum slopes from pulse-echo data of tissue specimens, classified by pathology type.
Figure 8 Attenuation coefficients for the reclassified tissuespecimens.
Doyle et al. BMC Cancer 2011, 11:444http://www.biomedcentral.com/1471-2407/11/444
Page 8 of 15

provided the highest values between normal and malig-nant tissues, whereas the cepstrum slope provided thehighest values between normal tissue and benign pathol-ogies. Both peak density and cepstrum slope gave thesame values between normal and FN-FA-TA patholo-gies. The binary classification tests indicated higher spe-cificities and sensitivities for lobular carcinomas than forductal carcinomas. The specificities and sensitivities areexpected to improve with more measurements fromfuture studies.The significance of the specificities and sensitivities in
Table 2 were analyzed with t-tests. Table 3 displays thet-test and p-value for each of the four pathology groups
in comparison to normal tissue, and for each of thethree ultrasonic parameters. The analyses that providedstatistically significant values (p < 0.05) were peak den-sity for lobular carcinomas, ductal carcinomas, and FN-FA-TA pathologies, and cepstrum slope for FN-FA-TAand benign pathologies. All five pathology groups wereadditionally analyzed with one-way ANOVA tests todetermine which of the three ultrasonic parameters pro-vided statistically significant separation of all five groups.The F-ratio for attenuation was F4, 31 = 3.933, indicatingthat the results are significant at the 5% level and veryclose to the 1% level of significance. Similarly, the F-ratio for peak density was F4, 31 = 3.728, again indicatingthat the results are significant at the 5% level and closeto the 1% level of significance. Finally, the F-ratio forcepstrum slope was F4, 25 = 1.854, indicating that theresults are not significant at the 10% level. Therefore, incontrast to the paired t-tests, the ANOVA tests suggestthat attenuation and peak density provide the highestsignificance for distinguishing between the pathologytypes.A multivariate analysis was also performed on the re-
categorized data by using the two-dimensional para-meter space defined by attenuation and peak density(Figure 11a). Classification boundaries were determinedin this space by rotating and translating the coordinatesof the data points and calculating linear and parabolic
Figure 9 Peak densities in the 20-80 MHz band for thereclassified tissue specimens.
Figure 10 Modified cepstrum slopes for the reclassified tissuespecimens.
Table 2 Highest specificity and sensitivity values fromanalysis of data classified into five pathology categories
Pathology Parameter Specificity Sensitivity
Lobularcarcinomas
Peak density 100% 86%
Ductalcarcinomas
Peak density 100% 74%
FN-FA-TA Peak density & cepstrumslope
80% 100%
Benignpathologies
Cepstrum slope 80% 82%
The specificity and sensitivity for each tissue category was calculated withrespect to normal breast tissue.
Table 3 t-test results from analysis of data classified intofive pathology categories
Pathology Attenuation Peak density Cepstrum slope
Lobular carcinomas t(10) = 2.14p < 0.10
t(10) = 2.952p < 0.02
t(10) = 0.88p > 0.20
Ductal carcinomas t(22) = 1.305p > 0.20
t(22) = 2.233p < 0.05
t(19) = 1.406p < 0.20
FN-FA-TA t(7) = 1.278p > 0.20
t(7) = 2.609p < 0.05
t(7) = 4.615p < 0.01
Benign pathologies t(21) = 1.414p < 0.20
t(21) = 1.751p < 0.10
t(20) = 2.883p < 0.01
The t-test and p-value for each tissue category was calculated with respect tonormal breast tissue.
Doyle et al. BMC Cancer 2011, 11:444http://www.biomedcentral.com/1471-2407/11/444
Page 9 of 15
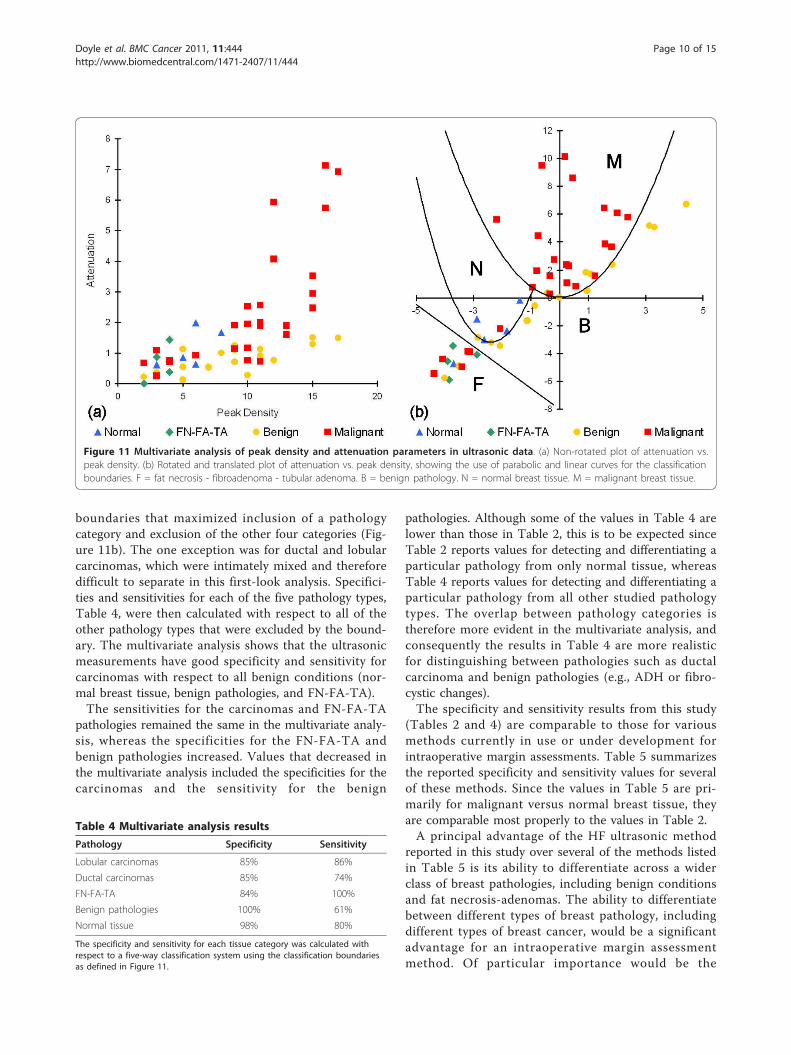
boundaries that maximized inclusion of a pathologycategory and exclusion of the other four categories (Fig-ure 11b). The one exception was for ductal and lobularcarcinomas, which were intimately mixed and thereforedifficult to separate in this first-look analysis. Specifici-ties and sensitivities for each of the five pathology types,Table 4, were then calculated with respect to all of theother pathology types that were excluded by the bound-ary. The multivariate analysis shows that the ultrasonicmeasurements have good specificity and sensitivity forcarcinomas with respect to all benign conditions (nor-mal breast tissue, benign pathologies, and FN-FA-TA).The sensitivities for the carcinomas and FN-FA-TA
pathologies remained the same in the multivariate analy-sis, whereas the specificities for the FN-FA-TA andbenign pathologies increased. Values that decreased inthe multivariate analysis included the specificities for thecarcinomas and the sensitivity for the benign
pathologies. Although some of the values in Table 4 arelower than those in Table 2, this is to be expected sinceTable 2 reports values for detecting and differentiating aparticular pathology from only normal tissue, whereasTable 4 reports values for detecting and differentiating aparticular pathology from all other studied pathologytypes. The overlap between pathology categories istherefore more evident in the multivariate analysis, andconsequently the results in Table 4 are more realisticfor distinguishing between pathologies such as ductalcarcinoma and benign pathologies (e.g., ADH or fibro-cystic changes).The specificity and sensitivity results from this study
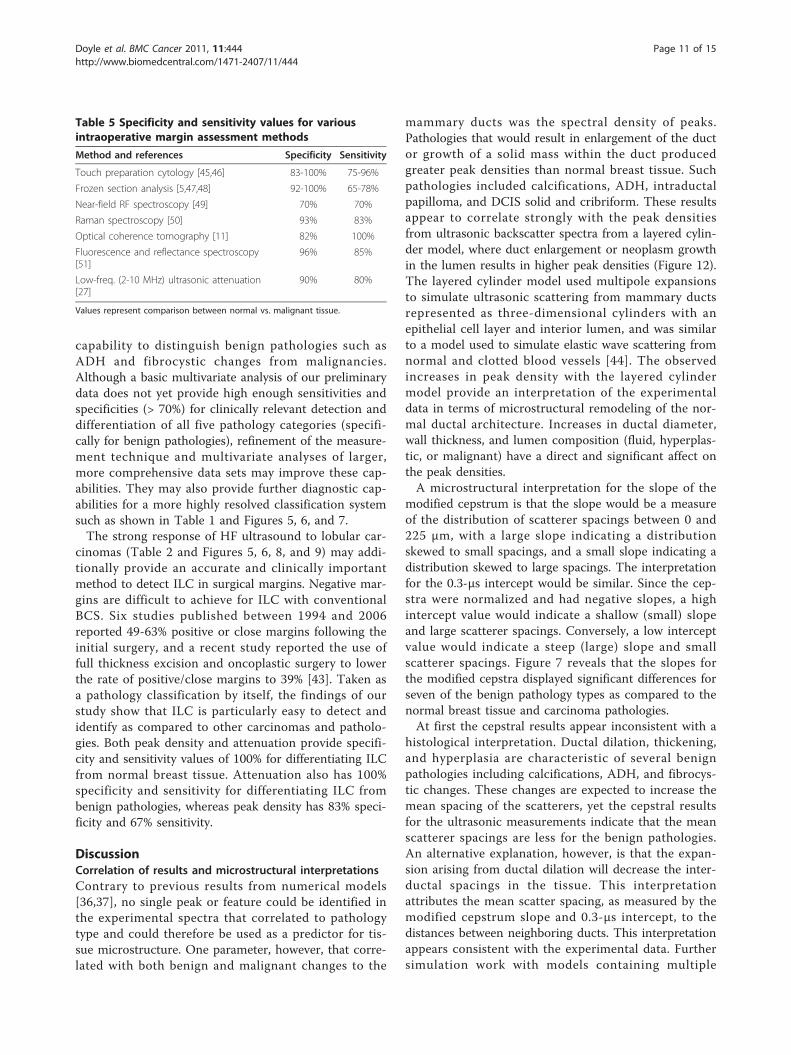
(Tables 2 and 4) are comparable to those for variousmethods currently in use or under development forintraoperative margin assessments. Table 5 summarizesthe reported specificity and sensitivity values for severalof these methods. Since the values in Table 5 are pri-marily for malignant versus normal breast tissue, theyare comparable most properly to the values in Table 2.A principal advantage of the HF ultrasonic method
reported in this study over several of the methods listedin Table 5 is its ability to differentiate across a widerclass of breast pathologies, including benign conditionsand fat necrosis-adenomas. The ability to differentiatebetween different types of breast pathology, includingdifferent types of breast cancer, would be a significantadvantage for an intraoperative margin assessmentmethod. Of particular importance would be the
Figure 11 Multivariate analysis of peak density and attenuation parameters in ultrasonic data. (a) Non-rotated plot of attenuation vs.peak density. (b) Rotated and translated plot of attenuation vs. peak density, showing the use of parabolic and linear curves for the classificationboundaries. F = fat necrosis - fibroadenoma - tubular adenoma. B = benign pathology. N = normal breast tissue. M = malignant breast tissue.
Table 4 Multivariate analysis results
Pathology Specificity Sensitivity
Lobular carcinomas 85% 86%
Ductal carcinomas 85% 74%
FN-FA-TA 84% 100%
Benign pathologies 100% 61%
Normal tissue 98% 80%
The specificity and sensitivity for each tissue category was calculated withrespect to a five-way classification system using the classification boundariesas defined in Figure 11.
Doyle et al. BMC Cancer 2011, 11:444http://www.biomedcentral.com/1471-2407/11/444
Page 10 of 15
capability to distinguish benign pathologies such asADH and fibrocystic changes from malignancies.Although a basic multivariate analysis of our preliminarydata does not yet provide high enough sensitivities andspecificities (> 70%) for clinically relevant detection anddifferentiation of all five pathology categories (specifi-cally for benign pathologies), refinement of the measure-ment technique and multivariate analyses of larger,more comprehensive data sets may improve these cap-abilities. They may also provide further diagnostic cap-abilities for a more highly resolved classification systemsuch as shown in Table 1 and Figures 5, 6, and 7.The strong response of HF ultrasound to lobular car-
cinomas (Table 2 and Figures 5, 6, 8, and 9) may addi-tionally provide an accurate and clinically importantmethod to detect ILC in surgical margins. Negative mar-gins are difficult to achieve for ILC with conventionalBCS. Six studies published between 1994 and 2006reported 49-63% positive or close margins following theinitial surgery, and a recent study reported the use offull thickness excision and oncoplastic surgery to lowerthe rate of positive/close margins to 39% [43]. Taken asa pathology classification by itself, the findings of ourstudy show that ILC is particularly easy to detect andidentify as compared to other carcinomas and patholo-gies. Both peak density and attenuation provide specifi-city and sensitivity values of 100% for differentiating ILCfrom normal breast tissue. Attenuation also has 100%specificity and sensitivity for differentiating ILC frombenign pathologies, whereas peak density has 83% speci-ficity and 67% sensitivity.
DiscussionCorrelation of results and microstructural interpretationsContrary to previous results from numerical models[36,37], no single peak or feature could be identified inthe experimental spectra that correlated to pathologytype and could therefore be used as a predictor for tis-sue microstructure. One parameter, however, that corre-lated with both benign and malignant changes to the
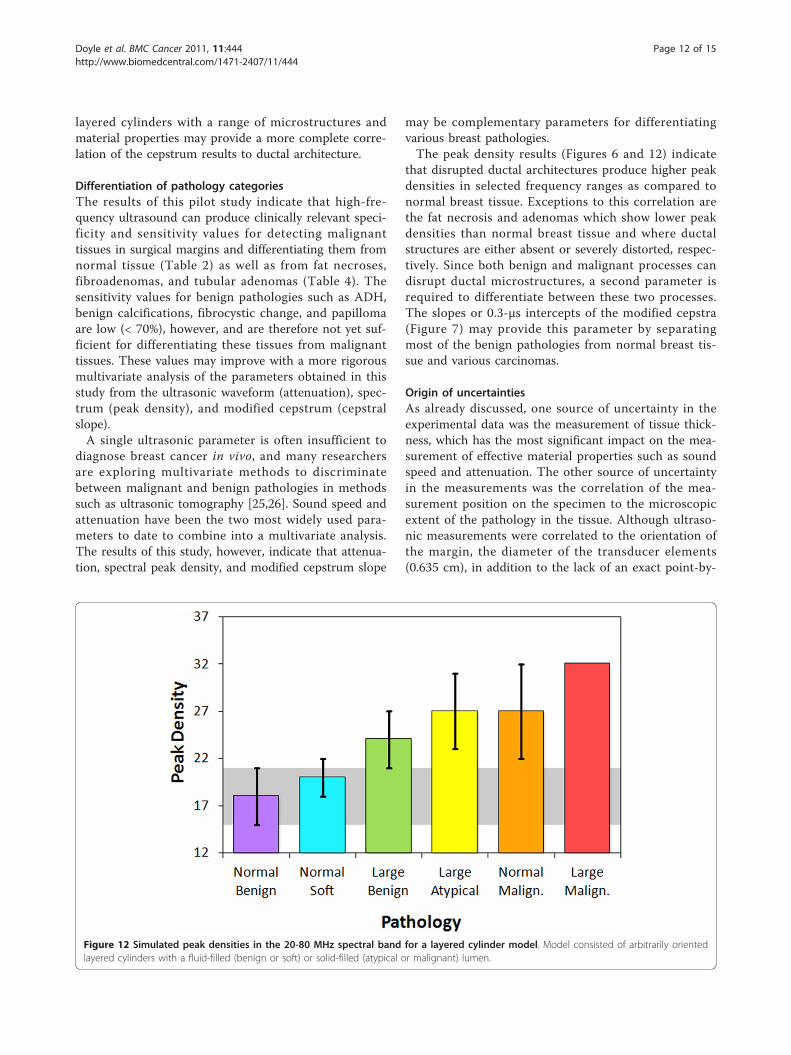
mammary ducts was the spectral density of peaks.Pathologies that would result in enlargement of the ductor growth of a solid mass within the duct producedgreater peak densities than normal breast tissue. Suchpathologies included calcifications, ADH, intraductalpapilloma, and DCIS solid and cribriform. These resultsappear to correlate strongly with the peak densitiesfrom ultrasonic backscatter spectra from a layered cylin-der model, where duct enlargement or neoplasm growthin the lumen results in higher peak densities (Figure 12).The layered cylinder model used multipole expansionsto simulate ultrasonic scattering from mammary ductsrepresented as three-dimensional cylinders with anepithelial cell layer and interior lumen, and was similarto a model used to simulate elastic wave scattering fromnormal and clotted blood vessels [44]. The observedincreases in peak density with the layered cylindermodel provide an interpretation of the experimentaldata in terms of microstructural remodeling of the nor-mal ductal architecture. Increases in ductal diameter,wall thickness, and lumen composition (fluid, hyperplas-tic, or malignant) have a direct and significant affect onthe peak densities.A microstructural interpretation for the slope of the
modified cepstrum is that the slope would be a measureof the distribution of scatterer spacings between 0 and225 μm, with a large slope indicating a distributionskewed to small spacings, and a small slope indicating adistribution skewed to large spacings. The interpretationfor the 0.3-μs intercept would be similar. Since the cep-stra were normalized and had negative slopes, a highintercept value would indicate a shallow (small) slopeand large scatterer spacings. Conversely, a low interceptvalue would indicate a steep (large) slope and smallscatterer spacings. Figure 7 reveals that the slopes forthe modified cepstra displayed significant differences forseven of the benign pathology types as compared to thenormal breast tissue and carcinoma pathologies.At first the cepstral results appear inconsistent with a
histological interpretation. Ductal dilation, thickening,and hyperplasia are characteristic of several benignpathologies including calcifications, ADH, and fibrocys-tic changes. These changes are expected to increase themean spacing of the scatterers, yet the cepstral resultsfor the ultrasonic measurements indicate that the meanscatterer spacings are less for the benign pathologies.An alternative explanation, however, is that the expan-sion arising from ductal dilation will decrease the inter-ductal spacings in the tissue. This interpretationattributes the mean scatter spacing, as measured by themodified cepstrum slope and 0.3-μs intercept, to thedistances between neighboring ducts. This interpretationappears consistent with the experimental data. Furthersimulation work with models containing multiple
Table 5 Specificity and sensitivity values for variousintraoperative margin assessment methods
Method and references Specificity Sensitivity
Touch preparation cytology [45,46] 83-100% 75-96%
Frozen section analysis [5,47,48] 92-100% 65-78%
Near-field RF spectroscopy [49] 70% 70%
Raman spectroscopy [50] 93% 83%
Optical coherence tomography [11] 82% 100%
Fluorescence and reflectance spectroscopy[51]
96% 85%
Low-freq. (2-10 MHz) ultrasonic attenuation[27]
90% 80%
Values represent comparison between normal vs. malignant tissue.
Doyle et al. BMC Cancer 2011, 11:444http://www.biomedcentral.com/1471-2407/11/444
Page 11 of 15
layered cylinders with a range of microstructures andmaterial properties may provide a more complete corre-lation of the cepstrum results to ductal architecture.
Differentiation of pathology categoriesThe results of this pilot study indicate that high-fre-quency ultrasound can produce clinically relevant speci-ficity and sensitivity values for detecting malignanttissues in surgical margins and differentiating them fromnormal tissue (Table 2) as well as from fat necroses,fibroadenomas, and tubular adenomas (Table 4). Thesensitivity values for benign pathologies such as ADH,benign calcifications, fibrocystic change, and papillomaare low (< 70%), however, and are therefore not yet suf-ficient for differentiating these tissues from malignanttissues. These values may improve with a more rigorousmultivariate analysis of the parameters obtained in thisstudy from the ultrasonic waveform (attenuation), spec-trum (peak density), and modified cepstrum (cepstralslope).A single ultrasonic parameter is often insufficient to
diagnose breast cancer in vivo, and many researchersare exploring multivariate methods to discriminatebetween malignant and benign pathologies in methodssuch as ultrasonic tomography [25,26]. Sound speed andattenuation have been the two most widely used para-meters to date to combine into a multivariate analysis.The results of this study, however, indicate that attenua-tion, spectral peak density, and modified cepstrum slope
may be complementary parameters for differentiatingvarious breast pathologies.The peak density results (Figures 6 and 12) indicate
that disrupted ductal architectures produce higher peakdensities in selected frequency ranges as compared tonormal breast tissue. Exceptions to this correlation arethe fat necrosis and adenomas which show lower peakdensities than normal breast tissue and where ductalstructures are either absent or severely distorted, respec-tively. Since both benign and malignant processes candisrupt ductal microstructures, a second parameter isrequired to differentiate between these two processes.The slopes or 0.3-μs intercepts of the modified cepstra(Figure 7) may provide this parameter by separatingmost of the benign pathologies from normal breast tis-sue and various carcinomas.
Origin of uncertaintiesAs already discussed, one source of uncertainty in theexperimental data was the measurement of tissue thick-ness, which has the most significant impact on the mea-surement of effective material properties such as soundspeed and attenuation. The other source of uncertaintyin the measurements was the correlation of the mea-surement position on the specimen to the microscopicextent of the pathology in the tissue. Although ultraso-nic measurements were correlated to the orientation ofthe margin, the diameter of the transducer elements(0.635 cm), in addition to the lack of an exact point-by-
Figure 12 Simulated peak densities in the 20-80 MHz spectral band for a layered cylinder model. Model consisted of arbitrarily orientedlayered cylinders with a fluid-filled (benign or soft) or solid-filled (atypical or malignant) lumen.
Doyle et al. BMC Cancer 2011, 11:444http://www.biomedcentral.com/1471-2407/11/444
Page 12 of 15
point matching of transducer position to specimenpathology in this study, most likely resulted in the sam-pling of tissues of mixed pathologies (e.g., normal breastplus DCIS) in a significant number of measurements.This measurement uncertainty is most probably themain source of the median absolute deviations in thepeak density and cepstrum plots (Figures 6 and 7).Finally, the small number of tested samples in this pilotstudy limits the statistical robustness of the results, par-ticularly for pathology types with only one or two mea-surements. Implementing a more comprehensiveexperimental design in subsequent studies is thereforeessential to minimizing the thickness and positioningerrors as well as to increasing the number of measure-ments for each pathology category.
ConclusionsHigh-frequency ultrasonic measurements were collectedfrom resected margins and other breast tissues. Attenua-tion, spectral, and cepstral analyses of these measure-ments show correlations to both benign and malignantpathologies that could potentially be used in a multivari-ate analysis to determine tissue pathology for intrao-perative margin assessments. The density of peaks inthe ultrasonic spectra is a key parameter in the correla-tions, and appears to be linked to the disruption of theductal architecture in breast tissue.
List of abbreviationsADH: atypical ductal hyperplasia; BB: benign breast; BC: benign breast withcalcifications; DC: ductal carcinoma; DCIS: ductal carcinoma in situ; DCIS-SC:ductal carcinoma in situ, solid and cribriform; FA: fibroadenoma; FC:fibrocystic change; FN: fat necrosis; HF: high-frequency; IDC: invasive ductalcarcinoma; ILC: invasive lobular carcinoma; LC: lobular carcinoma; LCIS:lobular carcinoma in situ; LN: lymph node; PA: papilloma; TA: tubularadenoma
AcknowledgementsWe gratefully thank the patients for their willingness to allow their tissues tobe used for this study, the surgical staff at the Huntsman Cancer Hospital fortheir assistance, and the pathologists for their analyses of the margins. Weespecially would like to thank Victoria Serpico and Paula Kimble for theirhelp in arranging the facilities for performing the ultrasonic testing on thetissue specimens during surgery. The project described was supported byAward Number R21CA131798 from the National Cancer Institute. Thecontent is solely the responsibility of the authors and does not necessarilyrepresent the official views of the National Cancer Institute or the NationalInstitutes of Health.
Author details1Department of Physics, Utah Valley University, Orem, UT 84058, USA.2Department of Pathology, University of Utah, Salt Lake City, UT 84112, USA.3Department of Surgery, University of Utah, Salt Lake City, UT 84132, USA.4Department of Mathematics and Statistics, Utah State University, Logan, UT84322, USA. 5Department of Physics, Utah State University, Logan, UT 84322,USA. 6Department of Biomedical Engineering, Wayne State University,Detroit, MI 48202, USA.
Authors’ contributionsTED participated in the study design, methods development, dataacquisition, data analysis, interpretation of results, and drafting of the
manuscript. REF participated in the data acquisition, interpretation of results,and data analysis. CLE participated in the data acquisition. KMS participatedin the data analysis, interpretation of results, and preparation of themanuscript. BJA designed the test fixture for the data acquisition and wrotethe data acquisition software. JBG, VPH, SCJ, and HP participated in the dataanalysis. LAN participated in the study design, data acquisition, andpreparation of the manuscript. All authors read and approved the finalmanuscript.
Authors’ informationTED is Assistant Professor of Physics at Utah Valley University and ResearchAssociate Professor of Physics at Utah State University. His research includesdeveloping computational and experimental methods in ultrasonics,biomechanics, and optics for the study, detection, and treatment of cancer.REF is Assistant Professor of Pathology at the University of Utah andHuntsman Cancer Institute. She practices general surgical pathology andcytology with an interest in breast pathology and cytopathology.CLE is a medical student at the University of Utah School of Medicine. Shehas worked in genetic research involving hereditary breast cancer, and herinterests include surgery and genetics.KMS is a mathematics student at Utah State University performing researchin acoustics, signal analysis, and medical ultrasound.BJA is a graduate of Utah State University in Physics and is currently workingas a research and development engineer. His interests are in streamliningdevelopment processes for new products.JBG is a graduate of Utah State University in Physics. His interests are inmedical physics.VPH is a Ph.D. candidate in Physics at Utah State University performingresearch in the development of tomographic and computational methodsfor upper atmospheric studies and medical physics.SCJ is a Physics student at Utah State University performing research inbiophysics, nanophysics, and nanomedicine.HP is a postdoctoral fellow in Biomedical Engineering at Wayne StateUniversity. His research interests are in tissue engineering.LAN is Professor of Surgery at the University of Utah School of Medicine,and is a member of the multidisciplinary team treating breast cancer at theHuntsman Cancer Institute. She holds a Jon and Karen HuntsmanPresidential Professorship in Cancer Research, has more than 15 years ofexperience with skin-sparing mastectomy, and has six years of experiencewith sentinel lymph node biopsy.
Competing interestsTED and LAN have applied for a patent relating to the content of thismanuscript, but have not received reimbursements, fees, funding, or salaryfrom an organization that holds or has applied for patents relating to thecontent of this manuscript. REF, CLE, KMS, BJA, JBG, VPH, SCJ, and HPdeclare that they have no competing interests.
Received: 21 June 2011 Accepted: 12 October 2011Published: 12 October 2011
References1. Anscher MS, Jones P, Prosnitz LR, Blackstock W, Hebert M, Reddick R,
Tucker A, Dodge R, Leight G Jr, Iglehart JD, Rosenman J: Local failure andmargin status in early-stage breast carcinoma treated with conservationsurgery and radiation therapy. Annals of Surgery 1993, 218:22-28.
2. Roukos DH, Kappas AM, Agnantis NJ: Perspectives and risks of breast-conservation therapy for breast cancer. Ann Surg Oncol 2003, 10:718-721.
3. Moore MM, Borossa G, Imbrie JZ, Fechner RE, Harvey JA, Slingluff CL Jr,Adams RB, Hanks JB: Association of infiltrating lobular carcinoma withpositive surgical margins after breast-conservation therapy. Annals ofSurgery 2000, 231:877-882.
4. Moore MM, Whitney LA, Cerilli L, Imbrie JZ, Bunch M, Simpson VB, Hanks JB:Intraoperative ultrasound is associated with clear lumpectomy marginsfor palpable infiltrating ductal breast cancer. Annals of Surgery 2001,233:761-768.
5. Cabioglu N, Hunt KK, Sahin AA, Kuerer HM, Babiera GV, Singletary SE,Whitman GJ, Ross MI, Ames FC, Feig BW, Buchholz TA, Meric-Bernstam F:Role for intraoperative margin assessment in patients undergoingbreast-conserving surgery. Ann Surg Oncol 2007, 14:1458-1471.
Doyle et al. BMC Cancer 2011, 11:444http://www.biomedcentral.com/1471-2407/11/444
Page 13 of 15
6. Dick AW, Sorbero MS, Ahrendt GM, Hayman JA, Gold HT, Schiffhauer L,Stark A, Griggs JJ: Comparative effectiveness of ductal carcinoma in situmanagement and the roles of margins and surgeons. J Natl Cancer Inst2011, 103:92-104.
7. Shimauchi A, Yamada T, Sato A, Takase K, Usami S, Ishida T, Moriya T,Takahashi S: Comparison of MDCT and MRI for evaluating the intraductalcomponent of breast cancer. Amer J Roentgenology 2006, 187:322-329.
8. Olsha O, Shemesh S, Carmon M, Sibirsky O, Dalo RA, Rivkin L, Ashkenazi I:Resection margins in ultrasound-guided breast-conserving surgery. AnnSurg Oncol 2011, 18:447-452.
9. Fitzgerald AJ, Wallace VP, Jimenez-Linan M, Bobrow L, Pye RJ,Purushotham AD, Arnone DD: Terahertz pulsed imaging of human breasttumors. Radiology 2006, 239:533-540.
10. Haka AS, Volynskaya Z, Gardecki JA, Nazemi J, Lyons J, Hicks D,Fitzmaurice M, Dasari RR, Crowe JP, Feld MS: In vivo margin assessmentduring partial mastectomy breast surgery using Raman spectroscopy.Cancer Res 2006, 66:3317-3322.
11. Nguyen F, Zysk AM, Chaney EJ, Kotynek JG, Oliphant UJ, Bellafiore FJ,Rowland KM, Johnson PA, Boppart SA: Intraoperative evaluation of breasttumor margins with optical coherence tomography. Cancer Res 2009,69:8790-8796.
12. Kennedy S, Geradts J, Bydlon T, Brown JQ, Gallagher J, Junker M, Barry W,Ramanujam N, Wilke L: Optical breast cancer margin assessment: anobservational study of the effects of tissue heterogeneity on opticalcontrast. Breast Cancer Research 2010, 12:R91.
13. Lizzi FL, Greenebaum M, Feleppa EJ, Elbaum M, Coleman DJ: Theoreticalframework for spectrum analysis in ultrasonic tissue characterization. JAcoust Soc Am 1983, 73:1366-1373.
14. Lizzi FL, Astor M, Feleppa EJ, Shao M, Kalisz A: Statistical framework forultrasonic spectral parameter imaging. Ultrasound Med Biol 1997,23:1371-1382.
15. Insana MF: Modeling acoustic backscatter from kidney microstructureusing an anisotropic correlation function. J Acoust Soc Am 1995,97:649-655.
16. Rose JH, Kaufmann MR, Wickline SA, Hall CS, Miller JG: A proposedmicroscopic elastic wave theory for ultrasonic backscatter frommyocardial tissue. J Acoust Soc Am 1995, 97:656-668.
17. Hunt JW, Worthington AE, Xuan A, Kolios MC, Czarnota GJ, Sherar MD: Amodel based upon pseudo regular spacing of cells combined with therandomization of the nuclei can explain the significant changes in high-frequency ultrasound signals during apoptosis. Ultrasound Med Biol 2002,28:217-226.
18. Oelze ML, Zachary JF, O’Brien WD Jr: Characterization of tissuemicrostructure using ultrasonic backscatter: Theory and technique foroptimization using a Gaussian form factor. J Acoust Soc Am 2002,112:1202-1211.
19. Oelze ML, O’Brien WD Jr, Zachary JF: Quantitative ultrasound assessmentof breast cancer using a multiparameter approach. In 2007 IEEEUltrasonics Symposium: 28-31 October 2007; New York. Edited by: Yuhas MP.Piscataway: IEEE; 2007:981-984.
20. Bige Y, Hanfeng Z, Rong W: Analysis of microstructural alterations ofnormal and pathological breast tissue in vivo using the AR cepstrum.Ultrasonics 2006, 44:211-215.
21. Oelze ML, O’Brien WD Jr: Application of three scattering models tocharacterization of solid tumors in mice. Ultrason Imaging 2006, 28:83-96.
22. Oelze ML, Zachary JF: Examination of cancer in mouse models usinghigh-frequency quantitative ultrasound. Ultrasound Med Biol 2006,32:1639-1648.
23. Savéry D, Cloutier G: High-frequency ultrasound backscattering by blood:Analytical and semianalytical models of the erythrocyte cross section. JAcoust Soc Am 2007, 121:3963-3971.
24. Mamou J, Oelze ML, O’Brien WD Jr, Zachary JF: Extended three-dimensional impedance map methods for identifying ultrasonicscattering sites. J Acoust Soc Am 2008, 123:1195-1208.
25. Huang SW, Li PC: Ultrasonic computed tomography reconstruction of theattenuation coefficient using a linear array. IEEE Trans Ultrason FerroelectrFreq Control 2005, 52:2011-2022.
26. Li C, Duric N, Huang L: Breast imaging using transmission ultrasound:reconstructing tissue parameters of sound speed and attenuation. In2008 International Conference on BioMedical Engineering and Informatics: 27-
30 May 2008; Sanya, China. Edited by: Peng Y, Zhang Y. Piscataway: IEEE;2008:708-712.
27. Jeong JW, Shin DC, Do SH, Blanco C, Klipfel NE, Holmes DR, Hovanessian-Larsen LJ, Marmarelis VZ: Differentiation of cancerous lesions in excisedhuman breast specimens using multiband attenuation profiles fromultrasonic transmission tomography. J Ultrasound Med 2008, 27:435-451.
28. Baddour RE, Sherar MD, Hunt JW, Czarnota GJ, Kolios MC: High-frequencyultrasound scattering from microspheres and single cells. J Acoust SocAm 2005, 117:934-943.
29. Taggart LR, Baddour RE, Giles A, Czarnota GJ, Kolios MC: Ultrasoniccharacterization of whole cells and isolated nuclei. Ultrasound Med Biol2007, 33:389-401.
30. Brand S, Solanki B, Foster DB, Czarnota GJ, Kolios MC: Monitoring of celldeath in epithelial cells using high frequency ultrasound spectroscopy.Ultrasound Med Biol 2009, 35:482-493.
31. Czarnota GJ, Kolios MC, Abraham J, Portnoy M, Ottensmeyer FP, Hunt JW,Sherar MD: Ultrasound imaging of apoptosis: high-resolution non-invasive monitoring of programmed cell death in vitro, in situ, and invivo. Br J Cancer 1999, 81:520-527.
32. Banihashemi R, Vlad R, Debeljevic B, Giles A, Kolios MC, Czarnota GJ:Ultrasound imaging of apoptosis in tumor response: Novel preclinicalmonitoring of photodynamic therapy effects. Cancer Res 2008,68:8590-8596.
33. Vlad RM, Kolios MC, Moseley JL, Czarnota GJ, Brock KK: Evaluating theextent of cell death in 3D high frequency ultrasound by registrationwith whole-mount tumor histopathology. Med Phys 2010, 37:4288-4297.
34. Doyle TE, Patel H, Goodrich JB, Kwon S, Ambrose BJ, Pearson LH: Ultrasonicdifferentiation of normal versus malignant breast epithelial cells inmonolayer cultures. J Acoust Soc Am 2010, 128:EL229-EL235.
35. Bruno I, Kumon RE, Heartwell B, Maeva E, Maev RGr: Ex vivo breast tissueimaging and characterization using acoustic microscopy. In AcousticalImaging. Volume 28. Edited by: André MP. Dordrecht: Springer;2007:279-287.
36. Doyle TE, Warnick KH, Carruth BL: Histology-based simulations for theultrasonic detection of microscopic cancer in vivo. J Acoust Soc Am 2007,122:EL210-EL216.
37. Doyle TE, Tew AT, Warnick KH, Carruth BL: Simulation of elastic wavescattering in cells and tissues at the microscopic cancer level. J AcoustSoc Am 2009, 125:1751-1767.
38. Daoud MI, Lacefield JC: Stochastic modeling of normal and tumor tissuemicrostructure for high-frequency ultrasound imaging simulations. IEEETrans Biomed Eng 2009, 56:2806-2815.
39. Wear KA, Wagner RF, Insana MF, Hall TJ: Application of autoregressivespectral analysis to cepstral estimation of mean scatterer spacing. IEEETrans Ultrason Ferroelectr Freq Control 1993, 40:50-58.
40. Wear KA: Autocorrelation and cepstral methods for measurement oftibial cortical thickness. IEEE Trans Ultrason Ferroelectr Freq Control 2003,50:655-660.
41. Mamou J, Feleppa EJ: Singular spectrum analysis applied to ultrasonicdetection and imaging of brachytherapy seeds. J Acoust Soc Am 2007,121:1790-1801.
42. Lanfranchi ME: Breast Ultrasound. 2 edition. New York: Marban Books; 2000.43. Sakr RA, Poulet B, Kaufman GJ, Nos C, Clough KB: Clear margins for
invasive lobular carcinoma: a surgical challenge. Eur J Surg Oncol 2011,37:350-356.
44. Henni AH, Schmitt C, Cloutier G: Three-dimensional transient andharmonic shear-wave scattering by a soft cylinder for dynamic vascularelastography. J Acoust Soc Am 2008, 124:2394-2405.
45. Klimberg VS, Westbrook KC, Korourian S: Use of touch preps for diagnosisand evaluations of surgical margins in breast cancer. Ann Surg Oncol1998, 5:220-226.
46. Valdes EK, Boolbol SK, Cohen JM, Feldman SM: Intra-operative touchpreparation cytology; does it have a role in re-excision lumpectomy?Ann Surg Oncol 2007, 14:1045-1050.
47. Cendán JCD, Coco D, Copeland EM: Accuracy of intraoperative frozen-section analysis of breast cancer lumpectomy-bed margins. J Am CollSurg 2005, 201:194-198.
48. Olson TP, Harter J, Munoz A, Mahvi DM, Breslin T: Frozen section analysisfor intraoperative margin assessment during breast-conserving surgeryresults in low rates of re-excision and local recurrence. Ann Surg Oncol2007, 14:2953-2960.
Doyle et al. BMC Cancer 2011, 11:444http://www.biomedcentral.com/1471-2407/11/444
Page 14 of 15
49. Pappo I, Spector R, Schindel A, Morgenstern S, Sandbank J, Leider LT,Schneebaum S, Lelcuk S, Karni T: Diagnostic performance of a noveldevice for real-time margin assessment in lumpectomy specimens. JSurg Res 2010, 160:277-281.
50. Haka AS, Volynskaya Z, Gardecki JA, Nazemi J, Shenk R, Wang N, Dasari RR,Fitzmaurice M, Feld MS: Diagnosing breast cancer using Ramanspectroscopy: prospective analysis. J Biomed Opt 2009, 14:054023.
51. Keller MD, Majumder SK, Kelley MC, Meszoely IM, Boulos FI, Olivares GM,Mahadevan-Jansen A: Autofluorescence and diffuse reflectancespectroscopy and spectral imaging for breast surgical margin analysis.Lasers Surg Med 2010, 42:15-23.
Pre-publication historyThe pre-publication history for this paper can be accessed here:http://www.biomedcentral.com/1471-2407/11/444/prepub
doi:10.1186/1471-2407-11-444Cite this article as: Doyle et al.: High-frequency ultrasound forintraoperative margin assessments in breast conservation surgery: afeasibility study. BMC Cancer 2011 11:444.
Submit your next manuscript to BioMed Centraland take full advantage of:
• Convenient online submission
• Thorough peer review
• No space constraints or color figure charges
• Immediate publication on acceptance
• Inclusion in PubMed, CAS, Scopus and Google Scholar
• Research which is freely available for redistribution
Submit your manuscript at www.biomedcentral.com/submit
Doyle et al. BMC Cancer 2011, 11:444http://www.biomedcentral.com/1471-2407/11/444
Page 15 of 15


![Orem[1] by Orem](https://img.dokumen.tips/doc/110x75/577d35321a28ab3a6b8fcae7/orem1-by-orem.jpg)


