Embed Size (px)
Citation preview

Hindawi Publishing CorporationJournal of Applied MathematicsVolume 2013 Article ID 197313 13 pageshttpdxdoiorg1011552013197313
Research ArticleLink-Based Signalized Arterial Progression Optimization withPractical Travel Speed
Wu Xianyu1 Hu Peifeng2 and Yuan Zhenzhou1
1 MOE Key Laboratory for Urban Transportation Complex Systems Theory and TechnologyBeijing Jiaotong University Beijing 100044 China
2 Center for Advanced Transportation Education and Research (CATER) UNR MS 258 Reno NV 89557 USA
Correspondence should be addressed to Wu Xianyu wuxybjtueducn
Received 17 June 2013 Revised 6 September 2013 Accepted 6 September 2013
Academic Editor Mohamed Fathy El-Amin
Copyright copy 2013 Wu Xianyu et al This is an open access article distributed under the Creative Commons Attribution Licensewhich permits unrestricted use distribution and reproduction in any medium provided the original work is properly cited
Bandwidth is defined as the maximum amount of green time for a designated movement as it passes through an arterial In mostprevious studies bandwidth has been referred to arterial bandwidth In practice a balance between link bandwidth and arterialbandwidth has proven to be important in optimizing coordinated signal timing plans because not all drivers need to pass through allthe intersections on an arterial This study proposes an algorithm on how to obtain an optimal coordinated signal timing plan withboth optimal link bandwidth and optimal arterial bandwidth considering practical vehiclesrsquo speed The weighted link bandwidthattainability is introduced as an additional measure of effectiveness for assessing the optimization results The link bandwidthoptimization is built based on the improvement of Messerrsquos algorithm about bandwidth optimization The arterial bandwidthoptimization algorithm takes into consideration the weighted link bandwidth attainability while selecting phase sequences Theproposed algorithm is demonstrated in a case study and many improvements are archived when a balanced consideration is givento both link bandwidth and arterial bandwidth Fine-tuning of initial signal timing plan is done using practical travel speed Theevaluation results show a rather significant improvement which is achieved
1 Introduction
The objective of a signalized arterial progression is to providecontinuous movement of vehicles andor minimize the delayalong an arterial Bandwidth is defined as the maximumamount of green time for a designated movement as it passesthrough an arterial It is an outcome of the signal timingplan that is determined by the offsets between intersectionsand the allotted green time for the coordinated phase ateach intersection Bandwidth (measured in seconds) can bedefined in terms of two consecutive intersections (referred toas link bandwidth) or in terms of an entire arterial (referredto as arterial bandwidth) Bandwidth and with its associatedmeasures of efficiency and attainability are measures that areoften used to assess the effectiveness of a coordinated signaltiming plan [1]
A larger progression bandwidth implies that more trafficon an arterial can progress through the signals withoutstops [2 3] Furthermore bandwidth-based signal timing
is preferred because it better meets driversrsquo expectations Asignal timing solution without a good progression band nomatter how well it may claim to minimize system delays andstops may not be acceptable to traffic engineers and travelers[4] A study conducted by Yang indicated that bandwidth-based solutions generally outperform delay-based solutionsbased on several field studies [5]
From the late 1960s to the early 1980s many researchersincluding Little Messer and Brooks made a significantprogress and developed a series of bandwidth optimizationalgorithms [6] Messer et al developed a variable-sequenceprogram to form the core of the PASSER software Theymodified traditional green bandwidth method and addedvariable phase sequence operation in the software [7 8]Little et al developed the MAXBAND using a more compli-cated mixed integer linear programming model [9] BesidesMAXBAND and PASSER there are several other modelsthat have been introduced Gartner et al developed MULTI-BAND to improve the originalMAXBAND [10] In 1996 they
2 Journal of Applied Mathematics
published MULTIBAND-96 to further improve the modeland applied to realistic networks [11] Efforts to improvebandwidth-based optimization models and their computingalgorithms continued up to the late 1990s [12ndash15] Feng [16]developed the projection algorithm (PA) to optimize signaloffsets and cycle length while considering start-up delayresidual queues and unbalanced traffic volumes
In these studies mentioned above bandwidth is alwaysdefined in terms of an entire arterial Arterial bandwidth iscommonly used to describe capacity or maximized vehiclethroughput While arterial bandwidth is a good indicatorfor progression opportunities it may not fully capture theoverall arterial operation For example on an arterial with10 signalized intersections an arterial bandwidth solutionallows vehicles to travel through the entire system In real-ity one must consider how many vehicles actually travelthrough all the intersections In some cases link bandwidthis more important than arterial bandwidth because of highvolumes (especially in the case of high left-turn volumes)between some links Therefore both link and arterial band-width should be considered in optimizing coordinated signaltiming plans In 2002 Gartner and Stamatiadis providedmathematical programming models for the developmentof optimal arterial-based progression schemes consideringan individually weighted band that can be adapted to theprevailing traffic flows on that link [17] Their models beganto pay more attention to link bandwidth however they didnot consider the impact of speed variation and could notobtain the signal timing plan with both optimal arterialbandwidth and optimal link bandwidth Although softwaretools such as SYNCHRO and TRANSY7F can depict botharterial bands and link bands their optimization objectiveis network delay instead of bandwidth A signal timing planwith both optimized link bandwidth and arterial bandwidthis normally difficult to be obtained [18] To overcome thelimitations of previous studies this study focuses on analgorithm that can obtain a best signal timing plan with bothoptimal link bandwidth and optimal arterial bandwidth
In an ideal coordinated system with optimal bandwidthplatoons with desired travel speed from an upstream inter-section at the start of green should arrive at downstreamintersection near start of the green indication In realityvehiclersquos speed might be lower or higher than the desiredspeed Speed limit is generally used when the actual speeddata are not available Recently transportation professionalshave new technologies and instruments to collect traffic dataThe use of Global Positioning Systems (GPS) has become aspringboard for many transportation related projects GPStools can capture store and transfer real-time traffic dataon the field Vehicle counts speed time and delay are thekey components of information to develop proper signalcoordination timing plan The expanding Geographic Infor-mation System (GIS) and GPS technologies have made iteasy to collect spatial data (latitude longitude) with attributesof time and velocity [19ndash22] Considering the impact ofpractical travel speed Feng [16] has developed a corridorsignal optimizationmethod called projection algorithm (PA)It does not introduce the fine-tuning of initial signal timingplan with practical travel speed
This study proposes an arterial progression optimizationapproach using link-based bandwidth optimization algo-rithm and a GPS tool on an arterial The rest of paper isorganized as follows Section 2 introduces some notationsof the bandwidth optimization methodology and provides alink bandwidth optimization algorithm with eight situationsto calculate upperlower interferences and six cases to cal-culate relative offset between two consecutive intersectionsSection 3 presents the new link-based arterial bandwidthoptimization algorithm Section 4 presents a case study todemonstrate the proposed algorithmand compare the perfor-mance index of signal timing plans on different speeds espe-cially the practical vehiclesrsquo speed with simulation modelsFinally Section 5 provides the summary and conclusions
2 Link Bandwidth Optimization
21 Notations 119873 number of intersections on an arterial 119862signal cycle length 119894 intersection 119871
119894119894+1 the link between 119894
and 119894 + 1 119866IBT119894 inbound through movement green time of 119894119866IBL119894 inbound left-turn movement green time of 119894 119866OBT119894outbound through movement green time of 119894 119866OBL119894 out-bound left-turnmovement green time of 119894120573
119894 phase sequence
of 119894 for left-turn in the arterial direction whose value canbe 1 2 3 and 4 in which (1) ldquoLeadLeadrdquo meaning IBL isleading phase and OBL is leading phase (2) ldquoLeadLagrdquo (3)ldquoLagLeadrdquo (4) ldquoLagLagrdquo119874
119894 offset of 119894 start of green time of
outbound through movement119874119894119894+1
relative offset between 119894and 119894 + 1 RO
119894120573119894 relative offset of 119866IBT119894 with respect to 119866OBT119894
at 119894with sequence 120573119894 Figure 1 shows the calculation of RO
119894120573119894
119879119894119894+1
travel time from 119894 to 119894 + 1 119879119894+1119894
travel time from119894 + 1 to 119894 LI
120573119894 120573119894+1 lower interference between 119894 and 119894 + 1
UI120573119894 120573119894+1
upper interference between 119894 and 119894 +1 VI120573119894 120573119894+1
validinterference between 119894 and 119894 + 1 119874119904
119894119894+1mdashslack time between
119866OBT119894 and 119866OBT119894+1 and 119874119904119894119894+1 = 119866OBT119894 minus 119866OBT119894+1 119868119904119894119894+1slack time between 119866IBT119894 and 119866IBT119894+1 and 119868119904119894119894+1 = 119866IBT119894 minus119866IBT119894+1 119861
119894 link bandwidth of 119871119894119894+1
119861119894119874 outbound link
bandwidth of 119871119894119894+1
119861119894119868 inbound link bandwidth of 119871
119894119894+1
119881OBT119894 traffic volume of outbound through movement at 119894119881IBT119894 traffic volume of inbound through movement at 119894
22 Calculation of UpperLower Interference The bandwidthoptimization algorithmdeveloped by Brooks and Little estab-lishes the primary principles of bandwidth optimizationThealgorithm was originally developed for two-phase signalsMesser et al [7] enhanced the original algorithm to handlemultiphase signals with left-turn phases which formed thecore of PASSER II [8] One major limitation of the algorithmis to get the optimal progression bandwidth for an arterialwith high number of signalized intersections (eg gt10)Messerrsquos paper did not include how to calculate relative offsetsand did not consider the relative locations of intersectionsThis section provides detailed descriptions on all possiblesituations to calculate upperlower interferences andoffset fortwo consecutive intersections
Figure 2 illustrates the basic concepts of bandwidth opti-mization algorithm for three signals with left-turn phasesThe maximum progression bandwidth is the sum of out-bound bandwidth and inbound bandwidth The value of
Journal of Applied Mathematics 3
Startpoint of
OBT
Startpoint of
IBT
IBLOBTOBL IBT120573i = 3
120573i = 2
120573i = 4
120573i = 1
120573 =
120573 = 1
120573 = 2
120573 = 3
120573 = 4
ROi
=
= 0
= GOBL i
= GOBL i
minus GIBL i
GIBL i
GOBL i minus GIBL i minusGIBL i GOBL i 0
ROi120573119894= GOBL i
ROi120573119894= GOBL i
Figure 1 Relative offset of 119866IBT119894 with respect to 119866OBT119894
Upper interferenceInbound bandwidth
Serial numberof
intersections OffsetTime point of
time-space diagram IBL OBL
bandwidth
GIBTmin
LImax
UImax
GOBTmin
Bmax = BO + Bi = GOBTmin + GIBTmin min(UImax + LImax )minus
min(UImax + LImax )minus
lower interference outbound
Figure 2 Illustration of bandwidth optimization algorithm
outbound bandwidth is a constant which equals the min-imum outbound through green time 119866OBTmin And theinbound bandwidth is determined by minimum total validinterference from other intersections In Figure 2 the secondintersection is the master intersection which has minimuminbound through green time 119866IBTmin A valid upper inter-ference is by the first intersection UImax and a valid lowerinterference is by the third intersection LImax Therefore theinbound bandwidth is 119866IBTmin minusmin(UImax + LImax)
The bandwidth optimization principle reveals that thelocation of 119894 with respect to 119894 + 1 plays an important role incalculating upper and lower interferences for two consecutiveintersections On the other hand according to comparisonof inbound and outbound through movement green timethere are four situations that ensure correct upper and lowerinterference calculations
After calculating upperlower interferences there are fouradditional cases to adjust these upperlower interferences and
obtain the valid interferences as shown in Table 1 Figure 3graphically illustrates the calculation of upper interferencefor the situation 4 In this situation the intersection 119894 has theminimum inbound through movement green time meaningthat the master intersection is on the left side of intersection119894 + 1
In Figure 3 phase sequence of the first intersection no119894 is ldquoIBLLagOBLLeadrdquo 120573
119894= 3 and phase sequence of the
second intersection no 119894 + 1 is ldquoIBLLeadOBLLagrdquo 120573119894+1=
2 To calculate upperlower interference between these twointersections there are other 15 conditions with differentcombinations of phase sequences as shown in Table 2
23 Valid UpperLower Interference and Link BandwidthAll upperlower interferences to be valid must be less thanthe minimum inbound through movement green time andgreater than the slack time between 119866IBT119894 and 119866IBT119894+1 as
4 Journal of Applied Mathematics
Time
Outbound
End of GOBTi+1
Start of GOBTi+1
Start of GIBTi+1
Start of GIBTi
Start of GIBTi+1
End of the inboundband
Start of GOBTiEnd of GIBTi+1
ii + 1
IBLlag
OBLlead
OBLlag
IBLlead
Tii+1
(GIBTi+1 minus (minusROi+1120573119894+1
minusROi+1120573119894+1
+ GOBTi+1 minus GOBTi
GOBTi+1 minus GOBTi
minus Tii+1 + ROi120573119894
ROi120573119894
+ GIBTi minus Ti+1i
Ti+1i
)modC) modC
GIBTi+1
GIBTi+1
minus (minusROi+1120573119894+1+ GOBTi+1 minus GOBTi minus Tii+1 + ROi120573119894
)
GIBTi+1 minus (minusROi+1120573119894+1+ GOBTi+1 minus GOBTi
+1 + ROi120573119894+ GIBTi)mod C
=
UI120573i120573119894+1
minusROi+1120573119894+1+ GOBTi+1 minus GOBTi minus Tii+1
0
UI120573119894 120573119894+1=
minusTii
Figure 3 The calculation of upper interference for situation 4
Table 1 Calculation of upperlower interference for link bandwidth
Common situation Upper interference Lower interference119866OBT119894 le 119866OBT119894+1
119866IBT119894+1 gt 119866IBT119894
UI120573119894 120573119894+1= 119866119868119861119879119894minus (minusRO
119894120573119894+ 119879119894119894+1
+RO119894+1120573119894+1+ 119866IBT119894+1 + 119879119894+1119894) mod 119862
LI120573119894 120573119894+1= (minusRO
119894120573119894+ 119879119894119894+1minus 119874119904119894+1119894
+RO119894+1120573119894+1+ 119879119894+1119894) mod 119862
119866OBT119894 gt 119866OBT119894+1
119866IBT119894+1 gt 119866IBT119894+1
UI120573119894 120573119894+1= (119866IBT119894 minus (minusRO119894120573119894 + 119866OBT119894 minus 119866OBT119894+1 + 119879119894119894+1
+RO119894+1120573119894+1+ 119866IBT119894+1 + 119879119894+1119894) mod 119862) mod 119862
LI120573119894 120573119894+1= (minusRO
119894120573119894+ 119879119894119894+1minus 119874119904119894+1119894
+RO119894+1120573119894+1+ 119879119894+1119894) mod 119862
119866OBT119894+1 le 119866OBT119894
119866IBT119894+1 le 119866IBT119894
UI120573119894 120573119894+1= (119866IBT119894+1 minus (minusRO119894+1120573119894+1 minus 119879119894119894+1
+RO119894120573119894+ 119866IBT119894 minus 119879119894119894+1) mod 119862) mod 119862
LI120573119894 120573119894+1= (minusRO
119894+1120573119894+1minus 119879119894119894+1
minus119874119904119894119894+1+ RO
119894120573119894minus 119879119894+1119894) mod 119862
119866OBT119894+1 gt 119866OBT119894
119866OBT119894+1 le 119866OBT119894
UI120573119894 120573119894+1= (119866IBT119894+1 minus (minus119877119874119894+1120573119894+1 + 119866OBT119894+1 minus 119866119874119861119879119894
minus119879119894119894+1+ RO
119894120573119894+ 119866IBT119894 minus 119879119894+1119894) mod 119862) mod 119862
LI120573119894 120573119894+1= (minusRO
119894+1120573119894+1minus 119879119894119894+1
minus119874119904119894119894+1+ RO
119894120573119894minus 119879119894+1119894) mod 119862
Special situation Upperlower interfence Interference adjustment119868119904119894119894+1lt 0 119862 + 119868119904
119894119894+1le LI120573119894 120573119894+1le 119862 LI
120573119894 120573119894+1= LI120573119894 120573119894+1minus 119862
LI120573119894 120573119894+1lt 0 119862 + LI
120573119894 120573119894+1le minGIBTi 119866IBT119894+1 LI
120573119894 120573119894+1= LI120573119894 120573119894+1+ 119862
119868119904119894119894+1lt 0 119862 + 119868119904
119894119894+1le UI120573119894 120573119894+1le 119862 UI
120573119894 120573119894+1= UI120573119894 120573119894+1minus 119862
UI120573119894 120573119894+1lt 0 119862 + UI
120573119894 120573119894+1le min119866IBT119894 119866IBT119894+1 UI
120573119894 120573119894+1= UI120573119894 120573119894+1+ 119862
shown in
119868119904119894le LI120573119894 120573119894+1le min 119866IBT119894 119866IBT119894+1
119868119904119894le UI120573119894 120573119894+1le min 119866IBT119894 119866IBT119894+1
(1)
Additionally because the master intersection has the min-imum green time only one interference (cannot be both)could occur for one combination phase sequence at two inter-sections as shown in
VI120573119894 120573119894+1= UI
120573119894120573119894+1 LI120573119894 120573119894+1 (2)
Journal of Applied Mathematics 5
Table 2 Phase sequence combinations of two consecutive intersections
Phase sequence combination No 119894 intersection No 119894 + 1 intersectionIBL OBL 120573 IBL OBL 120573
1
Lead Lead 120573119894= 1
Lead Lead 120573119894+1= 1
2 Lead Lag 120573119894+1= 2
3 Lag Lead 120573119894+1= 3
4 Lag Lag 120573119894+1= 4
5
Lead Lag 120573119894= 2
Lead Lead 120573119894+1= 1
6 Lead Lag 120573119894+1= 2
7 Lag Lead 120573119894+1= 3
8 Lag Lag 120573119894+1= 4
9
Lag Lead 120573119894= 3
Lead Lead 120573119894+1= 1
10 (Figure 2) Lead Lag 120573119894+1= 2
11 Lag Lead 120573119894+1= 3
12 Lag Lag 120573119894+1= 4
13
Lag Lag 120573119894= 4
Lead Lead 120573119894+1= 1
14 Lead Lag 120573119894+1= 2
15 Lag Lead 120573119894+1= 3
16 Lag Lag 120573119894+1= 4
Then a link bandwidth can be gained using
119861119894= 119861119894
119874+ 119861119894
119868
= min 119866OBT119894 119866OBT119894+1 +min 119866IBT119894 119866IBT119894+1 minus VI120573119894120573119894+1 (3)
24 Calculation of Relative Offset Assume that the referenc-ing phase is the start of green time of outbound throughmovement there are six cases to calculate the relative offsetof two consecutive intersections
Case 1 Consider 119866OBT119894 le 119866OBT119894+1 119866IBT119894+1 gt 119866IBT119894 andVI120573119894120573119894+1= UI120573119894 120573119894+1
as shown in Figure 4(a)Then
119874119894= 0 119874
119894+1= 119879119894119894+1
mod 119862 (4)
Case 2 Consider 119866OBT119894 gt 119866OBT119894+1 and 119866IBT119894+1 gt 119866IBT119894Then
119874119894= 0 119874
119894+1= (119879119894119894+1+ 119866OBT119894 minus 119866OBT119894+1) mod 119862 (5)
Case 3 Consider 119866OBT119894 le 119866OBT119894+1 119866IBT119894+1 gt 119866IBT119894 andVI120573119894120573119894+1= LI120573119894 120573119894+1
as shown in Figure 4(b)Then
119874119894= 0
119874119894+1= (119879119894119894+1+ 119866OBT119894 minus 119866OBT119894+1 + 119870 lowast 119862) mod 119862
(6)
where 119870 is an integer If 119879119894119894+1+ 119866OBT119894 minus 119866OBT119894+1 lt 0 then
119870 = 1 or else119870 = 0
Case 4 Consider 119866OBT119894+1 le 119866OBT119894 119866IBT119894+1 le 119866IBT119894 andVI120573119894120573119894+1= UI120573119894 120573119894+1
Then
119874119894= 119870 lowast 119862 minus 119879
119894119894+1 119874
119894+1= 0 (7)
Case 5 Consider 119866OBT119894+1 gt 119866OBT119894 and 119866IBT119894+1 le 119866IBT119894Then
119874119894= 119870 lowast 119862 minus 119879
119894119894+1+ 119866OBT119894+1 minus 119866OBT119894 119874119894+1 = 0 (8)
Case 6 Consider 119866OBT119894+1 le 119866OBT119894 119866IBT119894+1 le 119866IBT119894 andVI120573119894 120573119894+1= LI120573119894 120573119894+1
Then
119874119894= 119870 lowast 119862 minus 119879
119894119894+1+ 119866OBT119894+1 minus 119866OBT119894 119874119894+1 = 0 (9)
25 Example of Link BandwidthOptimization Algorithm Thesignal timing plans of two intersections are shown belowThe distance between them is 2015 ft and the speed limit is40mph then travel time is 34 s and cycle length is 130 s
119866IBT119894 = 51 119866OBT119894 = 49
119866IBL119894 = 20 119866OBL119894 = 18
119866IBT119894+1 = 45 119866OBT119894+1 = 36
119866IBL119894+1 = 29 119866OBL119894+1 = 20
(10)
Then 119866OBT119894+1 le 119866OBT119894 and 119866IBT119894+1 le 119866IBT119894 are fit forcommon situation 3 in Table 1 Table 3 shows the resultsof upperlower interference calculation including 16 phasesequence combinations
According to the rule of valid interference in Section 23and calculation of offset in Section 24 we can get the validinterference link bandwidth and offset relative to phasesequences as shown in Table 3 (bold text) including 10 phasesequence combinations (not all 16 combinations have validinterference)
6 Journal of Applied Mathematics
Table 3 Upperlower interferences of two consecutive intersections
Phase sequenceIntersection 119894 + 1 1 1 1 1 2 2 2 2Intersection 119894 1 2 3 4 1 2 3 4
Interference of intersection119894 + 1 from intersection 119894
Upper interference 55 Common45minus(minus(20minus29)minus34+(minus20)+51minus34) = 73
35 53 35 53 15 33
Lower interference minus74
Commonminus(minus9) minus 34 minus (49 minus 36) + (minus20) minus 34 = minus92
Special minus92 + 130 = 38 lt 45valid interference
minus54 minus72 minus54 minus72 minus34 minus52
Link bandwidth mdash 45 + 36 minus 38 = 43 45+36minus35 = 46 mdash 46 mdash 66 48Offset of intersection 119894 mdash 130 minus 34 + 36 minus 49 = 83 130 minus 34 = 96 mdash 96 mdash 96 96Phase sequence
Intersection 119894 + 1 3 3 3 3 4 4 4 4Intersection 119894 1 2 3 4 1 2 3 4
InterferenceUpper interference 84 102 64 82 64 82 44 62Lower interference 27 9 minus83 29 minus83 29 minus63 minus81
Link bandwidth 54 72 mdash 52 mdash 52 37 mdashOffset of intersection 119894 83 83 mdash 83 mdash 83 96 mdash
Time
Outbound
Oii+1
Ii+1
Tii+1
Oii+1 = Tii+1
Ii
modC
UI120573119894 120573119894+1
(a) Case 1 upper interference
iIOutbound
Oii+1
Ii+1
Tii+1
Oii+1 = (Tii+1 + GOBTi minus GOBTi+1 +
GOBTi+1 minus GOBTi
LI120573119894 120573119894+1
KlowastC)mod C
(b) Case 3 lower interference
Figure 4 The calculation of relative offset
3 Link-Based Arterial BandwidthOptimization Algorithm
31 Measures of Effectiveness (MOE) Bandwidth efficiencyand attainability are two measures to describe the quality ofa coordinated signal timing plan Both are computed froma time-space diagram that represents the signal timing plan
The two parameters are first defined by Messer et al [7 8] asshown in
119864119861=(119861out + 119861in)
2119862times 100
119860119888=119861out + 119861in
119866OBTmin + 119866IBTmintimes 100
(11)
Journal of Applied Mathematics 7
Sum ofthem is 72
(a) Maximum link bandwidth
Sum ofthem is 66
(b) Possible link and arterial bandwidth
Figure 5 Example of maximum and possible link bandwidth and arterial bandwidth
where 119864119861arterial bandwidth efficiency 119861out arterial band-
width of outbound 119861in arterial bandwidth of inbound and119860119888the attainability for a given cycle lengthBesides the arterial bandwidth efficiency and attainability
maximum link bandwidth possible link bandwidth andlink bandwidth attainability are first proposed as additionalmeasures of effectiveness in our research Maximum linkbandwidth is the maximum value of a link bandwidthobtained using link bandwidth optimization algorithm Pos-sible link bandwidth is the value of a link bandwidthwhen thesignal system has the optimal arterial progression bandwidthIn this case the link bandwidth may not be the best solutionto get the arterial bandwidth In Figure 5 the maximum linkbandwidth between the first and the second intersections is 72seconds while the possible link bandwidth is only 66 secondsto obtain the optimal arterial bandwidth (offset and phasesequence have been changed)119861119894
max is maximum link bandwidth of 119871119894 119861119894possible link
bandwidth of 119871119894 and 120572
119894link bandwidth attainability defined
as ratio of 119861119894over 119861119894max shown in
120572119894=119861119894
119861119894max (12)
32 Calculation of Link Bandwidth After the outbound di-rection is determined link bandwidth119861119894 with phase sequence120573119894 120573119894+1
and offset 119874119894119894+1
can be calculated The optimizedresults of 119871
119894119894+1are shown in Table 4 and are sorted in a
descending order by 119861119894 Both 120573119894and 120573
119894+1can be 1 2 3 and
4 therefore the total number of possible solutions is 16 It isnoted that not all 16 solutions yield a valid upper or lowerinterference Only 9 valid solutions are included in Table 4using two intersecions on Kietzke Lane Reno NV USA
Similarly the link bandwidth 119861119894+1 with phase sequence1205731015840
119894+1(intermediate variable to differentiate it from 120573
119894+1) 120573119894+2
and offset 119874119894+1119894+2
can be calculated The optimized results of119871119894+1119894+2
are shown in Table 5 and sorted in a descending orderby 119861119894+1
Using the same approach the link bandwidth 119861119894+2 withphase sequence 1205731015840
119894+2 120573119894+3
and offset119874119894+2119894+3
can be calculatedThe optimized results of 119871
119894+2119894+3are shown in Table 6 and
sorted in a descending order by 119861119894+2
33 Selection of Phase Sequence Using the conditions 120573119894+1=
1205731015840
119894+1and 120573
119894+2= 1205731015840
119894+2 one can get many solutions of phase
sequences for the intersections on this arterial Importanceof each link bandwidth may be different from one another onan arterialThere aremany factors that impact the value of theimportance such as traffic volumes (throughmovement left-turn) road configuration and passing pedestrians If trafficvolume of through movement from 119894 and 119894 + 1 is more thanothers then link bandwidth of 119871
119894119894+1is more important than
others 120596119894is defined as a weighted factor that reflects the
importance of link bandwidth attainability 119864119898is defined as
the efficiency for solution 119898 of a coordinated signal timingplan
119864119898=
119873
sum
119894
120596119894120572119894
120596119894=(119881OBT119894 + 119881IBT119894+1)
sum119894(119881OBT119894 + 119881IBT119894+1)
(13)
The best solution is the one that has the maximum efficiency119864119898 In this example
1205961=(119881OBT119894 + 119881IBT119894+1)
sum119894(119881OBT119894 + 119881IBT119894+1)
=(820 + 492)
(820 + 492) + (903 + 625) + (971 + 6483)
= 03055
1205962= 03559 120596
3= 03386
(14)
Table 7 shows five solutions of different phase sequencesbased on the data in Tables 4 5 and 6 The weighted factorof each link is calculated using through traffic volumes Ascan be seen solution 2 is the best solution which has anefficiency of 09755The number of solutions is dependent onthe optimized result Table 7 just shows five of the solutions
34 Calculation of Offset The inbound through movementgreen time determines which intersection is the referenceintersection for one link and how the relative offset ofeach intersection is calculated According to the value ofinbound through movement green time there are four casesto calculate the offsets of 119894 119894 + 1 and 119894 + 2
Case 1 Consider 119866IBT119894+1 gt 119866IBT119894 and 119866IBT119894+2 gt 119866IBT119894+1then119874119894= 0 119874
119894+1= 119874119894119894+1 119874
119894+2= 119874119894119894+1+ 119874119894+1119894+2 (15)
8 Journal of Applied Mathematics
Table 4 Optimized results for 119871119894119894+1
on Kietzke Lane (119866IBT119894+1 lt 119866IBT119894 2nd Steet and Mill Street)
Timing parameter Valid solutions1 2 3 4 5 6 7 8 9
120573119894
2 3 1 4 2 4 3 1 2120573119894+1
3 2 3 3 4 2 1 2 1119861119894 72 66 54 52 52 48 46 46 43120572119894
10 092 075 072 072 067 064 064 060119874119894119894+1
83 96 83 83 83 96 96 96 83
Table 5 Optimized results for 119871119894+1119894+2
on Kietzke Lane (119866IBT119894+2 gt 119866IBT119894+1 Mill Street and Vassar Street)
Timing parameter Valid solutions1 2 3 4 5 6 7 8 9 10 11 12 13 14 15
1205731015840
119894+11 1 1 2 2 2 4 4 4 2 3 1 4 3 3
120573119894+2
1 3 4 1 2 4 3 1 4 3 3 2 2 1 4119861119894+1 81 81 81 81 81 81 81 73 72 71 70 64 55 53 52120572119894+1
10 10 10 10 10 10 10 090 089 088 086 079 068 065 064119874119894+1119894+2
56 56 56 37 56 37 56 56 56 37 56 56 56 56 56
Table 6 Optimized results for 119871119894+2119894+3
on Kietzke Lane (119866IBT119894+3 lt 119866IBT119894+2 Vassar Street and Plumb Lane)
Timing parameter Valid solutions1 2 3 4 5 6 7 8 9 10 11 12
1205731015840
119894+22 4 1 2 2 3 4 1 4 1 2 3
120573119894+3
3 3 3 1 4 3 1 1 4 4 2 2119861119894+2 98 83 82 80 78 65 63 62 61 60 58 54120572119894+2
10 085 084 082 080 063 064 063 062 061 059 055119874119894+2119894+3
81 81 81 81 81 81 81 81 81 81 81 86
Case 2 Consider 119866IBT119894+1 gt 119866IBT119894 and 119866IBT119894+2 le 119866IBT119894+1then
119874119894= 0 119874
119894+1= 119874119894119894+1
119874119894+2= 119874119894119894+1minus 119874119894+1119894+2+ 119870 lowast 119862
(16)
where 119870 is an integer If 119874119894119894+1minus 119874119894+1119894+2lt 0 then 119870 = 1 or
else 119870 = 0
Case 3 Consider 119866IBT119894+1 le 119866IBT119894 and 119866IBT119894+2 gt 119866IBT119894+1then
119874119894= 119874119894119894+1 119874
119894+1= 0 119874
119894+2= 119874119894+1119894+2 (17)
Case 4 Consider 119866IBT119894+1 le 119866IBT119894 and 119866IBT119894+2 le 119866IBT119894+1then
119874119894= 119874119894119894+1 119874
119894+1= 0 119874
119894+2= 119862 minus 119874
119894+1119894+2 (18)
In Table 7 solution 2 is the best solution of phase sequenceson this arterial Using the algorithm of calculating the aboveoffset one can get the offset for each intersection
(1) Consider 119866IBT119894+1 lt 119866IBT119894 119866IBT119894+2 gt 119866IBT119894+1 then
119874119894= 119874119894119894+1= 96 119874
119894+1= 0 119874
119894+2= 119874119894+1119894+2= 56 (19)
(2) Consider 119866IBT119894+3 lt 119866IBT119894+2 then
119874119894+2= 119874119894+1119894+2= 56
119874119894+3= 119870 lowast 119862 + (119874
119894+1119894+2minus 119874119894+2119894+3) = 130 + (56 minus 81) = 105
(20)
4 Case Study
41 Site Description A Windows program bandwidth opti-mization and time space diagram (BOTSD) was developedbased on the proposed algorithm Time-space diagrams canbe produced by BOTSD with additional information to showthe start and end of each phase This information is usefulfor field implementation of signal timing plans providingeasiness of verifying that the current plan is running
Kietzke Lane an arterial in Reno NV USA is selectedas a case study to check the performance of the proposedbandwidth optimization algorithm There are eight intersec-tions (E 2nd Street no 1 Mill Street no 2 Vassar Streetno 3 Plumb Lane no 4 Grove Street no 5 Gentry Wayno 6 Moana Lane no 7 and Peckham Lane no 8) on theKietzke Lane selected in this study The coordinated cyclelength of this arterial is 130 seconds (1600 pmndash1800 pm) andspeed limit is 40mph Table 8 shows lengths of phase splitin the initial signal timing plan of Kietzke Lane This plan issuitable for real traffic volumes of each isolated intersection
Journal of Applied Mathematics 9
Table 7 Selected solutions of different phase sequences on Kietzke Lane (2nd Street rarr Plumb Lane)
119898 1 2 3 4 5119868119894
120573119894
120572119894
120573119894
120572119894
120573119894
120572119894
120573119894
120572119894
120573119894
120572119894
1 2 1 3 092 3 092 3 092 1 0752 3 086 2 1 2 1 2 1 3 0863 3 063 2 1 4 085 1 084 3 0634 3 mdash 3 mdash 3 mdash 3 mdash 3 mdash119864119898
mdash 08249 mdash 09755 mdash 09247 mdash 09214 mdash 07485
Table 8 Phase splits in the initial signal timing plan of Kietzke Lane (2nd Street rarr Peckham Lane)
INTID SBL NBT WBL EBT NBL SBT EBL WBT Distance (ft)1 18 51 20 41 20 49 30 312 20 45 25 40 29 36 25 40 20153 18 54 23 35 17 55 18 40 32944 22 48 18 42 20 50 22 38 26005 16 79 mdash 35 16 79 mdash 35 18416 15 80 mdash 35 18 77 mdash mdash 21807 22 40 20 48 18 44 19 49 7248 36 41 21 32 16 61 19 34 2168
Table 9 Traffic volumes of every intersection in the Kietzke Lane from field data
INTID NBL NBT NBR SBL SBT SBR EBL EBT EBR WBL WBT WBR1 226 820 169 56 430 54 248 585 143 160 418 632 220 903 259 120 492 121 166 684 134 318 742 1463 96 971 120 109 625 146 149 238 100 200 408 2564 253 780 313 299 483 143 230 870 244 282 757 1685 89 1193 72 6 800 148 113 71 70 128 98 306 119 1143 51 30 883 79 170 56 170 61 66 467 166 897 168 296 738 140 250 631 111 257 681 1768 71 845 249 305 633 168 81 419 19 mdash 514 300Total 1240 7552 1401 1221 5084 999 1407 3554 991 1406 3684 1185
shown in Table 9 not fit for the whole arterial Left-turntraffic volumes were much lower than through movementtraffic volumes so the optimal arterial progression bandwidthcan enable more drivers pass through the arterial systemswithout stops In this case study based on this timing plan weoptimized phase sequences and offsets to obtain best solutionof signal timing planwith optimal link bandwidth and arterialbandwidth
42 Optimized Results Using Messerrsquos Algorithm Figure 6shows time-space diagram of Kietzke Lane drawn by BOTSDusing Messerrsquos algorithm when southbound is the outbounddirection The outbound arterial bandwidth is 36 secondsand 14 seconds for the inbound If northbound is selectedas the outbound direction then the second intersection isthe master intersection which has the minimum throughmovement green timeTheoutbound arterial bandwidth is 40seconds and 13 seconds for the inbound If a vehicle arrives
at intersection no 1 at the beginning of outbound throughmovement it will stop and wait at intersection no 1 andthe offset of intersection no 1 can be adjusted as shown inFigure 6
43 Optimized Results Using the Proposed Algorithm South-bound is the outbound direction Figure 7 shows time-spacediagram for this arterial drawn by BOTSDusing the new pro-posed method in southbound The arterial outbound band-width is 30 seconds and 28 seconds for the inbound Arterialbandwidth efficiency is 2231 and bandwidth attainabilityis 7532 which means a fair progression according to theguidelines of bandwidth efficiency [1]
Using the same method of fine-tuning we have gottime-space diagrams with other travel speeds which areless than the speed limit and same for every link In thiscase study the speed limit is 40mph we can use 38mph35mph and 32mph to design the signal timing plans with
10 Journal of Applied Mathematics
Stop and wait
Stop and wait
Arrival
Arrival
Can adjust offset this way
Figure 6 TSD of signal timing plan with Messerrsquos algorithm
Figure 7 TSD of signal timing plan with proposed algorithm
the proposed bandwidth optimization algorithm and get theTSD with maximum progression of arterial bandwidth andlink bandwidth for comparison
44 Fine-Tuning of Signal Timing Plan withPractical Travel Speed
441 Travel Time Data Collection with GPS Tool We havecollected more than ten study runs of GPS data at the PMpeak hours using GPS receiver and GPS2LT [23] Then theactual travel time and speed can be obtained by the PC travelfor Windows [24] Based on the results of the actual traveltime and speed for links shown in Figure 8 the actual travelspeeds for most links are less than speed limit Additionallyall the standard deviations of travel speed for ten runs are lessthan 3mph
442 Analysis of Initial Signal Timing Using the GPS andTS tool and the collected GPS data we have drawn the GPS
trajectory on the TSD for three types of study runs for PMpeak hours (1600 pmndash1800 pm) In Figure 9 the arterialroad progression bandwidth of southbound is 12 secondsand 29 seconds in northbound The car can go through allthe 8 intersections on the TSD with the speed of 40mph inthe southbound for just two of ten runs However on thenorthbound the car must stop at least one time no matterwhen it entered the system
443 Signal Timing with Practical Speed According to theresults of fine-tuning of initial signal timing plan link by linkwe have got the best solution of TSD for the arterial Thearterial progression bandwidth of southbound is 28 secondsand 39 seconds in northbound The bandwidth efficiency is258 Attainability of every link is more than 85 and threeof them are equal to 100 as shown in Figure 10
45 Comparison of Results
451MOEResults Table 10 shows the link bandwidth attain-ability and arterial bandwidth efficiency of eight intersectionson Kietzke Lane with Messerrsquos algorithm and the proposedalgorithm
According to arterial bandwidth efficiency and attain-ability in Figures 9 and 10 and link bandwidth attainabilityin Table 10 the solution of coordinated signal timing planfrom the proposed algorithm is much better than thatfrom Messerrsquos algorithm whether the outbound direction issouthbound or northbound If a vehicle arrives at intersectionno 1 at the beginning of outbound throughmovement it willstop andwait at intersection no 1 the offset of intersection no1 can be adjusted as shown in Figure 9 However the time-space diagrams in Figure 10 have improved these problems
In the other way simulation results from SYNCHROshow that the proposed algorithm is better than Messerrsquosalgorithm Total intersection control delay of 8 intersectionswith optimized signal timing planwith proposed algorithm is2662 s less than that of Messerrsquos algorithm 288 s Total Linkdelay in arterial direction with proposed algorithm is 4013 sless than that of Messerrsquos algorithm 4452 s
Additionally when the number of signals in a systemincreases it becomes more difficult to obtain a good band-width solution using Messerrsquos algorithm In some cases thereis no valid solution with arterial bandwidth However thenew proposed algorithm can be used to obtain an optimalsolution of coordinated signal timing plan with both optimallink bandwidth and optimal arterial bandwidth
452 Simulation Results Comparison of Speed Limit and Prac-tical Speed The simulation model of this arterial is built upin VISSIM 530 Individual parameters in VISSIM 530 wereadjusted and tuned with model calibration and validationTo reduce stochastic variation ten random-seeded runs wereconducted in VISSIM 530 for the case study At the sametime the signal timing plan has been input into SYNCHRO70 to get the control delay for the intersections and linkson the arterial and check the traffic flow lines on the TSDAverage speed and delay per vehicle for the whole network
Journal of Applied Mathematics 11
05
1015202530354045
0 1 2 3 4 5 6 7 8Link
Spee
d (m
ph)
Run1Run2Run3Run4Run5Run6
Run7Run8Run9Run10Mean
(a) Southbound
05
1015202530354045
0 1 2 3 4 5 6 7 8Link
Spee
d (m
ph)
Run1Run2Run3Run4Run5Run6
Run7Run8Run9Run10Mean
(b) Northbound
Figure 8 Average practical travel speeds for links
Actual speed isless than speed
limit
Release earlierIn a long queue
Start of green Middle of green End of green
Figure 9 GPS trajectory on initial TSD on the speed of 40mph
average delay and queue length for the nodes and averagedelay for the links are the main simulation results shown inTable 11
The results show that a rather significant improvementis achieved after the fine-tuning of signal timing plan withpractical travel speed data is done
5 Conclusion
Bandwidth can be defined in terms of two consecutive inter-sections (link bandwidth) or in terms of an entire arterial(arterial bandwidth) In most previous studies bandwidth isalways referred to as arterial bandwidth In practice a balance
12 Journal of Applied Mathematics
Table 10 Attainability of link bandwidth on Kietzke Lane with two algorithms
Link 1 2 3 4 5 6 7Arterial MOEMax link bandwidth (s) 72 81 98 98 134 84 84
Weighted factor of link 01155 01345 01280 01391 01827 01656 01347Link bandwidth attainability
Algorithm Outbound 1205721
1205722
1205723
1205724
1205725
1205726
1205727
119864119898
119864119887
119860119888
Proposed SB 089 100 100 100 100 100 099 09855 02231 07532NB 089 100 100 100 100 100 099 09856
Messer SB 081 094 096 094 084 099 077 08903 01923 06494NB 089 099 085 097 083 099 073 08915 02038 06883
Table 11 Performance index of signal timing plans with different speeds
Type Index 32 Practical speed 35 38 40 (speed limit)
Network performance Average speed (mph) 1801 1912 1795 179 1769Average delay (s) 5725 532 5791 5829 6183
NodesTotal average delay (s) 2107 1906 2091 2132 2214Total average queue (ft) 5198 5051 5276 5328 5482
Total intersection control delay 2572 2358 2606 2672 2662Links Delay from VISSIM 3787 3506 3703 3821 3927
Delay from SYNCHRO 3783 3643 3826 3976 4013
Figure 10 TSD of signal timing plan with practical travel speed
between link bandwidth and arterial bandwidth has proven tobe important in optimizing coordinated signal timing plansbecause not all drivers need to pass through all the intersec-tions on an arterialThis paper proposes an algorithm on howto obtain an optimal coordinated signal timing planwith bothoptimized link and arterial bandwidth The proposed algo-rithmhas two parts link bandwidth optimization and arterialbandwidth optimization Link bandwidth attainability isdefined as an additionalmeasure of effectiveness for assessing
the optimized results In the link bandwidth optimizationthere are eight cases to calculate upperlower interferenceand six cases to calculate offset between two consecutiveintersections based on the improvement ofMesserrsquos researchThe arterial bandwidth optimization has 3-fold processessuch as calculation of link bandwidth selection of phasesequence and calculation of offset generally link by linkWeighted means of link bandwidth attainability is definedas another measure of effectiveness for selecting the bestsolution of different phase sequences The results in thecase study show that the proposed algorithm can be usedto get a much better signal timing plan than that fromMesserrsquos algorithm Additionally when the number of signalsin a system increases it becomes more difficult to obtaina good bandwidth solution with Messerrsquos algorithm Thereis no valid solution of arterial bandwidth using Messerrsquosalgorithm when the number of signals is very high How-ever the proposed algorithm of this paper can be used toobtain an optimal coordinated signal timing plan with bothoptimal link bandwidth and arterial bandwidth Fine-tuningof initial signal timing plan is done to improve link andarterial progression bandwidth using practical travel speedcompared to speed limit The evaluation results show thata rather significant improvement is achieved In future wewill continue our research on optimizing coordinated signaltiming plans under the consideration of the traffic volumes ofleft-turns and earlier release of left-turn phase
Conflict of Interests
There is no known conflict of interests associated with thispaper and there has been no significant financial support for
Journal of Applied Mathematics 13
this work that could have influenced its outcomeThe authorsdo not have any possible conflict of interests
Acknowledgments
This study is supported by Project ldquoThe Fundamental Re-search Funds for the Central Universities (no 2013JBM049)rdquoand ldquoNational Basic Research Program of China (no2012CB725403)rdquo
References
[1] Federal Highway Administration and USDOT Traffic SignalTiming Manual United States Department of TransportationWashington DC USA 2008
[2] J Bonneson S Sunkari and M Pratt Traffic Signal OperationsHandbooks Texas Transportation Institute Texas DOT TexasTex USA 2009
[3] Minnesota DOTMnDOT Traffic Signal Timing and Coordina-tion Manual Minnesota Department of Transportation SaintPaul Minn USA 2009
[4] Z Tian and T Urbanik ldquoSystem partition technique to improvesignal coordination and traffic progressionrdquo Journal of Trans-portation Engineering vol 133 no 2 pp 119ndash128 2007
[5] X K Yang ldquoComparison among computer packages in provid-ing timing plans for Iowa arterial in Lawrence Kansasrdquo Journalof Transportation Engineering vol 127 no 4 pp 311ndash318 2001
[6] K G Baass ldquoAnother look at bandwidth maximizationrdquo Trans-portation Research Record no 905 pp 38ndash47 1983
[7] C J Messer R H Whitson C Dudek and E J RomanoldquoA variable -sequence multiphase progression optimizationprogramrdquo Highway Research Record no 445 pp 24ndash33 1973
[8] C J Messer H E Haenel and E A Koeppe ldquoA report onthe userrsquos manual for progression analysis and signal systemevaluation routine-PASSER IIrdquo Research Report 165-14 TexasTransportation Institute College Station Tex USA 1974
[9] J D C Little M D Kelson and N H Gartner ldquoMAXBAND aprogram for setting signals on arteries and triangular networksrdquoTransportation Research Record no 795 pp 40ndash46 1981
[10] NHGartner S F Assmann F Lasaga andD LHou ldquoMULTI-BAND a variable-bandwidth arterial progression schemerdquoTransportation Research Record vol 1287 pp 212ndash222 1990
[11] C Stamatiadis and N H Gartner ldquoMULTIBAND-96 a pro-gram for variable-bandwidth progression optimization of mul-tiarterial traffic networksrdquo Transportation Research Record no1554 pp 9ndash17 1996
[12] N Papola ldquoBandwidth maximization split and unsplit solu-tionsrdquoTransportationResearch Part B vol 26 no 5 pp 341ndash3561992
[13] N Papola and G Fusco ldquoMaximal bandwidth problems a newalgorithm based on the properties of periodicity of the systemrdquoTransportation Research B vol 32 no 4 pp 277ndash288 1998
[14] H K Sripathi N H Gartner and C Stamatiadis ldquoUniform andvariable bandwidth arterial progression schemesrdquo Transporta-tion Research Record no 1494 pp 135ndash145 1995
[15] R S Pillai A K Rathi and S L Cohen ldquoA restricted branch-and-bound approach for generating maximum bandwidth sig-nal timing plans for traffic networksrdquo Transportation ResearchB vol 32B no 8 pp 517ndash529 1998
[16] C Feng Projection algorithm for improved corridor signalcoordination [MS thesis] Master of Science in EngineeringUniversity of Akron Civil Engineering Akron Ohio USA2009
[17] N H Gartner and C Stamatiadis ldquoArterial-based control oftraffic flow in urban grid networksrdquo Mathematical and Com-puter Modelling vol 35 no 5-6 pp 657ndash671 2002
[18] D Husch and J Albeck Synchro 6 Traffic Signal Software UserGuide Trafficware Albany Calif USA 2003
[19] S Rhyne ldquoUtilizing GPS and GIS in traffic signal coordinationrdquoin Proceedings of the Annual Meeting and Exhibit Compendiumof Technical Papers (ITE rsquo05) vol 8 2005
[20] C A Quiroga and D Bullock ldquoTravel time studies with globalpositioning and geographic information systems an integratedmethodologyrdquo Transportation Research C vol 6C no 1-2 pp101ndash127 1998
[21] H Rakha F Dion andH Sin ldquoUsing global positioning systemdata for field evaluation of energy and emission impact of trafficflow improvement projects issues and proposed solutionsrdquoTransportation Research Record no 1768 pp 210ndash223 2001
[22] Z A Sabra Global Positioning System for Time-Based SignalCoordination Benefit-Cost Analysis Baltimore Regional TrafficSignal Forum Baltimore Md USA 2nd edition 2005
[23] JAMER Technologies GPS Travel Time Reference Manual-Travel Time and Delay Data Collection Software JAMER Tech-nologies Hatfield Pa USA 2004
[24] JAMER Technologies PC-Travel for Windows Reference Man-ual-Travel Time and Delay Analysis Software JAMERTechnolo-gies Hatfield Pa USA 2004
Submit your manuscripts athttpwwwhindawicom
Hindawi Publishing Corporationhttpwwwhindawicom Volume 2014
MathematicsJournal of
Hindawi Publishing Corporationhttpwwwhindawicom Volume 2014
Mathematical Problems in Engineering
Hindawi Publishing Corporationhttpwwwhindawicom
Differential EquationsInternational Journal of
Volume 2014
Applied MathematicsJournal of
Hindawi Publishing Corporationhttpwwwhindawicom Volume 2014
Probability and StatisticsHindawi Publishing Corporationhttpwwwhindawicom Volume 2014
Journal of
Hindawi Publishing Corporationhttpwwwhindawicom Volume 2014
Mathematical PhysicsAdvances in
Complex AnalysisJournal of
Hindawi Publishing Corporationhttpwwwhindawicom Volume 2014
OptimizationJournal of
Hindawi Publishing Corporationhttpwwwhindawicom Volume 2014
CombinatoricsHindawi Publishing Corporationhttpwwwhindawicom Volume 2014
International Journal of
Hindawi Publishing Corporationhttpwwwhindawicom Volume 2014
Operations ResearchAdvances in
Journal of
Hindawi Publishing Corporationhttpwwwhindawicom Volume 2014
Function Spaces
Abstract and Applied AnalysisHindawi Publishing Corporationhttpwwwhindawicom Volume 2014
International Journal of Mathematics and Mathematical Sciences
Hindawi Publishing Corporationhttpwwwhindawicom Volume 2014
The Scientific World JournalHindawi Publishing Corporation httpwwwhindawicom Volume 2014
Hindawi Publishing Corporationhttpwwwhindawicom Volume 2014
Algebra
Discrete Dynamics in Nature and Society
Hindawi Publishing Corporationhttpwwwhindawicom Volume 2014
Hindawi Publishing Corporationhttpwwwhindawicom Volume 2014
Decision SciencesAdvances in
Discrete MathematicsJournal of
Hindawi Publishing Corporationhttpwwwhindawicom
Volume 2014 Hindawi Publishing Corporationhttpwwwhindawicom Volume 2014
Stochastic AnalysisInternational Journal of
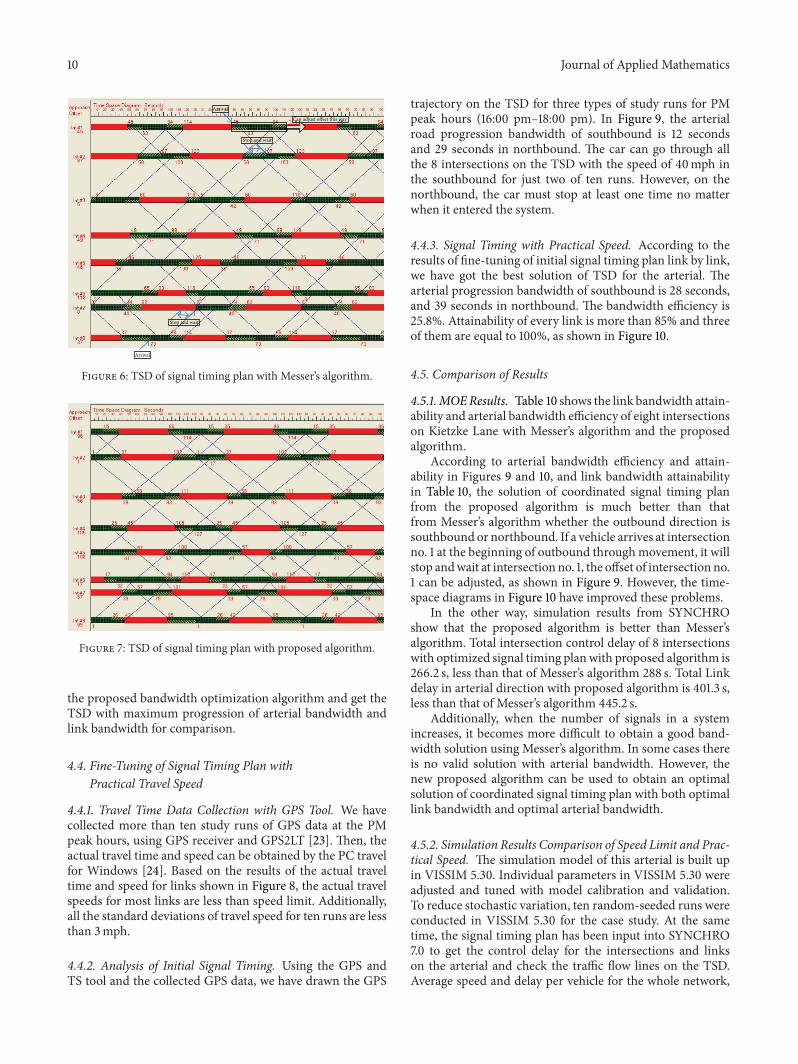
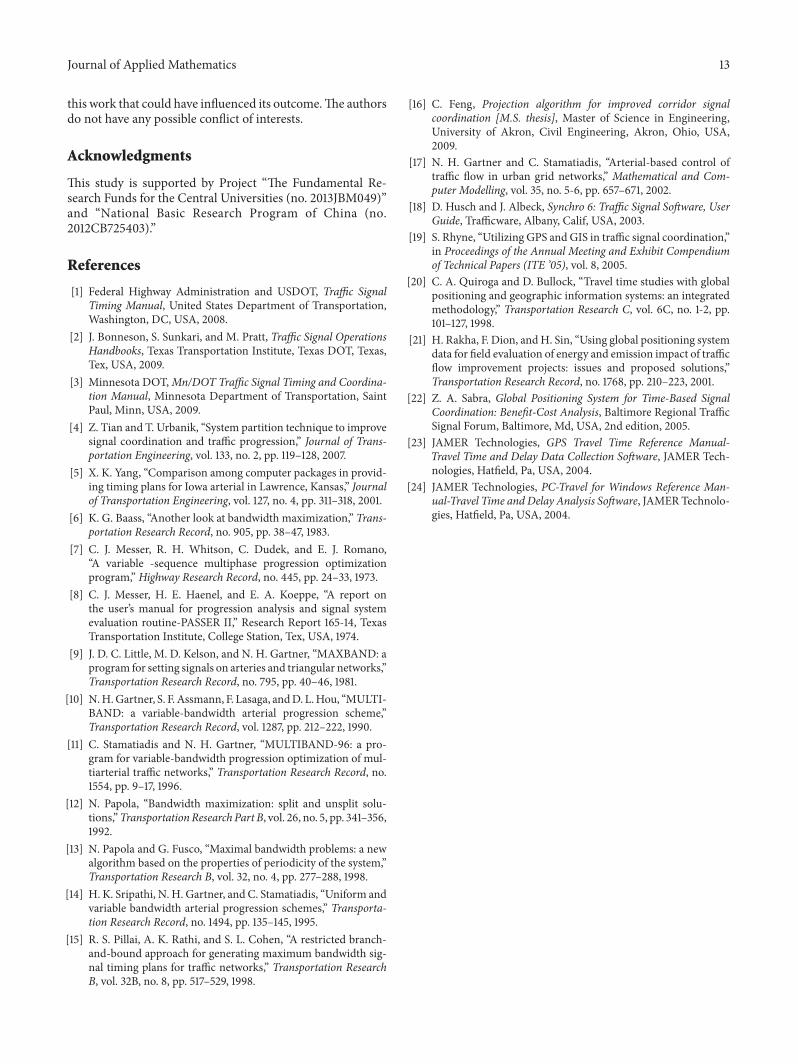