Embed Size (px)
Citation preview

Research ArticleLead Immobilization and Hydroxamate Ligand PromotedChloropyromorphite Dissolution
Nadia K. Adam1,2,3
1 Department of Environmental Engineering and Geological Sciences, Fitzpatrick, University of Notre Dame,South Bend, IN 27695-7619, USA
2Department of Geology & Geophysics, University of Wyoming, Laramie, WY 82071, USA3 Biomineral Systems LLC, South Bend, IN 27695, USA
Correspondence should be addressed to Nadia K. Adam; [email protected]
Received 2 February 2014; Revised 29 May 2014; Accepted 29 May 2014; Published 20 July 2014
Academic Editor: Andrew Hursthouse
Copyright © 2014 Nadia K. Adam. This is an open access article distributed under the Creative Commons Attribution License,which permits unrestricted use, distribution, and reproduction in any medium, provided the original work is properly cited.
The immobilization of lead, a major environmental contaminant, through phosphate amendments to form the sparingly solublelead phosphate mineral chloropyromorphite [Pb
5(PO4)3] (CPY) is an effective in situ strategy for soil remediation. An important
question is the effect of microbial processes on this remediation. Here, we investigate the role of the microbial siderophore liganddesferrioxamine-D
1(DFO-D
1) and its analog acetohydroxamic acid (aHA) in CPY lability using pH-dependent batch dissolution
kinetics and model calculations. Both (0.01)M aHA and (0.00024)M DFO-D1are similarly effective and enhance lead release
from CPY by more than two orders of magnitude at pH > 6 compared to in the absence of ligands. This is consistent with modelcalculations of pH-dependent (aqueous) complexation of lead with hydroxamate ligands. More importantly, pH-dependent ligandsorption is predictive of its ligand promoted dissolution behavior. Our results suggest that organic ligands can significantly increaseCPY lability at alkaline pHs in soils and sediments and that addition of P amendments to immobilize Pb as CPY may only besuccessful at acid pHs.
1. Introduction
Lead is a major environmental contaminant in soils, sedi-ments, and surface waters [1] and concentrations greater than10 𝜇g/dL are toxic to children. Exposure to lead contaminatedsoils is one of the main pathways of lead toxicity [2]. Leadimmobilization through phosphate amendments to formthe sparingly soluble lead phosphate mineral, chloropyro-morphite [Pb
5(PO4)3] (CPY), can be an effective in situ
strategy to remediate lead in soils [3]. The effectiveness ofthis strategy depends on the long-term stability of CPY,which may be affected by pH and the presence of organicligands. Microbial organic ligands such as trihydroxamatesiderophores, secreted by bacteria and fungi, are commonlypresent in soil environments [4, 5]. Siderophores can chelateFe(III) with high binding affinities and also trace metalssuch as Pb(II) [6].Therefore, hydroxamate siderophores suchas desferrioxamine-B (DFO-B) can potentially increase thelability of CPY. For example, trihydroxamate siderophores [7]
and acetohydroxamic acid containing only one hydroxamatemoiety [8] have been shown to promote dissolution of a Fe-oxide mineral, goethite. It is therefore important to charac-terize proton-promoted and organic ligands-promoted CPYdissolution commonly present in terrestrial environments forpredicting themobility of CPYparticles in porousmedia suchas soils.
Proton-promoted CPY dissolution has been investigatedas a function of pH and aging by Scheckel and Ryan [3] andmore recently by Xie and Giammar [9]. Schekel and Ryan [3]show that CPY dissolves rapidly; however, their dissolutionresults are limited to 1 h and 24 h only. Xie and Giammar[9] show that similar to the equilibrium solubility of CPY,the rate of dissolution also decreases with increasing pH.Recent investigation of DFO-B promoted CPY dissolutionby Manecki and Maurice [10] shows that DFO-B enhancesPb(II) release between pH 6 and 11 probably due to strongcomplexation of Pb(II) with DFO-B in this pH range. In spiteof these previous investigations, the effect of ligand size and
Hindawi Publishing CorporationJournal of GeochemistryVolume 2014, Article ID 168938, 10 pageshttp://dx.doi.org/10.1155/2014/168938

2 Journal of Geochemistry
ON
O
(a)
O
O
O
O
O
NN
OH
OH
OH
NH
NH2
NH
(b)
O
N
O
O
O
O
O
NN
OH
OH
OH
NH
NH
(c)
Figure 1: Molecular structures of (a) acetohydroxamic acid, (b) desferrioxamine-B, and (c) desferrioxamine-D1.
charge on CPY dissolution is not yet properly understood. Inaddition, proton-promoted dissolution of CPY over longertime periods and batch dissolution kinetics of relevant soilligands especially DFO-D
1promoted dissolution have not
been fully characterized. Here, we investigate DFO-D1(an
acetyl derivative of DFO-B) and acetohydroxamic acid (aHA)promoted dissolution of CPY in comparison to its proton-promoted dissolution with respect to its equilibrium solubil-ity and rate of dissolution (see Figure 1 for structural infor-mation). aHA containing a single hydroxamatemoiety is rep-resentative of hydroxamate siderophores found in soils andsurface waters. Results from this study provide a comparisonof DFO-B (a charged trihydroxamate siderophore) (see [11])and DFO-D
1(an uncharged trihydroxamate siderophore)
promoted CPY dissolution and also characterize the effectof ligand size and charge including stearic factors on ligand-promoted dissolution.
It is well known that, ligands (aHA and DFOD1) are
expected to enhance Pb(II) release upon CPY dissolution.However, the effect of pH is not known a priori becauseligand promoted and proton (or hydroxyl) promoted dis-solution of CPY may operate in tandem or in parallel.Generally, ligand-promoted pathways are dominant near thePZC of the mineral [8] although the contribution fromproton/hydroxyl/reductive dissolution pathways to ligand-promoted pathway is not known. The PZC of CPY is
estimated as 6.7 based on its isoelectric point determination.We investigated ligand-promoted dissolution of CPY at low(pH 4) and high (pH 9) pH relative to its PZC in additionto near its PZC to gain insights into the contributionfrom proton- or hydroxyl-promoted pathways to the ligand-promoted pathway of CPY dissolution. Proton-promotedpathways are generally dominant at very low pH, that is,between pH 2 and 3; the reductive dissolution pathway isexpected to be dominant below pH 2 [8]; and the hydroxyl-promoted dissolution pathway is dominant at pH ≥ 9 [8].
The objectives of this study are (1) to investigate theproton-promoted batch dissolution kinetics at pH 2.5 andequilibrium dissolution in the absence of ligands betweenpHs 2 and 9 and (2) to investigate equilibrium dissolutionand batch dissolution kinetics of DFO-D
1and aHApromoted
dissolution of CPY near pHs 4, 6.5, and 9. We employone-stop batch dissolution experiments similar to Scheckeland Ryan [3] and Xie and Giammar [9] to mimic CPYdissolution in natural systems. We observed that aHA andDFO-D
1dissolve CPY rapidly with the concentration of
dissolved Pb achieving steady state within the hour. Theamount of dissolved Pb(II) from CPY dissolution in thepresence of 0.01M aHA is similar to that in the presenceof 0.00024MDFO-D
1aHA and DFO-D
1increased CPY
dissolution between pH 6 and 10 by more than two ordersof magnitude.

Journal of Geochemistry 3
Figure 2: Scanning electronmicrograph of CPY showing essentiallya monodispersion of micron size cylindrical particles with somesmaller particles.
2. Methods
2.1. Synthesis and Characterization of Chloropyromorphite.Chloropyromorphite (CPY) is synthesized by combining500mL of 0.30M PbNO
3and 0.14M K
2HPO4(in 0.05M
NaCl) solutions. Two burettes are filled with PbNO3and
K2HPO4, respectively, and allowed to empty into a 2 L
polypropylene (PP) Erlenmeyer flask containing 1 L of Milli-pore H
2O at a rate of 24 drops per minute. A similar method
is used by Manecki et al. [12] to synthesize hydroxylpyro-morphite. White particles of CPY precipitate quickly uponmixing solution. Once all the 500mL solutions of PbNO
3
and K2HPO4have been emptied in the Erlenmeyer flask, the
precipitate is aged in suspension for 24 hours. Scheckel andRyan [3] showed that CPY aged for 24 h is as stable as CPYaged for 1 year. The CPY suspension is collected in 4, 250mLPP bottles and washed 4 times with deionized (Millipore)water. After washing, the suspension is freeze-dried forstorage. The X-ray diffraction pattern of CPY is consistentwith chloropyromorphite and the EDS shows peaks for onlyPb, P, O, andCl. Figure 1 shows scanning electronmicroscope(SEM) micrograph of CPY. CPY consisted of hexagonalparticles mostly measuring ∼1 𝜇m in diameter with somesmaller particles (Figure 2). The PZC of CPY was separatelydetermined and found to be 6.7 (data not shown).
2.1.1. Solution Preparation. Analytical grade reagents andMillipore water are used in preparation of all solutions. aHAis purchased from Sigma Aldrich and was not additionallypurified. DFO-D
1is prepared using a modified procedure of
Kraemer et al. [7]. Ligand solutions are prepared fresh andstirred before each experiment.
2.2. Sorption Measurements. The aHA sorption isothermexperiments on CPY are conducted at pH 6.5 in 28mL poly-carbonate centrifuge tubes. Samples have a suspended solidsconcentration of 10.0 g kg−1, constant ionic background of0.01M NaNO
3, and total sample mass of 25 ± 0.01 g. All
aqueous solutions for sorption experiments (0.01 NaNO3,
0.01M HCl, 0.01M NaOH, and 0.01M aHA) are preparedusing analytical grade reagents and Millipore water. aHAwas added at 0.025M concentration using a micropipette.
Table 1: Selected speciation constants used in model calculations.
Reaction log𝐾(CPY) Pb5(PO4)3Cl = 5Pb2+ + 3PO4
3− + Cl− −80.85DFOB3− + H+ = H(DFOB)2− 10.87H(DFOB)2− + H+ = H2(DFOB)
− 9.57H2(DFOB)
− + H+ = H3(DFOB) 8.97H3(DFOB) + H+ = H4(DFOB)
+ 8.35Pb2+ + H(DFOB)2− = PbH(DFOB) 10.0Pb2+ + H2(DFOB)
− = PbH2(DFOB)+ 9.25
Pb2+ + H3(DFOB)− = PbH3(DFOB)
2+ 5.922Pb2+ + H(DFOB)2− = Pb2H(DFOB)2+ 16.29Pb2+ + H2O = Pb(OH)+ + H+
−7.597Pb(OH)2 + 2H+ = Pb2+ + 2H2O −17.094Pb2+ + 3H2O = Pb(OH)−3 + 3H+
−28.0912Pb2+ + H2O = Pb2(OH)+3 + H+
−6.3973Pb2+ + 4H2O = Pb
3(OH)
4
+2 + 4H+−23.88
4Pb2+ + 4H2O = Pb4(OH)
4
+4 + 4H+−20.888
2H+ + PO4−3 = H2PO4
− 19.5733H+ + PO4
−3 = H3PO4 21.721H+ + PO4
−3 = HPO4−2 12.375
H2O −H+ = OH− −13.997
Pb+2 + PO4−3 + 2H+ = PbH2PO4
+ 21.073Pb+2 + PO4
−3 + H+ = PbHPO4 15.475
Samples are equilibrated on a shaker at a moderate rate at298K temperature for 24 h. The aHA sorption on CPY ismeasured as a function of time for batch sorption kineticsusing an analogous procedure as described earlier. The pHis adjusted to 4, 5.5, 6, 7, 8, 9, and 9.5 using 0.01M HCl or0.01M NaOH. After equilibration, samples are filtered andthe concentration of aHA is measured colorimetrically (400–650 nm) as a complex in the presence of excess Fe(III) usingmodified procedures of Bergmann and Segal [13] and Gillamet al. [14].
2.3. Dissolution Measurements. The DFO-D1, aHA, or
proton-promoted batch dissolution experiments areconducted in 28mL polycarbonate centrifuge tubes at 298∘Kwith 10 g/kg solid’s concentration and 0.01M NaNO
3as
background electrolyte. aHA or DFO-D1is added to make
a final concentration of 0.01M aHA or 0.00024M DFO-D1
to CPY suspension and the pH is adjusted to 4, 6.5, or 9.0using 0.01M HNO
3or 0.01M NaOH.The final mass is made
to 25 g with the addition of 0.01M NaNO3and the samples
are equilibrated over 1–192 h by shaking at a moderate rate.After equilibration the samples are centrifuged at 10,000 rpmfor 15 minutes and filtered using 0.2𝜇m polycarbonatehydrophobic filters. The supernatants are refrigerated foranalysis of dissolved Pb. Dissolved total Pb was analyzedusing a Perkin Elmer Optima 2000 ICP-OES instrumentagainst Pb standards made from a standard solution of Pb(Spex Certi-prep 999 ug/g standards from Fisher Scientific)diluted with 0.01M NaNO
3.
2.4. Modeling Aqueous Geochemical Speciation. VisualMinteq ver. 2.6.1 software program is used for modelingdissolved Pb speciation in supernatants from CPY

4 Journal of Geochemistry
Diss
olve
d Pb
(M)
0 50 100 150 200
Time (h)
10−3
10−4
10−5
10−6
pH 2.56 ± 0.03 protonpH 4.03 ± 0.03 aHApH 6.35 ± 0.10 aHApH 8.94 ± 0.03 aHA
pH 4.06 ± 0.05 DFO-D1pH 6.58 ± 0.07 DFO-D1pH 8.79 ± 0.11 DFO-D1
(a)
(mol
Pb g
−1 CP
Y h−
1 )No ligandaHADFO-D1
2 4 6 8 10
pH
10−3
10−4
10−5
10−6
10−7
10−8
10−9
(b)
Figure 3: (a) Batch dissolution kinetics of CPY in the absence of ligands near pH 2.5; in the presence of DFO-D1and aHA near pHs 4, 6, and
9; (b) compilation of average 1 h dissolution rates of CPY in the absence and presence of ligands (aHA, DFO-D1) plotted as a function of pH.
dissolution. All species along with their respectiveconstants specified in the default thermodynamic database(thermo.vdb) of Visual Minteq are used (see Table 1). CPYspecified as chloropyromorphite (soil) with a stabilityconstant of −80.4 is used in all calculations. The componentdatabase (comp 2008.vda) is modified to include DFO-Band aHA components. All pertinent DFO-B and aHA speciesalong with their reaction constants from Hepinstall et al. [15]are added to the thermodynamic database (Table 1). Ionicstrength (at 0.01M) and pH are fixed and CPY is modeledas an infinite solid phase for all calculations. Infinite solidphases are those that do not dissolve completely duringequilibration and control the solution ion activities. Thereis no difference, however, in modeling a solid as a finiteor infinite solid phase when the solid does not dissolvecompletely as in our (CPY) case.
3. Results and Discussion
3.1. Kinetics of CPY Dissolution. Proton-promoted dissolu-tion of CPY at pH 2.5 over a period of 1–186 h is shown inFigure 3(a). CPY dissolves within the hour. The amount ofdissolved Pb remains fairly constant between 1 and 186 h at∼1.4∗10−4M. Our CPY shows less dissolution compared tothe 1-month aged CPY of Xie and Giammar [9] probably dueto lower pH (of 2) and greater concentration of smaller 10–20 nm particles in their study (Figure 3(a)).
DFO-D1or aHA promoted CPY dissolution near pHs
4.0, 6.5, and 9.0 over a period of 1–186 h is also shown
in Figure 3(a). The ligands (DFO-D1or aHA) similar to
protons also caused CPY to dissolve within the hour and theconcentration of dissolved Pb remained essentially constantover the period of 186 hours (Figure 3(a)). Minimum CPYdissolves near its PZC of 6.7 as promoted by aHA orDFO-D
1.
This is consistent with CPY dissolution near its PZC beingdominated by the ligand-promoted pathway with minimalcontribution from proton, hydroxyl, or reductive dissolutionpathways. More CPY dissolves near pH 4 compared to nearits PZC andmaximumCPY dissolves near pH 9 (Figure 3(a))probably due to contribution from the proton- and hydroxyl-promoted pathways in addition to the ligand-promotedpathway.
Figure 3(b) shows a comparison of the 1 h batch dissolu-tion rates in the absence and presence of ligands as a functionof pH. These results indicate that the rate of CPY dissolutionis pH dependent (Figure 3(b)). In the absence of ligands,the rate of batch CPY dissolution decreases with increasingpH until about pH 7 (Figure 3(b)), similar to the findingsof Scheckel and Ryan [3] and Xie and Giammar [9], withflow-through reactors. The rate of CPY dissolution increasesnear pH 10 probably due to contribution from the hydroxyl-promoted pathway (see Figure 3(b)). In the presence of aHAor DFO-D
1, the rate of CPY dissolution is greater near pH
4 or 9 than near its PZC (Figure 3(b)). Near pH 4 in thepresence of ligands, the CPY dissolution rate is similar to theproton-promoted dissolution rate. However, near its PZC andpH 9, the ligand-promoted dissolution rate is much fasterthan the hydroxyl-promoted dissolution rate (Figure 3(b)).

Journal of Geochemistry 5
Diss
olve
d Pb
(M)
10−2
10−3
10−4
10−5
10−6
10−7
10−8
Model-DFO BModel-aHAModel-control
Dissolved Pb (M)-no ligandDissolved Pb (M) 1h-aHADissolved Pb (M) 1h-DFO-D1
2 4 6 8 10 12
pH
(a)To
tal d
issol
ved
Pb+2
(M)
Model 10mM DFO B-dissolved PbModel 24𝜇M DFO B-dissolved Pb
3 4 5 6 7 8 9 10 11
pH
10−3
10−4
10−5
10−6
10−7
10−8
(b)
Figure 4: (a) A comparison of equilibrium aHA or DFO-D1promoted dissolution of CPY as a function of pH compared to equilibrium
CPY dissolution in the absence of ligands along with Visual Minteqa 2.6.1 model calculations; (b) model calculations of 0.01MDFO-B versus0.00024 M DFO-B promoted CPY dissolution.
These results suggest that pH-dependent interactions of CPYwith ligands affect the contribution of proton- and hydroxyl-promoted pathways to the ligand-promoted pathway.
3.2. Equilibrium DFO-D1, aHA, Promoted CPY Dissolution.
Figure 4(a) shows the pH-dependent trend in aHA or DFO-D1promoted equilibrium CPY dissolution compared to the
control in the absence of ligands. Our results show thatCPY dissolution as promoted by aHA or DFO-D
1increases
at pH > 6 similar to equilibrium DFO-B promoted CPYdissolution inManecki andMaurice’s study [10] (Figure 4(a)).In the absence of ligands, the concentration of dissolvedPb increases with decreasing pH between pHs 6.5 and 2.1(Figure 4(a)). These results are consistent with the results ofScheckel and Ryan [3] and also Xie and Giammar [7] whoshow less CPY dissolution with increasing pH (2–6). Thetrend in dissolved Pb due to pH-dependent CPY dissolution(in the absence of ligands) closely matches the modeledequilibrium CPY dissolution with 𝐾sp of CPY at 10−80.4 (seeFigure 4(a)).This is also consistent with the results of Xie andGiammar [7], showing 𝐾sp of 10−80.4 as a better fit to theirresults on proton-promoted CPY dissolution than the widelyreported𝐾sp of 10
−84.4.To investigate our hypothesis that aHA or DFO-D
1
promoted CPY dissolution was greater at pHs 4 and 9due to the contribution from proton- or hydroxyl-promotedpathways, we compare equilibrium dissolved Pb concentra-tion in the absence of ligands with that in the presence ofaHA or DFO-D
1both from model calculations and trends
in experimental data. We find that, at pH 4, equilibrium
dissolved Pb concentration in the absence of ligands isslightly greater than equilibrium dissolved Pb concentrationin the presence of aHA or DFO-D
1, suggesting that the
contribution from ligand-promoted pathway is minimal nearpH 4 (Figure 4(a)). Near pH 6.5 and pH 9, however, ligand-promoted CPY dissolution pathway dominates as shown bymore than 2 orders of magnitude of dissolved Pb above pH6 in the presence of aHA or DFO-D
1than in the absence of
ligands (Figure 4(a)).The pH-dependent trend in equilibrium dissolved Pb
concentration from DFO-D1promoted CPY dissolution is
similar to that observed with aHA promoted CPY dissolution(Figure 4(a)). Surprisingly, the experimental data as shownin Figure 4(a) indicates that the efficacy of 0.00024M trihy-droxamate ligand (DFO-D
1) and 0.01M monohydroxamate
ligand (aHA) in dissolving CPY is comparable at all pHswithin error. It is well known that the efficacy of the ligand-promoted dissolution pathway is directly dependent on theconcentration of the sorbed complex [16–18] assuming thatthe adsorption sites contribute similarly to dissolution andthat the structure of sorbed complex does not change withpH [8]. Given more than two orders of magnitude smallerconcentration of DFO-D
1compared to aHA and its larger
mass and size (compared to aHA) causing possible stearicimpediments affecting its capacity to sorb, we would expectmuch less dissolution in the presence of DFO-D
1than in
the presence of aHA. Since stability constants for DFO-D1
are not available, DFO-B of similar structure, mass, and sizeis used as an analogue for DFO-D
1for model calculations.
The model calculations of aHA and DFO-B promoted CPYdissolution do indeed show nearly an order of magnitude less

6 Journal of Geochemistry
total Pb released with DFO-B compared to aHA promoteddissolution, respectively (Figure 4(a)). However, the experi-mental data showed similar total dissolved Pb with DFO-D
1
or aHA promoted CPY dissolution. In addition, the modelcalculations of CPY dissolution in the presence of 0.00024MDFO-B compared to 0.01MDFO-B showed an order of mag-nitude increase in Pb released consistent with the expectationthat amount of Pb2+ released from CPY dissolution shouldincrease with increase in ligand concentration (Figure 4(b)).
This discrepancy betweenDFO-Bmodel calculations andDFO-D
1experimental data may be mainly because of two
reasons. First, DFO-D1is in fact more effective than DFO-
B in dissolving CPY and releasing Pb. Kraemer et al. [7]compare DFO-B versus DFO-D
1promoted goethite disso-
lution at the same ligand concentration of 0.00024 M andshow that DFO-D
1is an order of magnitude more effective
than DFO-B. In addition, CPY dissolution of Manecki andMaurice [10] shows that DFO-B enhances Pb release fromCPYby approximately only an order ofmagnitude (comparedto the control) versus 2 orders of magnitudemore Pb releasedin the presence of DFO-D
1in our data (Figure 4(a)). Another
reason may be the difference in pH-dependent sorptionbehavior of aHA/DFO-D
1in addition to the pH-dependent
concentration of dissolved Pb-aHA/Pb-DFO-D1complexes
affecting CPY dissolution. DFO-B adsorption on goethiteshows cation-like behavior while DFO-D
1shows ligand-
like adsorption behavior and adsorbs twice as much ongoethite compared to DFO-B [7]. Lead-ligand complexationand ligand sorption as a function of pH are investigated inmore detail below by (1) modeling dissolved Pb speciationupon CPY dissolution in the absence of ligands and in thepresence of aHA or DFO-B and (2) by investigating pH-dependent aHA sorption behavior on CPY.
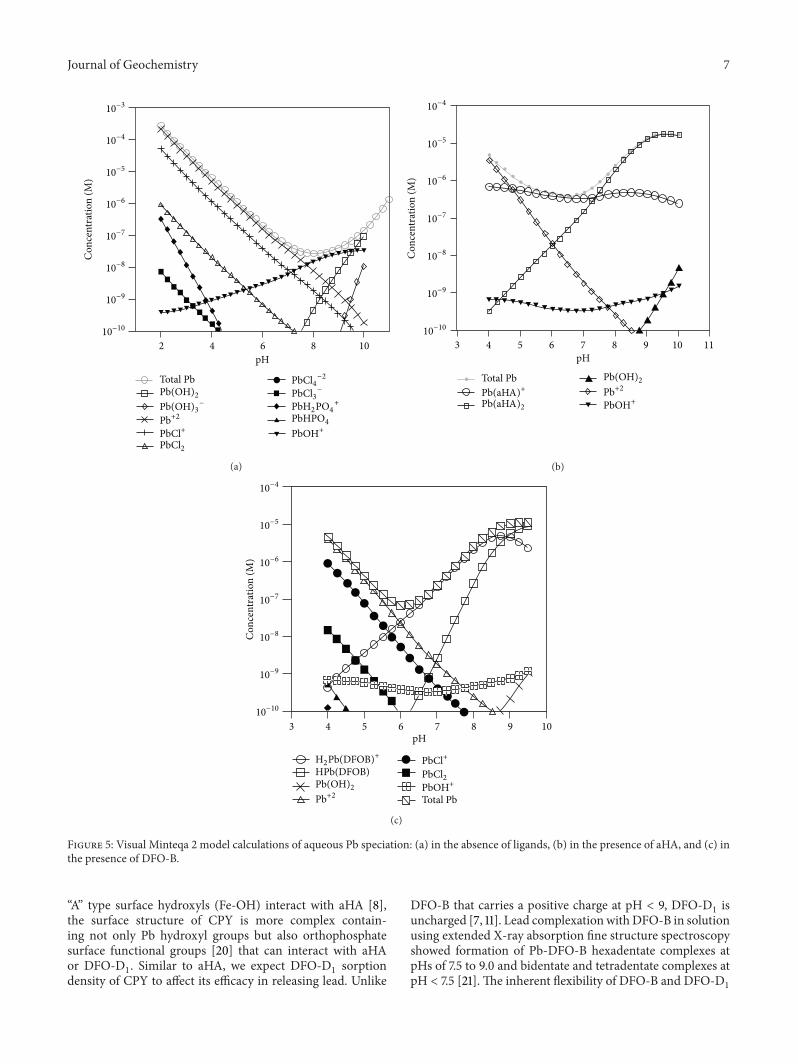
3.3. Lead Speciation in the Liquid Phase from Model Calcu-lations of CPY Dissolution. Figures 5(a), 5(b), and 5(c) showthe amount of calculated total Pb released in the absenceof ligands or in the presence of aHA or DFO-B. Figure 5(a)shows model calculations of pH-dependent Pb speciationupon CPY dissolution in the absence of ligands. Below pH7, the total dissolved Pb is essentially a sum of Pb2+ andPbCl+, both of which decrease steadily with increasing pH(Figure 5(a)). Above pH 7, PbOH+ is the main componentof the total dissolved Pb (Figure 5(a)). Figure 5(b) showsmodel calculations of pH-dependent Pb speciation in aHApromoted CPY dissolution. Pb forms two complexes withaHA, a positively charged Pb(aHA)+ complex and a neutralPb(aHA)
2complex (see Table 1). Similar to the control,
uncomplexed Pb2+ is one of the main species comprisingtotal dissolved Pb at low pH (4-5) with steadily decreasingcontribution with increasing pH (Figure 5(b)). However,unlike in the control, Pb(aHA)+ dominates at all pHs exceptbetween pHs 4 and 5 (Figure 5(b)). At pH above 7, the neutralspecies Pb(aHA)
2controls total Pb released with some con-
tribution from Pb(aHA)+ species (Figure 5(b)). Figure 5(c)shows model calculations of Pb speciation in DFO-B pro-moted CPY dissolution. Lead forms four aqueous complexeswith DFO-B: HPb(DFOB), H
2PB(DFOB)+, H
3Pb(DFOB)2+,
and HPb2(DFOB)2+ (Table 1; [15]). Unlike aHA, in DFO-
B promoted CPY dissolution, un-complexed Pb as Pb2+dominates Pb speciation until about pH 6 (Figure 5(c)).Above pH 6, Pb-DFO-B complexes in particular, positivelycharged H
2Pb(DFOB)+ and to a lesser extent, HPb(DFOB)
control Pb speciation in solution (Figure 5(c)). Furthermore,Pb-aHA aqueous complexes control the speciation of dis-solved Pb between pHs 5 and 9 and Pb-DFO-B aqueouscomplexes control the speciation of dissolved Pb betweenpHs 6 and 9 suggestingmaximum enhancement in Pb releasefrom CPY dissolution in these pH ranges, respectively. Themodel aqueous speciation calculations, therefore, explainthe pH-dependent trends in the experimental data showingessentially similar amounts of total Pb dissolved near pH 4and an enhancement in Pb release from CPY dissolution inthe presence of aHA or DFO-D
1compared to the control at
pH > 6 assuming that Pb-DFO-D1complexes are analogous
to Pb-DFO-B aqueous complexes (Figure 4(a)).
3.4. aHASorption onCPY andMechanism ofDissolution. Thesorption behavior of aHA as a function of time and input aHAconcentration is shown in Figure 6. aHA sorption envelopeon CPY particles is shown in Figure 6(a). aHA sorption onCPY is pH independent betweenpHs 3.5 and 8.0 but increasessharply at pH 9 and further increases at pH 9.5 (Figure 6(a)).ThePZCofCPY is 6.7 and IEP of aHA is 9 [19] indicating that,between pH 3.5 and ∼6.5, both CPY and aHA are positivelycharged. Between pHs 6.5 and 9, CPY carries a small negativecharge while aHA continues to be positively charged. If aHAsorption on CPY is electrostatically controlled, we wouldobserve maximum aHA sorption between pHs 6.5 and 9.However, no pH dependence on aHA sorption is observedbetween pHs 3.5 and 8. The amount of aHA sorbed onCPY increases dramatically beyond pH 8 (Figure 6(a)) whereCPY is negatively charged and aHA is neutral or carries asmall negative charge. These results suggest the influence ofhydrogen bonding in addition to the electrostatic forces inaHA sorption on CPY. The kinetics of aHA sorption wererapid with maximum sorption occurring at 1 h and stayingconstant at 6 h (Figure 6(b)). The rapid kinetics of aHAsorption explain rapid dissolution kinetics of CPY. Beyond6 h, the concentration of adsorbed aHA with time variederratically and reduced with increasing time suggesting thatthe sorption mechanism was complex (Figure 6(b)). aHAsorption isotherm on CPY at pH 6.5 exhibited a typicalligand-like behavior until 20 h (Figure 6(c)). The concentra-tion of adsorbed aHA slightly reduced at 48 h.ThemaximumaHA sorption density on CPY was ∼14 𝜇mol/g comparable toits sorption density of 10 𝜇mol/g on goethite (Figure 6(c)).
Since aHA sorbs at all pHs, we expect aHA sorption toaffect CPY dissolution at all pHs. If concentration of aHAsorbed on CPY is the only factor affecting CPY dissolutionthen one would expect maximum aHA promoted CPYdissolution at pH9.This is indeed true fromour experimentalresults of aHA promoted CPY dissolution (Figures 4(a)and 6(a)). In addition, rapid sorption kinetics suggest thatformation of the ligand surface complex is likely not therate limiting step in CPY dissolution. Unlike goethite where
Journal of Geochemistry 7
10−3
10−4
10−5
10−6
10−7
10−8
10−9
10−10
2 4 6 8 10
pH
Con
cent
ratio
n (M
)
Total PbPb(OH)2Pb(OH)3
−
PbCl+PbCl2
PbCl4−2
PbCl3−
PbH2PO4+
PbHPO4PbOH+
Pb+2
(a)
Con
cent
ratio
n (M
)
Total Pb
Pb(aHA)2Pb(aHA)+
Pb(OH)2Pb+2
PbOH+
10−4
10−5
10−6
10−7
10−8
10−9
10−10
3 4 5 6 7 8 9 10 11
pH
(b)
10−4
10−5
10−6
10−7
10−8
10−9
10−10
pH
Con
cent
ratio
n (M
)
H2Pb(DFOB)+HPb(DFOB)Pb(OH)2Pb+2
PbCl+
PbOH+
Total Pb
3 4 5 6 7 8 9 10
PbCl2
(c)
Figure 5: Visual Minteqa 2 model calculations of aqueous Pb speciation: (a) in the absence of ligands, (b) in the presence of aHA, and (c) inthe presence of DFO-B.
“A” type surface hydroxyls (Fe-OH) interact with aHA [8],the surface structure of CPY is more complex contain-ing not only Pb hydroxyl groups but also orthophosphatesurface functional groups [20] that can interact with aHAor DFO-D
1. Similar to aHA, we expect DFO-D
1sorption
density of CPY to affect its efficacy in releasing lead. Unlike
DFO-B that carries a positive charge at pH < 9, DFO-D1is
uncharged [7, 11]. Lead complexationwithDFO-B in solutionusing extended X-ray absorption fine structure spectroscopyshowed formation of Pb-DFO-B hexadentate complexes atpHs of 7.5 to 9.0 and bidentate and tetradentate complexes atpH < 7.5 [21]. The inherent flexibility of DFO-B and DFO-D
1

8 Journal of Geochemistry
25
20
15
10
5
0
3 4 5 6 7 8 9 10pH
Sorb
ed aH
A (𝜇
mol
/g)
(a)
25
20
15
10
5
00 5 10 15 20 25
Time (h)
Sorb
ed aH
A (𝜇
mol
/g)
(b)
25
20
15
10
5
0
Dissolved aHA (𝜇mol/L)0 10 20 30 40 50
Sorb
ed aH
A (𝜇
mol
/g)
(c)
Figure 6: (a) Sorption envelope of aHA on CPY with replications at pHs 4, 7, and 9; (b) kinetics of aHA sorption on CPY at pH 6.5 withreplications at 6 h and 24 h; (c) sorption isotherm of aHA sorbed on CPY at pH 6.5 with replication at 35 𝜇mol/L. The replicates showedessentially identical sorption numbers.
due to the presence of two alkane chains between eachhydroxamate moiety suggests that conformations similar tothose in solution complexes may also be possible at the sur-face except that the positively chargedDFO-Bwill be repelledat pH < PZC of CPY at 6.7. The expected maximumDFO-D
1
promotedPbdissolution at pH> 7 is therefore consistentwiththe experimental results (Figure 4(a)). In addition, formationof bidentate or tridentate DFO-D
1complexes involving two
or three Pb-OH surface groups on CPY could potentiallyexplain much greater dissolution rates and Pb(II) release aspromoted by DFO-D
1than aHA (Figure 4(a)).
3.5. Implications for CPY Stability in Soils and Sediments.Results on DFO-D
1and aHA promoted dissolution of
CPY here under controlled conditions are representative ofmany soils and sediments. These results showing significantenhancement in CPY lability due to ligand-promoted disso-lution suggest that CPY formation in soils under addition ofdissolved phosphate andphosphatemineral amendmentswillbe stable at acid conditions but not at alkaline conditions.This not only is indeed consistent with results of Stanforthand Qui [22] and Cao et al. [23] in soils pertaining to Pbimmobilization as CPY but also explains them. Stanforth and
Journal of Geochemistry 9
Qui [22] treated lead contaminated soil waste with phosphatebased additives and found a reduction in lead solubilityin the acid pH range but not in the alkaline pH range.Similarly, Cao et al. [23] showed that, in lead contaminatedsoil and soils spiked with various Pb-based minerals suchas cerrusite (PbCO
3), litharge (PbO), and anglesite (PbSO
4)
and treated with Ca(H2PO4)2P amendment transformed Pb
to pyromorphite effectively at acid pH. As noted above, leadremediation in soils as CPY is contingent on its stabilitywhich is mainly affected by commonly present ligands suchas siderophores.Therefore, siderophores (DFO-D
1andDFO-
B) enhancing CPY dissolution only at alkaline pH (seeFigure 4(a)) explain the efficacy of Pb remediation in soils atonly acid pH as observed by Stanforth and Qui [22] and Caoet al. [23].
4. Conclusions
The trends in kinetics and equilibrium ligand-promoteddissolution of CPY can be explained by its ligand sorp-tion behavior. All the results combined, especially the pH-dependent ligand-promoted dissolution of CPY, indicatethat hydroxamate ligands can dramatically increase CPYlability in alkaline environments. In addition, unchargedtrihydroxamate siderophores are more effective in dissolvingPb than positively charged trihydroxamate siderophores suchas DFO-B or monohydroxamate moieties such as aHA.
Abbreviations
CPY: ChloropyromorphiteaHA: Acetohydroxamic acidDFO-B: Desferrioxamine-BDFO-D
1: Desferrioxamine-D
1.
Conflict of Interests
The author declares that there is no conflict of interestsregarding the publication of this paper.
Acknowledgments
The author thanks Jennifer Forsythe for her help withSEM/EDS and BET surface area analysis and Dr. PatriciaMaurice for providing overall support and helpful sugges-tions for conducting this work. Funding for this researchwas provided by the Center of Environmental Science andTechnology at University of Notre Dame.
References
[1] G. M. Hettiarachchi and G. M. Pierzynski, “Soil lead bioavail-ability and in situ remediation of lead-contaminated soils: areview,” Environmental Progress, vol. 23, no. 1, pp. 78–93, 2004.
[2] J. A. Ryan, K. G. Scheckel,W. R. Berti et al., “Reducing children’srisk from lead in soil,” Environmental Science and Technology,vol. 38, no. 1, pp. 18A–24A, 2004.
[3] K. G. Scheckel and J. A. Ryan, “Effects of aging and pHon dissolution kinetics and stability of chloropyromorphite,”
Environmental Science & Technology, vol. 36, no. 10, pp. 2198–2204, 2002.
[4] P. E. Powell, P. J. Szaniszlo, G. R. Cline, and C. P. P. Reid,“Hydroxamate siderophores in the iron nutrition of plants,”Journal of Plant Nutrition, vol. 5, pp. 653–673, 1982.
[5] D. E. Crowley andD. Gries, “Modeling of iron availability in theplant rhizosphere,” in Biochemistry of Metal Micronutrients inthe Rhizosphere, J. A. Manthey, D. E. Crowley, and D. G. Luster,Eds., pp. 199–223, CRC Press, Boca Raton, Fla, USA, 1994.
[6] B. J. Hernlem, L. M. Vane, and G. D. Sayles, “Stability constantsfor complexes of the siderophore desferrioxamine B withselected heavymetal cations,” InorganicaChimicaActa, vol. 244,no. 2, pp. 179–184, 1996.
[7] S. M. Kraemer, S. F. Cheah, R. Zapf, J. Xu, K. N. Raymond, andG. Sposito, “Effect of hydroxamate siderophores on Fe releaseand Pb(II) adsorption by goethite,” Geochimica et Cosmochim-ica Acta, vol. 63, no. 19-20, pp. 3003–3008, 1999.
[8] B. A. Holmen and W. H. Casey, “Hydroxamate ligands, surfacechemistry, and the mechanism of ligand-promoted dissolutionof goethite [𝛼-FeOOH(s)],” Geochimica et Cosmochimica Acta,vol. 60, no. 22, pp. 4403–4416, 1996.
[9] L. Xie and D. E. Giammar, “Equilibrium solubility and disso-lution rate of the lead phosphate chloropyromorphite,” Envi-ronmental Science & Technology, vol. 41, no. 23, pp. 8050–8055,2007.
[10] M.Manecki and P. A.Maurice, “Siderophore promoted dissolu-tion of pyromorphite,” Soil Science, vol. 173, no. 12, pp. 821–830,2008.
[11] D. C. Edwards and S. C. B. Myneni, “Hard and soft X-ray absorption spectroscopic investigation of aqueous Fe(III)-hydroxamate siderophore complexes,” Journal of PhysicalChemistry A, vol. 109, no. 45, pp. 10249–10256, 2005.
[12] M. Manecki, P. A. Maurice, and S. J. Traina, “Uptake of aqueousPb by Cl−, F−, and OH− apatites: mineralogic evidence fornucleation mechanisms,” American Mineralogist, vol. 85, no. 7-8, pp. 932–942, 2000.
[13] F. Bergmann andR. Segal, “The separation anddetermination ofmicroquantities of lower aliphatic acids, including fluoroaceticacid,”The Biochemical Journal, vol. 62, no. 4, pp. 542–546, 1956.
[14] A. H. Gillam, A. G. Lewis, and R. J. Andersen, “Quantitativedetermination of hydroxamic acids,” Analytical Chemistry, vol.53, no. 6, pp. 841–844, 1981.
[15] S. E. Hepinstall, B. F. Turner, and P. A. Maurice, “Effects ofsiderophores on Pb and Cd adsorption to kaolinite,” Clays andClay Minerals, vol. 53, no. 6, pp. 557–563, 2005.
[16] G. Furrer and W. Stumm, “The coordination chemistry ofweathering: I. Dissolution kinetics of 𝛿-𝐴𝑙
2𝑂3and BeO,”
Geochimica et Cosmochimica Acta, vol. 50, no. 9, pp. 1847–1860,1986.
[17] C. Amrhein and D. L. Suarez, “The use of a surface com-plexation model to describe the kinetics of ligand-promoteddissolution of anorthite,”Geochimica et Cosmochimica Acta, vol.52, no. 12, pp. 2785–2793, 1988.
[18] C. Ludwig, W. H. Casey, and P. A. Rock, “Prediction of ligand-promoted dissolution rates from the reactivities of aqueouscomplexes,” Nature, vol. 375, no. 6526, pp. 44–47, 1995.
[19] M. T. Caudle, C. D. Caldwell, and A. L. Crumbliss, “Dihydrox-amic acid complexes of iron (III): ligand pKa and coordinatedwater hydrolysis constants,” Inorganica Chimica Acta, vol. 240,no. 1-2, pp. 519–525, 1995.

10 Journal of Geochemistry
[20] A. Bengtsson, A. Shchukarev, P. Persson, and S. Sjoberg, “A sol-ubility and surface complexation study of a non-stoichiometrichydroxyapatite,” Geochimica et Cosmochimica Acta, vol. 73, no.2, pp. 257–267, 2009.
[21] B.Mishra, E. A. Haack, P. A.Maurice, and B. A. Bunker, “Effectsof themicrobial siderophoreDFO-B on Pb andCd speciation inaqueous solution,” Environmental Science and Technology, vol.43, no. 1, pp. 94–100, 2009.
[22] R. Stanforth and J. Qiu, “Effect of phosphate treatment on thesolubility of lead in contaminated soil,” Environmental Geology,vol. 41, no. 1-2, pp. 1–10, 2001.
[23] X. Cao, L. Q. Ma, S. P. Singh, and Q. Zhou, “Phosphate-inducedlead immobilization from different lead minerals in soils undervarying pH conditions,” Environmental Pollution, vol. 152, no. 1,pp. 184–192, 2008.

Submit your manuscripts athttp://www.hindawi.com
Hindawi Publishing Corporationhttp://www.hindawi.com Volume 2014
ClimatologyJournal of
EcologyInternational Journal of
Hindawi Publishing Corporationhttp://www.hindawi.com Volume 2014
EarthquakesJournal of
Hindawi Publishing Corporationhttp://www.hindawi.com Volume 2014
Hindawi Publishing Corporationhttp://www.hindawi.com
Applied &EnvironmentalSoil Science
Volume 2014
Mining
Hindawi Publishing Corporationhttp://www.hindawi.com Volume 2014
Journal of
Hindawi Publishing Corporation http://www.hindawi.com Volume 2014
International Journal of
Geophysics
OceanographyInternational Journal of
Hindawi Publishing Corporationhttp://www.hindawi.com Volume 2014
Journal of Computational Environmental SciencesHindawi Publishing Corporationhttp://www.hindawi.com Volume 2014
Journal ofPetroleum Engineering
Hindawi Publishing Corporationhttp://www.hindawi.com Volume 2014
GeochemistryHindawi Publishing Corporationhttp://www.hindawi.com Volume 2014
Journal of
Atmospheric SciencesInternational Journal of
Hindawi Publishing Corporationhttp://www.hindawi.com Volume 2014
OceanographyHindawi Publishing Corporationhttp://www.hindawi.com Volume 2014
Advances in
Hindawi Publishing Corporationhttp://www.hindawi.com Volume 2014
MineralogyInternational Journal of
Hindawi Publishing Corporationhttp://www.hindawi.com Volume 2014
MeteorologyAdvances in
The Scientific World JournalHindawi Publishing Corporation http://www.hindawi.com Volume 2014
Paleontology JournalHindawi Publishing Corporationhttp://www.hindawi.com Volume 2014
ScientificaHindawi Publishing Corporationhttp://www.hindawi.com Volume 2014
Hindawi Publishing Corporationhttp://www.hindawi.com Volume 2014
Geological ResearchJournal of
Hindawi Publishing Corporationhttp://www.hindawi.com Volume 2014
Geology Advances in