Embed Size (px)
Citation preview
Research ArticleImplementation of Secondary Index on Cloud ComputingNoSQL Database in Big Data Environment
Bao Rong Chang,1 Hsiu-Fen Tsai,2 Chia-Yen Chen,1
Chien-Feng Huang,1 and Hung-Ta Hsu1
1Department of Computer Science and Information Engineering, National University of Kaohsiung, Kaohsiung 81148, Taiwan2Department of Marketing Management, Shu-Te University, Kaohsiung 82445, Taiwan
Correspondence should be addressed to Chien-Feng Huang; [email protected]
Received 4 September 2014; Accepted 12 December 2014
Academic Editor: Gianluigi Greco
Copyright © 2015 Bao Rong Chang et al. This is an open access article distributed under the Creative Commons AttributionLicense, which permits unrestricted use, distribution, and reproduction in any medium, provided the original work is properlycited.
This paper introduces the combination of NoSQL database HBase and enterprise search platform Solr so as to tackle the problemof the secondary index function with fast query. In order to verify the effectiveness and efficiency of the proposed approach, theassessment using Cost-Performance ratio has been done for several competitive benchmark databases and the proposed one. Asa result, our proposed approach outperforms the other databases and fulfills secondary index function with fast query in NoSQLdatabase. Moreover, according to the cross-sectional analysis, the proposed combination of HBase and Solr database is capable ofperforming an excellent query/response in a big data environment.
1. Introduction
Regarding big data storage [1, 2], the way of fast and easy dataquery is a concerned issue in NoSQL database. In general,NoSQL scheme [3, 4] is capable of supporting various dataformat to process the storage; yet it sacrifices the indexsearching function. HBase is of a NoSQL database as partof Hadoop ecosystem. It is known as the scheme of keyvalue and usually stores the results coming out ofMapReduceexecution. HBase features high scalability and high flexibility,delivering a high IO performance of big data. Solr is of ablazing fast open source enterprise search engine that canquickly create index and proceed with powerful full-textsearch. In this paper, we are able to combine HBase and Solrto enhance the secondary index function for HBase. Afterthe success of this combination, we go for a series of stresstests using several testing items and then make the perfor-mance comparison between the proposed one and the otherbenchmark databases. Finally, a cost effectiveness evaluationcalled Cost-Performance ratio (C-P ratio) [5] has been donefor a variety of databases. As a result, the assessment aboutC-P ratio will be analyzed and discussed for all of databases
mentioned in this paper. Based on the cross-sectional dataanalysis [6], it will explore the performance of data access inNoSQL database in a big data environment as well.
For key-value database, it allows the application to storeits data in a schema-less way. The data could be stored ina data type of a programming language or an object. Thereis no need for a fixed data model. Key-value storing dividesmany categories, like eventually consistent (always keeps thenewest result if there is no update), hierarchical (can usethe parent’s attributes), cache in RAM (key value stored inmemory, hash stored in cache, and hash used to present key-value index; time complexity is O(1)), solid state or rotatingdisk (like Google Bigtable which is used in solid state diskto enhance IO access speed), and ordered (with key-valuepairs which can sort keys or values). For tabular database, itis a database that is structured in a tabular form. It arrangesdata elements in vertical columns and horizontal rows. Eachcell is formed by the intersection of a column and row. Eachrow and column are uniquely numbered to make it orderlyand efficient. This type of database has a virtually infiniterange for mass data storage. Structuring data in tabular formmay be the oldest method used. It is also simple. Tabular
Hindawi Publishing CorporationScientific ProgrammingVolume 2015, Article ID 560714, 10 pageshttp://dx.doi.org/10.1155/2015/560714

2 Scientific Programming
Table 1: NoSQL database benchmark on 5 criteria.
Database Performance Scalability Flexibility Complexity FunctionalityKey-value store High High High Low VariableColumn store High High Moderate Low MinimumDocument store High Variable High Low VariableGraph database Variable Variable High High Graph theoryRelational database Variable Variable Low Moderate Relational algebra
database has several properties. They share the same set ofproperties per record.Thismeans that every row has the sameset of column titles. They access records through identifiers.Each table in a tabular database contains a particular setof related information that is connected with the databasesubject through key fields, which describe each record (row)so that, in the event of a query, the system can quickly locatethe record. There are several famous databases of this type,like Google Bigtable, Apache Accumulo, Apache HBase, andHypertable. For column store database, it stores data tablesas sections of columns of data rather than rows of data. ForRDBMS, rows are commonly used; the column store databasehas the advantage of aggregating computed data over largenumbers of similar data items. Column store is used in datawarehouse and CRM system. Using column store database,the system can evaluate which columns are being accessedand retrieved only if values are requested from the specificcolumns. For NoSQL database, eachmechanism has differentuses, and a famous database can have many properties, likeGoogle Bigtable. It owns solid state disk key-value type andtabular type. For this study,HBase is a column-store database.It has an easy method to use, and its performance as well asthe scalability is better than the others. Table 1 explains theperformance of each type of database over 5 criteria.
The following paragraphs of this paper are arranged asfollows. In Section 2, combination of NoSQL database andenterprise search platform will be described. The way tosystem assessment is given in Section 3. The experimentalresults and discussion will be obtained in Section 4. Finally,we drew a brief conclusion in Section 5.
2. Combination of NoSQL Database andEnterprise Search Platform
This paper studies how the combination of HBase and Solrruns in big data environment based on cloud computingplatform. All of application programs were installed in aLinux-based operating system. HBase is placed over HadoopHDFS system. Thus, HBase can be attached to Hadoopafter the core parts of Hadoop have been installed in aphysical machine such as MapReduce and HDFS. Solr canoperate independently without any support from any otherapplications.With the corporationwith Solr,HBase can easilycreate index. On the other hand, Solr is able to provide GUIinterface for user’s operation. The procedure to establish thecombination of two applications can be listed as follows.
(1) Install Linux O/S on every host, connect themtogether via SSH, and deploy JVM to every host toachieve a Linux cluster environment.
(2) Establish master and slave nodes and start them up.Master node shall deploy Hadoop to slave nodes.This has Hadoop done in every host in a clusterenvironment [7–9].
(3) After deploying Hadoop and ZooKeeper to cluster,we need to confirm the start-up of Hadoop andZooKeeper services. We are able to give jps instruc-tion at terminal to check whether or not the servicesare running normally. After that, we establish HBaseservice [10–13] within Hadoop.
(4) When procedure #3 has been done, web browser isused to view the start-up of Hadoop and HBase ser-vices. Key in http://localhost:50030/, 50040, 50070,and 60010 is used to check each node if operatingnormally.
(5) Before we get Solr started, we need to modify theexecution parameters in solrconfig.xml, which isa configuration file within ./solr-version/examples/solr/collection1/conf/. We have to determine the Solrwhether or not setting input word string to act asan index, content storage, and data format. ApacheSolr needed http web container to get it started, forexample, either Apache Tomcat or Apache Jetty. Here,we chose Jetty because of the default setting. Aftersetting up, we key in “java –jar start, jar” to start upSolr in terminal. Finally, we got Solr’s address, whichis http://localhost:8983/.
(6) Since HBase cannot support automatically generatedrow key, several big data files shall be modified inadvance. We need to design a unique and complexrowkey which corresponds to a large number of rows(up to ten million rows). In this study, we chose theAmerican Yellow Page as data source. Our data com-bination is “rowkey-category-shop name-telephone-province-address” with a total of 6 columns. Thesedata files have to translate into CSV format, and “,”symbols are used to separate each column.
(7) The CSV file is uploaded to Hadoop file system, andthese files are imported to HBase as full-text inputvia the special tool, “bulk load tool” [14]. We need tocheck the data integrity inHBase after data importing.
Scientific Programming 3
Figure 1: Apache Solr configuring file for indexing.
Clientuser
Querying index
HBaserowkey
CLI queryingrowkey
HBase table Solr cache
Solr indexquerying
Summarizethe column
Data classification
Data transmission to
HBase
Is datawith somerule?
Datatransmission to
SolrYes
No
Data integrity
Resend data
(Missing data)
Dataintegrityin Solr-doc no.
Resend data
Yes YesStart- collect
big data
End-getinformation
Feedback
(Missing data)No No
Figure 2: Flowchart of HBase together with Solr to implement secondary index operation.
(8) Then, we use HBase output API and Apache HTTPAPI to transfer the document to Solr fromHBase [15–17]. After the transmission, the indexes are createdand the content is saved in memory in Solr, that is,the schema as defined and shown in Figure 1. We canuse web browser to check the amount of documentsin Solr. Data in a row represent a document. We canuse query function to search our keyword (Secondaryindex or more) and reversely to search the primaryindex in Solr. We may be able to apply filter functionto improve the precision of search results.
(9) After finishing the setup of the proposed system, wechose some other benchmarks to compare with theproposed one in the experiment. After the experi-ment, we are able to give a kind of assessment onthose, for instance a cost effectiveness evaluation.
In Figure 2, a flowchart represents HBase together with Solrto implement secondary index operation.
3. System Assessment
In terms of the performance evaluation, we have initiallytested the time for data read/write to a variety of databases,such as Apache HBase, Cassandra, Huawei HBase, Solandra,and Lily Project. Next, the time for data transfer to Solr fromthe databases mentioned above has to be recorded. Finally,the response time for the query function performed in Solrneeded to be measured as well. According to four tests ondata write, data read, document transfer, and query/responseto any of databases as mentioned above, first of all we haveto measure a single datum access time taking a number ofdifferent data size as shown in (1), where 𝑡
𝑠𝑖𝑗𝑘represents a
single datum access time, for a single run 𝑡𝑖𝑗𝑘
stands for
4 Scientific Programming
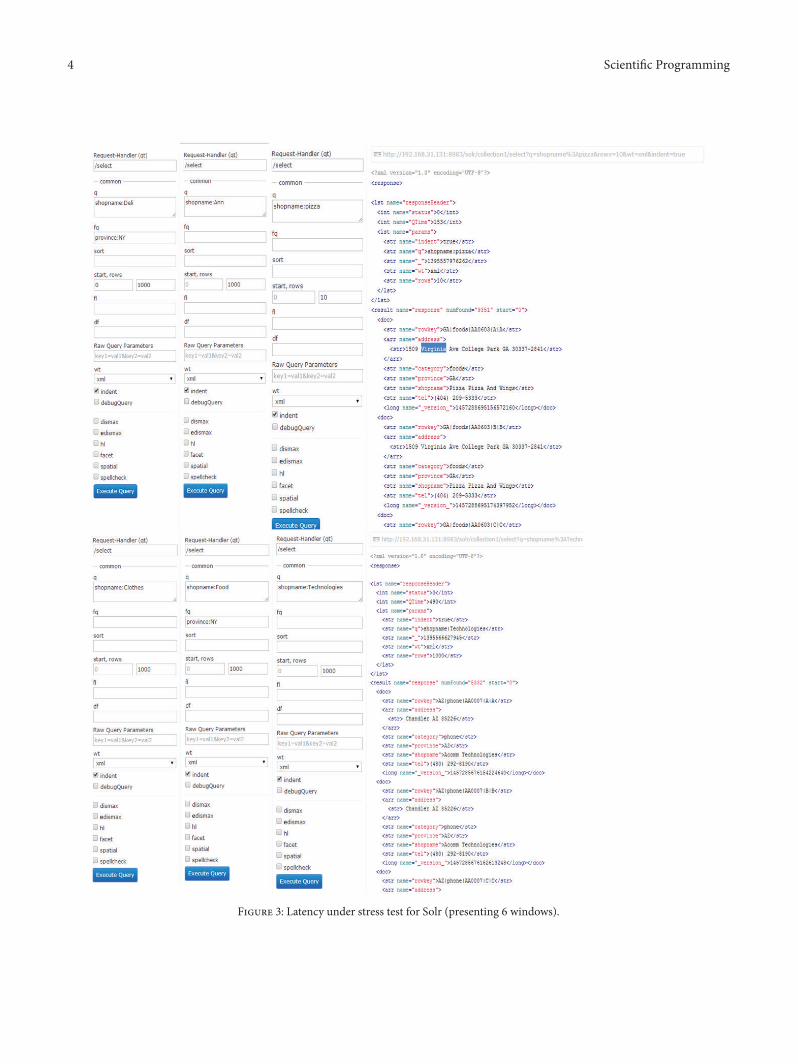
Figure 3: Latency under stress test for Solr (presenting 6 windows).

Scientific Programming 5
measured total time for a specific data size at a certaindatabase, and 𝑁
𝑖𝑘means a specific data size. In (2), 𝑡
𝑠𝑖𝑗𝑘
represents average time of a single datum access and 𝑤𝑖
stands for the respective weight factor for 𝑡𝑠𝑖𝑗𝑘. A normalized
performance index for a specific database at a certain testcan be obtained as shown in (3), where PI
𝑗𝑘represents a
normalized performance index. After that, we have evaluatedthe weighted average of normalized performance index and itturned out to be the performance index [18] for each databaseas shown in (4), where PI
𝑗represents performance index, SF1
stands for scale factor #1,𝑊𝑘is the respective weight, and PI
𝑗𝑘
means a normalized performance index. In order to assess thecost effectiveness evaluation, we need to calculate total cost ofownership [19] in (5), showing the expenditure of money inthe implementation of secondary index function for NoSQLdatabase, where HC
𝑎presents hardware cost, 𝑆
𝑏stands
for software cost, RCAW𝑐means repairing cost after the
warranty, DTC𝑑is downtime cost, and EUC
𝑒explains extra
upgrade cost. The monetary value of total cost of ownershipmay vary with location, market, and tax. Thus, a higher cost,for example, might be obtained in US and a lower cost inTaiwan. In the system assessment, a typical cost effectivenessevaluation calledC-P ratio has been introduced here to do theassessment in (6), whereCP
𝑗𝑔is C-P ratio, SF2 stands for scale
factor #2, and TCO𝑗𝑔
means total cost of ownership as wellas subscript 𝑗 that represents various data center and 𝑔 thatstands for a certain period of time. Consider the following:
𝑡𝑠𝑖𝑗𝑘=
𝑡𝑖𝑗𝑘
𝑁𝑖𝑘
, (1)
where 𝑖 = 1, 2, . . . , 𝑙, 𝑗 = 1, 2, . . . , 𝑚, and 𝑘 = 1, 2, . . . , 𝑛,
𝑡𝑠𝑗𝑘=
𝑙
∑
𝑖=1𝑤𝑖⋅ 𝑡𝑠𝑖𝑗𝑘, (2)
where 𝑗 = 1, 2, . . . , 𝑚, 𝑘 = 1, 2, . . . , 𝑛, and ∑𝑙𝑖=1 𝑤𝑖 = 1,
PI𝑗𝑘=
1/𝑡𝑠𝑗𝑘
Maxℎ=1,2,...,𝑚 (1/𝑡𝑠ℎ𝑘)
, (3)
where 𝑗 = 1, 2, . . . , 𝑚 and 𝑘 = 1, 2, . . . , 𝑛,
PI𝑗= SF1 ⋅ (
𝑛
∑
𝑘=1𝑊𝑘⋅ PI𝑗𝑘) , (4)
where 𝑗 = 1, 2, . . . , 𝑚, 𝑘 = 1, 2, . . . , 𝑛, SF1 = 102, and∑𝑛
𝑘=1𝑊𝑘 = 1,
TCO𝑗𝑔= ∑
𝑎
HC𝑎+∑
𝑏
𝑆𝑏+∑
𝑐
RCAW𝑐+∑
𝑑
DTC𝑑+∑
𝑒
EUC𝑒, (5)
where 𝑗 = 1, 2, . . . , 𝑚 and 𝑔 = 1, 2, . . . , 𝑜,
CP𝑗𝑔= SF2 ⋅
PI𝑗
TCO𝑗𝑔
, (6)
where 𝑗 = 1, 2, . . . , 𝑚, 𝑔 = 1, 2, . . . , 𝑜, and SF2 = 104.
Rawdata
Hadoopfile
system
Uploadfile
Importdata
Buildindex
(1) Query data(other index)
(2) Get row-key
(3) Queryrow-key
HBaseSolr
User
Figure 4: Implementation procedure.
Figure 5: Scanning a table in HBase using CLI.
In order to examine the stability and reliability of NoSQLdatabase secondary index function, a stress test of dataretrieval in Solr has been taken in a big data environment.Technically speaking, this test generated up to 20 threads(20 windows) to respond to 10 to 1000 queries and we hadchecked the latency (time interval) simultaneously. The keyindex in every query was different as shown in Figure 3.Clearly, the result would indicate the response time for thequery in Solr and explain what correlation between theamount of windows and the latency was found.
4. Experimental Results and Discussion
There are a few experiments and a discussion presented in thefollowing subsections.
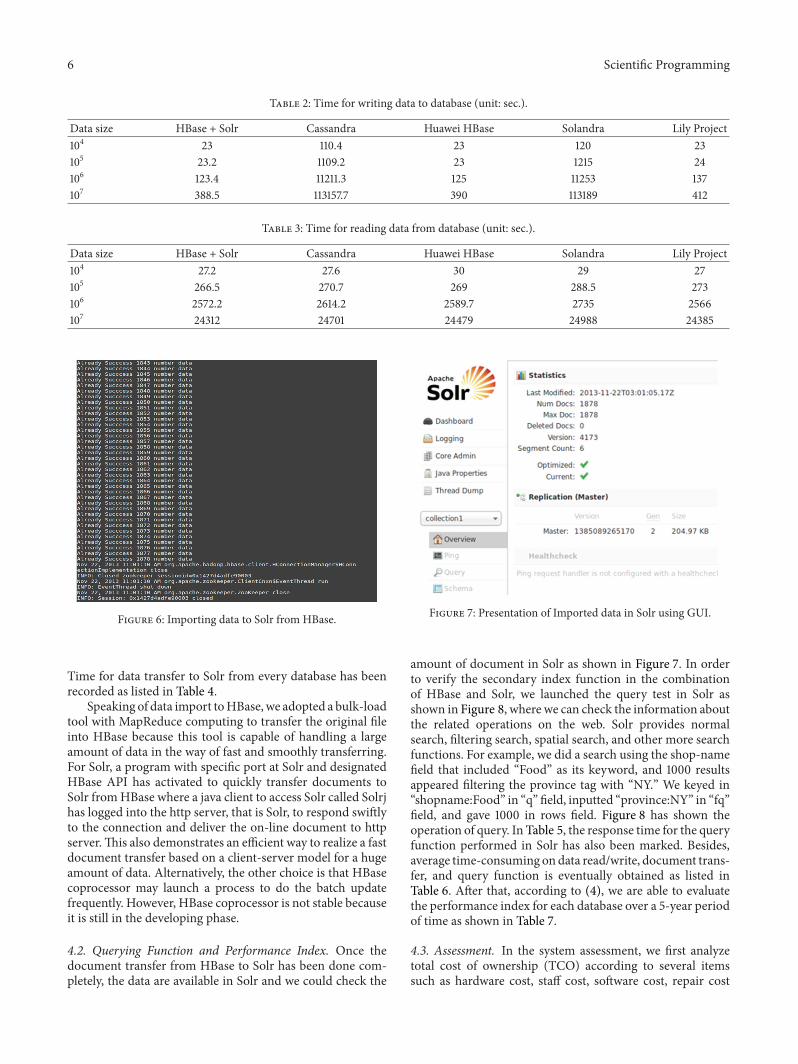
4.1. Data Transfer and Data Integrity Checking. In regardto implementation procedure as shown in Figure 4, whichindicated data transfer from HDFS to HBase and/or fromHBase to Solr, there are risks of losing data during thetransition. We have to verify the data integrity in HBaseinner table and the amount of input documents in Solr.For examining HBase, we checked inner table using thecommand “scan table-name” in CLI as shown in Figure 5.In Figure 6, the document transfer from HBase to Solr hasbeen done using the command in CLI. For examining Solr,we checked our input document amount in Solr using webinterface as shown in Figure 6. Furthermore, in terms of theperformance evaluation, the time for data writing/reading inevery database has been measured as listed in Tables 2 and 3.
6 Scientific Programming
Table 2: Time for writing data to database (unit: sec.).
Data size HBase + Solr Cassandra Huawei HBase Solandra Lily Project104 23 110.4 23 120 23105 23.2 1109.2 23 1215 24106 123.4 11211.3 125 11253 137107 388.5 113157.7 390 113189 412
Table 3: Time for reading data from database (unit: sec.).
Data size HBase + Solr Cassandra Huawei HBase Solandra Lily Project104 27.2 27.6 30 29 27105 266.5 270.7 269 288.5 273106 2572.2 2614.2 2589.7 2735 2566107 24312 24701 24479 24988 24385
Figure 6: Importing data to Solr from HBase.
Time for data transfer to Solr from every database has beenrecorded as listed in Table 4.
Speaking of data import toHBase, we adopted a bulk-loadtool with MapReduce computing to transfer the original fileinto HBase because this tool is capable of handling a largeamount of data in the way of fast and smoothly transferring.For Solr, a program with specific port at Solr and designatedHBase API has activated to quickly transfer documents toSolr fromHBase where a java client to access Solr called Solrjhas logged into the http server, that is Solr, to respond swiftlyto the connection and deliver the on-line document to httpserver.This also demonstrates an efficient way to realize a fastdocument transfer based on a client-server model for a hugeamount of data. Alternatively, the other choice is that HBasecoprocessor may launch a process to do the batch updatefrequently. However, HBase coprocessor is not stable becauseit is still in the developing phase.
4.2. Querying Function and Performance Index. Once thedocument transfer from HBase to Solr has been done com-pletely, the data are available in Solr and we could check the
Figure 7: Presentation of Imported data in Solr using GUI.
amount of document in Solr as shown in Figure 7. In orderto verify the secondary index function in the combinationof HBase and Solr, we launched the query test in Solr asshown in Figure 8, where we can check the information aboutthe related operations on the web. Solr provides normalsearch, filtering search, spatial search, and other more searchfunctions. For example, we did a search using the shop-namefield that included “Food” as its keyword, and 1000 resultsappeared filtering the province tag with “NY.” We keyed in“shopname:Food” in “q” field, inputted “province:NY” in “fq”field, and gave 1000 in rows field. Figure 8 has shown theoperation of query. In Table 5, the response time for the queryfunction performed in Solr has also been marked. Besides,average time-consuming ondata read/write, document trans-fer, and query function is eventually obtained as listed inTable 6. After that, according to (4), we are able to evaluatethe performance index for each database over a 5-year periodof time as shown in Table 7.
4.3. Assessment. In the system assessment, we first analyzetotal cost of ownership (TCO) according to several itemssuch as hardware cost, staff cost, software cost, repair cost

Scientific Programming 7
Figure 8: Response to a query in Solr using GUI.
after warranty, downtime cost, and extra upgrade cost. Asummary of TCO has been shown in Table 7. Here weestimated that hardware cost for two computers is $2666.Then, we assumed that the maintenance bill is $13000 everyyear for Hadoop together with HBase, Solr maintenance costis approximately $300 per year, and for Cassandra it would be$10300 every year. Accordingly, we do the same maintenanceestimation as the above-mentioned applications for Solandraand Lily Project because they are just the combination of theabove applications. All of software cost is totally free due toopen source. For hardware maintenance after warranty, weassumed that all the devices had the same risk of breakdown,and thus the chance of device breakdown in the 4th year
was about 25%, while in the 5th year it will be 50% chance.For the software upgrade cost, there is no charge because ofopen source. Regarding downtime cost, we assumed that oneapplication will cost $20 per year and the total cost woulddepend on the amount of software. Table 8 gives a summaryof the total cost of ownership for this study. As for the systemassessment, C-P ratio evaluation according to (6) for all ofdatabases will yield a summary of those over a 5-year periodof time as listed in Table 9.
4.4. Stress Test and Discussion. The issue about the stabilityand reliability of NoSQL database secondary index functionhas been concerned and hence a stress test of data retrieval

8 Scientific Programming
Table 4: Document transfer time from database to Solr (unit: sec.).
Data size HBase + Solr Cassandra Huawei HBase Solandra Lily Project104 109 120 115 123 115105 1121 1130 1125 1154 1130106 11105 11286 11173 11330 11186107 108055 112806 112347 113105 112395
Table 5: Response time for querying function performed in Solr (unit: sec.).
Data size HBase + Solr Cassandra Huawei HBase Solandra Lily Project104 0.15 0.91 45 2 1105 0.5 11.12 288 7 5106 2 143.1 547 15 10107 10 2011.13 1867 60 45
Table 6: Average time of a single datum access (unit: sec.).
Operation HBase + Solr Cassandra Huawei HBase Solandra Lily ProjectData write 0.000673563 0.011164768 0.0006735 0.011680475 0.00067955Data read 0.0025971 0.002637825 0.0026819 0.0027547 0.002608625Document transfer 0.011005125 0.01146665 0.011289425 0.011620125 0.011306375Query/response 0.00000575 0.000136603 0.002028425 0.00007275 0.000041125
1000011000120001300014000150001600017000
1st year 2nd year 3rd year 4th year 5th yearYear
Am
ount
of c
ost (
USD
)
HBase + SolrCassandraHuawei HBase
SolandraLily Project
Figure 9: Total cost of ownership among various databases over a5-year period.
in Solr has been taken in a big data environment. In thistest, there are up to 20 threads (20 windows) used to acceptthe number of queries from 10 to 1000 and in the meantimethe latency (time interval) has been counted. The key indexin every query was different as shown in Figure 3. Table 10has listed the summary of latency and we have examined theresults afterward. In the test from the statistics point of view,the amount of opening windows obviously did not affect thelength of latency occurring in the query in Solr. The stabilityand reliability of NoSQL database secondary index functionhave been verified because all of queries had responded in 5seconds during the stress test.
It noted that performance indexes for five databases havebeen listed in Table 7 and they are time-invariant. In Figure 9,
Table 7: Performance index.
Database Performance indexHBase + Solr 99Cassandra 51Huawei HBase 73Solandra 50Lily Project 77
Table 8: Total cost of ownership over a 5-year period (unit: USD).
Database 1st year 2nd year 3rd year 4th year 5th yearHBase + Solr 16393.3 13726.7 13726.7 13804.1 13877.9Cassandra 16020 13353.3 13353.3 13430.8 13504.6Huawei 16040 13373.3 13373.3 13450.8 13629.9Solandra 13040 10373.3 10373.3 10450.8 10524.6Lily Project 16393.3 13726.7 13726.7 13804.1 13877.9
Table 9: C-P ratio over a 5-year period.
Database 1st year 2nd year 3rd year 4th year 5th yearHBase + Solr 61.00 72.85 72.85 72.44 72.06Cassandra 31.94 38.32 38.32 38.10 37.89Huawei 45.92 55.07 55.07 54.76 54.04Solandra 38.85 48.84 48.84 48.48 48.14Lily Project 47.27 56.46 56.46 56.14 55.84
the total cost of ownership for our proposed approach hasvaried from year to year where it goes down dramaticallyand goes up slowly over a 5-year period. Accordingly, C-Pratio of the proposed approach goes up abruptly and almost

Scientific Programming 9
Table 10: Latency under stress test (unit: sec) (Win.: window).
Query Win. Win. Win. Win. Win. Win. Win. Win. Win. Win.#1 #2 #3 #4 #5 #6 #7 #8 #9 #10
10 0.15 0.1 0.2 0.2 0.1 0.15 0.16 0.15 0.2 0.2100 1 1 0.8 1 1 0.8 1 1 1 11000 3 4 3 4 3 4 3 4 5 4
#11 #12 #13 #14 #15 #16 #17 #18 #19 #2010 0.15 0.15 0.15 0.15 0.2 0.2 0.16 0.15 0.2 0.2100 1.2 0.8 1.1 1 1.1 1 1.2 1 1.1 1.21000 3 4 3 4 5 4 4 4 5 5
0.0010.0020.0030.0040.0050.0060.0070.0080.00
1st year 2nd year 3rd year 4th year 5th yearYear
HBase + SolrCassandraHuawei HBase
SolandraLily Project
C-P
ratio
Figure 10: C-P ratio among various databases over a 5-year period.
00.0020.0040.0060.008
0.010.0120.014
4 5 6 7
Tim
e (s)
Query/responseDocument transfer
Data writeData read
Data size (log 10)
Figure 11: Average time of a single datum access in a certaindatabase.
maintains the same level afterward as shown in Figure 10.Consequently, according toC-P ratio, our proposed approachoutperforms the others during this period, as listed in Table 9.This has verified that our proposed approach has beenrealized successfully andperformed significantly for aNoSQLsecondary index function and fast query.
There are four tests about the function of data read, datawrite, document transfer, and query/response, as mentionedabove in this paper to measure the average time of a single
datum access in a certain database as listed in Tables 2 to4. What we are interested in is to figure out whether theaverage time of a single datum access may be varied withdata size or not for these functions. As shown in Figure 11,the cross-sectional data analysis [6] gave that it takes leasttime on the function of query/responsewhen comparingwiththe other functions. The average time reduces dramaticallyas data size increases because the hit rate of data retrievalgoes up rapidly in memory cache and concurrently theresponse time shrinks sharply. This figure illustrates thatNoSQL database with secondary index function can achievean excellent performance in query/response of a certaindatabase, especially in a big data environment.
5. Conclusion
This paper introduces the combination of NoSQL databaseHBase and enterprise search platform Solr to realize thesecondary index function with fast query. In the assessment,a cost effectiveness evaluation called C-P ratio has beendone among several competitive benchmark databases andthe proposed one. As a result, our proposed approachoutperforms the other databases and fulfills secondary indexfunction with fast query in NoSQL database. Besides, astress test has been taken to verify the stability and relia-bility of the proposed approach. Finally, according to thecross-sectional analysis, the proposed combination of HBaseand Solr database is capable of performing an excellentquery/response in a big data environment.
Conflict of Interests
The authors declare that there is no conflict of interestsregarding the publication of this paper.
Acknowledgment
This work is supported by the Ministry of Science andTechnology, Taiwan, Republic of China, under Grant no.MOST 103-2221-E-390-011.
References
[1] D. Howe, M. Costanzo, P. Fey et al., “Big data: the future ofbiocuration,” Nature, vol. 455, no. 7209, pp. 47–50, 2008.
10 Scientific Programming
[2] A. Jacobs, “The pathologies of big data,” Communications of theACM—A Blind Person’s Interaction with Technology, vol. 52, no.8, pp. 36–44, 2009.
[3] R. Cattell, “Scalable SQL and NoSQL data stores,” ACM SIG-MOD Record, vol. 39, no. 4, pp. 12–27, 2010.
[4] J. Pokorny, “NoSQL databases: a step to database scalabilityin web environment,” International Journal of Web InformationSystems, vol. 9, no. 1, pp. 69–82, 2013.
[5] B. R. Chang, H.-F. Tsai, C.-M. Chen, and C.-F. Huang, “Analysisof virtualized cloud server together with shared storage andestimation of consolidation ratio and TCO/ROI,” EngineeringComputations, vol. 31, no. 8, pp. 1746–1760, 2014.
[6] C.-C. Lee andC.-P. Chang, “Energy consumption and economicgrowth in Asian economies: a more comprehensive analysisusing panel data,” Resource and Energy Economics, vol. 30, no.1, pp. 50–65, 2008.
[7] P. Zhou, J. Lei, and W. Ye, “Large-scale data sets clusteringbased on MapReduce and Hadoop,” Journal of ComputationalInformation Systems, vol. 7, no. 16, pp. 5956–5963, 2011.
[8] J. K. Chiang, “Authentication, authorization and file synchro-nization for hybrid cloud—the development centric to googleapps, hadoop and linux local hosts,” Journal of Internet Technol-ogy, vol. 14, no. 7, pp. 1141–1148, 2013.
[9] J. Leverich and C. Kozyrakis, “On the energy (in) efficiency ofHadoop clusters,” ACM SIGOPS Operating Systems Review, vol.44, no. 1, pp. 61–65, 2010.
[10] T. White, Hadoop: The Definitive Guide, O’Reilly Media, Sebas-topol, Calif, USA, 2009.
[11] N. Dimiduk, HBase in Action, Manning Publications, Green-wich, UK, 2012.
[12] Y. Jiang, HBase Administration Cookbook, Packt Publishing,Birmingham, UK, 2012.
[13] C. Boja, A. Pocovnicu, and L. Batagan, “Distributed parallelarchitecture for big data,” Informatica Economica, vol. 16, no. 2,pp. 116–127, 2012.
[14] J. Dean and S.Ghemawat, “MapReduce: simplified data process-ing on large clusters,” Communications of the ACM, vol. 51, no.1, pp. 107–113, 2008.
[15] M. Hausenblas and J. Nadeau, “Apache drill: interactive ad-hocanalysis at scale,” Big Data, vol. 1, no. 2, pp. 100–104, 2013.
[16] R.Kuc,Apache Solr 4Cookbook, Packt Publishing, Birmingham,UK, 2013.
[17] T. Grainger and T. Potter, Solr in Action, Manning Publications,Greenwich, UK, 2014.
[18] B. R. Chang, H.-F. Tsai, and C.-M. Chen, “High-performedvirtualization services for in-cloud enterprise resource planningsystem,” Journal of Information Hiding and Multimedia SignalProcessing, vol. 5, no. 4, pp. 614–624, 2014.
[19] B. R. Chang, H.-F. Tsai, and C.-M. Chen, “Evaluation of virtualmachine performance and virtualized consolidation ratio incloud computing system,” Journal of Information Hiding andMultimedia Signal Processing, vol. 4, no. 3, pp. 192–200, 2013.

Submit your manuscripts athttp://www.hindawi.com
Computer Games Technology
International Journal of
Hindawi Publishing Corporationhttp://www.hindawi.com Volume 2014
Hindawi Publishing Corporationhttp://www.hindawi.com Volume 2014
Distributed Sensor Networks
International Journal of
Advances in
FuzzySystems
Hindawi Publishing Corporationhttp://www.hindawi.com
Volume 2014
International Journal of
ReconfigurableComputing
Hindawi Publishing Corporation http://www.hindawi.com Volume 2014
Hindawi Publishing Corporationhttp://www.hindawi.com Volume 2014
Applied Computational Intelligence and Soft Computing
Advances in
Artificial Intelligence
Hindawi Publishing Corporationhttp://www.hindawi.com Volume 2014
Advances inSoftware EngineeringHindawi Publishing Corporationhttp://www.hindawi.com Volume 2014
Hindawi Publishing Corporationhttp://www.hindawi.com Volume 2014
Electrical and Computer Engineering
Journal of
Journal of
Computer Networks and Communications
Hindawi Publishing Corporationhttp://www.hindawi.com Volume 2014
Hindawi Publishing Corporation
http://www.hindawi.com Volume 2014
Advances in
Multimedia
International Journal of
Biomedical Imaging
Hindawi Publishing Corporationhttp://www.hindawi.com Volume 2014
ArtificialNeural Systems
Advances in
Hindawi Publishing Corporationhttp://www.hindawi.com Volume 2014
RoboticsJournal of
Hindawi Publishing Corporationhttp://www.hindawi.com Volume 2014
Hindawi Publishing Corporationhttp://www.hindawi.com Volume 2014
Computational Intelligence and Neuroscience
Industrial EngineeringJournal of
Hindawi Publishing Corporationhttp://www.hindawi.com Volume 2014
Modelling & Simulation in EngineeringHindawi Publishing Corporation http://www.hindawi.com Volume 2014
The Scientific World JournalHindawi Publishing Corporation http://www.hindawi.com Volume 2014
Hindawi Publishing Corporationhttp://www.hindawi.com Volume 2014
Human-ComputerInteraction
Advances in
Computer EngineeringAdvances in
Hindawi Publishing Corporationhttp://www.hindawi.com Volume 2014