Embed Size (px)
Citation preview
Research ArticleCoarse-Grain QoS-Aware Dynamic Instance Provisioning forInteractive Workload in the Cloud
Jianxiong Wan Limin Liu Jie Lv and Zhiwei Xu
School of Information Engineering Inner Mongolia University of Technology Hohhot 010080 China
Correspondence should be addressed to Jianxiong Wan jxwancsnet1cstsinghuaeducn
Received 22 November 2013 Revised 22 January 2014 Accepted 23 January 2014 Published 25 March 2014
Academic Editor Huiping Li
Copyright copy 2014 Jianxiong Wan et al This is an open access article distributed under the Creative Commons Attribution Licensewhich permits unrestricted use distribution and reproduction in any medium provided the original work is properly cited
Cloud computing paradigm renders the Internet service providers (ISPs) with a new approach to deliver their service with less costISPs can rent virtual machines from the Infrastructure-as-a-Service (IaaS) provided by the cloud rather than purchasing them Inaddition commercial cloud providers (CPs) offer diverse VM instance rental services in various time granularities which provideanother opportunity for ISPs to reduce cost We investigate a Coarse-grain QoS-aware Dynamic Instance Provisioning (CDIP)problem for interactive workload in the cloud from the perspective of ISPs We formulate the CDIP problem as an optimizationproblem where the objective is to minimize the VM instance rental cost and the constraint is the percentile delay bound Since theInternet traffic shows a strong self-similar property it is hard to get an analytical form of the percentile delay constraint To addressthis issue we purpose a lookup table structure together with a learning algorithm to estimate the performance of the instanceprovisioning policy This approach is further extended with two function approximations to enhance the scalability of the learningalgorithm We also present an efficient dynamic instance provisioning algorithm which takes full advantage of the rental servicediversity to determine the instance rental policy Extensive simulations are conducted to validate the effectiveness of the proposedalgorithms
1 Introduction
Before the advent of cloud computing Internet serviceproviders (ISPs) used to reserve mass amount of resourcesin order to deal with the peak workload otherwise theservice response time may increase to an intolerable degreewhile facing the flash crowd and greatly degrade the userexperience However this approach is energy-ineffectivesince peak resource utilization is often three times larger thanthe average utilization for a typical ISPThings get even worsein systems that provide interactive service where the averageutilization is only around 10 of the total capacity provi-sioned for the peak load [1]The cloud computing technologyprovides a novel service paradigm called Infrastructure-as-a-Service (IaaS) to reduce the hardware cost and maintenancecost In the IaaS the ISPs only need to rent resource (egvirtual servers and network bandwidths) from the cloudproviders (CPs) instead of purchasing a vast number ofphysical servers themselves The IaaS service enables a moreflexible and effective approach for resource provisioning For
example users in the Amazon EC2 system can rent resourcefor a small period of time to cope with the flash traffic
This paper studies a Coarse-grain Dynamic VirtualMachine (VM) Instance Provisioning (CDIP) problem forinteractive workload subjected to a percentile delay con-straint in the cloud from the perspective of ISPs Morespecifically this problem is related to the dynamic VMrental policy for the ISPs to minimize the resource rentalcost while satisfying QoS constraints A fine-grain (in theorders of seconds or minutes) resource provisioning policymay be more effective in increasing resource utilization andreducing cost but it is more complex and hard to implementFor example the startup phase of a VM instance in EC2which ldquotypically takes less than 10 minutes [2] (observedon November 2nd 2013)rdquo is not sufficient to support thefine-grain control policy Further the fine-grain policy caninduce fluctuation and undermine the system stability CPslike Amazon EC2 nowadays do provide a coarse-grain IaaSservice instead of the fine-grain one For example the EC2system offers IaaS service at 2 time scales At a higher level
Hindawi Publishing CorporationMathematical Problems in EngineeringVolume 2014 Article ID 215016 11 pageshttpdxdoiorg1011552014215016
2 Mathematical Problems in Engineering
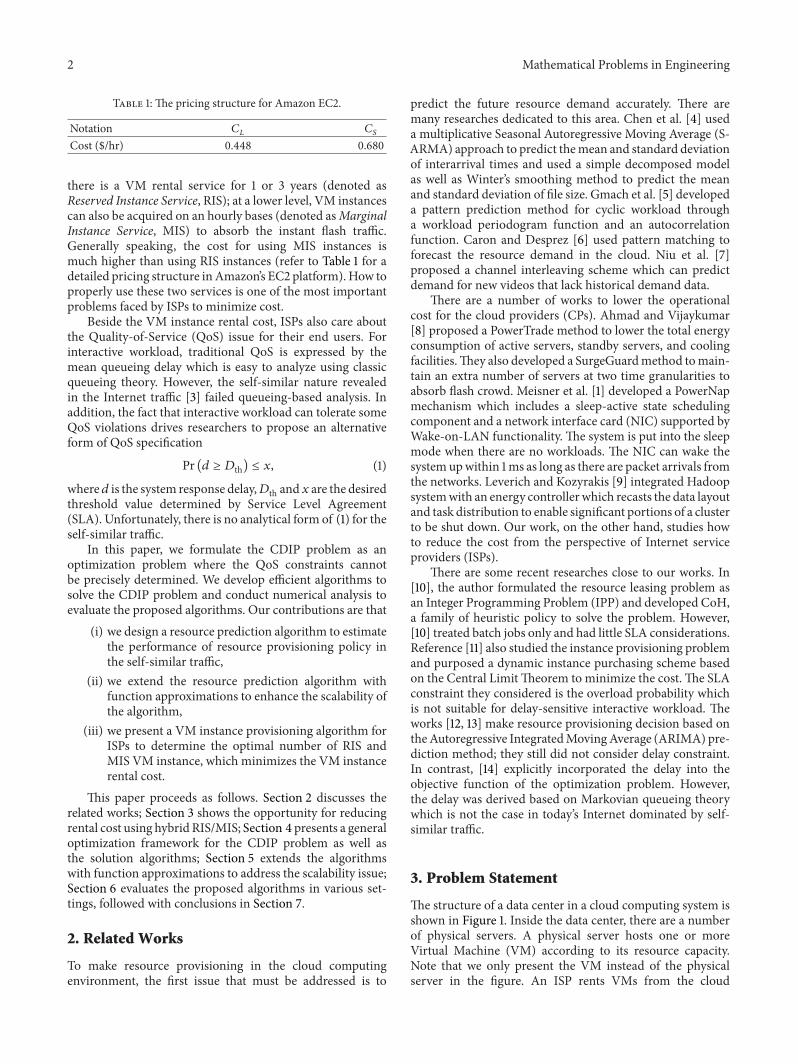
Table 1 The pricing structure for Amazon EC2
Notation 119862119871
119862119878
Cost ($hr) 0448 0680
there is a VM rental service for 1 or 3 years (denoted asReserved Instance Service RIS) at a lower level VM instancescan also be acquired on an hourly bases (denoted asMarginalInstance Service MIS) to absorb the instant flash trafficGenerally speaking the cost for using MIS instances ismuch higher than using RIS instances (refer to Table 1 for adetailed pricing structure inAmazonrsquos EC2 platform)How toproperly use these two services is one of the most importantproblems faced by ISPs to minimize cost
Beside the VM instance rental cost ISPs also care aboutthe Quality-of-Service (QoS) issue for their end users Forinteractive workload traditional QoS is expressed by themean queueing delay which is easy to analyze using classicqueueing theory However the self-similar nature revealedin the Internet traffic [3] failed queueing-based analysis Inaddition the fact that interactive workload can tolerate someQoS violations drives researchers to propose an alternativeform of QoS specification
Pr (119889 ge 119863th) le 119909 (1)
where119889 is the system response delay119863th and119909 are the desiredthreshold value determined by Service Level Agreement(SLA) Unfortunately there is no analytical form of (1) for theself-similar traffic
In this paper we formulate the CDIP problem as anoptimization problem where the QoS constraints cannotbe precisely determined We develop efficient algorithms tosolve the CDIP problem and conduct numerical analysis toevaluate the proposed algorithms Our contributions are that
(i) we design a resource prediction algorithm to estimatethe performance of resource provisioning policy inthe self-similar traffic
(ii) we extend the resource prediction algorithm withfunction approximations to enhance the scalability ofthe algorithm
(iii) we present a VM instance provisioning algorithm forISPs to determine the optimal number of RIS andMIS VM instance which minimizes the VM instancerental cost
This paper proceeds as follows Section 2 discusses therelated works Section 3 shows the opportunity for reducingrental cost using hybrid RISMIS Section 4 presents a generaloptimization framework for the CDIP problem as well asthe solution algorithms Section 5 extends the algorithmswith function approximations to address the scalability issueSection 6 evaluates the proposed algorithms in various set-tings followed with conclusions in Section 7
2 Related Works
To make resource provisioning in the cloud computingenvironment the first issue that must be addressed is to
predict the future resource demand accurately There aremany researches dedicated to this area Chen et al [4] useda multiplicative Seasonal Autoregressive Moving Average (S-ARMA) approach to predict themean and standard deviationof interarrival times and used a simple decomposed modelas well as Winterrsquos smoothing method to predict the meanand standard deviation of file size Gmach et al [5] developeda pattern prediction method for cyclic workload througha workload periodogram function and an autocorrelationfunction Caron and Desprez [6] used pattern matching toforecast the resource demand in the cloud Niu et al [7]proposed a channel interleaving scheme which can predictdemand for new videos that lack historical demand data
There are a number of works to lower the operationalcost for the cloud providers (CPs) Ahmad and Vijaykumar[8] proposed a PowerTrade method to lower the total energyconsumption of active servers standby servers and coolingfacilitiesThey also developed a SurgeGuardmethod tomain-tain an extra number of servers at two time granularities toabsorb flash crowd Meisner et al [1] developed a PowerNapmechanism which includes a sleep-active state schedulingcomponent and a network interface card (NIC) supported byWake-on-LAN functionality The system is put into the sleepmode when there are no workloads The NIC can wake thesystem upwithin 1ms as long as there are packet arrivals fromthe networks Leverich and Kozyrakis [9] integrated Hadoopsystemwith an energy controller which recasts the data layoutand task distribution to enable significant portions of a clusterto be shut down Our work on the other hand studies howto reduce the cost from the perspective of Internet serviceproviders (ISPs)
There are some recent researches close to our works In[10] the author formulated the resource leasing problem asan Integer Programming Problem (IPP) and developed CoHa family of heuristic policy to solve the problem However[10] treated batch jobs only and had little SLA considerationsReference [11] also studied the instance provisioning problemand purposed a dynamic instance purchasing scheme basedon the Central LimitTheorem to minimize the cost The SLAconstraint they considered is the overload probability whichis not suitable for delay-sensitive interactive workload Theworks [12 13] make resource provisioning decision based ontheAutoregressive IntegratedMovingAverage (ARIMA) pre-diction method they still did not consider delay constraintIn contrast [14] explicitly incorporated the delay into theobjective function of the optimization problem Howeverthe delay was derived based on Markovian queueing theorywhich is not the case in todayrsquos Internet dominated by self-similar traffic
3 Problem Statement
The structure of a data center in a cloud computing system isshown in Figure 1 Inside the data center there are a numberof physical servers A physical server hosts one or moreVirtual Machine (VM) according to its resource capacityNote that we only present the VM instead of the physicalserver in the figure An ISP rents VMs from the cloud
Mathematical Problems in Engineering 3
Dat
a cen
ter
Internetservice
provider
Enduser
Figure 1 A data center in the cloud computing system
10
15
9
19
5
23
12
20
25
20
15
10
5
0
1 2 3 4 5 6 7 8
Figure 2 An example of VM instance demand in different hours ofa day
provider serve to its end users To reduce the request responsetime the data center often employs a shared queue structure
The arrival rate of end user varies over time whichinduces a time-changing VM instance demand Figure 2presents an example which divides a day into 8 phases(3 hrphase) and the 119910-axis shows the VM instance demandto ensure the QoS requirement in each phase The marginalrental cost in Amazon EC2 is given in Table 1 From Figure 2we can see that there is a big gap between the maximumand the minimum instance demand If the ISP only uses RISinstance he must acquire 23 instances in order to satisfy thepeak workload appeared in the 6th phase which wastes a lotof resource and rises the daily instance rental cost to 24796$(the rental cost for using only RIS instance can be computedas 23 times 0448 times 24 = 24796$ (the product of the number ofinstance the marginal cost and total 24 hours)) In contrastif the ISP only adoptsMIS instance he will obtain the highestresource utilization and there is an opportunity to reduce thedaily rental cost to 23052$ (from Figure 2 the total numberof MIS instances is 10 + 15 + 9 + 19 + 5 + 23 + 12 + 20 = 113Since a phase contains 3 hours the rental cost for using onlyMIS instance can be computed as 113times 3times 0680 = 23052$)
If the ISP uses a hybrid approach which includes both RISand MIS on the other hand the daily instance rental costcan be remarkably reduced To see that consider a resourceprovisioning policy which rents 10 RIS VM instances andacquires extra MIS instances if RIS instances are insufficientThe number of MIS instance can be formally written as [119870
119894minus
10]+ where 119870
119894denotes the number of VM instance demand
in phase 119894 The daily rental cost for this hybrid approach is18708$ (the rental cost for RIS instance is 10 times 0448 times 24 =
10752$ The total number of MIS instances is 5 + 0 + 9 +
13 + 2 + 10 = 39 therefore the rental cost for MIS instance is39times0680times3 = 7956$Thus the total cost is 10752+7956 =
18708$) which saves 243 and 188 compared with usingpurely RIS and MIS instance respectively
The above analysis suggests 2 assumptions First the QoSperformance in terms of percentile delay can be preciselypredicted second the number of RIS and MIS instances canbe determined to minimize the VM instance rental cost Thefollowing sections explain these two assumptions in detail
4 A General Optimization Framework for theCDIP Problem
The notations used in this paper are shown in Notationssection The CDIP problem can be formulated as
min119896119894 119894isin0119873
1198960times 119873 times 119862
119871+ 119862119878times
119873
sum
119894=1
119896119894
(2)
subject to
Pr (119889119894ge 119863) le 119909 forall119894 isin 1 119873 (3)
where 1198960is the number of RIS instance and 119896
119894 119894 gt 0 is the
number of MIS instance in phase 119894Note that in the CDIP problem the distribution of 119889
119894
is determined by the characteristics of exogenous interactiveworkload arrivals and the number of active VM instance 119896
119894
As stated in Section 1 this problem is hard to solve sincewe can hardly derive an explicit form of constraint (3) Inthis section we will show how to approximately characterizeconstraint (3) and obtain the optimal solution
41 A Learning Algorithm to Characterize the PercentileQoS Constraint in Self-Similar Traffic Algorithm 1 learnsthe performance of various instance provisioning policiesin the form of percentile delay via the stochastic gradientmethod The algorithm first creates a data structure calledVP table (Violation Probability Table) in which each itemVP table[119894][119896] estimates the delay violation probability giventhe number of instance being 119896 in phase 119894 The algorithmruns for several iterations to obtain unbiased delay violationprobability samples p[119894][119896] for each phase 119894 These sampleswhich can be generated via real system running or simu-lation are further smoothed into VP table[119894][119896] ThereforeVP table[119894][119896] is an unbiased estimation of delay violationprobability with 119896VM instances in phase 119894 Variables 120578 119894 and119896 are iteration counter decision point counter and instancenumber counter respectively Algorithm 1 has the followingproperty
4 Mathematical Problems in Engineering
Proposition 1 Algorithm 1 converges to the unbiased estima-tion of percentile QoS performance of using 119896 VM instances inphase 119894
Proof The right-hand side of line 11 in Algorithm 1 can berewritten as
119864 [119894] [119896] =(120578 minus 1) times VP table [119894] [119896] + p [119894] [119896]
120578 (4)
Since p[119894][119896] is an unbiased sample of percentile QoS perfor-mance metric 119864[119894][119896] is the mean value of all samples up toiteration 120578 As long as the end user request arrival process andservice process are stationary stochastic processes in phase 119894with 119896VM instances 119864[119894][119896]must be an unbiased estimationof percentile QoS performance as 120578 rarr infin
In practice it is impossible to let 120578 rarr infin In factAlgorithm 1 converges very fast in our numerical analysis (itconverges within tens of iterations) Alternatively we can alsouse the following equation as the stop criterion
10038161003816100381610038161003816VP table [119894] [119896]120578 minus VP table [119894] [119896]120578minus1
10038161003816100381610038161003816le 119879 forall119894 119896 (5)
where 119879 is a threshold value to get a desired precision
42 The Instance Provisioning Algorithm Based on theVP table we can obtain the minimum number of VMinstances needed to meet the QoS constraints in phase 119894 thatis119870119894 To find the number of RIS instances 119896
0is equal to solve
the following optimization problem
min1198960
119873 times 119862119871times 1198960+
119873
sum
119894=1
[119870119894minus 1198960]+times 119862119878
(6)
subject to
Pr (119889119894(119896119894) ge 119863th) le 119909 (7)
where delay is considered as a function of the number of VMinstances
Problems (6)-(7) are an integer piece-wise function of1198960where the optimal solution must appear in the boundary
points Algorithm 2 provides the solution method for prob-lem (6) It can be divided into three parts as follows
(i) The first part (lines 1ndash8) uses exhaustive searchto obtain the minimum number of VM instancerequired to satisfy QoS constraints The result isstored in vector119870
119894 119894 isin 1 N
(ii) The second part (lines 9ndash17) solves problems (6)-(7) and the result is 119896
0 the optimal number of
RIS instances and the corresponding value of objectfunction119898
(iii) The third part (lines 18ndash20) computes the number ofMIS instances based on119870
119894and 1198960
The worst time complexity of Algorithm 2 is O(119873 times
(MAX NUM minusMIN NUM + 2))
5 Extensions
Algorithms 1 and 2 can effectively predict the number ofinstances needed for satisfying QoS constraints and reducingtotal rental cost for the ISPs However the scalability of thesetwo algorithms is questionable in order to obtain a preciseestimation of the violation probability in VP table we mustvisit all possible instance provisioning policies and get suffi-cient violation probability samples This section starts fromthe point of simplifying VP table by function approximationtechniques to enhance the scalability of Algorithms 1 and 2
The idea of function approximation is to use a function119909 = 119891119894(119870119894) to approximate the mapping between the number
of instances and the violation probability in phase 119894 In thispaper we use two forms of approximation
(i) a linear approximation given by
119909 = 119886119894+ 119887119894119870119894 119887119894lt 0 119909 gt 0 (8)
(ii) a nonlinear approximation given by
119909 = 119886119894times 119870119887119894
119894 119887119894lt 0 (9)
Note that function 119891119894(119870119894) is related to a certain phase 119894
therefore the parameters 119886 and 119887 have a subscript 119894 We havefurther remarks for these function approximations as follows
(1) Intuitively the QoS violation probability decreases asthere aremoreVM instances that is119891
119894is a decreasing
function with respect to 119870119894 therefore 119887
119894must be
negative in the nonlinear case
(2) The value of 119891119894will all be 0 when119870
119894exceeds a certain
threshold since no QoS violations occur if thereis sufficient number of VM instances When usinglinear approximation we should filter out the case119891119894(119870119894) = 0 otherwise the estimation precision will be
remarkably undermined for cases where 119891119894(119870119894) gt 0
We use the least square approach to obtain parameters119886119894and 119887119894in the approximate function 119891
119894 Formally the least
square approach is given by
min119886119894 119887119894
119865 (119886119894 119887119894) =
1
2
119899
sum
119895=1
(119909119895
119894minus 119891119894(119870119895
119894))2
(10)
where 119899 is the amount of samples and 119909119895
119894is the 119895th unbiased
sample for violation probability 119909For the linear approximation the optimal solution should
satisfy
120597119865
120597119886119894
= minus
119899
sum
119895=1
(119909119895
119894minus (119886119894+ 119887119894119870119895
119894)) = 0
120597119865
120597119887119894
= minus
119899
sum
119895=1
(119909119895
119894minus (119886119894+ 119887119894119870119895
119894))119870119895
119894= 0
(11)
Mathematical Problems in Engineering 5
Input 119868119879119864119873 and SLA specification 119863th 119868119879119864 is the number of iterations and119873 is thenumber of decision points in a day
Output VP table(1) Create VP table and initialize each item in VP table to 0(2) Create p[119894][119896] and counter p[119894][119896] is a sample of QoS violation ratio of using 119896 VM
instances in phase 119894 and counter logs the number of delay violations in a phase(3) for 120578 = 1 to 119868119879119864 do(4) for 119894 = 1 to119873 do(5) for 119896 =MIN NUM to MAX NUM do(6) Log response time 119889
119894for each incoming request
(7) if 119889119894gt 119863th then
(8) counter + +(9) end if(10) Calculate an unbiased sample of delay violation probability p[119894][119896] = counter119899120578
119894
where 119899120578119894is the total number of requests arrived in phase 119894 iteration 120578
(11) VP table[119894][119896] larr (120578 minus 1) 120578 times VP table[119894][119896] + (1120578) p[119894][119896] (12) end for Loop 119896
(13) end for Loop 119894
(14) end for Loop 120578
Algorithm 1 The learning Algorithm to characterize the Percentile QoS Constraint
Input VP tableOutput 119896
119894 119894 isin 0 119873 119896
0is the number of RIS instance and 119896
119894 119894 = 0 is the number
of MIS instance in phase 119894(1) for 119894 = 1 to119873 do(2) for 119895 =MIN NUM to MAX NUM do(3) if VP table[119894][119895] le 119909 and VP table[119894][119895 + 1] ge 119909 then(4) 119870
119894= 119895 + 1
(5) break(6) end if(7) end for(8) end for(9) 1198960= 0
(10)119898 = 119873 times 119862119871times 1198960+
119873
sum
119894=1
[119870119894minus 1198960]+times 119862119878
(11) for 119894 = 1 to119873 do(12) 119895 = 119870
119894
(13) temp = 119873 times 119862119871times 119895 +
119873
sum
119894=1
[119870119894minus 119895]+times 119862119878
(14) if temp lt 119898 then(15) 119896
0= 119895
(16) end if(17) end for(18) for 119894 = 1 to119873 do(19) 119896
119894= 119870119894minus 1198960
(20) end for
Algorithm 2 The instance provisioning algorithm
Rearranging these two equations we have
119899119886119894+ 119887119894
119899
sum
119895=1
119870119895
119894=
119899
sum
119895=1
119909119895
119894
119886119894
119899
sum
119895=1
119870119895
119894+ 119887119894
119899
sum
119895=1
(119870119895
119894)2
=
119899
sum
119895=1
119870119895
119894119909119895
119894
(12)
The above analysis suggests
119887119894=
sum119899
119895=1119870119895
119894times sum119899
119895=1119909119895
119894minus 119899sum119899
119895=1119870119895
119894119909119895
119894
(sum119899
119894=1119870119895
119894)2
minus 119899sum119899
119895=1(119870119895
119894)2
119886119894=
sum119899
119895=1119909119895
119894minus 119887119894sum119899
119895=1119870119895
119894
119899
(13)
6 Mathematical Problems in Engineering
(1) for 119894 = 1 to 119871 do(2) Measure 120582
119894 120582119894is the number of request arrivals in time window 119894
(3) 119905119894= 1120582
119894 Estimate the average inter-arrival time in time window 119894
(4) 119860 larr 119860 + 120582119894 119860 logs the accumulative total number of request in this time slot
(5) end for(6) 119905119886= 119871119860 Estimate the average inter-arrival times in the time slot
(7) 120590 = radic
119871
sum
119894=1
120582119894(119905119894minus 119905119886)2 Estimate the standard deviation of inter-arrival time
(8) 119862119860= 120590119905
119886
Algorithm 3 Online estimation of 119862119860
For the nonlinear approximation let 120594 = ln119909 120581119894= ln119870
119894
119860119894= ln 119886
119894 and 119861
119894= 119887119894 and take ldquolnrdquo in both sides of (9)
which transforms the nonlinear approximation into a linearapproximation
120594 = 119860119894+ 119861119894120581119894 (14)
Following the idea of the linear approximation we canobtain the solution for the nonlinear approximation as
119887119894=
sum119899
119895=1ln119870119895
119894times sum119899
119895=1ln119909119895
119894minus 119899sum119899
119895=1ln119870119895
119894ln119909119895
119894
(sum119899
119894=1ln119870119895
119894)2
minus 119899sum119899
119895=1(ln119870119895
119894)2
119886119894= exp
sum119899
119895=1ln119909119895
119894minus 119887119894sum119899
119895=1ln119870119895
119894
119899
(15)
We integrate the function approximations into Algo-rithms 1 and 2 where VP table is replaced by an arrayfunc app[119873] Each item in func app[119873] contains 2 elementsthat is 119886 and 119887 With function approximations some revi-sions are needed for Algorithms 1 and 2 which are shown inTable 5
6 Evaluations
61 Simulation Setup Internet traffic shows a strong self-similar property [3 15] We use the Multiscale Markov-Modulated Poisson Processes (MMPP) model to generatea self-similar like traffic This approach has been provedeffective in previous researches [16ndash18] and was successfullyapplied in the literatures like [19ndash22] We use the approachthe same as in [22] that is a three-dimension Markov on-off modulated Poisson process to generate the interactiveworkload arrivals Consider the following
(i) The first dimension is the workload burst in the orderof 1 secondWe assume that the peakworkload arrivesat the middle of the day that is the 43200th secondtherefore the arrival rate as a function of time can begiven by
120582 (119905) =
5119905
216 + 1000 if 0 le 119905 le 43200
minus5119905
216 + 3000 if 43200 lt 119905 le 86400
(16)
(ii) The second dimension of workload burst is 2000requests per 5 second
(iii) The last dimension of workload burst is 5000 requestsper 10 second
62 Estimation of the Response Time In a production cloudsystem it is impossible to log the response time for eachincoming request to calculate the delay violation probabilityA more practical way is to measure the mean response delay119889 in a small time slot and view 119889 as the response delay forall requests arrived in this time slot This approximation ofresponse delay will be more accurate as the length of the timeslot decreases For example in [23] the length of the time slotis set to 10 minutes In our work we set it to 10 seconds sincewe need to measure delay violation probability in a higherprecision
To estimate the mean response time in a time slot weemploy the Allen-Cunneen approximation formula [24 25]for the 119866119866119898 queueing system
119877 =1
120583+
119875119898
120583 (1 minus 120588)times1198622
119860+ 1198622
119878
2119898 (17)
where 119877 is the average response time 120583 is the average servicerate 120582 is the average arrival rate 120588 = 120582120583119898 is the averageutilization of a server 119898 is the number of servers 119875
119898takes
value from the following formula
119875119898=
120588(119898+1)2
if 120588 le 07
120588119898+ 120588
2 if 120588 gt 07
(18)
119862119860and 119862
119878are the coefficients of variation of request interar-
rival times and service times respectivelyIn this paper we assume a Poisson service process with
120583 = 100 requests per second therefore 119862119878
= 1 In orderto online estimate 119862
119860 we further divide a time slot into 119871
time windows (see Figure 3) The algorithm to estimate 119862119860is
shown in Algorithm 3
63 Result Analysis
631 Cost of Various Instance Provisioning Policies In thisexperiment the length of a phase is set to 1 hr From
Mathematical Problems in Engineering 7
Time
Decisionepoch
Decisionepoch
Decisionepoch
Phase
Time window Time window
Slot
middot middot middot middot middot middotmiddot middot middot
Figure 3The time structure for simulation A day is divided into several phases The delay violation probability is evaluated in each phase Aphase is divided into several slotsThe response delay for each request arrived within a slot is approximated by the mean response delay in thisslot To estimate the mean response delay using the Allen-Cunneen formula a slot is further divided into several time windows to measurethe coefficient of variation of inter-arrival time
Algorithms 1 and 2 we can obtain that the optimal number ofRIS instances is 29 Figure 4 shows the cost of three instanceprovisioning policies Consider the following
(i) In the RIS mode the ISP should rent 37 instances inall hours of a day since the system must satisfy thepeak workload demand This policy yields 408576$per day
(ii) In the MIS mode the ISP makes instances provision-ing decision in each hour according to the predicteddemand therefore the resource utilization is thehighest Unfortunately the total daily cost (51408$)is even higher than the one in the RIS mode
(iii) In the hybrid mode the optimal number of RISinstances is 29 Although in some cases this is a littlewaste of resource the daily cost of this policy is thelowest (360768$)
632 Effects of the Rental Granularity The length of thephase (or interdecision time) in the Amazon EC2 is 1 hourHere we vary the length to 2 and 3 hours to study itsimpact on the daily cost Figure 5 plots the optimal numberof reserved instances in each hour It goes ldquosmootherrdquo as thelength of the interdecision time becomes longer For examplethe numbers of reserved instances for the three rental gran-ularities in time interval [10 15] are 35 36 38 38 36 3535 37 37 37 37 35 and 37 37 37 37 37 37 The meannumbers in time interval [4 6] and [7 9] in the 3 hr granular-ity are 30 and 34 and the counterparts in the 1 hr granularityare 2967 and 33 This implies that the instance provisioningpolicy could be more flexible as the interdecision time goessmall
Figure 6 presents the total cost for three rental granulari-ties It is obvious that the total cost is an increasing functionof the length of the interdecision time However we canalso see that this function is not linear that is the marginalcost is shrinking as the length of the interdecision timegoes smaller In production systems a small interdecisiontime may induce additional system overhead therefore thereshould be a tradeoff between the rental cost and systemoverhead
Figure 7 describes the impacts of rental granularity tothe delay violation probability Using instance provisioningpolicies generated by Algorithms 1 and 2 the target SLAspecification is satisfied in all three rental granularities A
RIS MIS Hybrid
550
500
450
400
350
300
Figure 4 Cost of three instance provisioning policies
1 3 5 7 9 11 13 15 17 19 21 23
1 hour2 hour
3 hour
40
36
32
28
24
Figure 5The optimal number of reserved VM instances for variousrental granularities
Table 2 Means and standard deviations for various rental granular-ities
Rental granularity 1 hour 2hours 3hoursMean 0041215 0041218 0040743
standard deviation 0002773 0003848 0006968
more detailed comparison is provided in Table 2 The meansof delay violation probability in 1 hr granularity and 2 hrgranularity are very close to each other and the one in 3 hrgranularity is relatively small implying that more resourcesare reserved On the other hand the standard deviationof the delay violation probability decreases as the lengthof interdecision time goes smaller Since a small standarddeviation implies a more stable response delay we propose touse 1 hr granularity rental policy in delay- and jitter-sensitiveapplications such as VoIP and video streaming
633 Effects of Function Approximations Here we evaluatethe effectiveness of two function approximation approacheswith 1 hr rental granularity We can obtain parameters 119886 and
8 Mathematical Problems in Engineering
368
366
364
362
360
358
356
1 hour 2 hour 3 hour
Figure 6 Cost for various rental granularities
0055
0045
004
0035
003
0025
1 3 5 7 9 11 13 15 17 19 21 23
1 hour2 hour
3 hour
005
Figure 7 Impacts of rental granularity on the delay violationprobability
119887 using (13) and (15) for all phases which are shown inTable 3 Specifically the results in the first hour are plotted inFigure 8 where we can see that the nonlinear approximationis more accurate than the linear approximation Figure 9shows the estimation of VM instance demands The linearapproximation tends to overestimate the demand by 2ndash4and the nonlinear approximation underestimates the demandby 0-1 Figure 10 shows the delay violation probability Byusing VP table structure the delay violation probability isaround 4 The linear approximation approach reduces thedelay violation probability to about 1 since it reserves moreinstances By contrast the delay violation probabilities in 13phases (out of total 24 phases) exceed the target 5 objectiveThe delay violation probabilities even exceed 9 in the 10thand 16th phases
The basic instance provisioning algorithm makes thebest resource-SLA tradeoff but suffers from the scalabilityproblem The two function approximation approaches onlyneed to estimate two parameters in each phase They visitfewer instance provisioning policies and evade the lookuptable structure (VP table) thus the scalability of Algorithms 1and 2 is enhanced The effectiveness however lies in howwell the function approximates the behavior of VP tableA poor approximation may severely deviate from VP tableand generate a wrong instance provisioning policy whicheither damages the performance or increases the rental costFigures 11 and 12 present the number of RIS instances andtotal daily rental cost We can see that the number of RISinstances in the VP table approach is the same as in the onein the nonlinear approximation approach (29 VMs) Thelinear approximation approach although achieves a lowerdelay violation probability overestimates the VM instancedemand too much (33VMs)
20 25 30 35 40 45 50
0
06
05
04
03
02
01
Number of servers
SLA
vio
latio
n pr
obab
ility
Linear approximationNon-linear approximation
Table-lookup
Figure 8 Function approximations for VP table
1 3 5 7 9 11 13 15 17 19 21 23
41
37
33
29
25
Table-lookupLinear approximation
Non-linear approximation
Figure 9 Impacts of function approximation on the instancedemand estimation
In order to further evaluate the two function approxima-tion approaches define the instance deviation 119863
119898and the
violation probability deviation119863119904as
119863119898=
24
sum
119894=1
100381610038161003816100381610038161003816119870119891
119894minus 119870119894
100381610038161003816100381610038161003816
119863119904=
24
sum
119894=1
100381610038161003816100381610038161003816119904119891
119894minus 119904119894
100381610038161003816100381610038161003816
(19)
where 119870119891
119894and 119904
119891
119894denote the number of rented instances
(including both RIS and MIS instances) and the violationprobability using function approximations and 119870
119894and 119904
119894
denote the same parameters but using the VP table struc-ture Clearly smaller 119863
119898and 119863
119904indicate a more accurate
approximation The results are shown in Table 4 The linearapproximation achieves a lower violation probability at theexpense of a much higher number of instances In additionnonlinear approximation has a lower violation probabilitydeviation Therefore we purpose to use nonlinear approxi-mation in Algorithms 1 and 2
7 Conclusions
Dynamic instance provisioning is a key issue for Internetservice providers in the cloud computing environment Inthis paper we investigate the coarse-grain (in the order ofhours) QoS-aware dynamic instance provisioning problem
Mathematical Problems in Engineering 9
Table 3 Parameters for two function approximation approaches
Decision epoch Linear approximation Nonlinear approximation119886 119887 119886 119887
1 0910558 minus003026 196119864 + 13 minus1036722 117268 minus003832 342119864 + 13 minus1043383 131243 minus004182 623119864 + 13 minus1054444 150093 minus004697 404119864 + 13 minus1031475 146158 minus004394 162119864 + 13 minus9972216 159491 minus004727 368119864 + 12 minus9434357 149158 minus004142 556119864 + 11 minus8767718 157272 minus0043 235119864 + 11 minus8446039 163012 minus004319 116119864 + 11 minus81373210 16601 minus004237 502119864 + 10 minus78478311 175972 minus004396 181119864 + 10 minus74783212 181333 minus004415 670119864 + 09 minus71276413 181285 minus004386 802119864 + 09 minus71765114 175933 minus00437 176119864 + 10 minus7464415 17186 minus004436 401119864 + 10 minus77770916 163952 minus004352 646119864 + 10 minus7981517 158403 minus004322 183119864 + 11 minus83622318 155035 minus004373 120119864 + 12 minus90163919 154785 minus00454 354119864 + 12 minus94187120 138708 minus004119 503119864 + 12 minus96053521 150875 minus004732 856119864 + 13 minus10557522 131375 minus004188 237119864 + 13 minus10236723 116168 minus003787 370119864 + 13 minus10463324 0866371 minus002836 152119864 + 13 minus102863
1 3 5 7 9 11 13 15 17 19 21 23
01
008
006
004
002
Table-lookupLinear approximation
Non-linear approximation
0
Figure 10 Impacts of function approximation on the delay violationprobability
for interactive workload The optimization problem in ourconsideration (see (2)-(3)) is not a traditional optimizationproblem since the QoS constraint (3) has no analytical formfor the self-similar Internet traffic therefore it cannot besolved using classic methods We use various approaches forexample a lookup table and two function approximationsto characterize constraint (3) The lookup table approachsuffers from the scalability issue because in order to obtaina precise estimation of the violation probability in the tablewe must visit all possible instance provisioning policiesand get sufficient violation probability samples In contrastfunction approximations can predict the performance usinga small set of samples Function approximations (especially
34
33
32
31
30
29
28
27
Table-lookup Linearapproximationapproximation
Non-linear
Figure 11 The optimal number of RIS instances
Table 4 The instance deviation and the violation probabilitydeviation for two function approximation approaches
Metric ApproximationsLinear Nonlinear
119863119898
70 14119863119904
0730222 0407333
nonlinear approximation) address the scalability problem atthe expense of a little sacrifice of prediction precision Weconduct extensive simulations to evaluate the effectiveness ofthe proposed dynamic instance provisioning policy
10 Mathematical Problems in Engineering
Table 5 Revisions for Algorithms 1 and 2 with function approximations
Revisions for Algorithm 1 Revisions for Algorithm 2
(i) In line 5 there is no need to test each instanceprovisioning policy in [MIN NUM MAX NUM] Insteadwe can use either approach listed as follows
(1) Define a positive integer variable stepsize which isgreater than 1 and increase 119896 by stepsize rather than 1
(2) Pick a small set of 119896 randomly from [MIN NUMMAX NUM]
(ii) Compute 119886119894and 119887119894using (13) and (15) after line 19
(iii) The output of the algorithm is func app[119873]
(i) The input of the algorithm is func app[119873](ii) The exhausted search approach (lines 2ndash7) is replaced bythe inverse functions of (8) and (9) as follows
(1) For linear approximation case
119870119894= [
119909 minus func app[119894] sdot afunc app[119894] sdot b
]
(2) For nonlinear approximation case
119870119894= [
func app[119894]sdot119887
radic119909
func app[119894] sdot 119886]
where [119909] is the smallest integer no less than 119909
400
390
380
370
360
350
340
330
Table-lookup Linearapproximationapproximation
Non-linear
Figure 12 The daily rental cost
Notations
119873 The number of phases in a day to make instanceprovisioning decisions that is the number of decisionpoints
119870119894 The number of instances needed in phase 119894 to meet theQoS requirement
119862119871 The marginal rental cost for a RIS instance
119862119878 The marginal rental cost for a MIS instance
119889119894 The delay in phase 119894
119863th The threshold delay set by the SLA119909 The threshold violation probability set by
the SLA
Conflict of Interests
The authors declare that there is no conflict of interestsregarding the publication of this paper
Acknowledgments
The work is funded in part by the National Natural ScienceFoundation of China (NSFC) under Grant no 61363052the Inner Mongolia Provincial Natural Science Foundationunder Grant nos 2010MS0913 and 2013MS0920 and theScience Research Project for Inner Mongolia College underGrant nos NJZY14064 and NJZY13120
References
[1] D Meisner B T Gold and T F Wenisch ldquoPowerNap Elimi-nating server idle powerrdquo in Proceedings of the 14th InternationalConference onArchitectural Support for Programming Languagesand Operating Systems (ASPLOS rsquo09) pp 205ndash216 WashingtonDC USA March 2009
[2] ldquoA E instance launch timerdquo httpawsamazoncomec2faqsHowquicklywillsystemsberunning
[3] W E Leland M S Taqqu W Willinger and D V Wilson ldquoOnthe self-similar nature of Ethernet traffic (extended version)rdquoIEEEACM Transactions on Networking vol 2 no 1 pp 1ndash151994
[4] Y Chen A Das W Qin A Sivasubramaniam Q Wang andN Gautam ldquoManaging server energy and operational costsin hosting centersrdquo in Proceedings of the ACM InternationalConference on Measurement and Modeling of Computer Systems(SIGMETRICS) Banff Canada 2005
[5] D Gmach J Rolia L Cherkasova and A Kemper ldquoWorkloadanalysis and demand prediction of enterprise data center appli-cationsrdquo in roceedings of the IEEE 10th International SymposiumonWorkload Characterization (IISWC rsquo07) BostonMass USA2007
[6] E Caron and F Desprez ldquoForecasting for grid and cloudcomputing ondemand resources based on patternmatchingrdquo inProceedings of the 2nd IEEE International Conference on CloudComputing Technology and Science (CloudCom rsquo10) pp 456ndash463 Indianapolis Ind USA 2010
[7] D Niu H Xu B Li and S Zhao ldquoQuality-assured cloudbandwidth auto-scaling for video-on-demand applicationsrdquo inProceedings of the IEEE INFOCOM pp 460ndash468 Orlando FlaUSA 2012
[8] F Ahmad and T N Vijaykumar ldquoJoint optimization of idleand cooling power in data centers while maintaining responsetimerdquo in Proceedings of the 15th International Conference onArchitectural Support for Programming Languages and Operat-ing Systems (ASPLOS rsquo10) pp 243ndash256 March 2010
[9] J Leverich and C Kozyrakis ldquoOn the energy (in)efficiency ofhadoop clustersrdquo ACM SIGOPS Operating Systems Review vol44 no 1 pp 61ndash65
[10] S Shen K Deng A Iosup and D Epema ldquoScheduling jobsin the cloud using on-demand and reserved instancesrdquo inEuro-Par 2013 Parallel Processing vol 8097 of Lecture Notesin Computer Science pp 242ndash254 Springer Berlin Germany2013
[11] W Ming Y Jian and R Yongyi ldquoDynamic instance provi-sioning strategy in an iaas cloudrdquo in Proceedings of the 32nd
Mathematical Problems in Engineering 11
Chinese Control Conference (CCC rsquo13) pp 6670ndash6675 XirsquoanChina 2013
[12] D Deng Z Lu W Fang and J Wu ldquoCloudstreammedia acloud assistant global video on demand leasing schemerdquo inProceedings of the IEEE 10th International Conference on ServicesComputing (SCC rsquo13) pp 486ndash493WashingtonDCUSA 2013
[13] W Fang Z Lu J Wu and Z Cao ldquoRpps a novel resourceprediction and provisioning scheme in cloud data centerrdquo inIEEE Ninth International Conference on Services Computing(SCC rsquo12) pp 609ndash616 Honolulu Hawaii USA 2012
[14] J Jiang J Lu G Zhang and G Long ldquoOptimal cloud resourceauto-scaling for web applicationsrdquo in Proceedings of the 13thIEEEACM International Symposium on Cluster Cloud and GridComputing (CCGrid) pp 58ndash65 Delft The Netherlands 2013
[15] M E Crovella and A Bestavros ldquoSelf-similarity in worldwide web traffic evidence and possible causesrdquo IEEEACMTransactions on Networking vol 5 no 6 pp 835ndash846 1997
[16] T Yoshihara S Kasahara and Y Takahashi ldquoPractical time-scale fitting of self-similar traffic with markov-modulated pois-son processrdquo Telecommunication Systems vol 17 no 1-2 pp185ndash211 2001
[17] P Salvador R Valadas and A Pacheco ldquoMultiscale Fitting Pro-cedure Using Markov Modulated Poisson Processesrdquo Telecom-munication Systems vol 23 no 1-2 pp 123ndash148 2003
[18] A T Andersen and B F Nielsen ldquoA Markovian approachfor modeling packet traffic with long-range dependencerdquo IEEEJournal on Selected Areas in Communications vol 16 no 5 pp719ndash732 1998
[19] M Guazzone C Anglano and M Canonico ldquoExploiting VMmigration for the automated power and performance manage-ment of green cloud computing systemsrdquo in Energy EfficientData Centers vol 7396 of Lecture Notes in Computer Sciencepp 81ndash92 Springer Berlin Germany 2012
[20] D Bruneo ldquoA stochastic model to investigate data centerperformance and qos in iaas cloud computing systemsrdquo IEEETransactions on Parallel and Distributed Systems vol 25 no 3pp 560ndash569 2013
[21] T H Szymanski ldquoLow latency energy efficient communicationsin global-scale cloud computing systemsrdquo in Proceedings of theACM Workshop on Energy Efficient High Performance Paralleland Distributed Computing (EEHDPC rsquo13) pp 13ndash22 2013
[22] J Tai J Zhang J Li W Meleis and N Mi ldquoAra Adaptiveresource allocation for cloud computing environments underbursty workloadsrdquo in Proceedings of the IEEE 30th Interna-tional Performance Computing and Communications Conference(IPCCC rsquo11) pp 1ndash8 2011
[23] Y J Hong J Xue and M Thottethodi ldquoSelective commitmentand selective margin techniques to minimize cost in an iaascloudrdquo in Proceedings of the IEEE International Symposium onPerformance Analysis of Systems and Software (ISPASS rsquo12) pp99ndash109 2012
[24] A O Allen Probability Statistics and Queueing Theory withComputer Science Applications Academic Press Boston MassUSA 1990
[25] G Bolch S Greiner H de Meer and K S Trivedi QueueingNetworks and Markov Chains Wiley-Interscience New YorkNY USA 1998
Submit your manuscripts athttpwwwhindawicom
Hindawi Publishing Corporationhttpwwwhindawicom Volume 2014
MathematicsJournal of
Hindawi Publishing Corporationhttpwwwhindawicom Volume 2014
Mathematical Problems in Engineering
Hindawi Publishing Corporationhttpwwwhindawicom
Differential EquationsInternational Journal of
Volume 2014
Applied MathematicsJournal of
Hindawi Publishing Corporationhttpwwwhindawicom Volume 2014
Probability and StatisticsHindawi Publishing Corporationhttpwwwhindawicom Volume 2014
Journal of
Hindawi Publishing Corporationhttpwwwhindawicom Volume 2014
Mathematical PhysicsAdvances in
Complex AnalysisJournal of
Hindawi Publishing Corporationhttpwwwhindawicom Volume 2014
OptimizationJournal of
Hindawi Publishing Corporationhttpwwwhindawicom Volume 2014
CombinatoricsHindawi Publishing Corporationhttpwwwhindawicom Volume 2014
International Journal of
Hindawi Publishing Corporationhttpwwwhindawicom Volume 2014
Operations ResearchAdvances in
Journal of
Hindawi Publishing Corporationhttpwwwhindawicom Volume 2014
Function Spaces
Abstract and Applied AnalysisHindawi Publishing Corporationhttpwwwhindawicom Volume 2014
International Journal of Mathematics and Mathematical Sciences
Hindawi Publishing Corporationhttpwwwhindawicom Volume 2014
The Scientific World JournalHindawi Publishing Corporation httpwwwhindawicom Volume 2014
Hindawi Publishing Corporationhttpwwwhindawicom Volume 2014
Algebra
Discrete Dynamics in Nature and Society
Hindawi Publishing Corporationhttpwwwhindawicom Volume 2014
Hindawi Publishing Corporationhttpwwwhindawicom Volume 2014
Decision SciencesAdvances in
Discrete MathematicsJournal of
Hindawi Publishing Corporationhttpwwwhindawicom
Volume 2014 Hindawi Publishing Corporationhttpwwwhindawicom Volume 2014
Stochastic AnalysisInternational Journal of
2 Mathematical Problems in Engineering
Table 1 The pricing structure for Amazon EC2
Notation 119862119871
119862119878
Cost ($hr) 0448 0680
there is a VM rental service for 1 or 3 years (denoted asReserved Instance Service RIS) at a lower level VM instancescan also be acquired on an hourly bases (denoted asMarginalInstance Service MIS) to absorb the instant flash trafficGenerally speaking the cost for using MIS instances ismuch higher than using RIS instances (refer to Table 1 for adetailed pricing structure inAmazonrsquos EC2 platform)How toproperly use these two services is one of the most importantproblems faced by ISPs to minimize cost
Beside the VM instance rental cost ISPs also care aboutthe Quality-of-Service (QoS) issue for their end users Forinteractive workload traditional QoS is expressed by themean queueing delay which is easy to analyze using classicqueueing theory However the self-similar nature revealedin the Internet traffic [3] failed queueing-based analysis Inaddition the fact that interactive workload can tolerate someQoS violations drives researchers to propose an alternativeform of QoS specification
Pr (119889 ge 119863th) le 119909 (1)
where119889 is the system response delay119863th and119909 are the desiredthreshold value determined by Service Level Agreement(SLA) Unfortunately there is no analytical form of (1) for theself-similar traffic
In this paper we formulate the CDIP problem as anoptimization problem where the QoS constraints cannotbe precisely determined We develop efficient algorithms tosolve the CDIP problem and conduct numerical analysis toevaluate the proposed algorithms Our contributions are that
(i) we design a resource prediction algorithm to estimatethe performance of resource provisioning policy inthe self-similar traffic
(ii) we extend the resource prediction algorithm withfunction approximations to enhance the scalability ofthe algorithm
(iii) we present a VM instance provisioning algorithm forISPs to determine the optimal number of RIS andMIS VM instance which minimizes the VM instancerental cost
This paper proceeds as follows Section 2 discusses therelated works Section 3 shows the opportunity for reducingrental cost using hybrid RISMIS Section 4 presents a generaloptimization framework for the CDIP problem as well asthe solution algorithms Section 5 extends the algorithmswith function approximations to address the scalability issueSection 6 evaluates the proposed algorithms in various set-tings followed with conclusions in Section 7
2 Related Works
To make resource provisioning in the cloud computingenvironment the first issue that must be addressed is to
predict the future resource demand accurately There aremany researches dedicated to this area Chen et al [4] useda multiplicative Seasonal Autoregressive Moving Average (S-ARMA) approach to predict themean and standard deviationof interarrival times and used a simple decomposed modelas well as Winterrsquos smoothing method to predict the meanand standard deviation of file size Gmach et al [5] developeda pattern prediction method for cyclic workload througha workload periodogram function and an autocorrelationfunction Caron and Desprez [6] used pattern matching toforecast the resource demand in the cloud Niu et al [7]proposed a channel interleaving scheme which can predictdemand for new videos that lack historical demand data
There are a number of works to lower the operationalcost for the cloud providers (CPs) Ahmad and Vijaykumar[8] proposed a PowerTrade method to lower the total energyconsumption of active servers standby servers and coolingfacilitiesThey also developed a SurgeGuardmethod tomain-tain an extra number of servers at two time granularities toabsorb flash crowd Meisner et al [1] developed a PowerNapmechanism which includes a sleep-active state schedulingcomponent and a network interface card (NIC) supported byWake-on-LAN functionality The system is put into the sleepmode when there are no workloads The NIC can wake thesystem upwithin 1ms as long as there are packet arrivals fromthe networks Leverich and Kozyrakis [9] integrated Hadoopsystemwith an energy controller which recasts the data layoutand task distribution to enable significant portions of a clusterto be shut down Our work on the other hand studies howto reduce the cost from the perspective of Internet serviceproviders (ISPs)
There are some recent researches close to our works In[10] the author formulated the resource leasing problem asan Integer Programming Problem (IPP) and developed CoHa family of heuristic policy to solve the problem However[10] treated batch jobs only and had little SLA considerationsReference [11] also studied the instance provisioning problemand purposed a dynamic instance purchasing scheme basedon the Central LimitTheorem to minimize the cost The SLAconstraint they considered is the overload probability whichis not suitable for delay-sensitive interactive workload Theworks [12 13] make resource provisioning decision based ontheAutoregressive IntegratedMovingAverage (ARIMA) pre-diction method they still did not consider delay constraintIn contrast [14] explicitly incorporated the delay into theobjective function of the optimization problem Howeverthe delay was derived based on Markovian queueing theorywhich is not the case in todayrsquos Internet dominated by self-similar traffic
3 Problem Statement
The structure of a data center in a cloud computing system isshown in Figure 1 Inside the data center there are a numberof physical servers A physical server hosts one or moreVirtual Machine (VM) according to its resource capacityNote that we only present the VM instead of the physicalserver in the figure An ISP rents VMs from the cloud
Mathematical Problems in Engineering 3
Dat
a cen
ter
Internetservice
provider
Enduser
Figure 1 A data center in the cloud computing system
10
15
9
19
5
23
12
20
25
20
15
10
5
0
1 2 3 4 5 6 7 8
Figure 2 An example of VM instance demand in different hours ofa day
provider serve to its end users To reduce the request responsetime the data center often employs a shared queue structure
The arrival rate of end user varies over time whichinduces a time-changing VM instance demand Figure 2presents an example which divides a day into 8 phases(3 hrphase) and the 119910-axis shows the VM instance demandto ensure the QoS requirement in each phase The marginalrental cost in Amazon EC2 is given in Table 1 From Figure 2we can see that there is a big gap between the maximumand the minimum instance demand If the ISP only uses RISinstance he must acquire 23 instances in order to satisfy thepeak workload appeared in the 6th phase which wastes a lotof resource and rises the daily instance rental cost to 24796$(the rental cost for using only RIS instance can be computedas 23 times 0448 times 24 = 24796$ (the product of the number ofinstance the marginal cost and total 24 hours)) In contrastif the ISP only adoptsMIS instance he will obtain the highestresource utilization and there is an opportunity to reduce thedaily rental cost to 23052$ (from Figure 2 the total numberof MIS instances is 10 + 15 + 9 + 19 + 5 + 23 + 12 + 20 = 113Since a phase contains 3 hours the rental cost for using onlyMIS instance can be computed as 113times 3times 0680 = 23052$)
If the ISP uses a hybrid approach which includes both RISand MIS on the other hand the daily instance rental costcan be remarkably reduced To see that consider a resourceprovisioning policy which rents 10 RIS VM instances andacquires extra MIS instances if RIS instances are insufficientThe number of MIS instance can be formally written as [119870
119894minus
10]+ where 119870
119894denotes the number of VM instance demand
in phase 119894 The daily rental cost for this hybrid approach is18708$ (the rental cost for RIS instance is 10 times 0448 times 24 =
10752$ The total number of MIS instances is 5 + 0 + 9 +
13 + 2 + 10 = 39 therefore the rental cost for MIS instance is39times0680times3 = 7956$Thus the total cost is 10752+7956 =
18708$) which saves 243 and 188 compared with usingpurely RIS and MIS instance respectively
The above analysis suggests 2 assumptions First the QoSperformance in terms of percentile delay can be preciselypredicted second the number of RIS and MIS instances canbe determined to minimize the VM instance rental cost Thefollowing sections explain these two assumptions in detail
4 A General Optimization Framework for theCDIP Problem
The notations used in this paper are shown in Notationssection The CDIP problem can be formulated as
min119896119894 119894isin0119873
1198960times 119873 times 119862
119871+ 119862119878times
119873
sum
119894=1
119896119894
(2)
subject to
Pr (119889119894ge 119863) le 119909 forall119894 isin 1 119873 (3)
where 1198960is the number of RIS instance and 119896
119894 119894 gt 0 is the
number of MIS instance in phase 119894Note that in the CDIP problem the distribution of 119889
119894
is determined by the characteristics of exogenous interactiveworkload arrivals and the number of active VM instance 119896
119894
As stated in Section 1 this problem is hard to solve sincewe can hardly derive an explicit form of constraint (3) Inthis section we will show how to approximately characterizeconstraint (3) and obtain the optimal solution
41 A Learning Algorithm to Characterize the PercentileQoS Constraint in Self-Similar Traffic Algorithm 1 learnsthe performance of various instance provisioning policiesin the form of percentile delay via the stochastic gradientmethod The algorithm first creates a data structure calledVP table (Violation Probability Table) in which each itemVP table[119894][119896] estimates the delay violation probability giventhe number of instance being 119896 in phase 119894 The algorithmruns for several iterations to obtain unbiased delay violationprobability samples p[119894][119896] for each phase 119894 These sampleswhich can be generated via real system running or simu-lation are further smoothed into VP table[119894][119896] ThereforeVP table[119894][119896] is an unbiased estimation of delay violationprobability with 119896VM instances in phase 119894 Variables 120578 119894 and119896 are iteration counter decision point counter and instancenumber counter respectively Algorithm 1 has the followingproperty
4 Mathematical Problems in Engineering
Proposition 1 Algorithm 1 converges to the unbiased estima-tion of percentile QoS performance of using 119896 VM instances inphase 119894
Proof The right-hand side of line 11 in Algorithm 1 can berewritten as
119864 [119894] [119896] =(120578 minus 1) times VP table [119894] [119896] + p [119894] [119896]
120578 (4)
Since p[119894][119896] is an unbiased sample of percentile QoS perfor-mance metric 119864[119894][119896] is the mean value of all samples up toiteration 120578 As long as the end user request arrival process andservice process are stationary stochastic processes in phase 119894with 119896VM instances 119864[119894][119896]must be an unbiased estimationof percentile QoS performance as 120578 rarr infin
In practice it is impossible to let 120578 rarr infin In factAlgorithm 1 converges very fast in our numerical analysis (itconverges within tens of iterations) Alternatively we can alsouse the following equation as the stop criterion
10038161003816100381610038161003816VP table [119894] [119896]120578 minus VP table [119894] [119896]120578minus1
10038161003816100381610038161003816le 119879 forall119894 119896 (5)
where 119879 is a threshold value to get a desired precision
42 The Instance Provisioning Algorithm Based on theVP table we can obtain the minimum number of VMinstances needed to meet the QoS constraints in phase 119894 thatis119870119894 To find the number of RIS instances 119896
0is equal to solve
the following optimization problem
min1198960
119873 times 119862119871times 1198960+
119873
sum
119894=1
[119870119894minus 1198960]+times 119862119878
(6)
subject to
Pr (119889119894(119896119894) ge 119863th) le 119909 (7)
where delay is considered as a function of the number of VMinstances
Problems (6)-(7) are an integer piece-wise function of1198960where the optimal solution must appear in the boundary
points Algorithm 2 provides the solution method for prob-lem (6) It can be divided into three parts as follows
(i) The first part (lines 1ndash8) uses exhaustive searchto obtain the minimum number of VM instancerequired to satisfy QoS constraints The result isstored in vector119870
119894 119894 isin 1 N
(ii) The second part (lines 9ndash17) solves problems (6)-(7) and the result is 119896
0 the optimal number of
RIS instances and the corresponding value of objectfunction119898
(iii) The third part (lines 18ndash20) computes the number ofMIS instances based on119870
119894and 1198960
The worst time complexity of Algorithm 2 is O(119873 times
(MAX NUM minusMIN NUM + 2))
5 Extensions
Algorithms 1 and 2 can effectively predict the number ofinstances needed for satisfying QoS constraints and reducingtotal rental cost for the ISPs However the scalability of thesetwo algorithms is questionable in order to obtain a preciseestimation of the violation probability in VP table we mustvisit all possible instance provisioning policies and get suffi-cient violation probability samples This section starts fromthe point of simplifying VP table by function approximationtechniques to enhance the scalability of Algorithms 1 and 2
The idea of function approximation is to use a function119909 = 119891119894(119870119894) to approximate the mapping between the number
of instances and the violation probability in phase 119894 In thispaper we use two forms of approximation
(i) a linear approximation given by
119909 = 119886119894+ 119887119894119870119894 119887119894lt 0 119909 gt 0 (8)
(ii) a nonlinear approximation given by
119909 = 119886119894times 119870119887119894
119894 119887119894lt 0 (9)
Note that function 119891119894(119870119894) is related to a certain phase 119894
therefore the parameters 119886 and 119887 have a subscript 119894 We havefurther remarks for these function approximations as follows
(1) Intuitively the QoS violation probability decreases asthere aremoreVM instances that is119891
119894is a decreasing
function with respect to 119870119894 therefore 119887
119894must be
negative in the nonlinear case
(2) The value of 119891119894will all be 0 when119870
119894exceeds a certain
threshold since no QoS violations occur if thereis sufficient number of VM instances When usinglinear approximation we should filter out the case119891119894(119870119894) = 0 otherwise the estimation precision will be
remarkably undermined for cases where 119891119894(119870119894) gt 0
We use the least square approach to obtain parameters119886119894and 119887119894in the approximate function 119891
119894 Formally the least
square approach is given by
min119886119894 119887119894
119865 (119886119894 119887119894) =
1
2
119899
sum
119895=1
(119909119895
119894minus 119891119894(119870119895
119894))2
(10)
where 119899 is the amount of samples and 119909119895
119894is the 119895th unbiased
sample for violation probability 119909For the linear approximation the optimal solution should
satisfy
120597119865
120597119886119894
= minus
119899
sum
119895=1
(119909119895
119894minus (119886119894+ 119887119894119870119895
119894)) = 0
120597119865
120597119887119894
= minus
119899
sum
119895=1
(119909119895
119894minus (119886119894+ 119887119894119870119895
119894))119870119895
119894= 0
(11)
Mathematical Problems in Engineering 5
Input 119868119879119864119873 and SLA specification 119863th 119868119879119864 is the number of iterations and119873 is thenumber of decision points in a day
Output VP table(1) Create VP table and initialize each item in VP table to 0(2) Create p[119894][119896] and counter p[119894][119896] is a sample of QoS violation ratio of using 119896 VM
instances in phase 119894 and counter logs the number of delay violations in a phase(3) for 120578 = 1 to 119868119879119864 do(4) for 119894 = 1 to119873 do(5) for 119896 =MIN NUM to MAX NUM do(6) Log response time 119889
119894for each incoming request
(7) if 119889119894gt 119863th then
(8) counter + +(9) end if(10) Calculate an unbiased sample of delay violation probability p[119894][119896] = counter119899120578
119894
where 119899120578119894is the total number of requests arrived in phase 119894 iteration 120578
(11) VP table[119894][119896] larr (120578 minus 1) 120578 times VP table[119894][119896] + (1120578) p[119894][119896] (12) end for Loop 119896
(13) end for Loop 119894
(14) end for Loop 120578
Algorithm 1 The learning Algorithm to characterize the Percentile QoS Constraint
Input VP tableOutput 119896
119894 119894 isin 0 119873 119896
0is the number of RIS instance and 119896
119894 119894 = 0 is the number
of MIS instance in phase 119894(1) for 119894 = 1 to119873 do(2) for 119895 =MIN NUM to MAX NUM do(3) if VP table[119894][119895] le 119909 and VP table[119894][119895 + 1] ge 119909 then(4) 119870
119894= 119895 + 1
(5) break(6) end if(7) end for(8) end for(9) 1198960= 0
(10)119898 = 119873 times 119862119871times 1198960+
119873
sum
119894=1
[119870119894minus 1198960]+times 119862119878
(11) for 119894 = 1 to119873 do(12) 119895 = 119870
119894
(13) temp = 119873 times 119862119871times 119895 +
119873
sum
119894=1
[119870119894minus 119895]+times 119862119878
(14) if temp lt 119898 then(15) 119896
0= 119895
(16) end if(17) end for(18) for 119894 = 1 to119873 do(19) 119896
119894= 119870119894minus 1198960
(20) end for
Algorithm 2 The instance provisioning algorithm
Rearranging these two equations we have
119899119886119894+ 119887119894
119899
sum
119895=1
119870119895
119894=
119899
sum
119895=1
119909119895
119894
119886119894
119899
sum
119895=1
119870119895
119894+ 119887119894
119899
sum
119895=1
(119870119895
119894)2
=
119899
sum
119895=1
119870119895
119894119909119895
119894
(12)
The above analysis suggests
119887119894=
sum119899
119895=1119870119895
119894times sum119899
119895=1119909119895
119894minus 119899sum119899
119895=1119870119895
119894119909119895
119894
(sum119899
119894=1119870119895
119894)2
minus 119899sum119899
119895=1(119870119895
119894)2
119886119894=
sum119899
119895=1119909119895
119894minus 119887119894sum119899
119895=1119870119895
119894
119899
(13)
6 Mathematical Problems in Engineering
(1) for 119894 = 1 to 119871 do(2) Measure 120582
119894 120582119894is the number of request arrivals in time window 119894
(3) 119905119894= 1120582
119894 Estimate the average inter-arrival time in time window 119894
(4) 119860 larr 119860 + 120582119894 119860 logs the accumulative total number of request in this time slot
(5) end for(6) 119905119886= 119871119860 Estimate the average inter-arrival times in the time slot
(7) 120590 = radic
119871
sum
119894=1
120582119894(119905119894minus 119905119886)2 Estimate the standard deviation of inter-arrival time
(8) 119862119860= 120590119905
119886
Algorithm 3 Online estimation of 119862119860
For the nonlinear approximation let 120594 = ln119909 120581119894= ln119870
119894
119860119894= ln 119886
119894 and 119861
119894= 119887119894 and take ldquolnrdquo in both sides of (9)
which transforms the nonlinear approximation into a linearapproximation
120594 = 119860119894+ 119861119894120581119894 (14)
Following the idea of the linear approximation we canobtain the solution for the nonlinear approximation as
119887119894=
sum119899
119895=1ln119870119895
119894times sum119899
119895=1ln119909119895
119894minus 119899sum119899
119895=1ln119870119895
119894ln119909119895
119894
(sum119899
119894=1ln119870119895
119894)2
minus 119899sum119899
119895=1(ln119870119895
119894)2
119886119894= exp
sum119899
119895=1ln119909119895
119894minus 119887119894sum119899
119895=1ln119870119895
119894
119899
(15)
We integrate the function approximations into Algo-rithms 1 and 2 where VP table is replaced by an arrayfunc app[119873] Each item in func app[119873] contains 2 elementsthat is 119886 and 119887 With function approximations some revi-sions are needed for Algorithms 1 and 2 which are shown inTable 5
6 Evaluations
61 Simulation Setup Internet traffic shows a strong self-similar property [3 15] We use the Multiscale Markov-Modulated Poisson Processes (MMPP) model to generatea self-similar like traffic This approach has been provedeffective in previous researches [16ndash18] and was successfullyapplied in the literatures like [19ndash22] We use the approachthe same as in [22] that is a three-dimension Markov on-off modulated Poisson process to generate the interactiveworkload arrivals Consider the following
(i) The first dimension is the workload burst in the orderof 1 secondWe assume that the peakworkload arrivesat the middle of the day that is the 43200th secondtherefore the arrival rate as a function of time can begiven by
120582 (119905) =
5119905
216 + 1000 if 0 le 119905 le 43200
minus5119905
216 + 3000 if 43200 lt 119905 le 86400
(16)
(ii) The second dimension of workload burst is 2000requests per 5 second
(iii) The last dimension of workload burst is 5000 requestsper 10 second
62 Estimation of the Response Time In a production cloudsystem it is impossible to log the response time for eachincoming request to calculate the delay violation probabilityA more practical way is to measure the mean response delay119889 in a small time slot and view 119889 as the response delay forall requests arrived in this time slot This approximation ofresponse delay will be more accurate as the length of the timeslot decreases For example in [23] the length of the time slotis set to 10 minutes In our work we set it to 10 seconds sincewe need to measure delay violation probability in a higherprecision
To estimate the mean response time in a time slot weemploy the Allen-Cunneen approximation formula [24 25]for the 119866119866119898 queueing system
119877 =1
120583+
119875119898
120583 (1 minus 120588)times1198622
119860+ 1198622
119878
2119898 (17)
where 119877 is the average response time 120583 is the average servicerate 120582 is the average arrival rate 120588 = 120582120583119898 is the averageutilization of a server 119898 is the number of servers 119875
119898takes
value from the following formula
119875119898=
120588(119898+1)2
if 120588 le 07
120588119898+ 120588
2 if 120588 gt 07
(18)
119862119860and 119862
119878are the coefficients of variation of request interar-
rival times and service times respectivelyIn this paper we assume a Poisson service process with
120583 = 100 requests per second therefore 119862119878
= 1 In orderto online estimate 119862
119860 we further divide a time slot into 119871
time windows (see Figure 3) The algorithm to estimate 119862119860is
shown in Algorithm 3
63 Result Analysis
631 Cost of Various Instance Provisioning Policies In thisexperiment the length of a phase is set to 1 hr From
Mathematical Problems in Engineering 7
Time
Decisionepoch
Decisionepoch
Decisionepoch
Phase
Time window Time window
Slot
middot middot middot middot middot middotmiddot middot middot
Figure 3The time structure for simulation A day is divided into several phases The delay violation probability is evaluated in each phase Aphase is divided into several slotsThe response delay for each request arrived within a slot is approximated by the mean response delay in thisslot To estimate the mean response delay using the Allen-Cunneen formula a slot is further divided into several time windows to measurethe coefficient of variation of inter-arrival time
Algorithms 1 and 2 we can obtain that the optimal number ofRIS instances is 29 Figure 4 shows the cost of three instanceprovisioning policies Consider the following
(i) In the RIS mode the ISP should rent 37 instances inall hours of a day since the system must satisfy thepeak workload demand This policy yields 408576$per day
(ii) In the MIS mode the ISP makes instances provision-ing decision in each hour according to the predicteddemand therefore the resource utilization is thehighest Unfortunately the total daily cost (51408$)is even higher than the one in the RIS mode
(iii) In the hybrid mode the optimal number of RISinstances is 29 Although in some cases this is a littlewaste of resource the daily cost of this policy is thelowest (360768$)
632 Effects of the Rental Granularity The length of thephase (or interdecision time) in the Amazon EC2 is 1 hourHere we vary the length to 2 and 3 hours to study itsimpact on the daily cost Figure 5 plots the optimal numberof reserved instances in each hour It goes ldquosmootherrdquo as thelength of the interdecision time becomes longer For examplethe numbers of reserved instances for the three rental gran-ularities in time interval [10 15] are 35 36 38 38 36 3535 37 37 37 37 35 and 37 37 37 37 37 37 The meannumbers in time interval [4 6] and [7 9] in the 3 hr granular-ity are 30 and 34 and the counterparts in the 1 hr granularityare 2967 and 33 This implies that the instance provisioningpolicy could be more flexible as the interdecision time goessmall
Figure 6 presents the total cost for three rental granulari-ties It is obvious that the total cost is an increasing functionof the length of the interdecision time However we canalso see that this function is not linear that is the marginalcost is shrinking as the length of the interdecision timegoes smaller In production systems a small interdecisiontime may induce additional system overhead therefore thereshould be a tradeoff between the rental cost and systemoverhead
Figure 7 describes the impacts of rental granularity tothe delay violation probability Using instance provisioningpolicies generated by Algorithms 1 and 2 the target SLAspecification is satisfied in all three rental granularities A
RIS MIS Hybrid
550
500
450
400
350
300
Figure 4 Cost of three instance provisioning policies
1 3 5 7 9 11 13 15 17 19 21 23
1 hour2 hour
3 hour
40
36
32
28
24
Figure 5The optimal number of reserved VM instances for variousrental granularities
Table 2 Means and standard deviations for various rental granular-ities
Rental granularity 1 hour 2hours 3hoursMean 0041215 0041218 0040743
standard deviation 0002773 0003848 0006968
more detailed comparison is provided in Table 2 The meansof delay violation probability in 1 hr granularity and 2 hrgranularity are very close to each other and the one in 3 hrgranularity is relatively small implying that more resourcesare reserved On the other hand the standard deviationof the delay violation probability decreases as the lengthof interdecision time goes smaller Since a small standarddeviation implies a more stable response delay we propose touse 1 hr granularity rental policy in delay- and jitter-sensitiveapplications such as VoIP and video streaming
633 Effects of Function Approximations Here we evaluatethe effectiveness of two function approximation approacheswith 1 hr rental granularity We can obtain parameters 119886 and
8 Mathematical Problems in Engineering
368
366
364
362
360
358
356
1 hour 2 hour 3 hour
Figure 6 Cost for various rental granularities
0055
0045
004
0035
003
0025
1 3 5 7 9 11 13 15 17 19 21 23
1 hour2 hour
3 hour
005
Figure 7 Impacts of rental granularity on the delay violationprobability
119887 using (13) and (15) for all phases which are shown inTable 3 Specifically the results in the first hour are plotted inFigure 8 where we can see that the nonlinear approximationis more accurate than the linear approximation Figure 9shows the estimation of VM instance demands The linearapproximation tends to overestimate the demand by 2ndash4and the nonlinear approximation underestimates the demandby 0-1 Figure 10 shows the delay violation probability Byusing VP table structure the delay violation probability isaround 4 The linear approximation approach reduces thedelay violation probability to about 1 since it reserves moreinstances By contrast the delay violation probabilities in 13phases (out of total 24 phases) exceed the target 5 objectiveThe delay violation probabilities even exceed 9 in the 10thand 16th phases
The basic instance provisioning algorithm makes thebest resource-SLA tradeoff but suffers from the scalabilityproblem The two function approximation approaches onlyneed to estimate two parameters in each phase They visitfewer instance provisioning policies and evade the lookuptable structure (VP table) thus the scalability of Algorithms 1and 2 is enhanced The effectiveness however lies in howwell the function approximates the behavior of VP tableA poor approximation may severely deviate from VP tableand generate a wrong instance provisioning policy whicheither damages the performance or increases the rental costFigures 11 and 12 present the number of RIS instances andtotal daily rental cost We can see that the number of RISinstances in the VP table approach is the same as in the onein the nonlinear approximation approach (29 VMs) Thelinear approximation approach although achieves a lowerdelay violation probability overestimates the VM instancedemand too much (33VMs)
20 25 30 35 40 45 50
0
06
05
04
03
02
01
Number of servers
SLA
vio
latio
n pr
obab
ility
Linear approximationNon-linear approximation
Table-lookup
Figure 8 Function approximations for VP table
1 3 5 7 9 11 13 15 17 19 21 23
41
37
33
29
25
Table-lookupLinear approximation
Non-linear approximation
Figure 9 Impacts of function approximation on the instancedemand estimation
In order to further evaluate the two function approxima-tion approaches define the instance deviation 119863
119898and the
violation probability deviation119863119904as
119863119898=
24
sum
119894=1
100381610038161003816100381610038161003816119870119891
119894minus 119870119894
100381610038161003816100381610038161003816
119863119904=
24
sum
119894=1
100381610038161003816100381610038161003816119904119891
119894minus 119904119894
100381610038161003816100381610038161003816
(19)
where 119870119891
119894and 119904
119891
119894denote the number of rented instances
(including both RIS and MIS instances) and the violationprobability using function approximations and 119870
119894and 119904
119894
denote the same parameters but using the VP table struc-ture Clearly smaller 119863
119898and 119863
119904indicate a more accurate
approximation The results are shown in Table 4 The linearapproximation achieves a lower violation probability at theexpense of a much higher number of instances In additionnonlinear approximation has a lower violation probabilitydeviation Therefore we purpose to use nonlinear approxi-mation in Algorithms 1 and 2
7 Conclusions
Dynamic instance provisioning is a key issue for Internetservice providers in the cloud computing environment Inthis paper we investigate the coarse-grain (in the order ofhours) QoS-aware dynamic instance provisioning problem
Mathematical Problems in Engineering 9
Table 3 Parameters for two function approximation approaches
Decision epoch Linear approximation Nonlinear approximation119886 119887 119886 119887
1 0910558 minus003026 196119864 + 13 minus1036722 117268 minus003832 342119864 + 13 minus1043383 131243 minus004182 623119864 + 13 minus1054444 150093 minus004697 404119864 + 13 minus1031475 146158 minus004394 162119864 + 13 minus9972216 159491 minus004727 368119864 + 12 minus9434357 149158 minus004142 556119864 + 11 minus8767718 157272 minus0043 235119864 + 11 minus8446039 163012 minus004319 116119864 + 11 minus81373210 16601 minus004237 502119864 + 10 minus78478311 175972 minus004396 181119864 + 10 minus74783212 181333 minus004415 670119864 + 09 minus71276413 181285 minus004386 802119864 + 09 minus71765114 175933 minus00437 176119864 + 10 minus7464415 17186 minus004436 401119864 + 10 minus77770916 163952 minus004352 646119864 + 10 minus7981517 158403 minus004322 183119864 + 11 minus83622318 155035 minus004373 120119864 + 12 minus90163919 154785 minus00454 354119864 + 12 minus94187120 138708 minus004119 503119864 + 12 minus96053521 150875 minus004732 856119864 + 13 minus10557522 131375 minus004188 237119864 + 13 minus10236723 116168 minus003787 370119864 + 13 minus10463324 0866371 minus002836 152119864 + 13 minus102863
1 3 5 7 9 11 13 15 17 19 21 23
01
008
006
004
002
Table-lookupLinear approximation
Non-linear approximation
0
Figure 10 Impacts of function approximation on the delay violationprobability
for interactive workload The optimization problem in ourconsideration (see (2)-(3)) is not a traditional optimizationproblem since the QoS constraint (3) has no analytical formfor the self-similar Internet traffic therefore it cannot besolved using classic methods We use various approaches forexample a lookup table and two function approximationsto characterize constraint (3) The lookup table approachsuffers from the scalability issue because in order to obtaina precise estimation of the violation probability in the tablewe must visit all possible instance provisioning policiesand get sufficient violation probability samples In contrastfunction approximations can predict the performance usinga small set of samples Function approximations (especially
34
33
32
31
30
29
28
27
Table-lookup Linearapproximationapproximation
Non-linear
Figure 11 The optimal number of RIS instances
Table 4 The instance deviation and the violation probabilitydeviation for two function approximation approaches
Metric ApproximationsLinear Nonlinear
119863119898
70 14119863119904
0730222 0407333
nonlinear approximation) address the scalability problem atthe expense of a little sacrifice of prediction precision Weconduct extensive simulations to evaluate the effectiveness ofthe proposed dynamic instance provisioning policy
10 Mathematical Problems in Engineering
Table 5 Revisions for Algorithms 1 and 2 with function approximations
Revisions for Algorithm 1 Revisions for Algorithm 2
(i) In line 5 there is no need to test each instanceprovisioning policy in [MIN NUM MAX NUM] Insteadwe can use either approach listed as follows
(1) Define a positive integer variable stepsize which isgreater than 1 and increase 119896 by stepsize rather than 1
(2) Pick a small set of 119896 randomly from [MIN NUMMAX NUM]
(ii) Compute 119886119894and 119887119894using (13) and (15) after line 19
(iii) The output of the algorithm is func app[119873]
(i) The input of the algorithm is func app[119873](ii) The exhausted search approach (lines 2ndash7) is replaced bythe inverse functions of (8) and (9) as follows
(1) For linear approximation case
119870119894= [
119909 minus func app[119894] sdot afunc app[119894] sdot b
]
(2) For nonlinear approximation case
119870119894= [
func app[119894]sdot119887
radic119909
func app[119894] sdot 119886]
where [119909] is the smallest integer no less than 119909
400
390
380
370
360
350
340
330
Table-lookup Linearapproximationapproximation
Non-linear
Figure 12 The daily rental cost
Notations
119873 The number of phases in a day to make instanceprovisioning decisions that is the number of decisionpoints
119870119894 The number of instances needed in phase 119894 to meet theQoS requirement
119862119871 The marginal rental cost for a RIS instance
119862119878 The marginal rental cost for a MIS instance
119889119894 The delay in phase 119894
119863th The threshold delay set by the SLA119909 The threshold violation probability set by
the SLA
Conflict of Interests
The authors declare that there is no conflict of interestsregarding the publication of this paper
Acknowledgments
The work is funded in part by the National Natural ScienceFoundation of China (NSFC) under Grant no 61363052the Inner Mongolia Provincial Natural Science Foundationunder Grant nos 2010MS0913 and 2013MS0920 and theScience Research Project for Inner Mongolia College underGrant nos NJZY14064 and NJZY13120
References
[1] D Meisner B T Gold and T F Wenisch ldquoPowerNap Elimi-nating server idle powerrdquo in Proceedings of the 14th InternationalConference onArchitectural Support for Programming Languagesand Operating Systems (ASPLOS rsquo09) pp 205ndash216 WashingtonDC USA March 2009
[2] ldquoA E instance launch timerdquo httpawsamazoncomec2faqsHowquicklywillsystemsberunning
[3] W E Leland M S Taqqu W Willinger and D V Wilson ldquoOnthe self-similar nature of Ethernet traffic (extended version)rdquoIEEEACM Transactions on Networking vol 2 no 1 pp 1ndash151994
[4] Y Chen A Das W Qin A Sivasubramaniam Q Wang andN Gautam ldquoManaging server energy and operational costsin hosting centersrdquo in Proceedings of the ACM InternationalConference on Measurement and Modeling of Computer Systems(SIGMETRICS) Banff Canada 2005
[5] D Gmach J Rolia L Cherkasova and A Kemper ldquoWorkloadanalysis and demand prediction of enterprise data center appli-cationsrdquo in roceedings of the IEEE 10th International SymposiumonWorkload Characterization (IISWC rsquo07) BostonMass USA2007
[6] E Caron and F Desprez ldquoForecasting for grid and cloudcomputing ondemand resources based on patternmatchingrdquo inProceedings of the 2nd IEEE International Conference on CloudComputing Technology and Science (CloudCom rsquo10) pp 456ndash463 Indianapolis Ind USA 2010
[7] D Niu H Xu B Li and S Zhao ldquoQuality-assured cloudbandwidth auto-scaling for video-on-demand applicationsrdquo inProceedings of the IEEE INFOCOM pp 460ndash468 Orlando FlaUSA 2012
[8] F Ahmad and T N Vijaykumar ldquoJoint optimization of idleand cooling power in data centers while maintaining responsetimerdquo in Proceedings of the 15th International Conference onArchitectural Support for Programming Languages and Operat-ing Systems (ASPLOS rsquo10) pp 243ndash256 March 2010
[9] J Leverich and C Kozyrakis ldquoOn the energy (in)efficiency ofhadoop clustersrdquo ACM SIGOPS Operating Systems Review vol44 no 1 pp 61ndash65
[10] S Shen K Deng A Iosup and D Epema ldquoScheduling jobsin the cloud using on-demand and reserved instancesrdquo inEuro-Par 2013 Parallel Processing vol 8097 of Lecture Notesin Computer Science pp 242ndash254 Springer Berlin Germany2013
[11] W Ming Y Jian and R Yongyi ldquoDynamic instance provi-sioning strategy in an iaas cloudrdquo in Proceedings of the 32nd
Mathematical Problems in Engineering 11
Chinese Control Conference (CCC rsquo13) pp 6670ndash6675 XirsquoanChina 2013
[12] D Deng Z Lu W Fang and J Wu ldquoCloudstreammedia acloud assistant global video on demand leasing schemerdquo inProceedings of the IEEE 10th International Conference on ServicesComputing (SCC rsquo13) pp 486ndash493WashingtonDCUSA 2013
[13] W Fang Z Lu J Wu and Z Cao ldquoRpps a novel resourceprediction and provisioning scheme in cloud data centerrdquo inIEEE Ninth International Conference on Services Computing(SCC rsquo12) pp 609ndash616 Honolulu Hawaii USA 2012
[14] J Jiang J Lu G Zhang and G Long ldquoOptimal cloud resourceauto-scaling for web applicationsrdquo in Proceedings of the 13thIEEEACM International Symposium on Cluster Cloud and GridComputing (CCGrid) pp 58ndash65 Delft The Netherlands 2013
[15] M E Crovella and A Bestavros ldquoSelf-similarity in worldwide web traffic evidence and possible causesrdquo IEEEACMTransactions on Networking vol 5 no 6 pp 835ndash846 1997
[16] T Yoshihara S Kasahara and Y Takahashi ldquoPractical time-scale fitting of self-similar traffic with markov-modulated pois-son processrdquo Telecommunication Systems vol 17 no 1-2 pp185ndash211 2001
[17] P Salvador R Valadas and A Pacheco ldquoMultiscale Fitting Pro-cedure Using Markov Modulated Poisson Processesrdquo Telecom-munication Systems vol 23 no 1-2 pp 123ndash148 2003
[18] A T Andersen and B F Nielsen ldquoA Markovian approachfor modeling packet traffic with long-range dependencerdquo IEEEJournal on Selected Areas in Communications vol 16 no 5 pp719ndash732 1998
[19] M Guazzone C Anglano and M Canonico ldquoExploiting VMmigration for the automated power and performance manage-ment of green cloud computing systemsrdquo in Energy EfficientData Centers vol 7396 of Lecture Notes in Computer Sciencepp 81ndash92 Springer Berlin Germany 2012
[20] D Bruneo ldquoA stochastic model to investigate data centerperformance and qos in iaas cloud computing systemsrdquo IEEETransactions on Parallel and Distributed Systems vol 25 no 3pp 560ndash569 2013
[21] T H Szymanski ldquoLow latency energy efficient communicationsin global-scale cloud computing systemsrdquo in Proceedings of theACM Workshop on Energy Efficient High Performance Paralleland Distributed Computing (EEHDPC rsquo13) pp 13ndash22 2013
[22] J Tai J Zhang J Li W Meleis and N Mi ldquoAra Adaptiveresource allocation for cloud computing environments underbursty workloadsrdquo in Proceedings of the IEEE 30th Interna-tional Performance Computing and Communications Conference(IPCCC rsquo11) pp 1ndash8 2011
[23] Y J Hong J Xue and M Thottethodi ldquoSelective commitmentand selective margin techniques to minimize cost in an iaascloudrdquo in Proceedings of the IEEE International Symposium onPerformance Analysis of Systems and Software (ISPASS rsquo12) pp99ndash109 2012
[24] A O Allen Probability Statistics and Queueing Theory withComputer Science Applications Academic Press Boston MassUSA 1990
[25] G Bolch S Greiner H de Meer and K S Trivedi QueueingNetworks and Markov Chains Wiley-Interscience New YorkNY USA 1998
Submit your manuscripts athttpwwwhindawicom
Hindawi Publishing Corporationhttpwwwhindawicom Volume 2014
MathematicsJournal of
Hindawi Publishing Corporationhttpwwwhindawicom Volume 2014
Mathematical Problems in Engineering
Hindawi Publishing Corporationhttpwwwhindawicom
Differential EquationsInternational Journal of
Volume 2014
Applied MathematicsJournal of
Hindawi Publishing Corporationhttpwwwhindawicom Volume 2014
Probability and StatisticsHindawi Publishing Corporationhttpwwwhindawicom Volume 2014
Journal of
Hindawi Publishing Corporationhttpwwwhindawicom Volume 2014
Mathematical PhysicsAdvances in
Complex AnalysisJournal of
Hindawi Publishing Corporationhttpwwwhindawicom Volume 2014
OptimizationJournal of
Hindawi Publishing Corporationhttpwwwhindawicom Volume 2014
CombinatoricsHindawi Publishing Corporationhttpwwwhindawicom Volume 2014
International Journal of
Hindawi Publishing Corporationhttpwwwhindawicom Volume 2014
Operations ResearchAdvances in
Journal of
Hindawi Publishing Corporationhttpwwwhindawicom Volume 2014
Function Spaces
Abstract and Applied AnalysisHindawi Publishing Corporationhttpwwwhindawicom Volume 2014
International Journal of Mathematics and Mathematical Sciences
Hindawi Publishing Corporationhttpwwwhindawicom Volume 2014
The Scientific World JournalHindawi Publishing Corporation httpwwwhindawicom Volume 2014
Hindawi Publishing Corporationhttpwwwhindawicom Volume 2014
Algebra
Discrete Dynamics in Nature and Society
Hindawi Publishing Corporationhttpwwwhindawicom Volume 2014
Hindawi Publishing Corporationhttpwwwhindawicom Volume 2014
Decision SciencesAdvances in
Discrete MathematicsJournal of
Hindawi Publishing Corporationhttpwwwhindawicom
Volume 2014 Hindawi Publishing Corporationhttpwwwhindawicom Volume 2014
Stochastic AnalysisInternational Journal of
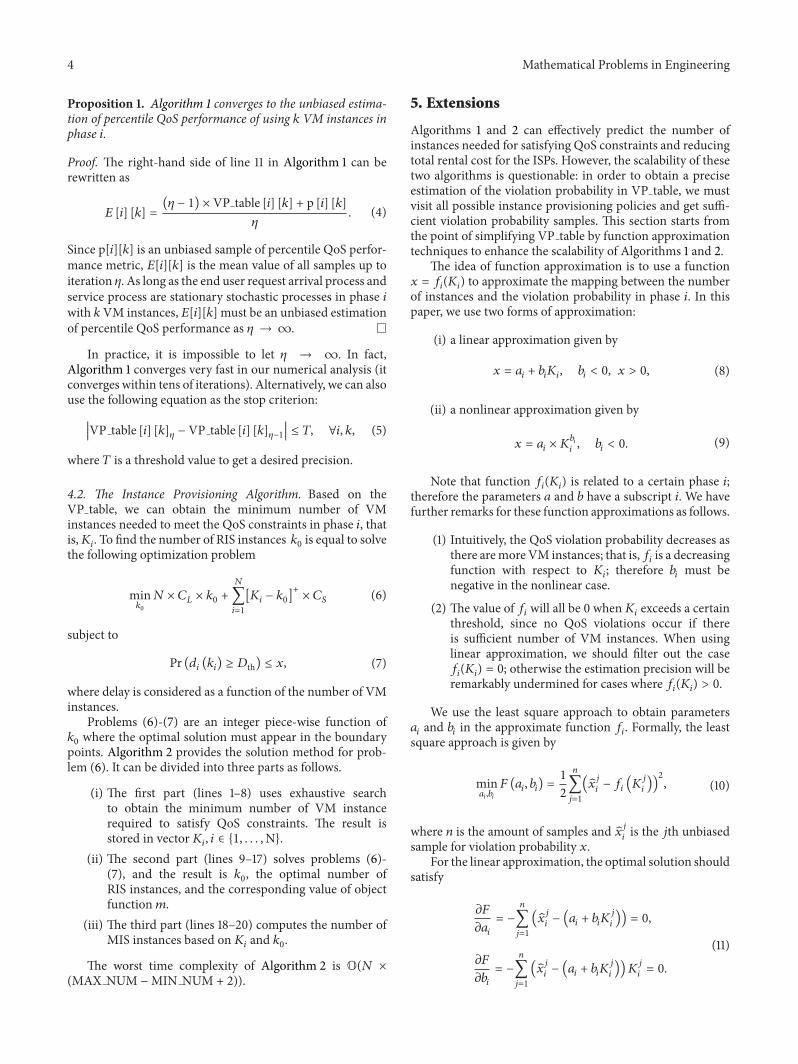
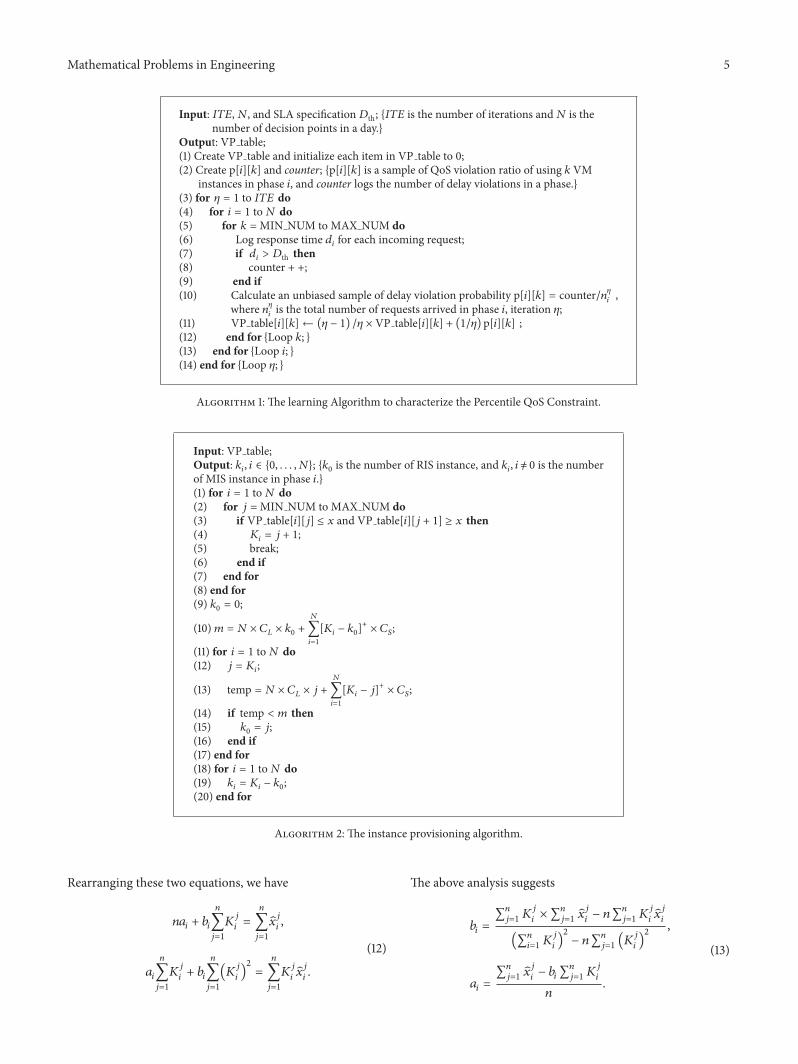
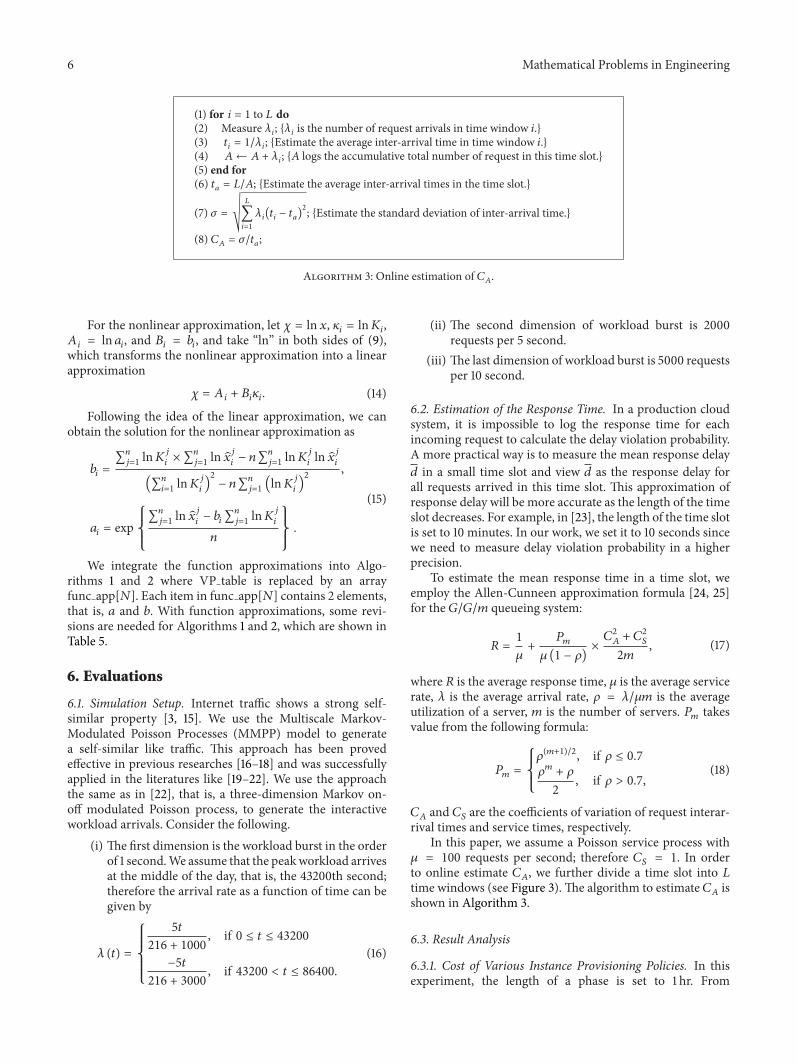
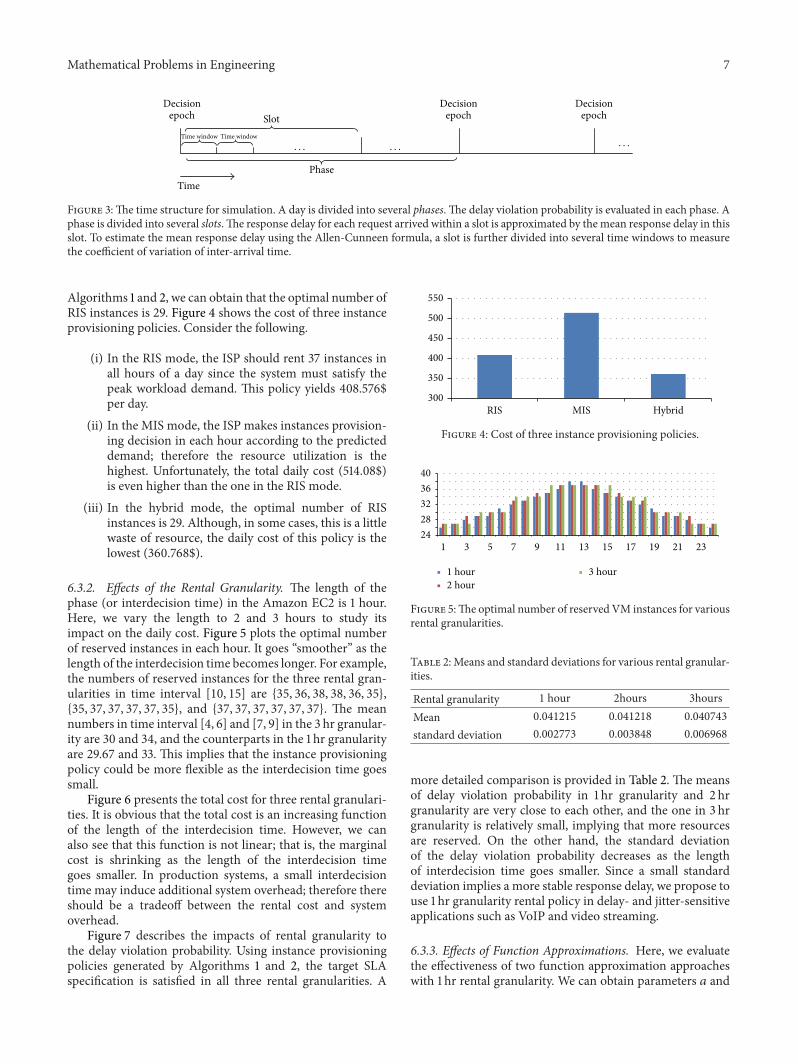
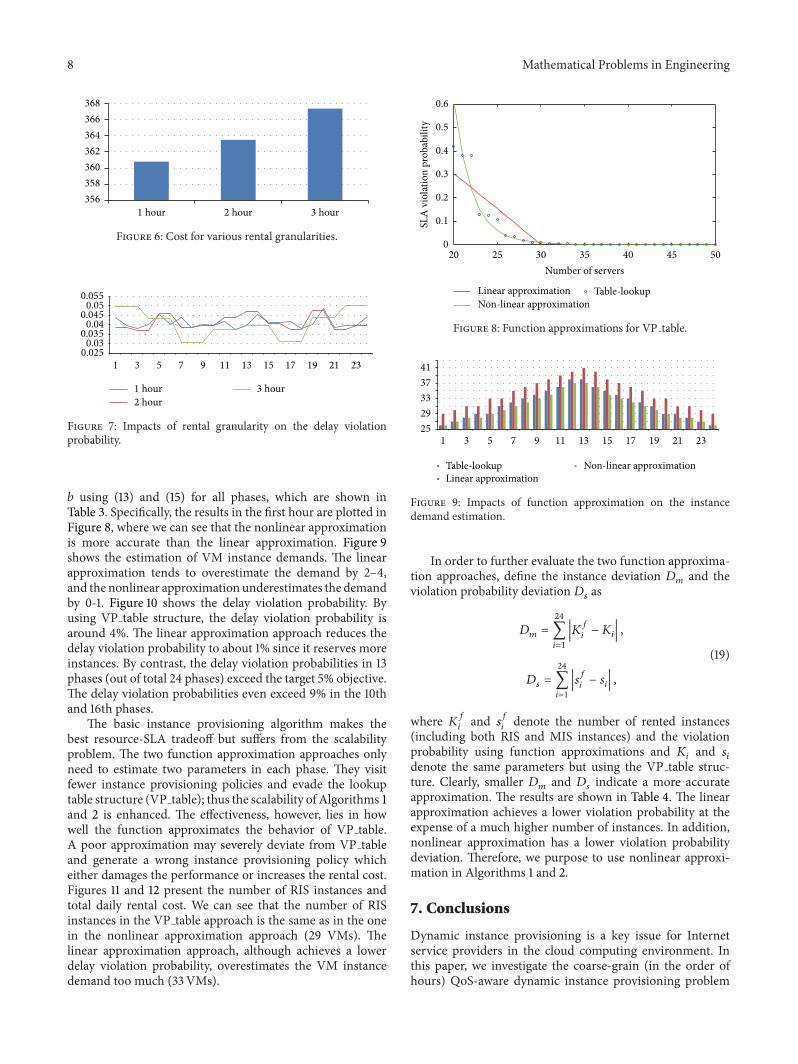
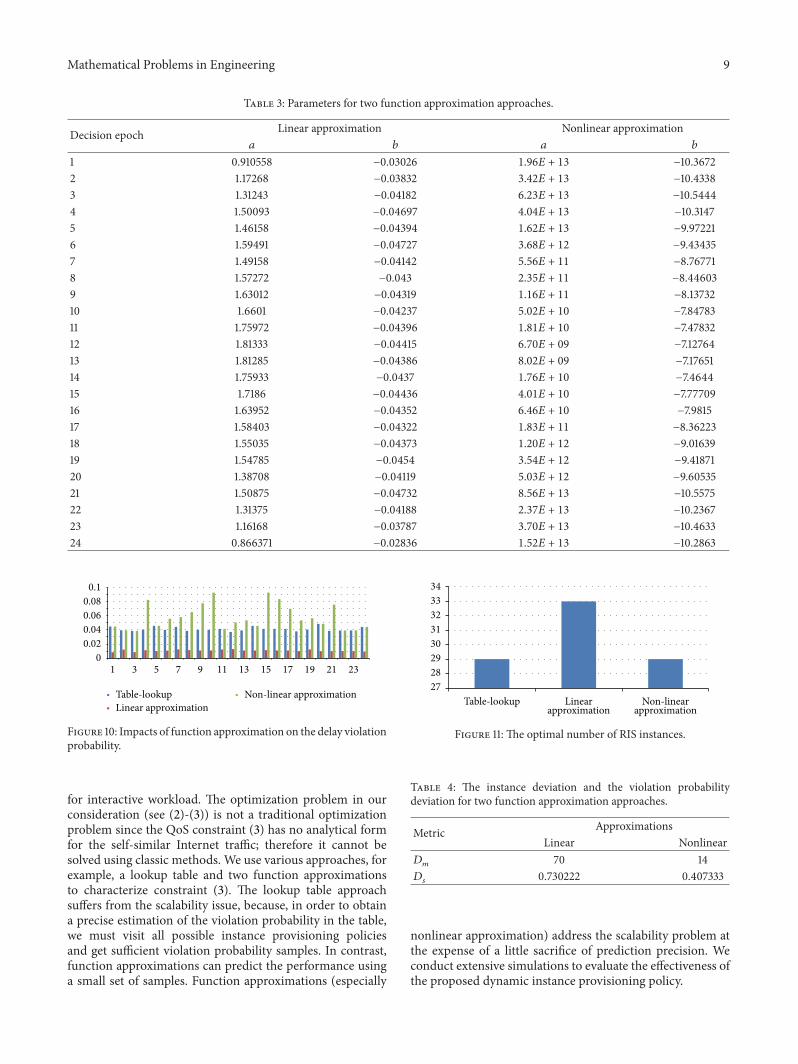
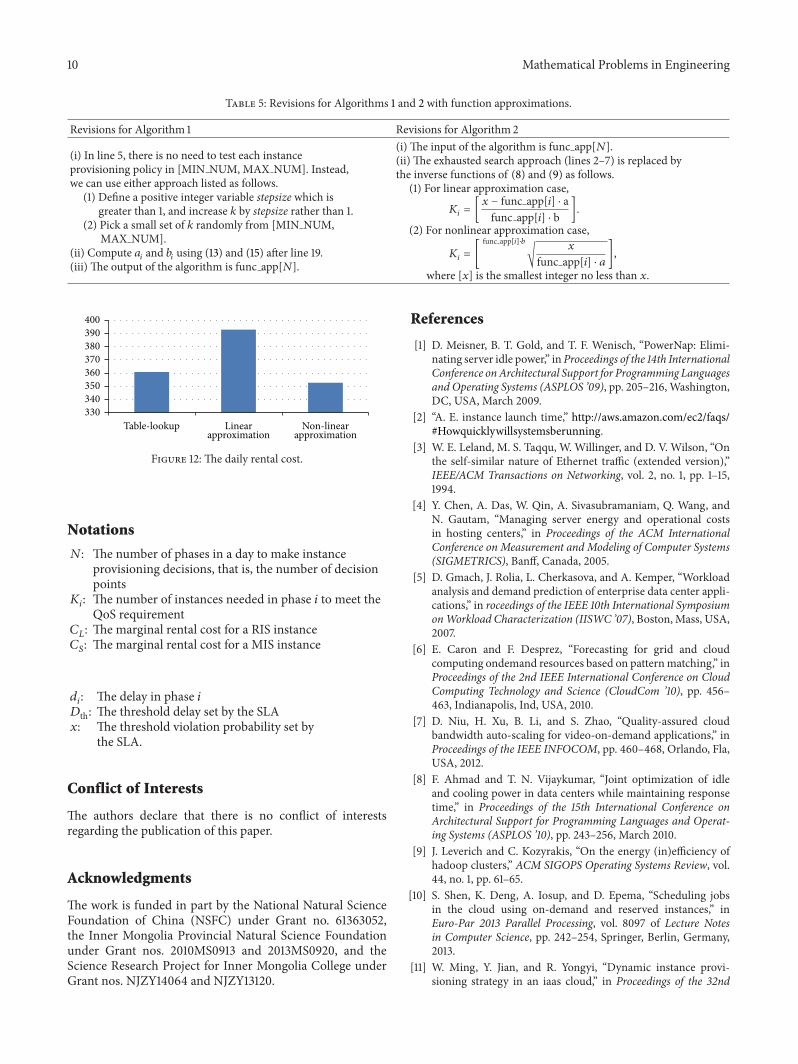
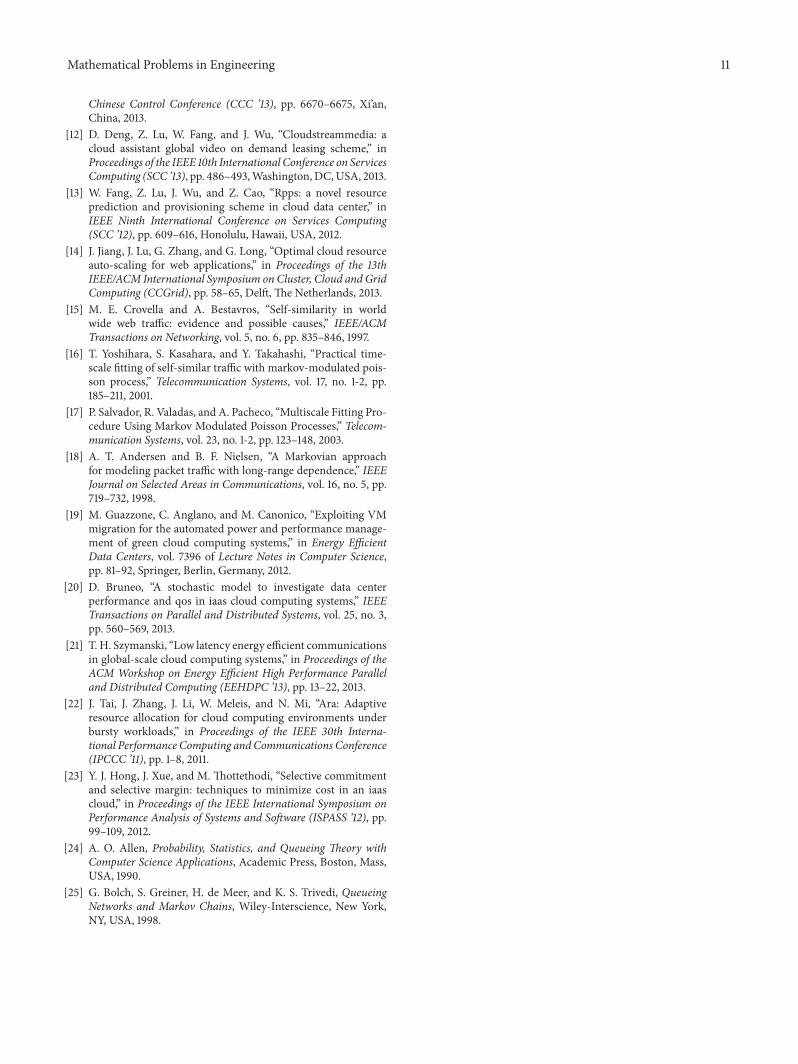