Embed Size (px)
Citation preview

©Journal of Sports Science and Medicine (2005) 4, 499-519 http://www.jssm.org
Research article
A THREE DIMENSIONAL KINEMATIC AND KINETIC STUDY
OF THE GOLF SWING
Steven M. Nesbit
Department of Mechanical Engineering, Lafayette College, Easton, PA, USA Received: 20 May 2005 / Accepted: 02 October 2005 / Published (online): 01 December 2005
ABSTRACT This paper discusses the three-dimensional kinematics and kinetics of a golf swing as performed by 84 male and one female amateur subjects of various skill levels. The analysis was performed using a variable full-body computer model of a human coupled with a flexible model of a golf club. Data to drive the model was obtained from subject swings recorded using a multi-camera motion analysis system. Model output included club trajectories, golfer/club interaction forces and torques, work and power, and club deflections. These data formed the basis for a statistical analysis of all subjects, and a detailed analysis and comparison of the swing characteristics of four of the subjects. The analysis generated much new data concerning the mechanics of the golf swing. It revealed that a golf swing is a highly coordinated and individual motion and subject-to-subject variations were significant. The study highlighted the importance of the wrists in generating club head velocity and orienting the club face. The trajectory of the hands and the ability to do work were the factors most closely related to skill level. KEY WORDS: Golf biomechanics, computer modeling, kinematics, kinetics.
INTRODUCTION Since the golf shot is one of the most difficult biomechanical motions in sport to execute, a detailed understanding of the mechanics of the swing would be beneficial to the golfer and teacher (Vaughn, 1979). It would also provide equipment manufacturers with useful data for club analysis and design (Thomas, 1994).
Most biomechanical studies of golf swings have employed models of varying degrees of sophistication (Budney and Bellow, 1979; 1982; Jorgensen, 1970; Lampsa, 1975; Neal and Wilson, 1985; Vaughn, 1979; Williams, 1967). Generally, these models were limited to one or two rigid link (double pendulum) systems and constrained the motion to two dimensions. The double pendulum models were further limited by fixing the pivot point of the upper link. Notable exceptions are Vaughn (1979) who analyzed the three-dimensional (3D)
mechanics of a swing using a rigid one-link model and Milne and Davis (1992) who utilized a two-link planar system with a flexible lower link to study shaft behavior. These models have been applied to only a single (male) subject each with the exception of Neal and Wilson (1985) who applied their model to six male subjects. Unfortunately, the only comparative information presented is the linear velocity of the club mass center, all other information is given for one subject.
These modeling endeavors have yielded important information on various mechanical quantities of the golf swing. However, these findings represent only a beginning to the full understanding of the entire mechanics of the golf swing. One method of obtaining a more complete understanding of the golf swing is the development of a three-dimensional biomechanical model of the golfer (Dillman, 1994). What has limited previous attempts at developing this type of model is the high

Kinematic and kinetic of the golf swing
500
degree of difficultly in deriving and solving the resulting equations of motion. The addition of links, the inclusion of the third dimension, and the use of non-rigid elements represent major increases in system and thus equation complexity. Fortunately, multi-body analysis software has become available that aides in the development of analytical models for highly complex dynamic systems.
This paper presents a comprehensive study of the 3D kinematics and kinetics of a golf swing using a model created with the aid of multi-body analysis software. The golf swing model combines a variable full-body multi-link three-dimensional representation of a human with a flexible parametric model of a golf club, a ground surface model, and an impact force model. This model is applied to a large sampling of subjects for statistical and comparative information. By analyzing a variety of subjects, the study attempted to discover where differences in swing style, skill level, body type, and experience reveal themselves in the kinematic and kinetic quantities. In summary, the purposes of this study are the following:
- Advance golf swing computer modelling. - Completely characterize the 3D kinetics and
kinematics of the club swing. - Analyze several diverse subjects for statistical
information of all quantities. - Highlight similarities and differences in swing
mechanics among select golfers. - Attempt to describe the golf swing from a
mechanics perspective.
Figure 1. Computer model of a golfer shown during downswing. METHODS A full-body computer model of a golf swing (Figure 1) was developed under the direction of the United States Golf Association (USGA) to study the biomechanics of the golfer, the interactions between the golfer and his equipment, and the behavior of the clubs. The model was built, analyzed and post-processed with the aid of the commercial software
package ADAMS (Mechanical Dynamics, Inc.). An ADAMS model is built from rigid segments connected with flexible elements and/or a variety of joints. Forces and motions can be superimposed on the model. ADAMS derives the differential equations of motion for the model employing methods of Lagrangian dynamics. The resulting equations of motion are integrated using one of several backward differentiation formula (BDF) integrators. The results are output and the model simulated using the ADAMS post-processor.
Golfer model The golfer was modeled as a variable full-body, multi-link, three-dimensional humanoid mechanism made up of fifteen rigid segments interconnected with spherical joints. The segment size, mass and inertia properties were determined from gender and overall body height and weight using the GeBod data base accessible through the ADAMS ANDROID module (Mechanical Dynamics, Inc.). The standard available joints are ankles, knees, hips, lumbar, thoracic, neck (2), shoulders, and elbows. Wrist joints were added. A notable generality of the model is the simplified representation of the back and spine joints. The model divided the entire torso and spine into two segments and joints (lumbar and thoracic). A finer division was attempted, however severe marker crowding resulted, and tracking was compromised. All joints were spherical yielding a maximum of three relative angular degrees-of-freedom (DOF’s) with the exceptions of the knees, elbows, and wrists which were modeled as two degree-of-freedom joints (bending and twisting for the knees and elbows, bending and yawing for the wrists). The motions superimposed upon the joints were specified in terms of Bryant angles (see below) and their time dependent derivatives.
Club model The golf club was modeled as a flexible shaft joined to a rigid club head. The shaft was made up of 15 rigid sub-segments each with representative mass and inertia properties. The sub-segments were connected by massless 3D beam elements with the appropriate flexibility and damping characteristics. The mass and flexibility properties for the shaft sub-segments were calculated using standard analytical methods. Global shaft damping was determined experimentally by fixing the grip end of a club in a cantilever manner, deflecting the club head, and measuring the rate of amplitude decay. This value was assumed to apply to all shaft sub-segments. The rigid club head segment with hosel contains the representative mass, CG location, and 3x3 inertia tensor which were determined using solid modeling techniques described by Oglesby et al. (1992).

Nesbit
501
The club and golfer models were interconnected with spherical-type joints placed at the ends of the lower arms and attached to the grip point of the shaft to simulate the motions of the wrists and hands. The model does not explicitly contain hands. However since the hands experience the same kinematic trajectories as the club handle grip point, the mass and inertia properties of the hands were combined with the properties of the handle of the club model. The angular motions of the wrist joints were driven kinematically while the three linear DOF’s were designated as flexible for both wrists. This designation avoided a closed loop (indeterminate) configuration which can cause the simulation to fail. Swing data and joint motions Data to kinematically drive the joints of the golfer model were obtained from subject golf swings. A multi-camera Motion Analysis System (Motion Analysis, Inc.) tracked passive-reflective markers (13 and 19 mm) that were strategically placed on the golfer and the club. There were 23 markers placed on the golfer and three on the club. On the golfer the markers were placed at the wrists, forearms, elbows, shoulders, cervical and lumbar vertebra, head, hips, knees, mid lower leg, ankles, and feet. All markers were located relative to bony landmarks for subject-to-subject consistency, and securely attached with two-sided tape (skin) or Velcro (clothing). Markers were attached directly to the skin wherever possible. The subjects wore snug-fitting clothing (tank-top and bicycle-style shorts), a baseball hat (head marker), and shoes of their choice. Marker/joint offsets were measured, and virtual joint-center markers were located from these data using features provided by the data collection software. The three markers on the club were arranged in a rigid triad that was attached to the shaft just below the handgrip.
The system was calibrated until the combined 3D residual for all cameras was under 1.00mm. Test/retest of static marker locations varied by less than 0.20mm for a given calibration. The three-dimensional marker paths were recorded at 180 Hz then smoothed and processed to yield global body 1-2-3 angular motions of each body segment and the club. The global angular motions were transformed into local relative joint motions (Bryant angles) by comparing the motions of adjacent body segments. The motion of the club relative to the lower arm segments represented the wrist motions. The relative angular motions were used to kinematically drive the joints and wrists of the golfer model. This process is described in Appendix.
Impact model A spring-damper impact function was included to model the ball-club head collision at impact. The impact force is calculated from the expression:
CVKXF e −= (1)
where X is the impact deformation, V is the impact deformation velocity, K is the spring stiffness, e is the stiffening exponent, and C is the damping factor. The values for K (K = 912,975 Nm), and e (e = 1.5265) were obtained from static compression tests performed on a variety of golf balls (Johnson, 1995). The damping factor C was set to 5% as no experimental or analytical data were available. This value was selected as it reflects the under-damped impact phenomena, and it results in a rapid removal of impact energy without noticeably increasing the impact force. The impact force calculated from Eqn (1) gave results consistent with impact forces reported by Gobush (1990) and Ujihashi (1994). More sophisticated impact models may be developed from the work of Lieberman and Johnson (1994). Ground surface model A ground surface model was added to support the golfer. A linear spring-damper system was used to represent the contact between the feet and the ground, and frictional forces provided traction. The initial contact parameters were obtained from Scott et al. (1993) and were adjusted at solution time to prevent over-stiffening the model. The golfer model was balanced by kinematically driving the angular DOF’s of the lower torso segment (hips) relative to the global coordinate system. To avoid over-constraining the model, the linear DOF’s were set free.
Individual force plates were used to measure the vertical reaction forces between the golfer’s feet and the ground. The data provided kinetic verification of the model since ground reaction forces are one of the outputs of the model. The data was also used to cause the android to keep both feet on the ground. A kinematically driven model is infinitely stiff, therefore small joint angle errors can cause one of the feet to leave the ground surface. To solve this problem, the Beta motion (up and down) of one of the ankle joints was dynamically driven to give the model compliance. A torque control function [Eqn (2)] that incorporated the force plate data was applied to the beta motion of the ankle joint to force the foot down.
WEIGHTPi
CALCMEASBeta TFFCiT +−= ∑ )( (2)

Kinematic and kinetic of the golf swing
502
where TBeta is the applied torque, Ci and Pi are the function constants, FMEAS and FCALC are the measured and calculated ground reaction forces respectively, and TWEIGHT is the torque in the ankle joint imposed by the weight of the golfer on that foot. The form of the function assured that the model results would agree with the measured ground reaction forces. The function constants are adjusted through trial solutions. Once an acceptable set of torque control function constants was found, the solution was iterated until the individual ground reaction forces from the analysis matched the force plate data.
Work and power Traditional kinetic analyses of the golfer have focused on determining the forces and torques generated during the downswing (Dillman and Lange, 1994). However, this information provides insight to instantaneous accelerations, not overall changes in velocity thus yielding a snapshot image of the swing dynamics. An energy analysis has the following advantages: Only the forces/torques that change the velocity of the club are taken into account, i.e., forces/torques that do no work are ignored; the cumulative effects of forces/torques applied over a distance are determinable which introduces factors such as range of motion, timing, and sustainability of forces/torques; the collective effect of various body motions can be summarized by looking at the output (i.e., the energy transferred to the club and the resulting club velocity) (Nesbit, 2003).
The work and power expressions were developed from the analytical equation for the work on a rigid body in three-dimensional motion:
GolferWork = dtCVF iii
t
t i )(1
2∑∫ ∑ •+•
rrrrω (3)
Where iF
r is external force vectors, iV
r is the linear
velocity vector, iωr
is the angular velocity vector,
and iCr
is the external moment vector. Power was determined by numerical differentiation of the results of Eqn (3).
Solution and model output Once all the elements of the model were assembled, the resulting dynamic equations of motion were solved using a Wielenga Stiff Integrator (Mechanical Dynamics Inc.). This integrator is the most stable and accurate, however occasional local errors do occur as evident by small spikes in some of the figures (see Figures 6 and 11). These discontinuities quickly damped out, and the errors did not propagate. Solution of the model yielded the
three-dimensional club trajectories, club kinematics, golfer/club interaction forces and torques, club work and power, club deflections, joint kinematic and kinetic quantities, and ground reaction forces. From the club trajectories, the quantity “swing radius ratio” is calculated as the ratio of the radius of the path of the club head through impact to the radius at the beginning of the downswing as measured in the swing plane.
Model verification Verification of the model was done in several phases. The first phase compared the simulated swing of the model with the motion analysis data taken for each subject. The joint angles for the model were calculated from the marker data using the analytical methods described in Appendix. The joint angular velocities and accelerations were subsequently determined by numerical differentiation of the joint angle information. These kinematic quantities were used to drive the joints of the model. The model simulations exactly reproduced the subjects’ motions in terms of joint and club angles, velocities, and accelerations. This comparison provided kinematic verification of the model.
To verify the internal loads predicted by the model, several carefully configured inverse static and dynamic test cases and simulations were applied to the model. The static analysis consisted of posing the humanoid model in a variety of stationary positions (such as the arms straight out to the side) and having the model solve for the static torques and forces in the joints to support the segments against gravitational loads. The model results and analytically determined results were identical. Next, harmonic motions were applied to individual segments (inverse dynamic simulation) and the model determined joint torques was compared to analytically predicted joint torques. Both methods gave identical results. This verification gave confidence in the internal loads predicted by the model. How well these loads represent actual subject joint loads is not known. The one kinetic output of the model that could be directly and accurately measured was ground reaction forces. Force plate data compared well with model calculated vertical ground reaction forces with less than 7% difference after local smoothing (Nesbit et al., 1994). Finally, model output is compared to available published data. These data are limited to the kinematic and kinetic quantities of the club. These comparisons are presented in the Results section.
Subjects A total of 84 male and one female amateur golfers of various skill levels, experience, age, height, weight,

Nesbit
503
Table 1. Subject data for male aggregate group. Age
(years Height
(m) Weight
(kg) Handicap Experience
(years) Rounds per
Year Average 31.6 1.82 83.9 5.8 15.8 58.9 Median 28.0 1.83 81.8 6.0 12.0 45.0 SD 10.6 .08 8.8 6.0 11.3 56.6 Range 18-56 168-193 70.5-109.1 0-20 5-35 20-200
and competitive rounds played per year were analyzed using the computer model. All subjects were right-handed. A summary of the data for the male subjects is given in Table 1. All subjects used the same driver for the study. The only study of this type that analyzed multiple subjects used the same club for all subjects (Neal and Wilson, 1985).
A subset of four subjects (three males and the one female) was selected for a detailed comparison of their swing mechanics (their data are given in Table 2). The three males were selected from the aggregate group. A diversity of skill levels, body types, gender, and swing styles were the criteria for selecting these four subjects. The detailed comparison is intended to present a cross-section of time histories of these quantities, and to illustrate similarities and differences in swing mechanics among select golfers. No effort at completeness is attempted here as every golfer has unique kinematic and kinetic swing signatures.
Informed consent for the following procedure was obtained from all of the subjects. Each subject had reflective markers placed upon his/her body. After practicing for several minutes to acclimate to the markers and testing environment, the subjects were asked to execute a series of swings which included striking a golf ball. A swing from each subject was self-selected then analyzed.
RESULTS The following data were determined for each subject: the trajectory of the club, the magnitude of the linear velocity and acceleration of the hands and club head, the magnitude of the golfer/club interaction force, the three components of the angular velocity and acceleration of the club, the three components of the golfer/club interaction torque, the total, linear, and angular components of work and power, and the club head deflection
patterns. These data for the four selected subjects are given in Figures 2 through 17. Table 3 presents statistical information for the maximum (M) and impact (I) values for the aggregate group. The maximum values are reported for the portion of the swing from the top of the backswing to impact.
The linear quantities are reported in resultant form since in each case (velocity, acceleration, and force) the dominant component was centrifugal and the magnitudes of and differences among the subjects for the other linear components were negligible. The angular quantities are resolved according to the relative body (Euler angle) 1-2-3 Bryant angle convention where alpha motion (α) is about the X-axis, beta motion (β) is about the Y’-axis, and gamma motion (γ) is about the Z’’-axis (Kane et al., 1983). The reference coordinate system, established when the subject addresses the ball, places the X-axis (alpha) perpendicular to the club shaft and aligned with the bottom edge of the club face as viewed down the club shaft, the Z-axis (gamma) pointing down the club shaft, and the Y-axis (beta) completing a right-handed coordinate system. The alpha component coincides with the swing angular motion, the beta component is a measure of the pitch motion of the club relative to the swing, and the gamma component is the roll angular motion about the long axis of the shaft.
While the majority of the data in Table 3 have not been previously reported, some data does exist. Differences in Table 3 values versus the reported values can be attributed to differences in subjects as well as analysis methodologies, and the clubs used. In all cases the reported data is for a few subjects only. For example, the magnitude of the grip velocity agrees well with Vaughn (1979), however there was not the significant reduction in hand speed prior to impact as reported and which is also discussed by Cochran and Stobbs (1969). The maximum club head velocity values and velocity
Table 2. Subject data for detailed comparison.
Subject Age (years)
Height (m)
Weight (kg)
Handicap Experience (years)
Round per Year
#1 Male 42 183 86.3 0 (scratch) 24 150 #2 Male 35 179 93.1 5 20 100 #3 Male 21 188 74.9 13 7 120 #4 Female 31 170 59.0 18 11 50

Kinematic and kinetic of the golf swing
504
Table 3. Swing analysis data (time relative to impact). Data Units Average Median Std. Deviation Range Swing Radius Ratio none .90 .95 .29 .70-1.23 Club Head Vel (M) m·sec-1 46.37 (-.002) 47.25 (.000) 4.98 (.005) 39-52 Club Head Vel (I) m·sec-1 46.25 46.00 2.87 43-50 Grip Vel (M) m·sec-1 8.125 (-.003) 8 (0) .25 (.030) 7.8-8.5 Grip Vel (I) m·sec-1 7.75 8 .50 7.1-8.0 Alpha Vel (M) Deg·sec-1 1756.25 (-.020) 1762.5 (-.030) 123.11 (.008) 1600-1910 Alpha Vel (I) Deg·sec-1 1737.5 1775 94.65 1600-1900 Beta Vel (M) Deg·sec-1 68.75 (-.176) 70 (-.197) 57.209 (.134) 30-125 Beta Vel (I) Deg·sec-1 -145 -165 212.17 100- (-375) Gamma Vel (M) Deg·sec-1 -231.25 (-.200) -237.5 (-.200) 24.75 (.000) -200- (-250) Gamma Vel (I) Deg·sec-1 -925 -925 301.39 -600 - (-125) Alpha Accel (M) Deg·sec-2 10,312.5 (-.060) 10,125 (-.062) 2248.8 (.015) 8000-13000 Alpha Accel (I) Deg·sec-2 -1587.5 -2550 3949.34 -4100-3750 Beta Accel (M) Deg·sec-2 4650 (-.019) 5300 (-.015) 2594.22 (.012) 1000-7000 Beta Accel (I) Deg·sec-2 2450 1500 2282.54 1000-5800 Gamma Accel (M) Deg·sec-2 1650 (-.050) -450 (-.050) 5661.9 (.057) -2500-10,000 Gamma Accel (I) Deg·sec-2 2500 3000 7000 -6000-10,000 Linear Force (M) N 395 (-.015) 395 (-.015) 84.16 (.006) 300-490 Linear Force (I) N 397.5 400 87.70 300-490 Club Lin Accel (M) m·sec-2 1441.3 (-.008) 1437 (-.010) 304.0 (.005) 1090-1800 Club Lin Accel (I) m·sec-2 1475 1500 312.2 1100-1800 Grip Lin Accel (M) m·sec-2 170 (-.010) 165 (-.005) 24.5 (.014) 150-201 Grip Lin Accel (I) m·sec-2 163.7 162.5 16.0 150-175 Alpha Torque (M) N-m 30.88 (-.074) 30.75 (-.087) 9.187 (.038) 22-40 Alpha Torque (I) N-m 4.25 9 17.15 -20 - 5 Beta Torque (M) N-m 10.78 (-.088) 11.75 (-.088) 2.62 (.0322) 7-12.6 Beta Torque (I) N-m -2.625 -3.125 4.264 -6.25 - 2 Gamma Torque (M) N-m 1.375 (-.043) -.2 (-.030) 3.25 (.043) -.3 - 6.25 Gamma Torque (I) N-m .0625 -.125 .5089 -.3 - .8 Total Work (M) N-m 291.75 (-.012) 288.5 (-.010) 49.13 (.015) 235-355 Total Work (I) N-m 287.25 285 50.29 228-351 Total Power (M) N- m·sec-1 2727.5 (-.048) 2657.5 (-.053) 927.92 (.017) 1720-3875 Total Power (I) N- m·sec-1 237.5 250 587.89 -450-900 Club Defl (M) m .1088 (-.035) .105 (-.045) .02594 (.024) .085 - .14 Club Defl (I) m .06125 .0675 .04007 .085 - .01
profiles agree with previous studies (Budney and Bellow, 1979; Cochran and Stobbs, 1969; Milburn, 1982; Vaughn, 1979). The magnitude of the linear force at the grip and the shape of these curves generally agree with that previously reported (Budney and Bellow, 1979; Vaughn, 1979; Williams 1983). Alpha torque magnitudes generally agree with previous data (Budney and Bellow, 1979; Vaughn, 1979), however the torque profiles are quite different. In addition, the beta torque values agree in magnitude with Vaughn (1979), however these curve profiles are also quite different. The gamma torque magnitudes and profiles obtained are considerably different than those reported by Vaughn (1979). The club deflection magnitudes generally agree with those obtained by Milne and Davis (1992) who report deflections for a driver based upon a two-dimensional model. However, there are small differences in the deflection profiles.
Significant relationships
The data in Tables 1 and 3 were correlated to determine which data are most indicative of performance as opposed to just being characteristic of the individual and their swing style. The most significant linear relationships found are reported in Table 4. This table lists the slope and Y-intercept values for the linear curve fits (trend lines), and the R2 values (coefficient of determination) which are a measure of how well the data fit the trend lines. These relationships are discussed in the following section.
The data in Table 3, the correlations in Table 4, and the graphical information in Figures 2 through 17 completely characterize the 3D kinetics and kinematics of the club during the downswing. This information is used to identify important swing characteristics, describe the swing mechanics, and compare the selected subjects in the subsections that follow. The statistical information in Table 3 reveals an unexpectedly large range of values for the majority of kinematic and kinetic quantities. In addition, the correlations given in Table 4 are at best

Nesbit
505
Table 4. Significant correlations. Y Variable X Variable Slope Y-Intercept R2 Club Head Vel Total Work .081 23.78 .431 Swing Rad Ratio Handicap .037 .572 .245 Lin/Ang Work Handicap .020 .740 .154 Total Work Handicap -5.587 342.1 .139 Club Head Vel Handicap -.529 52.20 .132 Alpha Torque Handicap -1.091 41.70 .129 Total Power Handicap -114.3 3756 .122 Alpha Ang Vel Handicap -15.46 1920 .115 Alpha Torque Weight .497 -7.037 .112 Grip Velocity Handicap -.023 8.33 .093 Alpha Ang Vel Height 11.78 339.4 .078
relatively low. These two findings expose the high degree of individuality of the golf swing.
Club trajectories A front superimposed view of the trajectory of the club for selected subjects’ swing is shown in Figure 2 with the golfer graphics removed for clarity. The swing is shown starting from the top of the backswing. Each frame represents 0.01 seconds. The separation between the shaft and the club head is an indication of club deflections. Individual swing characteristics are evident by differences in the amount of backswing, the path of the club head, the shape and size of the inner hub, the spacing between the frames, club deflection patterns, and the action of the wrists.
The figure clearly shows that the inner hub has a constantly changing radius which is necessary for
delaying the outward motion of the club (discussed later). This subtle action is negated by the fixed pivot of the of the upper link of double pendulum models and may explain why there was much contradictory discussion as to the exact mechanics involved in executing delayed wrist uncocking. Table 4 illustrates the relatively strong correlation between a reducing inner hub radius and skill level for all the subjects.
Figure 3 illustrates each swing from a side view showing the paths of the grip point and club head mass center. The figure clearly shows that the swing does not take place in a fixed plane and that there is significant pitch (beta) motion of the club during the swing. There appears to be two planes; one traced out by the club head, and the other by the path of the hands. The angle between these planes ranges from 9 to 12 degrees.
Figure 2. Front superimposed view of subject swings.

Kinematic and kinetic of the golf swing
506
Figure 3. Side view of subject swings.
Linear quantities Figure 4 illustrates the grip and club head mass center linear velocities for the four subjects. Impact occurs at 0.0 seconds. The grip velocity curves for the subjects are surprisingly similar (less than 0.4 m/sec separates the fastest from slowest), and the degree of difference in the curve profiles is very small especially when compared to the differences in the club head velocity curves. This similarity is true for the aggregate group as well. Generally, the maximum grip velocity was reached just before impact and remained constant or decreased slightly through impact. There was a small correlation between grip velocity and skill level for all subjects (Table 4).
There are large differences in both the shape and magnitude of the club head velocity curves. The figure illustrates the relationship between maximum
club head velocity and skill level as indicated in Table 4 for all subjects. Maximum club head velocity occurred at impact for the scratch golfer and on both sides of impact for the other subjects with the degree of spread related to the skill level of the four subjects. This finding is not unexpected noting the precise timing required to simultaneously coordinate the swing motion, wrist uncocking, wrist roll, swing plane stabilization, and shaft unflexing to cause the peak velocity to occur at impact. The large differences between grip and club head velocity highlights the importance of the wrists in generating club head velocity. The slope of the velocity curve during the downswing is an indication of both the delay and the magnitude of wrist swing motion. It also shows when the wrist motion occurs and its relationship to skill level of the four subjects.
Figure 4. Linear velocity of grip and club head.

Nesbit
507
Figure 5. Linear acceleration of grip and club head.
Figure 5 illustrates the magnitude of the grip
and club head linear accelerations. These curves reflect the dominant centrifugal acceleration component, hence they are similar in shape and subject trends to the velocity curves. It is interesting that while the grip velocity remains relatively constant or slightly decreases near impact, the grip acceleration curves increase slightly. This indicates a shortening of the hub radius near impact and is seen in all 84 subjects.
Figure 6 shows the magnitude of the golfer/club interaction force at the grip. The force is directed along the shaft through the entire downswing. Initially this force does work to accelerate the club, then gradually changes function as the downswing progresses to reacting to the centrifugal acceleration at the time of impact. The force curves have the same general shape and subject trends as the club head velocity and
acceleration curves. Comparison of this data with Figure 4 highlights how subject differences in club head velocity magnify the differences in the interaction forces.
Angular motion: Alpha component Figures 7, 8, and 9 illustrate the alpha component of the angular velocity, angular acceleration, and torque applied to the grip respectively for the four subjects. The alpha components indicate the swinging action of the club and are the most significant angular motions. Referring to Figure 7, the relationship between skill level and maximum swing angular velocity and the slope of the curve prior to impact can be seen. The alpha angular velocity of the club reflects the summation of the rotation of the upper body with the motion of the wrists. It was shown that the grip point linear velocity was similar for the subjects (Figure 4). This
Figure 6. Magnitude of linear interaction force.

Kinematic and kinetic of the golf swing
508
Figure 7. Alpha angular velocity.
fact reveals that the rotational velocity of the upper body did not differ much among the subjects which is surprising, noting the significant differences in body type and skill level. Thus the curves are a direct indication of differences in the wrist motion among the subjects. There is a weak correlation between subject height and alpha velocity (Table 4).
The maximum swing angular velocity consistently occurred 0.025 seconds prior to impact for the scratch golfer and generally occurred in the range of -0.020 to +0.010 seconds relative to impact for the other subjects. Figure 8 (alpha angular acceleration) further illustrates the timing of the maximum alpha angular velocity relative to impact, as well as the smoothness of the wrist swing plane motion. The large spike after impact for the scratch golfer was seen for all his swings and may reflect the sudden rolling over of the right wrist. (This view was deduced by how quickly the club face turns in
after impact as seen in Figure 2). Alpha torque (Figure 9) is the dominant torque
component. Again, there is a relationship between peak positive torque and skill level as reported in Table 4. The maximum values occurred well before impact and generally came close to zero near impact. The scratch golfer consistently exhibited a negative alpha torque 0.01 seconds prior to impact, however it is too late in the swing to suggest that it was related to the purposeful delaying of wrist motion. The figure clearly shows that delayed wrist motion is not achieved by applying a hindrance torque as suggested by Jorgensen (1970) and Milburn (1982). Also, it does not appear that the wrist behaves as a free hinge until impact (Jorgensen 1970; Milburn, 1982), but supports both Lampsa (1975) and Budney and Bellow (1979) that this torque should be positive up to impact to achieve maximum club head velocity. There is a weak correlation between
Figure 8. Alpha angular acceleration.

Nesbit
509
Figure 9. Alpha interaction torque.
subject weight and alpha torque (Table 4).
The subjects exhibited alpha torque profiles that were both unique and consistent among trails revealing a alpha torque “signature” for each subject. Two distinct swing styles were revealed however. The scratch and 5 handicap subjects were “hitters” appearing to exert considerable effort in swinging the club. Their alpha torques increased significantly during the downswing and reached large maximum values at the midpoint of the downswing. These maximum values were maintained until close to impact. The other two subjects were “swingers” with a swing style that was smooth and appeared almost effortless. Their maximum torques were much lower and the curves had smaller variations during the downswing. While there were significant subject differences in maximum alpha torques and the shape of the curves
during the downswing, these differences did not seem to affect the maximum alpha angular velocity or the curve profiles to the degree suggested by the torque data. Angular motion: Beta component Figures 10, 11, and 12 illustrate the beta component of the angular velocity, angular acceleration, and torque respectively for the selected subjects. The beta angular components indicate the pitch motion of the club. While the beta motion is the smallest of the angular motions, Figures 10 and 11 show that it is still significant. Since the path of the grip and club head define different planes (Figure 3), pitch motion of the club must take place. As the speed of the club increases, so must the beta motion as is indicated in Figure 10. The large variations in beta velocity curves among subjects further emphasize the relative
Figure 10. Beta angular velocity.

Kinematic and kinetic of the golf swing
510
Figure 11. Beta angular acceleration.
difference in hand and club head paths taken to impact. The scratch golfer had the least pitch motion up to impact and the lowest beta angular velocity at impact. All four subject exhibited a stabilization of the pitch motion as indicated by the low beta angular accelerations at impact (Figure 11).
The beta torque curves exhibit large subject-to-subject variations. In general, the torques increased towards impact which coincides with the rapid pitching of the club, then tend toward zero near impact as the pitch accelerations approach zero. The large negative torques after impact result mainly from the mechanical rolling over of the wrists which attempts to pitch down the club. All beta actions exhibited large ranges (Table 3). These motions and torques reflected characteristics of individual swing style, and were not related to skill level or club head velocity.
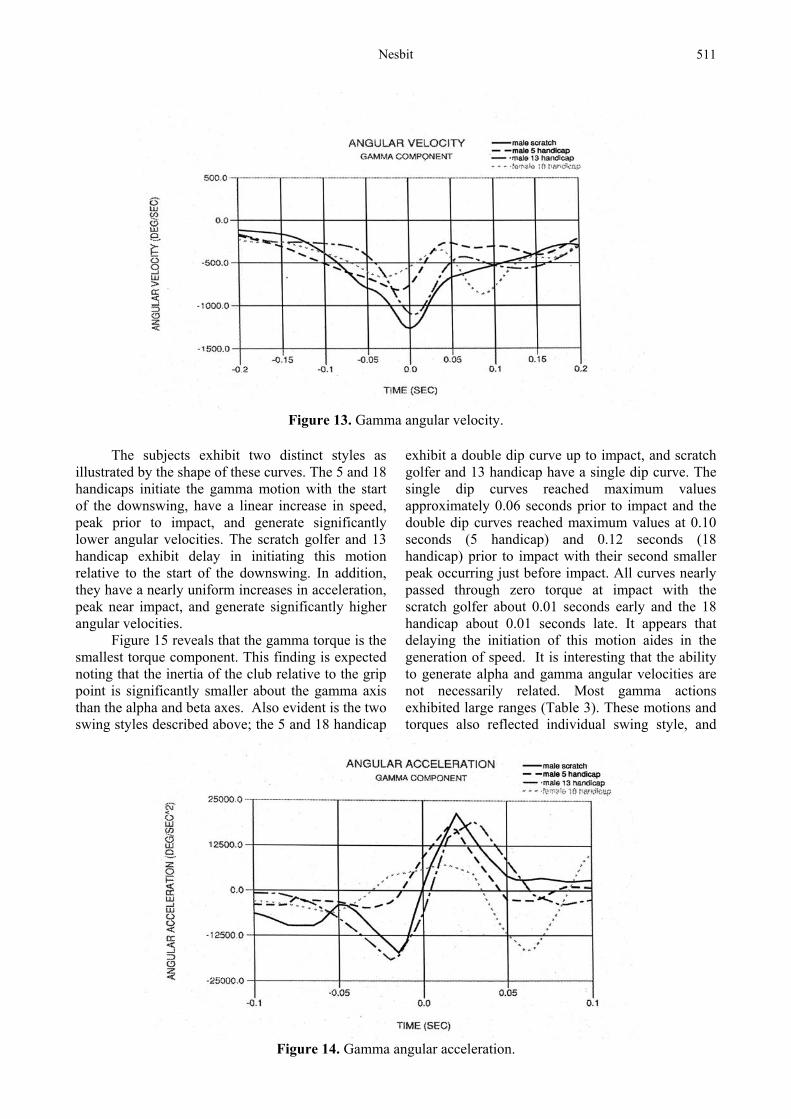
Angular motion: Gamma component Figures 13, 14, and 15 illustrate the gamma component of the angular velocity, angular acceleration, and torque respectively for the four subjects. The gamma angular components indicate the rolling motion about the long axis of the club shaft and are important in squaring up the club face for impact. Figures 13 and 14 reveal that the gamma motion is significant yielding angular velocity values that are approximately half of that for the alpha component, plus the largest angular acceleration component. While the most important function of the gamma motion is to square up the club face for impact, it does contribute to the overall club head velocity. For example, the scratch golfer generates approximately 1.5 m·s-1 club head mass center velocity at impact from the gamma angular velocity.
Figure 12. Beta interaction torque.
Nesbit
511
Figure 13. Gamma angular velocity.
The subjects exhibit two distinct styles as
illustrated by the shape of these curves. The 5 and 18 handicaps initiate the gamma motion with the start of the downswing, have a linear increase in speed, peak prior to impact, and generate significantly lower angular velocities. The scratch golfer and 13 handicap exhibit delay in initiating this motion relative to the start of the downswing. In addition, they have a nearly uniform increases in acceleration, peak near impact, and generate significantly higher angular velocities.
Figure 15 reveals that the gamma torque is the smallest torque component. This finding is expected noting that the inertia of the club relative to the grip point is significantly smaller about the gamma axis than the alpha and beta axes. Also evident is the two swing styles described above; the 5 and 18 handicap
exhibit a double dip curve up to impact, and scratch golfer and 13 handicap have a single dip curve. The single dip curves reached maximum values approximately 0.06 seconds prior to impact and the double dip curves reached maximum values at 0.10 seconds (5 handicap) and 0.12 seconds (18 handicap) prior to impact with their second smaller peak occurring just before impact. All curves nearly passed through zero torque at impact with the scratch golfer about 0.01 seconds early and the 18 handicap about 0.01 seconds late. It appears that delaying the initiation of this motion aides in the generation of speed. It is interesting that the ability to generate alpha and gamma angular velocities are not necessarily related. Most gamma actions exhibited large ranges (Table 3). These motions and torques also reflected individual swing style, and
Figure 14. Gamma angular acceleration.

Kinematic and kinetic of the golf swing
512
Figure 15. Gamma interaction torque.
were not related to skill level or club head velocity. Club deflection Figure 16 illustrates the club deflection patterns for each subject. The deflection includes bending in, and perpendicular to the swing plane, bending down of the club head, and twisting and elongation of the shaft. The deflection in the swing plane was by far the largest component. The curves clearly demonstrate that individual swing mechanics greatly effect shaft deflection patterns, with the patterns loosely following each individual’s alpha torque curve (Figure 9). There is a delay of approximately 0.015 to 0.020 seconds from the time an alpha torque curve passes through zero, and the club shaft in-plane deflection goes through zero. The scratch
golfer was superior in coordinating his alpha torque so to release the maximum stored strain energy in the shaft at impact. This timing is important since the unflexing of the shaft can contribute to the club head velocity. The magnitude and timing of the club shaft deflections varied greatly among subjects in the aggregate group (Table 3), and no significant correlations were found. Work and power The ability to apply forces and torques in the direction of motion during the downswing is indicated by the total work, and the ability to apply forces and torques as the swing increases in velocity is indicated by the total power. Figure 17 illustrates total work curves and reveals differences among the
Figure 16. Club head deflections.

Nesbit
513
Figure 17. Total work for all subjects.
four subjects in magnitude, shape, and timing. It is interesting that all subjects had the same total work at time -0.085 seconds which corresponds to the club position shown in Figure 1 for all subjects. The better golfers initially do work at a slower rate, then do work more rapidly through impact. The better golfers also had higher club head velocities, higher total work done, and were able to peak total work closer to impact. Referring to Table 4, the strongest correlation found was between total work and club head velocity. This correlation is expected since the total work is the primary factor in generating club head velocity as predicted by Newton’s Laws. Table 4 also points out a strong correlation between total work and handicap.
Total work is a combination of angular work (torques x angular motions) and linear work (forces
x linear translations). The linear force, work, and power are primarily transferred from the golfer to the club via pulling on the club by and through the arms. The angular torque, work, and power are transferred by and through the wrists. The ability to develop high peak forces and torques reflects the strength of the arms and wrists respectively. Table 3 shows a large range in values for both quantities among the subjects. An analysis of the ratio of linear work to angular work seems to indicate that better golfers use their arms more relative to their wrists to do work (by a 1.41:1 ratio for the scratch golfer). Table 4 shows a strong correlation between this ratio and handicap.
Figure 18 reveals differences among the subjects in the magnitude, shape, and timing of the total power profiles. Total power is approximately
Figure 18. Total power for all subjects.

Kinematic and kinetic of the golf swing
514
the same until -0.12 seconds which roughly corresponds to the vertical position of the club. The power then peaks at different times prior to impact for each subject. More importantly, the scratch golfer was able to zero his power output at impact resulting in maximum work output. The differences in total power are quite significant as is the balance between angular and linear power components. The arms are more important for generating power than the wrists. The angular power peaks prior to the linear power for each subject. Table 4 shows a correlation between total power and handicap DISCUSSION The ability to completely describe the three-dimensional kinematics and kinetics of the golf swing utilizing a computer model has numerous practical implications for practitioners and researchers. The information obtained from the computer model allows one to precisely explain a subject’s golf swing from a mechanics perspective by explicitly detailing the time history of the motions, forces, and torques. Doing so for several subjects revealed a number of important characteristics of the golf swing, and similarities/differences among subjects. The following observations and practical implications are offered:
- An important component in generating club head velocity is the reducing radius path of the hands during the downswing. The study revealed a relatively strong correlation between a reducing radius path of the hands and skill level. - The torques and range of motion of the wrists are important factors in generating club head velocity, more so than the speed of the hands. In addition, the actions of the wrists identified the better golfer more so than the speed of the hands. - The notion of delayed wrist motion to generate club head velocity is valid, however the mechanism to achieve it is based upon the path of the hands and the initial wrist angle, not a retarding wrist torque. - Shaft flexibility plays a part in generating club head velocity. The straightening of the shaft continues to accelerate the club head through impact even after the work by the wrist on the club is done. Approximately half of the shaft stored strain energy is released by impact and converted to higher club head velocities.
- Work and power analysis is a valuable method for evaluating a golf swing since this approach considers the cumulative effects of forces/torques applied over a distance thus
including factors such as range of motion, timing, and sustainability of forces/torques. - Work and power were well correlated to skill level, and were essential factors for generating club head velocity. Range of motion was important for generating maximum positive work. - Swinging harder does little to generate additional club head velocity. Swinging further (expanded range of motion) has the potential to generate additional club head velocity if the subject possess sufficient muscular power. Exercise programs thus should promote flexibility, and strength training for power as opposed to just strength development. - Subject differences in work, power, force, and torque do translate to differences in club velocity, however not to the degree one would expect. Factor in the greater losses associated with impact and aerodynamic drag at higher club speeds and the results are driving distances that are not that different. This observation is especially important for the individual golfer to realize as swinging the club “harder” may do little to improve driving distance. In fact, it may be more difficult to do useful work with tight muscles, and the cost associated with increased effort is often a reduction in accuracy.
Description of the swing mechanics The following description the golf swing is offered as an aide to understanding the fundamental mechanics involved. The description is from the top of the backswing through impact based upon data from the scratch golfer.
The downswing is initiated with a pulling along the shaft while simultaneously applying a positive alpha (swing) torque resulting in positive linear and angular work being done. As the club head moves away from the body, the action of the linear force becomes less directed at speeding up the club and more toward controlling the path of the grip point. About the time the club becomes vertical in the downswing, the alpha torque increases in magnitude as it takes over the acceleration of the club from the linear force. Simultaneously, the gamma (rolling) torque is initiated to square up the club head for impact, and a beta torque is applied to pitch the club forward. From this position up until the club shaft is roughly parallel with the ground, all the torque components increase smoothly and reach their maximum values. From the parallel position to impact, which coincides with the increase in swing motion of the wrists, the torque components rapidly decrease. All the torque components pass through zero at or near impact resulting in maximum angular work just before impact. By the time impact is

Nesbit
515
reached, the linear force is maximized and perpendicular to the path of the club head in the plane of the swing. At this time the linear force is reacting to the centrifugal loading of the club thus maximizing the linear work at impact.
Just before impact the wrists momentarily approximate a “free hinge” configuration as the golfer merely holds on to the club as its momentum carries it to impact. By the time impact is reached, all torque components are in opposite directions because the wrists cannot keep up with the rotational speed of the club at this time in the downswing. The club head does not slow down however, as the straightening of the shaft continues to accelerate the club head. The club head swing plane deflection component passes through zero at impact releasing about half of the shaft stored strain energy, and resulting in the club head velocity peaking exactly at impact.
This subject exhibited a swing hub curve with a large initial radius of curvature that decreased continuously during the downswing. He also had a highest degree of initial wrist cocking. Together, these served to reduce the initial centrifugal acceleration which in turn diminished the tendency of the club to move outward even though a positive alpha torque was applied from the initiation of the downswing. This large radius path was carried through most of the downswing as the hand speed was increased by the linear force. Approaching impact, the hub radius was quickly reduced by a redirection of the linear force, which in turned caused a rapid increase in the centrifugal acceleration. This action which was coordinated with a large increase in alpha torque, pulled the club outward and through impact. These coordinated actions give the impression of a consciously delayed wrist motion. It is believed that this sequence of events are necessary to yield the optimum segmental addition, thus the largest possible club head velocities. CONCLUSIONS The overall goal of this study was to create a computer model of a golfer, then use the model to analyze the 3D mechanics of a golf swing for several subjects. Novel components included completely characterizing the 3D kinetics and kinematics of the downswing, performing an energy analysis of the swing, analyzing a large group of subjects for statistical information, searching for significant correlations, and highlighting similarities and differences in swing mechanics among select subjects. An important advance over previous studies of this type was the development of the full-body golfer model and a flexible stepped-shaft club
model. This modeling effort consciously avoided applying the simplifying assumptions that limited previous modeling attempts. The model generated considerable valuable 3D data which were used to describe the golf swing from a mechanics perspective, and to identify important swing characteristics.
This analysis revealed the true complexity and individuality of the golf swing motion. While some data were similar among subjects, most data illustrated vast differences both in terms of magnitude and profile. For example, the kinetic quantities consisting of the work, power, linear interaction force and the three components of torque illustrated how differently each subject drives and controls the golf club. These differences have important implications for golf instruction, equipment design, and injury assessment. Also revealed were the quantities that were related to skill level such as hand trajectory, work ratio, work, club head and grip velocity, alpha torque and angular velocity, and power. The other quantities seemed to reflect swing style and not skill level. The study discovered little correlation between body type and swing characteristics or skill level. ACKNOWLEDGEMENT Funding for this project was provided by grants from the United States Golf Association and the National Science Foundation. REFERENCES Budney, D.R. and Bellow, D.G. (1979) Kinetic analysis
of a golf swing. Research Quarterly 50(2), 171-179.
Budney, D.R. and Bellow, D.G. (1982) On the swing mechanics of a matched set of golf clubs. Research Quarterly for Exercise and Sport 53(3), 185-192.
Cochran, A. and Stobbs, J. (1969) The search for the perfect swing. New York: J.P. Lippincott Co.
Craig, J.J. (1986) Introduction to robotics: mechanics & control. Reading, Massachusetts: Addison-Wesley Publishing Co.
Dillman, C.J. and Lange, G.W. (1994) How has biomechanics contributed to the understanding of the golf swing? Proceedings of the 1994 World Scientific Congress of Golf, St. Andrews, Scotland. Eds: Cochran, A..J. and Farrally, M.R. 1-13.
Gobush, W. (1990) Impact force measurements on golf balls. Proceedings of the 1990 World Scientific Congress of Golf, St. Andrews, Scotland. Eds: Cochran, A..J. and Farrally, M.R. 219-223.
Johnson, S.H. (1995) Experimental determination of the static mechanical properties of golf balls. USGA Technical Report. Far Hills, NJ: United States Golf Association.

Kinematic and kinetic of the golf swing
516
Jorgensen, T. (1970) On the dynamics of the swing of a golf club. American Journal of Physics 38(5), 644-651.
Kane, T.R., Likins, P.W. and Levinson, D.A. (1983) Spacecraft dynamics. New York: McGraw-Hill Co.
Lampsa, M.A. (1975) Maximizing distance of the golf drive: an optimal control study. Journal of Dynamic Systems, Measurement, and Control, Transactions ASME 97 (Series G), Dec: 362-367.
Lieberman, B.B. and Johnson, S.H. (1994) An analytical model for ball-barrier impart, Part 1 and Part 2. Proceedings of the 1994 World Scientific Congress of Golf, St. Andrews, Scotland. Eds: Cochran, A..J. and Farrally, M.R. 309-319.
Milborn, P.D. (1982) Summation of segmental velocities in the golf swing. Medicine and Science in Sports and Exercise 14, 60-64.
Milne, R.D. and Davis, J.P. (1992) The role of the shaft in the golf swing. Journal of Biomechanics 25(9), 975-983.
Neal, R.J. and Wilson, B.D. (1985) 3D kinematics and kinetics of the golf swing. International Journal of Sport Biomechanics 1(3), 221-232.
Nesbit, S.M. (2003) Work and power analysis of the golf swing. Proceedings of the 2003 ASME Annual Bioengineering Conference, Miami, FL, USA. 199.
Nesbit, S.M., Cole, J.S., Hartzell, T.A., Oglesby, K.A. and Radich, A.F. (1998) Method of and system for analyzing a golf club swing. US Patent #5,772,522.
Nesbit, S.M., Cole, J.S., Hartzell, T.A., Oglesby, K.A. and Radich, A.F. (1994) Dynamic model and computer simulation of a golf swing. Proceedings of the 1994 World Scientific Congress of Golf, St. Andrews, Scotland. Eds: Cochran, A..J. and Farrally, M.R. 71-76.
Oglesby, K.A. Cole, J.S. and Nesbit, S.M. (1992). Parametric ANSYS model of golf clubs. Proceeding of the 1992 ANSYS Technical Conference. Pittsburgh, PA, USA.
Scott, S. and Winter, D. (1993) Biomechanical model of the human foot: kinematics and kinetics during the stance phase of walking. Journal of Biomechanics 26(1), 1091-1104.
Teu, K.K., Kim, W. D., Fuss, F.K. and Tan, J. (2005) The Analysis of golf swing as a kinematic chain using dual euler angle algorithm. Journal of Biomechanics, in press. Available from URL: http://www.sciencedirect.com/science/journal/00219290
Thomas, W.F. (1994) The state of the game, equipment and science. Proceedings of the 1994 World Scientific Congress of Golf, St. Andrews, Scotland. Eds: Cochran, A..J. and Farrally, M.R. 237-246.
Ujihashi, S. (1994) Measurement of the dynamic characteristics of golf balls and identification of the mechanical properties. Proceedings of the 1994 World Scientific Congress of Golf, St. Andrews, Scotland. Eds: Cochran, A..J. and Farrally, M.R. 302-308.
Vaughan, C.L. (1979) A three-dimensional analysis of the forces and torques applied by a golfer during the downswing. Biomechanics VII-B. University Park Press. Warsaw, Poland. 325-331.
Williams, D. (1967) The dynamics of the golf swing. Quarterly Journal of Mechanics and Applied Mathematics 20, 247-255.
AUTHOR BIOGRAPHY
Steven M. NESBIT Employment Associate Professor and Head, Department of Mechanical Engineering, Lafayette College, Easton, PA, USA Degrees PhD, PE, MS, BS Research interests Sports Biomechanics, mechanisms, computer modelling Email: [email protected]
KEY POINTS
• Full-body model of the golf swing. • Mechanical description of the golf swing. • Statistical analysis of golf swing mechanics. • Comparisons of subject swing mechanics.
Dr. Steven M. Nesbit
Associate Professor and Head, Department of Mechanical Engineering, Lafayette College, Easton, PA, USA

Nesbit
517
APPENDIX (Determination of Joint Angles)
This section describes the methods used to locate local body segment coordinate systems, determine global orientations of the body segment coordinate systems, and extract the relative orientations of adjacent body segments which are the angles that drive the joints of the humanoid and golf club models. The methods were developed from the works of Kane et al. (1983) and Craig (1986). Other methods for determining relative body segment orientations and velocities are given by Teu et al. (2005).
Figure 1app illustrates the club and right forearm marker locations and coordinate systems. The markers at the ends of the right forearm segment are virtual makers located at the joint centers. Their positions are determined by the Motion Analysis System software. Also shown is the global coordinate system attached to the ground. The configuration of markers, local segment coordinate systems, and relative and global angles is typical of all adjacent segments in the body, thus the figure is relevant to the general discussions that follow.
Figure 1app. Club and right forearm marker locations and coordinate systems.
Local coordinate systems were defined for each body segment (and the club) from groups of three adjacent marker locations. Generally, markers were placed at the distal and proximal ends of each segment, and are represented as marker i+1 and marker i, respectively. In addition, a third non-collinear marker is placed between marker i and i+1, and is designated marker i+2. Taken together, the three markers form a plane from which the local coordinate systems are established. The local Z-axis is coincident to the long axis of the segment and is determined from the following vector difference:
i
i
i
i
i
i
z
y
x
ZYX
ZYX
ZZZ
−=
+
+
+
1
1
1
= { }^Z (1)
An intermediate vector Q is determined from markers i and i+2:
i
i
i
i
i
i
z
y
x
ZYX
ZYX
QQQ
−=
+
+
+
2
2
2
= { }^Q (2)
{ }globalγβα ,,Distal{ }relativeγβα ,,JointSpherical
{ }globalγβα ,,Proximal
i
1+i
2+i
X
Y ZX
Y
Z
Ground

Kinematic and kinetic of the golf swing
518
Using cross products, the local X and Y axes can be determined as follows:
{ }^Z x { }^
Q = { }^Y =
z
y
x
YYY
(3)
{ }^Y x { }^
Z = { }^X =
z
y
x
XXX
(4)
The local coordinate system is then represented in matrix form as follows:
xX xY xZ
yX yY yZ
zX zY zZ Where the first column Xx, Xy, Xz is the X-axis unit vector components, the second column is the Y-axis unit vector, and the third column is the Z-axis unit vector components. This process is repeated for all body segments and the club. All of the terms in the above matrix are known.
The android model is driven kinematically by specifying the relative body 1-2-3 Euler angles (Bryant angles alpha (α ), beta ( β ), and gamma (γ )) for each joint. The Bryant angle transformation matrix is as follows:
11R 12R 13R
21R 22R 23R
31R 32R 33R Where
11R = Cosα Cos β (5)
12R = Cosα Sin β Sinγ – Sinα Cosγ (6)
13R = Cosα Sin β Cosγ – Sinα Sinγ (7)
21R = Sinα Cos β (8)
22R = Sinα Sin β Sinγ – Cosα Cosγ (9)
23R = -Sinα Cos β (10)
31R = -Cosα Sin β Cosγ – Sin β Sinγ (11)
32R = Cosα Sin β Sinγ – Sinα Cosγ (12)
33R = Cosα Cos β (13)
The local coordinate system matrix and the Bryant angle transformation matrix are set equal to each other for each segment. Thus the left hand side of Eqns (5) through (13) are known. From these equations, the global Bryant angles are extracted. For example, solving for the angle α , note the following: Zy = 23R = -Sinα Cos β (14) Zz = 33R = Cosα Cos β (15) Dividing Eqn (14) by Eqn (15) yields the formula for α : α = Tan-1 (Zy/Zz) (16)

Nesbit
519
Using a similar procedure, the expressions for Beta and Gamma are found: β = Tan-1((Zx/Zy
2+Zz2)1/2) (17)
γ = Tan-1 (-Yx/Xx) (18) Thus Eqns (16), (17), and (18) yield the global Bryant angles for each body segment and the club.
Relative angles of the distal segment with respect to the proximal segment are needed to drive the joints of the model. Determination of the relative Bryant angles is done the following way: The relationship between the Bryant matrices of adjacent segments is given by:
RRR PD
GP
GD = (19)
where G is ground (global reference system). D is the distal segment, and P is the proximal segment. The relative Bryant angles are contained inside the RP
D matrix. In order to isolate this matrix, both sides of Eqn (19) are multiplied by the inverse of the RG
P matrix yielding:
[ ] RRR PD
GD
GP =
−1 (20)
The global Bryant angles are substituted into the RG
D and RGP matrices yielding all known elements of
the RPD matrix. The relative Bryant angles are then extracted from the RP
D matrix in a manner similar to that used for the global Bryant angles.
Application of Eqn (20) to the digitized motion analysis data yields tabular 3-D relative motions for all the joints of the model including the wrists which drive the club. Cubic splines are used to create continuous functions from the tabular data to kinematically drive each joint.