Embed Size (px)
Citation preview

DEPARTMENT for ENVIRONMENT, FOOD and RURAL AFFAIRS CSG 15Research and Development
Final Project Report(Not to be used for LINK projects)
Two hard copies of this form should be returned to:Research Policy and International Division, Final Reports UnitDEFRA, Area 301Cromwell House, Dean Stanley Street, London, SW1P 3JH.
An electronic version should be e-mailed to [email protected]
Project title Changes in lowland grassland management: effects on invertebrates and birds
DEFRA project code BD1435
Contractor organisation and location
British Trust for Ornithology, The Nunnery, Thetford, Norfolk IP24 2PUCABI Bioscience UK Centre, Bakeham Lane, Egham, Surrey TW20 9TYIGER, North Wyke, Okehampton, Devon EX20 2SB
Total DEFRA project costs £ 550,254
Project start date 01/11/98 Project end date 31/03/03
Executive summary (maximum 2 sides A4)
Executive Summary
(1) It is well established that declines in farmland birds in recent decades are related to changes in agricultural practices, but most of the relevant research has been conducted on arable systems. This project examined relationships between the intensification of grassland management and the food resources of birds. Specifically, it sought insights into how intensity of grassland management affects sward structure, plant species composition, seed density, invertebrate abundance and bird usage. This objective was pursued by undertaking a literature review, through intensive fieldwork in two regions of England and by undertaking a national survey of grassland birds .
(2) The literature review concluded that most of the changes in grassland management during the second half of the 20th century have reduced the suitability of grassland as feeding and breeding habitat for birds. These changes have involved more than a doubling in the use of inorganic nitrogen, the widespread substitution of silage for hay, and increased stocking rates of sheep. Swards have tended to change from being diverse in species composition and canopy structure to relatively dense, structurally uniform swards dominated by a few competitive plant species.
(3) The literature review also concluded that intensification of grassland management has probably reduced habitat quality for birds through the following key mechanisms. Increased fertiliser use in combination with increased frequency of cutting and/or grazing has reduced spatial and vertical structural complexity of swards, which in turn have had negative consequences for the general abundance and diversity of invertebrates in agricultural grasslands. Earthworm numbers, however, increase under moderate fertiliser inputs but decrease under high inputs. The dense swards that result from high fertiliser inputs provide less suitable nesting sites for ground-nesting birds and insect food is less abundant for insectivorous species. The densities of those seeds that tend to be preferred by seed-eating birds are less abundant in intensively grazed and heavily fertilised grassland.
(4) Evidence was sought for these proposed mechanisms through a detailed field study undertaken on samples of farms in discrete areas of east Devon and north Buckinghamshire (Bucks). Total nitrogen (N) input was used as a surrogate for management intensity. In each region livestock farms were identified in the following three
CSG 15 (Rev. 6/02) 1

Projecttitle
Changes in lowland grassland management: effects on invertebrates and birds
DEFRAproject code
BD1435
categories of average annual inputs of kg N /ha : > 200, 50 - 200, < 50. This ensured that samples of fields could be identified under different levels of management intensity from highly intensive to extensive. From within these farms, a total of 48 fields was selected in each region, with 16 fields in each management category, as far as possible equally divided between cut and grazed. Botanical, invertebrate and bird data were collected from these fields over a four year period, with at least two years of data from each region. For analysis purposes, individual fields were allocated management intensity scores reflecting their position on gradients relating to total nitrogen input and cutting versus grazing.
(5) The Devon study area was mainly grassland whereas Bucks was mixed livestock and arable. Average farm size in Bucks was twice that of Devon but average area of study fields was only slightly larger, though there was no regional difference in size of intensive fields. All intensive farms in both regions had dairy cows and all but two farms, in Bucks, had cattle, these being all sheep. Stocking rate in livestock units was significantly correlated with N inputs in both regions. More than 80% of study fields in each region were bounded on at least one side by hedges. Hedge width was greater in Devon than Bucks. Representativeness of the study farms of their regions was assessed using the Defra June 2002 Agricultural Census Statistics. The farms were broadly representative with two main exceptions. In Devon there was less arable land, and in Bucks there was more permanent pasture, on the study farms than in the surrounding region.
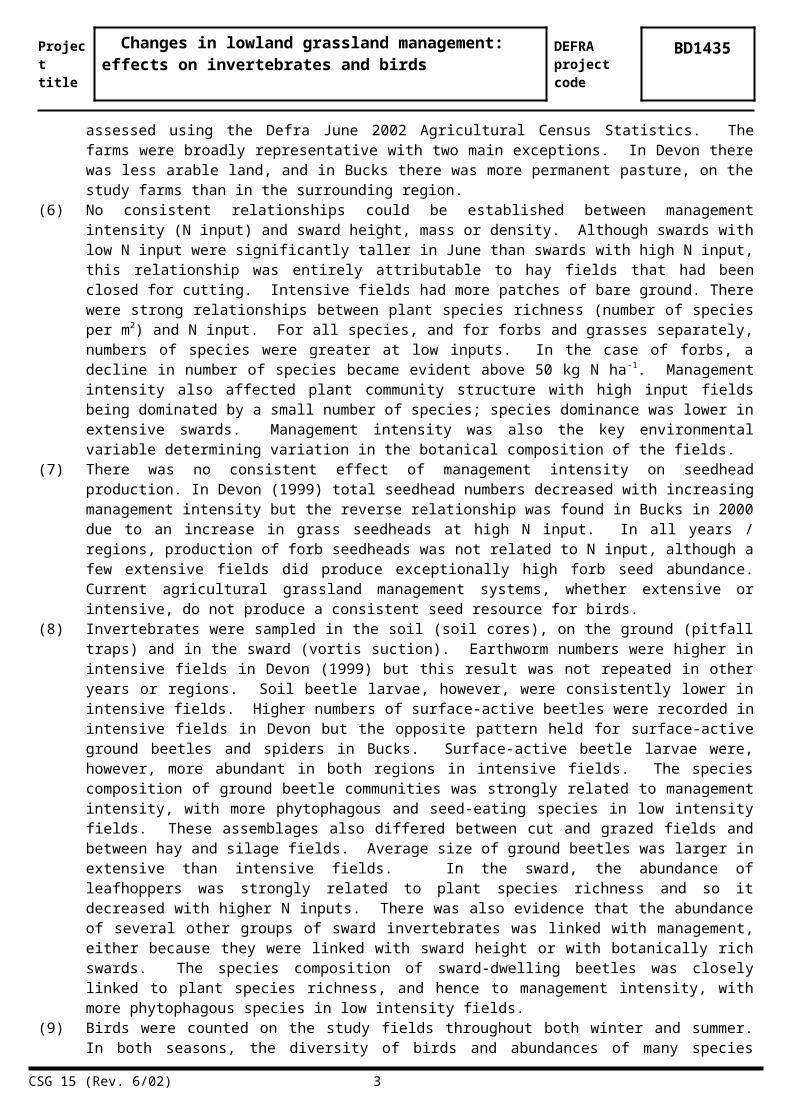
(6) No consistent relationships could be established between management intensity (N input) and sward height, mass or density. Although swards with low N input were significantly taller in June than swards with high N input, this relationship was entirely attributable to hay fields that had been closed for cutting. Intensive fields had more patches of bare ground. There were strong relationships between plant species richness (number of species per m2) and N input. For all species, and for forbs and grasses separately, numbers of species were greater at low inputs. In the case of forbs, a decline in number of species became evident above 50 kg N ha -1. Management intensity also affected plant community structure with high input fields being dominated by a small number of species; species dominance was lower in extensive swards. Management intensity was also the key environmental variable determining variation in the botanical composition of the fields.
(7) There was no consistent effect of management intensity on seedhead production. In Devon (1999) total seedhead numbers decreased with increasing management intensity but the reverse relationship was found in Bucks in 2000 due to an increase in grass seedheads at high N input. In all years / regions, production of forb seedheads was not related to N input, although a few extensive fields did produce exceptionally high forb seed abundance. Current agricultural grassland management systems, whether extensive or intensive, do not produce a consistent seed resource for birds.
(8) Invertebrates were sampled in the soil (soil cores), on the ground (pitfall traps) and in the sward (vortis suction). Earthworm numbers were higher in intensive fields in Devon (1999) but this result was not repeated in other years or regions. Soil beetle larvae, however, were consistently lower in intensive fields. Higher numbers of surface-active beetles were recorded in intensive fields in Devon but the opposite pattern held for surface-active ground beetles and spiders in Bucks. Surface-active beetle larvae were, however, more abundant in both regions in intensive fields. The species composition of ground beetle communities was strongly related to management intensity, with more phytophagous and seed-eating species in low intensity fields. These assemblages also differed between cut and grazed fields and between hay and silage fields. Average size of ground beetles was larger in extensive than intensive fields. In the sward, the abundance of leafhoppers was strongly related to plant species richness and so it decreased with higher N inputs. There was also evidence that the abundance of several other groups of sward invertebrates was linked with management, either because they were linked with sward height or with botanically rich swards. The species composition of sward-dwelling beetles was closely linked to plant species richness, and hence to management intensity, with more phytophagous species in low intensity fields.
(9) Birds were counted on the study fields throughout both winter and summer. In both seasons, the diversity of birds and abundances of many species tended to be higher in Bucks than Devon and there were considerable regional differences in bird species composition. Most species were only recorded in a small proportion of fields, reflecting generally low densities and the gregarious nature of some species especially in winter. There were very few consistent relationships across regions or years between the occurrence of birds and measures of field management. The main findings were as follows. In winter there was a tendency towards higher occupancy of intensively managed fields. Sward height, presence of grazing animals, abundance of molehills and bare ground appeared to be important to several species in winter. In summer there were relatively few relationships between field usage by birds and management intensity. However, most species showed relationships with vegetation height, avoiding tall swards. One of the most unexpected findings was that usage of fields was not related to food abundance. Out of 976 potential relationships between birds and abundance of invertebrate food resources in winter, only 23 were statistically significant. In summer out of 480 potential relationships only 23 were
CSG 15 (Rev. 6/02) 2
Projecttitle
Changes in lowland grassland management: effects on invertebrates and birds
DEFRAproject code
BD1435
significant. This number of significant results could have arisen by chance alone. Although the exact dietary requirements of most species of grassland birds are not fully understood, these findings suggest that factors other than, or in addition to, food abundance influence field selection by birds. It is likely that availability of food is critical, probably mediated by sward structure.
(10) An analysis of national bird distribution data enabled species particularly associated with pastoral landscapes to be identified. In winter most species reached highest abundance in mixed rather than predominantly arable or grass landscapes. An extensive national survey was undertaken of birds using grassland to place the above detailed studies in Bucks and Devon into context. This found that grassland bird assemblages show considerable variation from one locality to another but with no clear regional pattern.
(11) Relationships between birds and grassland management systems are extremely complex. This is partly because different species of birds respond to different habitat elements within grassland and partly because effects of food availability may override those of food abundance. This means that the creation of swards rich in plant species and supporting diverse and abundant insects will not necessarily offer optimal feeding opportunities for birds. The presence of a diversity of sward structures and the distribution and relative size of these different structured patches within a landscape matrix may also have important influences on feeding / breeding site selection by birds. This project has demonstrated how management influences invertebrate food resources for birds through its effects on plant composition and other sward characteristics. A major challenge for the future is to understand how different structures of vegetation affect the availability of that food to birds and the scales at which heterogeneity in sward structures should be provided to enhance habitat quality for grassland birds.
(12) It is suggested that attempts to restore habitat quality for birds in grassland landscapes need to create microhabitat diversity at both the scale of individual fields and whole farms. The former scale could be approached (i) through the use of low input field margin strips to create botanically and structurally diverse swards rich in invertebrates and (ii) by enhancing availability of grass seeds on intensive livestock farms. The whole-farm scale requires integration of extensive and intensive management possibly (i) through rotating late hay cutting and low-moderate grazing intensity within some fields and (ii) by creating diverse sward structures through adopting different grazing intensities (and different N input) in different fields.
CSG 15 (Rev. 6/02) 3

Projecttitle
Changes in lowland grassland management: effects on invertebrates and birds
DEFRAproject code
BD1435
Scientific report (maximum 20 sides A4)1. Introduction and review of existing knowledge
Lowland grasslands in the UK have been transformed over the last 50 years mainly through the introduction of silage systems, increased N inputs and widespread field drainage. Reductions in breeding bird populations in grass-dominated regions may be linked with these changes (Chamberlain & Fuller 2000, 2001). The broad hypothesis is that intensification of grassland management has altered the food resources available to breeding birds through reducing the abundance and / or availability of prey, mainly invertebrates (Vickery et al. 2001). The purpose of this project was to gain insights into whether and how intensification has affected the quality of lowland grassland as a habitat for birds by examining linkages between grassland management, sward structure and plant composition of the sward, invertebrate abundance and bird usage. Whilst concern about birds has focused on declines in breeding populations, grassland can hold important concentrations of invertebrate-feeding birds in winter which may be affected by grassland management (Tucker 1992). Therefore, this project examined usage of grassland by birds in winter as well as in summer.
Existing knowledge of the impact of grassland management on floristics, vegetation structure, invertebrates and birds was reviewed as objective 1 of the project. The review was published as a report (Vickery et al. 1999), the Executive Summary of which forms Appendix 1.1. This review formed the basis of Vickery et al. (2001) which is presented in Appendix 1.2. Specific hypotheses arising from this review and that are tested in this project are:
(1) Intensively managed swards offer reduced invertebrate food resources within the foliage, and on the surface, for breeding birds. Invertebrates in such swards will tend to be less diverse and abundant than in swards that are extensively managed and which are floristically relatively diverse and complex in structure.
(2) Extensively managed swards with low N inputs will offer lower food resources for species that depend on soil invertebrates than moderately or intensively managed swards with higher N inputs and this effect may be especially apparent in winter.
(3) Intensively managed swards are relatively poor in seed resources and hence will be used relatively little by seed-eating birds.
Documentation of invertebrate communities and bird usage of fields in relation to grassland management form objectives 2 and 3 respectively, while assessing the effects of grassland management on avian food resources forms objective 4. The generation of guidelines for increasing food resources for birds in grassland forms objective 5. Conclusions relating to each of these objectives are presented in section 6 of this report.
2. General approach, project design and study areas
Lowland grassland farms representing the broad range of intensification in UK agriculture were examined in two discrete areas centred on east Devon (north of Axminster, centred on ST20) and north Buckinghamshire (east of Bicester, centred on SP62). Working in different geographical areas (ca. 180 km apart) helped determine whether different processes operated in different landscapes locations. The findings based on the two regions were also placed into national context by an extensive survey of birds using grassland.
Total nitrogen input was used as a surrogate for management intensity (see also section 3). In each region livestock farms were identified in the following three management categories: highly intensive (referred to below as ‘intensive’) with average annual nitrogen inputs of > 200 kg ha-1, moderately intensive (referred to below as ‘moderate’) with inputs of 50 to 200 kg N ha-1, and extensive with inputs of < 50 kg N ha-1. The extensive farms were also selected on the basis that they should contain some unimproved and botanically diverse grassland. From within these farms, a total of 48 fields was selected in each region, with 16 fields in each management category, as far as possible equally divided between cut and grazed. Agricultural census statistics for June 2000 were obtained from Defra for a 10 km radius around each of the selected farms to typify farm type.
Data were collected over a four-year period, 1999-2002. The original plan was to collect data from all Devon fields in 1999, all Bucks fields in 2001 and from half the fields in each region in 2000. The funding was increased, however, to enable birds and some groups of invertebrates to be sampled in all fields in Devon in 2000. Work was severely disrupted by Foot and Mouth Disease in 2001 and the project was extended by a year. A summary of the data collected in the two regions in different years is presented in Appendix 2.1.
The description and summary of field management was essential in order to meet objectives 2, 3 and 4 of the project. A management database was established for each selected farm and field (Appendix 2.2). For the analyses, the
CSG 15 (Rev. 6/02) 4

Projecttitle
Changes in lowland grassland management: effects on invertebrates and birds
DEFRAproject code
BD1435
fields were located within a ‘management continuum’ by the following procedure. The available variables consisted of continuous variables such as total N inputs and nominal variables such as whether the field was grazed or cut. A two-step multivariate approach was therefore used to produce a management index for each field. In step 1, seven nominal management variables for each field in Devon 1999/2000 and Bucks 2000/2002 were summarised by Correspondence Analysis (CA) for each year separately and all years combined. The variables used were: grazed only, cut once, cut twice, hay cut, silage cut, FYM applied, slurry applied. The resulting ordinations explained a large proportion of variation in management in the first two axes (58-71 %) with axis 1 representing a cutting/grazing gradient and axis 2 a hay/silage cut gradient. In step 2, the scores of the fields along these CA axes were used with N inputs in a Principal Components Analysis (PCA). The derived scatter plot of fields was then used as a template for analyses of invertebrate and bird data in relation to management intensity. The resulting templates are shown in Fig. 2.1 and illustrate that fields in both regions and in different years were distributed across gradients of N input (axis 1) and management system with respect to grazing and cutting (axis 2). Axes 1 and 2 explained 82-88% of variation in N inputs and CA axes scores. Hay fields are located in the lower left of the diagram, intensive silage fields are at the top, and intensively grazed fields are at the lower right.
Fig. 2.1. Management templates for fields in the two study regions in different years. Individual fields are located in an ordination space that represents a gradient from low N to high N (horizontal axis) and from fields that are grazed and cut to ones that are intensive silage systems (vertical axis). The circle size is proportional to the number of fields showing the same score on the ordination axes. These diagrams are derived from one PCA with values for all the different year / region combinations shown separately for clarity.
Fig. 2.2. Farm land-use types within the two study regions taken from the June 2000 Agricultural Census Statistics. Average percentages of the agricultural land-use area are shown for the areas around each study farm. Percentage data for each land-use category from the sample areas were angular transformed prior to carrying out a two-way analysis of variance.
Average farm size in Bucks was 73 ha, which was greater (P<0.001) than the average farm size of 35 ha in Devon. Average field sizes on the study farms were 5.8 ha in Bucks and 4.2 ha in Devon (P<0.001). However, there was no difference in field size between regions on the intensive farms (Devon = 5.2 ha, Bucks = 6.1 ha, P = 0.301). Moderate and extensive fields were smaller in Devon than in Bucks (Devon = 3.7 ha, Bucks = 5.8 ha, P<0.001). In Devon, extensive fields were smaller than intensive fields (P<0.05). In Bucks moderate fields were larger than extensive and intensive fields (P<0.05). Field size did not differ between other categories of management intensity.
CSG 15 (Rev. 6/02) 5
%crops&fallow
%grassland<5yr
%grassland>5yr
%rough grazing
%woodland
%setaside
%other
% farm landuse type by area, Devon% farm landuse type by area, Bucks

Projecttitle
Changes in lowland grassland management: effects on invertebrates and birds
DEFRAproject code
BD1435
Devon had a higher percentage of dairy farms compared with Bucks, but similar percentage of holdings with cattle (all categories) and sheep (Appendix 2.3). All the intensive study farms in both regions had dairy cows and all of the study farms in Devon and all but two of the study farms in Bucks had cattle; the exceptions being extensively managed ‘all sheep’ farms. A lower percentage of Devon holdings had sheep compared with the Bucks region. The Devon study farms had fewer (P<0.001) sheep per holding than was average for the region. There was no overall difference between sheep numbers per holding on the Bucks study farms and the regional returns per holding. Overall stocking rates of the moderate and intensive study farms in Devon were higher (P<0.001) than in Bucks (Appendix 2.4). When the extensive farms were included in the analysis there was no significant difference between regions in overall stocking rate. At the regional level, overall stocking rate as shown by the June census data was higher in Devon than Bucks. This difference was due to higher (P<0.001) cattle numbers in Devon than in Bucks, which were 3.2 compared with 1.7 ha-1 (s.e.d. ± 0.072 d.f. = 23) respectively. There was no significant difference in the numbers of sheep between regions.
Stocking rate on the study farms and N input were significantly related in each region in each year. The slope coefficient was similar for both regions and between years so a combined relationship is shown in Fig. 2.3. N input took account of farmyard manure, slurry and dirty water application. Some movement along the LU: N slope by individual farms, particularly in the moderately intensive category, was apparent during the project. Movement downward, i.e. reduction in N usage, was possibly an agri-environment influence as both study regions were partly within ESAs.
Fig 2.3. Relationship between stocking rate and total nitrogen input on the study farms in Devon (filled diamonds) and Bucks (open squares). Individual points represent whole farm values. There are 15 farms for Devon and 12 for Bucks. Data for different years are plotted individually for each farm rather than as means.
Field boundary type and hedgerow structure were recorded for all study fields. Height and width (at 1 m above ground level) of each hedge was estimated at five positions along the hedge length. Measurements of hedge
structure were taken in the autumn and late winter. In Devon observations were made in 1999 and 2000 and in 2000 and 2002 in Bucks. No significant changes in boundary type were found between the two years of observations in either region, so average values are presented.
In Devon 83% and Bucks 85% of the study fields were bounded on one or more sides by hedges that were managed/trimmed in the autumn. Wire boundaries tended to be associated with the more intensive farms in both regions and were more frequent in Devon (21%) than Bucks (8%). When surveyed in the autumn there was a tendency for more hedges to be unmanaged in Bucks (28%) compared with Devon (6%). Unmanaged hedges were found across all farm intensity types. An estimate of the size of each hedge in mid-late winter was derived by multiplying the mean height by mean width. Hedge ‘size’ was greater (P<0.01) on the extensively managed fields in Devon compared with Bucks (Appendix 2.5). Hedge size for moderate or intensively managed fields were similar between the two regions. Hedge width was greater (P<0.001) across all farm intensity types in Devon compared with Bucks, with an overall average of 2.7 m against 2.1 m (s.e.d. ±0.154, with 65 d.f.), respectively. The greater width of the Devon hedges possibly reflects an influence of the bank upon which most hedges were established. The smaller field size and greater hedge size of the extensive fields in Devon compared with Bucks will mean that boundary effects on the field environment are likely to be greater in Devon.
Representativeness of the study farmsThe representativeness of the study farms within their region was examined using the land-use category data. Within Devon there was no significant difference between the percentage of short-term leys, permanent grass or woodland on the selected study farms compared with the region around them (Appendix 2.6). There was, however, a lower (P<0.05) percentage of crops and fallow land on the study farms compared with the region around them. This difference was probably a consequence of the bias in selection towards predominantly livestock/grassland farms. This difference between study farm and region in percent crop and fallow land was present across all the farm types in Devon and Bucks. There was a significantly higher percentage contribution of permanent pasture on the Bucks study farms than in the surrounding region (Appendix 2.7). This difference appeared to be due to the predominance of permanent pasture on the
CSG 15 (Rev. 6/02) 6

Projecttitle
Changes in lowland grassland management: effects on invertebrates and birds
DEFRAproject code
BD1435
moderate and extensive study farms. No difference in the percent of permanent pasture, or crop and fallow land, was found between the intensively managed study farms in Bucks and the regional census data.
3. Vegetation and plant communities in relation to field management
Three aspects of the vegetation were examined in relation to field management – sward structure, floristic composition and the abundance of seeds. Sward structure, in terms of the density and height of the sward, can potentially influence the accessibility of prey for birds feeding in grassland (Vickery et al. 2001). It is widely considered that sward structure is affected by intensity of management in ways that are disadvantageous to birds. We therefore investigated the relationship between herbage mass or sward surface height (termed ‘mass’ and ‘height’ hereafter) and N input, and thus livestock system intensity, on the study fields. Botanical composition is likely to be a critical factor determining the composition of invertebrate communities and, therefore, is expected to have an indirect effect on the food resources available for birds. Whilst seed-eating farmland birds tend to be more abundant in arable than grassland areas, grassland can potentially provide a wide range of plants that offer seed food resources for birds. It is therefore of interest to understand what relationships exist between grassland management and availability of seeds. It is expected that intensively managed swards will hold less abundant seed sources than extensively managed swards.
MethodsEach study field was divided into three zones: (i) the boundary, < 6 m from the field edge, (ii) the middle, midway between the field edge and the centre of the field, (iii) the field centre. Fifty sward surface height measurements were taken within each field zone in mid June and again in September in each of the study fields. At the same time, and close to the location of the sward height measurements, the vegetation within four randomly placed 25 x 25 cm quadrats was cut to ground level. The harvested herbage was dried in a force draft oven at 80 o C to constant weight in order to obtain the standing crop dry mass. It was only possible to obtain ‘snapshot’ information for individual fields, which was a particular problem in the case of cut fields. Effect of N input on sward structure was analysed separately for cut and grazed fields.
Botanical surveys were carried out on all study fields in mid June by recording cover estimates of all higher plant species present within 2m x 2m quadrats placed at random within each of the three field zones. Cover estimates were also made within each quadrat of any bryophytes (all species combined), any detached vegetation (i.e. litter), dung or bare ground.
A measure of the seed resources available for birds on the different study fields was obtained by counting all seedheads present within two 1 x 10 m transects positioned within each zone on each of the study fields in mid-late autumn each year. The seedhead counts were divided into the following categories: grasses (Poaceae), Asteraceae (e.g. Cirsium spp (thistles) and Senecio spp (ragwort), Asteraceae (e.g. Centaurea nigra, black knapweed and other Asteraceae species), Chenopodiaceae (e.g. Chenopodium album, fat hen), Brassicaceae (e.g. Cardamine pratensis, Lady’s-smock), Lamiaceae (e.g. Stachys officinalis, betony), Fabaceae (e.g. Trifolium repens, white clover), Polygonaceae (e.g. Rumex spp., docks), Apiaceae (e.g. Daucus carota, wild carrot) and Urticaceae (e.g. Urtica dioica, stinging nettle). Counts of seedheads of species belonging to plant families other than those listed were included as ‘others’.
Results and discussion Relationship between nitrogen input and sward structure
Height and mass varied both between and within farm management type for cut fields. This variability was probably largely due to the presence of a wide range of regrowth and primary growth stages on the study fields, especially in June. Grouped linear regression of height or mass against N input with either region or year as group variables was carried out. The relationship between sward surface height and N input was consistent between years and between regions: no significant N input x year or region interaction was found. There was also no significant difference between the intercept coefficients for the two regions or between year in the same region. A significant (P<0.001) overall reduction in height was found with increasing N input (Fig. 3.1). The relationship between total N input and height in June was strongly influenced by the fact that the majority of fields with a total input of 0 – 50 kg N ha -1 year-1 had been recently closed for a hay cut in July. When the hay fields were removed from the analysis there was no significant effect of N input on height in June.
CSG 15 (Rev. 6/02) 7
0.0
10.0
20.0
30.0
40.0
50.0
60.0
70.0
0 100 200 300 400
kg N / ha per year
cm
Fig. 3.1. Sward surface heights in June on study fields under cutting management for Devon and Bucks combined.
Fig. 3.2. Herbage ‘density’ (g dry matter per cm ht) in June on study fields under cutting management.

Projecttitle
Changes in lowland grassland management: effects on invertebrates and birds
DEFRAproject code
BD1435
No effect of N input was found on sward mass or density (mass divided by the sward surface height in June). However, it should not be concluded that extensively managed fields offered no significant difference in sward structure for foraging birds. A wide range in sward density was found in fields receiving zero N input (Fig.3.2), and this was associated with considerable differences in botanical composition i.e. spatial heterogeneity between study fields. In contrast, much of the variation in density in the study fields that received high N inputs reflected different states of regrowth from a previous silage cut.
In September there was no significant effect of N input on height or mass of swards that had been cut during the summer. This was probably due, in part, to the fact that the regrowth on most of these fields was grazed off in late summer.
No significant effect of N input on the coefficient of variation about the means of height or mass was found, indicating that low N input was not associated with any greater variation in sward structure compared with high N fields.
No significant effect of N input was found on height, mass or density for the ‘grazed only’ fields in Devon or Bucks in either June or September except for two sampling occasions (Appendix 3.1). The lack of any consistent effect of N input on any of the sward structure variables could indicate that grassland farmers, whether intensive or extensive, had the same management goal - to make optimal use of their fields for production. There were no ‘grazed only’ study fields that were managed primarily for nature conservation objectives; this would have allowed us to examine whether the ‘optimal use’ management goal could have been driving the observed structural similarity across the N input range. Unless grassland management objectives are set to create structural variation within a field then it is to be expected that farmers will aim to optimize herbage utilization.
Relationship between nitrogen input and botanical composition The data were examined for effects of management intensity / N input on plant species diversity and community composition. The effect of N input on species number per m2 was examined initially with study region as a separate factor. As no regional effects were found, the combined data for plant species diversity in relation to N input are presented in Fig. 3.3. The species number data were log transformed prior to regression analysis to normalise the distribution. An exponential model of the form: Y = 0.4976 + 0.6587(0.9935X) accounted for the highest percentage variance (R2 = 0.65) in the highly significant (P<0.001) relationship between species number and N input. This relationship indicated that only fields that received < 25 kg N fertiliser inputs ha -1 year-1 were likely to support plant communities with > 12 species of higher plant per m2. These data accord with experimental evidence showing the high degree of sensitivity of species-rich grasslands to N input (Mountford et al. 1993; Kirkham et al. 1996).
The wide range in species diversity with N inputs of < 25 kg /ha per year indicates that factors other than N input per se were influencing the diversity of the extensively managed fields. Some low input fields are on sites that were formerly more intensively managed and we know this to have happened with at least four fields in Bucks. In such cases,
relatively low species richness is to be expected through lack of dispersal into the fields and the absence of germination or establishment niches, the latter largely arising through high residual fertility giving an advantage to established competitive species.
Fig. 3.3. Plant species richness in relation to nitrogen input on farms in Devon and Bucks.
CSG 15 (Rev. 6/02) 8

Projecttitle
Changes in lowland grassland management: effects on invertebrates and birds
DEFRAproject code
BD1435
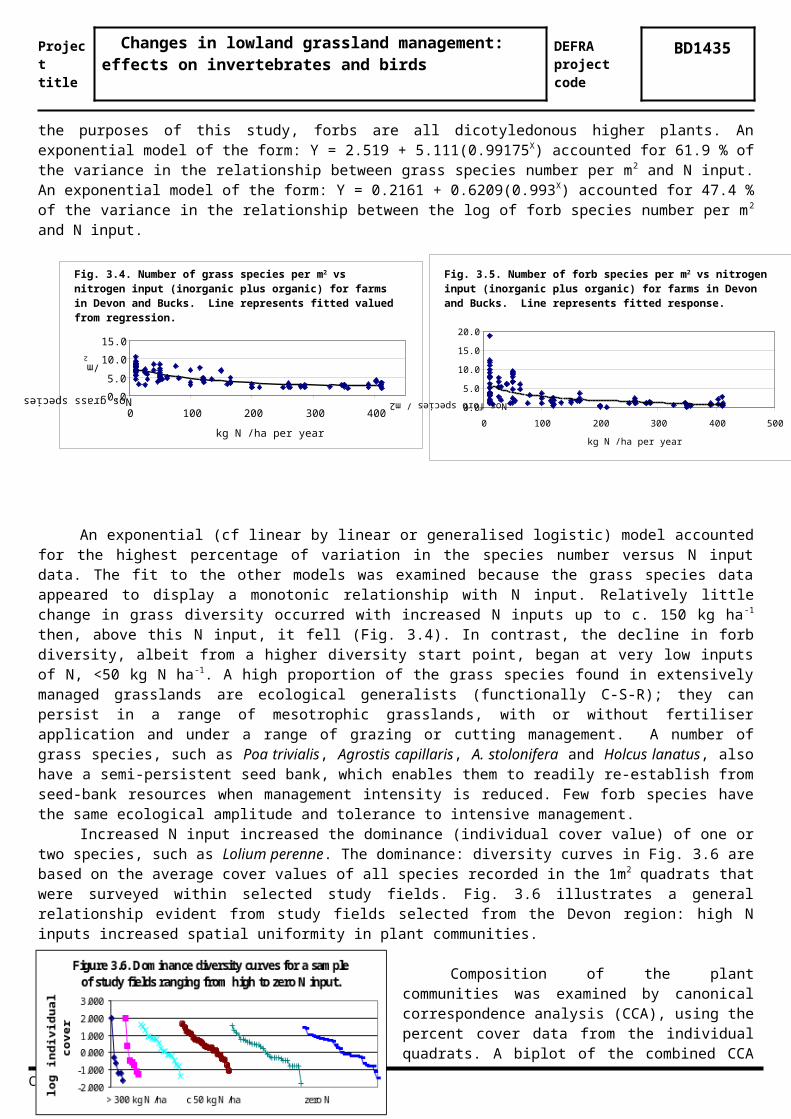
There were also highly significant negative relationships (P<0.001) between N input and grass species diversity (Fig. 3.4) and forb diversity (Fig.3.5). For the purposes of this study, forbs are all dicotyledonous higher plants. An exponential model of the form: Y = 2.519 + 5.111(0.99175X) accounted for 61.9 % of the variance in the relationship between grass species number per m2 and N input. An exponential model of the form: Y = 0.2161 + 0.6209(0.993X) accounted for 47.4 % of the variance in the relationship between the log of forb species number per m2 and N input.
An exponential (cf linear by linear or generalised logistic) model accounted for the highest percentage of variation in the species number versus N input data. The fit to the other models was examined because the grass species data appeared to display a monotonic relationship with N input. Relatively little change in grass diversity occurred with increased N inputs up to c. 150 kg ha-1 then, above this N input, it fell (Fig. 3.4). In contrast, the decline in forb diversity, albeit from a higher diversity start point, began at very low inputs of N, <50 kg N ha -1. A high proportion of the grass species found in extensively managed grasslands are ecological generalists (functionally C-S-R); they can persist in a range of mesotrophic grasslands, with or without fertiliser application and under a range of grazing or cutting management. A number of grass species, such as Poa trivialis, Agrostis capillaris, A. stolonifera and Holcus lanatus, also have a semi-persistent seed bank, which enables them to readily re-establish from seed-bank resources when management intensity is reduced. Few forb species have the same ecological amplitude and tolerance to intensive management.
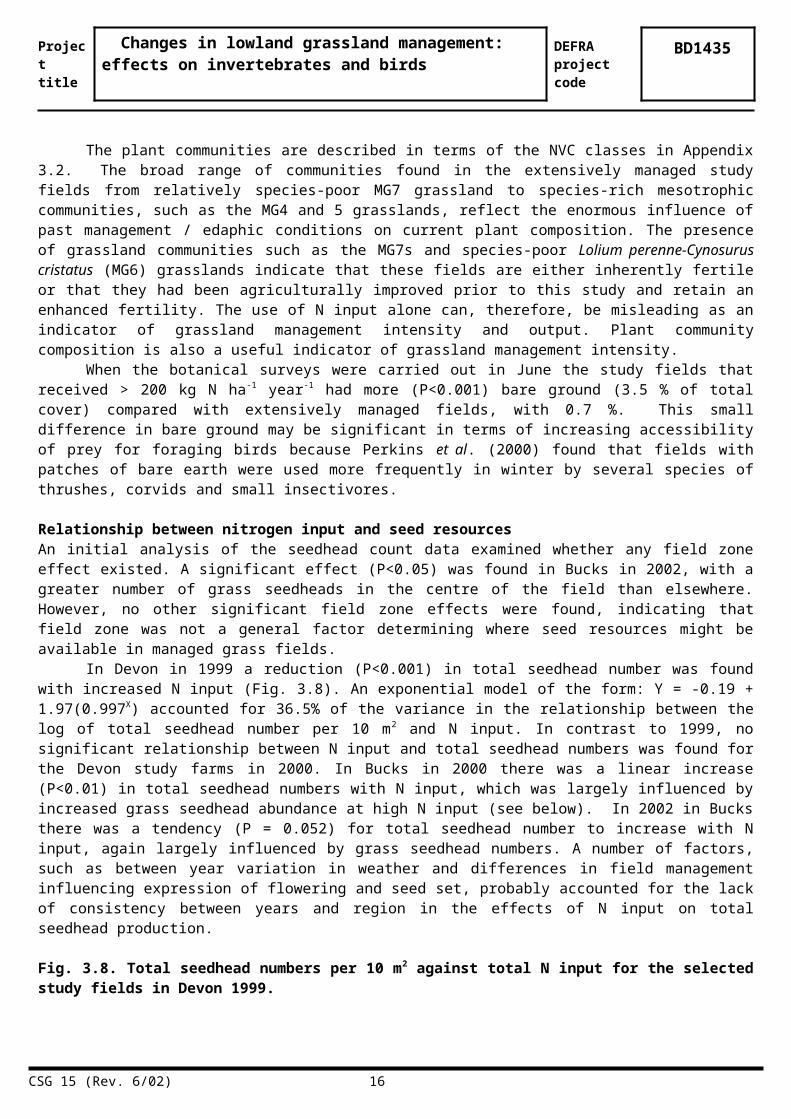
Increased N input increased the dominance (individual cover value) of one or two species, such as Lolium perenne. The dominance: diversity curves in Fig. 3.6 are based on the average cover values of all species recorded in the 1m 2
quadrats that were surveyed within selected study fields. Fig. 3.6 illustrates a general relationship evident from study fields selected from the Devon region: high N inputs increased spatial uniformity in plant communities.
Composition of the plant communities was examined by canonical correspondence analysis (CCA), using the percent cover data from the individual quadrats. A biplot of the combined CCA (Fig. 3.7) illustrates that total N input appears to be the key environmental vector separating the plant communities along axis 1. Interestingly, there is some separation on axis 1 of the extensive ‘grazed only’ fields and the extensive hay fields, this shift probably relates to the greater amount of N and other nutrients being cycled under grazing than in cut fields. Herbage mass in the autumn appears to be an
important factor separating communities along axis 2. In the intensively managed fields, separation along axis 2 appears to be associated with grazing or cutting for silage. Frequent/intensive grazing will maintain a highly tillered dense sward with a high mass, whereas, particularly during early stages of regrowth following cutting, herbage mass can be relatively low. The wide spread / separation along axis 2 of the extensively managed plant communities of Devon and Bucks indicates the presence of distinct differences in plant community composition between regions. The presence of the Alopecurus pratensis-Sanguisorba officinalis (MG4) flood meadow community in Bucks, but not in Devon and the separation of Cynosurus cristatus-Centaurea nigra (MG5) grassland communities of Devon and Bucks in Fig. 3.7 illustrate this regional distinctiveness.
CSG 15 (Rev. 6/02) 9
0.0
5.0
10.0
15.0
0 100 200 300 400
kg N /ha per year
Nos grass species
/m2
Fig. 3.4. Number of grass species per m2 vs nitrogen input (inorganic plus organic) for farms in Devon and Bucks. Line represents fitted valued from regression.
0.0
5.0
10.0
15.0
20.0
0 100 200 300 400 500
kg N /ha per year
Nos forb species / m2
Fig. 3.5. Number of forb species per m2 vs nitrogen input (inorganic plus organic) for farms in Devon and Bucks. Line represents fitted response.

Projecttitle
Changes in lowland grassland management: effects on invertebrates and birds
DEFRAproject code
BD1435
Fig. 3.7. A sample-focused CCA biplot of both the Devon and Bucks plant communities (species data log transformed). Symbols represent individual fields: Region - Thick black-edged symbols = sites in Devon, Thin black-edged symbols = sites in Bucks. Management - Triangles = cut for hay, Diamonds = cut for silage, Squares = grazed. Management intensity - Open symbols = extensive, Light grey = moderate, Dark grey = intensive. Arrows represent environmental gradients (sward heights included in the analysis were closely correlated with sward mass and are excluded here for greater clarity). The two most species rich communities, MG4 and MG5 (national vegetation classification), are also indicated.
Model % Variance explained P(Monte Carlo)
Summary table of CCA on all plant communities Devon 1999 and Bucks 2000 and 2002
Sq.rt. N + sward mass (June) + sward mass (Sept) + sward ht (June) + sward
ht (Sept)
18.2% (1st axis accounts for 9.2%, 1st two axes for 14.1%) 0.002
The plant communities are described in terms of the NVC classes in Appendix 3.2. The broad range of communities found in the extensively managed study fields from relatively species-poor MG7 grassland to species-rich mesotrophic communities, such as the MG4 and 5 grasslands, reflect the enormous influence of past management / edaphic conditions on current plant composition. The presence of grassland communities such as the MG7s and species-poor Lolium perenne-Cynosurus cristatus (MG6) grasslands indicate that these fields are either inherently fertile or that they had been agriculturally improved prior to this study and retain an enhanced fertility. The use of N input alone can, therefore, be misleading as an indicator of grassland management intensity and output. Plant community composition is also a useful indicator of grassland management intensity.
When the botanical surveys were carried out in June the study fields that received > 200 kg N ha -1 year-1 had more (P<0.001) bare ground (3.5 % of total cover) compared with extensively managed fields, with 0.7 %. This small difference in bare ground may be significant in terms of increasing accessibility of prey for foraging birds because Perkins et al. (2000) found that fields with patches of bare earth were used more frequently in winter by several species of thrushes, corvids and small insectivores.
Relationship between nitrogen input and seed resources An initial analysis of the seedhead count data examined whether any field zone effect existed. A significant effect (P<0.05) was found in Bucks in 2002, with a greater number of grass seedheads in the centre of the field than elsewhere. However, no other significant field zone effects were found, indicating that field zone was not a general factor determining where seed resources might be available in managed grass fields.
In Devon in 1999 a reduction (P<0.001) in total seedhead number was found with increased N input (Fig. 3.8). An exponential model of the form: Y = -0.19 + 1.97(0.997X) accounted for 36.5% of the variance in the relationship between the log of total seedhead number per 10 m2 and N input. In contrast to 1999, no significant relationship between N input and total seedhead numbers was found for the Devon study farms in 2000. In Bucks in 2000 there was a linear increase (P<0.01) in total seedhead numbers with N input, which was largely influenced by increased grass seedhead abundance at high N input (see below). In 2002 in Bucks there was a tendency (P = 0.052) for total seedhead number to increase with N input, again largely influenced by grass seedhead numbers. A number of factors, such as between year variation in weather and differences in field management influencing expression of flowering and seed set, probably accounted for the lack of consistency between years and region in the effects of N input on total seedhead production.
Fig. 3.8. Total seedhead numbers per 10 m2 against total N input for the selected study fields in Devon 1999.
CSG 15 (Rev. 6/02) 10
-1.0 1.5
-1.0
1.5
sq rt N
Sward mass June
Sward mass September
MG4
MG5
MG5
MG5
MG5
Projecttitle
Changes in lowland grassland management: effects on invertebrates and birds
DEFRAproject code
BD1435
Grouped linear regression of log grass seedhead number against N input with either region or year as group variables were carried out. A significant (P<0.001) positive response in grass seedhead abundance was found with increased N input (Fig. 3.9). There was a tendency (P = 0.052) for a steeper response of grass seedhead abundance to N input in Bucks in 2002 than in 2000. Grass seedhead numbers for Devon 1999 were not used in this analysis because the counts included other plant families. The tendency for higher grass
seedhead numbers with increasing N input was largely associated with the ability of Lolium perenne and L. multiflorum, in particular, to produce flower heads in late summer. Many Lolium seedheads were associated with ungrazed patches of sward around cattle dung pats. The combination of high fertility, the presence of tillers able to initiate flowering and seedhead development and lenient or lack of grazing contributed to the development of late summer seedhead production by grasses. Some farmland birds eat grass seeds in winter, especially Poa (Wilson et al. 1999). This raises the possibility of enhancing food resources for birds through management and this issue is returned to in the General Discussion (section 6). However, seeds of broad-leaved weeds appear to be far more important as foods for farmland birds than those of grasses (Wilson et al. 1999).
Fig. 3.9. Relationship between log of grass seedhead number per 10 m2 against total N input.
Initially the impact of N input on forb seedhead numbers was examined on the combined data for all forb families together. A few study fields under low N input produced an exceptionally high abundance of seedheads. However, grouped linear regression analysis carried out on log transformed data showed that there was in fact no significant effect of N input on forb seedhead number in any year in either region. Forb seedhead abundance was low across the range of N inputs. In Devon, 22% of the study fields had no forb seedheads, 47% had less than five seedheads per 10m2. In Bucks 52% of the study fields had no forb seedheads, 86% had less than five seedheads per10m2. A possible reason for the regional difference between Bucks and Devon in forb seedhead abundance may be that the relatively high sheep numbers and summer
grazing by sheep reduced forb seedhead abundance on many of the Bucks fields. Appendix 3.3 gives more detail on forb composition.
4. Invertebrates in relation to field management
Invertebrates form the major foods of birds using grassland, both in summer and winter. It is, therefore, important to gain an understanding of how the abundance of those invertebrate taxa forming major components of the diet of grassland birds is affected by the management of grassland. Unfortunately, information on the exact diets of grassland birds is unavailable but there is sufficient general knowledge to identify the major taxa that should be targeted in sampling programmes (Vickery et al. 1999, Wilson et al. 1999). In this project all the study fields were sampled for:
soil invertebrates (earthworms, beetle (Coleoptera) larvae, leatherjackets (Tipulidae) and other fly larvae) slugs
CSG 15 (Rev. 6/02) 11
Bucks 2002
Bucks 2000
Devon 2000

Projecttitle
Changes in lowland grassland management: effects on invertebrates and birds
DEFRAproject code
BD1435
surface-active (epigeal) invertebrates (ground beetles (Carabidae), beetle larvae and spiders (Araneae)) foliar invertebrates (beetles, true bugs (Heteroptera), spiders, leaf/plant hoppers (Auchenorrhyncha), caterpillars of
moths and butterflies (Lepidoptera) and sawfly larvae (Symphyta))
Throughout the rest of this report English common names will be used for invertebrate groups and the term ‘leafhoppers’ will be used for all Auchenorrhyncha. MethodsSoil invertebrates were sampled by taking nine soil cores measuring 10 cm diameter by 10 cm depth from each of the study fields (three in each of the boundary, middle and centre zones) in the spring and autumn of each study season. Potential food items for birds were extracted from the cores by hand sorting and counted. Slugs were sampled both in the spring and autumn of each study season by leaving six upturned plastic saucers (18cm diameter) overnight in each field (three in each of the boundary and centre zones). The saucers and the grass underneath were then searched thoroughly for slugs which were taken away for identification. Too few slugs were trapped in either region to allow statistical analyses. Epigeal invertebrates were sampled using nine pitfall traps in each field, equally distributed across the three zones. Pitfall traps were set for one week in the early spring of each year (except 2001). The number of invertebrates trapped by pitfall traps is influenced not only by their density but also by their activity so the derived measures should be regarded as ‘activity-density’ rather than ‘density’. Invertebrates associated with foliage were sampled in the early summer and autumn of each field season using a Vortis suction sampler (Burkhard Manufacturing). Nine samples, each consisting of eight 10-second sucks, were collected in each field, three samples in each of the three zones, covering a total area of 1.4 m2 per field.
In addition to count data, indirect measures of the biomass of certain invertebrate groups were obtained for a number of the sites / surveying times by calculating or measuring the sizes of individuals in the samples. For ground beetles, the Weight Median Length (median point of biomass distribution) of each species was calculated according to Jarošík (1989) using beetle length ranges given in Lindroth (1974). This allowed the average WML score per individual to be calculated for each sample. Sizes of key bird-food invertebrates collected by suction sampling were measured for Devon (autumn 1999 and summer 2000) and Bucks (summer 2000 and 2002 (beetles only)). Individuals in these invertebrate groups were measured on grids and placed into classes <2mm, 2-5mm, 5-10mm,10-15mm and >15mm. Counts of individuals in classes were used in analyses.
The abundance and community composition of various groups of invertebrates was examined in relation to both management and vegetation variables (vegetation methods are described in section 3). Abundance / abundance-activity measures of invertebrates at group level were analysed in relation to management and vegetation variables using stepwise multiple regressions. Ordination approaches were used to examine how the composition of beetle assemblages varied in relation to management and vegetation variables.
Due to the intercorrelation of several management and vegetation variables, and the need to discuss the responses of invertebrates both in terms of general management intensification processes and specifically in relation to vegetation characteristics, two regression approaches were adopted. First, regression of invertebrate abundance or abundance-activity against up to three vegetation variables as appropriate to the period in which the invertebrates were trapped. For soil and epigeal invertebrates, plant species richness was the only vegetation variable used. For foliage invertebrates three vegetation variables were used: plant species richness, sward height (measured in June or September) and sward height variance (measured in June or September). Second, regression of invertebrate abundance or abundance-activity against three management variables i.e. nitrogen input (kg ha-1 year-1) and two variables derived from the axis 1 and axis 2 of the ordinations of management data shown in Fig. 2.1. Where either of the ordination-derived variables was selected, this was expressed in terms of the main management characteristic of the gradient. Stepwise regressions were run both forwards from the null model, and backwards from the maximal model to determine the stability of selections.
Due to the relative homogeneity of the pitfall trap ground beetle data, it was deemed that linear ordination techniques, PCA and Redundancy Analysis (RDA) (Ter Braak and Smilauer, 2002), were appropriate for the analysis of species composition effects in all years and regions. To avoid problems with ‘rare’ species and vagrants all species represented by only one individual were removed from the analysis. Numbers of ground beetles per trap were untransformed throughout and were standardised by the sample norm, i.e. the relative abundance of species in the samples was compared (more appropriate as pitfall traps measure activity-density). The sward-dwelling beetle communities that were sampled in early summer were more heterogeneous than the ground beetle pitfall data so the unimodal method of Canonical Correspondence Analysis (CCA) was used. As with the pitfall data, singletons were excluded and the data were not transformed.
Results and discussion Soil invertebrates (soil core data)
CSG 15 (Rev. 6/02) 12

Projecttitle
Changes in lowland grassland management: effects on invertebrates and birds
DEFRAproject code
BD1435
The soil invertebrates were generally patchily distributed. The results of the stepwise regression analyses are summarised in Appendix 4.1; significant regressions were obtained in approximately 50% of analyses performed.
In spring 1999, earthworm density was highest in Devon fields that were characterised by higher concentrations of nitrogen (P = 0.014) and lower plant species richness (P = 0.003). However, in other years and in Bucks, no significant relationships between earthworm density and vegetation or management variables could be detected, with the exception of a positive relationship with grazed fields in Devon 2000 (P = 0.032). Previous studies (reviewed in Vickery et al. 1999, 2001), suggest that moderate increases in nitrogen may enhance earthworm densities so simple relationships with management intensity are not to be expected. The most striking result was that the density of beetle larvae in the soil was consistently lower in fields with higher management intensity (characterised by higher levels of nitrogen application, lower plant species richness or relatively little silage cutting) (P = 0.002 to 0.032). Only in Devon (spring 1999) was there no negative relationship between beetle larvae and management intensity. Results for other invertebrate groups were less conclusive, since there were too few significant trends to provide generalisations.
Epigeal invertebrates (pitfall data)Analyses of activity-density: Results of regression analyses are summarised in Appendix 4.2. Relationships were not consistent between the two regions. In Devon, the activity-density of several groups (all beetles 1999, ground beetles 1999 and 2000, beetle larvae 1999 and 2000), and the species richness of ground beetles (both years), increased with management intensification (characterised by higher levels of nitrogen application and lower plant species richness (P = 0.026 to <0.001)). The opposite trend was observed in Bucks fields sampled in 2002, with greater ground beetle and spider activity-density in fields with lower management intensity (lower levels of nitrogen application, higher plant species richness (P <0.001)). However, in common with observations in Devon, surface-active beetle larvae were collected in larger numbers in fields with higher management intensity (P<0.001).
Although this latter result apparently contradicts the finding from the soil cores (see above) and the suction samples (see below) that beetle larvae were less abundant in intensive fields, it should be noted that the three techniques sample larvae from different habitat strata (soil, ground layer, foliage layer). The species composition of beetle larvae is likely to vary distinctly among the three strata, each level potentially comprising larvae with different life history / feeding strategies and response to management impact. Although, owing to the complexity of identification of beetles in the larval phase, larvae were not routinely identified to species level, it was noted that the larval assemblage recorded in pitfalls appeared to be dominated by the genus Nebria. This lends further credence to the supposition that observed differences in overall larval response to management could be attributed to differences in the relative species composition in each habitat stratum. It should also be considered that while soil cores and suction samples provide measures of invertebrate abundance, pitfall catches are also influenced by degree of activity. A larger pitfall catch in the more intensive fields can reflect a combination of higher abundance and or activity.
Analyses of ground beetle communities: Ordination analyses showed that the species composition of the ground beetle assemblage was strongly related to grassland management. Example ordination plots are shown in Appendices 4.3 and 4.4, and a summary of the main points from all the ground beetle ordinations is given in Appendix 4.5).
The ground beetle communities in Devon and Bucks were similar in terms of the species found. Although the pitfall trap catch differed between years, the community structure remained fairly stable and of the measured environmental variables, plant species richness explained most differences in community composition. This was most evident in the low nitrogen, hay cut fields where the indicator species of the communities present included several seed-eating and phytophagous species. Management played an important role in both regions with the species composition of assemblages differing between cut and grazed fields and between hay cut and silage cut fields (see Appendices 4.3 – 4.5). As well as community differences, there was also evidence that the biomass distribution varied among management intensities. The ground beetle WML was greatest in fields that were low in nitrogen input and rich in plant species (especially ones cut for hay) with communities dominated by large species such as Pterostichus versicolor in Devon and Pterostichus cupreus in Bucks. In contrast, the higher nitrogen fields, especially ones cut for silage, were dominated by small species (low WML) e.g. Bembidion spp. This relationship between body size and management intensity is in agreement with other studies (e.g. Blake and Foster, 1998). More seed-eating species such as Amara spp. were found in the low nitrogen, plant species rich fields in Devon.
It is possible that these differences in the biomass distribution of ground beetles could be explained in terms of disturbance, high levels of which may select for species with relatively small body size. Beetles with large body size typically have a longer larval development period, sometimes taking several seasons to reach reproductive age. Selection against species with long larval development periods may occur in highly disturbed environments, if the disturbance has the capacity to remove individuals from the population before they reach reproductive age. Beetles with large body size are often less mobile and therefore may also run increased risk of mortality as adults. Several aspects of intensive grassland management may increase the risk of mortality in species that are unable to avoid the disturbance event. High
CSG 15 (Rev. 6/02) 13
Projecttitle
Changes in lowland grassland management: effects on invertebrates and birds
DEFRAproject code
BD1435
nitrogen, grazed fields have a livestock carrying capacity much higher than that of low nitrogen fields. Therefore the soil / ground disturbance by the animals will be greater. Although silage fields are relatively undisturbed by livestock during a season, they may be cut two or more times and cutting can be devastating. Modern mowers and collectors ensure that a field is ‘sucked clean’ of all cut grass and ground-dwelling fauna with the whole operation often completed on the same day. Beetles found in these habitats typically have relatively high dispersal powers. Hay making, however, takes place over a longer period of time, allowing the fauna to escape in the litter and field boundaries. When the hay is collected there is, therefore, less invertebrate‘by-catch’.
Sward-dwelling invertebrates (vortis sampling)Analyses of density: Results of regression analyses are summarised in Appendix 4.6. The abundance of leafhoppers was positively and significantly correlated with increasing plant species richness (P = 0.04 to <0.001) e.g. see Fig. 4.1and 4.3. This indicates that leafhoppers achieved greater abundance at lower intensities of management. The abundance of several other groups (adult beetles, beetle larvae, spiders) was described most consistently in relation to sward height P = 0.046 to <0.001) e.g. see Figs. 4.2 and 4.4. The density of these groups was greater in taller swards. Although several other groups, (caterpillars, sawfly larvae and true bugs) were less abundant and more patchily distributed, there was evidence that these were also influenced by variation in management intensity. In particular, greater numbers of caterpillars and sawfly larvae were consistently collected in the taller, botanically diverse swards where less intensive grassland management was practised (P = 0.02 to <0.001). These patterns of management intensity negatively affecting the density of various groups of foliar invertebrates were evident in both regions.
A refinement of these analyses considered the abundance of invertebrates deemed large enough to be potential food for birds (i.e. greater than 2 mm body length). Regressions of leafhoppers, beetles, true bugs and spiders greater than 2mm in body length were consistent with patterns found in the wider dataset.
CSG 15 (Rev. 6/02) 14
1.00
1.50
2.00
2.50
3.00
0 10 20 30 40
Number of plant species
Log1
0(x+
1) L
eaf/p
lant
hop
per
abun
danc
e
1.00
1.50
2.00
2.50
2 7 12 17 22 27
Average sward height (cm)
Log1
0(x+
1) b
eetle
(adu
lt)
abun
danc
e
Fig. 4.2. Relationship between beetle abundance and mean sward height, Devon, September 1999. (Variance explained = 15.2%, d.f. = 1,42, P=0.005)
Fig. 4.1. Relationship between leafhopper abundance and number of plant species in Devon, September 1999. (Variance explained = 46.4%, d.f. 1,43, P<0.001)
1.00
1.50
2.00
2.50
3.00
3.50
0 10 20 30 40 50
Number of plant species
Log1
0(x+
1) L
eaf/p
lant
hop
per
abun
danc
e
1.00
1.50
2.00
2.50
3.00
2 4 6 8 10 12 14 16
Average sward height (cm)
Log1
0(x+
1) b
eetle
adu
lt ab
unda
nce
Fig. 4.3. Relationship between leafhopper abundance and number of plant species in Bucks, September 2002. (Variance explained = 35.1%, d.f. = 1,46, P<0.001)
Fig. 4.4. Relationship between beetle abundance and sward height in Bucks, September 2002. (Variance explained = 33.9%, d.f. = 1,46, P<0.001)

Projecttitle
Changes in lowland grassland management: effects on invertebrates and birds
DEFRAproject code
BD1435
Analyses of beetle communities: Overall variation in foliage beetle communities explained by plant richness and management variables tended to be smaller than for ground beetle analyses. Details of the ordinations are in Appendices 4.7 – 4.9.
Plant species richness was important in explaining the differences in foliage-dwelling communities. Cutting and grazing were also important but this may have been because of their indirect effect on sward height rather than any direct effects. As with the epigeal ground beetles, the communities inhabiting low nitrogen, hay cut fields were distinguished by the presence of phytophagous species (possibly more available to birds because they are day-active on the vegetation).
In the Devon 1999 analysis (Appendix 4.7), differences in beetle communities were explained by plant species richness and to a lesser extent cutting vs. grazing (10 % variation in species explained by canonical axes, P<0.05). The low N hay cut fields were characterised by the presence of phytophagous species e.g. Apion assimile, Longgitarsus pratensis, Hypera plantaginis, Sitona sulcifrons and the high N, silage cut fields were characterised by predatory species, e.g. Oxypoda brachyptera, Philonthus cognatus, Alconota gregaria, Tachyporus chrysomelinus.
In the Bucks 2002 analysis (Appendix 4.8), beetle communities of low nitrogen fields with tall diverse swards differed from a larger group of fields with shorter swards (15.6% of variation in species explained by canonical axes, P<0.05). Axis 1, which related to a plant species richness / nitrogen inputs gradient, explained 8.7 % of species variation and axis 2, which was predominantly related to sward height, explained an additional 4.5 % of variation. As before, fields that were low in nitrogen and rich in plant species, supported more phytophagous species e.g. Apion trifolii, Sitona sulcifrons, Apion assimile. High N fields were characterised by predators and detritivores e.g. Oligota picipes, Tachyporus hypera, Atomaria testacea, Stilbus testaceus. Those fields with shorter swards had communities that separated along a nitrogen gradient.
5. Grassland bird communities and relationships to field management
The aim of the winter and summer bird work was twofold. Firstly, variation in the usage of individual fields by feeding birds was examined in relation to management variables and invertebrate abundance. Secondly, geographical variation in grassland bird assemblages was examined at two scales: (a) between Bucks and Devon and (b) more broadly, at the national scale.
Methods In winter, a minimum of 4 visits was made to the target fields, spread as evenly as possible between early November and the end of February in each of the three winters 1999/2000 to 2001/2002. On each field / visit three types of counts were made as follows (1) two point counts (one minute each) at opposite sides of the field for birds using the field surface, (2) perimeter walks around the entire field edge, recording birds at the field edge and in the boundary, (3) transect counts on which birds were recorded within 10 m of two straight transects, 50 m apart, across the centre of the field starting and finishing 20 m from the boundary, mainly to detect skylarks and meadow pipits. These three types of count were designed to maximise the probability of detecting all birds using the field during the visit; this meant that relatively large fields received more field effort than relatively small fields. This was accounted for in the analyses by incorporating field area into all models (see below). On each visit to the study fields, the following were recorded: sward structure (patchy / tussocky / uniform), sward height, presence of grazing animals, number of molehills (an indicator of earthworm abundance as well as of bare soil), proportion of bare ground and boundary features. The data presented in this report focus on the above counts, but an additional extensive survey was conducted in each of the three winters, involving 2 or 3
CSG 15 (Rev. 6/02) 15
Projecttitle
Changes in lowland grassland management: effects on invertebrates and birds
DEFRAproject code
BD1435
visits, during which birds were counted on several hundred fields in both Devon and Bucks. The fields covered lay within selected 1 km squares on a chequerboard layout centred on the study farms in each region.
In the summer, territory mapping, involving three to four visits, was undertaken to determine the range of breeding species present on each study farm and to provide information on which species foraged on and over fields. In this report we focus on data derived from timed feeding counts which provided systematic information on the frequency with which different species foraged in the target fields. These were made along 100 m stretches of field boundary, typically four such stretches per field. Birds were recorded over a five minute period in six distance bands from the field edge up to 100 m from the boundary. At least four sets of timed feeding counts were made for each field spread across the breeding season.
Management scores from the management PCA (see section 2) were used as surrogates for detailed management information. Axis 1 describes a gradient of total N application from low to high. Mean values of this axis score were taken for all relevant years for each field and this variable is referred to as ‘nitrogen gradient’ in Appendices 5.4 and 5.7. Axis 2 broadly represents a grazing to cutting gradient. A mean axis 2 score was not calculated as this tended to have a nominal response i.e. cut and grazed, cut once or cut twice. All the boundary features recorded for each field were entered into a PCA and major gradients identified in the boundary characteristics of fields (Appendix 5.1).
In all years and both regions, zero counts were obtained for individual species on the great majority of fields surveyed (see Appendices 5.3 and 5.6 for details of field occupancy). Modelling abundance or density using traditional generalized linear model-type analyses was not possible as the error distribution did not conform to normal or Poisson error distributions. Therefore repeated measures logistic regression (to take account of non-independence of different visits to the same field) with the field as the sampling unit was used to examine species-environment relationships, including direct relationships with invertebrate abundance, for all species recorded on more than 5% of occasions. The full range of independent variables considered is listed in Appendices 5.4 and 5.7 for winter and summer analyses respectively. Separate sets of analyses were undertaken for each region and year using the SAS GENMOD procedure. To test for non-linear relationships, quadratic terms were included in all models, except those for the grazing – cutting axis, boundary features and invertebrates. Effects of field area were taken into account in all models by including field area alongside the independent variable of interest. Statistically significant relationships in Appendices 5.4 and 5.7 are those that remain when any effects of field area have been accounted for.
Analyses that related birds to invertebrate groups adopted specific rules for defining potential food resources. Potential winter foods for large invertebrate feeders were all taxa from autumn soil cores and vortis samples taken before the winter (except vortis samples were not regarded as potential food for corvids) and all taxa from spring soil cores and spring pitfalls taken after the winter. Potential winter foods for small invertebrate feeders were beetle larvae sampled by soil cores and all taxa from vortis samples in the autumn before the winter and all beetle larvae from soil cores and all taxa, except large ground beetles, from spring pitfalls in the spring after the winter. In summer, food resources for large invertebrate feeders were regarded as all taxa from spring soil cores, pitfalls and the early vortis samples (individuals >5 mm). For small invertebrate feeders, potential foods were beetle larvae and fly larvae from spring soil cores, all taxa except large ground beetles from pitfalls, and all taxa from the early vortis samples. Aerial feeding birds were not matched to invertebrate groups. Seed densities were only matched to species that eat significant quantities of seed. See Appendices 5.4 and 5.7 for more details.
Two studies of grassland birds were undertaken at the national scale. First, an analysis of bird distributions, using summer and winter distribution data from BTO atlases, was undertaken with the aim of quantifying the extent to which different farmland birds were associated with pastoral, mixed and arable landscapes. The detailed methods are described in Atkinson et al. (2002); this paper is included as Appendix 5.8. Second, a national (lowland England) survey of lowland grassland bird communities was carried out to assess the extent to which regional variation exists in these communities. One km squares were selected at random within grass-dominated regions of lowland Britain (mainly western England, southwest Scotland and Wales) or in areas of mixed arable and grassland farming (mainly the English Midlands and central southern England). Volunteer observers surveyed areas of grassland below 200 m, within these 1-km squares. Grass fields within each square were visited three times between November 2000 and February 2001 and twice between April and June 2002. Observers recorded the condition of each grass field according to the following definitions: ‘improved’ grassland had been obviously fertilised and appeared bright green, lush, dense and even in texture whereas ‘unimproved’ grassland had not been obviously heavily treated with fertilisers and appeared uneven in growth and colour. It should be noted that these categories are relative and do not relate directly to the intensive, moderate and extensive categories used elsewhere in this report. A total of 93 sites was visited which included a total of 1968 fields of which 1028 were identified as either ‘improved’ or ‘unimproved’ (the rest were not classified).
CSG 15 (Rev. 6/02) 16

Projecttitle
Changes in lowland grassland management: effects on invertebrates and birds
DEFRAproject code
BD1435
Results and discussionWinter bird communities in Bucks and DevonIn winter, the bird communities associated with fields in the two regions showed some differences in terms of their species composition. Correspondence Analysis showed that Redwing, Fieldfare, Song Thrush, Starling and Yellowhammer were more strongly associated with fields in Bucks (Appendix 5.2). The frequency with which different species were associated with different regions in different years is summarised in Appendix 5.3; this emphasises that most species occurred on a low proportion of fields. Whilst the majority of species showing regional differences were more frequently recorded in Bucks, a few species were associated primarily with Devon, notably Snipe and Grey Wagtail.
Results of logistic regression analyses are given in Appendix 5.4. It should be stressed that significant results from these analyses do not guarantee a causal relationship, because the independent variable may simply be correlated with another variable that is ecologically important to the species. There were few consistent relationships between the presence of bird species and aspects of field management across the two regions; many relationships were only evident in one year / region. The following account emphasises the main patterns and strongest associations.
A total of 10 out of 16 species showed relationships with the nitrogen gradient i.e. with overall management intensity. However, in most of these cases, relationships were evident in just one year / region combination. Carrion Crow was an exception because it was more frequently recorded on highly intensive fields in four out of six data sets. Interestingly, most of the significant results involved higher occupancy of intensive fields. There were very few associations with the grazing to silage gradient. This is unsurprising as these management data were collected in summer and may not be relevant to the winter period. However, nine species showed relationships with the presence of grazing animals, with corvids generally associating with them but thrushes avoiding them. Sward height was negatively associated with field use for four large invertebrate feeders in Bucks (Rook, Jackdaw, Magpie and Starling), but one small insectivore, Meadow Pipit, was recorded consistently more frequently in tall swards in Devon. Boundary variables generally had little effect on field usage, though Meadow Pipits strongly selected fields with trees in the surrounding boundary, perhaps because these provided shelter or a source of blown insects. In Bucks, six species were positively related to abundance of molehills and three to amount of bare ground.
Relationships with abundance of food resources were surprisingly few in number and generally weak (Appendix 5.4). The strongest positive ones (P<0.01) were for Meadow Pipit with seeds in Bucks (2001) and Pied Wagtail with autumn spiders in Devon (1999). Unexpectedly, only 23 significant relationships were identified out of a potential total of 976. Clearly many of the significant relationships may be chance effects. There were actually more negative (14) than positive (nine) relationships with invertebrate samples. It is possible that sampling some groups of invertebrates in autumn or spring does not give a good index of food abundance in winter, or that birds were feeding in areas or on invertebrates that were not sampled. However, this is unlikely to explain this extremely low rate of detected relationships with food resources. This strongly suggests that factors other than simple food abundance are important in determining field use by birds in winter. These factors may include food availability, which is likely to be strongly affected by various components of sward structure, and the social behaviour of flocking species.
Previous studies have also found effects of field management on the occurrence of wintering bird species in fields. Use of farmyard manure (FYM) has been suggested to increase the probability that permanent grass fields will be used by several species of large invertebrate feeders (Tucker 1992). The present study was designed to investigate general relationships between overall management intensity as indexed by total N than with the effects of specific inputs. In a single year study of 77 fields in Oxfordshire, Wiltshire and Warwickshire, Perkins et al. (2000) found rather more relationships with field management than were evident in the present study and in some cases their results contradicted ours. They stressed the importance of grazing and bare earth patches to several bird species. They also found several significant responses to sward height, though the effect of sward height differed among species. It is unclear how the study sites used by Perkins et al. (2000) were selected, or whether they were representative of the wide region from which they were drawn. They may have embraced a larger variation in habitat characteristics than was evident in our study fields but the rigorous approach taken to site selection in the present study should have generated a wide range of sward structures and management intensities.
Summer bird communities in Bucks and DevonThere were marked differences between regions in the nature of the summer feeding bird assemblage on grass fields. In general bird communities in Bucks were more diverse and there was more variation between individual fields (Appendix 5.5). In contrast, in Devon there was relatively little variation in the bird community between fields. The occurrence of individual species in Bucks and Devon is summarised in Appendix 5.6 which shows that most species occurred on a low proportion of the fields. Considering those species that occurred on at least 1% of occasions, Woodpigeon and Stock Dove, many of the ground invertebrate feeders, and several of the smaller passerines occurred more frequently on fields in Bucks. However, aerial feeders and several thrush species occurred more frequently on Devon fields.
CSG 15 (Rev. 6/02) 17

Projecttitle
Changes in lowland grassland management: effects on invertebrates and birds
DEFRAproject code
BD1435
Relationships between summer bird assemblages and management and other attributes of fields are summarised in Appendix 5.7. There were very few relationships with the nitrogen gradient i.e. with overall management intensity and no consistent relationships with the grazing to silage gradient. Corvids showed positive relationships in Bucks. However, the most striking results were with sward height, with eight out of 12 species showing negative relationships (i.e. decreasing occurrence with increasing height). In six cases this result was obtained in both regions. No species was positively related to sward height. Relationships with boundary features were non-existant except that in Bucks Skylark avoided fields that had large hedges.
As with the winter, there were few relationships with food resources. Out of 480 possible relationships, only 23 were found to be significant and 17 of these were negative. The interpretation of these results is much the same as for winter except that for summer we can be more certain that the samples do reflect food abundance during the season of interest. We believe that this unexpected result is compelling evidence that access to food supplies is a critical factor, especially when coupled with the strong relationships found with sward height.
National scale studies of grassland birds The analysis of atlas data demonstrated that bird species differed in their preferred landscape type. Full details are given in the paper forming Appendix 5.8; this enables species principally associated with pastoral landscapes to be identified. The main point emerging from this analysis was that mixed farming landscapes were of particular importance in winter when most species reached highest abundance in mixed rather than predominantly arable or grass landscapes.
The main conclusion to be drawn from the results of the extensive national survey is that grassland bird assemblages show considerable variation from one locality to another but with no clear regional pattern. This is illustrated in the form of ordination diagrams for winter and summer birds in Appendices 5.9 and 5.10 respectively. In neither season is there any clear regional clustering. Bird assemblages in southwest England and the Midlands are of particular interest in the context of this study as these regions include the Devon and Bucks study areas. There is broad overlap between the grassland bird communities in these two regions in both summer and winter.
The presence of Lapwing and House Sparrow have a major effect on axis 1 scores in winter (Appendix 5.9). In summer, the main gradients in terms of the composition of grassland bird communities are clearer with a gradient from communities with Song Thrush and Robin to ones with Yellowhammer, Lapwing and Mallard at the other extreme (Appendix 5.10). It is difficult to interpret these gradients in terms of obvious habitat associations of the species involved.
In the absence of any clear regional differences in grassland bird communities, the species composition is likely to be driven mainly by factors such as soil dampness and surrounding landscape composition. Wetness is especially important to breeding waders (Vickery et al. 1999). The quantity of arable land appears to be a major influence on the composition of bird communities in grassland landscapes (Atkinson et al. 2002 (Appendix 5.8), Robinson et al. 2001). In terms of improved versus unimproved grassland, there were few differences in bird abundance at the functional group level (Appendix 5.11). However, all significant differences involved higher frequency of occurrence on improved grassland: Skylark in summer, and earthworm-eaters (thrushes, plovers) and corvids in winter.
6. General discussion and conclusions
The widespread changes in management of British grasslands that have occurred in the second half of the 20 th century are thought to have been instrumental in reducing habitat quality for nesting and feeding birds (Vickery et al. 2001). The mechanisms underlying this suggested deterioration of habitat quality involve a complex of factors relating to changes in sward structure and reduction in food resources. As far as we are aware, this project is unique in four respects. First, it examines how grassland management affects sward structure and potential food resources for birds by examining these components of habitat quality across an intensification gradient. The gradient has been defined by careful selection of study fields with respect to total nitrogen inputs which are used as a surrogate of intensification. Second, it takes an integrated approach by combining work on vegetation structure, floristics, seed resources, invertebrates and birds on the same sample of fields. Third, it seeks to assess to what extent relationships between grassland management exist in different regions by working in two landscape types, one predominantly livestock farming, the other mixed livestock and arable. Fourth, we have examined invertebrate-management and bird-management relationships in more than one year. This is important because variation in weather between years may be an important influence both on invertebrate abundance and on wintering bird populations.
Main trends in food resourcesIn the introduction three hypotheses were advanced concerning the effects of grassland intensification on food resources. These hypotheses were based on the results of the literature review undertaken as objective 1 of this project (Vickery et al. 1999, 2001). The first two relate to invertebrates and are relevant to objective 2 of the project. The following
CSG 15 (Rev. 6/02) 18
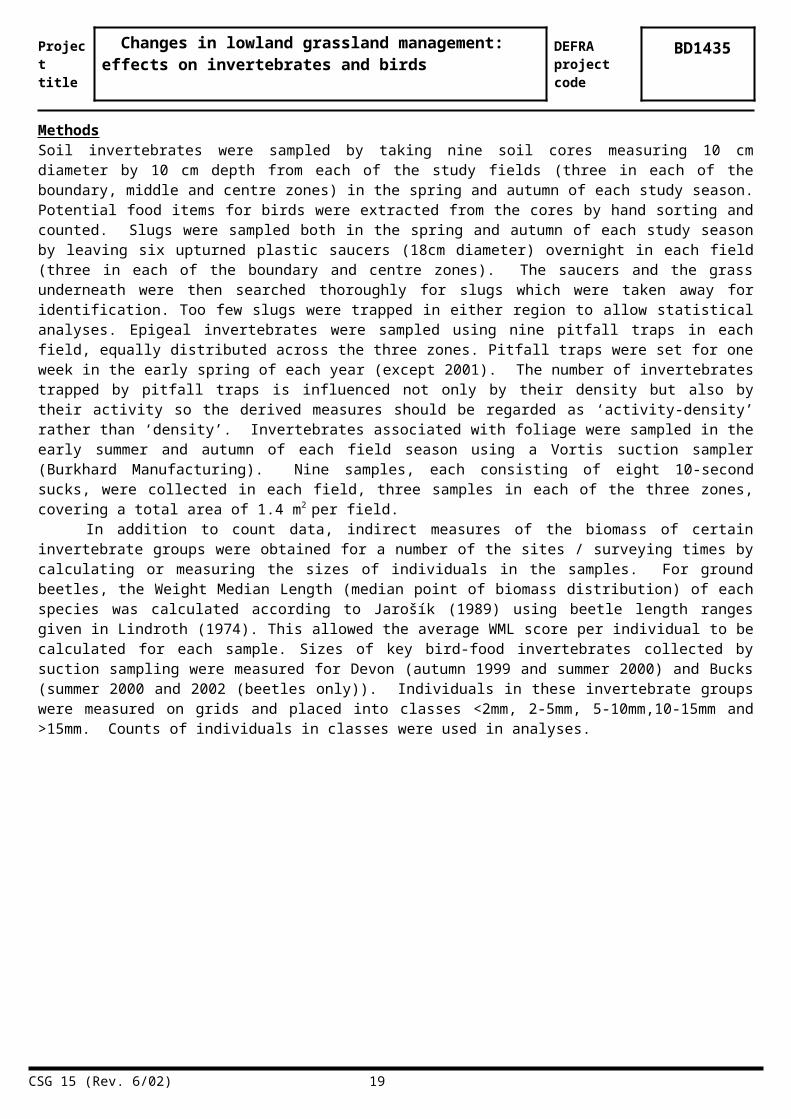
Projecttitle
Changes in lowland grassland management: effects on invertebrates and birds
DEFRAproject code
BD1435
discussion focuses on trends in the abundance of food resources, not on their actual availability to birds which is considered in the next section.
Hypothesis 1: Invertebrate food resources in the sward and on the ground Intensively managed swards are expected to offer reduced invertebrate food resources for birds feeding in the foliage and on the surface. This hypothesis was supported by the results at least as far as foliar invertebrates were concerned. A range of invertebrate groups was more abundant in swards that were richer in plant species and more complex (taller). These effects were found across both regions. Patterns in surface-active invertebrates were less clear with ground beetle abundance-activity showing contrasting relationships with management intensity in the two regions. Surface-active beetle larvae were consistently more abundant in intensive fields. In both regions there were large differences in the composition of ground beetle and foliar beetle communities that were clearly related to the management intensity of the fields. The species richness of plants and sward structure (height) appear to be principal factors influencing the diversity and structure of invertebrate communities.
Hypothesis 2: Soil invertebrates Extensively managed fields are expected to hold lower food resources than moderately or intensively managed fields for bird species that depend on soil-dwelling invertebrates. The result for earthworms – principal food of many ground-feeding birds – was consistent with the hypothesis in Devon in 1999 but there was no relationship with management intensity in the other years / regions. On the other hand, beetle larvae were consistently lower in the more intensive fields. This suggests that there may well be important trends in the overall availability of soil invertebrates that relate to management intensity. For example, where high earthworm populations occur in intensive fields, birds may focus their attention on those fields. However, in the absence of particularly high earthworm populations, birds may concentrate on other food resources such as beetle larvae in less intensive fields.
Hypothesis 3: Seed resources Intensive swards are expected to be relatively poor in seed resources and hence will be little used by seed-eating birds. This hypothesis was not clearly supported by the results. In Devon (1999) there were indeed fewer seeds in the intensive fields but this result was not repeated in 2000. There was no evidence that granivorous birds made more use of the seed-rich fields; this could have been a consequence of the low numbers of birds present in the study area (see below). In Bucks, the opposite trend in seed numbers was found, with larger numbers in intensive fields, this being entirely attributed to grass seeds. It would appear from the results that simple relationships between seeds and management intensity do not occur. Nonetheless, a greater diversity of seeds is to be expected in low intensity fields, and this appears to have been the case in Devon (1999) whereas a predominance of grass seeds may occur in intensive fields.
Patterns of field use by birdsObjective 3 of the project was to quantify the use made by birds of fields under different management systems. The densities of birds using fields in both regions were extremely low, though Bucks tended to hold larger numbers of several species. The large number of zero values in the data sets created problems for analysis; in particular relatively low power to detect relationships with management, habitat and food resource variables. There were very few consistent relationships across regions or years with aspects of field management. In winter there was a tendency towards higher occupancy of intensively managed fields. Sward height, presence of grazing animals, abundance of molehills and bare ground appeared to be important to several species in winter, although the form of relationships varied among species. In summer there were relatively few relationships between field usage by birds and management intensity. However, most species showed relationships with vegetation height, avoiding tall swards.
It should be noted that preliminary analyses of the bird data were undertaken at the level of extensive, moderate and intensive fields i.e. the three classes of management intensity used for the original selection of fields. This indicated that in Devon in the winter of 1999/2000, bird diversity was higher in intensive fields and that more species were associated with intensive fields than with extensive or moderate fields (Atkinson et al. 2002). The use of a management intensity index derived from the PCA described in section 2 is, however, regarded as a more appropriate approach as the distinction in management systems between the three intensity classes is not clear-cut.
Management intensity per se does not appear to be a strong predictor of bird distribution. This may be because bird populations are so low that even the better quality habitat is not saturated, making it difficult to detect general relationships with management intensity. Alternatively, factors other than general management intensity probably influence distribution. Social enhancement is important in winter, whereby birds may be attracted to join existing flocks rather than use unoccupied high quality habitat. More significantly in the context of understanding how birds select fields in which to forage, there will be important trade-offs between the abundance of food, its accessibility (i.e. availability) and predation risk. Whilst there is evidence that abundance of several avian food resources is influenced by management
CSG 15 (Rev. 6/02) 19

Projecttitle
Changes in lowland grassland management: effects on invertebrates and birds
DEFRAproject code
BD1435
(see above), birds may have difficulty exploiting these resources where sward structures are tall and dense (c.f. Whittingham & Markland 2002). There was much variation in sward structure independently of N input (see Fig. 3.1 for sward height and Fig. 3.2 for herbage density). This may have masked any underlying effects of management intensity.
One of the most unexpected and interesting findings concerned the general lack of evidence that usage of fields by birds was linked with food abundance. The number of significant results could have arisen purely from chance. Out of 970 potential relationships between birds and abundance of invertebrate food resources in winter, only 23 were significant. In summer out of 480 only 23 were significant. We acknowledge that these analyses are rather crude in that they do not measure food abundance at critical times for the birds (e.g. when feeding young) and that they do not take account of dietary preferences. Nonetheless, these data and analyses are unique and large in scope. Furthermore, the invertebrate groups have been matched to bird species as potential foods based on current knowledge. We argue that these findings suggest that birds select fields for feeding largely according to factors other than food abundance. It is likely that availability of food is critical. Sward structure will be affected by nitrogen input, grazing and cutting; this is likely to be the major factor affecting access to food.
Several species of breeding farmland birds have become particularly localised or scarce in grass-dominated regions. These include Grey Partridge, Lapwing, Turtle Dove, Yellow Wagtail, Tree Sparrow, Yellowhammer and Reed Bunting. Even before the agricultural intensification of the last 50 years, some of these species probably occurred at lower densities in western pastoral landscapes than in more eastern arable and mixed landscapes (Chamberlain & Fuller 2001). These birds were either absent from our study areas or present in such low numbers that we could not undertake analyses on them. It is possible that some of the extensive fields in our samples were in fact suitable for these species, but that the landscapes within which these fields were located were unsuitable. Isolated fields with suitable sward structures and an abundance of food are probably insufficient to maintain local breeding populations. We make this point for two reasons. First, a successful approach to habitat restoration for these species may require the provision of suitable habitat structures within fields set in the context of creating a wider diversity of food resources in the surrounding area. Second, it is possible that some of these scarce species would have shown significant relationships with measures of food abundance had we been able to find sufficient birds.
Mechanisms by which grassland management affects birds The literature review identified the mechanisms by which grassland management can potentially affect birds. These are summarised in Fig. 5 of Vickery et al. (2001) (see Appendix 1.2). In general it has proved less easy to identify relationships between management and bird usage of fields than between management and abundance of food resources. Some of the reasons for this are discussed in the previous section but it is important to stress that most of the routes by which management is likely to affect birds are indirect ones (mediated mainly by availability of food) and the pathways are complex. It is probable that the effects of grassland management on birds are diffuse (i.e. spread across several elements of habitat quality). This means that isolating the effects of single factors or variables will be extremely difficult. The current project has generated evidence for the following key linkages between grassland management and food resources.
Loss of hay systems may be associated with reduction of structural complexity in summer swards because height of hay fields in June was taller than other fields.
Intensification of management reduces plant species richness. This is associated with lowered densities of a range of invertebrate groups associated with the sward in summer.
Management intensity affects the species composition of ground beetle and foliar beetle communities. Implications for birds are unknown because dietary preferences of birds are not fully understood.
Intensification may result in an increase in earthworms in some intensive fields whereas beetle larvae in the soil may decrease.
Availability of seeds appears to be related to management intensity in complex ways, with greater diversity and abundance of seeds in some extensive swards and greater quantities of grass seed in intensive swards.
These linkages give insights both to management factors that may have contributed to the declines in grassland birds that started during the 1970s and to factors that may influence the current distribution of birds within grassland. It appears that past intensification may have widely reduced food resources in summer for birds that depend on sward-dwelling invertebrates. In addition to the taxa examined here, grasshoppers appear to be very sensitive to intensification (van Wingerden et al. 1992). Unfortunately grasshoppers, which are an important food of some grassland birds, were insufficiently abundant in our samples to permit an analysis. Hence, although not examined here, it is possible that deterioration of insect food supplies has led to reduced breeding success and possibly post-fledging survival of insectivorous birds. Examples of species that may have been affected historically include Lapwing, Yellowhammer, Reed Bunting, Whitethroat, Whinchat, Meadow Pipit and Pied Wagtail. The effects of intensification on birds that feed
CSG 15 (Rev. 6/02) 20
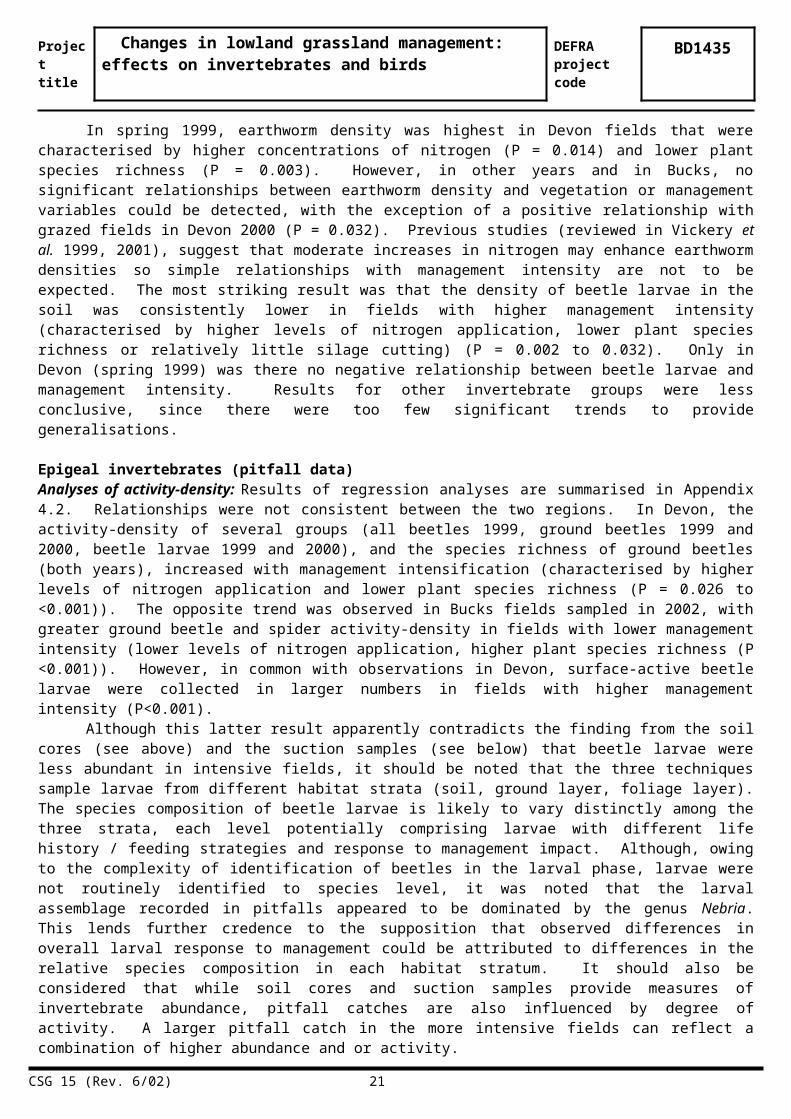
Projecttitle
Changes in lowland grassland management: effects on invertebrates and birds
DEFRAproject code
BD1435
in fields in autumn and winter are not necessarily negative. Some enhancement of earthworms may have occurred which has probably been beneficial for thrushes and corvids. However, other groups of soil invertebrates, notably beetle larvae, are less abundant in intensive swards. The effects of heavy grazing, for example by sheep, may override any such food reduction because short swards generally enhance the foraging efficiency of ground-feeding birds (Vickery et al. 2000). There may have been reduction in seed diversity although abundance of grass seeds may have increased and this could form a sub-optimal food for some species notably buntings.
It is clear that spatial variation in the structure of contemporary swards has been much reduced from the pre 1970s situation. The extensive swards that we examined in this project are not equivalent to those historical swards for several reasons. (1) Some of the extensive swards examined in this project may be recovering from former intensive management. (2) Much local variation in the regimes of hay making and grazing has been lost as management systems have become increasingly uniform. (3) Hay would have taken longer to harvest and was less efficiently harvested before the advent of modern mowers that made it possible to harvest whole fields in a single day. This would have given invertebrates and vertebrates a greater chance of finding a refuge. (4) Grazing animals were smaller and would probably have had different impacts on sward structure and composition. (5) At the landscape level there would have been mosaics of extensive hay and grazed fields, as well as arable fields, whereas surviving examples of extensive fields are now more likely to be surrounded by intensive fields. Therefore, spatial and temporal diversity of grassland structure would have been higher several decades ago, both at the scale of individual fields and farms. One should assume that the historical effects of intensification have been considerably greater than those evident from a study conducted across contemporary gradients of intensification.
Finally, it is clear from this project that relationships between grassland management, birds and their food resources may differ between regions. This could arise from differences in weather affecting the growth of grass, weather effects on invertebrates or differences in bird density leading to density dependent habitat selection. Despite these variations it should be possible to develop generic guidelines for enhancing the food resources of birds that take account of the results of this study and of previous studies (e.g. Tucker 1992, Perkins et al. 2000). This view is reinforced by the fact that clear regional distinctiveness is lacking in the bird assemblages on grassland as shown by the national survey of grassland birds (section 5). Some suggestions are made below.
Conclusions in relation to project objectives Objective 1: Review of existing knowledge of effects of grassland management on floristics, vegetation structure, invertebrates and birds.Several key points emerged from this review (Vickery et al. 1999, 2001). The intensification of grassland management has generated a complex of direct and indirect effects on birds. These include deterioration of sward structure for nesting and feeding, reduction of seed resources, changes in the abundance and availability of invertebrate prey, particularly in response to simplification of sward structure and diversity.
Objective 2: Determine variation in above-ground and soil invertebrate communities associated with different grassland management systems. Several groups of sward-dwelling invertebrates, most strikingly leafhoppers, are less abundant in intensively managed swards than extensively managed swards. The composition of ground beetle and foliar beetle communities is affected by management intensity. These effects of management are probably mediated by differences in plant species richness (higher in extensive swards) and by differences in sward structure (taller swards in many extensive fields). There is some evidence that earthworms can increase in abundance with intensification and stronger evidence that beetle larvae in the soil decrease in abundance with intensification.
Objective 3: Quantify the use made by birds of grassland under different management systems during the spring and winter. It is clear that relationships between birds and grassland management systems are extremely complex. This is partly because different species of birds respond to different habitat elements within grassland as described above. It also appears that effects of food availability may override those of food abundance. This means that the creation of swards rich in plant species and supporting diverse and abundant insects will not necessarily offer optimal feeding opportunities for birds. The creation of a diversity of sward structures may be just as important.
Objective 4: Assess how food resources for birds are affected by grassland management practices through factors such as interactions between vegetation structure and invertebrates. It is important to distinguish between mechanisms that caused the collapse of farmland birds in the 1970s and those currently affecting distribution of birds on grassland. The following are key points concerning the effects of grassland management on habitat quality for birds, based on the findings of this project. Intensification of management reduces
CSG 15 (Rev. 6/02) 21

Projecttitle
Changes in lowland grassland management: effects on invertebrates and birds
DEFRAproject code
BD1435
plant species richness. This leads to lower densities of a range of invertebrate groups associated with the sward in summer. This may have been a major mechanism by which changes in grassland management reduced the breeding success and post-fledging survival of several bird species. Management intensity affects the species composition of ground beetle and foliar beetle communities. Implications for birds are unknown because dietary preferences of birds are not fully understood. Intensification may result in an increase in earthworms in some intensive fields whereas beetle larvae in the soil may decrease. This may lead to greater use of some intensive fields by ground-feeding birds, especially in winter. Availability of seeds appears to be related to management intensity in complex ways, with greater diversity and abundance of seeds in some extensive swards and greater quantities of grass seed in intensive swards. However, we have argued that availability of food is perhaps even more important to grassland birds than its absolute abundance. Grassland management practices that lead to uniformity of sward structures within and between fields will probably reduce access to food supplies for many species of birds.
Objective 5: Provide guidelines for modifying grassland management to enhance invertebrate communities and increase food resources for birds. The potential impacts of such modifications on farm output will be quantified through the development of simple models.From a conservation management viewpoint, the absence of clear regional communities suggests that it should be possible to develop generic management prescriptions for grassland birds that have wide applicability. Two broad complementary approaches to enhancing food resources for birds within grassland are suggested by the results of this project, including the literature review. One approach relates to field margins, the other to whole-field and farm systems. This does not cover landscape-scale manipulations (e.g. introduction of arable into grass-dominated areas). Note that comprehensive guidelines need to take account of results of other studies and of the outcomes from a planned workshop on farm management for farmland birds, to be held later in 2003 or 2004 under the auspices of Defra’s Rural Development Service.
(1) Field margin manipulation.(1.1) Use of low input, field margin strips to create botanically diverse and structurally variable communities of
plants should greatly facilitate an increase in the abundance of sward-dwelling invertebrates.(1.2) On intensive livestock farms, availability of grass seed heads could be enhanced as a food resource for birds by
closing up field margins after mid-summer grazing (or cutting). Avoidance of late summer / early autumn grazing with sheep would also allow the grass seed head resource to develop. The seed of Poa species is probably a more valuable seed resource for birds, especially buntings, than Lolium. The cultivation and fallowing of field margin strips could be beneficial particularly where the seed bank of Poa annua, for example, is high. In addition the sowing of different grass mixtures and arable weed species at the field margin would ensure a wider range of seed resources.
(2) Development of whole farm systems that integrate extensive and intensive management practices at a field-scale. It has to be recognised that the following are not so much guidelines as conceptual systems that require empirical underpinning.
(2.1) Establish low nutrient input fields, rotate management between late hay cutting plus aftermath grazing (2 years) and low-moderate grazing intensity in a continuous stocking system with beef cattle for one year. Integration of hay production on intensive livestock farms will require the development of economically sustainable systems that utilize the late cut hay for winter feeding. In relation to the impact on agronomic output, yields of hay from unfertilised grassland range from <20 to 80% of the production that might be expected from agriculturally improved and intensively managed grassland (Tallowin and Jefferson 1999).
(2.2) Creation of a diversity of sward structures through varying grazing intensities (and different levels of fertiliser input) on fields within individual farms could provide diverse conditions for feeding and nesting birds. It is important to recognise that in winter some bird species may actually benefit from moderately intensive management that may create shorter swards and more bare ground. Grazing systems with moderate stocking densities may also be desirable at a whole-farm level. The likely impacts on output per ha of adopting low grazing pressures to enhance faunal diversity and abundance are the subject of some current research projects. It is too early in the course of these projects to provide robust estimates of the effect on farm output of grazing managements that provide benefits for birds.
Suggestions for future research The results of this project indicate that any future work on grassland management and the food resources for birds should pursue several issues.
CSG 15 (Rev. 6/02) 22

Projecttitle
Changes in lowland grassland management: effects on invertebrates and birds
DEFRAproject code
BD1435
(1) Effects of surrounding landscape composition on the invertebrates and birds that use grassland. This study has shown that mixed farming areas are especially important nationally for birds in winter (Atkinson et al. 2002). Furthermore, the mixed farming study area (Bucks) was generally richer in birds than the pastoral study area (Devon). The mechanisms underlying the perceived benefits of mixed farming systems, however, need to be fully explored and tested. Potential benefits of mosaics of extensive and intensive grassland also need to be explored at the field, farm and landscape scale to provide a scientific underpinning for grassland extensification schemes.
(2) Effects of different types of fertiliser input (FYM, inorganic, slurry) on invertebrates and field use by birds throughout the year. FYM from extensive/hay fed systems, apart from being a potentially valuable seed dispersal medium, may also provide significant seed resources in winter. Composting FYM may well negate these potential benefits.
(3) Dietary studies of grassland birds are needed to identify more clearly which invertebrate and seed groups are preferred by different species. This is important (a) for identifying how habitat quality could be enhanced through management to provide preferred foods and (b) for understanding the implications of shifts in insect species composition that accompany intensification. Diet studies need to take account of different nutritional needs at different stages of the annual cycle and of the seasonal availability of invertebrates to determine whether dietary bottlenecks might be created by grassland management.
(4) Experimental work is needed on how the availability of food to birds can be enhanced through manipulation of sward structure, composition and the relative size and position of these to other vegetation types in the landscape.
(5) Further work is needed to assess how abundance and availability of soil and surface invertebrates varies with management intensity. These are important food resources for birds and the patterns were unclear. For example do earthworms and beetle larvae show opposite responses to management intensity and what is the overall trend in biomass of key prey items?
(6) Intensive management has removed much of the small-scale topographical variation from fields (e.g. ridge and furrow, hollows and hummocks). Benefits of restoring/enhancing topographical variation in the field margin of intensive grass fields by simple practical means such as ploughing strips are worth exploring.
(7) Experimental work is needed on methods of enhancing seed production in swards under different management regimes and in particular on providing preferred seed resources (linked with (3). Why did a small number of fields stand out in terms of seed production?
(8) More work is needed on the implications of introducing low input livestock systems which appear to have considerable potential benefits for biodiversity (Vickery et al. 2001). We are aware that other projects are currently addressing manipulation of cutting regimes, grazing pressures and the influence of breed type on sward structure. However, all these studies are at a small plot or field-scale. We need to understand how manipulation of stocking densities and type of livestock, coupled with low fertiliser inputs, affects the food resources and preferred structures of grasslands for birds at a landscape level.
(9) Impacts of anti-helminthic treatments on invertebrates and birds (from Vickery et al. 2001). We need to explore the long-term impacts over several trophic levels of livestock systems designed to reduce worm burdens and thus the need for anthelminthic treatment.
(10) Interaction between predation rates on nesting birds and grassland management (from Vickery et al. 2001).
7. References
Atkinson, P.W., Asteraki, E.J., Conway, G.J., Fuller, R.J., Goodyear, J., Smith, R.E.N., Tallowin, J.R.B. & Vickery, J.A. (2002). Use of grassland by wintering birds: effects of management on their food resources. Pp.61-64. Conservation Pays? Reconciling Environmental Benefits with Profitable Grassland Systems. Occasional Symposium No.36 British Grassland Society (ed. J.Frame). British Grassland Society.
Atkinson, P.W., Fuller, R.J. & Vickery, J.A. (2002) Large-scale patterns of summer and winter bird distribution in relation to farmland type in England and Wales. Ecography 25, 466-480. (see Appendix 5.8)
Blake, S. & Foster, G (1998) The influence of grassland management on body size in Carabidae (ground beetles) and its bearing on the conservation of wading birds. In: European Wet Grasslands: Biodiversity and restoration. Eds. Chris B. Joyce, C. B and Wade, P. Max Wade. John Wiley and Sons
Chamberlain, D.E. & Fuller, R.J. (2000) Local extinctions and changes in species richness of lowland farmland birds in England and Wales in relation to recent changes in agricultural land-use. Agric. Ecosyst. & Env.78,1-17.
Chamberlain, D.E. & Fuller, R.J. (2001) Contrasting patterns of change in the distribution and abundance of farmland birds in relation to farming system in lowland Britain. Global Ecol.& Biogeog. 10, 399-409.
Hopkins A. (1986) Botanical composition of permanent grassland in England and Wales in relation to soil, environment and management factors. Grass & Forage Sci. 41, 237-246.
CSG 15 (Rev. 6/02) 23

Projecttitle
Changes in lowland grassland management: effects on invertebrates and birds
DEFRAproject code
BD1435
Hopkins A., Wainwright J., Murray P.J., Bowling P.J. & Webb M. (1988) 1986 Survey of upland grassland in England and Wales: changes in age structure and botanical composition since 1970-72 in relation to grassland management and physical features. Grass & Forage Sci. 43, 185-198.
Jarosík, V. (1989) Mass vs length relationship for carabid beetles (Col., Carabidae). Pedobiologia 33, 87-90.Lindroth, C.H. (1974) Coleoptera: Carabidae. Handbooks for the Identification of British Insects. 4 (2) 1-148. London:
Royal Entomological Society.Kirkham F.W., Mountford J.O. & Wilkins R.J. (1996) The effects of N, potassium and phosphorus addition on the
vegetation of a Somerset peat moor under cutting management. J. Appl. Ecol. 33, 1013-1029. Mountford J.O., Lakhani K.H. & Kirkham F.W. (1993) Experimental assessment of the effects of N addition under hay-
cutting and aftermath grazing on the vegetation of meadows on a Somerset peat moor. J. Appl. Ecol. 30, 321-332. Perkins, A.J., Whittingham, M.J., Bradbury, R.B., Wilson, J.D., Morris, A.J. & Barnett, P.R. (2000) Habitat
characteristics affecting use of lowland agricultural grassland by birds in winter. Biol.Conserv. 95, 279-294.Robinson, R.A., Wilson, J.D. & Crick, H.Q.P (2001) The importance of arable habitat for farmland birds in grassland
landscapes. J.Appl.Ecol. 38, 1059-1069.Tallowin, J.R.B. & Jefferson, R.G. (1999). Hay production from lowland semi-natural grasslands: a review of
implications for livestock systems. Grass and Forage Science 54, 99-115.Ter Braak, C.J. & Smilauer P. (2002) Reference manual and CanoDraw for Windows User’s guide: Software for
Canonical Community Ordination (version 4.5). Microcomputer Power (Ithaca, NY, USA), 500 pp.Tucker, G.M. (1992) Effects of agricultural practices on field use by invertebrate-feeding birds in winter. J. Appl. Ecol.
29,779-790. Vickery, J.A., Tallowin, J., Feber, R.E., Atkinson, P.W., Asteraki, E.J., Fuller, R.J. & Brown, V.K. (1999) Changes in
lowland grassland management: implications for invertebrates and birds. BTO Research Report No. 222. (see Appendix 1.1)
Vickery, J.A., Tallowin, J.R., Feber, R.E., Asteraki, E.J., Atkinson, P.W., Fuller, R.J. & Brown, V.K. (2001) Distribution and abundance of breeding and wintering birds and their food resources with special reference to recent changes in fertiliser, mowing and grazing practices on lowland neutral grasslands in Britain. J. Appl. Ecol. 38, 647-664. (see Appendix 1.2)
Van Wingerden, W.K.R.E., van Kreveld, A.R. & Bongers, W. (1992) Analysis of species composition and abundance of grasshoppers (Orth. Acrididae) in natural and fertilised grasslands. J. Appl. Entom. 113, 138-152.
Whittingham, M.J. & Markland H.M. (2002) The influence of substrate on the functional response of an avian granivore and its implications for farmland bird conservation. Oecologia, 130, 637-644.
Wilson, J.D., Morris, A.J., Arroyo, B.E., Clark, S.C. & Bradbury, R.B. (1999) A review of the abundance and diversity of invertebrate and plant foods of granivorous birds in northern Europe in relation to agricultural change. Agric. Ecosyst. & Env.75,13-30.
CSG 15 (Rev. 6/02) 24