Embed Size (px)
Citation preview

Report No. 14375-TUN
Republic of TunisiaTowards the 21 st CenturyCountry Economic Memorandum(In Two Volumes) Volume II Annexes
October 1995
Country Operations DivisionCountry Department IMiddle East and North Africa Department
h-'I', '', ''<,i' WCk '' 7.'.~~~~~~~~~~-'~
;. ~ ~~~ .. F _ 1i 9et ' '-- X, - _ , - '
~W V
7,~ ~ ~ ~ ~~~- %~ '
-- ;- .-~~~* _-
"N x 7~f
* -.- , -,-~~~~~~~~~~~~~~~~~~~~~.
"e7
4~~~~~~~~~~~~~~~~~~~~~~~~~~~~~~~~~~~~~~~~~~~
Pub
lic D
iscl
osur
e A
utho
rized
Pub
lic D
iscl
osur
e A
utho
rized
Pub
lic D
iscl
osur
e A
utho
rized
Pub
lic D
iscl
osur
e A
utho
rized
Pub
lic D
iscl
osur
e A
utho
rized
Pub
lic D
iscl
osur
e A
utho
rized
Pub
lic D
iscl
osur
e A
utho
rized
Pub
lic D
iscl
osur
e A
utho
rized

Currency and Exchange Rates
Currency Unit: Tunisian Dinar (TD)
TD per US$
Period Averages
1980=0.40501981 =0.49381982=0.59071983 =0.67881984=0.77681985 =0.83451986 =0.79401987 =0.82871988 =0.85781989=0.94931990=0.87831991 =0.92461992 =0.88441993 = 1.0037
1994=1.0126 (est.)
Fiscal Year
January 1st - December 31st
Weights and Measures
Metric System

ABBREVIATIONS AND ACRONYMS
ANPE Agence Nationale de Protection de l'Environnement (Environment National Agency)BCT/CBT Banque Centrale de Tunisie (Central Bank of Tunisia)BNA Banque Nationale Agricole (Agricultural National Bank)CDs Certificates of Deposits (Certificats de Dep6t)CNSS Caisse Nationale de Securite Sociale (National Social Security Fund)CPI Consumer Price Index (Index des Prix a la Consommation)CTN Compagnie Tunisienne de Navigation (Tunisian shipping company)EPA Etablissement Public Administratif (administrative entity)EPIC Etablissement Public Industriel et Commercial (quasi-commercial entity)EU European Union (Union Europeenne)FDI Foreign Direct Investment (Investissement Direct Etranger)FODEP Fonds de Depollution (Anti-Pollution Fund)FTA Free Trade Agreement (Accord de Libre Echange)FTZ Free Trade Zone (Zone de Libre Echange)GATT General Agreement on Tariffs and Trade (Accord General sur les Tarifs Douaniers et le
Commerce)GDI Gross Domestic Investment (Investissement Interieur Brut)GOT Government of Tunisia (Gouvernement de Tunisie)IDF Institutional Development Fund (Fonds de Developpement Institutionnel)INNORPI Institut National pour la Normalisation des Produits Industriels (National Institute for
Industrial Products Normalization)INS Institut National de Statistiques (National Institute of Statistics)MEAT Ministere de l'Environnement et de l'Amenagement du Territoire
(Ministry of Environment and Regional Planning)MMR Money Market Rate (Taux du Marche Monetaire)MOA Ministry of Agriculture (Ministere de l'Agriculture)MOH Ministry of Health (Ministere de la Sante)NIE Newly Industrializing Economies (Economies Nouvellement Industrialisees)OC Office des Cereales (National Agency for Cereal Marketing)OECD Organization for Economic and Cooperation Development
(Organisation de Cooperation et de Developpement Economiques - OCDE)ONAS Societe Nationale d'Assainissement (National Sewerage Company)ONH Office National de l'Huile (National Agency for Edible Oil)O&M Operation and Maintenance (Exploitation et Entretien)QRs Quantitative Restrictions (restrictions quantitatives)SICAF Societe d'Investissement a Capital Fixe (closed-end mutual fund)SICAV Societe d'Investissement a Capital Variable (open-end mutual fund)SME Small-Medium Sized Enterprises (Petites et Moyennes Entreprises)SONEDE Societe Nationale d'Exploitation et de Distribution des Eaux
(National Water Supply Utility Company)STAM Societe Tunisienne d'Affretement Maritime (Tunisian cargo-handling company)STIL Societe Tunisienne d'Industrialisation Laitiere (National Company for Milk Marketing)VAT Value-Added Tax (taxe a la valeur ajoutee)WTO World Trade Organization (Organisation Mondiale du Commerce)

List of Definitions
Accord de place Informal agreement between commercial banks not to compete for depositsbased on interest rates.
Appel d 'oifres A weekly auction by the Central Bank of a fixed amount of seven-day fundsprovided to commercial banks. The appel d 'oifres operations are based onprecisely defined collateral (loans to priority sectors, e.g. agriculture,micro-enterprises.
Bon d'equipement Treasury bonds mandatorily placed by the Government.Bon du Tresor Treasury Bills at market-related interest rates.Bon du Tresor negociable Treasury Bills negotiable (NTB) on the bourse and set at maturities of five
years or more.Contrat de liquidite ou Obligation for commercial banks to repurchase the securities sold toAccord de liquidite customers virtually on demand regardless of maturity.
Enprunts nationaux "National loans", borrowing of the Government through bond issues.Prise en pension A seven-day repurchase facility at a higher interest rate than the appel
d'offres, designed to provide banks with additional liquidity.
The report is a product of a team consisting of Linda Likar (Task Manager), Norman Loayza (Macroeconomic Policyand Policies for Higher Growth), Aziz Bouzaher and Sarah Forster (Environmental Issues), Mohamed Lahouel(Competition Policies) and Guillermo Hakim (Labor Policies), Laura Burakreis and Richard Brun (Banking and FinancialSector Reforms), Faycal Lakhoua (Role of the State in the Economy) and Juan Lopez (Comparator Country Analysis andMacroeconomic support). The main report was prepared by Linda Likar and Norman Loayza. Several working papers(listed in the bibliography) were prepared by staff from the sector divisions and by Tunisian consultants. Valuable inputsand comments were received by Laurie Effron and David Tarr. Fataneh Semsarzadeh provided research assistance.
The cooperation of the Government of Tunisia, particularly the Ministry of Plan and the Institut d 'Economie Quantitative,is gratefully acknowledged. Local consultants, Professors Mohamed Lahouel and Faygal Lakhoua of the University ofTunis and the SIDES consulting firm, made significant contributions to the report.
REPUBLIC OF TUNISIATOWARDS THE 21ST CENTURY
COUNTRY ECONOMIC MEMORANDUM
VOLUME 11 - ANNEXES
Contents
ANNEX I - ECONOMIC GROWTH AND ENVIRONMENTAL SUSTAINABILITYIN TUNISIA: LINKAGES AND IMPLICATIONS
I - Overview
II - The Government's Environmental Strategy & Institutional Framework
A. Environmental Priorities and StrategyB. Government ProgramsC. Institutional Framework
III - Sectoral Environmental Issues and Economic Linkages
A. AgricultureB. Industry and EnergyC. Tourism
IV - The Social Cost of Environmental Pollutionand Natural Resource Degradation
A. Public Health and the EnvironmentB. The Costs of Natural Resource Degradation
V - Conclusions: Macroeconomic Linkages and Sustainable Development
ANNEX II - COMPETITION POLICIES
I - Trade Liberalization
Quantitative RestrictionsTariff Barriers
II - Competition Policies and Differentiated Support Measures
The Old Investment Incentive SystemThe New Incentive SystemSpecific Incentives and Distortions
Contents (cont'd)
The Removal of Capacity LicensingIndustrial Support MeasuresAbsorption of Technology and Support ServicesPublic Procurement PoliciesTransparency of RulesTendering ProceduresDifferentiated Treatment of Firms
III - Pricing and Deregulation Policies
Price and Distribution ControlsMajor Shifts in 1991Procedure and Pace of Price LiberalizationPrice Control at the Producer StagePrice Control at the Distribution StageDeregulation: The Transport Sector
ANNEX III - FINANCIAL SECTOR IN TUNISIA
CHAPTER I - THE BANKING SYSTEM
A - OverviewB - Banking RegulationsC - Sources of Funding and Composition of AssetsD - Intermediation and Efficiency of the Banking SystemE - Concluding Recommendations
CHAPTER 11 - FINANCING OF THE TREASURY, MONETARY POLICYAND FINANCIAL MARKETS
A - The Financing of the Treasury and the Managementof the Monetary Policy
I - The Financing of the Treasury (Primary Market)and the Management of Domestic Public Debt (Secondary Market)
11 - The Management of the Monetary Policy
B - The Modernization of the Stock and Bond MarketsI - The Legal Environment and the Market OrganizationII - Evolution of Market Activity and Present Issues
C - Recommendations

ANNEX 1
ECONOMIC GROWTH AND ENVIRONMENTAL SUSTAINABILITY INTUNISIA: LINKAGES AND IMPLICATIONS
I. OVERVIEW
1. For the last ten years, Tunisia has experienced relatively steady economic growth based on adevelopment strategy focussed on three principal sectors: irrigated agriculture, manufacturing industry andtourism (Table 1). GDP growth has averaged around 5 percent for the last five years. Growth has notbeen steady, however, but rather reflects the economy's dependancy on the agricultural sector, the output ofwhich varies dramatically depending on rainfall.
Table 1. Sectoral Share of GDP and Growth Rates (in percentages)
1987 1988 1989 1990 1991 1992 1993 1994
GDP growth rate 6.7 0.1 3.7 7.6 3.8 8.0 2.6 6.1
Agriculture GDP share 15.3 11.7 12.1 14.4 15.7 15.5 14.1 14.1
Growth rate 20.5 -25.8 5.7 27.7 14.3 6.6 -7.0 5.1
Industry GDP share 27.8 28.1 29.0 28.2 28.0 27.1 26.5 26.4
Growth rate 0.4 2.3 5.4 6.2 5.1 5.6 1.8 7.2
(Manufacturing) GDP share 13.1 13.9 14.4 15.0 15.1 15.0 15.0 15.3
Growth rate 4.4 6.5 6.0 11.3 4.0 8.1 3.0 7.4
Services GDP share 32.5 35.8 35.3 34.0 32.0 33.1 34.4 34.6
Growth rate 8.6 9.0 2.2 3.3 -1.3 11.9 5.9 6.1
(Tourism) GDP share 3.8 4.3 4.2 3.9 2.9 3.8 4.0 4.0
Growth rate 37.2 11.6 -2.8 -0.8 -25.0 44.8 7.0 6.5
Source: World Bank data
2. In recent years increasing concerns have emerged about the environmental costs of thisdevelopment strategy. Pursuit of development objectives in these priority sectors, combined with a growingshift of the population to the coastal areas (where over 77 percent of the population are concentrated in lessthan 25 percent of the total land area), has placed increasing pressures on the natural resource base,particularly coastal land and water resources which are relatively limited. This is leading to environmentaldegradation which is manifested in three main ways:
* land degradation -- over 60 percent of the country's usable land resources are estimated to beaffected by degradation. This is leading to the permanent loss of the equivalent of 24,000 hectaresof agricultural land (about 0.5 percent of cultivated land) a year putting even more pressures onrangeland resources, whose productivity continues to decline at an average of 2 percent per year.

Annex 1Page 2
* water scarcity -- almost all Tunisia's available water resources will be fully developed by theyear 2000. Continued growth of agriculture, industry and tourism at current rates is likely to putincreasing pressures on existing water resources, leading to a deterioration of water quality due todomestic, industrial and agricultural pollution, increasing intersectoral competition for scarcesupply and potentially constraints to long-term economic growth.
* coastal degradation -- industrial and oil pollution problems, coastal erosion and overdevelopmentare worsening long the coast as urban, industrial and tourism areas continue to grow rapidly. Inthe next 10 years, Tunisia's population will grow by an estimated 3.15 million, the vast majority ofwhich will live along the coast, if current trends continue, further increasing pressures on marineand coastal resources.
3. The Government is well aware of these problems and has made significant progress in developinginstitutions, policies and programs to deal with them.' To date their approach to environmentalmanagement has been investment-based, with significant resources going to sanitation infrastructure andsoil and water conservation, in particular. Less attention has been paid to developing incentives to reducewaste and encourage conservation, though progress is now being made on key pricing policy reforms toencourage more sustainable use of natural resources -- water pricing, energy pricing and reduction ofagrochemical subsidies. A more integrated approach to land and water use management, however, is yet tobe developed.
4. The purpose of this report is to examine the nature and extent of these environmental problems andtheir economic implications. The report first discusses the evolution and current status of theGovernment's overall environmental strategy and institutional framework for environmental management.Second, it provides an analysis of the environmental issues related to Tunisia's three main sectors:agriculture, industry and tourism. Third, to the extent possible, given the time and data constraints of thisreport, a rough estimate is made of the costs, both social and economic, to the economy of theseenvironmental problems, particularly the cost of natural resource degradation, air pollution and lack of safewater and sanitation. Finally, the report provides initial conclusions and recommendations as to how toreconcile the objectives of economic development and environmental protection.
5. This paper will be followed-up by further analysis of the potential natural resource constraints toeconomic development in Tunisia. A more detailed study is to be carried out in close collaboration with theTunisian Government which will provide a more extensive and systematic economic analysis of the issuesrelated to the competing demands on water and coastal land and their environmental and economicimplications.
'See Annex 2 and 3 for selected economic and environmental indicators for Tunisia and comparable countries.
Annex 1Page 3
II. THE GOVERNMENT'S ENVIRONMENTAL STRATEGY ANDINSTITUTIONAL FRAMEWORK
A. ENVIRONMENTAL PRIORITIES AND STRATEGY
6. Environmental protection has long been a concern of the Government of Tunisia, however, it isonly in the last few years that the understanding of environmental issues, their relation to development andtheir translation into action have been approached in a systematic and effective fashion. In 1990, with thesupport of the World Bank, the Government developed a National Environmental Action Plan whichrepresented the first step in an ongoing process of environmental policy-making. Environmentalmanagement was a central objective of the Eighth Plan for Social and Economic Development (1992-96)which devoted a chapter specifically to environmental protection, the first plan to do so, and set out thefollowing environmental priorities2:
* ensure the rational and sustainable use of the country's natural resources* keep pollution within acceptable limits* clean-up polluted areas* involve citizens in the effort to protect the environment
7. To achieve these objectives the Government has a three-part strategy, implementation of which isunder the overall responsibility of the Ministry of Environment and Regional Planning (MEAT):
a Prevention - this is based on the Government's realization that a strategy of grow now andclean-up later is no longer acceptable and is unnecessarily expensive. It is thereforeplacing emphasis on designing and implementing policies and mechanisms to preventpollution and the wasteful use of natural resources. A key tool is the use of environmental
3impact assessments.
Inspection and monitoring of environmental conditions - monitoring of environmentalconditions is essential to control compliance with pollution control regulations. Thestrategy aims to increase the capacity of research and analytical laboratories, monitoringstations and technical and scientific staff.
* Curative actions - though the main thrust of the Government's strategy is prevention ofpollution and natural resource degradation, in certain areas serious damage has alreadybeen done. According to the Government's strategy, this damage will be rectified.Attention should be paid to the costs and benefits of such clean-up programs, and prioritygiven to cleaning-up areas where environmental degradation is causing a serious risk tohuman health or economic activity and the greatest benefits can be achieved. In the long-term, it is hoped that a preventative approach will reduce the need for costly clean-upprograms.
2Ministry of Environment and Regional Planning (MEAT), 1994. Environment and Sustainable Development: AReview of the Tunisian Strategy, report of Tunisia to the Tunis Conference on Sustainable Development in theMediterranean.
3Environmental assessments have formed the centerpiece of environmental policy in many countries, particularlythe U.S.

Annex IPage 4
B. GOVERNMENT PROGRAMS
8. To implement the strategy, MEAT has launched seven programs:
(i) Urban and rural sanitation. The objective of this program is to extend the sewage network anddisposal system in order to increase the percentage of households connected to the collection system,to increase the treatmnent capacity by putting new treatment plants into operation, and to increase thereuse of treated effluents, especially in the agricultural sector.
(ii) Protection of the coastal zone (program "Main Bleue"). This program consists of activities toensure that the beaches along Tunisia's coastline are fit for swimming; to protect the marineenvironment from oil spills and pollution; to reduce the impacts of urbanization along the coast --both in terms of aesthetics as well as liquid and solid wastes; and to implement the necessary landuse planning measures to achieve these objectives.
(iii) Solid waste management, the "PRONAGDES" program, aims to improve the worseningsituation of the collection, treatment and ultimate use of household waste, industrial waste andspecial waste (from hospitals, slaughterhouses etc.). In the short-term, the program is gearedtowards improving waste disposal; in the longer term, the goal is to reduce the overall volume ofwaste generated and maximize recycling of solid waste.
(iv) Industrial pollution control. This program has two components: prevention and pollutionreduction. Prevention is put into effect primarily through (a) environmental impact assessments,which are now mandatory for all new projects; (b) creation of a depollution fund (FODEP) tofinance pollution control (para. 11); (c) encouraging non-polluting industrial processes; and (d) thecreation of industrial zones which allow easier pre-treatment of industrial effluent. Polluhonreduction involves identifying sectors and regions with particularly severe pollution problems anddesigning and implementing action plans to reduce or eliminate the pollution based on considerationof pollution reduction options.
(v) Desertification control (program "Main Jaune") consists of a broad range of activitiesimplemented by different ministries and coordinated by MEAT, including family planning in ruralzones, integrated rural development, forestry, soil and water conservation programs and researchactivities carried out by the Institute for Arid Regions.
(vi) Natural resource management and biodiversity conservation ("Main Verte"). The objectives ofthis program are to conserve biological resources, rare and endangered species and their ecosystems;to sensitize the public to the need for nature conservation; and to promote ecological tourism.
(vii) Environmental awareness and education. This program involves environmental education and anawareness-building effort aimed primarily at children and young people. The program isimplemented in collaboration with other ministries and NGOs.
9. Financing. The Government budget allocated to environmental protection has increased over thelast ten years, from 260 million dinars in the Seventh Development Plan (1987-1991), roughly 0.3 percentof GDP, to 600 million dinars in the Eighth Plan (1992-1996), around 0.4 percent of GDP. This figurerises to 1,400 million dinars, or about 1 percent of GDP if financing for environmental protection at themunicipal level and for safeguarding natural resources, such as water, forests and soils are added. This iscomparable to the expenditure of industrial nations on environmental management, which is between 0.8and 2 percent of GDP, though the budgetary allocation for environmental programs is still below the

Annex 1Page 5
4investment needs proposed by MEAT which amount to 3 percent of GDP. Much of the budget forenvironmental protection is financed by external aid which is not yet assured for the total investmentprogram. Table 2 presents budget allocations for the above mentioned environmental programs and otherenvironmentally-related investments.
Table 2. Government Budget Allocations for Environmentally-related Investments.
Planned Enviroinmental Investments
Eighth Plan for Economic and SocW Development (1992-1996)
Environmental Investments Dinars % of budget %(millions) disbursed
Environmental Protection Programs 259 25 35
- industrial pollution control 157
- solid waste management 53
- oil pollution prevention 20
-protection of natural and cultural heritage 16
- institutional support 8
-public awareness and research 5
Sanitation 299 28 55
Flood control 40 4 35
Soil and Water Conservation 196 19 94
Forestry 259 25 71
TOTAL 1,053
Source: Ministry of Environment and Regional Planning (MEAT), 1994. Environment and SustainableDevelopment: A Review of the Tunisian Strategy, report of Tunisia to the Tunis Conference on SustainableDevelopment in the Mediterranean.
10. Though budget allocations remain below proposed investment needs, operational problems are amajor constraint to disbursing existing funds. A Bank analysis on the implementation of the TunisianNEAP found that only 17 percent of the proposed projects had been completed on target.5 The quality ofproject design and institutional factors appear to be key determinants of disbursement rates and projectcompletion. Many projects are selected and included in the investment program before pre-feasibilitystudies had been done. Institutional arrangements are another important factor determining the success rateof projects. Overall, for example, there is very little delay of municipal sewerage and wastewater treatmentprojects which are handled by a very competent institution (ONAS), whereas programs to addressmounting solid waste problems have been seriously delayed. These are handled by municipalities whichhave limited institutional capacity.
4Ministry of Environment and Regional Planning, 1993. Rapport National: L 'Etat de I 'Environnement, 1993.
5World Bank, 1994. 1990 National Environmental Action Plan Update Sector Note (draft), prepared by MNlIN.

Annex 1Page 6
11. Depollution Fund (FODEP). The Government is developing new mechanisms to financeenvironmental investments in the form of environmental funds. The most important fund is the depollutionfund (FODEP) established under the 1993 investment law to finance investments in pollution control. Anyindustrial enterprise, public or private, can receive up to 20 percent of the investment cost of depollutionactivities. At least 30 percent of the financing must be covered by the enterprise itself and the remaining 50percent can benefit from bank financing obtained through lines of credit earmarked for environmentalprotection. FODEP is a very new creation and several outstanding issues need further clarification duringimplementation including (i) the treatment of public and private firms; (ii) how the Government will dealwith polluting firms that are financially non-viable, and (iii) the treatment of old versus new firms.
Box 1: Policy Tools for Environmental Management - Lessons from OECD Experience
In most OECD countries a combination of command and control (CAC) and economic incentives are used tomanage environmental problems. The experience with economic incentives, though in theory the most efficientmechanism by which to ensure the costs of environmental degradation are internalized into developmentactivities, is fairly limited and it is too early to draw very concrete lessons.
Pollution fees are the most commonly used economic instrument and are part of environmental managementsystems in many European countries and the U.S. Most of these programs are in the areas of water protection,waste disposal and noise abatement. However, the majority of fees are set too low to function as economic.incentives, due for the most part to resistance by industry and fears of the adimiinistrative complexity of suchsystems. Use of marketable permits has been limited and has been mostly confined to the U.S. All permitprograms exist within a larger CAC framework and their experience has been mixed. A number of countries:have used outright subsidies to induce polluters to make the investments required to bring them intoenvironmental compliance, despite it being contrary to the polluter pays principle. In Gennany, in particular,credit guarantees and subsidies drawn from revolving funds are used to speed the implementation of stricterenvironmental standards, especially among small and medium size firmns, which could experience cash flow,problems because of the sudden capital investments required to comply with mandatory enviromnentalstandards. Tax incentives have proven successful for. encouraging the use of "clean" cars and unleaded fuelsIn the U.K., for example, a 10% differential in fuel prices resulted in a doubling of the use of lead free fuel in 12months.
All incentive systems to date are add-ons to pre-existing CAC regulations. A pure economic incentive system isunlikely to ever exist, so the basic challenge is to determnine the most appropriate mix taking into accounteconomic and political realities. Whatever the instrument selected, the regulator must Xmonitor and enforce the
: environmental management system. If agencies lack necessary. equipment or trained manpower to ensurecompliance, CAC regulations and monitoring of initial compliance may be the best interim approach untilbetter resources are available.
Source: Patterns of Environmental Management, paper prepared for the World Bank, 1994.
12. Many similar funds have been established in OECD countries and Eastern Europe (see Box 1).Some of these are financed utilizing revenues raised from pollution charges, which is more in line with thepolluter pays principle (PPP). Tunisia has yet to introduce a system of pollution taxes. FODEP subsidizesdepollution activities, essentially violating the PPP and arguably providing a disincentive to polluters tointernalize the cost of pollution. In the short term, however, FODEP may prove a useful mechanism duringthe transitional stage of environmental policy implementation to ease the financial pressures on enterprisesassociated with complying with stricter pollution standards. FODEP can also help speed up thereplacement of old plants by cleaner technologies. In the medium to long-term, the role of more efficientpolicy instruments, such as pollution taxes, should be strengthened and the need for subsidies reduced.

Annex 1Page 7
13. Policy Reform. In addition to the above programs, the Governnent is undertaking a number of policyreforms, including water and energy pricing, that will encourage the conservation of natural resources andreduce waste and pollution (summarized in Table 3). Many of these policy reforms were made for economicreasons -- primarily to increase govemment revenue by improving cost recovery of public services -- however,they represent so-called "win-win" policies that will also bring environmental improvements
Table 3. Key Policy Reforms
Policy Objective Progress to date Expected Environmental Impact
Macroeconomic and Sectoral Policies Land Water Air Waterdegradation scarcity pollution Pollution
Water Improve Despite regular price increases, waterpricing water use is still being subsidized particularly for
efficiency agriculture and domestic use by an + ++ ++and cost estimated 83 MD6 Tariffs charged are (oncerecovery based on the volume of water tariffs are
consumed. 1994 tariffs range from D brought in
0.095-0.585 per i 3. The consolidated aIe withrnational average revenue is D co)l
0.326/m3 ($1.46/1,000 gallons). l
Energy Improve After several delays in increasingpricing economic electricity and petroleum prices, in
and energy 1990 the Government started to + ++use efficiency implement tariff adjustments. Prices
are now in line with LRMC.
Agrochemic To encourage Subsidies for fertilizer have beenal subsidies use of substantially reduced over the last ten
fertilizer and years'. The gross amount of subsidy + ++pesticides. peaked in 1989 at 20 MD but had been
reduced to 0.9 MD by 1993. Data onagrochemical subsidies is lacking.
Livestock To assist Animal feed continues to befeed livestock subsidized2, particularly duringsubsidies owners drought years. Subsidies for animal
maintain feed peaked in the drought year of 3herd sizes 1989 at 50 MD (plus a further 20 MD_during subsidy for fertilizer, some of it fordrought years feed production) before falling to 4so stabilizing MD in 1993. Overall levels of subsidyincomes. were higher in the 80s than in the 70s.
Legend: + +: positive, direct impact; - -: negative, direct impact+ positive, indirect impact; - negative, indirect impact.' Subsidies have been eliminated for 3 of the 4 main types of fertilizers used.2 Maize and soybean meal subsidies have been eliminated; subsidies remain mostly for barley.3 Maintaining herd sizes during drought years can put unsustainable pressures on grazing lands.
6This figure represents an implicit subsidy based on the difference between cost and price of water. Table 14presents the issue from a public expenditure point of view.

Annex IPage 8
14. Legal Framework There are over 350 existing legal texts related to environmental issues inTunisia which are often overlapping, provide a sectoral approach to the environment and fall within nooverall guiding framework. The most important laws are the Forestry Code (1988), the Water Code(1975), the Urban Planning Code (1979) and the Labour Code (1966), which currently regulates pollution.A new soils code is awaiting legislative approval. MEAT aims to consolidate all environmentally-relatedtexts within a coherent framework based on an integrated cross-sectoral, cross-media environmental policy.To this end, ANPE has inventoried and classified all existing legal texts concerning the environment.Based on this, the legal framework for environmental protection is being thoroughly revised.
C. INSTITUTIONAL FRAMEWORK
15. After a series of institutional reforms, the Tunisian government now has three well-establishedinstitutions to take the lead on designing and implementing environmental policy:
The National Sanitation Board (ONAS) which was created in 1974 to control water pollutionand protect the country's water resources. ONAS manages the entire sanitation system beingresponsible for the design, construction, operation and maintenance of all sanitation works fromcollection to treatmnent. There are plans under discussion, however, to privatize certain aspects ofONAS' operations. The institution has accomplished a remarkable amount in its twenty years ofexistence. Over 80 percent of Tunisia's urban population is now connected to the sanitationsystem, though rural sanitation is still lacking. Over 100 million m3 of water are treated each year,and the quality of treated water meets international standards. Increased reutilization of treatedwater has also provided savings in the use of fresh water.
The National Environmental Protection Agency (ANPE), created in 1988, has a two-foldmandate: to analyze and monitor the state of the country's environment and to combat all sourcesof damage to and degradation of the natural environment. ANPE carries out a number ofpreventative measures: (i) evaluating and approving environmental impact assessments which arenow compulsory for all new investments; (ii) drawing up environmental standards; (iii) promotingpublic awareness; and (iv) training and environmental education. It also undertakes curativemeasures including (i) inspection of industrial plants and their pollution treatment facilities and (ii)enforcing legislation. ANPE is legally empowered to bring court action against any entity found tobe in contravention of the law and it can conclude agreements with offending enterprises regardingmeasures to remedy pollution problems.
The Ministry of Environment and Regional Planning (MEAT), created in 1991, wasestablished to complete the institutional structures dealing with environment and to lend greaterpolitical weight and importance to environmental policy. The Ministry, in collaboration with otherministries, is responsible for proposing policies regarding protection of the environment,improvement of living conditions and land planning. It is also responsible for legislation related tothe environment. Structures with authority in the environmental domain continue to exist in otherministries, as for example the Department of Environmental Hygiene and Protection in the Ministryof Health, but MEAT is responsible for ensuring overall coordination among them.
In addition, a National Coastal Zone Agency ("Agence Nationale du Littoral") has recently beencreated and will be another agency of MEAT.
16. Institutional Capacity. The Ministry of Environment and Regional Planning (MEAT) has arelatively high degree of political power and resources compared to many other environmental institutions

Annex 1Page 9
elsewhere in the world. However, according to an assessment of environmental management systems indeveloping countries (see Table 4), though Tunisia's institutional framework is now integrated, the fact thatline ministries still keep control over environmental management issues means that the envirommentalmanagement system itself defacto remains fragmented. This constrains the ability of MEAT to have a realimpact on the various sector activities and on facilitating the integration of environmental policy intogeneral development iniatives. Continued efforts will need to be made to strengthen MEAT and theenvironmental units in sectoral ministries, while improving coordination between them.
Table 4: Nature of Environmental Management Systems in Selected Countries
Country Institutional Framework EnvironmentalManagement
Tunisia Integrated Fragmented
Morocco Coordinated Fragmented
Thailand Quasi-integrated Fragmented
Indonesia Integrated Fragmented
Argentina Coordinated Fragmented
Chile Coordinated Fragmented
Mexico Quasi-integrated Integrated
Nigeria Integrated Integrated
Germany Integrated Fragmented
U.S.A. Integrated Integrated
Definitions:Fragmented: enviromnental protection functions are carried out by sectoral and media agencies, based on laws
and regulations primarily addressing the sectoral or media issues.Coordinated: environmental protection functions are still assigned to several sector ministries and agencies,
however, environmental policy formulation is coordinated through an inter-ministerial body.Quasi-integrated: one of the line ministries is assigned responsibility for environmental protection issues.
Potential conflicts of interest with the ministry's main function, however, are not eliminated.Integrated: a separate environmental protection agency or ministry is established and administrative
functions and resources for environmental management are transferred to this agency.
Source: Lovei M., 1994. Institutional Issues of Environmental Management and the Bank's Approach inDevelopment Countries, ENVPE, World Bank.
17. Monitoring. Though Tunisia now has a well-organized institutional framework in place,monitoring and enforcement capacity still need considerable strengthening. Current staff numbers areinadequate to properly evaluate all environmental impact assessments and monitor pollution trends. Todate, attention has been focused on financing and irnplementing environmental programs, such as soilconservation and pollution control programs, without paying adequate attention to the importance ofmonitoring natural resource degradation and pollution trends. As a result, information on ambientenvironmental conditions and trends is lacking. Several steps are being taken to address this, including thesetting-up of an environmental monitoring observatory and the decentralization of MEAT -- MEAT plans
Annex 1Page 10
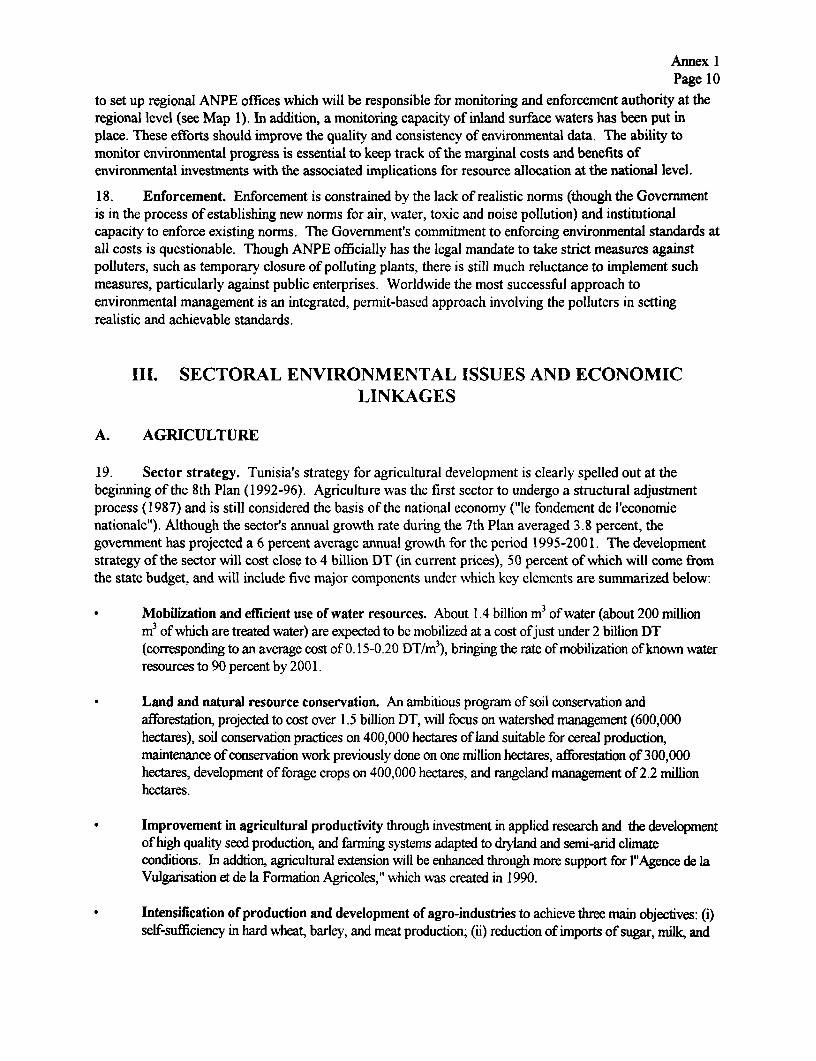
to set up regional ANPE offices which will be responsible for monitoring and enforcement authority at theregional level (see Map 1). In addition, a monitoring capacity of inland surface waters has been put inplace. These efforts should improve the quality and consistency of environmental data. The ability tomonitor environmental progress is essential to keep track of the marginal costs and benefits ofenvironmental investments with the associated implications for resource allocation at the national level.
18. Enforcement. Enforcement is constrained by the lack of realistic norms (though the Governmentis in the process of establishing new norms for air, water, toxic and noise pollution) and institutionalcapacity to enforce existing norms. The Government's commitment to enforcing environmental standards atall costs is questionable. Though ANPE officially has the legal mandate to take strict measures againstpolluters, such as temporary closure of polluting plants, there is still much reluctance to implement suchmeasures, particularly against public enterprises. Worldwide the most successful approach toenvironmental management is an integrated, permit-based approach involving the polluters in settingrealistic and achievable standards.
III. SECTORAL ENVIRONMENTAL ISSUES AND ECONOMICLINKAGES
A. AGRICULTURE
19. Sector strategy. Tunisia's strategy for agricultural development is clearly spelled out at thebeginning of the 8th Plan (1992-96). Agriculture was the first sector to undergo a structural adjustmentprocess (1987) and is still considered the basis of the national economy ("le fondement de 1'economienationale"). Although the sector's annual growth rate during the 7th Plan averaged 3.8 percent, thegovernment has projected a 6 percent average annual growth for the period 1995-2001. The developmentstrategy of the sector will cost close to 4 billion DT (in current prices), 50 percent of which will come fromthe state budget, and will include five major components under which key elements are summarized below:
v Mobilization and efficient use of water resources. About 1.4 billion m3 of water (about 200 millionm3 of which are treated water) are expected to be mobilized at a cost ofjust under 2 billion DT(corresponding to an average cost of 0.15-0.20 DT/m3), bringing the rate of mobilization of known waterresources to 90 percent by 2001.
* Land and natural resource conservation. An ambitious program of soil conservation andafforestation, projected to cost over 1.5 billion DT, will focus on watershed management (600,000hectares), soil conservation practices on 400,000 hectares of land suitable for cereal production,maintenance of conservation work previously done on one million hectares, afforestation of 300,000hectares, development of forage crops on 400,000 hectares, and rangeland management of 2.2 millionhectares.
* Improvement in agricultural productivity through investment in applied research and the developmentof high quality seed production, and fanming systems adapted to dryland and semi-arid climateconditions. In addtion, agricultural extension will be enhanced through more support for l"Agence de laVulgansation et de la Formation Agricoles," which was created in 1990.
* Intensification of production and development of agro-industries to achieve three main objectives: (i)self-sufficiency in hard wheat, barley, and meat production; (ii) reduction of imports of sugar, milk, and

Annex 1Page 11
soft wheat; and (iii) increasing exports of olive oil, fruits, vegetables, and fish products. To achieve theseobjectives, an additional 100,000 hectares will be managed for intensive irrigation (at 5,000-6,000m3/ha, this implies an additional 550 miilion m3) and 77,000 hectares of cereal crops will be managed for"irrigation d'appoint." Other key actions will be designed to increasing olive oil, livestock; sugar beet,fruits, vegetables, and fish production and associated agro-industries.
Improvement in the institutional framework through reforms in land tenure, agriculural credit and taxsystems, and development of subsidized crop insurance schemes (through "le Fonds National deGarantie"). Water conservation will be promoted through the continued gradual increase of water pricesand the support of water user associations (700 new AIC for irrigation water will be created by 2001).Additional support to the sector will also come from continued subsidies for cereals, milk, and olive oil,deregulation of input and output markets, and continued development of rural infrastructure (electricity,water supply, and rwal roads).
20. Land distribution. Tunisia has a total land area of 15.6 million hectares, 62 percent of which isclassified as suitable for agriculture and livestock production ("surface agricole utile"). The cultivated areais 5 mnillion hectares, of which 2.1 million hectares are used for annual crops, 1.9 million hectares forperennial crops (68 percent olives, the rest fruits and vignards), and 1.0 million hectares are fallowed(Figure 1).
21. Farm structure and land tenure. The Tunisian farm sector is characterized by an asymmetricfarm size distribution with a large number of small operators (47% hold only 8% of the land) and a largeconcentration of land within the hands of a few (less than 2% hold over 28% of the land). The averagefarm size is less than 14 ha, with 85% of the farms having less than 20 ha (Figure 2).
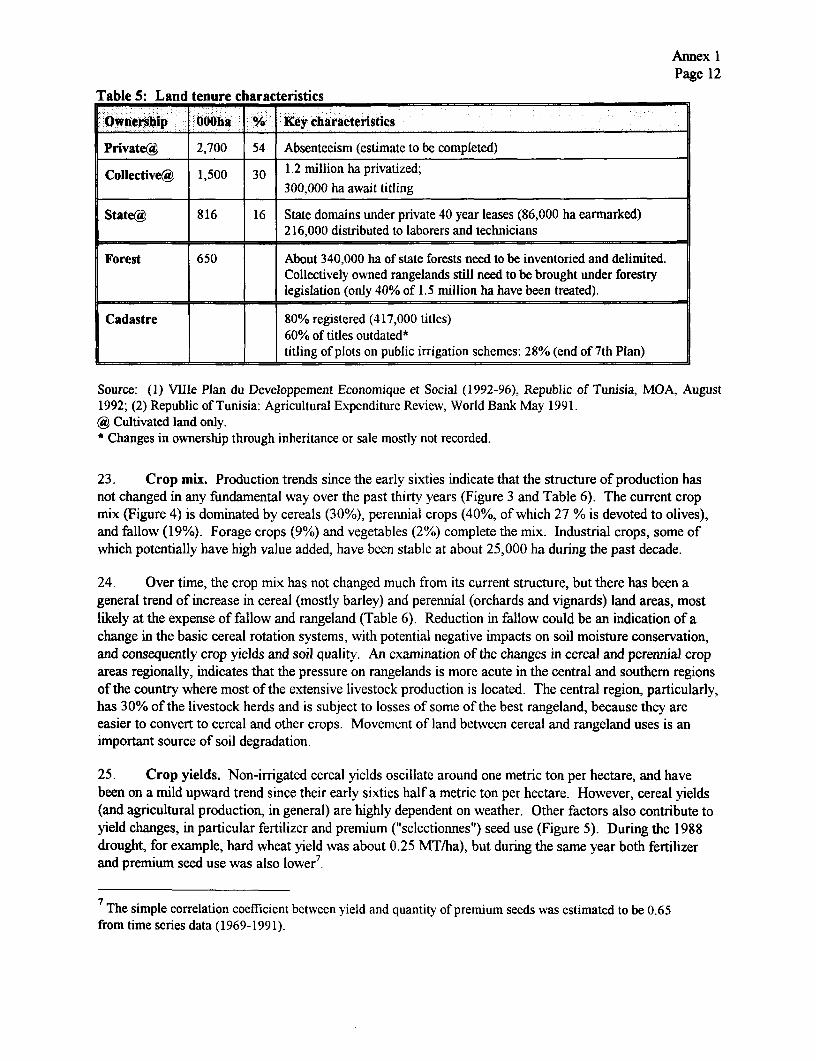
22. The land tenure system is emerging as a major constraint to the further development of theagricultural sector. The major characteristics of the land tenure system are fragmentation, absenteeism,and lack of clear and secure property rights. In addition, there is a need for a cadastral system andnecessary institutions to support the smooth functioning of land markets. With 1.2 million land parcels, the380,000 farm operations average 3.2 parcels per average operation. This trend is amplified by inheritanceand socio-cultural factors. Absenteeism, often associated with extensive agricultural practices, is animpediment to investment and intensification, partly because absentees are engaged in other economicactivities. Out of the 5 million hectares of cultivated land, about 54 percent are privately owned, 30percent are collectively owned and managed, and 16 percent are state held lands. Some key indicators ofthe land tenure system are shown in Table 5.
Annex 1Page 12
Table 5: Land tenure characteristics
ilOwnership ... 000Oha. Key characteristics
PrivateC#, 2,700 54 Absenteeism (estimate to be completed)
Collective* 1,500 30 1.2 million ha privatized;300,000 ha await titling
State@¢ 816 16 State domains under private 40 year leases (86,000 ha earmarked)216,000 distributed to laborers and technicians
Forest 650 About 340,000 ha of state forests need to be inventoried and delimited.Collectively owned rangelands still need to be brought under forestrylegislation (only 40% of 1.5 million ha have been treated).
Cadastre 80% registered (417,000 titles)60% of titles outdated*titling of plots on public irrigation schemes: 28% (end of 7th Plan)
Source: (1) Vllle Plan du Developpement Economique et Social (1992-96), Republic of Tunisia, MOA, August1992; (2) Republic of Tunisia: Agricultural Expenditure Review, World Bank May 1991.@ Cultivated land only.* Changes in ownership through inheritance or sale mostly not recorded.
23. Crop mix. Production trends since the early sixties indicate that the structure of production hasnot changed in any fundamental way over the past thirty years (Figure 3 and Table 6). The current cropmix (Figure 4) is dominated by cereals (30%), perennial crops (40%, of which 27 % is devoted to olives),and fallow (19%). Forage crops (9%) and vegetables (2%) complete the mix. Industrial crops, some ofwhich potentially have high value added, have been stable at about 25,000 ha during the past decade.
24. Over time, the crop mix has not changed much from its current structure, but there has been ageneral trend of increase in cereal (mostly barley) and perennial (orchards and vignards) land areas, mostlikely at the expense of fallow and rangeland (Table 6). Reduction in fallow could be an indication of achange in the basic cereal rotation systems, with potential negative impacts on soil moisture conservation,and consequently crop yields and soil quality. An examination of the changes in cereal and perennial cropareas regionally, indicates that the pressure on rangelands is more acute in the central and southern regionsof the country where most of the extensive livestock production is located. The central region, particularly,has 30% of the livestock herds and is subject to losses of some of the best rangeland, because they areeasier to convert to cereal and other crops. Movement of land between cereal and rangeland uses is animportant source of soil degradation.
25. Crop yields. Non-irrigated cereal yields oscillate around one metric ton per hectare, and havebeen on a mild upward trend since their early sixties half a metric ton per hectare. However, cereal yields(and agricultural production, in general) are highly dependent on weather. Other factors also contribute toyield changes, in particular fertilizer and premium ("selectionnes") seed use (Figure 5). During the 1988drought, for example, hard wheat yield was about 0.25 MT/ha), but during the same year both fertilizerand premium seed use was also lower7.
7The simple correlation coefficient between yield and quantity of premium seeds was estimated to be 0.65from time series data (1969-199 1).
Annex 1Page 13
26. The importance of cereal production in Tunisia (and throughout the region for that matter) stemsfrom its traditional role in the subsistence and economic conditions of small farmers (less than 20 ha, andrepresenting 85% of the operators), and from government subsidies and food security objectives. However,dryland cereal production is neither economical nor environmentally sustainable, particularly in areas ofunfavorable climatic and soil conditions. Overall yields are less that half the worldwide average andcompare favorably only with yields on the African continent. Granted there are important differences inlocal conditions, the long-run, extensive, non-sustainable forms of cereal production will exarcebate thewater and soil scarcity constraints. A targeted approach is needed to phase out non-sustainable cerealproduction in marginal and stagnating/declining yield areas and promote other farming systems whichbetter integrate crop and livestock production, using improved pastures and legume crops and areeconomically viable.
27. Livestock production. Several important factors characterize the livestock sector, and have adirect, although not easy to estimate, environmental impact. The country's general policy of increasing itsself-sufficiency in livestock products, has led to various pricing and subsidy schemes (Partow and Mink,World Bank, 1993), which are particularly evident during drought years. For example, during the 1988-89and 1993-94 drought years, herd sizes were not affected. Despite yearly fluctuations, two particular trendsare noteworthy because of their potential implications for the overall balance between livestock units andfeed supply, and consequently the carrying capacity of the land: (i) the increase in herd size (Table 7) and(ii) the increase in cultivated land (between 1986 and 1993, total animal units increased by over 15% at thesame time cultivated land increased by about 5%). Clearly, these general trends need to be examined indetail by species and at the regional level to determine more specifically where the pressure on rangelandresources is more acute. However, initial indications are, that the Center and South, where extensiverangeland-based livestock systems (mostly small animals) predominate, are the two regions where increasesin cultivated land have been more significant. Between 1980 and 1990, cultivated land increased by 4.8%,17.6%, and 9.0%, in the North, Center, and South regions, respectively (Msellati et al., 1994)8.
28. Three sources contribute about equally to overall feed supply: concentrates; cultivated forages; andpastures. Over time, however, the contribution of rangelands to the overall feed balance has decreaseddramatically, from 1,200 million feed units in 1964 to about 533 million feed units in 1990. Initialestimates indicate that, in addition to the conversion of pasture land to cultivated agriculture, the majorcause of this trend is a loss of productivity of rangelands, which can only be attributed to non-sustainableuses (Table 8, adapted from Msellati et al., 1994).
sThe results of this study ("Contribution to a Rangeland Strategy." December 1994) are preliminary andneed to be cleared with Laurent Msellati before they can be quoted.

Annex 1Page 14
Table 6. Trends in crop mix (1000 ha)
:1982 1986 1987 1990 1992
Cereals 1,197 1,278 1,710 1,551 1,499
Fallow 1,184 1,091 755 875 960
Forage crops* 428 419 407 449 432
Veetables 121 165 137 141 96
Industrial 9 24 27 30 24
Sub-total 2,939 2,977 3,036 3,046 3,011
Olive oil 1,306 1,294 1,379 1,327 1,327
Almonds 295 311 304 389 389
Other perr. 226 210 213 257 248
Sub-total 1,827 1,815 1,896 1,973 1,973
Total 4,777 4,792 4,932 5,019 4,975
Source: World Bank and Tunisia MOA and MOP. * Includes "cultures fourageres et legumineuse."
Table 7. Trends in Livestock Herds
1986 1993
Cattle 624,290 659,000
Sheep 5,409,080 7,110,000
Goats 1,046950 1,417,000
SAU (standard animal units) 1,770,000 2,085,000
Source: (1) Tunisia Small Farmers Potential and Prospects: A Technical Study, World Bank, March 1991; (2)Laurent Msellati et al. 1994.
Table 8. Sources of Degradation of Rangeland Resources
Million feed %units
Decrease in rangeland area (720,000 ha over 14 years) 145 21.7Decrease in forest-based rangeland area 30 4.5Productivity loss of existing rangelands (33% over 4 million ha) 270 40.5Rangelands not used in the South 138 20.7Rangelands under utilized because of land tenure constraints 84 12.6
0;iTotal :loss t:0: :: 0 0: 0 ;: 0 : :: 00: t: 00 0 ; ; : ; ;it tl: 0667:; ;:6 .100IO
Source: L. Mselati, 1994.

Annex IPage 15
29. The sustainability of irrigated agriculture. Tunisian irrigated agriculture contributes about 30percent of agricultural GDP. The sector uses about 82 percent of mobilized water resources9 and isexpected to continue at the same rate well beyond the year 2010 (Tunisia Water Sector Review, WorldBank, September 1994). Irrigated land has increased an average of 7,500 ha per year during the 80s,totalling 300,000 ha today. However, Tunisian statistics show that only about 250,000 ha are actuallyirrigated, corresponding to an 83 percent utilization rate. We examine in the next two sections the role oftwo important factors in the sustainability of agricultural production in Tunisia: water scarcity and waterpricing.
30. Water scarcity. Tunisia invested a great deal in the development of its water resources, and it isestimated that the country's traditional water sources will be fully developed by the year 2000 (TunisiaWater Sector Review, World Bank, September 1994). Because the country's water balance will becomeincreasingly small, and agriculture is slated for intensification and will continue to be the major user,nonpoint source pollution, mainly from agriculture, will add to the salinity of water resources andexacerbate the scarcity issue. In this light, by explicitly incorporating some form of quality'° constraints,and assuming that all potable water will have to be supplied from resources with salt concentration notexceeding 1.5 g/l, we can examine how constraining the water balance will be by the year 2010 based onsupply source, quality, and demand, separately or together, as follows:
Water supply (by 2010) = {demand}, {by source}, or {quality}
3,800 Mm3 = 3,200 Mm3 (demand/year) + 600 Mm3 (balance, assuming median rainfall)
3,800 Mm3 = 2,090 Mm3 (surface water) + 1,710 Mm3 (groundwater)
3,800 million m3 = 1,688 Mm3 (<1.5 g/l salt) + 1,044 Mm3 (1.5-3.0 g/l salt) +1,068 Mm3 (> 3.0 g/l salt)
3,800 million m3 = {625 Mm3 (<1.5 g/l salt, for domestic, industry, and tourism by 2010)+ 1,063 Mm3 (remaining supply with <1.5 g/l salt)} +
1,044 Mm3 (1.5-3.0 gA salt) + 1,068 Mm3 (> 3.0 g/l salt)
9Although the sector is allocated about 82 percent of water, it uses about 60 percent in an average year(Steve Mink, World Bank).
10 Given the lack of systematic data on water quality, we confine the analysis to salinity only, therebyunderestimating the scarcity constraint. The following salinity distribution is used, and assumed to be thesame until 2010:
Surface water: 74% < 1.5 g/l; 24% between 1.5 g/l and 3.0 g/l; and 2% > 3.0 g/lGroundwater: 8.4% < 1.5 g/l; 31.7% between 1.5 g/l and 3.0 g/l; and 60% > 3.0 g/l
Data sources: (1) Tunisia Water Sector Review, World Bank, September 1994) and (2) Developpement duTourisme et Preservation de l'Environnement en Tunisie, Volume II, METAP Project, February 1994).

Annex 1Page 16
31. The last relationship allows us to evaluate the availability of water for additional irrigation, byconsidering three scenarios (Table 9).
Table 9. Irrigation and water scarcity: 3 scenarios (assuming zero water balance by 2010
Scenario 1: Agriculture can only use water with salinity < 1.5 gAl
Amount of water available by 2010: 1,063 M m3
a. Maximum land area that can be irrigated at the current average rate (5250 m3/ha): 202,000 hab. Maximum water rate to maintain current level of irrigation (300,000 ha): 3,543 m3/hac. Maximum water rate to achieve new irrigation target (400,000 ha): 2,658 m3/ha
Scenario 2: Agriculture can only use water with salinity < 3.0 g/l
Amount of water available by 2010: 2,107 M m3
a. Maximum land area that can be irrigated at the current average rate (5250 m3/ha): 401,000 hab. Maximum water rate to achieve new irrigation target (400,000 ha): 5,268 m3/ha
Scenario 3: Agriculture can use water with no salinity restriction
Amount of water available by 2010: 3,175 M m3
a. Maximum land area that can be irrigated at the current average rate (5250 m3/ha): 605,000 ha
32. If reservoir siltation continues unabated at the current rate it will lead to storage capacity losses ofabout 500-600 Mm3 by 2010, which will wipe out the projected positive water balance, and severelyrestrict additional irrigation potential (Table 9) and will require even larger efficiency gains (Table 10).
Table 10. Irrigation implications of water scarcity
No salinity restriction Can potentially irrigate about 600,000 ha at current ratesIncreasing need for salt tolerant crop mixGreater potential impact of salinity on productivitySpecial precautions for irrigation
Irrigation water with salinity (1.5-3.0 g/l) Can potentially irrigate about 400,000 ha at current ratesIncreasing need for salt tolerant crop mixGreater potential impact of salinity on productivity
Irrigation water with salinity <1.5 g/l Can potentially irrigate about 200,000 ha at current rates;or, irrigate about 300,000 ha by achieving a 33% efficiencyin water use;or, irrigate about 400,000 ha by achieving a 50% efficiencyin water use;
33. From this analysis we can draw some general conclusions (summarized in Table 6) which clearlypoint to water scarcity (quantity and quality) as a major constraint to the future development of theagricultural sector, if not before, certainly beyond 2010, and that major gains in water use efficiency willhave to be achieved and maintained, although, as we suggest below, progress will be dependent on otherpolicy and institutional factors.

Annex 1Page 17
34. Water use efficiency. Efficient water management requires strict control of losses and water use;losses can be minimized with good pumping schemes and efficient distribution networks; use requires dosemanagement (quantity and timing); but the complex land tenure structure, the high degree of absenteeism,the credit system, and insufficient extension services together with relatively high efficiency levels combineto make the hypothesis of dramatic savings from irrigation efficiency not very likely in the foreseeablefuture.
35. The analysis also shows that important trade-offs need to be made between different uses, changesin crop mix patterns, and investment in water mobilization, treatment, and reuse. Addressing these trade-offs in systematic ways will require starting to think about water and land resources and related issues in astrategic and integrated way, but also to develop and use methodologies and decision support systems(incorporating benefit-cost or cost-effectiveness approaches) to guide government policy.
36. Water pricing. Based on available data sources, current estimates of the value, price, and cost ofwater are summarized in Table 11.
Table 11. Value, price, and cost of water
Use Value of water (DT per m3 ) Price of water (DT per m3) Cost of water (DT per mi)
Agriculture 0.34 - 0.48 0.04 (Annex 5, Water groundwater: 0.24 - 0.52*(details in Annex 1) Sector Review, May 1994 & surface water: 0.15 -0.39*
Mink) treated waste water: 0.25*Cost of additional water: 0.15-0.20 / (1996-2001) (see para.
_____________ ~~~~~~~~~~~~~~~19)
Domestic: 0.32 (1993 average over 0.45#Urban 1 - 14 (willingness to pay for SONEDE's tariff schedule) 0.86#Rural privately supplied water)&
Industry 0.59@ 0.59 (highest SONEDE rate) 0.45#
Tourism 0.59@ 0.59 (same as industry) 0.45#
* From Draft annex 4 (Rezebos): "The Value and Cost of Water," Tunisia Water Sector Review, World Bankmission 1993/94)& Draft annex 4: "The Value and Cost of Water," Tunisia Water Sector Review, World Bank mission 1993/94).Based on fragmented data and applying to irregular supplies of water.# "Etude Economique sur l'Eau Potable en Tunisie: Rapport, lere partie. M.L. Lahouel et al., November 1993.@ Because of lack of data, the value of water is assumed to be equal to SONEDE's water price for the highestquantity users (>151 m3/quarter). Discussions with Tunisian officials indicated that both in industry and tourismsome operators are starting to develop alternative sources of water supplies, deeming SONEDE's price too high, anindication of willingness to pay, which we use as a proxy for the value of water in the two sectors.
37. This shows that: (i) water is still being subsidized" (about 83 million DT per annum based on thedifference between average cost and price); (ii) the level of subsidy is even larger if willingness to pay is
1 If all the irrigation water is priced at 0.04 DT/m3 and costs an average of 0.22 DT/m3, the amount ofsubsidy would be about 284 million DT. However, according to Steve Mink, only 20 percent of irrigationwater is being subsidized, which would put the total subsidy level at about 52.1 million DT.

Annex IPage 18
taken into account; (iii) the average value added of water in agriculture (estimated in Annex 1 in the range0.34-.48 DT/m3), is about twice the current average cost of water mobilization; and (iv) as the marginalcost of supplying irrigation water increases (recall that by the year 2010 most available resources will havebeen mobilized), the value added of water will have to also increase, suggesting that a detailed analysis bycrop and region be undertaken to determine the most economically viable and environmentally sustainablecrop mix for the country. An important target would be to identify specific areas of the country whereproduction can be sustained without policy distortions and the underpriced of environment and naturalresource.
38. Soil degradation. Sixty percent of Tunisia's useful land resources (estimated between 8.5 and 10million hectares) are subject to different forms of degradation of varying intensities, under the combinedeffects of natural processes and human activity. The county's rainfall pattern (wide regional variations,timing, irregularity, heavy storms, and violent sporadic floods) and the hilly topography combine withsocio-economic factors (population pressure on vegetative cover, particularly cultivation of marginal landspreviously used for grazing and deforestation) and inadequate management practices (tilling up and downthe slope, stubble plowing, and mechanical operations) to produce significant soil erosion.
39. The 1992 Tunisia "National Report to the United Nations Conference on Environment andDevelopment" and the 1993 "State of the Environment Report" identify four major sources of landdegradation.
(i) Soil erosion due to water and flooding, results in soil losses equivalent to withdrawing11,000 ha permanently from production each year. This form of erosion predominates in the north(71%) and south (23%); estimated erosion rates are in the range 5-50 tlhalyr. Detailed regionaldata is not available, but the partial data presented in Table 12 provides an indication of thepervasiveness and the severity of the erosion problem in Tunisia.
Table 12. Erosion distribution in Northern Tunisia
Erosion class North West North East Total (Ha)
Ha % Ha %
Low 301,500 26.1 301,500
Moderate 242,800 21.0 183,000 19.9 425,800
Severe 148,200 12.8 27,000 2.9 232,200
Very severe 57,000 6.2
Region total 1,155,000 100 918,000 100 2,073,222
Source: Sols de Tunisie. Bulletin de la Division des Sols, No.11, 1980. Ministry of Agriculture, Tunisia.
(ii) Desertification, mostly due to wind erosion, salinity, and genetic weakening of rangelands,results in "the loss of 8,000 ha of relatively productive land each year.
(iii) Urban encroachment. It is estimated that the rapid urbanization that occurred between 1975and 1985 "took place mainly on farmland." An estimated 4,000 ha is permanently lost toagriculture each year.

Annex 1Page 19
(iv) Salinization, due to changes in the water table and irrigation practices, contributes to the lossof about 1,000 ha per year.
40. In addition, the degradation of rangeland resources (combined effects of land lost to cultivation,productivity loss and other factors) can be put at about 23 percent of the total feed demand (feed value for460,000 SAUs)'2. However, note that some of this loss is compensated by the gains from conversion of theland to other uses.
B. INDUSTRY AND ENERGY
41. Structure and Trends in the Industrial Sector. For the last few decades, industrial developmenthas been a central pillar of Tunisia's development strategy. The country now has an important industrialbase which accounted for 31% of GDP in 1992 compared to 24% in 197013. Manufacturing is the largestcomponent of the industrial sector (consisting primarily of agro-industry, construction materials,machinery, textiles and chemicals) followed by fuel production, gas and electricity, and mining (primarilyof phosphate and steel). Tunisia has performed well in terms of export growth, with manufactured exportsincreasing by 9% a year during 1980-92, though growth has slowed in recent years. This rate of growthwas achieved through a combination of policies that fostered macroeconomic stability and increased theoutward orientation of the economy.
42. Structure and Trends in the Energy Sector. The principal sources of primary energy in Tunisiaare oil and natural gas. The structure of energy consumption has changed dramatically over the past 30years in favor of gas which represented 30% of energy consumed in 1992 compared to only 7% in 1970.Ttraditional energy sources (primarily wood) are an important source of energy in the household sector,however, data on wood consumption is limited. Electricity demand is growing at 6% a year which willrequire an expansion of Tunisia's production capacity. Much of this demand is likely to be met fromincreased use of natural gas; the state electricity company (STEG) estimates that 80% of currentproduction capacity could use gas.
43. Environmental "Hotspots". Most industry and energy use occurs around urban centers wherepollution affects the health and well-being of large segments of the population. Industrial pollution hasincreased steadily in Tunisia over the last twenty years. Industrial activity is considerable and diverse,concentrated primarily around the large cities and along the coast. At least 12% of Tunisia's 10,000officially registered industrial establishments have been identified as major polluters. The environmental"hotspots" in Tunisia (areas where problems of air quality, industrial/municipal water pollution and solidwaste tend to converge) are major population centers on the coast: Tunis, Sousse, Sfax, Gabes, Gafsa andBizerte. These areas all contain major industries which are known point sources of water and air pollution,as well as port facilities and tourist development zones. Beaches in the Sfax and Gabes areas have beenclosed for a number of years due to industrial pollution. Though these are not tourist beaches and pollutiondoes not appear to have had a negative impact on the tourism trade, as yet, industrial pollution if notcontrolled could jeopardize tourism.
12 Assuming one standard animal unit requires 1450 feed units per year.
13World Development Report, 1994.

Annex 1Page 20
44. Land use regulations in these areas are, for the most part, poorly defined, with the consequentjuxtaposition of industrial zones, tourist beaches and residential areas. Very few industrial establishmentshave in-house pollution abatement facilities that are either operational or fully capable of treating planteffluents. Wastes are rarely pre-treated, nor are there centralized treatment plants where sewered wastescan be processed. Historical reasons, particularly the fast industrialization efforts in the 60s and 70s,explain why in the past pollution control was neglected.
45. Industrial Pollution: Comparative Analysis. To assess the seriousness of Tunisia's pollutionproblems and its environmental progress, it is useful to compare its performance to a number of countriesfrom different regions and with similarities in either size of the economy or stage of economicdevelopement. Using data from the World Bank's industrial pollution projection system (IPPS)'4 , pollutionintensities and pollution loads were estimated for 28 sectors for Tunisia (TUN), Chile (ClL), Ecuador(ECU), Jordan (JOR), Portugal (PRT), Thailand (TMA), and Turkey (TUR). The IPPS system is based onthe premise that "industrial pollution is heavily affected by the scale of industrial activity, its sectoralcomposition, and the process technologies which are employed in production." Because industrial pollutiondata is not readily available for all countries, industry survey information on output is used to estimatepollution intensities (that is, pollution per unit of activity). A number of indicators are chosen to span therange of pollution impacts. First, three indicators are used for toxic pollution to air (Air), water (Water),and land (Soil); second, BOD (biological oxygen demand) and TSS (total suspended solids) are used forwater pollution intensity; and N02 (nitrogen dioxide), S02 (sulphur dioxide), and VOC (volatile organiccoumpounds) are used for air pollution intensity'5. The comparative results are summarized in Figure 6and accompanying tables.
46. Several important observations can be made. First, Tunisia exhibits the same pollution patterns,but compares favorably with other countries, particularly Portugal, Chile, Jordan, and Turkey; second, interms of water quality, the relatively high level of intensity of TSS and low level of BOD may reflect thefact that much more attention is given to wastewater treatment than to sedimentation and industrial wasteproblems; and third, Tunisia has the highest level of pollution intensity from NO2, usually associated withthe thermal combustion of fossil fuels, and indication perhaps of less efficient technologies in the industryand transportation sectors.
47. The distribution of pollution intensity within the Tunisian industrial sector also exhibits someinteresting patterns (see short and detailed tables at the end of the paper giving distribution of pollution).The chemical industry is the largest contributor to toxic pollution (respectively, 52% of air pollution, 70%of water pollution, and 60% of land pollution); other much smaller contributors are the paper, iron andsteel, and textile industries. Water pollution is almost entirely attributable to the food (53% of BOD), ironand steel (82% of TSS), paper (21% of BOD and 6% of TSS), and chemical (18% of BOD and 8% of
14 The Industrial Pollution Projection System, By H. Hetige, P. Martin, M. Singh, and D. Wheeler.December 1994.
15 Toxicity indicators are used because they incorporate heavy metals and are poisonous to humans. BODand TSS are traditional water quality indicators with direct implications for ecosystem health and levels ofwater treatment requirements; nitrates and total coliform are two other water quality indicators with moredirect linkage to human health, but were not available from IPPS. For air pollution, S02 and N02 arecaused by fossil fuel combustion in transportation and industrial activities, and VOC are particularlyimporant in the petrochemical and plastic industries; all these pollutants impact human health.

Annex 1Page 21
TSS) industries. The non-metallic mineral production, iron and steel, chemical, and petroleum refineryindustries are the major air pollutants.
48. Health Impacts of Pollution. What matters are not the total emissions of pollutants but rather thedamage that they cause to human health and the environment. A growing body of evidence points to aconsistent association between pollution and health. However, linkages between human health and/orecosystems damage, exposure, ambient pollution concentrations and emissions are complicated and requireconsiderable data and analysis to understand. There is very little data available on the impact of pollutionboth in terms of actual damage to and exposure of people and the environment to pollution in Tunisia.However, based on estimates done for the MENA region as a whole (MENA Environmental Strategy,World Bank, 1994), it is estimated that air pollution in Tunisia leads to the loss of 105,000 DALYs ordisability adjusted life years a year"6 .
49. Government Pollution Control Policies. Up until 1990, the government had no homogenous andintegrated industrial pollution policy. The body in charge of monitoring industrial pollution was not staffedor financed adequately to carry out a credible monitoring function. Inspections were made onlysporadically and even then enforcement was only partial given the absence of adequate environmentalquality standards. As of 1988, atmospheric emission limits did not exist and there were only partial normson liquid effluents with major pollutants with limits often so strict as to be impossible to observe.Regulations for waste disposal were absent as well.
50. With the creation of the National Environmental Protection Agency in 1988, the situation hasimproved considerably. The government is now in the process of developing new environmental norms anda pollution prevention policy framework that combines economic and environmental regulations, market-based incentives, monitoring, enforcement and negotiated agreements between enterprises and theauthorities based on a two part strategy:
clean-up highly polluted ("hot spot") areaspromote clean industrial growth where pollution is kept to acceptable norms.
51. Since 1992, a significant effort has been made to clean up "hot spots" and institutionalize the useof environmental impact assessments. Environmental action plans have been developed for the industrialzones of Bizerte, greater Tunis, Sousse, Sfax, Gabes and Gafsa. Two plans specific to tanneries and agro-processing industries have also been launched. Measures undertaken include the installation ofpretreatment and treatment plants. However, in general, industries still regard pollution control measuresas a burden that will undermine profitability. Though the Government espouses the "polluter paysprinciple", such a policy has yet to be implemented. The cost of pollution control and more importantly ofprevention have yet to be integrated into the concerns of industrialists since there are no pollution taxes.Certain other measures have been taken, however, that will help prevent pollution, including the creation ofFODEP (see para. 11). Water and energy tariffs have also been increased. The government startedincreasing electricity tariffs in 1990 and these are now considered to be in line with LRMC.'' Water tariffshave also risen sharply in recent years; however water consumption is charged on a sliding scale accordingto a category of users and volume of water consumed. While for large industries the price of water has
16A disability adjusted life year (DALY) is a measure of the loss of healthy life, based on years lost due topremature mortality combined with those lost as a result of disability.
17World Bank, 1994. Project Completion Report: Tunisia Fourth Power Project.

Annex IPage 22
already reached a level that covers the cost of supply, it is possible that small industries still do not seeenough incentives to conserve water.
52. Government's Energy Conservation Policy. The government's strategy to reduce theenvironmental impacts of energy is one of demand. For the next decade, the main thrusts of thegovernment's strategy are (i) launching an action program of energy efficiency in the main sectors; (ii)continuation of the policy of price adjustment and subsidy removal on energy products (except for keroseneand LPG); (iii) preparation of regulations to establish energy efficiency normns; and (iv) continueddevelopment of natural gas utilization in final energy use. This program is estimated to cost 65 MD duringthe period 1990-2001. It will pernit 300,000 tons of oil equivalent in energy savings by the year 2000,corresponding to 50MD.
53. The government is aiming for complete substitution to natural gas in the electricity stations whichwill reduce CO2 emissions and virtually eliminate SO2. Under a worst case scenario, S02 emissions wouldonly increase from 20% to 30% by the year 2000 while electricity demand will increase from 50 to 75%.These emissions could be completely eliminated if the price of gas became competitive with fuel oil. C02emissions would be reduced from 3 to 5% by 2000 due to the improved efficiency of the cycle combind andfrom 16 to 33% if maximum natural gas is used.
54. The government also plans to invest 100 MD in renewable energy development over the next tenyears for the following programs:
- development of biogas in rural areas -- actual potential is estimated at 30 million m3 a year, whichis equivalent to 50,000 m3 of wood
development of solar water heaters -- 800,000 households could be equipped with solar waterheaters which would save 300,000 tep per year. The GEF program has provided Tunisia with agrant of $4 million to subsidize the purchase price of water heaters so as to increase their uptake.
distribution of small-scale photovoltaic systems in rural areas far from the electricity grid.
55. Future industrial growth and its environmental implications. The industrial sector will play acentral role in the future economic growth of Tunisia. The Government intends to further liberalize itseconomy and has set itself a target of over 6% annual GDP growth for the next five years. Industry,particularly growth in manufactured exports, is considered a key economic sector in achieving this goal.Greater emphasis on privatization and export promotion is to be welcomed from an environmentalperspective as competition with EU countries is likely to require firms to comply with higher environmentalstandards. Inward looking economies, such as in Eastern Europe, China, and India, have historically hadmore severe pollution problems as they rely heavily upon state-owned enterprises and lack of competitionhas provided little incentive to firms to improve their environmental standards.
56. There are strong linkages between private sector development, economic liberalization, cleangrowth and human health benefits. If the Government wishes to capitalize on these poisitive linkages it isessential that it establish a policy and institutional framework that encourages rapid and clean growth. Keywill be removing impediments to the adoption of clean technology, including tariff and non-tariff barriers tothe importation of clean technology, and reducing and eventually eliminating input subsidies thatdiscourage resource conservation and efficiency improvements. These reforns should also be accompaniedby the introduction of pollution charges or taxes on polluting activities which will encourage resouce useefficiency and pollution abatements (see section para. 89).

Annex 1Page 23
C. TOURISM
57. Overview. Since the 1960s, tourism has witnessed explosive growth in Tunisia and today is one ofthe country's most important sources of foreign currency. In 1993, foreign exchange earnings from tourismreached nearly $1.3 billion, 30 percent of the income from merchandize exports, and the sector accountedfor 4 percent of GDP. Tourism is also a major source of direct and indirect employment, providing200,000 jobs of which 60,000 are direct, and has a positive effect on other parts of the economy, such asagriculture, and the manufacturing and construction industries.
58. Tourism in Tunisia is essentially mass tourism catering to large numbers of low budget tourists inseaside resorts. Tunisia is regarded as one of the Mediterranean's "package holiday" destinations alongwith Greece and Spain, though the density of beds is still lower in Tunisia than in these competitorcountries. In 1993, 3.6 million tourists visited Tunisia. The country had 144,000 hotel beds at the end of1993 compared to 4,000 in 1962. Eighty kms of the 1,300 km coastline are now developed with resortsconcentrated around the towns of Sousse, Monastir, and Hammamet.
59. Market studies indicate that there is still an unmet demand for low price, mass tourism in theMediterranean basin8 . The government is keen to take advantage of this potential and encourage furthergrowth in the tourism sector, whose contribution to the economy, and to providing jobs and foreigncurrency in particular, is seen as crucially important. New incentives for tourism were introduced in 1993under the Unified Investmnent Code which the government hopes will bring within reach its target ofincreasing the number of hotel beds from 130,000 to 200,000 by the year 2000.
60. Government policies. The policy of the Government towards tourism can be divided into threeperiods during which time there has been a growing awareness of the linkages between tourism and theenvironment:
1963 to 1972 - tourism developed haphazardly with little planning. The state intervened purely byproviding hoteliers with fiscal and financial advantages and through direct investment in touristdevelopments. Ninety percent of developments were seaside resorts, many of which were built alongcoastal dunes creating long-term erosion problems.
1973 to 1981 - was characterized by a recognition of the lack of infrastructure, particularly water andsanitation, in tourist areas and the consequent risks to human health. The government started to play amore activist role in tourism development and strategically developed six "tourist zones": Tunis-nord,Tunis-sud, Hammamet-Nabeul, Sousse, Djerba and Zarzis. These zones were the target of large scaleinvestment, including World Bank financing, in water, sanitation, electricity, roads and communications.Efforts were also made to clean-up beaches, monitor water quality in bathing areas, reduce public healthrisks and protect the country's cultural heritage. Tourism, in this sense, had a positive impact on theenvironment in Tunisia, providing the incentive to invest in water and sanitation services and environmentalimprovements in coastal areas.
1982 to present - the government adopted a policy of developing more "integrated" tourist resorts offering awider range of attractions, including golf courses and marinas. More recently, the government has
'8Comete Engineering, 1994. Developpement du Tourisme et Preservation de l'Environnement en Tunisie (ProjetMETAP).

Annex 1Page 24
investigated ways of further diversifying tourism in Tunisia, by encouraging tourists to visit the interior ofthe country and offering cultural holidays, trips into the Sahara etc. This period was also characterized bya growing awareness of the linkages between the environment and tourism. MEAT developed the "MainBleue" programn which aims to protect the country's marine and coastal resources. The Government alsoestablished a special fund for environmental protection of tourist areas under the 1993 finance law. Touristestablishments are subject to a 0.5% tax on their revenue which is used to finance projects to clean-up andimprove tourist towns and coastal areas. Furthermore, there has been an important move away fromsubsidizing tourism towards encouraging tourist establishments to pay the full cost of water and energy,and, more recently, land.
61. Tourism and the Environment. There is essentially a two way relationship betweeen tourism andthe environment. On the one hand, a pristine environment attracts tourists and environmental degradationcan therefore have a negative impact on tourism revenues; on the other hand, tourism itself can lead toenvironmental degradation -- large numbers of tourists put pressures on scarce land and water resourcesand sanitation infrastructure and their activities can damage marine and coastal ecosystems.
62. It is difficult to isolate the environmental impacts of tourism on the natural resource base andhuman health from that of industrial activities and urbanization which are also concentrated along thecoast, though tourism is likely to have a lesser impact than industry and urbanization. Tourism is not amajor source of pollution. The most direct impact tourism has is on the integrity of marine and coastalsystems and it is difficult to value this damage. Given the complexity of the situation and the lack of data,it is also difficult to quantify the economic cost of the impact of environmental degradation on tourism.However, certain observations can be made as to the environmental sustainability of tourism.
63. Impact on Land Resources. Tourism is one of the main users of coastal land, along with industryand urbanization. Tunisia has 1,300 kms of coastline with 525 kms of sandy beaches. Already 80 kms ofTunisia's coastline is developed for tourism and the government plans to promote development of a further74 kms, so that by 2005 a total of 154 kms or 12% of the coastline will be developed, occupying more than10,000 hectares of land compared to 4,000 hecatares today.'9
64. To date, there has been no integrated land use planning of development of the coastal areas;different agencies are involved in land development with little coordination between them. Tourismauthorities decide where new tourism sites should be developed with little communication with otherauthorities. The indirect consequences of tourism development, such as the growth of surrounding urbanareas, is rarely considered. Whilst the tourism sites themselves are generally provided with adequateinfrastructure, the neighbouring urban areas grow anarchically and generally lack adequate infrastructureto cope with growing demands for water and basic services and the increase in household waste.
65. The coastal resources on which Tunisia's tourism industry depends are fragile and vulnerable to thepressures of construction that mass tourism entails. Already, much of the coastline which has beendeveloped for tourism is being eroded and is gradually retreating. One of the main problems is thathoteliers build too close to the seashore, so destroying the natural integrity of coastal areas and leading toerosion. There is little respect for coastal planning regulations. Sand dunes are mobilized due toconstruction or removal of vegetation as tourists walk along them, so accelerating the erosion process.Given current trends, the beaches on the islands of Djerba and Kerkennah are expected to disappear withina few decades. Coastal erosion in turn threatens tourist infrastructure.
'9Comete Engineering, 1994.

Annex 1Page 25
66. A factor which compounds the precariousness of Tunisia's beach areas, is the rising sea level.Measurements indicate that the sea has risen by 3.6 mm per year at Sousse during the period 1910-1956and by 5.7 mm/year at Sfax. This is higher than the overall rise in sea level witnessed worldwide due toglobal climate change which was an estimated 1.4 mm/year between 1881-1980 and 2.3 mm/year for theperiod 1930-1980.
67. Tourism and water use. Water consumption in tourist areas is far higher, on a per capita basis,than in the rest of Tunisia. An average of 574 litres of drinking water are consumed every day peroccupied hotel bed (300 I/day for an installed bed) compared to an average of 70 I/person/day for domesticuse. Tourism can therefore give the impression of being in competition with other economic activities forwater resources. However, total consumption of water of the tourism sector is only 6 percent of totaldrinking water consumed, though water consumption for tourism is growing faster than any other sector.Water is likely to become an increasing constraining factor to tourism development, particularly in thesouth and on the islands of Kerkanneh.20
68. Good progress has been made on water pricing, with the tourism sector being charged the highesttariff of 585 millimes/m3 (1993 tariffs). This high price has resulted in some hotels building and operatingtheir own desalinization plants which prove a more cost effective way of meeting their water demands.
69. The Tunisian government, under the auspices of ONAS, has developed a system of wastewatertreatment for the coastal areas, superior to that in most Mediterranean countries. An impressive 76 percentof all collected wastewater is treated. It is obligatory for all hotels to be connected to the sewage system.The steady increase in the coverage of sewage services has produced a growing volume of treated effluent.The Government is actively promoting reuse of waste water and there is already some reuse in tourist areasfor watering of golf courses. Unused treated water is discharged lkm out to sea. The tourism sector hasperhaps the greatest potential for reuse of treated effluent.2 ' The high water tariff and the high water usageper bed result in large water bills for tourist establishments. Reuse would reduce these bills by reducingpotable water demand which is more expensive than the 0.25 dinars charged for wastewater.
70. The quality of seawater in coastal bathing areas is monitored by the Government and is generallyfound to be good. Marine pollution is a problem in some areas, such as Sfax, Gabes and Tunis, however, ithas not, as yet, affected the tourist beaches (though local beaches are closed), though it does represent afuture threat to tourism if nothing is done to control pollution.
71. Water and Energy Conservation. Improvements are being made in water and energyconservation in Tunisian hotels. An increasing number of hotels are introducing modem technology toreduce their consumption and improve energy efficiency, for example air conditioners and taps that switchoff automatically.
20There are already localized problems of water quantity. In the region of Hammamet, hotels have dug wells towater their grounds. Many of these are drying up as ground water resources are depleted. Water regulations arerarely respected and neighbouring hotels access the same water table despite pumping limitations. Increased use oftreated water could reduce this problem.
21Hanrahan, D. 1994. Development of Effluent Reuse in Tunisia.

Annex 1Page 26
72. Coastal Zone Management. Lack of adequate coastal zone management is one of the mainunderlying causes of coastal degradation and pollution. An integrated approach to coastal development isneeded to harmnonize the simultaneous growth of industry, urban areas and tourism along the coast which iscurrently leading to unsustainable social and environmental pressures. To improve the situation, theMEAT is developing a "coastal charter" in conjunction with other relevent ministries to provide guidelinesfor more integrated coastal development that takes into account environmental and social concerns. Such acharter will have little impact unless the government has the power to forbid construction in certainprotected areas. The recently created of the National Coastal Zone Agency will be responsible forimplementing this charter and, provided it is given adequate authority, could have a positive influence overfuture coastal zone development. One possible way of protecting certain vulnerable coastal areas would befor the government to purchase land that is to be protected, along the lines of the "National Trust" inEngland or the "Conservation du Littoral" in France. The cost of such a measure could be recovered if theprotected area were opened to the public.
73. Tourism Development Plans and their Environmental Sustainability. According to a recentlycompleted study22 carried out under the auspices of MEAT with METAP financing on the impact oftourism on the environment, there is a need to downsize tourism development plans in certain areas toensure its environmentally sustainability where: (i) further development would destroy certain ecologicallysensitive areas; (ii) lack of water resources and sanitation infrastructure constrain tourism development;and (iii) where the scale of the proposed projects compared to the existing human resources is bound toresult in extremely negative indirect impacts, such as very high levels of immigration.
74. Social Impact Based on available data and field observations, the study found that as soon asdirect employment from tourism reaches a quarter of the population in the immediate area of a tourism site,rapid immigration and anarchic urban development result. They, therefore, recommend the downsizing ofprojects that are likely to employ more than a third of the local population by the year 2004. This appliesto five regions: Zouarai, Skanes, the coastline between Nabeul-Hammamet and Sousse, and the islands ofKerkennah and Djerba.
75. Physical Impact. If the above number of beds is reduced, the physical impact of tourismdevelopment will be lessened. However, there are seven zones where further reduction in tourism plans arerecommended: the islands of Kerkennah and Djerba which are naturally environmentally fragile and pose aproblem in terms of water and sanitation provision, and five other areas where hotel construction could leadto coastal erosion or destruction of ecosystems, such as coral reefs and coastal wetlands.
76. Overall, it is recommended that the planned increase in the number of beds be reduced by 30percent (equivalent to 138,000 beds) to a total of 326,400 beds. This is within the objectives of tourismdevelopment for the next 20 years and would not severely constrain tourism development (see Map 2).
77. A fundamental question is whether the rapid rate of tourism development in Tunisia could actuallyundermine the future profitability of the sector. The demand for this type of resort tourism is in declineworldwide and other countries, such as France and Spain, have found it difficult to convert overdevelopedresort areas that have lost their appeal into more attractive sites. Furthermore, as tourism establishmentsare forced to pay the full cost of land and other resources and of environmental compliance, they will needto search for higher returns. It therefore seems imperative to consider how to diversify the tourism industryin Tunisia and to develop a higher value-added product. This need is recognized by the Government and
22Comete Engineering, 1994. Developpement du Tourisme et Preservation de I'Environnement en Tunisie.

Annex IPage 27
several ideas are being pursued to develop more diversified, higher value tourist packages. However, thereis still a need to take a strategic look at the economic and environmental viability of current developmentplans. Current trends suggest that some scaling back and better coastal zone management is needed.
IV. THE SOCIAL COST OF ENVIRONMENTAL POLLUTIONAND NATURAL RESOURCE DEGRADATION23
78. Tunisia has made important economic progress, and is conscious of the challenges and constraintsposed by environmental pollution and natural resource degradation. To achieve further welfare gains, thecountry has moved agressively to integrate environmental objectives with overall development objectives.The progress achieved so far is significant but realizing and sustaining even further progress will depend onestablishing permanent linkages at the macro-economic level by systematically incorporating environmentand natural resource costs and benefits in the necessary trade-offs that are continually made. In this sectionsome of the key linkages and their potential economic consequences are highlighted.
A. PUBLIC HEALTH AND THE ENVIRONMENT
79. There remain important public health risks posed by environmental problems, particularly for thehigher exposed rural population, as the Tunisian economy continues to expand:
* about 2.5 million people currently have no access to safe drinking water (all in the rural areas), andmore than half of the population (4.5 million) are without safe sanitation (two thirds of which live in ruralareas); and
* 2.5 million people live in urban centers with potential air pollution problems due to industrialemissions as well transportation and energy use.
80. Based on an estimation for the whole MENA region (MENA Environmental Strategy, World Bank,1994), and using a per capita basis, the loss of human life in Tunisia, because of both premature mortalityand disability, could be as high as 2.3 million disability adjusted life years (DALYs). Out of this totalburden, environment related causes may be responsible for about 11 percent, with 150,000 DALYs losteach year due to poor water quality, lack of access to water, and sanitation and hygiene, and another105,000 DALYs lost due to air pollution and over-crowded housing. The social cost of theseenvironmental problems could be substantial. The burden from lack of water and sanitation alone, whenactive life lost from premature mortality and morbidity (DALYs) are valued at current GDP per capita($1,700), is in excess of US$ 250 million (Table 14).
81. Improved water and sanitation can produce substantial reductions in mortality and morbidity24.For Tunisia, the provision of safe drinking water (to 2.4 million people, almost all in the rural areas) andsanitation (to 4.5 million people, more than two-thirds of which are in the rural areas) would reduceDALYs by about 100,000 per year, representing about two thirds of water-related diseases. The social
23 Due to the paucity of empirical data, measurement problems, and the complexity of interacting factors andmethodological difficulties, the social cost estimates presented in this section are more illustrative than definitive.
24 Based on a review of 144 studies published in the Bulletin of the World Health Organization, 1991.

Annex 1Page 28
costs saved by avoiding DALYs due to lack of safe water and sanitation are in the range US$ 170 to 255million, not including the associated health costs saved. Consumer surplus due to the difference betweenprice and willingness to pay, adds even more benefits to the provision of safe drinking water and sanitation(add this to value of DALYs saved).
B. THE COSTS OF NATURAL RESOURCE DEGRADATION
82. The total social costs of natural resource degradation are likely to be significant, but are not easyto quantify. Some of the impacts with economic consequences are: (i) on-site costs due to reduced soilfertility and productivity losses, usually borne by land owners/operators, which effect the long-termproductivity and value of the land; and (ii) off-site costs, stemming from reservoir siltation and reductionin storage capacity, loss of runoff water into the sea, increased risks of flooding and consequent impacts ontowns, and various infrastructures, reduced water quality due to turbidity, reduced recreation value,increasing cost of ditch, waterway and harbor dredging.
83. Other forms of natural resource degradation have impacts that are more difficult to identify andvalue, such as depletion of genetic fauna and flora resources, loss of ecosystem integrity, and the loss ofcultural and archaeological heritage. It is very hard to estimate the extent of loss of biological resources.For example, alfa steppe in Tunisia, which is used for feed and paper production, and plays a key roleagainst desertification, has decreased at an average rate of over 5,800 hectares per year for the last century.This is due to a combination of factors, particularly overgrazing, lack of rangeland management, landtenure problems and agricultural policy. Coastal resource values and tourism revenues are affected byexcessive fishing, bacteriological pollution from domestic and tourism wastewater discharges, pollutionfrom industrial and hydrocarbon activity, and degradation of beaches.
84. Although there are insufficient data to approximate the total social cost of natural resourcedegradation, it is possible to have a rough notion of some of the more easily estimated components. Forexample, the partial social cost of soil degradation from erosion is estimated at 30 million DT per year(estimated as the opportunity costs of agricultural land and reservoir storage capacity, using agriculturalvalue added) (Table 14).
Table 13. Yearly Cost of Environment and Natural Resource DegradationAnnual Health Costs 1994
150,000 DALYsLack of safe water/sanitation/hygiene or
US$ 255 million
Air pollution and over-crowding 105,000 DALYS
orUS$ 178 million
Natural Resource DegradationDirect productivity loss US$ 14.4 millionReservoir storage capacity US$ 13.3 millionRun-off losses US$ 216 million@Rangeland degradation 270 million FUs
Total social cost/yr > US$ 670. mnillion
@ This estimate is based on valuing 1.2 billion m3 at the price of water net of cost of mobilization (.18 DT/m3,and making no adjustment for resources captured indirectly.

Anmex 1Page 29
V. CONCLUSION: MACRO-ECONONIC LINKAGESAND SUSTAINABLE DEVELOPMENT
85. Tunisia has made important efforts to address environmental pollution and natural resourcedegradation. In particular, good progress has been made on reducing subsidies for water, energy andagrochemicals. Continued reduction of these subsidies is essential to move towards a more integratednatural resource management approach which will produce efficiency gains from (i) a reallocation ofnatural resources among sectors based on cost-effectiveness, and (ii) more conservation. At present, thegovernment's development strategy is still very supply dnrven with public investment playing a key role.For example, the Eighth Plan included about $4 billion for investment in agriculture and soil and waterconservation. The Government can put itself on a more sustainable development path through a moretargetted investment approach combined with (i) more demand-management, (ii) increased incentive-basedpolicies, (iii) reduction of impediments and support for transfer of environmentally-sound technology --clean technology for industry and high value-added and resource-conserving technology for agriculture, (iv)reform of the land tenure system through clarification of property rights and institutional support for theemergence of efficient land markets, and (v) institutional strengthening of monitoring and enforcementsystems, information dissemination, public participation and research and extension.
86. There are two areas, in particular, where Tunisia can make more progress to strengthen thelinkages between macro-economic and environmental policy and internalize the social costs of pollution:cost recovery policies and pollution charges.
87. Cost Recovery. An important part of government expenditures goes to finance activities that havea direct impact on environmental quality and natural resource use. Most of the fiscal expenditures inquestion go to the provision of water, sanitation, irrigation water, soil and water conservation, electricity,and transport infrastructure. The provision of these services to users with low or no cost recovery is animpediment to their efficient use which results in pollution problems and unsustainable patterns of naturalresource consumption. In addition, these government (non-recoverable) expenses have other opportunitycosts: (i) lower service provision in other areas (e.g., rural wvater supply and sanitation or in the urbanfringes) and associated health and environmental costs; and (ii) increasing potential additional distortionaryfiscal pressure, with a negative impact on private and corporate investment.
88. A policy of full cost recovery of both investment and operations & maintenance can produce manydividends in terms of efficient use of natural resources, particularly water, enhanced health protection of thepopulation, incentives for increased investment in economic growth, reduction in distortionary taxation, andan increase in revenues for targeted social interventions.
89. Pollution charges/taxes. In addition to cost recovery, internalizing the social cost of pollution,particularly as industry, tourism, and agriculture expand, should produce greater efficiency and protect theenvironment. Continued urbanization, industrialization, tourism expansion, agricultural intensification, andpopulation growth will put more stress on the basic resources, air, water and land. These stresses, causedby natural resource-depleting and polluting activities will impose an even larger burden on the Tunisiansociety, unless policies are initiated now that will effectively enforce the "polluter pays principle" across allsectors of the economy. Pollution charges on polluting activities, directly linked to levels of emission, andtaxes on certain inputs and outputs will encourage resource use efficiency and pollution abatement bypolluters. The tax burden needs to be transparent, equitable, and non-distortionary. The main areas ofpollution taxes are energy, leaded gasoline, agro-chemicals, hazardous waste, and polluting water

Annex IPage 30
discharges in industry and agriculture. In addition, a natural resource tax linked to land use could helpprovide additional incentives to sustainable land management (Table 15).
90. The estimated annual cost of mitigating air and water pollution and providing drinking water andsanitation for the next 10 to 15 years are not easy to ascertain. As an indication, using a roughapproximation (per capita basis) from the MENA Environmental Strategy (World Bank, 1994), theinvestment requirement per year for the next 10 years would be in the order of US$ 190-260 million. Thisestimated investment requirement, is about 3040% of the potential resource mobilization from costrecovery and pollution taxes (Table 15).
Table 14. Potential Resource Mobilization (per ear)
Cost Recovery US$ (converted from DT, assuming USS 1 = DT 1)
Electricity (does not appear in government budget)Water supply (SONEDE)* US$ 154.3Sanitation (ONAS)* US$ 93.3Water mobilization (reservoirs, etc ...)# US $ 120.0Irrigation# USS 44.4Potable water (rural areas)# US$ 14.9Soil and water conservation# US$ 56.7
Sub-total USS 484 million
Miscellaneous subsidies US$ 20.0
Agriculture#IndustryTourismOther
USS 20 millionSub-total
Pollution charges
Irrigation water (for illustration: US$ 0.05 per mc for20 percent of 1,575 Mm3) US$ 16.0Industrial water (85 M at US$ 0.05) US$ 4.0Tourism water (20 Mm3 at US$ 0.05) US$ 1.0Agricultural land resources 4 US$ 50.0Lead in gasoline (at US$ 65.00 per ton) US$ 18.0
Sub-total USS 89 million
* Source: Social public expenditures, World Bank, 1994.# Source: Investment budget, Ministry of Agriculture, 1994. In: Revue des depenses agricoles VIIe Plan de
Developpement 1992, 1993, 1994, World Bank@ Based on 2% of agricultural GDP per hectare
91. The illustrative program of cost recovery and pollution taxes, although based on roughapproximations, clearly shows that a "win-win" path that combines private sector-led economic growth,cost recovery for the provision of services and natural resource use, and internalization of the social costs

Annex IPage 31
of pollution, is possible. However, a number of institutional and other reforms need to be either continuedor initiated, in the areas of removal of impediments to clean industrial growth, including the role of publicenterprises, and land tenure. Some segments of the population will be unable to pay for services, butadditional fiscal revenues will enable the state to design well targeted service provision to the very needy.
92. Tunisia has made significant progress both on the economic and environmental fronts. The pattemof its environmental problems is comparable to countries at a similar stage of development, but the extentof its degradation is not nearly as severe as in some developing countries, such as Eastern Europe (seeFigure for comparative environmental indicators). In many areas, particularly sanitation, Tunisia hasexceeded the achievements of even OECD countries, such as Spain and Italy. But the initital estimatespresented in this paper illustrate that the social cost of environmental pollution and natural resourcedegradation is considerable (over $670 million a year). Moving towards a full integration of environmentaland economic policy is essential to reducing this cost. However, as highlighted in this paper, two morespecific policy reforms are needed: (i) continued reform of incentive structures, with a particular focus oncost recovery mechanisms and pollution taxes; and (ii) completion of the environmental managementsystem, focussing on integration of the institutional structure and developing the capacity to monitorprogress.
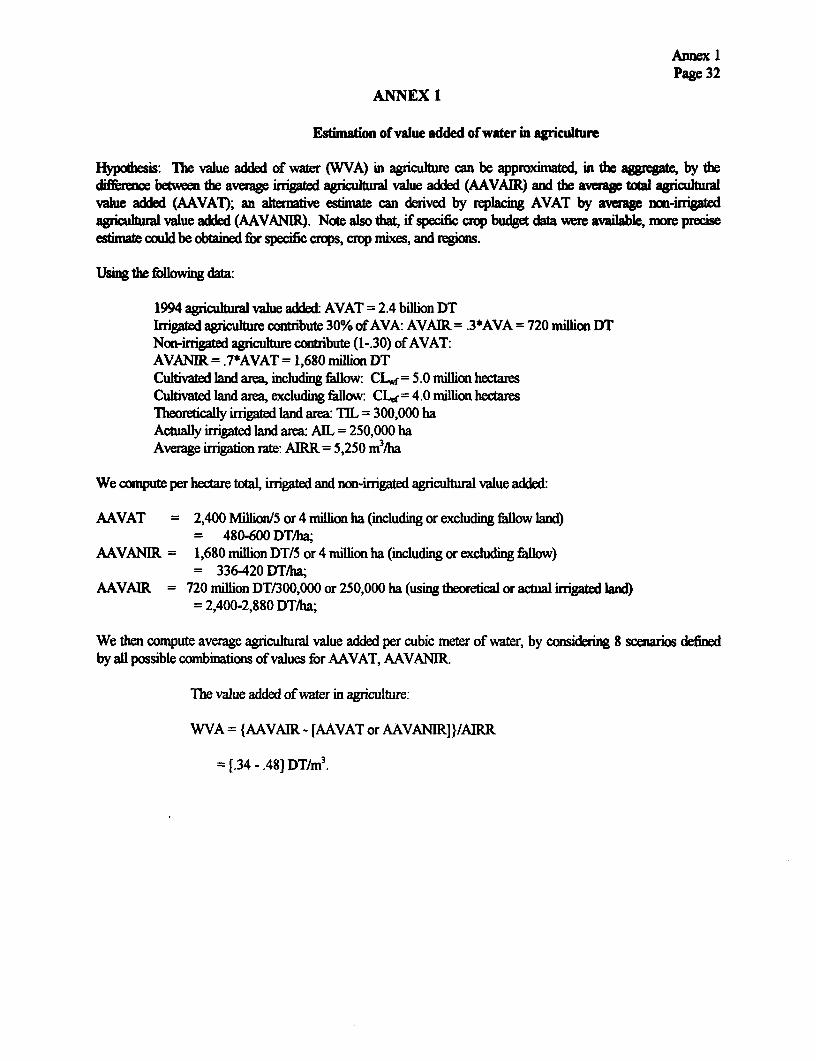
Annex 1Page 32
ANNEX 1
Estimation of value added of water in agriculture
Hypoiesis: The value added of water (WVA) in agricultre can be approxmtd, in the agggae, by tedffrce between the average inigated agricutural value added (AAVAIR) and the averae total agicualtralvalue added (AAVAT); an alternative estmate can deived by replacing AVAT by average mm-irriedagriculural value added (AAVANIR). Note also dtat, if specific crop budget data were available, more preciseesimate could be obtained for specific crops, crop mixes, and regions.
Using the following data:
1994 agriculurl value added AVAT=2.4bdionDTIrrigated agricuture contibute 30% of AVA: AVAIR =.3*AVA = 720 milion DTNon-irigated agriculure contribute (1-30) of AVAT:AVANIR=.7*AVAT= 1,680 milion DTCultivated land area, including fallow: CLvf = 5.0 million hectaresCultivated land area, excluding fallow: CLf= 4.0 million hectaresTheoretically inigated land area: TTL = 300,000 haActuay irrigated land area: ALL = 250,000 haAverage inigation rate: AIRR = 5,250 m3/ha
We compute per hectare total, irngated and non-irrigated agricultural value added:
AAVAT = 2,400 Million/S or 4 million ha (including or excluding fallow land)= 480-600DT/ha,
AAVANIR= 1,680 miUion DT/5 or 4 mrilion ha (including or excluding falow)= 336-420DTiha,
AAVAIR = 720 million DT/300,000 or 250,000 ha (using thoretical or actua irrigated And)= 2,400-2,880 DT/ha;
We then compute average agriculural value added per cubic meter of water, by considering 8 scenarios definedby all possible combinations of values for AAVAT, AAVANIR.
The value added of water in agriculture:
WVA = {AAVAIR - [AAVAT or AAVANIR]}/AIRR
[.34-.48] DT/m3.

_38-
Annex IPage 33
NGolfe de Tunish
olfe de Hammamet
350 MER MtDITERRANE
_34
- ~ ~ ~ -
_32 \\\\\\\\\\ DIRECTIONS PEGIONALES DU/ MINISTERE DE L'ENVIRONNEMENT
\\\\\\\ / ET ~DE L'AMENAGEMENT DU TERRITOIRE
\ E ~~~~~~~~~DRLN: Littoral Nord (Tunis)
DRLC: Littoral Central (Sousse)
31\ \m DRLS: Littoral Sud (Sfax)
ZNDRPPN Hauts plateaux et plainesdu Nord (Edja)
E g DRS: Steppes (Kairouan)
0 25 50 75 100. ° hS a________E DRSS: Sud saharien (Tozeur)
30. ~~~~~Kilomitrts* Si&ge de direction regionale
s'OCOMETEEngineeng6 9__ _
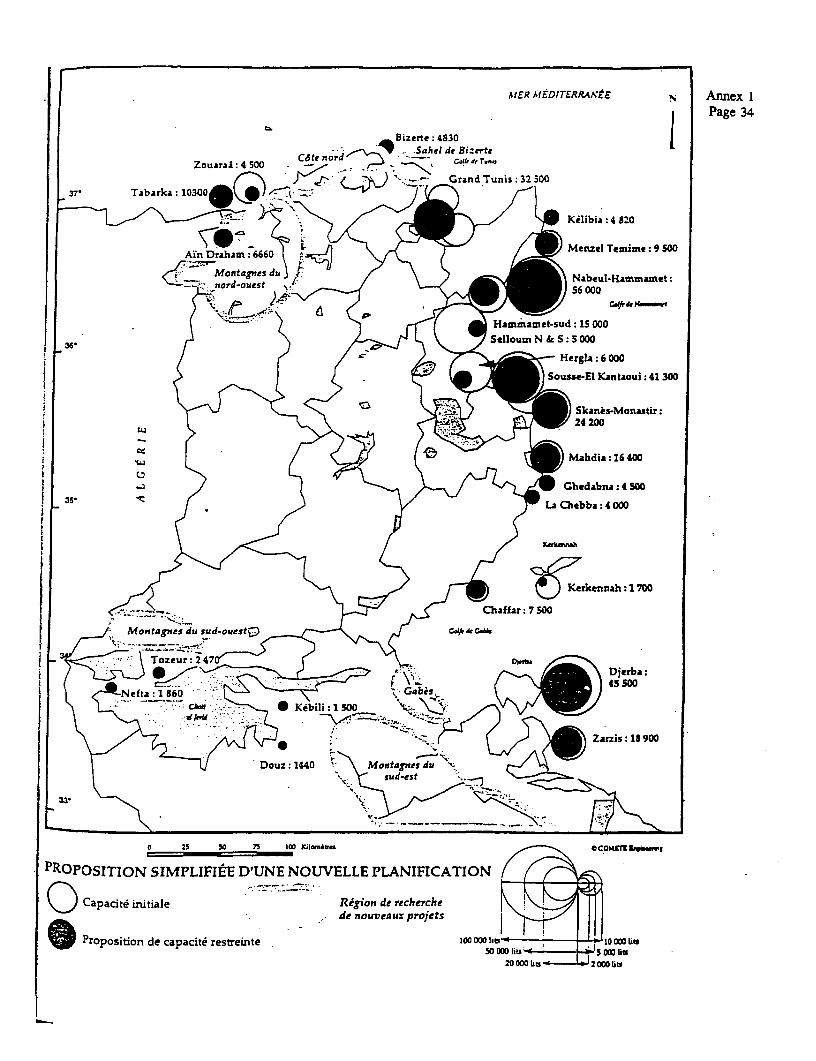
AYER AIEDITERRAXtE N Annex IPage 34
Bizerte 4S30Sahel de Bizerte
Zouaral: 4 500 Co nord . d3r Tabarka 103000(N) ) 7 -sGrand Tunis: 32 500
37. Tabarka: 10300 \.~J ~
Kilibia :4 S20
Ain Draham 6660 k H 9(> r Menzel Temime:9 500
g MostagncsduJ ,f / \ ) _ j Nabeul-Hammamet:nordouet ? 56 000
Hammamet-sud: 15 000
L 36- /2 > Lv 7Selloumn N & S: 5000
i / < / - 2 2 _ ; ~~~~~~~~~~~~~~~~~~~~Herglab 6 000Sousse-EI Kantaoui 41 300
Skanes-Monastir:
i X ;> >31 V~~~~~~~~~~~~~~~~~~~~~~24 200Mahdia 16 400
-.3 < J t >~LGhedabna :4 500
! 35 j P )/ gr L Ch~~~~~~~~~~~~~~~~~~~~ebba :4 000
_ -_t K.rkennah :1 70W
Tozeur:247 Chaffar 7 SW! ,, ~~~Montagns du sud-ouestC-)=X ?At CA6
O Cap iNiialef J t Region de) cherceDjerba
CAuff~ ~ ~~~~~eoweupr t j ilIISO\ l S ; - if - 9D0 Kebiii 1500 > X V V5000 tsv- ---- S o
ZOO* '.- =Ob W t Zarzis 1 9w00
t ~~~~~~~~~Douz: 1440 onstagnes du -<
33 ; <- i
0 25 so 75 ICO ?Cillt?tttre ecoznsouR_ r
"'(POSITION SIMPLIFIEE D'UNIE NOUVELLE PLANIFICATION
0 Capacite initiale Rtegion de recherche lkl^ . ~~~~~~~~~~~de nouvecaux projets
Prposition de capacite6 restreinte 100oo -- s 10 _ 0 U:C?N
20 00? h?s- ;200a Uts

Annex 1Page 35
Figure 1. Land distribution
6
5
cultivated fallow olives perrenials forest rangeland mria
{ ~~~~~Land Distribution by Percentages
13% U cultivated
39% a l olives
ij) 8% * perrenials
\ . 4% Ol forest
,Y 4% Ol rangeland26 * g
culivte fllo oivs errnils foe% ragln marginal
I -______________Land __ Ditibto by Percentage

Annex 1Page 36
Figure 2. Farm structure
50% 45% KOperators40% I35% F Area (hal
30% 125% r20%~15% 1
0%' 0-5 5-10 10-20 20-50 50- 100+ha ha ha ha 100 ha
ha
Farm size
50%T
4 5% \\L L O N|I30% ~ ~ ~ ~ ~ ~ ~ ~~~----Operators
25% _ t20% 0- Area (ha)
15% U -
co ° ° 0
.... ._C_ _ _ __ _._ _._ .__ . ____._.___ .... ..__ .__ _ ....... _U,0 0

Annex 1Page 37
Figure 3: Trends in structure of production
35 r
30
c 0 -*- 1962-71
20
3 2 ,-~--- 1982-91
3 15 < 1992
t- lo \ - ... .. + ~~~~~~~~~~~~~~1993
o \ , _______
96 5
o___ i_-_-_-*-----*---*_r-----i -- 4--- 1-
certJs olive oil othcr vegetables livestock miscellaneous fishpertenials

Annex 1Page 38
Figure 4: Crop mix (1000 ha - 1992)
5% I-
SOX ~~~~~~~~~~~~~*cereals
i>: _ 30% 1- foaciriefallow
Dforage
* vegetables
27% /DO industrial
\ olive oil
*almonds
2% 19% poth err.9% _

] ( J | 1970 r . 741969 ---- .6
1971 hI 1971
1972 I 1972
1973 j'1973 -
975I, , > : 1 1974'1975 J, - -.
1975
98 'l tii1812t =
9736Klt / i 19761977y / 18 U,
} 1986 ?;0 . ~~1 98577o
1978 t1979 LL1978...
i 1988 2 ~ ~ ~ ~ 1 198791 . _ z } f
198 0 r% j 19 791 1980.
1981
1991 U S }~" 1981.. U- I
1982 1981
1983 1982..
1984 1983 1985~ 198.4..
? 0_
19866 195
-~~~~~
1987 ~ U-19856-
19881\ 1 987j
1989 1 , 19878AI>
19019894
1991 ,Lj~~19 8± F 9 9 1 ~~~~~J ~~1990]
I19911E
H .~~~~~~~~~~~~~~~~~~~~~~~~~c
6f I x;auuy

Annex 1Page 40
a-
Figure 6 Pollution Intensity (Ibs/US$ 1 million output)
4,000
3.500
3.=0 0 0
2,500 - TOXIC POiutn to Air
2,000-Toxic pollution to Water
I. '~~~~~t\ O~~0TOXIC ponutto to soil
1.000 'I"
0
TUnIsIa Portugal Chill Jorcdan Turkey
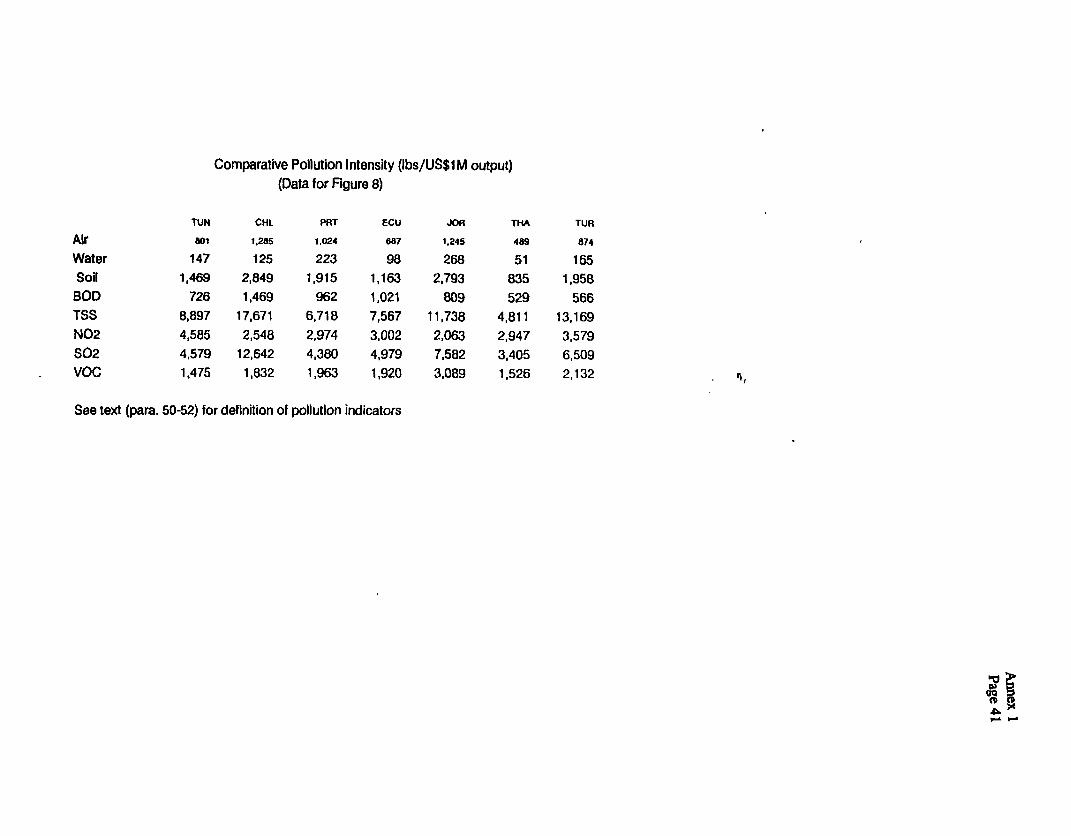
Comparative Pollution Intensity (Ibs/US$1 M output)(Data for Figure 8)
TUN CHL PRT ECU JOR THA TURAir 801 1,285 1.024 687 1.245 489 874Water 147 125 223 98 268 51 165Soil 1,469 2,849 1,915 1,163 2,793 835 1,958BOD 726 1,469 962 1,021 809 529 566TSS 8,897 17,671 6,718 7,567 11,738 4,811 13,169N02 4,585 2,548 2,974 3,002 2,063 2,947 3,579S02 4,579 12,642 4,380 4,979 7,582 3,405 6,509VOC 1,475 1,832 1,963 1,920 3,089 1,526 2,132
See text (para. 50-52) for definition of pollution indicators
_ l_

Distribution of Pollution Intensity (% of total)
ISIC30ES ISIC3 Air Water Soil BOD TSS S02 N02 VOCFOOD PRODUCTS 311 1.41 2.16 2.95 52.84 1.08 6.15 9.58 4.98PAPERANDPRODUCTS 341 6.72 9.18 1.48 21.32 5.86 6.30 5.39 3.56INDUSTRIALCHEMICALS 351 36.41 69.20 50.36 17.85 2.60 10.05 17.24 26.18OTHER CHEMICALS 352 16.37 2.55 10.12 0.66 5.44 5.01 3.02 11.78PETROLEUM REFINERIES 353 2.97 1.22 6.87 0.85 0.3&' 10.84 9.69 17.83OTHER NON-METALLIC MINERAL PROD. 369 5.16 0.47 4.14 0.27 0.37 39.09 34.33 3.55IRON AND STEEL 371 4.62 8.94 14.45 0.07 82.28 14.67 9.90 6.10
See text (para. 50-52) for variable definition
oQ

Annex 1Page 43
Distribution of Pollution Intensity (% of total)
ISIC3DES ISIC3 Air Water Soil BOD TSS S02 N02 VOCFOOD PRODUCTS 311 1.41 2.16 2.95 52.84 1.08 6.15 9.58 4.98BEVERAGES 313 0.26 0.21 0.11 3.25 0.48 1.20 1.19 4.03TOBACCO 314 1.70 0.06 0.09 0.01 0.00 1.38 1.30 0.86TEXTILES 321 4.05 4.08 1.31 0.43 0.05 1.74 3.55 3.25WEARING APPAREL,EXCEPT FOOTWEAR 322 0.09 0.00 0.02 0.00 0.00 0.04 0.02 0.03LEATHER PRODUCTS 323 0.77 0.17 0.97 0.14 0.03 0.07 0.03 0.35FOOTWEAR,EXCEPTRUBBERORPLASTIC 324 1.01 0.00 0.02 0.24 0.02 0.01 0.00 0.16WOODPRODUCTS,EXCEPTFURNITURE 331 0.58 0.01 0.07 0.18 0.07 0.36 1.09 2.64FURNITURE,EXCEPT METAL 332 1.62 0.01 0.08 0.00 0.00 0.05 0.05 3.50PAPERANDPRODUCTS 341 6.72 9.18 1.48 21.32 5.86 6.30 5.39 3.56PRINTING AND PUBLISHING 342 0.50 0.00 0.04 0.01 0.00 0.01 0.01 0.56INDUSTRIAL CHEMICALS 351 36.41 69.20 50.36 17.85 2.60 10.05 17.24 26.18OTHER CHEMICALS 352 16.37 2.55 10.12 0.66 5.44 5.01 3.02 11.78PETROLEUM REFINERIES 353 2.97 1.22 6.87 0.85 0.35 10.84 9.69 17.83MISC. PETROLEUM AND COAL PRODUCTS 354 0.00 0.00 0.00 0.00 0.00 0.00 0.00 0.00
RUBBER PRODUCTS 355 1.24 0.02 0.36 0.00 0.19 0.66 0.35 2.20PLASTIC PRODUCTS 356 3.99 0.05 0.65 1.20 0.00 0.02 0.01 0.77POTTERY.CHINA,EARTHENWARE 361 0.49 0.01 0.44 0.05 0.01 0.06 0.04 0.68GLASS AND PRODUCTS 362 0.21 0.09 0.07 0.00 0.00 0.59 1.82 0.47OTHER NON-METALLIC MINERAL PROD. 369 5.16 0.47 4.14 0.27 0.37 39.09 34.33 3.55IRONAND STEEL 371 4.62 8.94 14.45 0.07 82.28 14.67 9.90 6.10NON-FERROUS METALS 372 0.35 0.07 0.51 0.39 0.45 0.80 0.04 0.09FABRICATED METALPRODUCTS 381 4.39 1.26 2.65 0.08 0.18 0.14 0.73 3.55MACHINERY,EXCEPT ELECTRICAL 382 0.06 0.01 0.02 0.00 0.00 0.01 0.01 0.05MACHINERY ELECTRIC 383 3.35 0.19 1.83 0.15 0.02 0.63 0.48 1.30TRANSPORTEOUIPMENT 384 1.41 0.03 0.33 0.00 0.00 0.12 0.10 1.43PROFESSIONAL & SCIENTIFIC EQUIPM 385 0.03 0.00 0.01 0.00 0.00 0.00 0.00 0.00OTHER MANUFACTURED PRODUCTS 390 0.22 0.02 0.05 0.00 0.51 0.01 0.01 0.12
See text (para. 50-52) for definition of pollution indicators

Page 1 of 29
ANNEX II
COMPETITION POLICIES
1. Trade Liberalization
Quantitative Restrictions and Licensing
1. Until the promulgation of the trade law of March 1994 imports were regulated in Tunisiaaccording to one of two regimes, a free regime whereby import operations required an import certificate,delivered more or less automatically, and a restricted regime where an administrative authorization, alicense or an import card was required depending on the nature of imports, the size of the applying firmor importer and its needs. This system was of the positive list type specifying the goods falling underthe free regime, all goods not included in this list were submitted to the second regime. The law of 1994has simplified the administrative procedure by unifying authorization procedures but more importantlyby replacing the positive list by a negative list limited to the goods that are still under the restrictedregime'.
2. Most imports were very highly regulated and restricted by both high duties and licensing until1986. The external payments difficulties of 1985 and 1986 dictated a change in policy orientation andled the government to undertake a vast program of reforms in many areas, in particular in trade policy,with the ultimate objective of promoting competitiveness and exports.
3. This new policy of liberalization paved the way for Tunisia to become a full member of GATTin 1990 after being confined to an observer status since 1959. By joining the Uruguay Round, Tunisiacommitted itself to a progressive removal of quantitative restrictions and their replacement by importduties.
4. The removal of import licensing has been gradual. In 1986, over 94% of imports (in terms oftariff lines) were licensed. The trade regime was even more restrictive than in earlier periods sinceunrestricted imports made up in 1983 over 20% of the total number of tariff lines (table I-1 ). Tradereform started in 1987 with the share of liberalized imports rising to 20% in terms of tariff positions(table I-l) and to almost 32 % in terms of import value (table 1-2). The reform focused in the first twoyears of structural adjustment (1987-88) on the liberalization of imports of raw materials, semi-processedand capital goods. By the end of 1988, almost 40% of imports became unrestricted; the share of freeimports was much higher for capital goods, standing almost at 70%, than for other goods, but 54% ofimports of raw materials (excluding energy) and semi-processed goods were also unrestricted (Table 1-2).The relatively high unrestricted share for consumer goods (41% in 1987 and almost 32% in 1988) ismisleading since this category of goods includes clothing used mainly by off-shore textile firms in theirexporting activities.
5. The removal of licensing continued after 1988 and has been gradually extended to food products,energy and consumer goods. For all goods the share of unrestricted imports stood in terms of tariff linesat almost 73% as of April 1994 and at over 76% after the publication of the negative import list at theend of August of the same year (table 1-4). In terms of import values, liberalized imports reached in
1/ Law no. 94-41 dated March 7, 1994 (Article 5).

Annex IIPage 2 of 29
1993 almost 77% of total imports2; energy has been partially liberalized whereas imports of food productsare still largely regulated by licensing (table 1-2).
6. As it is well known, it is more useful to assess the extent of liberalization in terms of the shareof domestic production protected by import licensing, since the aim of liberalization is to promotecompetitiveness by confronting domestic firms with foreign competition and inducing a resourcereallocation based on comparative advantage. On the basis of this criterion, the pace of liberalization canbe considered as having been very slow at the beginning of SAP, the share of domestic production withunrestricted imports not exceeding 6% and 14% of total production respectively in 1988 and 1989(table 1-3). Almost all food, textiles and mining remained protected by import licensing. The removalof quantitative restrictions has accelerated somewhat only since 1992 when almost half of domesticproduction started facing unrestricted imports. This share rose again to 60% in 1993 and stood,according to government estimates3, at 83% of total domestic production in 1994. According to theEconomic Budget of 1995, it is expected that liberalization will be extended by the end of this year toother goods representing 8.5% of domestic production. When this liberalization is implemented, licensingwill be confined to subsidized and luxury products representing 8.5% of domestic production.
7. The estimates of domestic production protected by import restrictions prepared for this workingpaper show lower rates of domestic production for which imports have been liberalized than thepreceeding results. The measure can have significantly different results depending on the methodologyand production weights selected. Also, the estimates for this paper have been based on the latest negativelist of August 1994, however, the calculations consider energy products as being among the group ofrestricted imports, when in fact these products are not on the negative list, but are controlled through astate import monopoly (ETAP). Table (1-4) shows liberalization rates for different activities and for theeconomy as a whole. For Agriculture and Fishing, the removal of import licensing applies to around54% of domestic production and there is for the moment no intention to liberalize the remaining goods.Cereals, most vegetables and live cattle (cows) are still protected through licensing.
8. For the whole manufacturing sector, the rate of liberalization stands at less than 53%. Withinthis sector, textiles and leather goods continue to be highly protected with only 39% of them free ofimport licensing. The products still restricted are mainly garments for which the removal of licensingis scheduled for this year (1995). Once this is carried out, liberalization for this subsector will reachalmost 87% of domestic production (column 2 of Table 1-4). Far more progress has been made inremoving import restrictions on mechanical and electrical products with liberalization reaching almost82% in terms of domestic production. In contrast, processed food products are still today under heavylicensing with as much as 60% of domestic production protected by this type of regulation. The productsconcerned are almost all cereal based in addition to olive oil which is a major Tunisian export. Finally,more than half of chemical products are still restricted through prior import authorization, in part becausethey are considered by the authorities to impose health risks.
9. Commercial policy is also still very restrictive with regard to mining and energy products. Ourestimates (Table 1-4) show a very low degree of liberalization for these products, less than 26% in termsof domestic production; moreover, this subsector is dominated by public enterprises having a quasi-importmonopoly. With mining and energy added to agriculture, fishing and manufacturing, the calculated rateof import liberalization decreases to around 50% of total domestic production. The authorities plan to
2/ More recent estimates show however a ratio of liberalized to the total value of imports of only 71.5% since thepublication of the official negative list at the end of August 1994 (Table 1-4).
3/ According to Bank's estimates, the share of unrestricted imports (in terms of domestic production) stood in 1994 at76%.

Annex IIPage 3 of 29
liberalize garments by the end of the current year (1995). This step will almost totally remove importrestriction on textiles, clothing and leather products. For manufacturing as a whole, the degree ofliberalization will thus increase from the current rate of 53% to 65% of domestic production. For allgoods, including mining and energy, liberalization will cover over about 59% of production. Accordingto official documents (the Economic Budget of 1994), the liberalization of textiles is supposed to be thelast step of the liberalization process started in 1987. Our estimates show however that when textiles areliberalized, there will still remain a significant share of domestic production that will be protected throughimport licensing.
10. The foreign trade law no. 94-40 promulgated in March 1994, effective in July of the same year,stated the principle of unrestricted import and export operations for all goods, with the exception of twosets of products that were to be later listed by decree; the first contains products involving security,public order, health, the protection of species and of cultural endowment. The second list, the nature ofwhich is not specified in this law, is supposed to remain temporarily under import licensing until the tradeliberalization program is completed.
II. The law of 1994 thus introduced the negative list system in Tunisian trade policy, which hassignalled a commitment to the removal of quantitative restrictions. The decree of August 1994 stated intwo separate tables (A and B) the two lists of products, defined at a nine-digit HS level, remainingpermanently and temporarily under restrictions. Table A covers a wide range of products not alwaysfalling under one of the reasons mentioned in the law and listed above: cereals or cereal-based products,fruits and vegetables, olive oil, motor vehicles, etc. In addition to products that clearly involve health,security or the preservation of cultural heritage, many other products included in this table are eithersubsidized basic food products or goods considered luxury goods such as jewelry, watches, yachts, butmainly passenger motor vehicles. Table B, listing temporarily restricted imports, contains essentiallygarments and passenger motor vehicles.
12. Cereals and cereal-based products belong to the permanent negative list. They have as a commonfeature their subsidization by the state at the producer level for grains and, in principle, at the consumerlevel for processed grains and products derived thereof. The public cereal board "L'Office des Cereales"has the monopoly to import cereals. It also collects whatever domestic output is available at prices thathave been over the last several years far above international prices. It then transfers the quantities thusacquired, domestic and foreign, to the millers at very low prices. The latter sells the derived products,flour or semolina, to bakeries, to other food processors or wholesalers at prices far below costs, onaverage less than a third of total costs, by adding to the cost of grains a milling margin covered bygovernment subsidies. It is understandable that because of heavy subsidization, the exports of theseproducts are restricted; but they also figure on the negative list of restricted imports.
13. The Tunisian authorities have imposed import restrictions on these products because ofsubsidization. If these restrictions are removed along with the import monopoly that the "Office desCereales" holds, private importers can sell cheap foreign produced cereals to the Office at much highergovernment set prices, which will add another heavy drain on the subsidy fund "Caisse Generale deCompensation" and eventually displace domestic production. This risk can of course be removed byadjusting duties on cereals imports in relation to the support prices set by the government for localproduction; but the intervention of a public board such as "l'Office" will continue to be needed as longas the subsidy system remains in place.
14. Import restrictions on finished food products are not justifiable by the subsidy argument sincesubsidies intervene at earlier processing stages. Their import prices tend to be much higher in generalthan those of similar domestic products (example of italian pasta) so that they cannot compete with thelatter as long as subsidies remain. For these products, liberalization will be an incentive for local

Annex IIPage 4 of 29
producers to improve quality and to reduce costs, even though the resulting price competition is likelyto be negligible.
Tariff barriers
15. With the significant removal of licensing that has taken place since 1992, The protection ofdomestic production has relied increasingly on tariffs. In addition to the existing duties, additionaltemporary levies, called provisional complementary duties, have been set up since 1991 in order toprotect local producers while they make the restructuring needed to face foreign competition. Theselevies, varying between 10 and 30%, are supposed to last a period not exceeding three years.
16. The Foreign Trade Law of 1994 has also introduced compensatory or countervailing duties inorder to offset dumping practices or subsidies granted on exports in the exporting countries and whichconstitute a threat or result in a prejudice to similar national production. According to this law, thereis dumping of a product if the export price to Tunisia is lower than its normal value or that of a similarproduct. Domestic production is also to be protected by countervailing duties against all kinds of director indirect subsidies, whether they are based on production, exports or transportation. These duties areallowed by GATT in its article VI at levies equal to the estimated dumping margin (difference betweennormal value and actual price) or to the amount of the subsidy.
17. The Tunisian law stipulates that the countervailing duties can be levied even after merchandiseshave entered the country, within a period not exceeding ninety days following customs declaration. Thisprovision has been a source of uncertainty for importers since the imported merchandise is often sold onthe domestic market, at prices based on the duties already paid, before the government could establishwhether there is a case of dumping or subsidization or not. Furthermore, because of the difficultiesinvolved in identifying the normal values and the direct and indirect subsidies or in establishing theresulting material prejudice or threat to domestic production of similar goods, it is not clear in someinstances whether the countervailing levy is really meant to offset such practices abroad or to strengthenthe protection of similar domestic products. In any case, the anti-dumping provision is potentially apowerful means to shield domestic producers from foreign competition.
18. Nominal tariff protection has undergone many changes since the beginning of the 80's. On theeve of structural adjustment, customs duties were relatively high, exceeding on average 40 %. They werealso widely dispersed, varying between 5 and 236%. As Table 1-5 shows, duties increased in importantproportions for all sectors between the years 1983 and 1986, exceeding 60% on average for foodprocessing and textiles and averaging over 40% for the total economy. With the reforms implementedduring the period 1987-1990, average rates declined to 29% for the whole economy, with major cutsinvolving agriculture, food processing and textiles. Dispersion was also significantly reduced, with dutiesconfined in 1990 to a range of 15 to 43%. However, the reduction of duties levied on imports of foodand textile products during this period should not be interpreted as a significant step towards liberalizationsince import licensing continued to cover over 90% of domestic textiles production and around 85% ofthat of agriculture and processed food (Table 1-3).
19. Effective protection also shows the same trend, declining for the whole economy from a rate of70% in 1986 to 52% in 1987 and decreasing further to an average of 43% over the years 1988-1990(Table I- 5). Effective protection remained however very high for manufacturing, averaging 84% in 1990with a true protection probably much higher than this rate because of import licensing.
20. The gradual removal of licensing has since been accompanied by an upward revision of dutiesfor non bound tariff positions as well as by the imposition of complementary provisional duties (DCP)since 1991. The simple average tariff has risen in the middle of 1994 to about 33 %, including the latter
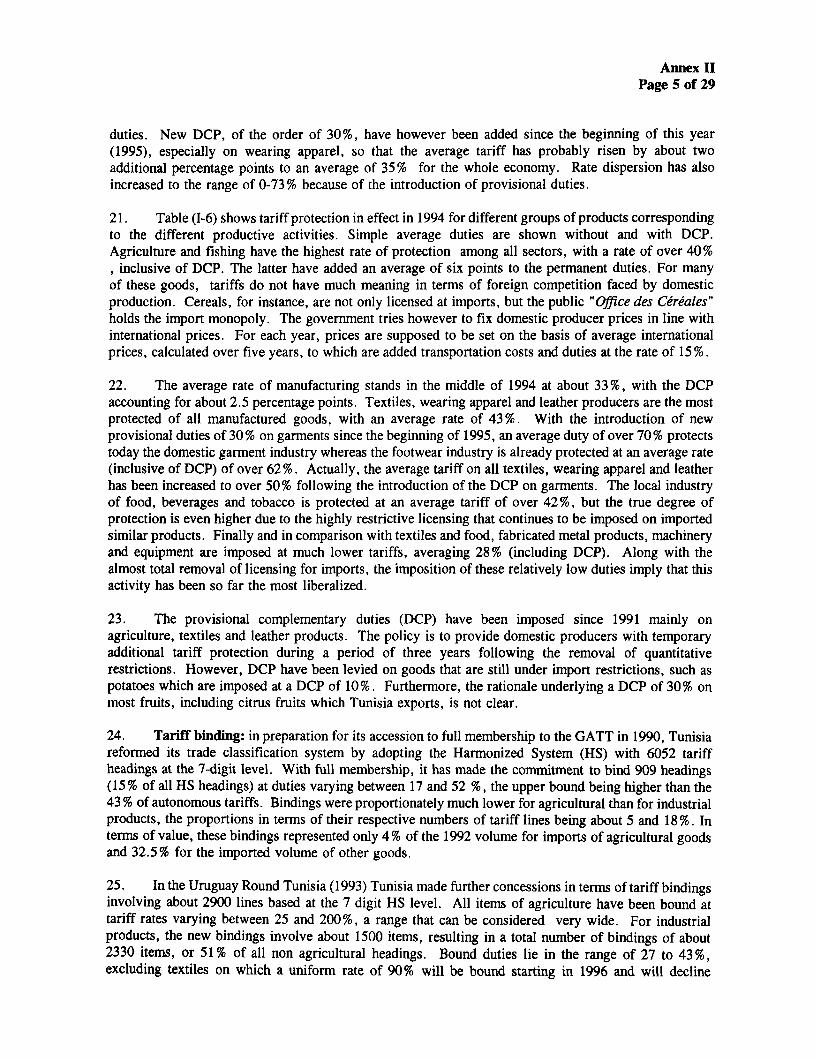
Annex IIPage 5 of 29
duties. New DCP, of the order of 30%, have however been added since the beginning of this year(1995), especially on wearing apparel, so that the average tariff has probably risen by about twoadditional percentage points to an average of 35% for the whole economy. Rate dispersion has alsoincreased to the range of 0-73% because of the introduction of provisional duties.
21. Table (1-6) shows tariff protection in effect in 1994 for different groups of products correspondingto the different productive activities. Simple average duties are shown without and with DCP.Agriculture and fishing have the highest rate of protection among all sectors, with a rate of over 40%, inclusive of DCP. The latter have added an average of six points to the permanent duties. For manyof these goods, tariffs do not have much meaning in terms of foreign competition faced by domesticproduction. Cereals, for instance, are not only licensed at imports, but the public "Office des Cereales"holds the import monopoly. The government tries however to fix domestic producer prices in line withinternational prices. For each year, prices are supposed to be set on the basis of average internationalprices, calculated over five years, to which are added transportation costs and duties at the rate of 15%.
22. The average rate of manufacturing stands in the middle of 1994 at about 33%, with the DCPaccounting for about 2.5 percentage points. Textiles, wearing apparel and leather producers are the mostprotected of all manufactured goods, with an average rate of 43%. With the introduction of newprovisional duties of 30% on garments since the beginning of 1995, an average duty of over 70% protectstoday the domestic garment industry whereas the footwear industry is already protected at an average rate(inclusive of DCP) of over 62 %. Actually, the average tariff on all textiles, wearing apparel and leatherhas been increased to over 50% following the introduction of the DCP on garments. The local industryof food, beverages and tobacco is protected at an average tariff of over 42%, but the true degree ofprotection is even higher due to the highly restrictive licensing that continues to be imposed on importedsimilar products. Finally and in comparison with textiles and food, fabricated metal products, machineryand equipment are imposed at much lower tariffs, averaging 28% (including DCP). Along with thealmost total removal of licensing for imports, the imposition of these relatively low duties imply that thisactivity has been so far the most liberalized.
23. The provisional complementary duties (DCP) have been imposed since 1991 mainly onagriculture, textiles and leather products. The policy is to provide domestic producers with temporaryadditional tariff protection during a period of three years following the removal of quantitativerestrictions. However, DCP have been levied on goods that are still under import restrictions, such aspotatoes which are imposed at a DCP of 10%. Furthermore, the rationale underlying a DCP of 30% onmost fruits, including citrus fruits which Tunisia exports, is not clear.
24. Tariff binding: in preparation for its accession to full membership to the GATT in 1990, Tunisiareformed its trade classification system by adopting the Harmonized System (HS) with 6052 tariffheadings at the 7-digit level. With full membership, it has made the commitment to bind 909 headings(15 % of all HS headings) at duties varying between 17 and 52 %, the upper bound being higher than the43 % of autonomous tariffs. Bindings were proportionately much lower for agricultural than for industrialproducts, the proportions in terms of their respective numbers of tariff lines being about 5 and 18%. Interms of value, these bindings represented only 4% of the 1992 volume for imports of agricultural goodsand 32.5% for the imported volume of other goods.
25. In the Uruguay Round Tunisia (1993) Tunisia made further concessions in terms of tariff bindingsinvolving about 2900 lines based at the 7 digit HS level. All items of agriculture have been bound attariff rates varying between 25 and 200%, a range that can be considered very wide. For industrialproducts, the new bindings involve about 1500 items, resulting in a total number of bindings of about2330 items, or 51% of all non agricultural headings. Bound duties lie in the range of 27 to 43%,excluding textiles on which a uniform rate of 90% will be bound starting in 1996 and will decline

Annex IIPage 6 of 29
gradually to 60% in the year 2005. Thus total bindings represent about 63% of all items, which is verycomparable to what developing countries have offered on the average in the Uruguay Round (GATT,1994). It is however worth noticing that bound tariffs remain too high for textiles and for agriculturalgoods. Rates of effective protection are much higher than what nominal rates imply, even though recentestimates of the former rates are not available. However, with reasonable assumptions on cost structure,it can be shown that with the bindings offered, domestic production of wearing apparel will continue toenjoy for a long time to come effective protection rates exceeding 100% .
26. On the basis of these trends and given the high protection that can be imposed throughcountervailing duties against dumping and subsidization, it is difficult to assess the extent of liberalizationof textiles and leather products. While it is recognized that the removal of licensing will be a significantstep towards liberalization of the corresponding domestic activities, the binding of tariffs at such highrates may have the opposite effects.
II. Competition Policies and Differentiated Support Measures
27. The Tunisian system of investment incentives has evolved since the first code of 1969 whichconcerned both national and foreign investment. Major steps have been taken towards liberalizinginvestment project undertaking and reducing barriers to entry and distortions between activities, butfurther reforms are still needed.
The old investment incentive system
28. According to the law 69-35 of 1969 an investment project of any kind, be it a first project, aproject of extension or of replacement, as well as any relocation of a production unit within the country,had to obtain government prior approval. Investment was therefore highly regulated and capacity strictlylicensed. However, this code already contained important fiscal and financial incentives to investmentwhich did not discriminate in principle between sectors. The main incentives, which varied accordingto the size of investment and the number of jobs to be created, were temporary income tax holidays,investment tax credits, exemptions from import duties and other taxes on imported capital goods, andgovernment guarantees facilitating the access to bank loans. According to this code, the Governmentcould also grant other important advantages on a conventional basis such as tax rebates lasting a very longperiod, the availability of a subsidized or even a free site, preferential interest rates, etc.
29. The code of 1969 went as far as granting to some investors on a conventional basis a monopolyposition and prohibiting the imports of the goods to be produced. These incentives constituted of coursestrong measures of protection that were to last until 1987 and to give rise to many highly inefficient andcostly investment projects.
30. From 1972 on a specific incentive system has been applied to the promotion of exports. The socalled totally exporting or off-shore firms were granted special advantages, the most important of whichwere total exemptions from duties and other taxes on imports of equipment, raw materials andintermediate inputs, as well as an income tax holiday for a period of ten years. The latter advantage waslater converted into a permanent income tax exemption.
31. The 1980s witnessed the proliferation of sectoral investment codes or incentive schemes, whichwere in contrast to the code of 1969 which, at least in principle, did not discriminate between sectors.These codes contained incentives tied to the fulfillment of different objectives the most important of whichwere export promotion and the development of lagging regions. They all contained more or less the sametypes of incentives: investment tax credits, income tax holidays, rebates or exemptions from import dutiesand value added taxes. However, in addition to these advantages, tourism and agriculture benefited from

Annex IIPage 7 of 29
access to credit at preferential interest rates which in the case of tourism attracted a larger share of totalinvestment and induced heavy reliance on cheap bank credit and less on equity financing.
32. These incentive schemes provided generous advantages which resulted in a relatively largefinancial cost for the government, exceeding 1% of GDP per year or more than 4% of total fiscalreceipts. They also resulted in large distortions between various activities, notably in favor of off-shorefirms, of foreign or Tunisian nationality, as opposed to firms producing for the local market, and, withrespect to sectoral allocation, in favor of tourism and agriculture as opposed to manufacturing for thelocal market or services. Whereas the bias in favor of exports was largely justifiable during a periodwhen firms producing for the domestic market were highly protected from foreign competition throughhigh tariff barriers and very restrictive import licensing, it is much less justifiable today within the newcontext of import liberalization and the increased openness of the domestic market.
33. The discrimination between sectors resulted in highly dispersed marginal effective tax rates whichwere very different from the apparent statuary corporate income tax rate of 35 %. Given the preferentialinterest rates and the income rebates and exemption provisions applying to tourism and agriculture, theeffective rates for these two sectors were practically nil. For other activities such as manufacturingdestined to the local market and not withstanding tax evasion, effective rates were near the 35 % statutoryrate. These distortions were bound to induce a misallocation of capital and has already probably inducedexcessive investment in tourism.
34. The granting of preferential interest rates to agriculture and tourism in the incentive system ofthe late 1980s has also resulted, in spite of tax exemptions on reinvested income, in a bias towards debtas opposed to equity financing.
The new incentive system
35. The new investment code stipulated by the law 93-120 of December 1993 has replaced thesectoral codes of the 1980s as well as practically all other general or specific advantages granted toinvestors. It has been labeled "code unique" to the extent that it applies to all activities and contains a setof measures tied to the fulfillment of horizontal objectives, regardless of the sector where the latter areachieved. Contrary to the former codes which provided incentives for two objectives, export promotionand regional decentralization, the new code extends many of the incentive measures to other importantobjectives in a relatively coherent way: agricultural development which is a sectoral concern but to whichis associated the objective of food security, protection of the environment and the fight against pollution,the promotion of technology, research and development and energy saving, the development of newentrepreneurship and finally the encouragement of institutions involved in support service and humancapital formation: education, health, vocational training, cultural production, etc.
36. The incentives that are common and therefore non discriminatory between activities are thefollowing:
- Tax exemptions on reinvested income up to 35 % of income both for individuals and companies. Inthe case of the latter this advantage is obtained provided equity is not reduced during the five yearsfollowing reinvestment.
- Accelerated depreciation for equipment with a fiscal amortization period longer than sevenyears. It is a new measure introduced by the new code as compared to the former sectoral codes.
- The reduction of import duties to the rate of 10%, the suspension of the value added tax andthe consumption duty (droit de consommation) on imported equipments for which there are no

Annex IIPage 8 of 29
similar local products and the suspension of the latter two taxes on locally produced capital goodsthat have been defined in a decree. Most equipment is therefore taxed at the relatively moderateimport duty of 10% as compared to the much higher average statutory rate, which is of the orderof 25 %.
Specific incentives and distortions
37. Exporting firms: The Tunisian incentive system has granted since 1972 very generous fiscaladvantages to exporting firms. These advantages which were gradually increased peaked in 1987 whenit was decided to grant total and permanent income tax exemption to off-shore or totally exporting firms.The Tunisian authorities then argued that the decision was taken because a limited tax holiday (ten years)induced firms to close down at the end of the holiday and to reopen under a new name in order to escapetaxation. The new legislation of 1993 introduced some changes in this investment scheme but kept thedistinction between totally and partially exporting finns, and limited in a very restrictive way access ofthe former to the domestic market.
38. According to the legislation enacted since the beginning of 1994, totally exporting firms, i.e.those that export at least 80% of their output if they produce manufactured goods or services and 70%of their output if they produce agricultural goods, are granted the following advantages: an income taxholiday during the first ten years following the first export operation followed by an imposition at a rateof 17.5%, which is equal to half the normal rate applying to other firms; income tax exemption onpersonal or corporate income; total exemption from all taxes and duties on imported equipment and allother imported inputs entering their exports.
39. Off-shore firms are allowed to sell up to 20% of their turnover on the local market if they areproducers of manufactured products or services and 30% of their output if they are agriculturalproducers. However, these sales are unconditional only if they involve products for which there is nosimilar other domestic production. If they compete with on-shore production, sales allowed on thedomestic market cannot exceed the amount of their purchases of locally produced inputs and only 50%of the value of such purchases in the case of textiles and footwear. In addition, for off-shore firms otherthan those in agriculture, there is an income tax withholding equal to 2.5% of the amount of sales on thelocal market.
40. One objective lying behind these restrictions is to strengthen the backward linkages of off-shoreactivities with the other activities. However, this system has some drawbacks. Firstly, the 20% ceilingon companies producing goods with no on-shore equivalents does not serve any useful purpose anddiscriminates against these companies in comparison to the treatment of similar products purchased fromabroad. Clearly, since the activity of such companies does not compete with on-shore production, itwould have been more sensible to allow off-shore companies and foreign investors to develop theirexports and to have at the same access free access to the local market of these products. With tradeliberalization, the Tunisian economy will greatly benefit from the equal treatment of sales of theseproducts by off-shore companies and imports. This treatment will consist, as it is stipulated in theinvestment code, in levying on these sales exactly the same duties as those levies on similar imports, withno restrictions on the share of output locally sold.
41. Policy towards off-shore firms producing goods competing with other domestic production isclearly meant to protect the latter. Up until now almost all off-shore production, mainly clothing andgarments, has been of the competing type and most of the existing firms involved do not purchaselocally manufactured inputs in the proportions needed to sell 20% of their output domestically. In thecase of textiles and footwear, off-shore firms will have to purchase more than 60% of their intermediateinputs locally in order to be allowed to reach the 20% domestic market share. This is clearly a very

Annex IIPage 9 of 29
restrictive measure which discriminates against locally as opposed to foreign produced importable, themore so that the tendency has been for the removal of quantitative restrictions and their replacement bytemporary import duties for all goods, complementary and similar to local goods alike, including textilesand footwear the liberalization of which having already been undertaken. There are of course fiscaldifficulties involved in controlling domestic sales by these companies but they are not insurmountable andprobably not more severe than those encountered in controlling on-shore firms.
42. More importantly, Tunisia will make very important liberalization commitments within theframework of the Free trade Zone with the European Union with which 75% of total external trade istransacted. All Tunisian tariff and non tariff barriers on goods exported by the E.U. would have to beremoved within a maximum period of twelve years, and this liberalization would have to cover at least60% of Tunisia's imports from the E.U. in the first five years. If actual restrictions on domestic salesby off-shore companies are maintained, they will clearly discriminate, at the expense of the promotionof the local economic activity, against these companies and in favor of producers located abroad.
43. Partially exporting firms: the new incentive system grants these firms many but not alladvantages going to off-shore firms. They benefit from the same ten-year income tax holiday, followedby reductions in later periods, but only on profits earned from exports. They also get refunds of importduties paid on intermediate inputs and equipment, in proportions related to their exports. However,earnings saved and reinvested in the expansion of export capacity do not get any tax deduction orexemption, beyond the minimum 35% rate that is common to all activities, as long as these firms do notswitch to the off-shore status which cannot be obtained unless exports represent at least 80% of total sales(for activities other than agriculture). Furthermore, refunds of import duties on equipment are allowedonly if the latter does not have any similar domestic product, a measure that puts partial exporters at adisadvantage with respect to totally exporting ones and certainly discourages them from purchasing locallyproduced capital goods.
44. The investment code does not therefore put on an equal fiscal footing partially and totallyexporting firms. Clearly, there are serious distortions when the holding of equity in a firm that exportsbetween 80% and 100% of its output is totally exempted from the income tax whereas investment inanother firm making less than 80% of its sales out of exports is granted a reinvestment tax credit of only35%.
45. Given the liberalization commitments made by Tunisia towards GATT, but more importantly thecommitments within the FTZ agreement with the E.U., there is a need for a major rethinking of theincentive system with regard to the differentiation between totally exporting firms and those producingfor the local market. With the projected removal of tariff and quantitative barriers on imports from theE.U., which make up the bulk of Tunisia's imports, export incentives will no longer serve their initialpurpose of compensating the distortions resulting from protection. If these incentives are maintained,they will result in reverse discrimination against firms producing for the local market and adjusting toforeign competition. Tunisia's membership to GATT and WTO also implies the removal of trade relatedinvestment measures (TRIMs) within a period of five years. Export incentives fall within this categorysince they link tax concessions to the fulfillment of certain export conditions. Major revisions in thetreatment of exporting and non exporting firms will thus have to be carefully prepared and enacted in themedium term. In the meantime and as long as the domestic market continues to be protected by hightariffs and complementary temporary duties ("Droits Complementaires Provisoires"), reforms should beundertaken to simplify the procedures related to handling and servicing the refunds of duties and othertaxes levied on intermediate inputs used in the production of exported goods by partially exporting firms.In this transitional period, it may even be both a sensible and workable policy to remove restrictions ondomestic sales by off-shore firms.

Annex IIPage 10 of 29
46. Other activities: The new code of 1993 grants important incentives to investment in agricultural,in first stage processing of agricultural products (such as milk processing and conditioning, processingand canning of fruits, vegetables and sea products), in fishing activities and in agriculture and fishingrelated services, including the collecting and storage of cereals. All these activities are practicallyexempted from personal or corporate income taxes. In addition to exempting all reinvested income fromthese taxes, the code grants them a ten year tax holiday at the end of which they will be taxed, accordingto the tax code, at the flat rate of 10%, which is a much lower rate than the 35% rate applying to othersectors. Moreover, investment in agriculture can be granted, after obtaining the approval of a relevantcommission in the Agriculture Ministry, a subsidy varying according to the size of the firm, amountingto as much as 7% of the cost of investment. This measure is certainly an improvement with respect tothe old system where the agricultural code of 1988 gave investors access to credit at highly preferentialinterest rates. Preferential rates on loans to tourism have also been eliminated which is likely to reducethe capital intensity of this activity and the very strong attractiveness of this sector, relatively to otheractivities. The removal of interest rate subsidies has thus been an important reform introduced in the newcode.
The removal of capacity licensing
47. Investment has been significantly liberalized since the beginning of SAP in 1986. As statedabove, the investment code of 1969, which more or less continued to regulate investment until 1987,imposed the prior government approval for any kind of investment and allowed even for the grantingof monopoly power to investors in some cases. This very restrictive regulation certainly constituted ahindrance to private investment development and created an attitude of suspicion on the part of potentialinvestors towards the regulatory agencies, in particular towards the regulatory agency in charge ofmanufacturing investment (then called "Agence de Promotion de lI'nvestissement" or A.P.I.).Entrepreneurs had to endure long waiting periods before the decisions made by this agency were made;furthermore, capacity licensing was very restrictive in some activities, such as textiles, on the basis thatthey were already saturated and that existing total capacity reached the "optimal level". The regulatoryagencies thus created barriers to entry to potentially successful firms and protected existing ones againstpotential competition. In other words, these agencies preempted the market from playing its mostimportant function of rewarding efficient projects and sanctioning inefficient ones.
48. Under SAP and with the promulgation of the manufacturing code of 1987, investment becamederegulated as long as it did not request any of the incentives designed in this code. This was of coursea significant step towards liberalization but since most private investment relied on and made use of fiscaland financial advantages, government prior approval continued to cause delays in project implementation.49. The new code unique of 1993 has reasserted the principle of freedom of investment, the onlyadministrative requirement being an investment declaration made to the relevant agency or governmentdepartment. Prior government approval has thus been removed for all but certain activities listed in alater decree (decree no. 94-492 of 1994) as well as for other activities that have remained unspecified.Listed activities still regulated belong mainly to the service sector but also involve other sectors: fishing,tourism under all its forms (lodging, recreation and transportation), handicrafts, transportation (road,maritime and by air), telecommunications, education, vocational training, cultural production, health andreal estate development. Investment in other services are still highly regulated even though they are notmentioned in the code (restaurants, "cafes", etc.). On the other hand, the code does not apply to financialservices, mining and energy which continue to be regulated respectively by the monetary authorities andthe relevant economic departments.
50. The conclusion that can be drawn is that investment has been significantly deregulated since 1987and that this deregulation has been confirmed in the new code of 1993 for most activities. However,prior government authorization is still imposed on investment in other activities which in 1993 exceeded

Annex IIPage 11 of 29
40% of total investment, private and public.Transportation in particular is still highly regulated and entryto it by private entrepreneurs still unduly restricted.
51. Concerning foreign investment, the new legislation makes a distinction between off-shore ortotally exporting firms in all activities but agriculture, services other than those exported by firms havingan off-shore status and agricultural projects. Investment undertaken by the first category of firms isunrestricted, the treatment being the same as for national finrs. The second category, comprising manyservice activities, is submitted to the prior approval of the Higher Investment Commission (CommissionSuperieure d'Investissement) if the foreign capital has a majority share higher than 50% of total capital.The main activities concerned are transportation, telecommunications, travel agencies, cultural productionand distribution, real estate development, construction and maintenance, computer services, consultingand auditing. Finally, foreign companies or individuals can invest in agriculture only on a rental basis,land ownership being strictly prohibited (law 93-120 of december 1993).
52. While the regulation of foreign investment in agriculture can be considered restrictive, it stillrepresents a significant liberalization decision as compared with the previous period where foreigninvestment was shut out of this sector. However, the economic and strategic rational behind restrictionsimposed on investment in many support services is not clear. Such is the case, for instance of softwaredevelopment and updating, consulting and auditing when we know that other countries such as India forexample have benefited from the involvement of foreign companies in these activities. In addition, giventhe restructuring needs of Tunisian firms to enhance their competitiveness, the opening to foreigninvestment of auditing and consulting services, notably in the area of international marketing and qualityand technological improvements, is likely to be highly beneficial both directly through the quality of theservices that will be delivered, as well as indirectly through the competition it will exert and the externalpositive effects it will generate for the local firms.
Industrial Support Measures
Fiscal and Financial Incentives to the Promotion of Technology
53. The Investment incentive system provides special advantages to investment in industry, agricultureand fishing helping to master or to develop technologies or to increase productivity. These advantagesare granted in the form of partial or total financing of the training related to such investment. Inaddition, investment in energy saving benefits from subsidies in the proportions of 5% of theexpenditures involved. Research and development carried out by firms in these sectors is exempted fromduties, VAT and consumption taxes on imported related equipment and can benefit from subsidiesamounting to as much as 20% of the cost of the equipments involved. Finally, firms in various activitiesare encouraged to enhance the quality of their staffing and capacity utilization through the financing bythe State of 50 % of social security taxes due respectively on university graduates and on additional shiftsduring a period of five years. These fiscal and financial advantages reinforce other schemes such as theIndustrial Technology Promotion and Absorption Fund set up in 1991 and which provides subsidies tosmall and medium industrial firms on their expenditures related to technological auditing, pre-technologystudies, the purchase of design and control equipment and the development of new industrial products.There is thus a whole panoply of fiscal and financial incentives aimed at the absorption of and thedevelopment of technology, the improvement of quality and the development of new products. It ishowever difficult to assess the importance of the total cost, in terms of both effective outlays and foregonefiscal income, incurred in the pursuit of these technological objectives.
Absorption of Technology and Support services

Annex IIPage 12 of 29
54. Support services to help firms modernize themselves technologically and to facilitate technologyabsorption are delivered by sectoral technical centers: CTMCCV for construction materials, CNCC forleather and shoes, CETIM for machinery, electrical and electronical equipment, CETTEX for textiles;etc. The mission of these centers is to help firms resolve their technical problems, to provide training(at highly subsidized cost) in their respective technical areas and eventually to carry out studies requestedby firms of the sector. They are staffed mainly with engineers, CETIM being the largest of them withapproximately 160 employees among which 60% are engineers. Many entrepreneurs have voicedcomplaints that these centers do not cater enough to their needs. Others have simply been suspicious ofthem fearing that their technological know-how will be communicated to their competitors; firms havethus relied so far much more on the technical assistance provided by their foreign suppliers of equipmentrather than on the centers. This has led the Tunisian Government to design the legal framework for thetransfer of the management and the responsibilities of these institutions to business sectoral associations.
Public Procurement Policies
55. Public procurement are regulated essentially by the decree 89-442 of 1989 (such as it has beenamended by the decrees of march 1990 and september 1994). This decree unified the legislation and therules applying to both public enterprises and public administrations, even though it kept from the formerlegislation, dating back to 1974 for the latter and to 1985 for the latter, certain rules specific to publicenterprises.
Transparency of rules
- The respect of procurement procedures is required on all purchases of goods and servicescosting above certain thresholds, with public enterprises allowed higher thresholds than otherpublic entities.
- The decree of 1989 is fairly explicit about the obligation to define the nature, the content andthe technical characteristics of the services or goods sought before any tendering is made.
- Procurement contracts can be broken down into several contracts if that is likely to give riseto technical and financial advantages. The terms of the procurement have to specify the number,the nature and the importance of each contract and eventually the maximum number of contractsany single bidder can bid for.
- Public entities, public administrations or enterprises are allowed to pool their procurement incommon contracts. This procedure strengthens the bargaining power of the public sector towardsthe private sector.
- Contracts can stipulate fixed or revisable prices. In the latter case, they should mention theperiod over which the initially proposed prices will apply and the precise rules to be applied inthe revision.
- Bidders have to constitute a temporary bail or deposit that does not exceed I % of the bid value.For the selected bidder, a final bail or deposit amounting to 3 % of the value of the contract canbe required. An additional guarantee of the respect of the contract can be requested, withoutexceeding together with the final bail 15% of the value of the contract.
Tendering procedures

Annex IIPage 13 of 29
56. The Tunisian system allows competitive as well as single tendering under some well definedconditions. Competitive tendering can take the form of a call to bid ("appel do'fres ") or of"adjudication". It can be open to all firms or restricted to pre-qualified firms. The terms of theprocurement have to be made available to interested bidders at least twenty days before the deadline setfor submission. Tendering through "adjudication" requires the fulfillment of the following conditions:the advertising of the opening of bids and the conclusion of the contract after selecting the least pricebidder. Single tendering allows that a specific firm be directly approached and awarded the contractunder one of the conditions defined in the decree of 1989: supplies tied to specific patents, technicalconditions dictating the recourse to a specific supplier, invitations to bid that remain unanswered or thathave induced unacceptable bids, urgency of the procurement, etc. The same decree defines thecomposition and the responsibilities of procurement committees at the state-owned firm, departmental,regional, or at the highest governmental level (Commission Superieure des marches); the latter has theresponsibility to verify the compliance with the regulation on the basis of all relevant tendering documentsin the case of large procurement contracts, defined according to thresholds defined by the decree.
Differentiated Treatment of firms
57. The system does not favor in principle public enterprises or other public entities over privatefirms, with the exception of the bails, deposits or guarantees from which public entities in which the stateholds more than 50% of equity are exempted. As for foreign firms and in the case of internationalbidding, the regulation grants some advantages to domestic producers. First, foreign bids are requiredto include a maximum of subcontracting to locals, as long as the latter are likely to fulfill parts of theprocurement; secondly, for the same quality, products of Tunisian origin have to be preferred overforeign products, as long as prices of the former do not exceed those of the latter by more than 20%.Finally and unless it is impossible, a foreign consulting firm has to associate itself with a Tunisianconsulting firm selected among those existing on the list of the concerned public entity. This regulationthus discriminates in favor of domestic firms, but is not very different from the legislation and practicefound in most countries, developed and developing alike. The Government Procurement Agreement(GPA), concluded within GATT during the Tokyo round, has prohibited any preferences for domesticfirms, but allowed developing countries not to apply the principle of non discrimination for some productsand some entities. It is however worth noticing that very few countries have signed the GPA (Tunisiais non signatory) and many of them continue to favor domestic over foreign firms.
58. These restrictions are meant to tie the selection of foreign suppliers to some transfer of technologyor know-how. However, the 20% price protection, according to which domestic suppliers have to beselected even if their prices are higher by up to 20% than those of foreign suppliers, represents asomewhat excessive protection to the extent that the latter have to pay more or less the same taxes andimport duties as domestic suppliers on the goods that will be used. In principle, the additional protectionought to be related to the value added that will be produced locally and not to the total value of theprocurement. With a 20% rate of protection on the latter, the effective protection rate granted toTunisian bidders is much higher than what the 20% nominal rate implies.
III. Pricing and Deregulation Policies
Price and Distribution Controls
59. The Tunisian economy has undergone major reforms in the area of price regulation since the year1986. Up until that year state intervention was pervasive and firms were very much constrained as faras price setting was concerned. Prices were regulated by a law of 1970 which established five regimesapplying to different categories of goods and services. The five regimes were: i) government price fixingapplicable to basic commodities and public utilities, ii) price certification (homologation), iii) price self

Annex IIPage 14 of 29
certification (Tautohomologation"), iv) "restricted" free price regime ("liberte contr&leef) and v)-unrestricted free price regime ("liberte totale").
60. Under the first regime, prices are set by the government and changed from time to timedepending on cost increases, the weight of the subsidies incurred as well as on socio-political conditions.This regime was applied mainly to basic subsidized goods and inputs, to products of mass consumption(tea, coffee, black pepper), to public utilities and to health services.
61. Under the Prior Approval regime, firms submit their accounts and other documents to the PriceRegulatory Department whenever they apply for price increases. This Department makes its decision onthe basis of these documents as well as on the basis of sectoral data. Firms are not allowed to changeprices until the government takes and notifies its decision, in principle within 45 days after receiving therequests. Prices are set for each firm on the basis of average costs of production (the sum of the costsof raw materials, labor cost and the cost of other components such as fuel, water and electricity, repairand maintenance, rent, depreciation and debt cost) to which are added a net profit margin equal to 20%of equity and an additional margin to cover overhead outlays. These two margins make up a total grossmargin set for each firm. Thus, prices may vary for the same product from one firm to another.
62. Given the lack of competition both from other domestic producers and imports, this policyguaranteed a return of 20% on equity regardless of whether firms were cost efficient or not andregardless of the degree of capacity utilization. In fact the price allowed by the Regulatory Departmentwas the higher, the lower the utilization rate. Such an approach was of course likely to encourage firmsto build up excessive production capacities, to choose capital intensive investment projects, as well as touse intermediate inputs inefficiently. In addition, it was likely to induce them to underreport thequantities produced so as to have approved by the government higher unit prices. The latter shortcomingpushed the government to change informally its formula of price setting on the basis not of the declaredquantities but on a percentage of installed capacity, set at 80%. It is also worth noticing that reportedincreases in the prices of raw materials could not be taken into account by the Regulatory Departmentunless they exceed the rate of 3%. This provision has been kept in the new law of 1991. With thesignificant deceleration of inflation (5% in 1994), such a provision is likely to penalize products stillunder control.
63. Whereas the prior approval regime applied for each set of products and for each firm, the selfcertification regime applied to the same products across firms. The latter were allowed to revise theirprices 45 days after notifying the government, unless the latter rejects the proposed revisions within thesame delays. Price changes should be based on average cost to which could be added a gross margin setby the government in agreement with the concerned business representatives (UTICA). These marginsvaried from one category of products to another: on the average 15% for food, 22% for leatherproducts, 20% for textile and clothing, 18% for construction materials, etc.
64. Finally, the restricted free price regime allows firms to set their prices freely and to apply anychanges 15 days after notifying the R.D.; however, the government reserves for itself the right tosupervise, to exert eventually some influence on firms' decisions and can go as far as rejecting theprojected price modifications within 15 days after being notified.
65. This complex system enabled the government to control profit margins, especially in sectorswhere market power was concentrated in the hands of very few firms at a time when the latter were veryprotected from foreign competition. It was also an efficient policy to control inflation. However, it wasa source of distortions, especially with regard to the way the margins were calculated and incorporatedin prices by the government, as stated above.

Annex IIPage 15 of 29
66. This system was cumbersome and difficult to manage. The Regulatory Department did not havethe logistics nor the human resources to run it efficiently and to seriously evaluate firm's applications forprice revisions. Out of some six thousand applications filed every year, the staff of this Department couldnot evaluate in any way more than a third. This resulted in long delays before decisions were made andcommunicated to firms. In the meantime and given the highly oligopolistic structure of most sectors andtheir protection from foreign competition, firms were in a position to reduce the quality of their products,which of course had the same effects as to increase prices. Price control was thus far from beingeffective.
67. Up until 1982 price control covered over 80% of all goods and services. Prices could be freelyset by firms only for 17% of goods and services (essentially producer agricultural products, thedistribution margins were still regulated). In 1982 the unrestricted regime was extended to another 18%of all goods and services bringing the total coverage of this regime to about 35 %. The self certificationregime was extended to about 26% of all products which had been under the fixed regime and marginallyunder the restricted free regime. The latter did not cover more than 2% of the total. A share of 37%were regulated through the other two regimes of government price fixing and certification (prior approval)of which the former took 34%.
Major shifts in 1991
68. The law of 1991 liberalized pricing by introducing the general principle of free pricedetermination within limits dictated by considerations pertaining to the protection of the purchasing powerof low income groups or, for some other products, by an excessive market concentration and a veryoligopolistic or monopolistic market structure. This principle was not therefore to concem all goods andservices but only those that did not fall under one of those two restrictions, the final objective being toliberalize pricing for about 85% of all products at both the production and the distribution stages.
69. Moreover, along with this principle were set new regulations setting rules of competition andshielding the economy from any abuses that may result from dominant market positions or collusionamong firms. The government has thus changed the nature of its intervention and reduced considerablythe scope of its regulation by setting the rules of competition and precluding any collusive behavior: inpricing, in entry, in production and capacity expansion and in market sharing (law no. 91-64 of July 29,1991); This law has also required transparency of information regarding prices and sale conditions. Onequalifier to this principle is however that the government can occasionally intervene in price settingwhenever it thinks it necessary but for a period not exceeding six months (this provision should perhapsbe removed since it can be considered as a source of uncertainty for firms, although it has not, to ourknowledge, been so far invoked).
70. For those goods and services that continue to be regulated ( prior approval and self certification.Under the first regime, the Regulatory Department sets prices on the basis of applying firms' accountsor of sectoral data if price changes involve a whole sector or activity. This regime, which is applicableto both production and distribution, replaced the two regimes of price fixing and of prior govemmentapproval in the old legislation. The second regime, applying only to distribution, defines distributionmargins as rates, absolute amounts or a combination of the two.
Procedure and Pace of Price Liberalization
71. Between 1982 and 1991, price liberalization was first announced in newspapers, then followedby legal texts (decrees of 1986 and 1990). The first significant actions of liberalization were undertakenin 1986, followed by new lists of products in 1990. Both lists involved mainly the producer stage andvery little the distribution stage.
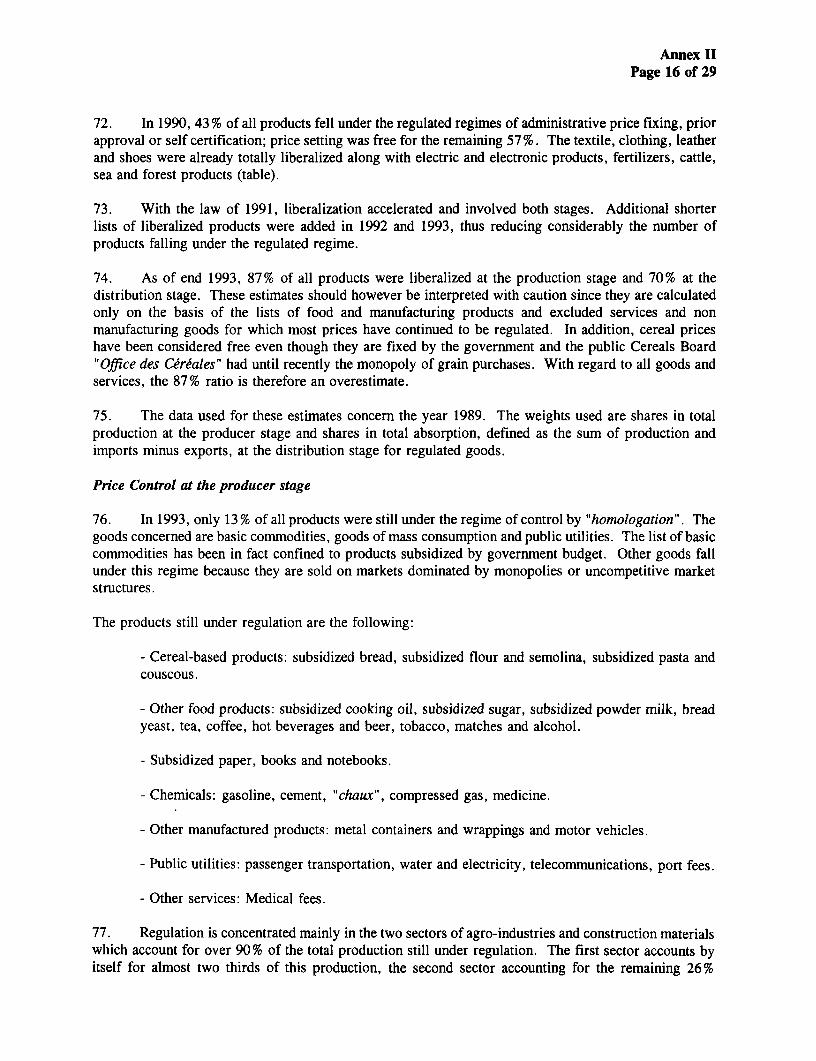
Annex IIPage 16 of 29
72. In 1990, 43 % of all products fell under the regulated regimes of administrative price fixing, priorapproval or self certification; price setting was free for the remaining 57 %. The textile, clothing, leatherand shoes were already totally liberalized along with electric and electronic products, fertilizers, cattle,sea and forest products (table).
73. With the law of 1991, liberalization accelerated and involved both stages. Additional shorterlists of liberalized products were added in 1992 and 1993, thus reducing considerably the number ofproducts falling under the regulated regime.
74. As of end 1993, 87% of all products were liberalized at the production stage and 70% at thedistribution stage. These estimates should however be interpreted with caution since they are calculatedonly on the basis of the lists of food and manufacturing products and excluded services and nonmanufacturing goods for which most prices have continued to be regulated. In addition, cereal priceshave been considered free even though they are fixed by the government and the public Cereals Board"Office des Cereales" had until recently the monopoly of grain purchases. With regard to all goods andservices, the 87% ratio is therefore an overestimate.
75. The data used for these estimates concern the year 1989. The weights used are shares in totalproduction at the producer stage and shares in total absorption, defined as the sum of production andimports minus exports, at the distribution stage for regulated goods.
Price Control at the producer stage
76. In 1993, only 13 % of all products were still under the regime of control by "homologation". Thegoods concerned are basic commodities, goods of mass consumption and public utilities. The list of basiccommodities has been in fact confined to products subsidized by government budget. Other goods fallunder this regime because they are sold on markets dominated by monopolies or uncompetitive marketstructures.
The products still under regulation are the following:
- Cereal-based products: subsidized bread, subsidized flour and semolina, subsidized pasta andcouscous.
- Other food products: subsidized cooking oil, subsidized sugar, subsidized powder milk, breadyeast, tea, coffee, hot beverages and beer, tobacco, matches and alcohol.
- Subsidized paper, books and notebooks.
- Chemicals: gasoline, cement, "chaux", compressed gas, medicine.
- Other manufactured products: metal containers and wrappings and motor vehicles.
- Public utilities: passenger transportation, water and electricity, telecommunications, port fees.
- Other services: Medical fees.
77. Regulation is concentrated mainly in the two sectors of agro-industries and construction materialswhich account for over 90% of the total production still under regulation. The first sector accounts byitself for almost two thirds of this production, the second sector accounting for the remaining 26%

Annex IIPage 17 of 29
(table). The remaining 10% concern the mechanics and electrical sector (7%) and Chemicals (mainlymedicine).
78. Price control continues to be very important for two subsidized categories of goods, the cerealbased commodities and cooking oil, government pricing covering more than 86% and 96% of theirrespective outputs. These two categories make up 40% of the total production of goods still underregulation. Control is also very restrictive for goods under monopoly or state production such as tobacco,beer, drugs and cement which together represent more than 40% of total regulated production (mainlycement and tobacco).
79. For most of the goods or services still under price regulation, the need for such control is likelyto decrease as trade liberalization proceeds and consumer subsidies are reduced. For food products suchas tea, coffee and hot beverages, the continuation of price restrictions can no longer be justified. Importsof the first two products have indeed been liberalized and open to the private sector and internationalprice fluctuations are such that consumer prices have been raised by over 60% in 1994, even thoughimports were practically the monopoly of a public trade board, the "Office de Commerce". It is not infact clear that the margins earned by this board are lower than what would be earned on such productsby private importers. As for hot beverages, "cafes" are classified in different categories and regulatedprices vary widely from one category to another. Furthermore, entry to this activity is not free since aprior government authorization is required.
80. The regulation of medical fees is not in fact restrictive as far as private health care is concerned.Government set fees are in fact applied only by public hospitals and pubic health insurance companiesin their refunds to members (CNSS and CNR). Doctors and clinics operating in the private sector chargefees that are far higher than government's tariffs. This regulation is therefore not effective as far as theprivate sector is concerned; it should be removed since the legislation looses its credibility in the absenceof enforcement.
Plice control at the distribution stage
81. Even though significant liberalization has been introduced, the regulation of distribution marginscontinues to be important. Whereas the unrestricted regime covered 47% of total absorption (domesticproduction plus imports minus exports) in 1990, this regime rose to 70% in 1993. The government hasset as a final objective the extension of this regime to 85% of all goods and services, implying that 15%more of all goods and services are to be liberalized at the distribution stage.
82. At the present time, the sectors most regulated at this stage are the agro-industry, the mechanicaland electrical industry and agriculture and fishing. These three sectors represent respectively about 28%,31% and 19% of total regulated absorption, or a total share of 78%. Chemicals and constructionmaterials make up another 15% of total absorption.
83. It is worth reminding that for agriculture there is hardly any price control at the production stage,notwithstanding cereals and milk for which the state guarantees minimum prices which are higher thaninternational prices. In contrast, the distribution margins are regulated for more than 80% of vegetablesand 60% of fruits. This distribution activity is very competitive and qualifies very well for liberalizationon the basis of the market structure criterion. It is true that the products involved are in most cases basiccommodities, but they are sold on sufficiently competitive markets so as not to fear any significantincrease in average margins if distribution were liberalized. The benefits liberalization are likely to bea wider variety in terms of quality and possibly also lower prices for the low income groups. Given thenumber of markets involved and therefore the public resources needed to conduct efficient and regular

Annex IIPage 18 of 29
control actions, the removal of such regulation will free public resources for the far more needed controlof hygiene and quality of the products sold.
84. Finally, the regulation of the distribution margins for motor vehicles will continue as long asimports are licensed. Importers and dealers have so far enjoyed oligopolistic positions and given thequantitative restrictions imposed on imports, they would have reaped high rents (in spite of the very hightariffs levied on them), had consumer prices been deregulated. Up until the end of 1994, dealers couldprevail of exclusive representation of foreign car companies, which provided them with monopolypositions and probably allowed them to earn handsome profits in spite of price regulation by thegovernment. Beginning in 1995, exclusive representation is no longer legal, a change which is likely topromote competition in the sector, but it is not yet clear how that is going to be enforced. In any case,the government has no intention to liberalize the distribution margins in the near future and is unlikelyto do so unless imports of these products are liberalized. It is worth noticing with this respect that carimports have been very restricted for a long time, even though there has been a significant increase inthe imported volume over the last two years (1993-1994). The restrictiveness of quantitative restrictions,combined with very high customs duties and other taxes, has been such that the average age of cars incirculation is very high, exceeding twelve years. As a consequence, imports of spare parts have beenvery high so that it is far from obvious that there has been any optimization between imports of cars andof spare parts.
Deregulation
The transport sector
a) Merchandise transport
85. It is the activity the most liberalized in this sector which represents an interesting experiment inderegulation as well as in privatization which will probably have an incidence on the course and pace ofliberalization in the future. A law opening regional merchandise transport was already in place in 1985but it was not enacted until 1989. The number of private carriers has since increased significantly, risingto 77 in 1992. Today there are over one hundred private carriers operating at the regional level.
86. One can safely conclude that the reform has been beneficial to the sector. Transport fees havebeen lower by a third on the average as compared to the maximum fees charged by public regionalenterprises before deregulation became effective in 1989. For some merchandises, tariffs have been cutby us much as one half in nominal terms. Furthermore and contrary to an argument often made, laggingregions have also benefitted from the reform.
87. Public regional enterprises have however been significantly hurt by liberalization. Due to largeinefficiencies and high costs, especially but not only labor costs, they have not been able to adjust to thecompetition forced on them by small and medium size carriers who are more dynamic and having a muchgreater adaptive capacity. The removal of barriers to entry to the sector has thus induced a lot ofcompetition, the more so the activity does not require a large capital base or a scale of activity to be runprofitably.
88. Initially, there were twelve regional public enterprises involved in both passenger andmerchandise transport. Following government decision in 1992 to privatize merchandise transport, thetwo activities have been completely separated and twelve merchandise enterprises have ben created. Theyare now in the process of privatization once the problem of layoffs has been resolved (layoffcompensations for their employees amounting to as much as 29 months of wages).

Annex IIPage 19 of 29
89. This process has perhaps taken too long since these enterprises have been losing more money overthe last two years because of the fierce competition coming from private carriers. The government alsoruns another nation wide company (la Societe de Transport de Marchandises "STM") which has raisedfinancial and management problems as serious, if not more, as the regional companies. These companieshave lost a big share of their activity to private carriers, as the following table clearly shows:
Table: Merchandise Road Transport (Public/private sectors, 1991-1993)(Shares in %)
1991 1992 1993
Regional Public 42 38.2 30.8
Enterprises
STM 21.6 12 4.6
Public Sector (total) 63.6 50.2 35.4
Private Sector 36.4 49.8 64.6
Source: Ministry of Transports
90. The structural shifts have been rapid and very significant since private carriers have increasedtheir share in the total volume of transport from slightly over a third in 1991 to almost two thirds in1993. This expansion has been achieved at the expense of both the regional public firms and the nationwide firm (STM). For the latter firm, the volume of activity has shrunk dramatically, standing in 1993at less than one fourth of the volume of 1991. Its situation has therefore deteriorated significantly andits privatization has been long overdue.
b) Passenger transport
91. Passenger transport is still covered mainly by the public sector made up of the "Societe Nationalede Transport Interurbain" (SNTRI) as far as inter city traffic is concerned, and of the `Societe Nationalede Transport" (SNT) and the twelve regional enterprises which are in charge of inner city transport. Theprivate sector has been so far allowed to run only taxis for both inner and inter city transport, with theexception of two bus licenses that have been granted on a very restrictive basis for passenger transportwithin Tunis, one of which is already in use.
92. Deregulation of this activity has so far concerned only authorizations granted to taxi operators.It has been limited to the removal of administrative barriers and to the design of a system of incentivesto modernize and expand the taxi network. This has resulted in a very important increase in the numberof licenses granted which has increased by threefold between 1991 and 1994. The opening of the busactivity to the private sector is not envisaged by the government, apart perhaps from a few lines thatwould be defined and strictly regulated. The public company manages today to be more or less infinancial equilibrium because it covers the losses incurred by running unprofitable horizontal lines linkingthe littoral to the other regions by surpluses made on the littoral business. The government fears if itauthorizes private carriers to enter this activity, they would be interested only by the littoral business,leaving the unprofitable business of the other regions to the public company. The latter would thus runbig losses that will have to be borne by the government budget. Against this argument in favor ofexcluding private carriers two questions can be raised, apart from the fact that much of this activity wasefficiently run by private carriers in the sixties. The first is to what extent the off littoral lines are losingmoney because they cannot really be profitable and or because they are simply run inefficiently and at

Annex IIPage 20 of 29
excessive costs. Even if they are really unprofitable, a second question is whether the deregulation andultimately the privatization of this activity, along with the continuation of subsidized public services inthe off shore regions, will not be a better option than the costly status quo.
c) Maritime Transport
93. 90% of Tunisia's external trade uses maritime uses shipping of which only a share of 20% isserviced by the Tunisian national fleet, dominated by one public company, the "Compagnie Tunisiennede Navigation" (CTN). There are also three private shippers in addition to the specialized firm "GabesChimie Transport" which used to be publicly owned and which was privatized in 1993. The privatesector is however still very small with a very minor share in the total shipping volume not exceeding onepercent.
94. The public company, the CTN, has been granted advantages which constitute in fact barriers toentry for the private sector. The first is the national monopoly it enjoys on the most profitable lines (mainly Tunisia-Marseille). Recent agreements, concluded in accordance with GATT, have dividedmerchandise maritime transport between the south of France and Tunisian ports among French, Tunisianand other shippers in the proportions respectively of 40, 40 and 20%. The Tunisian fleet is not todaysufficient to fulfill its shipping share and the private sector should be allowed to enter the most importantregular lines so as to fill this gap. In addition, CTN still enjoys the right of first refusal which allowsit to be informed of any shipping operation requested by a resident exporter or importer and to have thepriority of making a competitive offer within two days after notification. This may have resulted in extracost for trade operations. It may be true that this activity is highly capital intensive and requires largeresources that may not be within the reach of the private sector, but these two restrictions are additionalinstitutional barriers to entry that should be rethought.
95. Maritime transport suffers also from the monopoly situation that the cargo-handling state firm,the STAM, holds in the ports of Tunis (Tunis, la Goulette and Rades) where productivity is notoriouslylow and costs are very high compared to other ports (Sousse and Sfax) where cargo handling is done byprivate firms.
d) Air Transport
96. The public company Tunis Air shares the regular lines with foreign companies according tobilateral arrangements. The charter activity has been liberalized and opened to the private sector (twocompanies have been recently set up in partnership with foreign carriers) but Tunis Air continues to beprotected as far as the most important part of air transport, which takes the regular lines, is concerned.This privilege, along with the important depreciation of the dinar that has taken place since 1985, hasprovided it with a comfortable financial position which has concealed serious problems of overstaffingand management. There are no plans to privatize it or to remove the monopoly it enjoys over the regularlines. The only option that is being envisaged is to sell 10% of equity on the stock market.
m:\hinda\cem\annex2a10.13.95

Annex LlPage 21 of 29
Table 1-1- Llberalized and Restricted Imports (1983-1994)(Based on tariff lines)
1983 1986 1987 1988 1989 1990 1994
Restricted imports- Number of tariff lines 6598 7966 6781 5963 4747 4045 1646- % of total number of lines 78.3 94.2 80.0 69.8 56.7 48.3 27.4
Unrestricted imports- Number of tariff lines 1827 489 1694 2577 3629 4331 4367- % of total number of lines 21.7 5.8 20.0 30.2 43.3 51.7 72.6
Total number of tariff lines 8425 8455 8475 8540 8376 8376 6013Sources: Forthe years 1983 to 1990: IEQ,1992
For 1994: GATT, 1994.
Table 1-2- Unrestricted Imports (1987-1993)(Shares of unrestricted imports In total Imports)
Year 1987 1988 1989 1990 1991 1992 1993
0.9 0.4 2.5 9.4 19.6 28.9 41.5jFood 0.0 0.0 15.4 17.5 23.9 94.1 99.7Energie 37.0 54.2 65.1 82.7 82.9 85.9 86.1Raw Mate. and Semi-Processed 40.5 69.6 77.9 73.5 76.2 94.6 80.3Capital Goods 41.2 31.7 54.9 66.1 78.9 91.0 70.4Consumer GoodsTotal 31.8 39.4 53.0 64.0 72.2 84.2 76.8
Source: Institut d'Economie Quantitative.

Annex IIPage 22 of 29
Table 1-3. Shares of Domestic Production Protected by Quantitative Restrictons
1987 1988 1989 1990 1991 1992 1993
Total manufacturng 96.6 94 85.6 68.4
-Food 99.8 99.6 95.6 83.9- Chemicals 94.4 93.7 90.2 50.9- Textiles 98.5 97.8 93.6 90.5- Electrical & Machinery 90.3 88 61.3 53.8
Agriculture 97.3 98.4 98.3 85.5
Mining 99.3 98.4 98.3 85.5
Total Economy 97 94.7 87.5 71.9 70.33 52.45 39.95Sources: 1987-1990: World Bank unpublished document on changing the structureof incentves, April 1991. For 1991-93: Banque Centrale de Tunisie.
Table (14)- Uberalized imports.1995 (in terms of domestic production) |In terms of production 89 In terms of production 92
(1) (2) (3) (4)Share(in %) % fib. if Share(in %) % lib. ifof libera. imp. garments Inc. of libera. imp. garments inc.
Activity
Agriculture and Fishing 58.0 58.0 54.5 54.5
Manufacturing 54.1 64.9 52.8 65.0- Agro-industry 41.5 41.5 38.7 38.7- Construction materials 79.8 79.8 81.7 81.7- Mechanical and electrical products 82.9 82.9 81.6 81.6- Chemical products 47.1 47.1 49.9 49.9- Textiles, clothing and leather products 41.2 86.2 39.1 86.8- Other manufactring products 69.7 69.7 69.1 69.1
Agriculture, Fishing and Manufacturing 54.9 63.6 53.2 62.6
Minerals and Energy 24.6 24.6 25.2 25.2
All goods 51.1 58.8 50.4 58.9
Source: Estimates based on the negative list of August. 1994.Columns (1) and (3): based on the list of restricted imports of August 1994Columns (2) and 14): suppose that all garments will be liberalized.

Annex IIPage 23 of 29
Table 1-4'- Liberalized imports 1995 fin terms of imports)Tariff lines Value of Imports (a)(1) (2) (31 (4)
Liberalized Ratio libera. Liberalized Ratio libera.(%l inc. garments (%) inc. garmrents
Activity
Agriculture and Fishing 66.7 66.7 24.0 24.0
Manufacturing 77.2 81.6 79.6 82.4- Agro-industry 60.2 60.2 35.8 35.8- Construction materials 84.9 84.9 85.7 85.7- Mechanical and electrical products 83.9 83.9 88.3 88.3- Chemical products 83.8 83.8 83.5 83.5- Textiles, clothing and leather products 61.4 82.6 72.3 85.4- Other manufactring products 80.5 80.5 86.1 86.1
Agriculture, Fishing and Manufacturing 76.7 80.9 75.0 77.5
Mines and Energy 35.1 35.1 16.7 16.7
,All goods 76.2 80.3 71.5 73.9
Source: Estimates based on the negative list of August 1994 and INS statistics.(a): Rates of liberalization based on import values for the year 1989
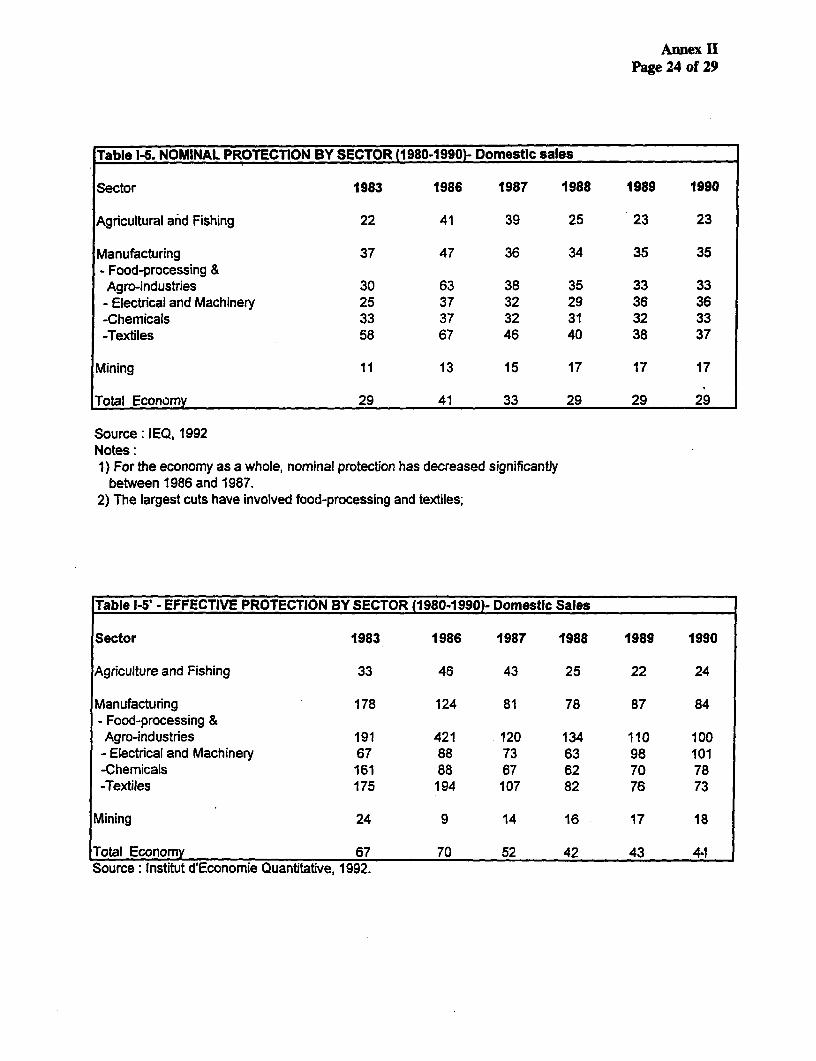
Annex IIPage 24 of 29
Table 1-. NOMINAL PROTECTION BY SECTOR (1980-1990)- Domestic sales
Sector 1983 1986 1987 1988 1989 1990
Agricultural and Fishing 22 41 39 25 23 23
Manufacturing 37 47 36 34 35 35- Food-processing &Agro-industries 30 63 38 35 33 33- Electrical and Machinery 25 37 32 29 36 36-Chemicals 33 37 32 31 32 33-Textiles 58 67 46 40 38 37
Mining 11 13 15 17 17 17
Total Economy 29 41 33 29 29 29
Source: IEQ, 1992Notes:1) For the economy as a whole, nominal protection has decreased significantly
between 1986 and 1987.2) The largest cuts have involved food-processing and textiles;
Table I-5' - EFFECTIVE PROTECTION BY SECTOR (1980-1990)- Domestic Sales
Sector 1983 1986 1987 1988 1989 1990
Agriculture and Fishing 33 46 43 25 22 24
Manufacturing 178 124 81 78 87 84- Food-processing &Agro-industries 191 421 120 134 110 100- Electrical and Machinery 67 88 73 63 98 101-Chemicals 161 88 67 62 70 78-Textiles 175 194 107 82 76 73
Mining 24 9 14 16 17 18
Total Economy 67 70 52 42 43 41Source: Institut d'Economie Quantitative, 1992.

Annex IIPage 25 of 29
Table ( 1-6 ). NOMINAL PROTECTION BY SECTOR 01994)Tariff without DCP Tariff with DCPSlmple Range Simple RangeAverage Average(1) (2) (3) (4)
Agricultural and Fishing 34.1 10-43 40.3 10-73- Agriculture and Livestock Production 34.4 10-43 42.4 10-73- Forestry and Logging 23.4 20-43 25.1 20-73- Fishing 39.8 20-43 41.5 20-73
Mining and Energy 22.9 0-43 23.1 0-73- Coal Mining 20 20-20 20 20-20- Crude Petroleum and Natu. Gaz Produc. 0 0-0 0 0-0- Metal Ore Mining 20 20-20 20 20-20- Other Mining 25.4 17-43 25.7 17-73
Manufacturing (Total) 30.7 0-43 33.1 0-73
Food, Beverages and Tobacco 37.5 15-43 42.1 15-73- Food Products 37.8 15-43 42.7 15-73- Beverages 39.7 20-43 40.8 20-73- Tobacco 38.5 34-43 38.5 34-43
Textiles, Wearing apparel and leather 39.1 17-43 43 17-73- Textiles 38.4 17-43 42'1 17-73- Wearing Apparel 42.4 20-43 72 50-73- Leather products (excluding footwear) 36.8 20-73 44.2 20-73- Footwear 41.8 31-43 62.3 31-73
Chemicals 24.5 0-43 25.8 0-73- Industrial Chemicals 23.2 15-43 23.3 15-73- Other chemicals(inc. Pharmaceuticals) 26.3 0-43 28.6 0-73- Refined Petroleum 9.1 0-43 9.9 0-73- Rubber Products 32.7 17-43 43 17-73- Plastic Products 38.3 20-43 38.6 20-53
Construction materials, ceramics,glass 34.7 10-43 39.1 10-73
Basic metal 25.4 0-43 25.8 0-63
Fabricated metal products, mach. § equip. 26.5 0-43 28 0-73- Fabricated metal products 35.5 0-43 28 0-73- Non electri. machin., incl. computers 19.3 0-43 20.4 0-73- Electrical machinery 31.3 10-43 33.4 10-73- Transport equipment 26.5 0-43 28.8 0-73- Professional and scienti. equipment 26.3 0-43 26.7 0-73
Other manufacturing 37.2 10-43 38.8 10-73
Source: GATT, 1994 and Budget Law (Loi de Finance) ,1995.Columns (1) and (2) are related to 1994 and Columns (3) and (4) are related to 1995.

Annex 11Page 26 of 29
Table 4. Quantitative Restrictions or Import Licensing (1983-1992)(shares of restricted imports in total import values)
1983 1986 1987 1988 1989 1990 1991 1992
All goods 82 92 92.9 63.7 46.5 41.3 37 35.6- Food products - - 99.2 99.5 97.6 86.9 80.7 69.1- Energy - - - - 96.3 96 97 73- Raw ma./semi-processed goods - - 88.5 72.7 28.2 15.8 10.6 13.4- Capital goods - - 96 12 4.7 8.8 9.3 9.6- Consumer goods - - 96.6 64 57.5 63 63.7 65
Source: Institut National de Statistiques, INSICONJ/930202 for the period 1987-1992and IEQ/BJ/89083 for 1983 and 1986.

Annex IIPage 27 of 29
LISTE DES PRODUITS DONT LES PRIX SONT CONTROLESAU STADE DE LA DISTRIBUTION En 1993
Part des Part DansSECTEUR PRODUIT Produits -Non L'ensemble Part des
Libres dans des Produits Produits dansL'absorption non libres le Secteur
TotaleAgric &Pich 5.60% 19.06%
Grand Cultur 0.09% 0.31% 1.61%Fruits 2.06% 7.01% 36.78%Legumes 1.97% 6.70% 35.16%Elevages 1.48% 5.04% 26.45%
IAA 8.29% 28.19%Lait 0.52% 1.78% 6.32%Grains 2.97% 10.09% 35.78%Huiles 0.90% 3.04% 10.79%Conserves 0.60% 2.05% 7.28%Sucre 0.71% 2.40% 8.51%Diverses 0.44% 1.49% 5.29%Boissons 0.63% 2.15% 7.62%Tabacs 1.53% 5.19% 18.42%
IMCCV 1.78% 6.05%Ciment 1.68% 5.70% 94.26%Ceramique 0.10% 0.35% 5.74%
IME 9.06% 30.79%Sid6rurgie 2.16% 7.33% 23.81%Metaux 0.46% 1.55% 5.04%Equip Agric 0.60% 2.04% 6.63%Voiture/Cam 3.72% 12.65% 41.09%Mat Transp 0.00% 0.00% 0.01%Mat El6ctriq 0.46% 1.58% 5.13%Mat Electron 1.26% 4.29% 13.93%Equip M6na 0.39% 1.34% 4.35%
Ind Chimiq 2.85% 9.69%Parachimie 0.83% 2.84% 29.26%Medicament 1.13% 3.83% 39.55%Caoutchouc 0.89% 3.02% 31.18%
Textiles 0.12% 0.40%Tissus 0.12% 0.40%
Diverses 1.71% 5.82%Papiers 0.79% 2.69% 46.28%Diverses 0.92% 3.13% 53.72%
Ensemble 29.41% 100.00%

Annex IIPage 28 of 29
LISTE DES PRODUITS DONT LES PRIX NE SONT PAS LIBREAU STADE DE LA PRODUCTION En 1993Y Compris Bid Tendre et Bld Dur
Part des Part DansSECTEUR PRODUIT Produits Non L'ensemble Part des
Libres dans des Produits Produits dansLa Production non libres le Secteur
TotaleAgriculture 1.13% 7.79%
Grand Cultur 1.13% 7.79% 100%IAA , 8.63% 59.52%
Lait 0.63% 4.37% 7.34%Grains 3.48% 24.01 % 40.34%Huiles 1.83% 12.60% 21.16%Sucre 0.27% 1.83% 3.07%Diverses 0.38% 2.64% 4.44%Boissons 0.27% 1.88% 3.16%Tabacs 1.77% 12.19% 20.48%
IMCCV 3.49% 24.09%Ciment 3.49% 24.09% 100%
IME 0.94% 6.49%Metaux 0.53% 3.66% 56.49%Voiture/Cam 0.41% 2.82% 43.51%
Chimle 0.31% 2.11%Parachimie 0.11% 0.74% 34.91%Medicament 0.20% 1.37% 65.09%
Ensemble 14.50% 100.00%
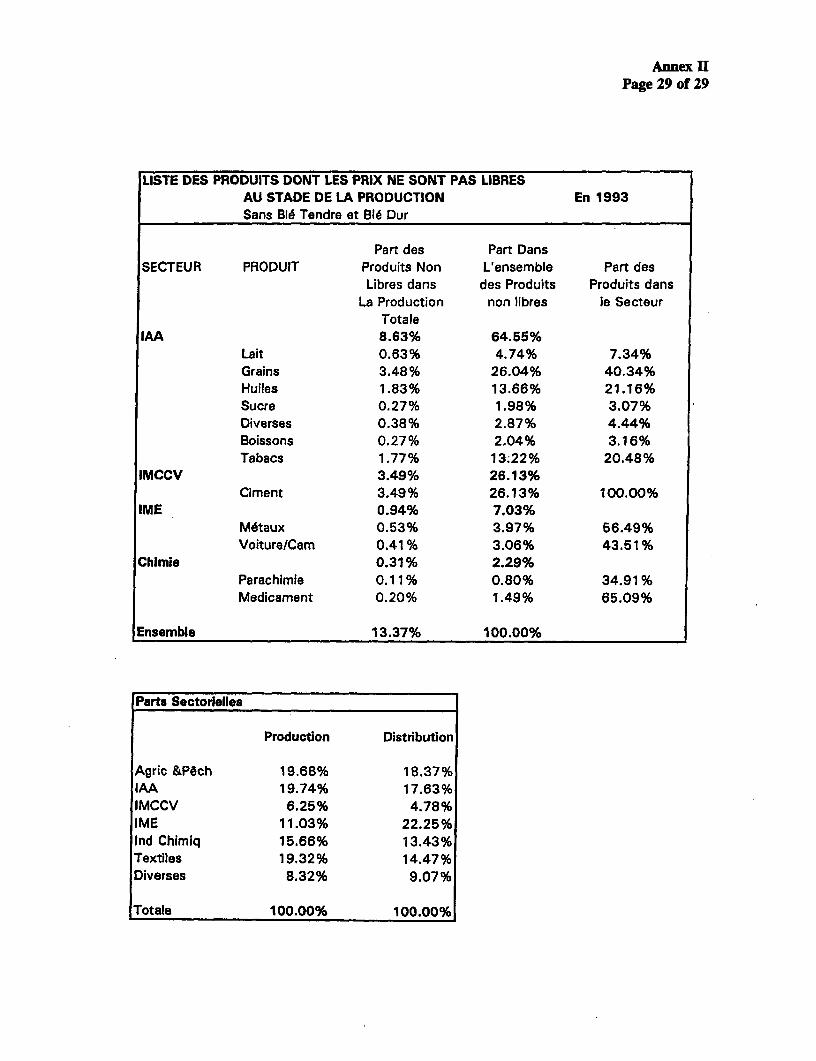
Annex IPage 29 of 29
LISTE DES PRODUITS DONT LES PRIX NE SONT PAS LIBRESAU STADE DE LA PRODUCTION En 1993Sans Bid Tendre et Ble Dur
Part des Part DansSECTEUR PRODUIT Produits Non L'ensemble Part des
Libres dans des Produits Produits dansLa Production non libres le Secteur
TotaleIAA 8.63% 64.56%
Lait 0.63% 4.74% 7.34%Grains 3.48% 26.04% 40.34%Huiles 1.83% 13.66% 21.16%Sucre 0.27% 1.98% 3.07%Diverses 0.38% 2.87% 4.44%Boissons 0.27% 2.04% 3.16%Tabacs 1.77% 13;22% 20.48%
IMCCV 3.49% 26.13%Ciment 3.49% 26.13% 100.00%
IME 0.94% 7.03%M6taux 0.53% 3.97% 56.49%Voiture/Cam 0.41% 3.06% 43.51%
Chimie 0.31% 2.29%Parachimie 0.11% 0.80% 34.91%Medicament 0.20% 1.49% 65.09%
Ensemble 13.37% 100.00%
Parts Sectorlelles
Production Distribution
Agric &P6ch 19.68% 18.37%IAA 19.74% 17.63%IMCCV 6.25% 4.78%IME 11.03% 22.25%Ind Chimiq 15.66% 13.43%Textiles 19.32% 14.47%Diverses 8.32% 9.07%
Totals 100.00% 100.00%

Page 1 of 36ANNEX III
FINANCIAL SECTOR IN TUNISIA
CHAPTER I - THE BANKING SYSTEM
A. OVERVIEW
1.01 The aim of this annex is to analyze the impact of recent reforms on the financial sector, identifythe current problems in the banking system and propose an agenda for further reforms to improve theefficiency of the system. The annex covers a seven and a half year period of reform from 1987 to mid1994.
1.02 The banking system is composed of twelve commercial banks, eight development banks, sixleasing companies, and eight off-shore banks. ' Six of the twelve commercial banks are public banks:Banque Nationale Agricole (BNA), Societe Tunisienne des Banques (STB), Union Internationale desBanques (UIB), Banque du Sud (BS), Banque Franco-Tunisie (BFT), and Banque d'Habitat (BH). Thesebanks account for 68% of total commercial bank loans to the economy. The six remaining commercialbanks are privately held: Banque Internationale Arabe de Tunisie (BIAT), Arab Tunisian Bank (ATB),Banque de Tunisie (BT), Credit Foncier et Commercical de Tunisie (CFCT, recently renamed AmenBank), Union Bancaire pour l'lndustrie et le Conmmerce (UBCI), and Citibank. There is foreignownership of shares in all but one of these private banks, but only three of the commercial banks arejointly or majority-foreign owned: ATB, UBCI, and Citibank. The foreign partners in the private banksinclude the Arab Bank PLC, Banque Nationale de Paris, Gruppo Bancario San Paolo, BanqueTransatlantique, Cr6dit Industriel et Commercial, Soci6te Generale, Cr6dit Suisse, and Citibank, amongothers.
1.03 In addition to the commercial banks, there are also eight development banks that as a groupaccount for a smaller percentage of total assets (19%), but extend the majority of medium and longterm loans. The two largest, Banque de Developpement Economique de Tunisie and the Banque Nationalede Developpement Touristique, are considered public by law; the other six are joint ventures between theTunisian government and governments of other Arab states, and are public in character. There are alsosix small leasing companies, which are the latest entrants to the banking system. Commercial banksfounded five of these leasing companies; relative to the total assets of the financial system, the amountof their assets is insignificant.
1/ The eight off-shore banks include Citibank, l'Union Tunisienne des Banques (UTB), Tunis International Bank (Tm),the Loan and Investment Company (LINK), Beit Ettamouil Saoudi Tounsi (BEST), North African International Bank(NAIB), the Arab Banking Corporation (ABC) and Alubaf International Bank (AIB). The services of the off-shorebanks include: trade finance and other short term lending, foreign exchange operations, and medium and long termlending for investment. To finance their activities, the off-shore banks mobilize convertible dinar deposits and raisefinancing from their parent companies. Commercial banks and off-shore banks differ essentially in their clientele.Clients of off-shore banks are primarily off-shore companies owned by multi-national corporations and Tunisians,although they can extend loans in foreign exchange to resident banks and enterprises.
.. .......

Annex IIIPage 2 of 36
1.04 Chart 1 shows the market shares ofdifferent types of commercial banks2 for Chwt 1: DlstrLbIor of Market Share of T,wiantotal deposits and credits in the system as of Commerclal Banksyear end 1993. The two largest banks, 45.00%
BNA and STB, control respectively, 17% 40.00% _Qnposits
and 19% of deposits; BIAT, a large private 3500% .030.00%
bank, controls 14%, the two medium sized 25 .00% -state banks, UIB and BS, control 8% and 20 00% -
9% of deposits, respectively. BH, the 15.00%housing bank controls, 7% of deposits. 5.00%
Lastly, the medium sized private commercial 0.0 0%banks control together 27% of deposits. It is Large Medium Public Large Medium
Public Sized Housing Private Sizedstriking that this pattern is not similar for Banks Public Bank Bank Private
distribution of credits. On the whole private Banks Banks
banks hold a larger shares of deposits than Source: Annual Reports of Turisian Bankers Assoc iat ions 1 987-1 993.
credits in the system.
B. BANKING REGULATIONS
1.05 The amendment of the banking law in February 1994 breaks down heavily segmented marketsbetween commercial and development banks and thereby promotes competition in the banking systemat large. Commercial banks and development banks are now permitted to engage in a wide range ofoverlapping activities. Commercial banks, according to the law, are permitted to lend for any term andtake equity positions. Likewise, development banks may conduct these same activities, though withlimitations on collecting deposits and lending short term. Before the amendment of the recent bankinglaw, lending long term was exclusively the domain of the development banks and lending short term theexclusive domain of the commercial banks. In addition, investment banks have been introduced as a newcategory of banking institution, and both commercial banks and development banks are allowed toundertake financial advisory services, the core activity of investment banks, thereby increasingcompetition in the banking system still further. Finally, in an effort to separate functions within thecapital market and reduce conflicts of interest, a 1994 law (No. 94-17) on the reform of the stockexchange excludes banks from brokerage activities.
1.06 The Banking sector is overseen by the Central Bank with extensive powers to enforce prudentialnorms. Through amendment banking law, government has widened the powers of the Central Bank andstrengthened its role as watchdog of the financial system. Through the reinforcement of prudentialregulations in 1991, the BCT also has refined and widened the scope of Central Bank supervision. Theresult of these measures as well as others measures to enhance the supervisory capacity of the BCT, isthat the quality of bank supervision in Tunisia is high, in comparison to similar low middle incomecountries.
1.07 In 1991 the Central Bank issued new prudential regulations with the aim of strengthening thefinancial standing of the banks. These regulations establish i) minimum capital standards for the banks,ii) minimum standards for loan classification and loan loss provisioning based on the aging of arrears,
2/ For the purpose of this annex and the following analysis of the performance of the commercial banks, which aregrouped by size, structure of ownership, and function, the two smallest private banks have been omitted, since theirassets are not significant.

Annex IIIPage 3 of 36
iii) limits on risk concentration to group borrowers and limits on credit exposure to administrators andaffiliates of the banks, iv) requirements for the collection of certified financial statements, and v) limitson over draft lines as a function of a given company's gross sales. As a whole, the minimum capitaladequacy and provisioning standards are stricter than the Basle Committee recommendation, known asthe Basle Accord3. Although Tunisian banks are required to only meet a 5% capital to risk weightedassets, strict standards for loan classification and provisioning and for calculating net exposure offset thedifference between that Tunisian minimum standard and the 8% Cooke ratio.
1.08 At present all of the financial institutions in Tunisia have been audited in accordance with newstandards based on exhaustive and rigorous terms of reference, which meets international standards. Onthe basis of these audits, and as necessary, the BCT agreed on action plans with the financial institutionsto eliminate gradually any shortfall in provisioning and reinforce their capital and institutional capacity.The time allotted to the banks by the BCT to respect the prudential regulations (notably with respect tothe constitution of adequate provisions and the minimum capital ratio) was adapted to the capacity ofindividual banks.
1.09 To comply with the new capital and loan loss provisioning standards, all of the banks in thesystem in the last two years have taken measures to raise capital and/or increase provisions. By theend of 1994 all of the development banks met the minimum 5% capital to risk weighted assets ratio. Inaddition, five of six private commercial banks and two public commercial banks met the new minimumcapital standard, almost all of them after having issued new shares on the stock exchange in 1993 and1994. In the next several years the four public commercial banks will also meet the same standards byraising capital and improving the quality of their loan portfolios. In summary, the introduction of strictcapital standards has led to the re-capitalization of all of the commercial banks and the largestdevelopment bank.
1.10 The reinforcement of prudential regulations has been the cornerstone of Central Bank reforms tostrengthen the banking system. To accompany this reform, in mid 1993 the Central Bank set detailedterm of reference for external audits of banks and off site reporting requirements, ensuring its own abilityto rigorously enforce the compliance of all financial institutions subject to the new regulations.
1.11 Since 1989 the Central Bank has required non-interest bearing reserves of 2%4. This is lowrelative to other similar systems. However, there is an implicit tax on deposits which may addsubstantially to intermediation cost. This implicit tax is the requirement of commercial banks to financeselected priority sectors at fixed interest margins. The commercial banks are required to lend to prioritysector an amount equal to 10 % of total deposits. If a commercial bank fails to comply with the mandatoryrequirement for financing priority activities (agriculture, small and medium enterprises and exports), thecommercial bank is required to deposit in a provisional account (depots provisoire) the difference between
3/ The Basle Committee on Banking Regulations and Supervision Practices (otherwise known as the Cooke Committee,named after its chairman Peter Cooke) comprises representatives of the central banks and supervisory authorities ofthe group of ten countries (Belgium, Canada, France, Italy, Japan, Netherlands, Sweden, Switzerland) and Luxemburg.The Basle Accord sets a minimum ratio of capital to weighted risk assets of 8%, of which the core capital must beat least 4 %. The Basle Accord on capital adequacy represents the first attempt to harmonize banking regulations acrossnational frontiers.
4/ Since 1990, the amount of the mandatory reserve has been fixed to 2% of the base, constituted by depositscollected by banks in dinar, with the exception of the following accounts: savings-housing, saving-project andsavings-investment. To this amount, 100% of all increase of this same base (in comparison of its level ofDecember 1989) is added, beyond fixed limits.

Annex IIIPage 4 of 36
the amount required and the actual amount lent for such priority activities. Since no interest is earned onthe funds in the provisional account, the cost to the commercial banks of this requirement could be ashigh as if the Central Bank had a mandatory reserve requirement of 12% instead of 2%. Currently,several private commercial banks are obliged to place funds in provisional accounts at the Central Bank;the exact amount by which they fall short of making the required loans is not available.
C. SOURCES OF FUNDING AND COMPOSITION OF ASSETS
1.12 Summary balance sheets for the commercial banks and the development banks and specializedinstitutions are presented below.
Table 1: Comparison of 1993 Consolidated Balance Sheetsfor Commercial and Development Banks and Specialized Institutions
12 Commercial % 8 Development %Banks Banks and Spec.
(Thousands TD) Inst.(Thousands TD)
Cash and reserves 181,106 2 25,649 1
Deposits in Foreign Banks 277,653 3 54,578 2
Government Securities 535,911 5 28 0
Loans and Advances 7,052,812 66 1,677,943 69
Equity Investments and Other Securities 285,558 3 263,899 11
Other Assets 2,140,348 20 383,978 16
Net Fixed Assets 161,851 2 9,688 0
Total Assets 10,635,239 100 2,415,763 100
Debt to Central Bank 790,219 7 95,001 4
Special Resources 824,454 8 703,386 29
Deposits 5,400,201 51 386,122 16
Deposits of Non-residents and Foreign Banks 613,852 6 28,588 1
Other Liabilities 1,953,123 18 296,714 12
Provisions 502,763 5 178,161 7
Capital and Reserves 550.627 5 727,791 30
Total Liabilities, Equity and Provisions 10,635,239 100 2,415,763 100
Source: Statistiques Financieres No. 106-107

Annex IIIPage 5 of 36
Liabilities of Commercial and Development Banks
1.13 Deposits accountfor the majority of commercial bankfunds. They account for 50 % of the totalresources of the commercial banks and consist of roughly one third sight deposits and two thirds termdeposits and savings accounts. In the last six years the commercial banks have experienced tremendousgrowth in term deposits and savings accounts, which is attributable to the liberalization of term depositrates in 1987 and the introduction of a ceiling of 2% on sight deposits in 1987, as well as growth in theeconomy at large. The table below shows the proportion of term and savings deposits to sight depositswhich shifted from 1.3 to 1 in 1987 to 2.3 to 1 in 1993, as a result of growing sophistication ofdepositors and competition among the commercial banks for deposits.
Table 2: Mobilisation of Deposits (Current Prices)(in Millions of Dinars)
1987 1988 1989 1990 1991 1992 1993Commercial Banks (a)Sight Deposits 1,226 1,557 1,557 1,386 1,401 1,516 1,623Time and Savings Deposits 1,687 1,974 2,637 3,319 3,196 3,490 3,777
Development Banks (b)Sight Deposits 17 14 6 8 5 5 8Time and Savings Deposits 256 329 116 187 275 327 378
Financial System (a+b)Sight Deposits 1,243 1,571 1,563 1,394 1,406 1,522 1,631Time and Savings Deposits 1,943 2,303 2,753 3,506 3,471 3,817 4,155
Source: Statistiques Financieres Nos. 90, 94, 101, and 106-7
1.14 Commercial banks' reliance on purchased funds (funds from Central Bank, the interbankmarket, and correspondent banks) increased over the period, as credit growth slightly out-paced depositmobilization. In 1987, total deposits funded 82% of credits to the economy extended by commercialbanks, but by 1993 only 77%. This gap was funded largely by the Central Bank through the refinancingfacility and the interbank market. One single bank in the financial system largely accounts for thedrawing of funds from the Central Bank credit action and the money market. In 1993, BNA, the largestcommercial bank, which is also the largest lender to the four large state enterprises (OC, ONH,andGroupe Chimique), borrowed funds against paper collateral amounting to approximately TD 800 millionto close its financing gap.
1.15 Development banks' reliance on purchased funds, on the other hand, was met almostexclusively by bi-lateral and multi-lateral agencies in the form of international borrowings and to alesser extent, the Government in the form of special resources. Few development banks aside fromBDET issued bonds in the capital market over the last ten years. BDET's domestic issues outstandingtotaled TD 84 million in 1993, while the total amount of outstanding issues of the three next largestdevelopment banks BNDT, BTKD, STUSID, whose combined assets are double the assets of BDET, wasonly TD 72 million. This is particularly striking given that the combined assets of the three banks is DT1.2 billion. In part, the latter reflects the unwillingness of certain Arab partners in the group ofdevelopment banks to be borrowers in the market place.

Annex IIIPage 6 of 36
Assets of Commercial and Development Banks: Credits to the Economy and Holdings ofGovernment Securities
1.16 Before 1987, the public commercial banks, were used by the government to finance stateenterprises and government sponsored incentive programs to encourage private sector investment. Mostof the development banks invested in institutional and privately owned projects. The public commercialbanks, on the other hand, financed the large state enterprises, for the purpose of investment as well asfor working capital needs. Those credit related activities which were initiated by the government forpolitical reasons and which were not driven by sound financial management of resources explain in largepart the poor financial performance and high level of sub-standard loans in the four public commercialbanks. Weak credit controls and inadequate systems for monitoring exposure also explains their lowperformance and the poor quality of their portfolios.
1.17 The Government has been able to count on the public commercial banks and to a lesser extentthe private commercial banks to finance the deficit of state enterprises even after the elimination of apriori credit controls, which took place in 1987. This can be seen in the case of increasing credits toa select number of state enterprises which are experiencing difficulties. A handful of state enterprisesaccount for a large share of problem loans (depending on the bank, as much as 50% of a given bank'scommitments placed in classes 2-4); these enterprises are Groupe Chimique, Office National (ONH) andOffice des Cereales (OC). In 1993 total credits to these enterprises as a group peaked at DT 1.0 billion(11 % of all credits to the economy).
1.18 Total lending to the state enterprises is difficult to measure precisely. In 1989, Governmentchanged the definition of state enterprises to include only those enterprises in which the state held aninterest directly or indirectly, through a wholly owned subsidiary, of 50% or more. This change in thedefinition resulted in a large decrease by almost a half, of the stated amount of total lending to stateenterprises, as shown in Table I below. The definition used from 1989 onward is the same throughoutthe following years. Hence, at least for those state enterprises in which the government holds an interestof 50% or more, total loans extended by the commercial banks are the same percentage (19% of totalcredits) in 1993 as in 1989, and total loans from the development banks are slightly lower in 1993 thanin 1989 (5% versus 8%).

Annex IIIPage 7 of 36
Table 3: Short, Medium and Long Term Loans to Public Enterprises 1987-1993(In Millions of TD)
1987 1987 1987 1989 1989 1989 1991 1991 1991 1993 1993 1993
ST M& Total ST M & Total ST M & Total ST M & TotalLT LT LT LT
Total Credits of Commercial Banks 2,473 1,094 3,567 3,339 1,408 4,747 4,175 1,863 6,038 5,237 2,366 7,603
those to Public Enterprises 969 449 1,418 692 202 894 840 188 1,028 1,204 216 1,420
asaPercentageofTotalCredits 39% 41% 40% 21% 14% 19% 20% 10% 17% 23% 9% 19%
Total Credits of Development Banks 225 950 1,175 74 645 719 154 912 1,066 282 1,250 1,532
those to Public enterprises 3 70 73 5 50 55 0 57 57 40 38 78
asaPercentageofTotalCredits 1% 7% 6% 7% 8% 8% 0% 6% 5% 14% 3% 5%
Total Credits of the Banking System 2,698 2,044 4,742 3,413 2,053 5,466 4,329 2,775 7,104 5,519 3,616 9,135
those to Public Enterprises 972 519 1,491 697 252 949 840 245 1,085 1,244 254 1,498
as a Percentage of Total Credits 36% 25% 31% 20% 12% 17% 19% 9% 15% 23% 7% 16%
Source: Central Bank of Tunisia
1.19 The burden of commercial banks in extending credits to Groupe Chimique (GCT) ONH andOC is recognized by government. To minimize this burden, the government, in several cases, hasagreed upon a series of measures to restructure the enterprises. The GCT was recapitalized and theGovernment assumed the reimbursement of certain international debts and extended its guarantees tocover domestic debts. For the case of ONH and OC, the Government extended its guarantee to cover theobligations of the two companies and also conducted a study to determine how to improve theirprofitability and ensure their positive annual income. The impact of these measures were extremelyimportant for the consolidation of certain public banks, notably BNA.
1.20 Credits to the economy extended by commnercial banks from 1987 to 1993 increased from TD 3.5billion to TD 7.4 billion, at a growth rate of 12% per annum or a cumulative rate of 100%. The growthin credits in real terms is 55 %.
1.21 Distribution of commercial bank credit by term. Commercial banks are principally the shortterm lenders in Tunisia, that is the vast majority of their credits are loans less than two years or arecredits drawn through over draft facilities. Their role in medium and long term lending, however, hasbeen increased since 1987, and in 1993 loans with maturities greater than two years accounted for almost40% of all loans. With recent changes in the Banking Law and the liberalization of lending rates for mostsectors, commercial banks can be expected to play a larger role in medium and long term lending to theeconomy.
1.22 Growth in Credits provided by development banks and other specialized insttutions.Development banks for the most part extend loans with maturities seven years and greater. Leasingcompanies provide credit for up to five years. Although, in terms of total assets in the banking system,the assets of leasing companies are insignificant, their growth has been tremendous. Year over year, overthe last six years, assets of leasing companies have doubled. As of 1993, leasing operations totaled

Annex IIIPage 8 of 36
TD 100 million. Total credits extended by these leasing companies and development banks from 1987to 1993 increased from TD 1.2 billion to TD 1.7 billion, at a growth rate of 6% per annum or acumulative rate of 42%. The growth in credits in real terms, after adjusting for a cumulative rate ofconsumer price inflation of 45 %, is -3 %.
1.23 Distribution of credit by sector. The sectoral distribution of loans is displayed in Chart 2. Thischart reflects the combined portfolios of development banks and commercial banks, thus total short-,medium- and long-term lending. As for medium- and long-term credits, the majority of these termcredits are to the service sector and in large part are for housing,construction, and tourism. Thisconcentration is high but is consistent with the percentage of private fixed capital investment in theeconomy as a whole to these sub-sectors.
Chart 2: Sectoral Distribution of Bank Loans (as of Dec.1993)
14.00%
12.00% -
10.00% K
8.00% X
6.00%-
4.00%-
2.00%-
0.00% -E a) a m _ ,
U) ~~~0 0CD U
E E (-- CD .U 0E Ln LO~* ~ E I-C) 0 U)~C W o-U)
Source: 1993 Annual Report of Central Bank of Tunisia.1/ Construction Includes constructlon related materials and ceramics.
1.24 Not reflected in the chart is the concentration of tourism loans in a number of the developmentbanks. This is a point of increasing concern due to the high percentage of their loan approvals to thetourism sector in the last two years. Two of the largest development banks (BNDT and BDET) haveportfolios of more than 65% for private sector investments in tourism. Moreover, the portfolio of theBNDT, which is a specialized development bank is almost exclusively (99%) to the tourism sector.
1.25 Historically, development banks have been the lenders to this sector, since tourism projectsgenerally demand long-term funds for hotel construction. With changes in the recent banking law thatpermit more long term lending by commercial banks, sectoral concentration in the sector could be bornemore equally by all financial institutions. As a first step, however, BDET, BNDT and BTKD need to

Annex IIIPage 9 of 36
recognize the excessive risk that they currently hold in their portfolios and design long term strategiesto decrease their exposure to the sector.
1.26 With the establishment of prudential regulations, banks were asked to comply with a maximumexposure limit of 40% of their equity to a single group borrower in 1992 decreasing to 25% in 1994.Most commercial banks do not fully comply with this requirement, however, with recent increases in thebanks' capital bases, the number of groups in excess of this limit has fallen substantially. The banks andgovernment need to explore solutions to cut excessive exposure to single groups and in parallel suchsolutions may develop further the capital markets. The most natural solution would be to permit thegroups, without imposing tax consequences on capital gains, to restructure themselves into holdingcompanies. This would facilitate the ability of the groups to issue bonds in the market and to raisefinancing outside the banking system. An exoneration from taxes on capital gains would be appropriateprovided that: i) there is no impact on fiscal receipts since the capital gains in question is not realized butrather simply the result of a paper transfer of shares, and ii) the Stock Exchange lists securites based onsolid valuations as opposed to valuations based on legal revaluations. To preserve the principle oftransparency of these holding companies, the privilege of this proposed tax exoneration could be grantedto those companies which open their capital to the public on the stock exchange and are willing to makeadequate disclosures with respect to their financial standing.
1.27 Decreasing holdings of Government securities. As a percentage of total assets, commercialbanks held in 1993 only 5% of their assets in Government Securities versus 13% in 1987. The changein the structure of the balance is attributable to the elimination of forced holdings of Governmentsecurities and the reduction of the deficit. Today banks are free to place the Government bonds withclients and invest in them at their discretion.
D. INTERMEDIATION AND EFFICIENCY OF THE BANKING SYSTEM
Interest Rates and Spreads of Commercial and Development Banks: Resources and Credits
1.28 The Central Bank regulates the rate for sight deposits at a maximum of 2%, and the rate onsavings accounts ("comptes d'epargne"), which it sets at 2% below TMM (the money market rate).As for other deposits and savings instruments, since 1990 the Central Bank has had no controls on ratesfor instruments that are greater than 3 months but no longer than five years. Rates on these term depositsvary according to amounts deposited and the length of the term, however, these rates do not varysignificantly between banks. Reportedly there is a gentlemen's agreement in place among the banks withrespect to the ceiling on term deposit rates.
1.29 The cost of purchasedfunds varies little from one bank to another. All the banks have equalaccess at the credit auction of the Central Bank, provided that they can provide the proper paper ascollateral; the rate is generally the same across all banks. In the money market the seven day rate is thesame as the rate of the prise on pension which is exactly 1 % more than the appele d'offre. All banks haveaccess to the prise on pension provided that they also submit the proper acceptable paper.
1.30 Rates on most credits extended by commercial banks are variable and linked to the TMM(money market rate). Since their resources are for the most part at variable rates, the practice of settingrates linked to TMM minimizes interest rate risk.

Annex IIIPage 10 of 36
1.31 Since June 1994, the Central Bank has permitted the commercial banks to set rates freely onmost credits. Through a series of measures over a seven and a half year period, the BCT removedrestrictions on margins as well as absolute rates. As a first step, in January 1987 the governmentabandoned its policy of setting rates on credits, except for those to priority sectors, and placed a cap onthe margin which banks would receive at 3% over the money market rate. In December 1991, thisceiling of 3 % over TMM was replaced with average margin of 3% over TMM for all loans extended bya bank. Finally in 1994 this last restriction was removed.
1.32 Except for rates on credits to a few priority sectors, the interest rate environment is free. Sincethe removal in June of the 3 % average cap, there have been few changes in rates on commercial loans,in part confirming that the ceiling on the average of a given lending rates was not binding. Bankshowever, are experimenting with new loan products to consumers and access to credit appears to bewidening with the emergence of consumer based lending (i.e. lending for purchases of householddurables).
1.33 Commercial bank lending rates to Priority sectors. Since 1989 the BCT has imposed on thecommercial banks mandatory medium-term financing of priority sectors equal to 10% of theircommercial bank deposits, and for these credits the BCT sets the rates. Priority credits, which coverboth, the mandatory medium-term loans and short-term loans, are currently to such sectors as agriculture,export industries, and micro-enterprises and are approximately 10% of commercial bank loans. Since1987, the number of sectors benefiting from priority credits has decreased. As shown in Table 5, theinterest rates set by the BCT have risen steadily since 1987 for credits in the priority sectors and are nowpositive in real terms. For credits to priority sectors, commercial banks are ensured a margin of 1.25 %-2.75% by the BCT. If a given credit merits a higher margin, banks are prohibited from charging sucha margin to cover their risk. For the government to complete the liberalization of the lending rates, thelast step is the removal of this financing requirement and the remaining fixed rates on credits to prioritysectors. The BCT is expected to abolish the 10% financing requirement for priority credits by the endof 1995.

Annex IIIPage 11 of 36
Table 4: Selected Interest Rates, 1987-94(In percent; end of period)
1987 1988 1989 1990 1991 1992 1993 Sept.1994
Money market rate (TMM) 8.65 8.65 11.31 11.81 11.81 11.31 8.81 8.81
Central BankAuction of refinance credit 1/ 8.65 8.65 10.31 10.38 10.38 10.38 7.88 7.88Repurchase facility 2/ 8.65 8.65 11.31 11.88 11.88 11.38 8.88 8.88
Commercial banksMaximum lending/overdraft 11.65 11.65 13.75 14.81 15.81 NA 5/ NA NA
rate3/8.00 8.00 8.00 9.00 10.00 11.00 11.00 11.00
Export related credit 7.00 7.00 7.00 8.00 9.00 10.00 10.00 10.00Crop credit 7.50 7.50 7.50 8.00 9.00 10.00 10.00 10.00Agricultural investment 8.00 8.00 8.00 9.00 10.00 11.00 11.00 11.00PME investments 4/
Source: Central Bank of Tunisia1/ Under the appel d'offres a fixed amount of seven-day liquidity is auctioned against assets held by the banks.2/ The prise en pension is an automatic repurchase window at the initiative of the banks.3/ The maximum lending rate was set at the TMM plus 3.00% in 1987. In November 1988, the Bankers' association agreed
to reduce the ceiling to TMM plus 2.5 %. In 1990-1991 the ceiling was TMM plus 3 points. From the beginning of 1992the average lending rate for each bank was limited to the TMM plus 3 points and all restrictions were lifted in early June1994.
4/ PME, small -and medium-sized enterprises.5/ Not applicable.
1.34 Spreads on commercial bank loans. Observed gross spreads on commercial bank loans,excluding credits to priority sectors, are about 6% which is not excessive. Observed gross spreads forloans to large groups are 3-4%, reflecting keen competition among banks to lend to well establishedclients.
1.35 Interest rates on loans extended by develoDment banks. In contrast to commercial banks, alldevelopment banks, except BDET on medium term loans to industry, charge a given fixed interest ratebased on the term and the sector of the loan. There is little competition between development bankson the basis of price. The Board of Directors at each of the development banks sets the rates on loansas a function of term and sector. There is no adjustment for specific risk of the project or the credit-worthiness of the client. Either the project is sound and worth financing or it is not, in which case thereis no financing available.
Profitability of the Commercial Banks: A Comparison of Return on Equity (ROE) and Return ofAssets (ROA)
1.36 For the purpose of assessing the efficiency of the banking system and its main components, the10 largest commercial banks are grouped into five categories, as a function of their size, ownershipstructure, and function. The five groups are: (i) large public banks (BNA and STB); (ii) large privatebank (BIAT); (iii) medium sized public banks (BS, UIB, and BS); (iv) medium-sized private banks (ATB,BT, CFCT, and UBCI); and (v) public housing bank (BH). The following analysis is based on the incomeand balance sheet of the 10 banks as presented in the Annual Reports of the Bankers' Association for the

Annex IIIPage 12 of 36
years 1987-1993. The figures are based on the average ratios of the years 1988 through 1993. Takingthe average for the period provides a more accurate picture of performance, given the under provisioningby most banks in the system before 1991 and the large provisions which were set aside in 1992 and 1993.Generally, the following figures for ROE and ROA of private commercial banks and the housing bankapproximate the true performance of these banks. The figures presented for the state banks, however,overstate their real profitability given the large shortfalls of provisions which existed at the end of 1993.
1.37 The average return on assets before tax, over the six year period was 0.7 % for all ten commercialbanks. Both the large public banks and the large private bank were very close to the average, andlikewise the ROA for the medium sized public banks was similar. The medium private banks, on theother hand, earned an ROA of 1.3 %, almost double the average of all commercial banks (see Chart 3).Since this was achieved even after setting aside largely sufficient provisions, the medium sized privatebanks can be said to have a "true" ROA which compares favorably with ROA of banks in OECDcountries'.
Chart 3: Average Pre-Tax Retum on Assets of Commercial Bar*s4 As of % of Averge Assets for Years 1988-1993)
1.41.21 .00.B0.60.40.2
0.0
Large Large Medium Housing MediumState Private Sized Bank SizedBanks Bank State Private
Banks Banks
Source: Annual Reports of Tunisian bankers' Association 1987-1993
5/ ROA for commercial banks in OECD countries were found to range from .31 % to 1.01 , on a pre-tax, as an averageof years 1980-1986. 'Measuring Commercial Bank Efficiency; Use and misuse of Bank Operating Ratios' DimnitriVittas, World Bank working papers, WPS806, November 1991.

Annex IIIPage 13 of 36
1.38 The level of profitability of each group is most easily compared taking pre-tax income, since taxrates vary across the five groups of commercial banks.6 Average ROE for the large private bank is 21 %versus 13% for the large public banks. The difference between these figures is mostly attributable to thehigher leverage of the large private bank versus the public banks. Actually a comparison of true ROEwould show the difference to be much larger, given the large shortfall in provisions of the public banksat the end of 1993 and the impact of adjusting the figures to reflect adequate provisions. For the fivemedium sized private banks the ROE is 25% versus 10% for two medium sized public banks, and 19%for the public housing bank. This comparison also does not take into account that the two medium sizedpublic banks had large shortfalls of provisions at the end of 1993.
Profitability of the Development Banks versus Commercial Banks
1.39 A comparison of return on assets among development banks and between development banks andcommercial banks is misleading because of the difference in their sources of funding. All of the bilateraldevelopment banks are well endowed with strong capital bases, thus their interest expenses are unusuallylow and their ROA, consequently, are high. A comparison of ROE, although still crude, is a reasonablebasis on which to compare commercial and development banks. There is a striking difference between
Chart 4 Average Pretax Return on Equlty for Commercial and DevelopmentBanks
20 -
1 0 - .15
10
05 ---.. .....Commercial Banks Development Banks
Source: Annual reports or Tunisia Bankers! Association 1987-1993.11 Excluding BTQI and BCMA.
6/ Taxes paid by medium-sized private commercial banks are significantly higher than those paid by publiccommercial banks and development banks. This difference can be attributed to the extent to which banks takeadvantage of a tax law which permits income that is invested in the form of equity to be exonerated from taxes.The two largest state banks, which have the largest equity portfolios of the twelve commercial banks, appear tohave benefited most from this tax rule. As a percentage of net income, the private banks are paying average taxrates of roughly 28% while state banks are paying roughly 20% on average. This compares favorably with taxrates on net income in OECD countries.

Annex IIIPage 14 of 36
the before tax ROE of the development banks and the commercial banks, as shown in Chart 4.7 TheROE, before tax, of the group of development banks is 4.7%, which is negative in real terms, comparedwith 16% for the commercial banks. In part this can be explained by the fact the development banks asa group generally have provisioned adequately and the commercial banks, specifically the four publicbanks (BNA, BS, UIB and STB) have not. However, this is not a sufficient explanation. The low averageROE also reflects the low profitability of the development banks' loan and equity portfolios and their lackof sufficient fee based income. Average ROE for each of the development banks, before tax, for thesix year period vary from 2% to 13%.
Highlights of Other Key Asset, Cost and Income Ratios
1.40 The Tunisian banks report low interest margins as a percentage of total average assets. Thisis attributable to the high incidence of non-performing loans in the loan portfolios of the state banks,and, until recently, limits on loan spreads and lending policies that did not take into account varyinglevels of credit risk in pricing. This margin should improve with the recent liberalization of interestrates, less government interference in bank operations, and the recent introduction by bank managementof stricter collateral requirements.
1.41 A comparison of the ratios of the five groups reveals key strengths and weaknesses of thedifferent types of commercial banks. The large public banks (more specifically BNA), have a slightlyhigher borrowing cost due to weak resource mobilization (relative to extension of credits), which in partexplains the low interest margin of large public banks. In comparison, the most salient feature of themost profitable banks is that the five medium-sized private commercial banks have a low cost of funds,as a result of strong mobilization of resources, as shown in Chart 1. Among the private banks, there isalso an apparent correlation between the high gross margin and their high operating costs, suggesting thatthey have targeted high margin high cost business and that this segment of the banking business is themost profitable.
Chart 5: Average Operating Costs for Commercial Banks(As a % o Assets for Years 198S-1993) 11
2.5-
2-
1.5-
1-
0.5
0-
Jm Jm a)_ (e m ' m'
Source: Annual Reports of Tunisian Bankers' Association 1987-1993. 1/ Excluding Depreciation.
7/ The average ROE for the group is based on the results of all of the development banks except the smallest developmentbank BCMA (Banque de Cooperation du Magreb Arabe with total assets of 69 million), and BTQI (Banque Tuniso-Qatarie d'lnvestissement) which suffered a large foreign exchange loss in the early nineties.
Annex IIIPage 15 of 36
1.42 Operating costs of the public and private commercial banks are in line with the operating costsof banks in OECD countries, both in terms of costs as a percentage of average assets and costs as apercentage of income. Because of the large difference in wages between public and private banks, staffand operating costs, as a percent of assets, are lowest for the public banks. The staff at the privatebanks, however, are more productive. Private banks have lower cost-income ratios than the statecommercial banks, which demonstrates higher productivity. On average for years 1988-1993, for everydinar generated in gross income by the group of commercial banks, 35 % was paid out for salaries and17% was spent on other operating costs excluding depreciation. This is similar to commercial banksOECD countries, where the figures for operating cost, including depreciation, were found to range from58% to 72% of gross income. A comparison of operating costs for the five groups is shown in Chart5.
1.43 As for the numbers of staff in Tunisian banks, the average is slightly lower than internationalstandards. In general, commercial banks in Britain, Germany, France and other OECD countries havestaff per branch levels of around 25. In Tunisia, on the other hand, the average for the group is 20; thisis roughly similar across the group of banks whether they are state-owned or private. Fewer servicesmay account for this difference between Tunisian banks and OECD countries.
1.44 One measure of the sophistication of bank services is the amount of fee income generated byproviding competitive services. As a percentage of income on average for years 1988-1993, the amountof income generated through fees for three top performing banks is 29%. These three banks offerservices such as banking through automatic teller machines, VISA debit cards and Mastercard services,and homebanking services for corporate customers.
Portfolio Quality of Commercial and Development Banks
1.45 The quality of bank portfolios and off balance sheet items varies considerably from bank tobank. The combined assets and off-balance sheet commitments of the private banks, however, aresignificantly better than the public banks. Furthermore, the trend which is evident in the audits of thelast two years is that the quality of their portfolios is improving, at a faster rate than those of the publicbanks. For each of the three largest private banks as of 1993, on and off-balance sheet risks which fallinto class 2 through 4 (a rough measure for the percentage of non-performing loans8) as a percentage oftotal commitments, were all less than one third the percentage of that for the largest public bank. Thisdifference can be partly explained by the exposure of the largest bank to poor performing publicenterprises, however, also commitments to the private sector are found in classes two through four. Asfor the development banks, their percentages of commitments in classes two through four are high whencompared with those of the commercial banks. This is especially noteworthy because most of thedevelopment banks have lent almost all their funds for private sector projects.
8/ In summary, if a client is 90 days late in a payment for interest or principal, the total exposure to that client isclassified as class 2. Furthermore, if the cash flow of a client company is deteriorating the whole exposure to theclient is placed in class 2. Class 3 is for clients in arrears more than 180 days and class 4 for clients more than 360days. Banks are required to set aside provisions equal to 20%, 50% and 100% of their net exposures which fall in class2, class 3 and class 4, respectively.

Annex IIIPage 16 of 36
Changing Role of the Development Banks
1.46 The oldest development bank, BDET, was created in 1959. Subsequently, the seven otherdevelopment banks were established, with the capital from governments of the Kingdom of Saudi Arabia,Kuwait, United Arab Emirates, Libya, Algeria and Qatar. These institutions served to fill a gap for banklending for investment in private sector enterprises and to promote the financing of new technology inTunisia. At a time when the capital markets in Tunisia were virtually non-existent these banks playeda key role in providing long term financing. With the deepening of the financial system, and an increasein the variety of financial instruments as well as types of financial institutions, the role of the developmentbanks needs to evolve.
1.47 With the aim of improving their lending operations, the largest development banks have agreedwith the Central Bank on measures to enforce supervision standards and to raise the quality of their loanportfolios. However, this alone will not suffice to raise their profitability. With the evolution of thefinancial sector, the development banks find themselves facing greater competition in long term lending.Development banks are at an increasing disadvantage in their ability to attract clients, now that thecommercial banks are, in general, swifter in appraising and approving operations, have often weekly oreven daily contact with their clients, and can offer favorable lending terms. That the development banksoffer a level of technical expertise which is generally superior to the commercial banks has in the pastjustified their role in many projects. In the future, however, only one or two development banks couldcontinue to play a successful catalytic role in raising financing for investments, given the on-goingtransformation of the sector.
1.48 Currently, the development banks are exploring strategies to enlarge their role in the marketthrough diversification. Several banks are reviewing the experience of the former Portuguesedevelopment banks which evolved into investment banks and are considering offering advisory serviceson a fee basis. One of the development banks is also creating an investment fund in which it can placeselective equity investments which it makes in future years. In short, the development banks areconsidering and developing ways in which they may redefine their activities. However, they must alsoseriously consider how they will acquire the capacity to offer these new activities. Some activities mayideally be pursued through the creation of joint ventures in association with other development banks andor commercial banks.
E. CONCLUDING RECOMMENDATIONS
Encouraging Intra and Inter-Industry Competition
1.49 With the amendment of the new banking law in 1994, a key competitive restriction was liftedwhen the limits on commercial bank lending long term were removed. Furthermore, the banking lawalso improved the ability of new banks to enter the system and opened the possibility of investment banksto enter the system. This will permit greater competition in the whole financial system. Other limitationsor costly requirements imposed by the Central Bank with respect to a given commercial banks' abilityto grow need also to be re-examined and removed. Currently, for every four branches that a commercialbank opens in a governorship in which several banks already operate, the bank must open a branch ina rural area where there are no banks. The impact of this requirement is that expansion of a branchnetworks is costly for banks, and an impediment to competition.

Annex IIIPage 17 of 36
1.50 As for the leasing companies, although they have been profitable, their growth is constrainedby tough minimum capital standards. These capital standards are not uniform across all of the leasingcompanies and the highest debt equity ratio permitted is 7 to 1. Raising gradually this maximum debt toequity ratio for all leasing companies to 12 to 1 and setting a timetable to review the performance of thesenew companies would permit prudent growth in leasing operations and contribute to further diversificationand competition in the financial system.
1.51 Government should encourage large commercial groups to restructure andfinance themselvesdirectly on the stock exchange through issues of debentures and/or shares. This would contribute tothe rapid development of the capital market, promote inter-industry competition, and enable banks toreduce their large concentrations of credit exposure to interrelated enterprises and industries. Excessiveexposure to large group borrowers puts into question the soundness of some banks in the system.Government should explore changes in tax law that would permit groups to change their capital structureand create holding companies. Such structures would enable them to take their financing needs public,provided that they meet the disclosure requirement of the stock exchange. To this end, accounting rulesfor consolidating accounts should also be established and enforced.
Increasing the Role of the Private Sector in Banking Activities
1.52 The fundamental problem in the Tunisian banking system is the predominance of the publicsector in commercial banking activities. Its heavy presence in the system has an impact on the efficiencyof the sector, with respect to allocation of credits and to a lesser extent with respect to depositmobilization. This can be seen in the notable difference in key measures of profitability and portfolioquality.
1.53 The government still holds controlling interests in the six commercial banks (BNA, STB, BS,UIB, BTF and BH), and by law these banks are considered public. Through amendment of a law on stateenterprises in August 1994 (Loi 94-102), any bank in which the government holds a shareholding director indirect of greater than 34 % is considered public and subject to the same codes and regulations, withrespect to management and personnel as enterprises which are 50% or more direct or indirectly held bythe Government.
1.54 The impact of this recent law on public enterprises is that unless the government's holding isreduced to less than 34%, divestiture has virtually no impact on the operations and policies of thesebanks. The composition of the Board of Directors and, most important, the capacity of management tocompensate staff commensurate with their performance remain unchanged even after sizeable increasesin private sector ownership of the banks. To improve the operations of the commercial banks, at aminimum the Boards of Directors should fairly represent all shareholders.
1.55 Government should explore actively the sale of its shares in public banks with the purpose oftotally eliminating-government control of these banks. With the removal of credit controls, liberalizationof deposit rates and loan interest rates, and the strengthening of prudential regulations and supervisioncapacity of the Central Bank, government's large shareholdings in commercial banks is incongruous withthe spirit of the reform program. Given the considerably smaller size of the medium sized publiccommercial banks compared with the two large state banks, government's direct or indirect shareholdingsin UIB or BS could be sold readily to the private sector. As a first step in the privatization process, UIB,which is 70% indirectly owned by government, could be considered for sale. Alternatively, if thequality of the portfolio of one public bank is superior to the others, the sale of shares in this bank wouldbe easier, and thus its sale first would contribute to enhance the whole privatization process.

Annex IIIPage 18 of 36
1.56 Government should consider merger of public banks with Tunisian private banks oralternatively aim to place core shareholdings with financial institutions which can offer technical andmost importantly, managerial support. Divestiture through sales of shares to the public has limited onetime benefits. This type of sale is an easy way to raise quick cash. Given the difficulties that privateTunisian banks may have in raising the capital for mergers, as an alternative the Government may finda private financial institution to buy a strategic interest. A core shareholder ideally would be designatedcertain responsibilities and rights such as the appointment of key Board Members and senior managerialpositions. It is worthwhile to note that the most efficient banks in the Tunisian banking system, asmeasured by their ability to mobilize resources, build strong portfolios and generate fee income, whilein keeping costs in line with OECD standards, are those private banks with strategic foreign partners.
1.57 Government should put in place a strategy for the future of the development banks, to raisetheir efficiency. The development banks hold less than 20% of the assets of the banking system, but theircombined capital is more than 50% of the total capital in the banking system. Before this capital baseis significantly eroded, their role in the financial system should be redefined. Government should considerall options which would raise the efficiency of these banks and would enable them to achieve an adequatelevel of profitability to ensure their financial sustainability. The development banks need to define notonly their range of activities, but also the way in which they acquire the capacity to offer them.
m:\linda\cem\an3-leng

CHAPTER IIFINANCING OF THE TREASURY,
AND FINANCIAL MARKETS
A. THE FINANCING OF THE TREASURY
Summary Introduction
2.01 The management of domestic debt and monetary policy are closely linked and are of criticalimportance for the deepening of the financial sector, developing domestic savings and ultimately forimproving the growth rate. Government securities' are the building blocks of the financial markets inmost countries because the domestic public debt constitutes the largest pool of securities for investorsin all countries, and because these securities are the least risky investment available on the market.Medium and long-term Government securities (notes and bonds) are the basis of modem bonds markets,whereas T-bills are short-term instruments which are used by Central Banks to meet the commercialbanks refinancing needs, and they are the basic instruments for an efficient monetary policy. Efficientmanagement of the public domestic debt is the key element in establishing a yield curve and abenchmark2 , which allows investors to efficiently allocate their savings.
2.02 Since 1988, the GOT has been gradually replacing the use of direct management of monetaryinstruments with indirect methods. Public domestic debt management has been made more marketoriented over the past three years through (i) the introduction of new instruments at market prices (T-billsand Negotiable bonds), (ii) the introduction of new auction procedures and, (iii) the progressive phasingout of Emprunts nationaux and Bons d'equipement (these instruments are virtually illiquid because theyare issued at below market rates, and they were mandatorily placed).
2.03 Despite these improvements, there is still a limited secondary market for Treasury securitiesbecause the transfer of ownership is almost impossible as we will see later. The Treasury needs toimprove its cash management by developing modelling capacity and the use of modern, computerizedtechnology. Since 1989, the Central Bank decided to adopt a more indirect management of the monetarypolicy through interest rates but further progress is necessary in order for a yield curve to be establishedand for interest rates to reflect overall liquidity in the economy.
1/ Government securities include Treasury bills, Treasury notes both usually traded on the money market and bondstraded on the bond market (in Tunisia, the Bourse).
2/ The yield on Government securities constitute the base return of the least risky investment in the economy.
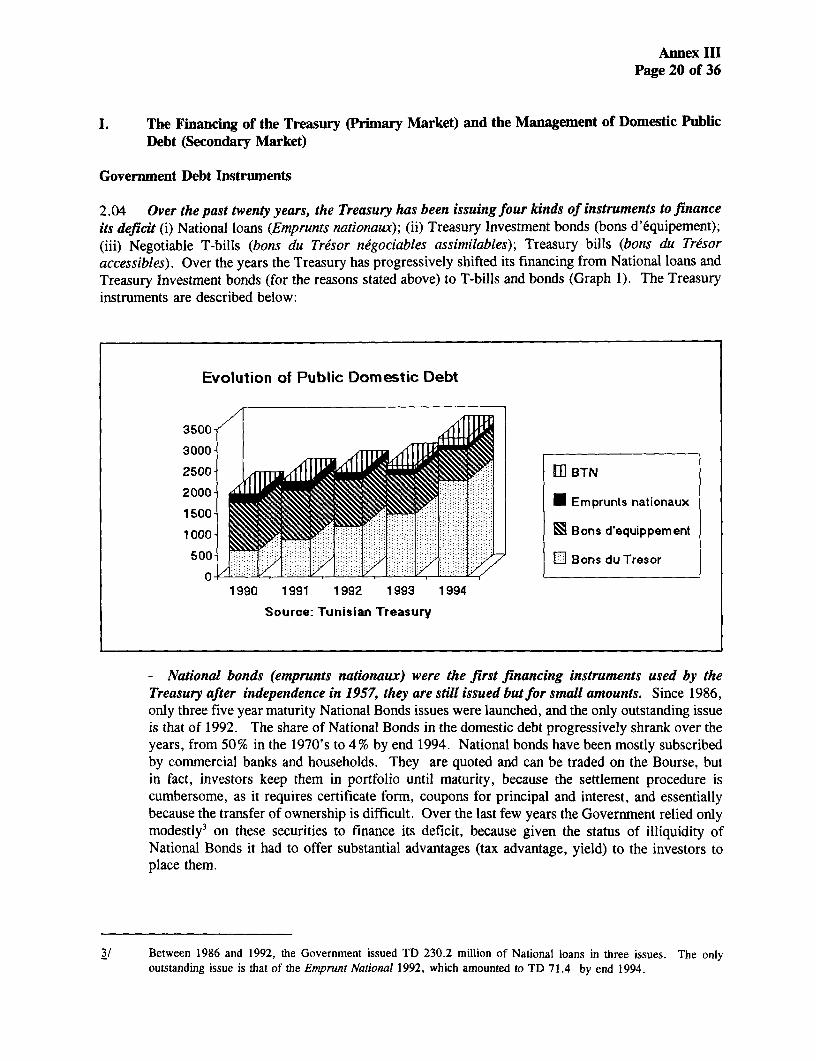
Annex IIIPage 20 of 36
I. The Financing of the Treasury (Primary Market) and the Management of Domestic PublicDebt (Secondary Market)
Goverrnent Debt Instruments
2.04 Over the past twenty years, the Treasury has been issuing four kinds of instruments to financeits deficit (i) National loans (Emprunts nationaux); (ii) Treasury Investment bonds (bons d'equipement);(iii) Negotiable T-bills (bons du Tresor negociables assimilables); Treasury bills (bons du Tresoraccessibles). Over the years the Treasury has progressively shifted its financing from National loans andTreasury Investment bonds (for the reasons stated above) to T-bills and bonds (Graph 1). The Treasuryinstruments are described below:
Evolution of Public Domestic Debt
3500j3000
2500- II BTN
1990 1991 1992 1993 1994
Source: Tunisian Treasury
- National bonds (emprunts nationaux) were the first financing instruments used by theTreasury after independence in 1957, they are still issued but for srnall amounts. Since 1986,only three five year maturity National Bonds issues were launched, and the only outstanding issueis that of 1992. The share of National Bonds in the domestic debt progressively shrank over theyears, from 50% in the 1970's to 4 % by end 1994. National bonds have been mostly subscribedby comnmercial banks and households. They are quoted and can be traded on the Bourse, butin fact, investors keep them in portfolio until maturity, because the settlement procedure iscumbersome, as it requires certificate formn, coupons for principal and interest, and essentiallybecause the transfer of ownership is difficult. Over the last few years the Government relied onlymodestly3 on these securities to finance its deficit, because given the status of illiquidity ofNational Bonds it had to offer substantial advantages (tax advantage, yield) to the investors toplace them.
3/ Between 1986 and 1992, the Government issued TD 230.2 million of National loans in three issues. The onlyoutstanding issue is that of the Emp,runt National 1992, which amounted to TD 71.4 by end 1994.

Annex IIIPage 21 of 36
- Treasury Investment bonds (bons d'iquipement) were the principal means of financing thedeficit between 1969 and 1992. They averaged 70% of the total Treasury securities issuedduring the period. These 10 year maturity bonds were issued monthly at below market rates,originally at 5.5%, then 6.5%, and finally 8.125%. They were almost exclusively mandatorilyplaced in banks, insurance companies and retirement funds. Profitable public companies werealso "required" to subscribe. In principle Treasury Investment bonds were tradable on thebourse, but given their low yield they were--and are still--rarely traded. In fact, given their lowyield these securities can be considered equivalent to a tax on the financial system. As soon asthe needs for automatic financing decreased (drop in the public deficit since 1992), theGovernment stopped issuing these bonds, and began to repay them in 1993, by exchanging themfor Treasury bills issued at market rates (still controlled) through auction mechanisms. In 1994the Government continued prepaying Treasury investment bonds by exchanging them against anew instrument introduced the same year, Bons du Tresor negociables en Bourse (BTN), theseBTN offer theoretically a greater liquidity than regular T-bills, as they are negotiable on theBourse, while there is no real secondary market for T-bills. It is expected that the remainingBons d'Equipement will be completely repaid by end 1996.
- Bons du Trdsor Negociables en Bourse (BTN) have been created in 1993 to replace TreasuryInvestment Bonds, but their features must be improved to increase their acceptability. SinceDecember 1993, banks are authorized to place Treasury bills with a maturity of over one yearas Bons du Tresor negociables. In theory these new securities are negotiable on the Bourse desValeurs Mobilieres as bonds issued by public or private companies, but in fact the negotiabilityof these securities is presentiy difficult because, following the circular issued by the Central Bank,banks have converted money market instruments of over one year maturity (T-bills), into financialinstruments (BTN) whose settlement procedure does not allow the transfer of ownership from one
Tunisia: Domestic Financing of the Treasury
500 ]
400-
300 - - . .. _
200 ~ ~~~~~~~~~~~~~~~~~ ~~~Other Net Bar
100- ~~~~~~~~~~~~~~~~~~~El Bans du Tresar
0 S Bans d'Equip
-100
-2001980 1985 1986 1987 1988 1989 1990 1991 1992 1993
Source: Tunisian treasury

Annex IIIPage 22 of 36
investor to another. Therefore the success of BTN has been limited4 . In order to make this newinstrument successful the Govermnent should issue BTN directly and the central bank shouldfacilitate the transfer of ownership of T-bills. We will describe more in detail the neededimprovements in the recommendations.
- Treasury-Bills (Bons du Tresor) have been introduced in 1989 by the Treasury and haveprogressively replaced other instruments. They have a growing importance in the total publicdomestic debt (Gaph 2). The stock of T-bills increased eight-fold over the last five years, fromabout TD 200 million to TD 1600 million, and they now account for 70% of the total domesticpublic debt. From 1989 to 1993, circulars of the Banque Centrale de Tunisie (BCT) introducedT-bills of different maturities. Since the end of 1993, the Treasury issues weekly the followingmaturities: 13, 26, 52 weeks and 2, 3, 5, 7 years. If we except national loans, T-bills are nowthe only instruments issued by the Treasury. In order to make the debt more homogeneous, andlimit the number of issues of same maturities, the Treasury is implementing the technique of Tap-issues (Bons du Tresor assimilables)5. The introduction of this technique is very importantbecause it will increases the depth of the public debt and will facilitate the future developmentof liquidity in the secondary market by limiting the number of different issues. Interest rates onT-bills have been very stable over the last four years, and they are established independently ofmaturities. This stability is closely connected with the management of the monetary policy. In1991-92 interest rates reached 11.6875%, and they dropped to 9.5% in late 1993, following theevolution of the refinancing rates for banks.
Issuing Procedures, Trading and Debt Management
2.05 The following description will apply only to T-bills as they now constitute the bulk of Treasuryissues. Other instruments are no more (bons d 'equipement), or scarcely used (emprunts nationaux). Theuse of BTN will probably be expanded in the future as soon as they are technically improved (particularlythe issuing procedures and the transfer of ownership system), but T-bills will still constitute the maininstrument of domestic public debt.
4/ In 1994 the total amount of T-bill transformed in BTN amounted to 7.5% of the total domestic public debt.
5/ The technique of tap issues consists in reopening the same line of issues of the same maturity. If for example a 7 yearsT-bill is issued in 1/1995, with redemption in 1/2002, the Treasury will be able to reissue other seven years T-billsduring the year 1995 with the same redemption date and the same features, but it will do so at different prices in orderto adjust the return at the level of the first issue. If the 7 years 1/95 with redemption 1/2002 is issued at 100, theseven years 6/95 with redemption 1/2002 will be issued at 102. This technique reduces the number of issues, if forexample the Government wanted to borrow TD 100 million in 5 years maturity T-bills during a specific year, withtraditional techniques, it would probably have launched five different issues during the year, with five redemptiondates, fragmenting the market with five lines of TD 20 million for example. With the tap-issues technique, it wouldhave reopened the same issue five time, therefore there would be only one TD 100 million line of specific financialcharacteristic. By limiting the number of issues, this technique increases the depth of the market and its potentialliquidity.

Annex IIIPage 23 of 36
Issuing Procedures
2.06 T-bills are issued on the basis of the "Dutch auction" technique' and reserved only forcommercial banks. Auctions are held weekly every tuesday morning. They are handled by the CentralBank and are open only to the 12 commercial banks existing in Tunisia (including one off-shore bank,with an in-shore subsidiary). Insurance companies, households and corporations are excluded fromauctions, as banks are in fact considered "de facto" as primary dealers (in OECD countries the auctionis open to non-bank investors). Banks are advised of the result of the auction two days after the auction,the transaction is settled and the proceeds credited to the treasury 7 days after the auction. The delay forthe conclusion of the operation is a longer than in OECD countries (respectively 1 and 3 days). The T-bills are inscribed in the banks name in an account at the Central Bank. As explained above, it is almostimpossible to transfer a T-bill from one bank to another or to another investor. As T-bills progressivelyreplaced the mandatory placed Treasury Investment Bonds (bons d 'equippement), the Treasury assignedeach bank a bidding quota (the difference with the system of Bons d'equipement is that banks receive themarket rate), in order to always satisfy the Treasury financing needs.
2.07 Besides the competitive auctions, the Treasury allowed the development of non competitiveauctions. Introduced in 1992, this technique consists of permitting banks to place bids on behalf of theircustomers. Banks are allowed to place non competitive bids in amounts up to 30% of their own bid7.As usual in developed countries, non competitive bids are awarded at the average price of competitivebids accepted. In fact most non competitive bids come from large corporate customers and SICAVs8affiliated to commercial banks. Customers submitting non competitive bids get the benefit of the fullinterest paid by the Treasury without paying the bank fee. The non-competitive bid technique isbecoming increasingly used by investors. In 1992, there were no non-competitive bids, 12 weresubmitted in 1993 and 20 in 1994. The only drawback of non-competitive bids is the liquidity risk.Investors buying T-bills directly through non competitive bids are not certain to be able to trade thembefore maturity, as there is no secondary market for T-bills. In the case for T-bills purchased by acustomer from his bank, the customer and bank sign a contrat de liquidite, which ensures that the banksredeem the bills as requested without penalty and therefore provide liquidity for T-bills purchased fromthem.
2.08 In Tunisia, the auction process leads to limited competition, since there is no interest ratehierarchy (the yield curve is almostflat). Bidders pay almost the sarne rate for a 13 week T-bill as theydo for a 5 year T-bill, and it is close to the refinancing rate that banks obtain from the Central Bank(TMM). Competition develops only on maturities asked by the bidders. In fact the position of theTreasury depends on its financing needs and of the market liquidity. When the market is liquid and theTreasury refinancing needs are limited, it proposes the maturities it is willing to accept from biddingbanks. On the other hand when its financial situation is tight, as in 1993, it accepts the maturitiesproposed by the bidders. Given the fact that there is no real secondary market for public securities andno yield curve, there is a tendency for banks to bid essentially on short-term maturities. Hence the
6/ The Dutch auction technique is one by which the auctioneer starts with a high price and lowers it until a buyer isfound. The auctioneer bids to the highest offered price. In fact, in the Tunisian case it is not exactly a Dutch auctionbecause the Treasury chooses the prices at which it accepts investors offers, not necessarily the higher offer.
7/ If a bank bids for itself TD 100 million, it is authorized to place for its clients a maximum of TD 30 million in noncompetitive bids.
8/ SICAVs (Societes dI'nvestissement a Capital Variable) are the French equivalent of Mutual Funds.

Annex IIIPage 24 of 36
average maturity on the domestic debt has been decreasing over the past three years, from about 6 to 4.5years.
Trading and Secondary Market
2.9 In Tunisia there is no real secondary market for T-bills, but commercial banks designed asystem similar to a secondary market, in which banks play the central role. The development of a truesecondary market for T-bills is quite difficult in Tunisia, because commercial banks and the Governmentare facing contradictory objectives:
- On the one hand, in order to secure its financing, the Treasury has asked commercial banks tomaintain a more limited quota of public securities after the redemption of bons d'equipement,forcing banks to keep a large portfolio of T-bills, without the possibility to trade them, becausethere is no secondary market. On the other hand the Treasury wants the banks to be able tofinance more easily the private sector, and tries not to crowd-it out.
- The Central Bank is willing to develop an active secondary market of T-bills. The CentralBank circular published in November 1991, defined several requirements for the establishmentof a secondary market in Treasury bills9. However its action did not fit with the announcedpolicy, as the Central Bank maintains a restrictive settlement system, prohibiting in practice thetransfer of ownership'°
2.10 In order to overcome the limitations imposed by the lack of secondary market and the restrictionto transferability, commercial banks developed afragmented secondary marketfor T-bills. The CentralBank created a system of a bank-by-bank secondary market, through what is known as contrat deliquidite'1 . In fact the bulk of T-bills held by banks and private investors, is traded in 12 separatemarkets (one for each of the 12 banks). In this system, banks sell T-bills to private investors, with abuyback guarantee at a determined price. Private investors buying T-bills from a bank are certain to beable to sell them back to the same bank at any time, at the pre-determined price. The participants in thissystem appreciate its flexibility: the Treasury can auction large quantities of T-bills, because it is almostcertain that the banks will bid, given the potential liquidity offered by the "contrat de liquidity". TheCentral Bank does not need to change the settlement system since T-bills can be exchanged with theowner bank without the problem of non-transferability of ownership involved with interbank exchanges.The system assures the Treasury of getting the funds it needs when it needs them to finance the deficit.
9/ Banks are expected to indicate daily bid and offer prices for T-bills, and to give the Central Bank a daily and monthlyreport on their "secondary trading' which is a report of the number of clients who has a contrat de liquidite with aparticular bank. In fact in this circular commercial banks are clearly considered as market makers for the secondarymarket of T-bills.
10/ In Tunisia, banks can be considered as primary dealers on the primary market for T-bills. But they have no chanceto become active participants on the secondary market, since the securities that they buy are registered in their name.When a T-bill issued by the Treasury and bought by a bank, the Central Bank registers the T-bill in the bank's name.Until maturity, the T-bill will remain in the bank's name, even if the bank wants to sell it to another bank or to oneof its other customers. More importantly, interest payments and the repayment of the Bill are made to the owner bank,if the bill is sold or transferred, there is no guarantee for the second owner to receive interest or repayment. Thissituation prevents the transfer of T-bill, and the creation of a secondary market.
11/ The contrat de liquidite, is an arrangement by which commercial banks sell T-bills to private investors, offer a yieldof T-bills rate minus .50%, and promise the investor to buy back these bonds at the investors' request in the futurewithout penalty.

Annex IIIPage 25 of 36
The major drawbacks in the system are that (i) it does not promote the development of a modernsecondary market that would support conducting monetary policy on a system-wide basis; and (ii) banksare exposed to interest rate risk by offering this "contrat de liquidite".
2.11 There is also an informal system among the banks caUed "accord de place" which complementsthe "accord de liquidite" by limiting competition for funds between the banks on the basis of interestrates. Under this agreement, all banks agree to offer their customers the same rate for the T-billspurchased, normally the TMM -0.5 %. It is worth noting that the offered yield does not take into accountthe maturity of the securities, therefore it is impossible to determine a yield curve'2, which would indicateto investors how to invest efficiently (in maturities or instruments).
2.12 The combination of the contrat de liquidite and the accord de place offers major advantages tothe monetary authorities and commercial banks:
- The Treasury can issue large quantities of T-bills, and is certain that banks will bid, given thepotential liquidity offered by the contrat de liquidite.
- The accord de place offers commercial banks margins for organizing the fragmented secondarymarket for T-bills and protects the weaker banks from having to pay higher rates for their funds.
- The Central Bank can control tightly the monetary policy and the refinancing of the Treasury.First the interest rates on T-bills are closely linked to the Central Bank refinancing rate, secondby maintaining the present settlement system, banks are not free to trade their securities.
2.13 Besides the T-bills owned by banks and managed through the "contrat de liquidite ", there isa large quantity" of T-bills purchased through non competitive bids. Non competitive bids are notincluded in the contrat de liquidite. Banks do not accept to purchase these securities as they assume thatthe higher yield received by non-competitive bidders compensates the lack of liquidity. In fact the presentsystem determines the investor's origin and their behavior. Among competitive bidders there areinsurance companies, and big corporations. These investors are not looking for liquidity but for yield,They usually invest their mathematical reserves or excess cash, and bid essentially on short to medium-term issues. But the bulk of the non competitive bids comes from SICAVs that are usually affiliates ofthe main commercial banks.
2.14 SICAVs are used by commercial banks to bypass the "accord de place" and compete with otherbanks to attract deposits by offering higher yields. Given their possibility to purchase T-bills at the bidrate, SICAVs can offer a better return to investors than the banks themselves. This explains why a lotof investors have transferred deposits from their T-bills accounts in the banks to SICAVs. If a realsecondary market for T-bills were in place, the behavior of investors would be dictated by the yield curvewhich would accurately reflect the overall liquidity in the economy and the preference of investors fordifferent maturities.
12/ The yield curve is the curve rendering where interest rates are, along the maturity spectrum from 13 weeks T-billsto 30 years Treasury bonds (in the US, in Tunisia it could go up-to 7 years.).
13/ The Government does not disclose the number of T-bills purchased through non competitive bids, and the names ofbidders.

Annex HIlPage 26 of 36
Chart 8: Evolution of Refinancing Rates
12
11.5 N
11 -T 'c - Taux des Appels d'Offre
10.5- - - Taux des Prises en
10 pensions
9.5 ~ ~ ~ ~ ~ ~ - TMM
9.
Dec-90 Dec-91 Nov-92 Dec-92 Jan-93 Jun-93
Source: Central Bank of Tunisia.
B. THE MODERNIZATION OF THE STOCK AND BOND MARKETS
2.15 After a long dormant period, the stock and bond markets have been modernized between 1989and 1994, since then, the activity has been burgeoning and they have both witnessed a robust growthin turnover and capitalization. Nevertheless these markets must be deepened in order to transform theminto efficient emerging markets. The Tunis stock exchange whose legal name is bourse des valeursmobilieres de Tunis, was founded in 1969 and began operating in 1970. During almost 20 years, themarket has been dormant with very few transactions. A major reform was set up in 1989 with theenactment of the law 89-49'4. Since then, new products and activities were issued on the market. InNovember 1994, a new law'5 was passed achieving the modernization of the legal and regulatoryenvironment. Following this law, the final modernization of the markets is underway and should becompleted by end 1995. The modernization achieved so far allowed the development of the stock andbond markets which both witnessed a dramatic increase in activity over the past two years. In fact, inthe case of the bond market, it is essentially the primary market which developed. Nevertheless thisincrease in activity brought stock prices to a very high level which should be consolidated as soon aspossible with a better liquidity in the financial sector, and the increase of the number of securities offeredto investors (through new Initial Public Offering and Privatization), as we will see later.
14/ The law on the bourse 89-49 enacted in March 8, 1989 and the regulation related to it define the main features of thebourse, organize the supervisory and regulatory bodies and their responsibilities. They also clarify the rules offunctioning of the institution.
15/ A new law was passed in November 14, 1994, in order to reorganize the stock and bond markets, this law completesthe law 89-49. The main purpose of the new law was to create a new supervisory body, define the professional rulesof intermediaries and introduce new instruments.

Annex IIIPage 27 of 36
I. The Legal Environment and the Market Organization
2.16 The Government launched a comprehensive reform of the stock market between 1989 and 1994.A first law was enacted in March 1989 (law 89-49). This first law allowed the market to develop, butit needed to be strengthened in order to attract more companies'6 . Furthermore, the organization of themarket -where regulatory and management bodies were concentrated in one public institution only'7- wasnot efficient and did not include a modem settlement system'". In order to overcome the limitations ofthe law 89-49 the Govermnent enacted in November 1994 a new law (law 94-117) overhauling the 89-49law. This new law includes the most modern features of OECD stock markets (private bourse, modernsettlement system, etc). The publication of decrees and circulars will be achieved in 1995, and the neworganization should be completely implemented by end 1995.
The Legal Environment
2.17 The new law creates the three main institutions governing the financial markets: the councilof the financial market ("Conseil du Marche Financier"), the "Bourse des Valeurs Mobilires deTunis", and the "Societe de Depots, de Compensation et de Reglement". The council of the financialMarket is a supervisory institution. The Bourse is a managing institution. The Societe de dip6t is a backoffice institution (in charge of settlement of operations and transfer of ownership).
2.18 The "Conseil du Marche Financier" is in charge of protecting the savings invested in securities,organizing the stock market, and supervising the good functioning of the markets. The council has alegal and financial autonomy, it is chaired by a president with nine members'9. The main attributions ofthe council are:
- The organization and working procedures of the bourse
- The enactment professional rules and obligation of all professionals working on the market.
- The enforcement of the law on the financial market.
2.19 The "Bourse des Valeurs Mobilieres de Tunis" is a private company whose shareholders areall the stockbrokers in Tunis. This institution is working under the supervision of the conseil, it is incharge of:
- Implementing the technical and administrative structures for an efficient functioning of themarket
16/ As of December 1993, the number of companies in the stock market amounted to only 20, and since the enactmentof the law, only one company was introduced in the market.
17/ The Bourse des Valeurs Mobilieres de Tunis under the law 89-49 was a public institution in charge of supervising themarket, and managing it.
18/ In fact under the previous law the companies issuing securities were in charge to handle to transfer of ownership ofsecurities, and to settle all operations involving the securities. As a consequence of this system, the delivery systemwas lengthy, which reduced the liquidity of securities, and increased the transaction cost.
19/ The conseil includes three judges, one official from the Ministry of Finance, one official from the Central Bank, onerepresentative of the brokers, and three members chosen for their professional expertise.

Annex IIIPage 28 of 36
- Authorizing the issuance of new securities on the market
- Registering the operations on the market and the quotes
- Suspending the quotation on the market in case of technical or financial risk
- Publishing the information concerning quotations and operations on the market
- Preparing the floor regulation, and supervising possible unlawful practices
2.20 The "Societe de DepBt, de Compensation et de Reglement", will be in charge of the settlementand the transfer of ownership of securities. This new institution is not presently operational and willbe developed during 1995. The model chosen will probably be the French SICOVAM. This settlementsystem is an essential part of the modernization process of the bourse. It will help attract investors bystreamlining the settlement process which is now lengthy and unreliable, and it should help develop thesecondary market for bonds (particularly negotiable Treasury bills and bonds). It will permit, inparticular, the progressive phasing out of the accord de liquidites, and the partial replacement of T-billsby BTNB.
The Market Structure
2.21 Transactions in the Tunis stock market are conducted on three separate markets's: thepermanent market opened to the largest companies, the occasional market reserved for smallercompanies, and the bond market. The permanent market is split into two sub-markets: The first marketopened to the most prominent companies and banks, and the second market opened to smaller companies.The occasional market is opened to very small companies and has a limited activity. The bond marketwas originally mostly used by the public sector, but it is increasingly used by the private sector.
The Permanent Market
2.22 The First Market is opened to equities of companies with the best financial standing and only13 companies are listed. Public companies willing to be listed on the first market must have a paid-upcapital of a minimum of TD I million, have at least 300 shareholders and distribute at least 20% of thecapital to the shareholders. They must be at least three years old and having distributed dividends in atleast one of the last three fiscal years. As of August 1995, only 18 companies were listed on this market,among these companies, 11 were banks, there was a financial company, and only one industrialcorporation. This market constitutes the bulk of the permanent market, out of 63.7 million shares in thepermanent market, 60.3 million are listed on the first Market.
2.23 The Second Market is opened to smaller companies than in the first mnarket and only sevencompanies are listed in the second market. In order to be listed on the second market, a company musthave a paid-up capital of a minimum of TD 500,000, it must be at least one year old, have a minimumof 100 shareholders and a distribution of 10% of its capital and have distributed a dividend in at least oneof the last two fiscal years. As of December 1994, seven companies were listed of which five were
20/ Another market exists in Tunisia, the Registrar Market. By law , all the companies (even the privately owned), mustconduct the sale their shares on the registrar market, even if they are only in hands of the entrepreneur, his associatesor his family. The registrar market is theoretically part of the stock market but is in fact a place where the transferof property titles is registered. The 5,000 incorporated companies (Societes anonymes) in the country must registerany change in equity on the registrar market.

Annex IIIPage 29 of 36
industrial corporations and two were financial institution. The share of the second market is very limitedas the number of shares traded on it amounts to only 3.4 million.
Tunisia: Turnover of the Tunis Bourse
1 990 1 991 1 992 1 993 1 994
Source: Tunis Bourse
Tunisia: Evolution of Funds managed by SlCAFs and SICAVs
7800
1600/
1400 ICF
1200z
100Z
40-
1990 1 991 1992 1993 1994Sourse: Bourse of Tunis

Annex IIIPage 30 of 36
The Bond Market
2.24 On the Bond Market are listed Treasury bonds and bills, as well as bonds issued by public andprivate companies. Before 1988 bond issues were forbidden for private borrowers. Until 1990, bondswere issued essentially by the Treasury and public (or semi-public) companies. Among public companies,most issuers were development banks for which bond issues were the essential means of refinancing.Until 1990, the bond market was almost only reserved to the public sector, there were almost no privateissues. Since 1990, issues of private companies have dramatically increased (we will analyze later theevolution of the market and the reasons for this evolution), but trading on public securities remain thebulk (more than 80%) of bonds trading.
The Occasional Market
2.25 The occasional market is opened to small companies who want to become public but are notauthorized to be registered on the permanent market and whose shares are regularly traded on this marketwhich can be compared to the NASDAQ market in the U.S.. This market is also opened for blocktrading of shares of stock by companies registered on the occasional market, but also on the permanentmarket. Block trading of bonds are also achieved on this market. The value traded on the occasionalmarket is quite high. In 1994, it amounted to TD 89.6 millions versus TD 179 million on the permanentmarket. But block trading amounted to TD 75.7 million whereas regular transaction of securitiesregistered on the occasional market amounted to only TD 12.3 million.
Instruments and Tax Treatment
Instruments Developed
2.26 Since the enactment of the financial market law and regulation in 1989-90, several circularscreating new instruments have been enacted. Instruments introduced over the last four years are similarto the ones used on the stock markets of developed countries, namely: Unit trusts, preferred share, Bshares, Convertible bonds, participating preferred shares, investment certificates and voting rights. Twoessential instruments for the development of the market were created: the Societes d'Investissement 2Capital Variable (SICAVs), comparable to mutual funds, and Societes d'Investissement 2 Capital Fixe(SICAFs) comparable to closed-end funds:
- SICAVs, which are the Tunisian equivalent of US mutual funds were created by the law No88-92 of August 2, 1988. As of December 1994, 16 SICAVs have been authorized, amongwhich 12 were operating. Three were investing in bonds only, while 9 were investing into amix of bonLe and stocks. The funds managed by SICAVs reached TD 301 million by end ofSeptember 1994 (graph 4). The increase in managed assets has been particularly spectacular overthe past two years, since the funds managed by SICAVs amounted to TD 7 million by October1993. We will analyze later more in detail the behavior of SICAVs over the past 18 months.
- SICAFs, which are the equivalent of closed-end funds in the US market, were created anddefined by the law No 85-108 and the law No 88-92. As of December 1994, 62 SICAFs wereauthorized, among which 52 were operating. Assets managed by SICAFs amounted to TD 280million by end September 1994. SICAFs have had a great success over the past 6 years. Thesuccess of the SICAFs is probably partly due to tax incentives offered to investors. Originally,the law specified that 100% of funds invested by a company in a SICAF were deductible fromthe taxable income of this company. The creation of SICAFs became a wonderful opportunityfor private industrial groups to restructure financially and to benefit from the tax deductibility.

Annex IIIPage 31 of 36
In fact SICAFs became a way for a holding group to invest almost tax free in the stocks of thecompanies belonging to the holding. Originally SICAFs were created to lure investors on thestock market and to encourage companies to become public. The laws never specified that stockspurchased by SICAFs needed to be publicly traded on the stock market, therefore owners offamily groups created SICAFs, invested their profits tax-free and purchased privately-ownedstocks of their own companies. In fact SICAFs encouraged corporate owners to maintain theircompanies private, at a high cost for the budget. In 1993 the tax incentive was reduced, as taxexemption on funds invested in SICAFs were reduced to 50%, but the interest for SICAFsremained strong.
Tax Regime on Financial Instruments
2.27 While they were modernizing the stock market, authorities also harmonized the tax regime offinancial instruments, however stocks still enjoy very generous"1 special incentives in order to lureinvestors and to bring companies on the stock market and the bond market.
- Investment in stocks enjoy major tax incentives. Investment in new share issues are deductiblefrom the taxable income or profit of investors, with a ceiling of 35% of the taxable income.Dividends are not taxable whether the investor is a private person or a company. Capital gainsare also not taxable for private investors.
- Bonds receive a less favorable tax treatment, but the taxation is harmonized with the taxtreatment of savings accounts in banks. Up to 1500 TD interests are not taxable', above TD1500, private investors pay 25 % on interest received (including 15 % withholding tax). For bondsbought through a Compte d'Epargne en Emprunts Obligataires (savings account in bonds), thetaxation amounts to only 15 % withholding. The tax incentive can only be obtained if savings areblocked for a minimum of five years. If savings are withdrawn before five years, asupplementary 10% withholding tax is collected (to reach a total withholding tax of 25%).
The Brokerage Activity
2.28 The brokerage activity has been reformed twice, in 1989 and 1994. In 1989, banks were directbrokers (in fact the brokerage activity was handled in special departments of the commercial banks). Thelaw 94-117 now forbids the banks to intervene directly on the stock market. Since 1994, banksparticipate in brokerage activity only through (theoretically) independent subsidiaries. These new rulesimprove substantially the transparency on the stock market and help increase competition. There are now26 brokerage firms. Among them, 15 are bank subsidiaries, 2 are financial institutions partly owned bybanks, and 4 are independent companies.
21/ In OECD countries, no investor can obtain such tax incentives.
22/ In fact the minimum not taxable of TD 1500 covers also interests received from banks savings accounts.
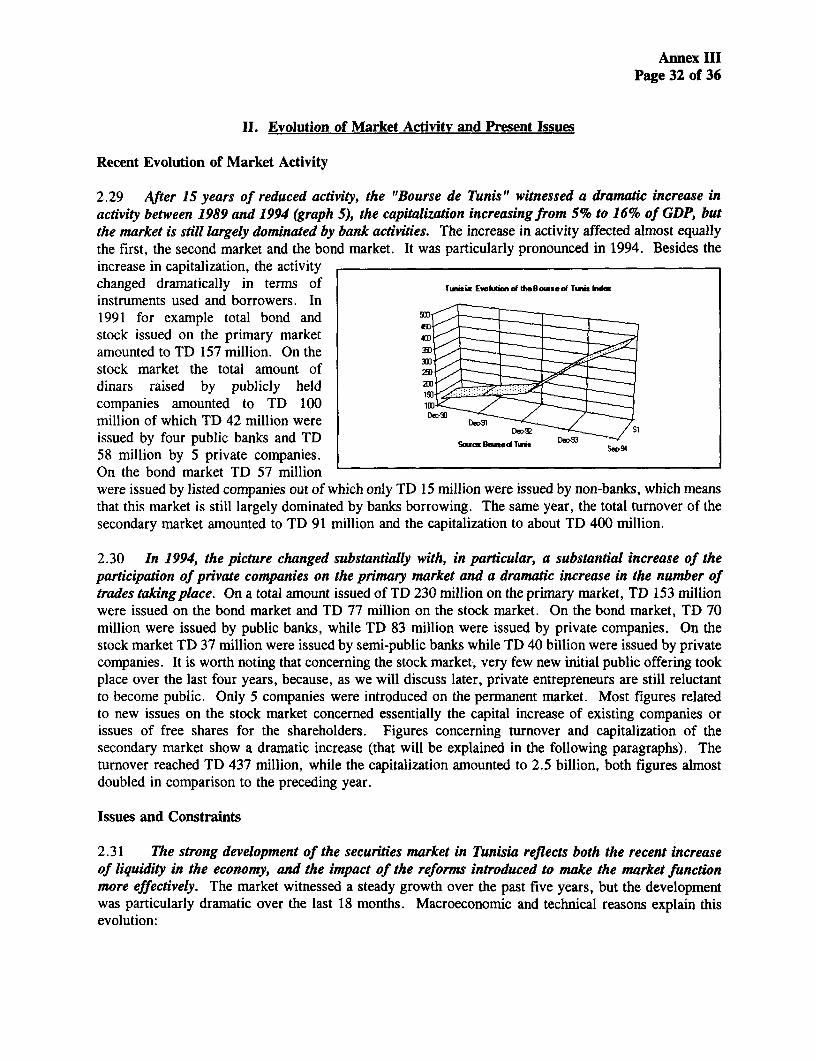
Annex IIIPage 32 of 36
11. Evolution of Market Activity and Present Issues
Recent Evolution of Market Activity
2.29 After 15 years of reduced activity, the "Bourse de Tunis" witnessed a dramatic increase inactivity between 1989 and 1994 (graph 5), the capitalization increasing from 5% to 16% of GDP, butthe market is still largely dominated by bank activities. The increase in activity affected almost equallythe first, the second market and the bond market. It was particularly pronounced in 1994. Besides theincrease in capitalization, the activitychanged dramatically in terms of Tui EvoktionfthegoulsedoTLWs
instruments used and borrowers. In1991 for example total bond andstock issued on the primary marketamounted to TD 157 million. On thestock market the total amount of 25
dinars raised by publicly heldcompanies amounted to TD 100million of which TD 42 million were S,
issued by four public banks and TD SwBdT D&-93
58 million by 5 private companies. __ __On the bond market TD 57 millionwere issued by listed companies out of which only TD 15 million were issued by non-banks, which meansthat this market is still largely dominated by banks borrowing. The same year, the total turnover of thesecondary market amounted to TD 91 million and the capitalization to about TD 400 million.
2.30 In 1994, the picture changed substantially with, in particular, a substantial increase of theparticipation of private companies on the primary market and a dramatic increase in the number oftrades takingplace. On a total amount issued of TD 230 million on the primary market, TD 153 millionwere issued on the bond market and TD 77 million on the stock market. On the bond market, TD 70million were issued by public banks, while TD 83 million were issued by private companies. On thestock market TD 37 million were issued by semi-public banks while TD 40 billion were issued by privatecompanies. It is worth noting that concerning the stock market, very few new initial public offering tookplace over the last four years, because, as we will discuss later, private entrepreneurs are still reluctantto become public. Only 5 companies were introduced on the permanent market. Most figures relatedto new issues on the stock market concerned essentially the capital increase of existing companies orissues of free shares for the shareholders. Figures conceming turnover and capitalization of thesecondary market show a dramatic increase (that will be explained in the following paragraphs). Theturnover reached TD 437 million, while the capitalization amounted to 2.5 billion, both figures almostdoubled in comparison to the preceding year.
Issues and Constraints
2.31 The strong development of the securiiies market in Tunisia reflects both the recent increaseof liquidity in the economy, and the impact of the reforms introduced to make the market functionmore effectively. The market witnessed a steady growth over the past five years, but the developmentwas particularly dramatic over the last 18 months. Macroeconomic and technical reasons explain thisevolution:
Annex IIIPage 33 of 36
- Since mid-1993, as a consequence of the reduction of credit demand following a slow-down ininvestnent by the private sector, monetary authorities reduced the base refinancing rate, whichin turn reduced the yield on savings in banks'. Two additional developments encouragedincreased stock and bond activity:
- Introduced by law in mid-1988, the first SICAVs were created in 1992. They provided anefficient vehicle to attract investors to the stock and bond markets. Moreover, as commercialbanks could not compete for deposits through interest rates (accord de place), they competed toattract deposits by creating the SICAVs which could offer higher returns by investing heavily instocks and bonds.
- Over the last four years there was not enough stocks to satisfy the demand for securities. Forthe few initial public offerings achieved over the last four years, the demand exceeded the supplyof stock offerings by 200 to 500%. The main reason for this behavior is the very high yieldoffered by stocks4'.
2.32 While the stock market witnessed a strong growth over the last four years (the index increasedby 350%), the bond market grew at a more moderate pace.
The Bond Market
2.33 Until 1991, most of the bonds issued were public or semi-public. Bonds issued by privateborrowers were negligible. In 1991, out of TD 176 million borrowed on the market, only TD 15 millionwere borrowed by the private sector. This situation was due to several reasons:
- The Treasury controls directly or indirectly more than 50% of medium and long-term funds inTunisia, as these funds come essentially from the Social Security, Insurance Companies and postalsavings, and since the use of funds is mandatorily earmarked.
- Until 1978, the private sector was not allowed to issue bonds. In 1979, the Treasury allowedprivate companies to issue bonds, but only bonds registered in the owners' name were authorizedfreely, whereas for bearers bonds an authorization of the Treasury was necessary'.
- The Treasury was also controlling the yield of private bonds. Until 1993, the Treasury rarelygranted authorization for bonds whose yield was above T-bill yields. Since these bonds wouldbe perceived as more risky than Government bonds, it was difficult for private borrowers tolaunch successful issues.
23/ The drop in interest rates had consequences on the traditional savings in banks for both small and big investors. Aswe explained in previous chapters, interest rates on savings were rigidly tied to the money market rate (TMM),therefore any reduction on banks refinancing rates was passed-on to small investors with term deposits.
2 By OECD standards, the yield on the Tunisian stock market can be considered very high, particularly if we considerthat dividends and capital gains are tax free. In 1991, which was not a good year according to professionals, theaverage return on stocks could be estimated to 31% (Including capital gains, dividends and distributions of free shares).The return was estimated to 40% in 1990.
25/ In fact by authorizing a private bond issue, the Treasury provides its guaranty on this bond.

Annex IIIPage 34 of 36
- Since most bonds were issued by semi-public entities (Often public banks) (graph 6), theGovernment asked public companies, public banks and institutional investors to buy the bonds.Since there was no secondary market for bonds, the companies buying these bonds had to keepthem in their books until maturity. By doing so, in fact, the Government transformed the bondmarket into a private placement market.
2.34 Over the last two years the primary market for bonds witnessed a strong development, thisevolution reflects the modernization of the financial system through new laws and regulations, and thedevelopment of new financial instruments.
- Since 1993, the Treasury released most of its controls over bond issues. Private companies cannow issue bonds as they wish and no longer need prior authorization from the Treasury. Theonly requisite is the obligation of a bank guarantee to issue bonds. It must be stressed that thislast requisite should be eliminated since it seems to introduce distortions in the behavior of somecommercial banks, which took advantage of the present regulation to give their guarantee tocompanies with mediocre financial records, presently borrowing from them. Therefore, the onbalance sheet risk was transferred to an off-balance sheet risk.
- One important reason for the development of the bond market has also been the dramaticexpansion of SICAVs which invest now heavily in private bond issues. SICAVS are requiredto invest 70 % of their assets in public and private bonds (and stocks). The authorities also helpedto develop the market by offering a better tax treatment for investing in SICAVs (in fact the taxsystem considerably increased the demand for SICAVS), than for investing directly in bonds.
The Stock Market
2.35 On the stock market the development has been more dramatic than in the bond market, but thesurge reflected more a secondary market activity than a primary market one, since only five companiesmade a public offering over four years. The growth of the market activity has been very strong overthe last two years, whether in turnover or in capitalization. Between July 31, 1994 and July 31, 1995the market index increased 67%, increasing from 373 to 623. On the primary market, only three newcompanies did initial public offerings over the last four years. The increase in the number of shares onthe primary market was mainly due to the distribution of free shares and the capital increase of listedcompanies. The present situation reflects the reluctance of companies to issue stocks and the strongcompetition among investors for the few stocks available.
On the supply side:
- It is worth noting that, few new stocks were issued despite generous tax incentives -A companyissuing stocks on the primary market pays a reduced corporate tax of 17.5% instead of a regular35% tax. The development of new instruments offering a protection against take-over-bids (Bshares and convertible bonds) was not sufficiently attractive for private companies to open theircapital to the public. The main reason is the reluctance of entrepreneurs to release financialinformation on their companies
- The development of SICAFs also hampered the development of IPOs, since most private groupscreated privately owned SICAFs enjoying the same tax incentives as investors in publicly tradedstocks.

Annex IIIPage 35 of 36
On the demand side:
- SICAVs were responsible for a growing share of the increase in activity on the stock marketsince the funds managed by these institutions more than quadrupled over the past three years
2.36 The valuation of the Tunisian stock market can be considered high even by emerging marketstandards. The market Price/earnings (P/E) ratio was estimated at about 25 in 1994, and several stockswere valued as high as 40 compared to ratios in other emerging markets which range between 15-20.The high market valuation is attracting a growing number of small investors.
- Small investors have been attracted to the stock market by the by the very high returns, dueprincipally to price changes. The return on commercial bank stocks as a result of stock pricechanges and distribution of dividends has been very high over the last few years, averagingaround 25% a year.
- The market lacks instruments which would introduce flexibility on the market. In particularit is not possible to take short positions or to buy options. These two instrurrents would help toregulate the market and smooth the volatility.
C. Recommendations
Management of the Monetary Policy
2.37 While they are improving the Treasury financing, the authorities must also modernize themanagement practice of the monetary policy, which will help strengthen the reform of the Treasuryfinancing and facilitate its implementation. It must be stressed that in the case of Tunisia, themodernization of the monetary policy is more an issue of practices since the main instruments alreadyexist.
Financing of The Treasury
2.38 These recommendations are in line with the recommendations made by several experts whoaudited the Tunisian Treasury'. They are to:
- Modernize the system of clearance and settlement at the Central Bank for T-bills to facilitatetrading among banks and other participants on the secondary market
- Improve the forecasting of patterns of Treasury cash needs and manage debt issue as a program,with the publication of a calendar as -which widely used in OECD countries- calendrier desemissions.
- Encourage competition in the primary market, with the establishment of real auctions. TheTreasury should consider authorizing few primary dealers that will organize the market, guaranteeunderwriting of issues, and possibly become market makers on the secondary market (as it is thecase in most European countries).
26/ Recommendations by Ulrich Ernst, Hassine Trad, Edward Dey, in June 1994 ("strengthening Tunisia's debtmanagement system") and Lars Kalderen in June 1993.

Annex IIIPage 36 of 36
- The Treasury should offer longer term debt instruments as bond issues, and progressivelyreplace all long-term instruments by BTNB tradable essentially on bourse, (the procedure of tapissues should also be generalized for BTNB) by doing this, the Treasury could lay the foundationof a sound bond market, based on a stable long-term public debt as in most OECD countries.
- While it is improving the management of its debt, the Treasury should encourage thedevelopment of the secondary market of short-term public securities by authorizing all economicagents to participate to this market, and by progressively phasing-out the accord de liquidite andthe accord de place.
Bond and Stock Markets
2.39 The main reforns have been already launched. Since 1989, the Government launched animpressive set of reforms which culminated in December 1994 by the enactment of a new law giving tothe Tunisian market the features of the most modern OECD markets. In 1995, the Government willimplement the law and create the new structures (privatization of the bourse, implementation of thesettlement system).
2.40 In addition to these forthcoming changes, the following improvements are recommended:
- It is essential that the privatization process be launched as soon as possible, it will help increasethe number of companies listed, and deepen the market.
- In order to develop and deepen stock and bond market and raise the savings rate, it is necessaryto reform and modernize the institutional investors sector (Insurance Companies, Social Security,Savings Institutions).
- To facilitate the introduction of new companies on the stock market, the tax incentives offeredto create and invest in SICAFs should be suppressed, unless investments are made in publiclytraded companies.
- On the bond market most of the reforms deemed necessary two years ago have beenimplemented, in particular the tax regime of bonds has been streamlined. Two improvementsmust be added, first, the necessity to obtain a bank guarantee to issue private bonds must besuppressed in order to let the market price adequately evaluate companies borrowing on themarket, second, and in parallel, a private rating agency must be created.
- On the stock market, several techniques should be authorized in order to help smooth themarket fluctuations and increase the liquidity. In particular, investors should be authorized tosell stocks short, buy and sell options should also be authorized as soon as possible.
m:\AiHda\cem\an3-rb


,.� � '*%�
�
� �
'> � � �,
* � � �
�* v�
�