Embed Size (px)
Citation preview
Osteoarthritis and Cartilage 20 (2012) 29e35
Reproducibility of sodium MRI measures of articular cartilage of the knee inosteoarthritis
R.D. Newbould y*, S.R. Miller z, J.A.W. Tielbeek x, L.D. Toms k, A.W. Rao y, G.E. Gold{, R.K. Strachan#,P.C. Taylor yy, P.M. Matthews yzz, A.P. Brown yyGSK Clinical Imaging Centre, Hammersmith Hospital, Imperial College London, London, UKzGSK Discovery Analytics EU, Cambridge, UKx Leids Universitair Medisch Centrum, Leiden, NetherlandskDepartment of Radiology, John Radcliffe Hospital, University of Oxford, Oxford, UK{Department of Radiology, Stanford University, Stanford, CA, USA#Department of Orthopaedic Surgery, Charing Cross Hospital, Imperial College London, London, UKyyKennedy Institute for Rheumatology, Charing Cross Hospital, Imperial College London, London, UKzzCentre for Clinical Neurosciences, Department of Medicine, Imperial College London, London, UK
a r t i c l e i n f o
Article history:Received 5 July 2011Accepted 11 October 2011
Keywords:SodiumMagnetic resonance imagingOsteoarthritisKnee cartilageRepeatability
* Address correspondence and reprint requests to:Imaging Centre, Du Cane Road, London W12 0NN, UK44-02080086491.
E-mail address: [email protected] (R.D
1063-4584/$ e see front matter � 2011 Osteoarthritidoi:10.1016/j.joca.2011.10.007
s u m m a r y
Objective: To determine the stability and reproducibility of the sodium magnetic resonance imaging(MRI) signal measured in the articular cartilage of the knee in both healthy volunteers and osteoarthritis(OA) patients.Design: This was a prospective Research Ethics Committee approved study that acquired sodium andproton MRI data from 15 subjects with OA (three males, age 64 � 10) and five healthy controls age andsex matched over the group. Each subject underwent standing planar radiographs of their knees forradiological scoring as well as symptomatological assessment questionnaires. In two MRI sessions on thesame day, high resolution double-echo steady state (DESS) and 3D short echo time sodium MRI images ofthe most diseased knee were acquired and co-registered in each session. A blinded reader (LT) manuallydelineated the articular cartilage into four discrete regions, and two combined regions, on the DESSimages. These regions were applied to the sodium images, and a median sodium signal from each re-ported. Within-subject and between-subject coefficients of variation were estimated and intraclasscorrelation coefficients for the healthy control group, OA subject group, and all pooled subjects groupwere calculated.Results: Within-subject variability of sodium MRI at 3 T was 3.2% overall, and 2.0% in healthyage-matched volunteers compared to a reproducibility of 3.6% on OA subjects.Conclusions: The reproducibility of sodium MRI was similar in both healthy controls and OA subjects.Researchers piloting techniques in healthy controls thus may expect a similar reproducibility in a controlledtrial involving subjects with American College of Rheumatology (ACR)-defined OA of the knee.
� 2011 Osteoarthritis Research Society International. Published by Elsevier Ltd. All rights reserved.
Introduction
Cartilage degeneration in osteoarthritis (OA) is characterized bydegradation of the collagen matrix and loss of extracellularproteoglycans (PGs)1,2. PGs contain negatively charged sulfate andcarboxylate groups, which constitute a fixed charge density (FCD).
R.D. Newbould, GSK Clinical. Tel: 44-02080086264; Fax:
. Newbould).
s Research Society International. P
The Donnan equilibrium dictates that positively charged mobileions distribute into cartilage in proportion to this FCD. The majorityof positively charged ions in synovial fluid and cartilage are sodium(Na); which can bemeasured bymagnetic resonance imaging (MRI)to determine the FCD3. Therefore, measuring Na in cartilagemay bea sensitive marker for PG loss and cartilage degeneration4.
Studies using ex-vivo cartilage samples have determined thatthe FCD can be determined by Na MRI3,4, and that the Na concen-tration, and therefore the FCD, reduces with chemical degradationof the cartilage samples by trypsin5. It has further been shown thatNa MRI is a sensitive marker of PG content, whereas proton T1, T2,and proton density are not6.
ublished by Elsevier Ltd. All rights reserved.
R.D. Newbould et al. / Osteoarthritis and Cartilage 20 (2012) 29e3530
Later work progressed Na imaging into small cohorts of humans,and determined the Na concentration in the wrist7, and that areasof lower Na concentration could be found in the knee cartilage ofthree OA patients8. A previous study has examined the repeatabilityof Na measures in four healthy volunteers9 and found a within-subject variability of 6.6%.
A number of studies have explored the use of NaMRI of cartilagein OA, but no study has systematically addressed the reproduc-ibility of these measurements in a larger cohort of both healthy andOA subjects. Therefore, in this study we sought to determine thereproducibility of the Na MRI concentration measured in thearticular cartilage of the knee in both healthy volunteers and OApatients. This study is a step towards validating Na MRI asa biomarker of OA progression in a clinical cohort.
Materials and methods
Patient population
A total of 20 subjects were recruited and gave informed consentin accordance with a Research Ethics Committee (REC) approvedprospective study protocol (Redbridge andWaltham Forest REC ref:08/H0701/87). Fifteen subjects were referred from rheumatologyand surgical clinics in the Imperial College Healthcare NHS Trustwith a confirmed diagnosis of OA by the American College ofRheumatology (ACR) guidelines10, and five were recruited asbetween-group age and sex matched healthy controls. Subjectdemographics are summarized in Table I.
After an initial screening and informed consent visit, allsubjects underwent a standing plane film X-ray of both knees.Whole-joint KellgreneLawrence (KeL) scoring11 was performedon these X-rays by a blinded radiologist with 16 years experience.A pain visual-analog scale (VAS) score, the International PhysicalActivity score (IPAQ)12, and the Knee Injury and OsteoarthritisOutcome Score (KOOS)13 was collected from each subject. Theseclinical scoring systems were used to measure disease burden,
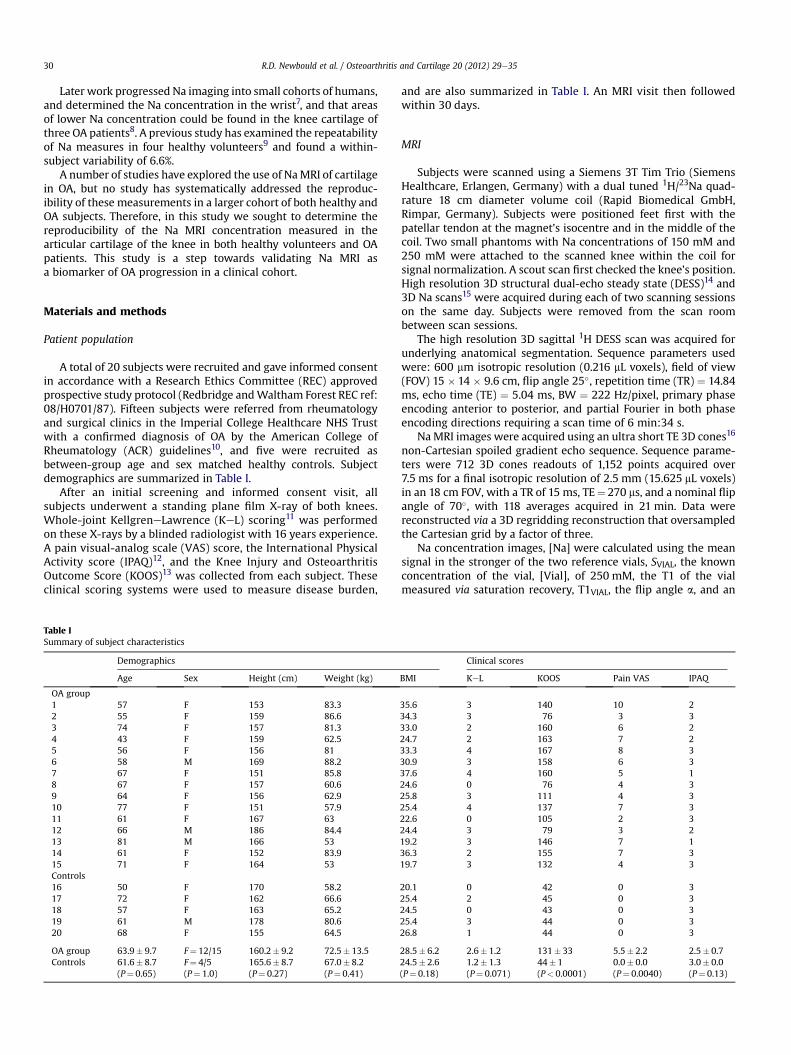
Table ISummary of subject characteristics
Demographics
Age Sex Height (cm) Weight (kg)
OA group1 57 F 153 83.32 55 F 159 86.63 74 F 157 81.34 43 F 159 62.55 56 F 156 816 58 M 169 88.27 67 F 151 85.88 67 F 157 60.69 64 F 156 62.910 77 F 151 57.911 61 F 167 6312 66 M 186 84.413 81 M 166 5314 61 F 152 83.915 71 F 164 53Controls16 50 F 170 58.217 72 F 162 66.618 57 F 163 65.219 61 M 178 80.620 68 F 155 64.5
OA group 63.9� 9.7 F¼ 12/15 160.2� 9.2 72.5� 13.5Controls 61.6� 8.7 F¼ 4/5 165.6� 8.7 67.0� 8.2
(P¼ 0.65) (P¼ 1.0) (P¼ 0.27) (P¼ 0.41)
and are also summarized in Table I. An MRI visit then followedwithin 30 days.
MRI
Subjects were scanned using a Siemens 3T Tim Trio (SiemensHealthcare, Erlangen, Germany) with a dual tuned 1H/23Na quad-rature 18 cm diameter volume coil (Rapid Biomedical GmbH,Rimpar, Germany). Subjects were positioned feet first with thepatellar tendon at the magnet’s isocentre and in the middle of thecoil. Two small phantoms with Na concentrations of 150 mM and250 mM were attached to the scanned knee within the coil forsignal normalization. A scout scan first checked the knee’s position.High resolution 3D structural dual-echo steady state (DESS)14 and3D Na scans15 were acquired during each of two scanning sessionson the same day. Subjects were removed from the scan roombetween scan sessions.
The high resolution 3D sagittal 1H DESS scan was acquired forunderlying anatomical segmentation. Sequence parameters usedwere: 600 mm isotropic resolution (0.216 mL voxels), field of view(FOV) 15 � 14 � 9.6 cm, flip angle 25�, repetition time (TR) ¼ 14.84ms, echo time (TE) ¼ 5.04 ms, BW ¼ 222 Hz/pixel, primary phaseencoding anterior to posterior, and partial Fourier in both phaseencoding directions requiring a scan time of 6 min:34 s.
NaMRI images were acquired using an ultra short TE 3D cones16
non-Cartesian spoiled gradient echo sequence. Sequence parame-ters were 712 3D cones readouts of 1,152 points acquired over7.5 ms for a final isotropic resolution of 2.5 mm (15.625 mL voxels)in an 18 cm FOV, with a TR of 15 ms, TE¼ 270 ms, and a nominal flipangle of 70�, with 118 averages acquired in 21 min. Data werereconstructed via a 3D regridding reconstruction that oversampledthe Cartesian grid by a factor of three.
Na concentration images, [Na] were calculated using the meansignal in the stronger of the two reference vials, SVIAL, the knownconcentration of the vial, [Vial], of 250 mM, the T1 of the vialmeasured via saturation recovery, T1VIAL, the flip angle a, and an
Clinical scores
BMI KeL KOOS Pain VAS IPAQ
35.6 3 140 10 234.3 3 76 3 333.0 2 160 6 224.7 2 163 7 233.3 4 167 8 330.9 3 158 6 337.6 4 160 5 124.6 0 76 4 325.8 3 111 4 325.4 4 137 7 322.6 0 105 2 324.4 3 79 3 219.2 3 146 7 136.3 2 155 7 319.7 3 132 4 3
20.1 0 42 0 325.4 2 45 0 324.5 0 43 0 325.4 3 44 0 326.8 1 44 0 3
28.5� 6.2 2.6� 1.2 131� 33 5.5� 2.2 2.5� 0.724.5� 2.6 1.2� 1.3 44� 1 0.0� 0.0 3.0� 0.0(P¼ 0.18) (P¼ 0.071) (P< 0.0001) (P¼ 0.0040) (P¼ 0.13)
R.D. Newbould et al. / Osteoarthritis and Cartilage 20 (2012) 29e35 31
extrapolated literature T1 value for Na in the cartilage, T1CART, at 3 Tof 18 ms8,17,18 using
½Na� ¼
½Vial�$
0B@1� e
�TR=T1VIAL
1CA
0B@1� cosðaÞ$e�TR=T1CART
1CA$SCART
0B@1� cosðaÞ$e�TR=T1VIAL
1CA
0B@1� e
�TR=T1CART
1CA$SVIAL
[1]
3D images were finally scaled using an affine transformationcalibrated on a resolution phantom (data not shown) to partiallyaccount for gradient non-linearities19 that were corrected for theCartesian sequences, such as the 3D DESS, with the manufacturerprovided warping field.
Structural T1, T2, and proton density scans were also acquired inone of the scan sessions for radiological review to rule out otherpathologies.
Data analysis
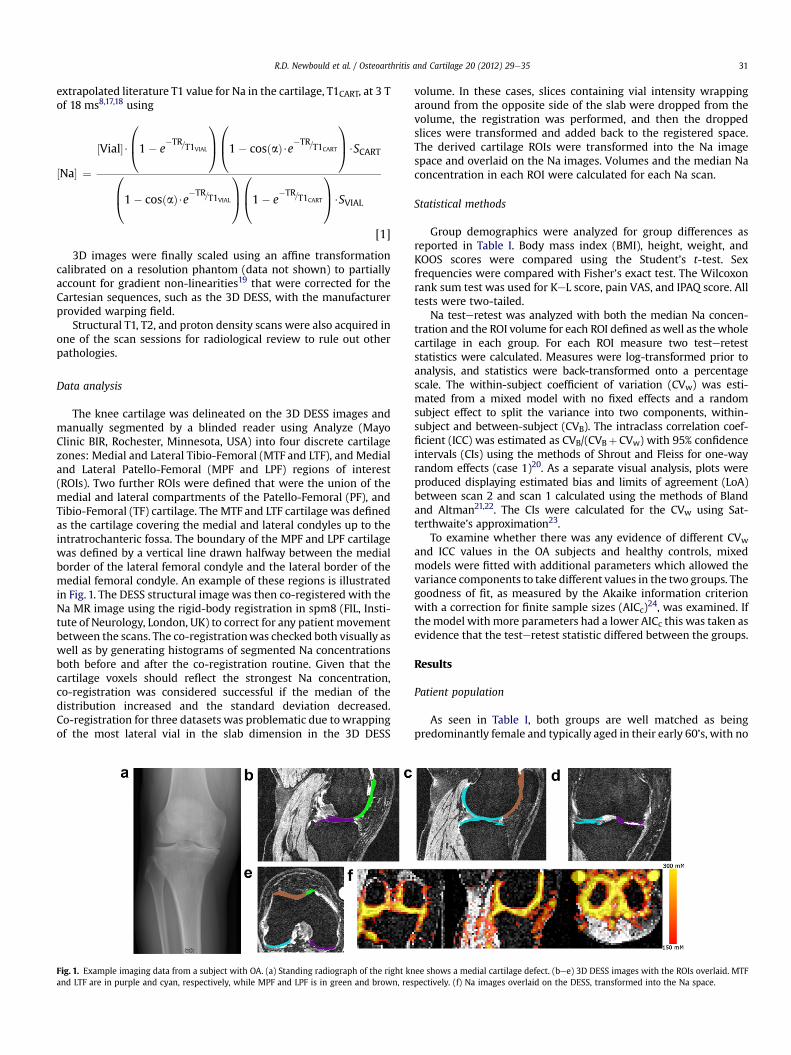
The knee cartilage was delineated on the 3D DESS images andmanually segmented by a blinded reader using Analyze (MayoClinic BIR, Rochester, Minnesota, USA) into four discrete cartilagezones: Medial and Lateral Tibio-Femoral (MTF and LTF), and Medialand Lateral Patello-Femoral (MPF and LPF) regions of interest(ROIs). Two further ROIs were defined that were the union of themedial and lateral compartments of the Patello-Femoral (PF), andTibio-Femoral (TF) cartilage. The MTF and LTF cartilage was definedas the cartilage covering the medial and lateral condyles up to theintratrochanteric fossa. The boundary of the MPF and LPF cartilagewas defined by a vertical line drawn halfway between the medialborder of the lateral femoral condyle and the lateral border of themedial femoral condyle. An example of these regions is illustratedin Fig. 1. The DESS structural image was then co-registered with theNa MR image using the rigid-body registration in spm8 (FIL, Insti-tute of Neurology, London, UK) to correct for any patient movementbetween the scans. The co-registrationwas checked both visually aswell as by generating histograms of segmented Na concentrationsboth before and after the co-registration routine. Given that thecartilage voxels should reflect the strongest Na concentration,co-registration was considered successful if the median of thedistribution increased and the standard deviation decreased.Co-registration for three datasets was problematic due towrappingof the most lateral vial in the slab dimension in the 3D DESS
Fig. 1. Example imaging data from a subject with OA. (a) Standing radiograph of the right knand LTF are in purple and cyan, respectively, while MPF and LPF is in green and brown, res
volume. In these cases, slices containing vial intensity wrappingaround from the opposite side of the slab were dropped from thevolume, the registration was performed, and then the droppedslices were transformed and added back to the registered space.The derived cartilage ROIs were transformed into the Na imagespace and overlaid on the Na images. Volumes and the median Naconcentration in each ROI were calculated for each Na scan.
Statistical methods
Group demographics were analyzed for group differences asreported in Table I. Body mass index (BMI), height, weight, andKOOS scores were compared using the Student’s t-test. Sexfrequencies were compared with Fisher’s exact test. The Wilcoxonrank sum test was used for KeL score, pain VAS, and IPAQ score. Alltests were two-tailed.
Na testeretest was analyzed with both the median Na concen-tration and the ROI volume for each ROI defined as well as thewholecartilage in each group. For each ROI measure two testereteststatistics were calculated. Measures were log-transformed prior toanalysis, and statistics were back-transformed onto a percentagescale. The within-subject coefficient of variation (CVw) was esti-mated from a mixed model with no fixed effects and a randomsubject effect to split the variance into two components, within-subject and between-subject (CVB). The intraclass correlation coef-ficient (ICC) was estimated as CVB/(CVBþ CVw) with 95% confidenceintervals (CIs) using the methods of Shrout and Fleiss for one-wayrandom effects (case 1)20. As a separate visual analysis, plots wereproduced displaying estimated bias and limits of agreement (LoA)between scan 2 and scan 1 calculated using the methods of Blandand Altman21,22. The CIs were calculated for the CVw using Sat-terthwaite’s approximation23.
To examine whether there was any evidence of different CVwand ICC values in the OA subjects and healthy controls, mixedmodels were fitted with additional parameters which allowed thevariance components to take different values in the two groups. Thegoodness of fit, as measured by the Akaike information criterionwith a correction for finite sample sizes (AICc)24, was examined. Ifthemodel withmore parameters had a lower AICc this was taken asevidence that the testeretest statistic differed between the groups.
Results
Patient population
As seen in Table I, both groups are well matched as beingpredominantly female and typically aged in their early 60’s, with no
ee shows a medial cartilage defect. (bee) 3D DESS images with the ROIs overlaid. MTFpectively. (f) Na images overlaid on the DESS, transformed into the Na space.

Table IIITesteretest statistics, with 95% CIs in parentheses, for the Na concentration and ROIvolumes for the group containing only the healthy controls
ROI % CVw ICC
Median Na concentration WHOLE 2.0 (1.3, 5.0) 0.96 (0.75, 1.00)PF 4.0 (2.5, 9.9) 0.91 (0.48, 0.99)TF 2.2 (1.4, 5.5) 0.96 (0.72, 1.00)LPF 3.1* (1.9, 7.6) 0.93 (0.58, 0.99)MPF 13.8* (8.6, 34.7) 0.80y (0.09, 0.98)LTF 4.2 (2.6, 10.3) 0.89 (0.38, 0.99)MTF 3.1 (2.0, 7.7) 0.93 (0.60, 0.99)
Volume WHOLE 7.5 (4.7, 18.6) 0.64y (�0.23, 0.95)PF 5.5 (3.4, 13.4) 0.92 (0.53, 0.99)TF 10.1 (6.3, 25.2) 0.61y (�0.29, 0.95)LPF 16.5* (10.3, 42.0) 0.65y (�0.22, 0.96)MPF 62.2* (36.9, 248.1) 0.23y (�0.64, 0.88)LTF 10.4 (6.5, 25.9) 0.73 (�0.08, 0.97)MTF 13.7 (8.5, 34.5) 0.57y (�0.34, 0.94)
* CVw differs between the OA and healthy control groups.y ICC differs between the OA and healthy control groups.
Table IV
R.D. Newbould et al. / Osteoarthritis and Cartilage 20 (2012) 29e3532
significant group differences in age, BMI, height, or weight. This isin contrast with the clinical measures of disease severity, also inTable I. The pain VAS was significantly different (P¼ 0.0040)between groups. As pain is one of elements of the ACR criteriadefining OA, this could be expected. The KOOS scoring was alsohighly significantly different (P< 0.0001), which stands in contrastto the IPAQ and KeL scoring methods. Whole-knee KeL scoringapproached but did not achieve significance (defined as P< 0.05)between groups. While caution must be exercised in comparingP-values from different tests, overlap in scores is notable betweenthe groups: two OA subjects had the lowest possible KeL score of 0,and one control had a high KeL score of 3. Given the strongdifferences between groups in reported pain and KOOS scores, thismay reflect shortcomings in whole-knee KeL scores as well asheterogeneity of the disease. The activity scoring was still furtherfrom significance (P¼ 0.13) andmay reflect the limited scope of thescoring system, e.g., that it reflects only activity rather than clinicalcriteria for the etiology of OA.
Na repeatability
An example dataset from an OA subject is shown in Fig. 1. Thestanding X-ray shows an obvious medial joint space narrowing. Thedefect is apparent on the 3D DESS images, and can be appreciatedhere in Fig. 1(d), where the gap in the MTF ROI in purple highlightsthe lack of cartilage. Na images are shown overlaid on the DESS,which has been transformed into the Na space. High Na signal canbe appreciated in the cartilage, with little signal elsewhere asidefrom in the external reference vials.
Repeatability measures for the Na concentration in the cartilageROIs are summarized in Table II for the total study group. Overall,a 3.2% CVw was found for the median Na concentration over thetotal cartilage studied. The TF cartilage was more repeatable thanthe PF cartilage, which is also reflected in comparisons betweenboth the medial and lateral sub-ROIs. This trend is shown in bothOA and healthy subjects. The volume measurements showed a 5.8%CVw across all subjects, yet was slightly lower (5.0%) in the OAsubjects only. Repeatability measures for the volume of the carti-lage ROIs are reported in the lower half of Table II. As could beexpected, the measurement was less stable for smaller ROIs thanfor larger ROIs. Unlike the Na signal, the repeatability was higher inthe PF cartilage than in the TF cartilage.
Overall, there was little difference in the repeatability measuresof each group separately, as summarized in Tables III and IV. Forboth Na concentration and volumemeasures the AICc was generallylower when the CVw was assumed to be the same for both OAsubjects and healthy controls, with evidence of different variability
Table IITesteretest statistics, with 95% CIs in parentheses, for the Na concentration and ROIvolumes for the group containing all subjects
ROI % CVw ICC
Median Na concentration WHOLE 3.2 (2.5, 4.7) 0.91 (0.79, 0.96)PF 5.9 (4.5, 8.6) 0.84 (0.63, 0.93)TF 2.5 (1.9, 3.7) 0.95 (0.89, 0.98)LPF 6.0 (4.6, 8.8) 0.86 (0.68, 0.94)MPF 9.9 (7.5, 14.5) 0.67 (0.33, 0.86)LTF 4.1 (3.1, 6.0) 0.88 (0.72, 0.95)MTF 3.6 (2.7, 5.2) 0.94 (0.86, 0.98)
Volume WHOLE 5.8 (4.4, 8.5) 0.95 (0.88, 0.98)PF 4.7 (3.6, 6.9) 0.98 (0.95, 0.99)TF 7.4 (5.6, 10.8) 0.95 (0.88, 0.98)LPF 10.4 (7.9, 15.2) 0.97 (0.92, 0.99)MPF 34.8 (26.1, 52.6) 0.85 (0.66, 0.94)LTF 9.6 (7.3, 14.1) 0.86 (0.68, 0.94)MTF 13.8 (10.5, 20.3) 0.95 (0.88, 0.98)
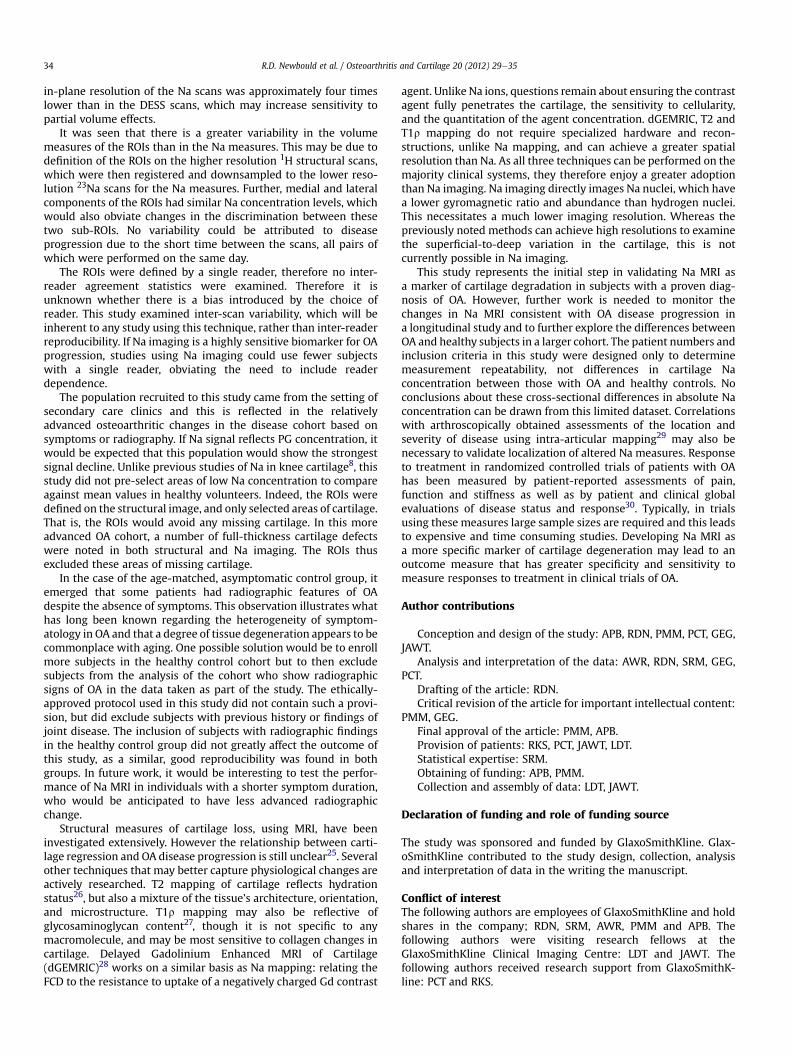
between the populations only in the smallest ROIs (LPF and MPF).Similar results were seen for the ICC statistic with Na concentra-tion. However, AICc was lower when the ICC was allowed to bedifferent between the OA and healthy groups than themodel whichconstrained the ICC to be the same in both groups for the volumemeasures in most ROIs. This appears to be primarily driven byincreased between-subject variability in the OA subjects, presum-ably due to differential disease progression, which in turn results insmaller ICCs in this group than the healthy controls. TheBlandeAltman plots in Figs. 2 and 3 for the volume and Nameasurements, respectively, more clearly show the similaritiesbetween the groups. The bias lines and 95% LoA are similar for eachgroup in all the plots. Overall, these results support the conclusionthat the repeatability of Nameasurements is very similar in healthyand OA subjects.
Discussion
This study quantified the testeretest variability of Na imaging ofthe knee in OA subjects. The testeretest reliability was similarbetween healthy controls and OA subjects. This is a major finding ofthe study, as it shows that Na methods, which are still generallyperformed only in a research setting piloted in healthy controls,would have a similar stability when applied to subjects withcartilage degeneration. One may have expected a greater variabilityin the cartilage of OA subjects due to the expectation of more
Testeretest statistics, with 95% CIs in parentheses, for the Na concentration and ROIvolumes for the group containing only OA subjects
ROI % CVw ICC
Median Na concentration WHOLE 3.6 (2.6, 5.6) 0.89 (0.71, 0.96)PF 6.5 (4.7, 10.2) 0.82 (0.53, 0.94)TF 2.6 (1.9, 4.1) 0.95 (0.86, 0.98)LPF 6.8* (5.0, 10.7) 0.85 (0.61, 0.95)MPF 8.0* (5.9, 12.7) 0.40y (�0.13, 0.76)LTF 4.1 (3.0, 6.4) 0.87 (0.66, 0.96)MTF 3.7 (2.7, 5.8) 0.95 (0.84, 0.98)
Volume WHOLE 5.0 (3.7, 7.9) 0.97y (0.91, 0.99)PF 4.4 (3.3, 7.0) 0.98 (0.96, 1.00)TF 6.1 (4.5, 9.6) 0.97y (0.92, 0.99)LPF 7.0* (5.1, 11.1) 0.99y (0.97, 1.00)MPF 19.8* (14.4, 31.6) 0.96y (0.88, 0.99)LTF 9.3 (6.8, 14.7) 0.89 (0.69, 0.96)MTF 13.9 (10.1, 22.0) 0.96y (0.89, 0.99)
* CVw differs between the OA and healthy control groups.y ICC differs between the OA and healthy control groups.
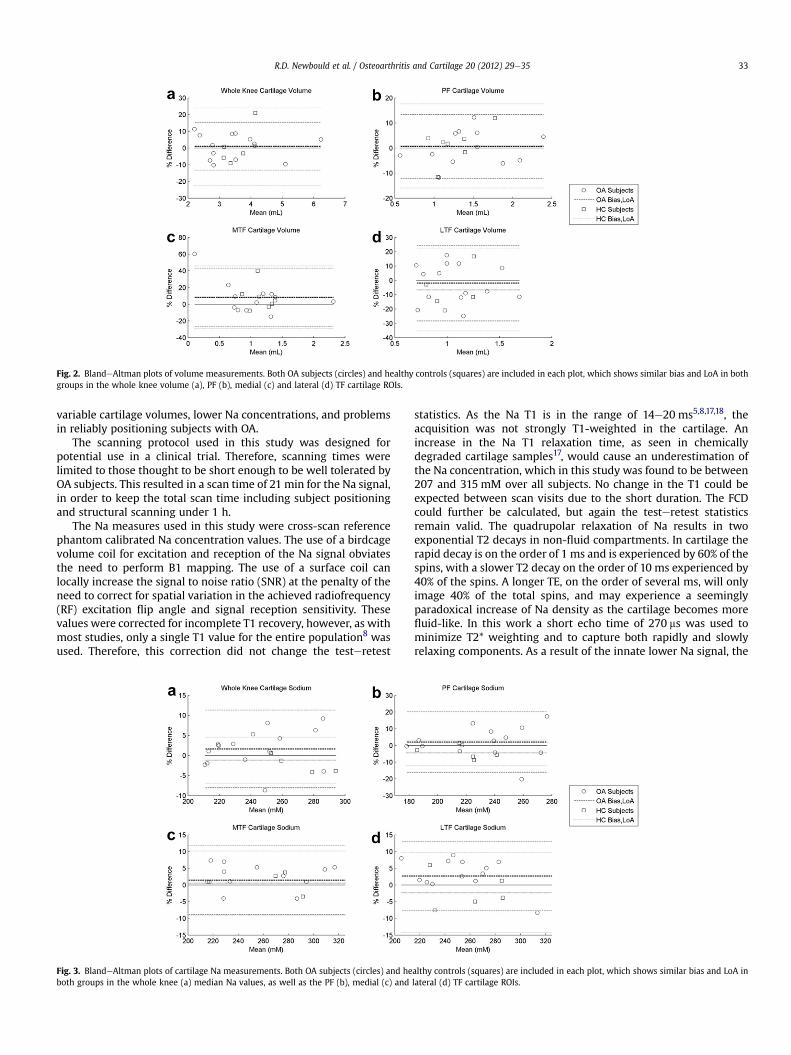
Fig. 2. BlandeAltman plots of volume measurements. Both OA subjects (circles) and healthy controls (squares) are included in each plot, which shows similar bias and LoA in bothgroups in the whole knee volume (a), PF (b), medial (c) and lateral (d) TF cartilage ROIs.
R.D. Newbould et al. / Osteoarthritis and Cartilage 20 (2012) 29e35 33
variable cartilage volumes, lower Na concentrations, and problemsin reliably positioning subjects with OA.
The scanning protocol used in this study was designed forpotential use in a clinical trial. Therefore, scanning times werelimited to those thought to be short enough to be well tolerated byOA subjects. This resulted in a scan time of 21 min for the Na signal,in order to keep the total scan time including subject positioningand structural scanning under 1 h.
The Na measures used in this study were cross-scan referencephantom calibrated Na concentration values. The use of a birdcagevolume coil for excitation and reception of the Na signal obviatesthe need to perform B1 mapping. The use of a surface coil canlocally increase the signal to noise ratio (SNR) at the penalty of theneed to correct for spatial variation in the achieved radiofrequency(RF) excitation flip angle and signal reception sensitivity. Thesevalues were corrected for incomplete T1 recovery, however, as withmost studies, only a single T1 value for the entire population8 wasused. Therefore, this correction did not change the testeretest
Fig. 3. BlandeAltman plots of cartilage Na measurements. Both OA subjects (circles) and heboth groups in the whole knee (a) median Na values, as well as the PF (b), medial (c) and
statistics. As the Na T1 is in the range of 14e20 ms5,8,17,18, theacquisition was not strongly T1-weighted in the cartilage. Anincrease in the Na T1 relaxation time, as seen in chemicallydegraded cartilage samples17, would cause an underestimation ofthe Na concentration, which in this study was found to be between207 and 315 mM over all subjects. No change in the T1 could beexpected between scan visits due to the short duration. The FCDcould further be calculated, but again the testeretest statisticsremain valid. The quadrupolar relaxation of Na results in twoexponential T2 decays in non-fluid compartments. In cartilage therapid decay is on the order of 1 ms and is experienced by 60% of thespins, with a slower T2 decay on the order of 10 ms experienced by40% of the spins. A longer TE, on the order of several ms, will onlyimage 40% of the total spins, and may experience a seeminglyparadoxical increase of Na density as the cartilage becomes morefluid-like. In this work a short echo time of 270 ms was used tominimize T2* weighting and to capture both rapidly and slowlyrelaxing components. As a result of the innate lower Na signal, the
althy controls (squares) are included in each plot, which shows similar bias and LoA inlateral (d) TF cartilage ROIs.
R.D. Newbould et al. / Osteoarthritis and Cartilage 20 (2012) 29e3534
in-plane resolution of the Na scans was approximately four timeslower than in the DESS scans, which may increase sensitivity topartial volume effects.
It was seen that there is a greater variability in the volumemeasures of the ROIs than in the Na measures. This may be due todefinition of the ROIs on the higher resolution 1H structural scans,which were then registered and downsampled to the lower reso-lution 23Na scans for the Na measures. Further, medial and lateralcomponents of the ROIs had similar Na concentration levels, whichwould also obviate changes in the discrimination between thesetwo sub-ROIs. No variability could be attributed to diseaseprogression due to the short time between the scans, all pairs ofwhich were performed on the same day.
The ROIs were defined by a single reader, therefore no inter-reader agreement statistics were examined. Therefore it isunknown whether there is a bias introduced by the choice ofreader. This study examined inter-scan variability, which will beinherent to any study using this technique, rather than inter-readerreproducibility. If Na imaging is a highly sensitive biomarker for OAprogression, studies using Na imaging could use fewer subjectswith a single reader, obviating the need to include readerdependence.
The population recruited to this study came from the setting ofsecondary care clinics and this is reflected in the relativelyadvanced osteoarthritic changes in the disease cohort based onsymptoms or radiography. If Na signal reflects PG concentration, itwould be expected that this population would show the strongestsignal decline. Unlike previous studies of Na in knee cartilage8, thisstudy did not pre-select areas of low Na concentration to compareagainst mean values in healthy volunteers. Indeed, the ROIs weredefined on the structural image, and only selected areas of cartilage.That is, the ROIs would avoid any missing cartilage. In this moreadvanced OA cohort, a number of full-thickness cartilage defectswere noted in both structural and Na imaging. The ROIs thusexcluded these areas of missing cartilage.
In the case of the age-matched, asymptomatic control group, itemerged that some patients had radiographic features of OAdespite the absence of symptoms. This observation illustrates whathas long been known regarding the heterogeneity of symptom-atology in OA and that a degree of tissue degeneration appears to becommonplace with aging. One possible solution would be to enrollmore subjects in the healthy control cohort but to then excludesubjects from the analysis of the cohort who show radiographicsigns of OA in the data taken as part of the study. The ethically-approved protocol used in this study did not contain such a provi-sion, but did exclude subjects with previous history or findings ofjoint disease. The inclusion of subjects with radiographic findingsin the healthy control group did not greatly affect the outcome ofthis study, as a similar, good reproducibility was found in bothgroups. In future work, it would be interesting to test the perfor-mance of Na MRI in individuals with a shorter symptom duration,who would be anticipated to have less advanced radiographicchange.
Structural measures of cartilage loss, using MRI, have beeninvestigated extensively. However the relationship between carti-lage regression and OA disease progression is still unclear25. Severalother techniques that may better capture physiological changes areactively researched. T2 mapping of cartilage reflects hydrationstatus26, but also a mixture of the tissue’s architecture, orientation,and microstructure. T1r mapping may also be reflective ofglycosaminoglycan content27, though it is not specific to anymacromolecule, and may be most sensitive to collagen changes incartilage. Delayed Gadolinium Enhanced MRI of Cartilage(dGEMRIC)28 works on a similar basis as Na mapping: relating theFCD to the resistance to uptake of a negatively charged Gd contrast
agent. Unlike Na ions, questions remain about ensuring the contrastagent fully penetrates the cartilage, the sensitivity to cellularity,and the quantitation of the agent concentration. dGEMRIC, T2 andT1r mapping do not require specialized hardware and recon-structions, unlike Na mapping, and can achieve a greater spatialresolution than Na. As all three techniques can be performed on themajority clinical systems, they therefore enjoy a greater adoptionthan Na imaging. Na imaging directly images Na nuclei, which havea lower gyromagnetic ratio and abundance than hydrogen nuclei.This necessitates a much lower imaging resolution. Whereas thepreviously noted methods can achieve high resolutions to examinethe superficial-to-deep variation in the cartilage, this is notcurrently possible in Na imaging.
This study represents the initial step in validating Na MRI asa marker of cartilage degradation in subjects with a proven diag-nosis of OA. However, further work is needed to monitor thechanges in Na MRI consistent with OA disease progression ina longitudinal study and to further explore the differences betweenOA and healthy subjects in a larger cohort. The patient numbers andinclusion criteria in this study were designed only to determinemeasurement repeatability, not differences in cartilage Naconcentration between those with OA and healthy controls. Noconclusions about these cross-sectional differences in absolute Naconcentration can be drawn from this limited dataset. Correlationswith arthroscopically obtained assessments of the location andseverity of disease using intra-articular mapping29 may also benecessary to validate localization of altered Na measures. Responseto treatment in randomized controlled trials of patients with OAhas been measured by patient-reported assessments of pain,function and stiffness as well as by patient and clinical globalevaluations of disease status and response30. Typically, in trialsusing these measures large sample sizes are required and this leadsto expensive and time consuming studies. Developing Na MRI asa more specific marker of cartilage degeneration may lead to anoutcome measure that has greater specificity and sensitivity tomeasure responses to treatment in clinical trials of OA.
Author contributions
Conception and design of the study: APB, RDN, PMM, PCT, GEG,JAWT.
Analysis and interpretation of the data: AWR, RDN, SRM, GEG,PCT.
Drafting of the article: RDN.Critical revision of the article for important intellectual content:
PMM, GEG.Final approval of the article: PMM, APB.Provision of patients: RKS, PCT, JAWT, LDT.Statistical expertise: SRM.Obtaining of funding: APB, PMM.Collection and assembly of data: LDT, JAWT.
Declaration of funding and role of funding source
The study was sponsored and funded by GlaxoSmithKline. Glax-oSmithKline contributed to the study design, collection, analysisand interpretation of data in the writing the manuscript.
Conflict of interestThe following authors are employees of GlaxoSmithKline and holdshares in the company; RDN, SRM, AWR, PMM and APB. Thefollowing authors were visiting research fellows at theGlaxoSmithKline Clinical Imaging Centre: LDT and JAWT. Thefollowing authors received research support from GlaxoSmithK-line: PCT and RKS.
R.D. Newbould et al. / Osteoarthritis and Cartilage 20 (2012) 29e35 35
References
1. Bollet AJ, Nance JL. Biochemical findings in normal and oste-oarthritic articular cartilage. II. Chondroitin sulfate concen-tration and chain length, water, and ash content. J Clin Invest1966;45:1170e7.
2. Mankin H, Dorfman H, Zarins L. Biochemical and metabolicabnormalities in articular cartilage from osteoarthritic humanhips. II. Correlation of morphology with biochemical andmetabolic data. J Bone Joint Surg 1971;53A:523e37.
3. Lesperance LM, Gray ML, Burstein D. Determination of fixedcharge density in cartilage using nuclear magnetic resonance.J Orthop Res 1992;10(1):1e13.
4. Shapiro EM, Borthakur A, Gougoutas A, Reddy R. 23Na MRIaccurately measures fixed charge density in articular cartilage.Magn Reson Med 2002;47(2):284e91.
5. Reddy R, Insko E, Noyszewski E, Dandora R, Kneeland J, Leigh J.Sodium MRI of human articular cartilage in vivo. Magn ResonMed 1998;39:697e701.
6. Borthakur A, Shapiro E, Beers J, Kudchodkar S, Kneeland JB,Reddy R. Sensitivity of MRI to proteoglycan depletion incartilage: comparison of sodium and proton MRI. Osteoar-thritis Cartilage 2000;8(4):288e93.
7. Borthakur A, Shapiro E, Akella S, Gougoutas A, Kneeland J,Reddy R. Quantifying sodium in the human wrist in vivo byusing MR imaging. Radiology 2002;224:598e602.
8. Wheaton AJ, Borthakur A, Shapiro EM, Regatte RR, Akella SVS,Kneeland JB, et al. Proteoglycan loss in human knee cartilage:quantitation with sodium MR imagingdfeasibility study.Radiology 2004;231:900e5.
9. Koo S, Staroswiecki E, Bangerter N, Hargreaves B, Gold G.Repeatability and age-related change of sodium in the kneearticular cartilage measured with sodium MRI. Proceedings ofthe 17th ISMRM 2009:1975.
10. Altman R, Asch E, Bloch D, Bole G, Borenstein D, Brandt K, et al.Development of criteria for the classification and reporting ofosteoarthritis: classification of osteoarthritis of the knee.Arthritis Rheum 1986;29(8):1039e49.
11. Kellgren JH, Lawrence JS. Radiological assessment of osteo-arthrosis. Ann Rheum Dis 1957;16:494e502.
12. Craig CL, Marshall AL, Sjostrom M, Bauman AE, Booth ML,Ainsworth BE, et al. International Physical Activity Question-naire: 12-country reliability and validity. Med Sci Sports Exerc2003;35(8):1381e95.
13. Roos EM, Roos HP, Lohmander LS, Ekdahl C, Beynnon BD. KneeInjury and Osteoarthritis Outcome Score (KOOS) e develop-ment of a self-administered outcome measure. J Orthop SportsPhys Ther 1998;28(2):88e96.
14. Hardy PA, Recht MP, Piraino D, Thomasson D. Optimization ofa dual echo in the steady state (DESS) free-precession sequencefor imaging cartilage. JMagn Reson Imaging 1996;6(2):329e35.
15. Staroswiecki E, Bangerter NK, Gurney PT, Grafendorfer T,Gold GE, Hargreaves BA. In vivo sodium imaging of human
patellar cartilage with a 3D cones sequence at 3 T and 7 T.J Magn Reson Imaging 2010;32(2):446e51.
16. Gurney PT, Hargreaves BA, Nishimura DG. Design and analysisof a practical 3D cones trajectory. Magn Reson Med 2006;55(3):575e82.
17. Insko EK, Kaufman JH, Leigh JS, Reddy R. Sodium NMR evalu-ation of articular cartilage degradation. Magn Reson Med1999;41(1):30e4.
18. Shapiro EM, Borthakur A, Dandora R, Kriss A, Leigh JS, Reddy R.Sodium visibility and quantitation in intact bovine articularcartilage using high field 23Na MRI and MRS. J Magn Reson2000;142(1):24e31.
19. Langlois S, Desvignes M, Constans JM, Revenu M. MRIgeometric distortion: a simple approach to correcting theeffects of non-linear gradient fields. J Magn Reson Imaging1999;9(6):821e31.
20. Shrout PE, Fleiss JL. Intraclass correlations: uses in assessingrater reliability. Psychol Bull 1979;86(2):420e8.
21. Bland JM, Altman DG. Measurement error. BMJ 1996;313(7059):744.
22. Bland JM, Altman DG. Statistical methods for assessingagreement between two methods of clinical measurement.Lancet 1986;1(8476):307e10.
23. Satterthwaite FE. An approximate distribution ofestimates of variance components. Biometrics 1946;2(6):110e4.
24. Hurvich CM, Tsai C-L. Regression and time series modelselection in small samples. Biometrika 1989;76:297e307.
25. Cibere J, Sayre EC, Guermazi A, Nicolaou S, Kopec JA, Esdaile JM,et al. Natural history of cartilage damage and osteoarthritisprogression on magnetic resonance imaging in a pop-ulation-based cohort with knee pain. Osteoarthritis Cartilage2011;19(6):683e8.
26. Lüssea S, Claassen H, Gehrke T, Hassenpflug J, Schünke M,Heller M, et al. Evaluation of water content by spatiallyresolved transverse relaxation times of human articularcartilage. Magn Reson Imaging 2000;18(4):423e30.
27. Menezes NM, Gray ML, Hartke JR, Burstein D. T2 and T1rhoMRI in articular cartilage systems. Magn Reson Med2004;51(3):503e9.
28. Burstein D, Gray ML, Hartman AL, Gipe R, Foy BD. Diffusion ofsmall solutes in cartilage as measured by nuclear magneticresonance (NMR) spectroscopy and imaging. J Orthop Res1993;11(4):465e78.
29. Hunt N, Sanchez-Ballester J, Pandit R, Thomas R, Strachan R.Chondral lesions of the knee: a new localization method andcorrelation with associated pathology. Arthroscopy2001;17(5):481e90.
30. Dworkin RH, Peirce-Sandner S, Turk DC, McDermott MP,Gibofsky A, Simon LS, et al. Outcome measures inplacebo-controlled trials of osteoarthritis: responsiveness totreatment effects in the REPORT database. OsteoarthritisCartilage 2011;19(5):483e92.