Embed Size (px)
Citation preview

Representing Website Design
Copyright © 2003 David K. Farkas.
WinWriters Online Help ConferenceSeattle, Washington
February 19, 2003
Professor David K. FarkasDepartment of Technical Communication
University of WashingtonC
A
D
B
E

Five ways to represent the design of a website
1. Node-link diagrams
2. Flowchart node-link diagrams
3. Page mock-ups
4. Visual hierarchy diagrams
5. Page Layout Change (PLC) notation

Node-Link Diagrams

Node-link diagrams
Hypertext Theory:
A node is a generalized
unit of content (often
equivalent to an HTML
page). The electronic
pathways that connect
nodes are links.

The uses of node-link diagrams
• They enable designers to represent the design of particular websites.
• They enable designers to think through design ideas.
• They enable designers to gauge whether users can achieve situational awareness.

Representing a particular design

Thinking through design ideas

Gauging whether users can achieve situational awareness

Limitations of node-link diagrams
• You can run out of space trying to represent a large website.
• A node-link diagram has an “impoverished” notion of a node and a link. For example, how do you represent transactions? How do you represent downloads?
• They don’t tell you anything about the appearance of the website.

For detailed information on node-link diagrams
David K. Farkas and Jean B. Farkas
Principles of Web Design
Longman 2002

Flowchart Node-Link Diagrams
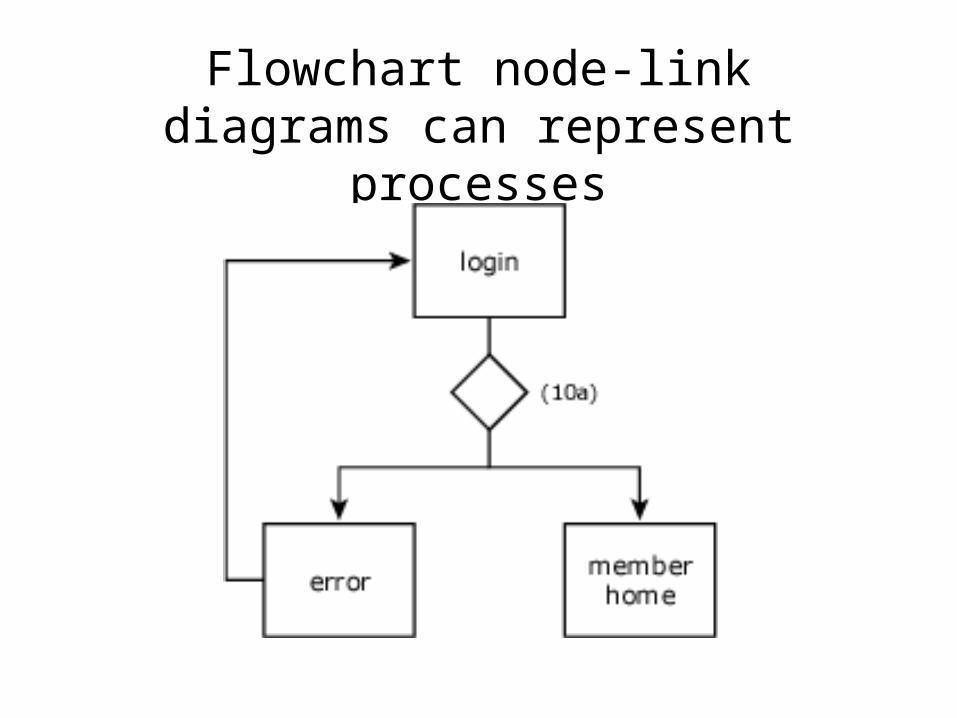
Flowchart node-link diagrams can represent processes

Flowchart node-link diagrams can represent processes—2
page file

The limitations of classical and flowchart node-link diagrams
• You can run out of space trying to represent a large website.
• They don’t tell you anything about the appearance of the website.

For detailed information on flowchart node-link diagrams
Jesse James Garrett’swebsite: http://www.jjg.net
“A visual vocabulary for describing information architecture and interaction design”
http://www.jjg.net/ia/visvocab

Page Mock-ups

Page mock-ups(thumbnails, sketches, wireframes)
• Page mock-ups are simply representations of individual pages—usually created early in the design process.
• Page mock-ups are central to design work.
Human beings almost always “rough out” their design ideas.

Page mock-ups vary in fidelity to the finished page
From Rosenfeld and Morville, 2002

The limitations of page mock-ups
Page mock-ups do not capture the thinking that
surrounds them. They don’t tell you why the
designer did what he/she has done.

For detailed information on using page mock-ups in Web design
Louis Rosenfeld and Peter Morville
Information Architecture for the World Wide Web
2nd. ed., O’Reilly 2002
. . . and many other books.

Visual Hierarchy Diagrams

Visual hierarchy diagrams
Visual hierarchy diagrams explicitly represent
the subordination of the regions and elements
on a page. Therefore, they convey a key aspect
of the designer’s thinking.

“Each page should have a clear visual hierarchy”
“One of the best ways to make a page easy to grasp in a hurry is to make sure that the appearance of the things on the page—all of the visual cues—clearly and accurately portray the relationship between the things on the page: which things are related and which things are part of other things. In other words, each page should have a clear visual hierarchy.”
Steve Krug, Don’t Make Me Think. Que, 2000.

A web page with a simple, straightforward visual hierarchy

Visual hierarchies may be complex
A(1)
D(2)
G(3)
B(2)C(2)
E(2)
F(3)

Uses of visual hierarchy diagrams
1. Gauging how well the elements on the page are organized. Is there a clear visual hierarchy? Does it accord with the rhetorical function of the text?
2. Gauging—and informally scoring— the complexity of a design (the number of elements and regions).

A poor visual hierarchy

A poor visual hierarchy
Special import from Germany
Frankie Lyman and the Teenagers
3 CD boxed set, 72 cuts and illustrated booklet
Call for price 301-345-9504

Scoring visual complexity
18 design elements + 3 regions = 21

Limitations of visual hierarchy diagrams
1. Determining a visual hierarchy is a very inexact science with numerous principles involved.
2. Visual hierarchy diagrams take time to create.
3. Visual hierarchy diagrams focus our attention on individual pages. Users, however, experience a website as a succession of pages.

For detailed information on visual hierarchy diagrams
K. Reichenberger, K. J. Rondhuis, J. Kleinz and J. Bateman, “Effective Presentation of Information Through Page Layout: A Linguistically Based Approach,” in Electronic Proceedings of the ACM Workshop on Effective Abstractions in Multimedia, Nov. 4,1995 San Francisco, CA.
http://www.cs.tufts.edu/~isabel/reichen/page-layout.html

Page Layout Change (PLC) Notation

PLC Notation
PLC notations expand upon visual hierarchy
diagrams. They represent user pathways
through a website and help us gauge—and
informally score—the degree of page layout
change.

Using PLC
1. Trace one or more user pathway, marking the regions of each page on the path.
2. Annotate the user’s pathway using PLC syntax.
3. Calculate the PLC score.
4. Compare PLC score to visual complexity score.

“reconfigured as”
PLC Syntax
Link Region(s)“operates on”
>> Region(s) >> Region(s)
(Note: Refer to >> as a “chevron.”)
=“remains as”
Region(s) = Region(s)

A simple example with minimal change (no reconfiguration)
B CA = AClicking a link in B drives a change in C.
This is a very typical design.

Fusing regions(Tracing a path across three pages)
A
C
B
D1
F1
I G3
J
F3
F2 G1
G2F4
H
A
CB
D
D2 C-JC-J >> C,D
Massive reconfiguration,fusion of multiple regions.
D2
E1
E2

Fusing regions(Tracing a path across three pages)
A
CB
D
A
CB
DLink in main content area (MCA) changes content of main content area.
D D

Splitting a region
C CC >> D+E
A
CB
A
D
B E

Spawning a new region
B BB >> B(C)
AB
AC
B

Dropping a region
xxxxxxx
C C(D)C(D) >> CA
CB D
A
CB

Shifts in the dimensions of regions
A
C
D E
F
B
G H
I
AC
D E
F
B
G
I
H
C A-I(A-I) >> (A-I)

Regions introduced by scrolling
Scroll A,B,CA,C >> D
A
CB
D

The scope of PLC:What behaviors can it track?
1. Changes in content only (no reconfiguration)
2. Splitting into two or more regions
3. Fusing regions
4. Spawning a region
5. Dropping a region
6. Shifts in the dimensions of regions
7. Regions introduced by scrolling
8. Any and all combinations

The scope of PLC: What events are supported?
• Mouse click• Mouse rollover• Scrolling via scroll bar• Scrolling via an anchor link• Automated cycling of graphics on a page• Turning of a page (print)

Scoring PLC: Determining the degree of Page Layout Change
PLC score = X + 2Y
X = # of regions that change (number of letters following arrow)
Y = # of reconfigured regions (# of letters—whichever is highest—on either side of the chevron)
The scoring is not “objective.” It’s a referencepoint for design discussions and decisions.
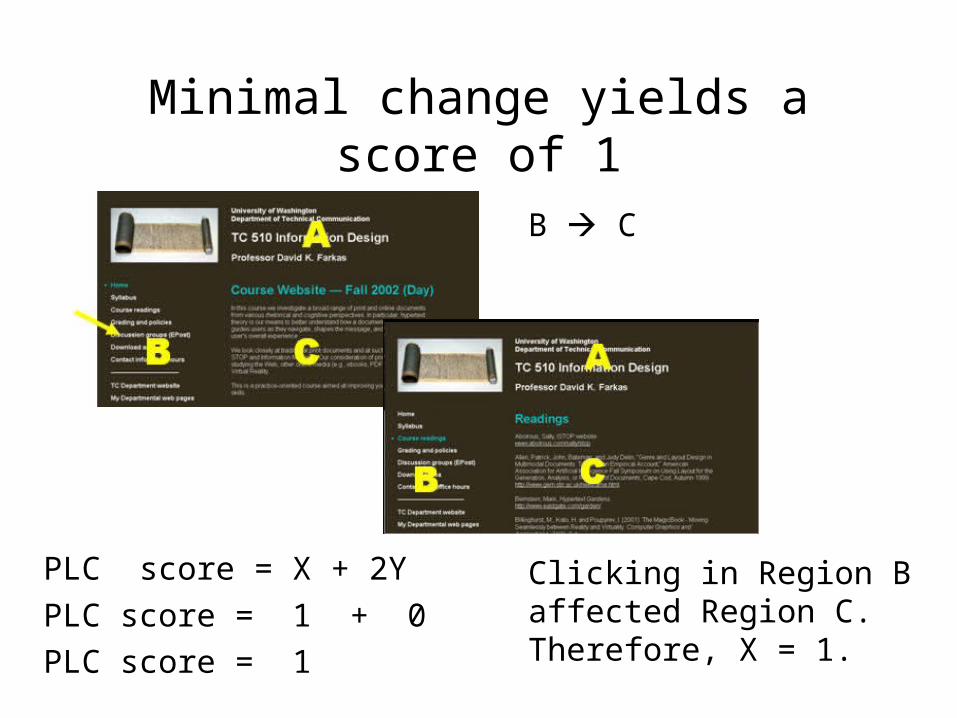
Minimal change yields a score of 1
B C
PLC score = X + 2Y
PLC score = 1 + 0
PLC score = 1
Clicking in Region B affected Region C. Therefore, X = 1.
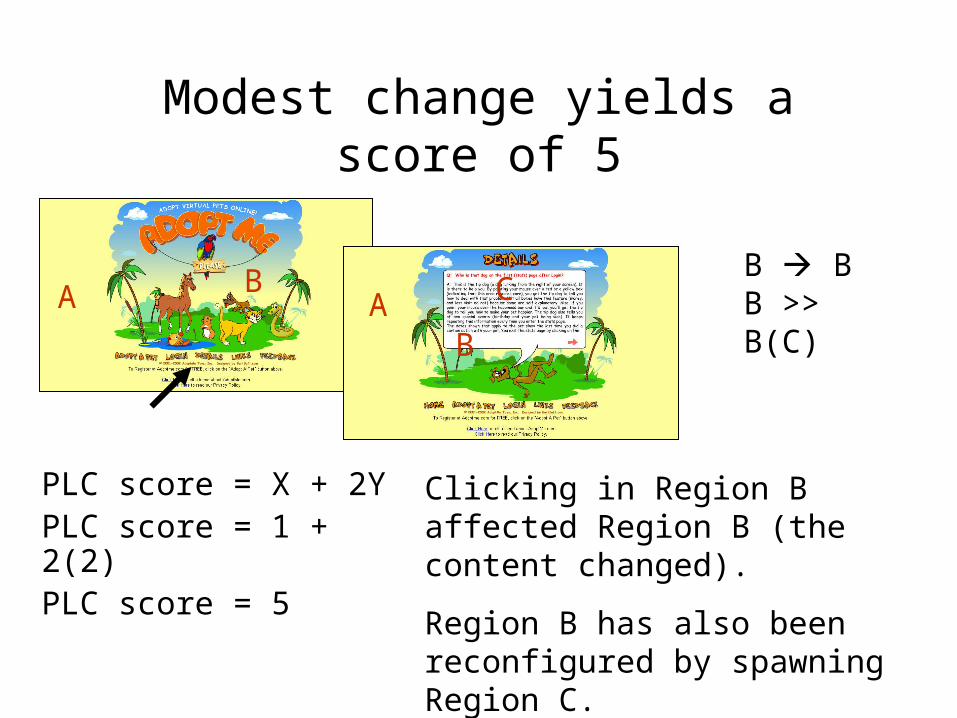
Modest change yields a score of 5
B BB >> B(C)
PLC score = X + 2YPLC score = 1 + 2(2)PLC score = 5
Clicking in Region B affected Region B (the content changed).
Region B has also been reconfigured by spawningRegion C.
A CBA
B

Extensive change yields ascore of 27
A
C
D E
F
B
G H
I A
C
D E
F
B
G
I
H
C A-I(A-I) >> (A-I)
PLC score = X + 2YPLC score = 9 + 2(9)PLC score = 27
All regions were affected and all were reconfigured.

A complex design with extensive change yields a score of 49
A
C
B
D1
F1
I G3
J
F3
F2 G1
G2F4
H
ACB
D
D2 A-JB-J >> B-D
D2
E1
E2
PLC score = X + 2YPLC score = 17 + 2 (16)PLC score = 49
All regions were affected. Region A was not reconfigured. Region B stretched. Regions C-J fused into Regions C and D.

Comparing PLC scores with visual complexity scores
It is worthwhile to compare how visual
complexity correlates with PLC. For example,
when the MSN pages scored 49 in PLC, there
was also a large drop in visual complexity from
141 to 54. Visual complexity can also increase
with PLC score.

Value of PLC
PLC promotes greater awareness of important
design variables. It helps designers– Identify non-standard navigation.– Identify design errors pertaining to PLC
and visual complexity.– Gauge PLC and visual complexity as
aspects of the overall user experience.
Uses of PLC
PLC does not directly tell you what is good or
bad. It invites such questions as these:– “Why do I see such different PLC scores
among pages serving a similar purpose?”– “Why does this pathway vary so much in
PLC scores?” – “Is this behavior typical of the genre?”

Conclusion: You can usefully represent the underlying structure and the appearance of a website
1. Node-link diagrams
2. Flowchart node-link diagrams
3. Page mock-ups
4. Visual hierarchy diagrams (with visual complexity scoring)
5. Page Layout Change (PLC) notation

The End