Embed Size (px)
Citation preview
IMPACT AND PROCESS EVALUATION OF AMEREN ILLINOIS COMPANY’S RESIDENTIAL APPLIANCE RECYCLING PROGRAM (PY5)Draft
Prepared for:
AMEREN ILLINOIS COMPANY
Prepared by
The Cadmus Group
Under Contract to:
OPINION DYNAMICS CORPORATION
1999 Harrison StreetSuite 1420Oakland, CA 94612(510) 444-5050
www.opiniondynamics.com
Contact: Mary Sutter, Vice President of Energy Evaluation
October 2013

TABLE OF CONTENTS
1. EXECUTIVE SUMMARY.............................................................................1
2. INTRODUCTION......................................................................................4
3. EVALUATION METHODS...........................................................................5
3.1 Data Sources and Analytical Methods...........................................................53.1.1 Process Analysis...................................................................................53.1.2 Impact Analysis....................................................................................6
3.2 Sampling and Survey Completes..................................................................93.2.1 Telephone Surveys...............................................................................9
4. RESULTS AND FINDINGS........................................................................11
4.1 Process Findings..........................................................................................114.1.1 Marketing and Outreach....................................................................12
4.2 Impact Results............................................................................................164.2.1 Participant verification.......................................................................164.2.2 Gross Impacts....................................................................................164.2.3 Net Impacts........................................................................................18
5. INPUTS FOR FUTURE PLANNING...............................................................21
5.1 Free Ridership.............................................................................................215.2 Spillover......................................................Error! Bookmark not defined.
5.3 Induced Replacement..................................Error! Bookmark not defined.
5.4 Final Net to Gross........................................................................................21
A. APPENDIX: DATA COLLECTION INSTRUMENTS...............................................23
B. APPENDIX: NTGR ALGORITHM................................................................24
C. APPENDIX: SURVEY FREQUENCIES............................................................26
opiniondynamics.com
Page

opiniondynamics.com
Page

TABLE OF TABLES
Table 1. Summary of Participant Verification Results.................................................1Table 2. PY4 ARP Program Impacts............................................................................2Table 3. Summary of Evaluation Methods..................................................................5Table 4. UEC Regression Algorithm............................................................................6Table 5. PY5 Mean Explanatory Variables...................................................................7Table 8. Ex Post Per-Unit Savings...............................................................................8Table 9. Survey Sample Size and Completes..............................................................9Table 10. ARP Survey Dispositions...........................................................................10Table 11. ARP Survey Response and Cooperation Rates..........................................10Table 10. PY5 ARP Unit Energy Savings (Without part-use adjustments).................17Table 13. PY4 and PY5 ARP Unit Energy Savings......................................................17Table 12. Historical Part-Use Factors by Category....Error! Bookmark not defined.
Table 13. PY5 Overall Part-use Factors by Appliance Prior and Likely Use........Error! Bookmark not defined.
Table 14. PY5 Overall Part-use Factors by Appliance Type.....Error! Bookmark not defined.
Table 15. PY5 Gross Per-Unit Savings.......................................................................18Table 16. PY5 ARP Total Program Gross Impacts by Appliance Type........................18Table 17. PY5 Net Per-Unit Savings..........................................................................19Table 18. PY5 Total Program Net Savings by Appliance Type...................................19Table 19. PY5 ARP Total Program Net Savings.........................................................19Table 20. Free Ridership by Refrigerator Designation.............Error! Bookmark not defined.
Table 21. Free Ridership Test for Significant Difference Between Usage..........Error! Bookmark not defined.
Table 22. Spillover Measures Reported by Program Participants...Error! Bookmark not defined.
opiniondynamics.com
Page

Table 23. AIU Refrigerators Induced Replacement by Year.....Error! Bookmark not defined.
Table 24. Induced Replacement Rates Comparison. Error! Bookmark not defined.
Table 25. Final Net-to-Gross Ratio............................................................................21Table 26. Refrigerator NTGR Benchmarking.............................................................22
TABLE OF FIGURES
Figure 1. Percent Change in Participation by Program Year.....................................12Figure 2. Participation by Month Compared to Four Comparably Mature Programs. 13Figure 3. PY5 Program Participation by Month..........................................................14Figure 4. PY4 Sources of Program Awareness..........................................................15Figure 5. Benchmarking Sources of Program Awareness.........................................16Figure 6. Inducted Replacement—Refrigerators.......Error! Bookmark not defined.
opiniondynamics.com
Page

Results and Findings
1. EXECUTIVE SUMMARY
The Ameren Illinois Company’s (AIC) Appliance Recycling Program (ARP) offers free recycling of refrigerators, freezers, and room air conditioners for residential and small commercial customers. AIC expected this program to garner approximately 8% of electric savings of its overall portfolio. Conservation Services Group (CSG) manages the program and advertising. Appliance Recycling Centers of America (ARCA) handles the implementation, which includes pick-up and recycling of the appliances as well as scheduling and customer service.To verify program participation and estimate Program Year 5 (PY5) savings, the evaluation team reviewed and analyzed the tracking database. We calculated savings estimates using a regression equation resulting from an earlier metering study of Illinois program participants as specified in the Illinois Statewide Technical Reference Manual (TRM), dated June 1, 2012. We applied NTGR adjustments based on PY3 evaluation activities and a new refrigerator NTGR to inform future evaluation years.For the process review, the team interviewed program managers from AIC, Conservation Services Group (CSG), and Appliance Recycling Centers of America (ARCA), the program implementer.
Impact ResultsGross Impacts
Verification was based on a sample of 140 participants who had recycled refrigerators in PY5. The survey was limited to refrigerators in PY5 and was designed specifically to address concerns from the PY4 evaluation that there may be significant differences in free ridership between primary and secondary appliances. The team applied the PY4 verification rate of 100% for freezers and air conditioners.
Table 1. Summary of Participant Verification Results
Recycling Measure
Participants
Sample Verified Sample
VerifiedParticipan
tsVerificatio
n RateRefrigerator 8,780 140 140 8,780 100%Freezer 2,899 70a 70 2,899 100%Air Conditioner 4 N/Ab N/A 4 100%Total 11,683 210 210 11,683 100%
a Applied results from PY4 verification
b Assumed similar verification to refrigerators and freezers
In 2012, the Illinois TRM introduced a change in the methodology for estimating the annual consumption for recycled refrigerators and freezers, which was based on an in situ metering study conducted in a similar program for Commonwealth Edison (ComEd) in 2012. The revised algorithm for estimating unit energy consumption
opiniondynamics.com
Page 1

Inputs for Future Planning
(UEC) decreased gross per-unit savings from PY4 to PY5: from 1,239 to 937 annual kWh for refrigerators and from 1,172 to 882 annual kWh for freezers. We also used our participant survey research to update the part-use factor (percentage of time the product is plugged in) for refrigerators in future evaluations. For PY5 impact calculations the team applied the part use factor specified in the TRM.
Net Impacts
Table 2 is a summary of PY5 program impacts.Table 2. PY5 ARP Program Impacts
Program
PY5 Ex Antea
Gross Savings
PY5 Ex Postb Gross
Savings
PY5 Ex Antea Net Savings
PY5 Ex Postb
Net Savings Net Realization
Ratec
MWh MW MWh MW MWh MW MWh MW
Refrigerator
5,768
1.09
7,216 1.1 4,46
2 0.8
45,70
1 0.88 128%
Freezer 1,957
0.33
2,243 0.3 1,60
5 0.2
7 1,839 0.25 115%
Air Conditioner
4 0.97 2 0.0
0 4 0.00 2 0.00 42%
Total 7,729
2.39
9,461
1.43
6,071
1.12
7,542
1.14 124%
a Ex ante from PY5 reported savings in tracking workbook for refrigerators and freezers, which were AIC’s pre-program estimates. Room AC ex ante based on PY3 results.b Ex post determined by adjusting part-use factors, net-to-gross ratio (NTGR), and verified participation.C Net realization rate= ex post net savings/ex ante net savings
To estimate PY5 net savings, the evaluation team applied the PY3 net-to-gross ratio (NTGR) of 0.79 for refrigerators, 0.82 for freezers, and 1.0 for air conditioners. Ex ante per unit gross savings estimates were lower than ex post, due to a difference in the mix of units recycled compared to that assumed for tracking purposes and the slightly higher part-use factor. This resulted in an overall realization rate of 129%.
Process ResultsWhile AIC exceeded its internal program savings goal for the year, participation decreased by 18% from PY4, falling from 14,242 to 11,679 appliances. AIC anticipated this decline in participation, which is typically seen in ARP programs elsewhere as the pool of unused or unnecessary secondary refrigerators and freezers is taken out of the market.
opiniondynamics.com
Page

Inputs for Future Planning
When compared to other utility programs, we find similar participation drop-offs. The participation decrease in PY5 may also be due to PY4 participation being unusually high. PY4 was the first full year the program allowed primary appliance recycling. In addition, the program offered higher incentive levels in PY4. Much of the same program marketing occurred in PY5 as PY4: AIC continued its retail partnership with Sears, continued to double the nonprofit referral bonus from $10 to $20 during the winter holiday season (whereby a nonprofit, which the participant names as a referral entity, receives a payment), and continued the use of the Energy Hog as the program mascot. AIC discontinued television advertising in PY5 as it was not perceived to be cost effective, but added a spring sweepstakes for a $2,000 ENERGY STAR® appliance shopping spree; anyone who recycled an appliance during January through March were entered for the prize.
RecommendationsThe team provides the following key recommendations:
While the overall marketing strategy appears to be successful in making the program recognizable AIC should consider utilizing customer segmentation methods (such as Neilsen’s PRIZM segmentation methodology) in order to identify customers with higher response rates to advertising efforts. This could help mitigate the trend of declining participation as the program matures.
Consider ways to identify customers that are likely to have older appliances perhaps by identifying longer established households. This could result in an increase per-unit savings if marketing can increase the proportion of older units and increase the average age of appliances that are recycled through the program.
Consider cross-promotion of AIC programs. ARP participants tend to be extremely satisfied with their program experience and report being likely to participate in other programs. The cross-promotion can be both to and from the ARP program and can include: conveying information about ARP with the Residential Efficient Products Program (REEP) program rebate checks or leaving behind a flyer with other residential program information when ARP appliances are picked up.
Consider a bonus for participants who refer others to the ARP. A substantial portion of participants were referred to the program by a friend or family member, and ARP participants report that they are likely to recommend the program to others.
opiniondynamics.com
Page

Inputs for Future Planning
2. INTRODUCTION
AIC’s ARP offers free recycling of refrigerators and freezers to residential and small commercial customers. Participants receive a $50 incentive payment, and the program implementer picks up and hauls the appliance to its recycling facility in Springfield, Illinois. The program not only removes older, inefficient appliances from use within AIC’s service territory but disposes of them in an environmentally responsible manner.1 CSG serves as the primary implementer for all AIC programs, and ARCA serves as a subcontractor, with primary responsibility for implementing the ARP.AIC electric customers qualify for the program if they are served under Residential Delivery Service (Rate DS-1) or Small General Delivery Service (Rate DS-2). Further, equipment must meet the following requirements to qualify for the program:
Located on account premises and operational at the time of pick-up; Full-sized units between 10 and 27 cubic feet; and Household-type models (commercial refrigerators and freezers do not
qualify).Additionally, the program picks up and recycles working room air conditioners when removing refrigerators or freezers, although air conditioners do not qualify for incentives.The program is marketed through several channels including: traditional bill inserts, direct mail, and printed materials featuring the easily recognizable Energy Hog character. The Energy Hog not only appears on printed materials but also makes live appearances at community events and also is featured on a prominent banner at a local mall. Additionally, the program provides a referral bonus for nonprofit organizations when they are named as having referred participants to the program.
1 This includes disposal of oils, PCBs, mercury, and CFC-11 foam, and recycling of CFC-12, HFC-134a, plastic, glass, steel, and aluminum.
opiniondynamics.com
Page

Results and Findings
3. EVALUATION METHODS
3.1 DATA SOURCES AND ANALYTICAL METHODSTable 3 summarizes the methods used to evaluate the PY5 program.
Table 3. Summary of Evaluation Methods
TaskPY5
Impact
PY5 Proce
ss
Forward
Looking
Details
Program Staff In-Depth Interviews
√ √
Three program staff interviews provided insight into design and delivery, as well as potential refinements or improvements to the current program. Stakeholders included the staff from AIC, CSG, and ARCA.
Participant Survey √ √ √
We surveyed 142 refrigerator recycling participants (70 primary and 72 secondary) to assess program implementation, verify participation, calculate part-use, and calculate and compare free ridership between participants recycling primary vs. secondary refrigerators. (While we worked with the ComEd EM&V contractors to ensure consistent survey questions and methods, due to budget constraints we did not conduct retailer surveys as in ComEd, but rather incorporated knowledge obtained from other similar evaluations to account for how market actors would dispose appliances.
Database Review √ √
Reviewed all data in the tracking database to ensure collection of appropriate data to inform the evaluation.
Gross Savings Calculation
√
Calculated estimates of annual UEC via the 2012 Illinois TRM, using inputs from the PY5 program tracking database. Adjust per-unit savings for part-use, as calculated from participant survey results, to determine gross savings.
Net-to-Gross Calculation √
Using PY5 participant data, updated net savings adjustments to be applied in PY7.
opiniondynamics.com
Page 5

Inputs for Future Planning
3.1.1 PROCESS ANALYSISThe evaluation team used surveys to assess participant satisfaction, sources of program awareness, and wait times for appliance pick-ups. To understand how the program evolved during PY5, we interviewed ARCA staff, AIC’s ARP manager, and CSG’s ARP manager. Interview topics included the following:
How has program design changed since its launch? What impacts did these changes cause? Which marketing approaches have been used, and what results did they
produce? What challenges does the program face?
3.1.2 IMPACT ANALYSIS
Gross ImpactsUsing PY5 tracking data, participant survey data, and the algorithms specified in the TRM, the evaluation team calculated evaluated gross savings. The team verified participation by comparing the number and type of units in the tracking database to the number and types of appliances given by survey respondents and also verified that pick-up dates were within the PY5 program period.
Estimated Annual Consumption
The TRM algorithm, which bases its coefficients on a metering study conducted for ComEd in PY4,2 generated savings estimates for both refrigerators and freezers.Holding all other variables constant, the coefficient of each independent variable indicates the influence of that variable on annual consumption:
A positive coefficient indicates an upward influence on consumption. A negative coefficient indicates a downward effect on consumption.
The coefficient value indicates the marginal impact of a one-point increase in the independent variable on the UEC. (For instance, a 1-cubic foot increase in refrigerator size results in a 13.52 kWh increase in average annual consumption.) For dummy variables, the coefficient value represents the difference in consumption if a given condition holds true. For example, the coefficient for the variable indicating that a refrigerator uses a manual defrost unit is -381.23; all else being equal, this means a manual defrost refrigerator consumes 381.23 kWh more
2 May 31, 2012, memo from Opinion Dynamics: “Fridge & Freezer Recycle Rewards Program PY4 Metering Study: DRAFT Savings Results.” Energy savings are based on an average 30-year TMY temperature of 51.1 degrees.
opiniondynamics.com
Page

Inputs for Future Planning
annually than an automatic defrost unit. Table 4 lists the TRM inputs and coefficients.
Table 4. UEC Regression AlgorithmVariable Description Coefficient Coefficient
Intercept -103.39Freezer dummy (=1 if freezer) 433.40Side-by-side dummy (= 1 if side-by-side) 614.91Chest dummy (=1 if chest freezer) -490.78Single door dummy (=1 if single door) -797.90Age 23.93Pre-1993 dummy (=1 if manufactured pre-1993) 289.82Capacity (Cubic Feet) 13.52Manual defrost dummy (= 1 if manual defrost) -381.23
Extrapolation
Using the PY5 tracking database, the evaluation team calculated the corresponding characteristics (the independent variables) for participating appliances to feed into the TRM algorithm. Table 5 summarizes program averages or proportions for each independent variable.
Table 5. PY5 Mean Explanatory Variables
Independent Variables Participant Population Mean Value(Refrigerators Freezers
Freezer dummy 0.00 1.00Side-by-side dummy 0.19 0.00Chest dummy 0.00 0.47Single door dummy 0.07 0.00Age 24.50 29.56Pre-1993 dummy 0.65 0.81Capacity (cubic feet) 18.36 15.92Manual defrost dummy (= 1 if manual defrost) 0.12 0.99
Participant survey data informed the proportion of units located in garages, porches, and patios for the demand savings algorithm (below). The TRM specifies unit demand savings as:
ΔkW=[(Side∗0.04920)+(Freezer∗0.01988)+(Age∗0.01199)+(Age2∗−0.0001443)+(Capacity∗0.001156)+(ManualDefrost∗−0.04503)+(GaragePorchPatio∗0.04681)−0.09662]∗Part UseFactor
Part-Use
The part-use factor accounts for appliances that were not plugged in year-round prior to participation. For PY5 the team applied the part use factor of 0.877 specified in the TRM which applies to both refrigerators and freezers. We also conducted
opiniondynamics.com
Page

Inputs for Future Planning
primary research on PY5 refrigerators that can apply to future evaluations. This analysis is summarized in Appendix D.
Net SavingsThe program’s NTGR, as calculated previously in PY2, was based on the self-report approach methodology, established in the 2004–2005 California Residential Appliance Recycling Program evaluation and continued in more recent evaluations, both in California and elsewhere in the United States.3 The PY2 NTGR was the most recently analysis performed that meets the Illinois NTG framework.The NTG adjustment negates energy savings from participants whose appliances would have been removed from service independent of the program (free riders), but it credits the program for destroying units that either would have continued to be used within participating homes or would have been transferred to other users for continued use. If the participating appliance had not been recycled through the ARP, it would have followed one of four other scenarios:
1. The unit would have been kept by the household, but not used.2. The unit would have been kept by the household and used.3. The unit would have been discarded by the household through a method
resulting in the unit’s destruction. 4. The unit would have been transferred by the household to another entity for
continued use elsewhere.Scenarios 1 and 3 indicate free ridership. Under these two scenarios, free ridership occurs because the units would have been removed from the grid even though they were not recycled through the program. As a result, the program cannot claim energy savings generated by recycling these appliances.The evaluation team adjusted gross savings for free ridership using PY3 evaluation results4 to determine net savings where net savings equals:
Net Savings=Gross savings∗(1−free rider% )
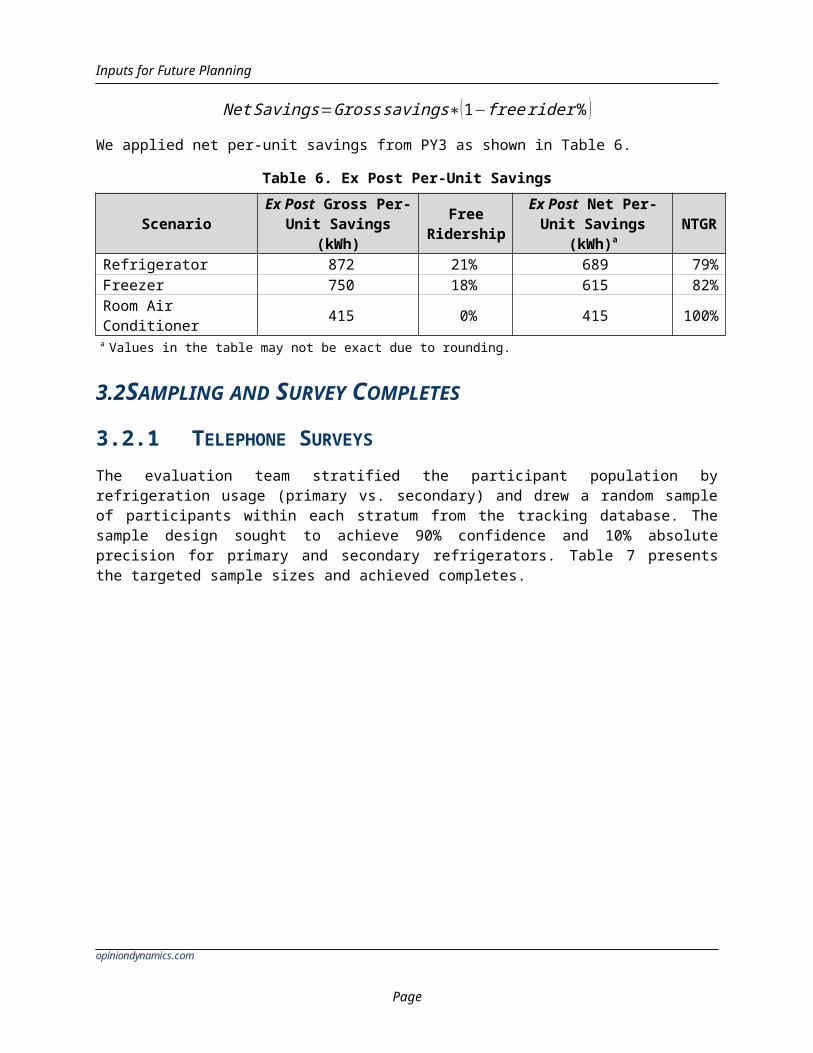
We applied net per-unit savings from PY3 as shown in Table 6. Table 6. Ex Post Per-Unit Savings
Scenario Ex Post Gross Per-Unit Savings
Free Ridership
Ex Post Net Per-Unit Savings
NTGR
3 ADM Associates, Inc. “Evaluation Study of the 2004-05 Statewide Residential Appliance Recycling Program”. April,2008.http://www.calmac.org/publications/EM&V_Study_for_2004-2005_Statewide_RARP_-_Final_Report.pdf.4 PY3 net savings used PY2 participant survey data to adjust for free ridership.
opiniondynamics.com
Page

Inputs for Future Planning
(kWh) (kWh)a
Refrigerator 872 21% 689 79%Freezer 750 18% 615 82%Room Air Conditioner 415 0% 415 100
% a Values in the table may not be exact due to rounding.
3.2 SAMPLING AND SURVEY COMPLETES
3.2.1 TELEPHONE SURVEYSThe evaluation team stratified the participant population by refrigeration usage (primary vs. secondary) and drew a random sample of participants within each stratum from the tracking database. The sample design sought to achieve 90% confidence and 10% absolute precision for primary and secondary refrigerators. Table 7 presents the targeted sample sizes and achieved completes.
Table 7. Survey Sample Size and Completes
Measure Population Quota
Completed
SurveysPrimary Refrigerator 968 70 70Secondary Refrigerator 7,812 70 72Total 8,780 140 142
Survey Dispositions and Response Rate
The survey response rate equals the number of completed interviews divided by the total number of potentially eligible respondents in the sample. The evaluation team calculated the response rate using the standards and formulas set forth by the American Association for Public Opinion Research (AAPOR).5 For various reasons, we could not determine the eligibility of all sample units through the survey process, choosing rather to use AAPOR Response Rate 3 (RR3). This includes an estimate of eligibility for these unknown sample units. The formulas used to calculate RR3 follow (Table 8 provides definitions of letters used in the formulas):
E = (I + R + NC) / (I + R + NC + e)RR3 = I / ((I + R + NC) + (E*U))
5 AAPOR. Standard Definitions: Final Dispositions of Case Codes and Outcome Rates for Surveys. 2001. http://www.aapor.org/AM/Template.cfm?Section=Standard_Definitions2&Template=/CM/ContentDisplay.cfm&ContentID=3156
opiniondynamics.com
Page

Inputs for Future Planning
We also calculated a cooperation rate (the number of completed interviews divided by the total number of eligible sample units contacted). In essence, the cooperation rate provides the percentage of participants completing an interview out of all participants speaking with the evaluation team. We used AAPOR Cooperation Rate 3 (COOP3), calculated as:
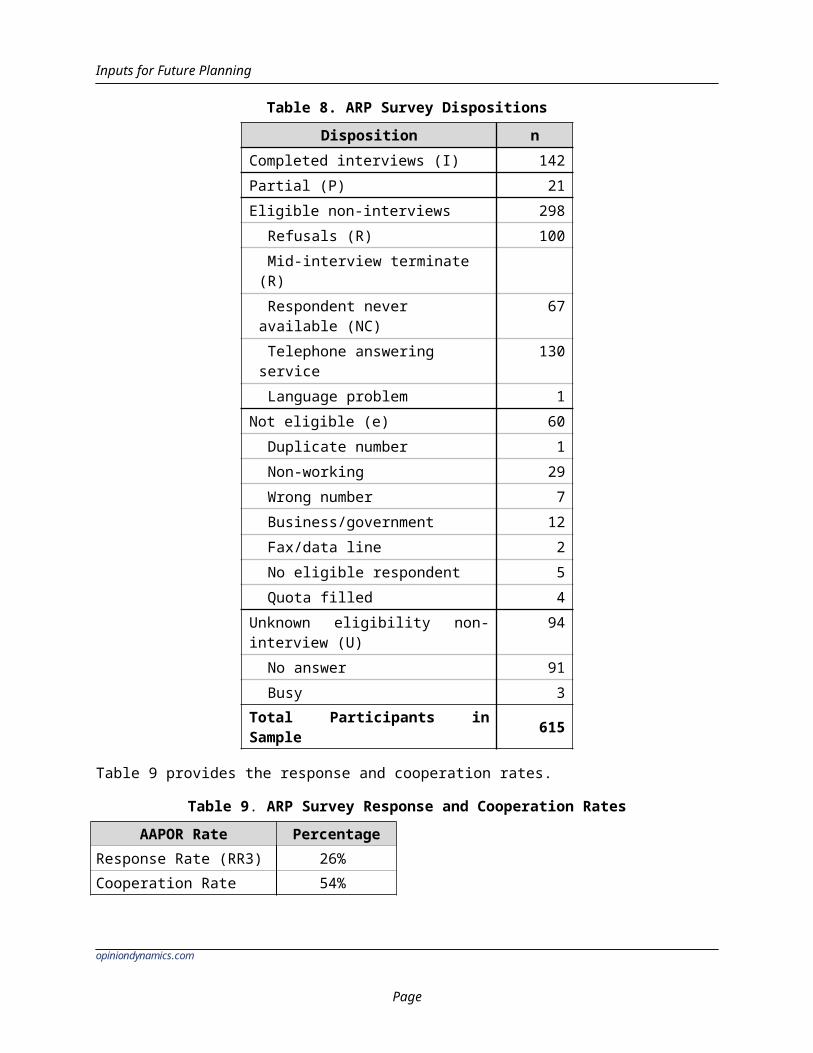
COOP3 = I / (I + P+ R)The survey with ARP participants fielded from August 6 to August 15, 2013. Table 8 shows the final survey dispositions.
Table 8. ARP Survey DispositionsDisposition n
Completed interviews (I) 142Partial (P) 21Eligible non-interviews 298
Refusals (R) 100 Mid-interview terminate (R) Respondent never available (NC)
67
Telephone answering service 130 Language problem 1
Not eligible (e) 60 Duplicate number 1 Non-working 29 Wrong number 7 Business/government 12 Fax/data line 2 No eligible respondent 5 Quota filled 4
Unknown eligibility non-interview (U)
94
No answer 91 Busy 3
Total Participants in Sample 615
Table 9 provides the response and cooperation rates.Table 9. ARP Survey Response and Cooperation Rates
AAPOR Rate PercentageResponse Rate (RR3) 26%Cooperation Rate 54%
opiniondynamics.com
Page

Results and Findings
4. RESULTS AND FINDINGS
4.1 PROCESS FINDINGSAll interviewed stakeholders felt the program succeeded in meeting its participation and savings goals in PY5. Overall, the marketing strategy appears to have functioned very well, with the program meeting or exceeding participation targets in all but one month. Even with a drop in participation from 14,242 to 11,679 appliances—a decrease of 18%—the program exceeded its goal of 11,000 appliances. In contrast, program staff reported the Sears retail partnership generated less participation than anticipated. PY4 was the first year that the program was open to primary appliances and also the first full year at the increased incentive level. Most programs experience a peak in participation that levels off over time as the program matures and the appliances that customers are most eager to discard have already been collected. Customers who use or need their appliances the least are the first to participate and take advantage of the program. To place this change in ARP participation in context, Figure 1 shows participation over time for several appliance recycling programs. There are two important notes regarding these programs:
None of the programs, with the exception of AIC’s (in PY1 through mid PY3), had restrictions on primary appliances.
Neither AIC nor the Mid-Atlantic utility have a full first-program year and therefore participation was markedly lower. The partial first year was not included in the figure.
With the exception of the Southwest utility (which had a marginal increase of 1% in PY2) and AIC, participation in all of the programs peaks in the first full-program year and then declines over time. AIC’s program is likely the exception because PY4 was the first year when the program was open to primary units and the incentive was increased, thereby dramatically increasing participation. In a sense, PY4 could be considered the first year that the program was operating at full potential. It is therefore necessary to adjust participation goals each year based on estimates of the likelihood there are fewer remaining potential appliances.An additional consideration in the decline in participation is the severe flooding that occurred in the spring. Weather could have been an influence in the drop in participation in April and May (Figure 2).
opiniondynamics.com
Page 11

Inputs for Future Planning
Figure 1. Percent Change in Participation by Program Year
4.1.1 MARKETING AND OUTREACHCSG designed and managed the PY5 marketing strategy, largely implemented by ARCA. The marketing strategy changed most substantially in presenting the spring sweepstakes, when participants who signed up between January and March 2013 were entered in a contest that awarded a $2,000 shopping spree for ENERGY STAR appliances. Aside from this additional tactic, the strategy remained consistent with PY4. In particular, the Energy Hog remained a marketing focus, appearing in printed materials, as a live mascot at public events, and on a large banner in a local shopping mall.The program also continued to reward nonprofit organizations for referring customers to the program. When customers sign up for the program via referral, they receive the usual incentive and are also asked to identify the nonprofit making the referral. That nonprofit then receives a $10 bonus for each customer it refers. During PY5’s winter months, AIC doubled the referral bonus for nonprofits to increase participation during a period with typically lower participation. The change also sought to build upon the holiday season’s feelings of generosity. The increased referral bonus helped maintain steady 7% overall participation in November and December 2012 while participation peaked in March 2013, the last
opiniondynamics.com
Page
Inputs for Future Planning
month of the spring sweepstakes. The seasonal participation resembles that from other ARP programs the evaluation team has reviewed. Figure 2 compares participation by month with four other utility programs of comparable maturity. Though participation did drop from peak levels during months where the referral bonus was doubled, it stayed relatively constant rather than declining as sharply as other utilities. There is also a notable increase in March when the spring sweepstakes was under way and participation reached near-peak levels similar to August and October.
Figure 2. Participation by Month Compared to Four Comparably Mature Programs
opiniondynamics.com
Page

Inputs for Future Planning
Figure 3 shows total participation by month in PY5.Figure 3. PY5 Program Participation by Month
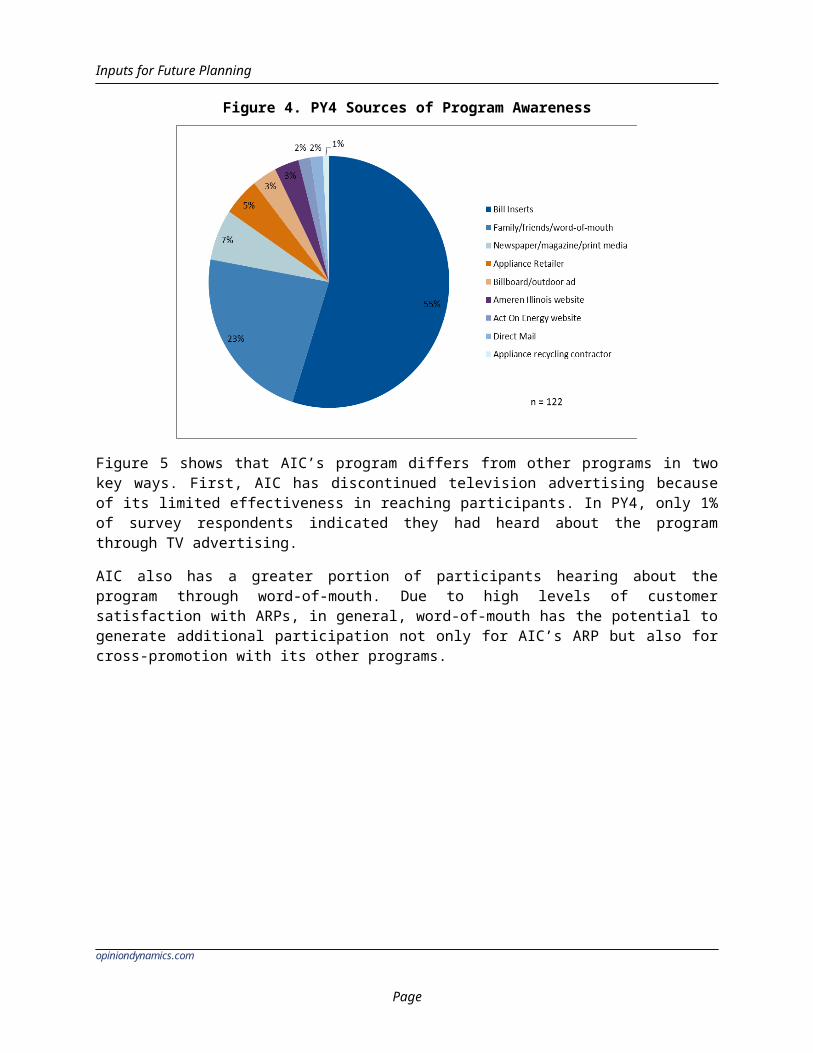
ARCA continued the retailer partnership with Sears stores within AIC’s service territory. Through this partnership, Sears’s appliance departments provided information about the program at computer kiosks, where customers could sign up directly. When delivering a new appliance, Sears would remove participants’ old appliances for recycling. ARCA then picked up appliances from Sears for recycling. CSG and the ARCA program manager indicated they had expected a greater impact on participation from the Sears partnership. However, there was an increase in the proportion of participants coming through the Sears retail partnership, from less than 0.5% of participants in PY4 to 2.5% in PY5. As shown in Figure 4, bill inserts remained the most common source of participant awareness of the program (55%). AIC sent several rounds of bill inserts in PY5. Family, friends, and word-of-mouth served as the second most common sources (23%). Newspapers and print media came in third (7%).
opiniondynamics.com
Page
Inputs for Future Planning
Figure 4. PY4 Sources of Program Awareness
Figure 5 shows that AIC’s program differs from other programs in two key ways. First, AIC has discontinued television advertising because of its limited effectiveness in reaching participants. In PY4, only 1% of survey respondents indicated they had heard about the program through TV advertising.AIC also has a greater portion of participants hearing about the program through word-of-mouth. Due to high levels of customer satisfaction with ARPs, in general, word-of-mouth has the potential to generate additional participation not only for AIC’s ARP but also for cross-promotion with its other programs.
opiniondynamics.com
Page

Inputs for Future Planning
Figure 5. Benchmarking Sources of Program Awareness
4.2 IMPACT RESULTS
4.2.1 PARTICIPANT VERIFICATIONCSG and ARCA maintain a program database to track recycled units. The database includes the following information:
Customer name and address Unit type (refrigerator/freezer/room air conditioner) Pick-up description (first or second unit picked up from household) Incentive amounts Unit characteristics, including age, size, defrost type, and configuration AIC’s estimated energy and demand savings
The team verified participation by comparing the number and type of units in the tracking database to survey responses, and also verified that pick-up dates were within the PY5 program period. All records sampled proved accurate.
4.2.2 GROSS IMPACTSUpon publication of the TRM, the evaluation team calculated unit energy savings using program data applied to the algorithm. The team then calculated gross
opiniondynamics.com
Page

Inputs for Future Planning
energy savings by adjusting unit energy savings for part-use from information gathered in the participant survey.
Gross Annual Unit Energy Consumption
The evaluation team calculated gross energy savings, using the TRM algorithm specified in Table 4and the input values calculated from the program tracking data in Table 5. As an example, the freezer UEC equation is given below:
FreezerUEC=¿
Table 10 shows unit energy consumption using the TRM equation. Table 10. PY5 ARP Unit Energy Savings (Without part-use adjustments)
Measure Unit Energy Savings (kwh)
Unit Demand Savings (kw)
Refrigerator Recycling 937 0.14Freezer Recycling 882 0.12Air Conditioner Recycling 415 0.33
PY4 annual consumption estimates were based on the U.S. Department of Energy’s (DOE) testing protocols rather than in-home metering data. The estimates between the two methodologies differ primarily for two reasons:
First, metering the appliance in its original location captures impacts of critical external factors on appliance energy use (such as door openings, unit locations, and weather); these factors cannot be accounted for when relying on DOE databases, which contain data on units metered under controlled conditions.
Second, most existing DOE databases estimate energy consumption at the time of appliance manufacture, not at unit retirement. Consequently, evaluations require devising and applying additional assumptions to account for appliance degradation. In-home metering data reflect how recycled appliances were actually used in homes at the time of retirement.
Differences in UEC estimates are shown in Table 11.Table 11. Difference in PY4 and PY5 ARP Unit Energy Savings
Recycling Measure
PY4 Unit PY5 UnitEnergy Savings (kWh)
Demand Savings
(kW)
Energy Savings (kWh)
Demand Savings (kW)
Refrigerator 1,239 0.15 937 0.14Freezer 1,172 0.14 882 0.12Air Conditioner 968 0 415 0.33*We compare PY5 to PY4 in this table, however AIC’s ex ante estimates are not based on PY4, but rather were AIC’s pre-program predictions for PY5.
opiniondynamics.com
Page

Inputs for Future Planning
Part-Use
As not all appliances recycled would have been used for a full year (had they not been recycled), the evaluation team adjusted the UECs using part-use factors specified in the TRM. These part-use factors, applied to unit energy savings, produce gross unit energy savings, as shown in Table 12.
Table 12. PY5 Gross Per-Unit Savings
Measure Unit Savings (kWh)
Unit Savings
(kW)
Part-Use
Factor
Gross Unit
Savings (kWh)
Gross Unit
Savings (kW)
Refrigerator 937 0.14 0.88 822 0.12Freezer 882 0.12 0.88 774 0.11Room Air Conditioner 415 0.33 1 415 0.33
Total Gross Impacts
Table 13 shows total program gross savings for PY5. The gross realization rate reflects the updated part-use factor and savings estimated with the TRM algorithm. Ex ante savings for refrigerators and freezers were reported in the PY5 tracking data, which used a 0.00019 coincidence factor for refrigerators and 0.00017 for freezers. Per-unit ex ante gross savings were 657 kWh and 675 for freezers, respectively, which were AIC’s pre-program estimates for PY5.
Table 13. PY5 ARP Total Program Gross Impacts by Appliance Type
Recycling Measure
Verified Participant
Unitsa
Ex Ante Gross
Savings (MWh)b
Ex Post Gross
Savings (MWh)c
Gross Realization
Rate d
Refrigerator 8,780 5,768 7,216 125%Freezer 2,899 1,957 2,243 115%Air Conditioner 4 4 2 43%Total 11,683 7,729 9,461 122%a Participant verification was 100%.b Ex ante gross impacts for refrigerators and freezers are from the PY5 tracking database. Ex ante savings for air conditions are from PY3 evaluation resultsc. Ex post gross impacts are adjusted by part-use.d Gross realization rate = ex post gross savings/ex ante gross savings
4.2.3 NET IMPACTSThe team applied PY2 NTGR results to PY5 gross savings. PY2 research adjusted savings for free ridership as shown in the following equation:
Net per−unit savings=Gross per unit savings∗(1−free rider%)
opiniondynamics.com
Page

Inputs for Future Planning
Free Ridership
The evaluation team applied PY2 free ridership estimates, following the NTG framework, which used responses to participant survey questions regarding what would have happened to the appliance had the program not been available (Table14).
Table 14. PY5 Net Per-Unit Savings
MeasureGross Unit
Savings (kWh)
Gross Unit Savings
(kW)NTG
RNet Unit Savings (kWh)
Net Unit Savings
(kW)Refrigerator 822 0.12 0.79 649 0.10Freezer 774 0.11 0.82 634 0.09Room Air Conditioner 415 0.33 1.00 415 0.33
Table 15 shows total program net savings for PY5.Table 15. PY5 Total Program Net Savings by Appliance Type
MeasureVerified
Participant – Units
Ex Post Gross
Savings (MWh)
Ex Post Gross
Savings (MW)
NTG Ratio
Ex Post Net
Savings (MWh)
Ex Post Net
Savings (MW)
Refrigerator 8,780 7,216 1.06 0.79 5,701 0.83Freezer 2,899 2,243 0.32 0.82 1,839 0.26Air Conditioner 4 2 0.00 1 2 0.00Totals 11,683 9,461 1.37 n/a 7,542 1.10
The Net Impacts section of the methods provides details of NTGR methods and scenarios for determining free ridership. Because the air conditioner units are picked up as an additional service the evaluation team applied an NTGR of 1.0.
Table 16. PY5 ARP Total Program Net Savings
Recycling Program
PY5 Ex Ante Net Savingsa
PY5 Ex Post Net Savingsb Net Realization
RateMWh MW MWh MWRefrigerator 4,462 0.84 5,701 0.83 128%Freezer 1,605 0.27 1,839 0.26 115%Air Conditioner 4 0.00 2 0.00 42%Total 6,071 1.12 7,542 1.10 124%c
a Ex ante from PY5 reported savings in tracking workbook for refrigerators and freezers. Room air conditioner ex ante based on PY3 results.b Ex post determined by adjusting part-use factors, NTGR, and verified participation.C Net realization rate=ex post net savings/ex ante net savings
Total PY5 ARP net program savings equaled 7,542 MWh with an overall net realization rate of 124%, which is derived from differences in the ex ante gross per-
opiniondynamics.com
Page

Inputs for Future Planning
unit savings values and the ex post gross per-unit savings. The refrigerator ex ante savings were approximately 657 kWh and freezers were 675 kWh per unit.
opiniondynamics.com
Page
Inputs for Future Planning
5. INPUTS FOR FUTURE PLANNING
For future planning (to apply to PY7), the evaluation team estimated new NTGR’s based on the participant survey conducted from PY5 participants. The NTGR considers the following three factors:
Part Use Free ridership Spillover Induced replacement
1. Table 17. PY5 Overall Part-use Factors by Appliance TypeMeasure Part-Use Factor
Refrigerators 0.93Freezers* 0.85* From PY4
5.1 FINAL NET TO GROSSThe final NTGR is calculated in Table 18 below where net savings are equal to:
Net Savings=Gross per unit savi ngs−free ridership−induced replacement+spillover
All survey inputs in the net savings adjustments for freezers are based on PY4 survey results since no freezer participants were surveyed in PY5. Net savings adjustments are calculated on an average per-unit basis.
Table 18. Final Net-to-Gross Ratio
Recycling Measure
Gross Per-Unit Savings (kWh)
Free Ridershi
p
Induced Replacem
entSpillov
erNet Per-
Unit Savings
Final NTG Ratio
Refrigerator 872 368 40 25 489 56%Freezer 750 270 22 7 465 62%
As shown in Table 19 the NTGR for refrigerators decreased from 64% in PY4 to 56% in PY5. This is due to two factors. First, free ridership was lower in PY4 at 37% compared to 42% in PY5. This is not due to the additional primary survey respondents. Surprisingly, secondary appliance survey respondents were more likely to be free riders than the primary respondents, though again, the difference
opiniondynamics.com
Page

Inputs for Future Planning
was not statistically significant. The second factor is the inclusion of induced replacement, which had an overall impact of approximately 5% for refrigerators. 6
Overall, the NTGR is in the range of results for comparably mature programs that allow both primary and secondary appliances using similar methodology. It is important to note that the PG&E, SCE, and SDG&E results do not include induced replacement.
Table 19. Refrigerator NTGR Benchmarking
Utility NTGR – Refrigerators
AIC PY5 56%AIC PY4 64%PG&E 06-08 51%SCE 06-08 56%SDG&E 06-08 58%PG&E, SCE, and SDG&E results do not include induced replacement.
6 Induced kWh relative to gross per-unit savings 40/872 = 4.6%.
opiniondynamics.com
Page

Appendix: Data Collection Instruments
A. APPENDIX: DATA COLLECTION INSTRUMENTS
opiniondynamics.com
Page 23
Appendix: NTGR Algorithm
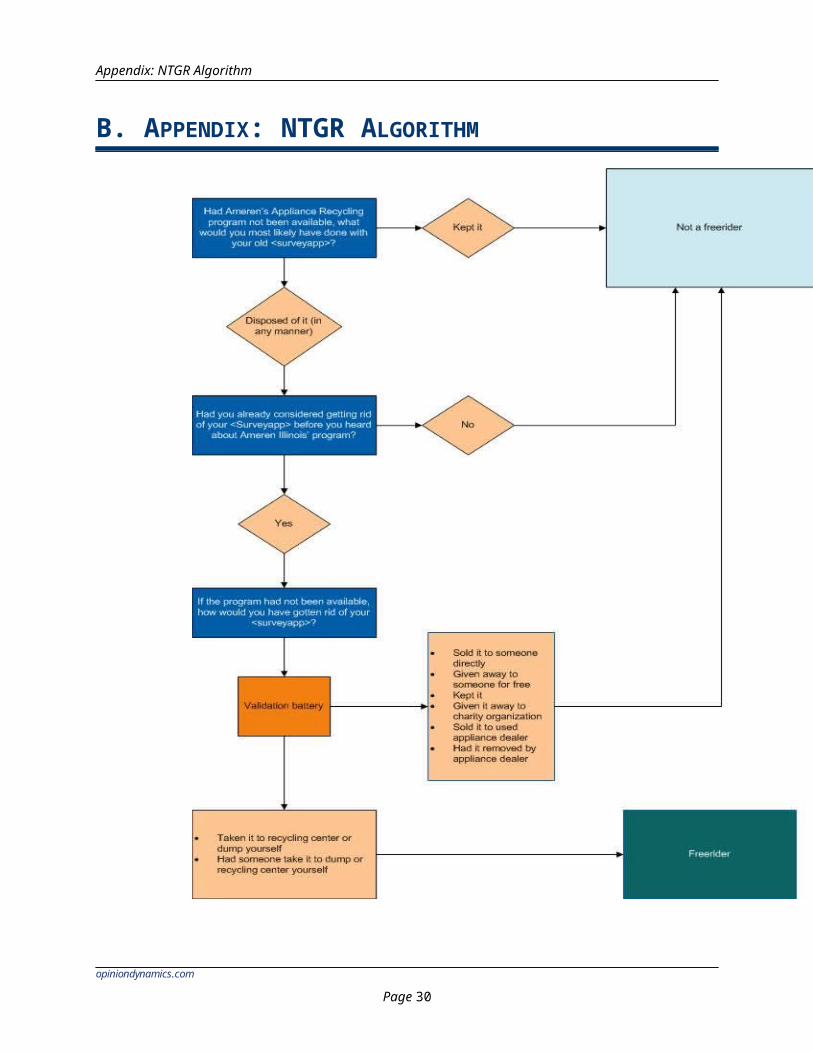
B. APPENDIX: NTGR ALGORITHM
opiniondynamics.com
Page 24

Appendix: NTGR Algorithm
From top to bottom on the left:E9 informs the first grey box in the diagram, E7 the second grey box. E17 informs the third.F1 through F4 are the validation battery before the final brown box which is informed by F3 and F5.
opiniondynamics.com
Page

Appendix: Survey Frequencies
C. APPENDIX: SURVEY FREQUENCIES
opiniondynamics.com
Page 26

Appendix: Gross Savings
D. APPENDIX: GROSS SAVINGS
PART USEThe part-use factor accounts for appliances that were not plugged in year-round prior to participation. Based on responses to the telephone survey, each participant could be characterized as one of three part-use categories outlined below. Our part-use methodology uses information from surveyed customers. However, the final estimate of part-use reflects not how appliances were previously operated, but how appliances were likely to have been operated had they not been recycled. For example, a primary refrigerator operating year-round may become a secondary appliance used only for the holidays. The methodology accounts for these potential shifts in usage types. Specifically, part-use is calculated using a weighted average of the following prospective part-use categories and factors:
Appliances that would have run full-time (part-use = 1.0) Appliances that would not have run at all (part-use = 0.0) Appliances that would have operated a portion of the year (part-use is
between 0.0 and 1.0) Using information gathered through the participant survey, the evaluation team undertook the following multistep process to determine part-use.
1. We determined if recycled refrigerators were primary or secondary units. 2. We asked those participants who indicated they had recycled a secondary
refrigerator if the refrigerator was unplugged, operated year-round, or operated for a portion of the preceding year. (We assume all primary units were operated year-round.)
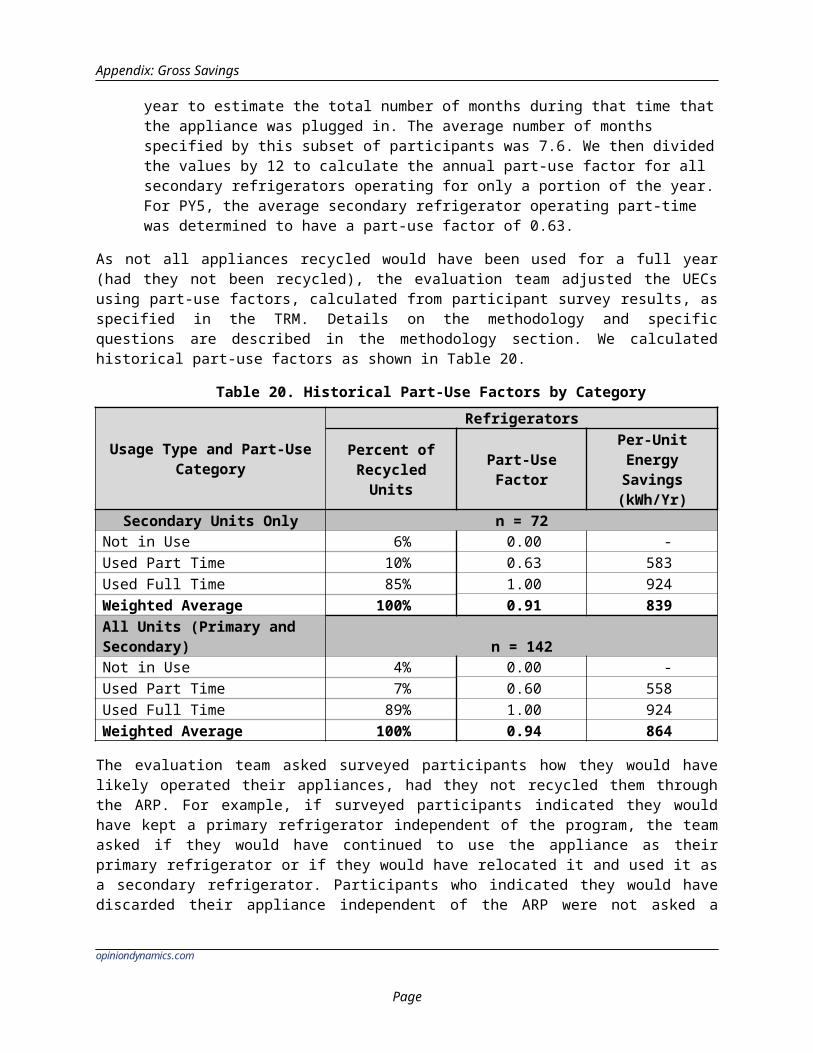
3. We asked those participants who indicated that their secondary refrigerator was operated for only a portion of the preceding year to estimate the total number of months during that time that the appliance was plugged in. The average number of months specified by this subset of participants was 7.6. We then divided the values by 12 to calculate the annual part-use factor for all secondary refrigerators operating for only a portion of the year. For PY5, the average secondary refrigerator operating part-time was determined to have a part-use factor of 0.63.
As not all appliances recycled would have been used for a full year (had they not been recycled), the evaluation team adjusted the UECs using part-use factors, calculated from participant survey results, as specified in the TRM. Details on the methodology and specific questions are described in the methodology section. We calculated historical part-use factors as shown in Table 20.
opiniondynamics.com
Page

Appendix: Gross Savings
Table 20. Historical Part-Use Factors by Category
Usage Type and Part-Use Category
RefrigeratorsPercent of Recycled
UnitsPart-Use Factor
Per-Unit Energy Savings (kWh/Yr)
Secondary Units Only n = 72Not in Use 6% 0.00 -Used Part Time 10% 0.63 583Used Full Time 85% 1.00 924Weighted Average 100% 0.91 839All Units (Primary and Secondary) n = 142Not in Use 4% 0.00 -Used Part Time 7% 0.60 558Used Full Time 89% 1.00 924Weighted Average 100% 0.94 864
The evaluation team asked surveyed participants how they would have likely operated their appliances, had they not recycled them through the ARP. For example, if surveyed participants indicated they would have kept a primary refrigerator independent of the program, the team asked if they would have continued to use the appliance as their primary refrigerator or if they would have relocated it and used it as a secondary refrigerator. Participants who indicated they would have discarded their appliance independent of the ARP were not asked a similar question as the future usage would have been determined by another customer.This allowed the part-use factors listed in Table 20 to be combined with participants’ self-reported action, had the program not been available. This resulted in the distribution of likely future usage scenarios and corresponding part-use estimates. Table 21 shows the weighted average of these future scenarios, which produced the overall part-use factor for refrigerators (0.93).7
7 As the future usage of discarded refrigerators remains unknown, the evaluation team applied the weighted average part-use value of all refrigerators that would have been discarded independent of the program (0.93). This approach acknowledges the next owner of discarded appliances might use them as primary or secondary units.
opiniondynamics.com
Page

Appendix: Gross Savings
Table 21. PY5 Overall Part-use Factors by Appliance Prior and Likely Use
Use Prior to Recycling
Likely Use Independent of Recycling
RefrigeratorPart-Use Factor
Percent of Participants
PrimaryKept (as primary unit) 1.00 2%Kept (as secondary unit) 0.91 2%Discarded 0.94 29%
Secondary Kept 0.91 11%Discarded 0.94 55%
Overall 0.93 100%
Using this part-use factor, the evaluation team adjusted unit energy savings to arrive at gross unit energy savings. The PY5 participant survey focused only on refrigerator participants.
opiniondynamics.com
Page
Appendix: Net Savings
E. APPENDIX: NET SAVINGS
FREE RIDERSHIPFor PY5 the evaluation team designed the survey sample to test if free ridership rates differed between participants who recycled primary refrigerators and participants who recycled secondary refrigerators. Using a stratified sample of 70 respondents who recycled primary units and 72 respondents who recycled secondary units, we asked the respondents what they would have done with their appliance had they chosen not to participate. Based on their responses we calculated free ridership scores for each grouping as shown in Table 23.8
If the participating appliance had not been recycled through the ARP, it would have followed one of four other scenarios:
1. The unit would have been kept by the household, but not used.2. The unit would have been kept by the household and used.3. The unit would have been discarded by the household through a method
resulting in the unit’s destruction. The unit would have been transferred by the household to another entity for continued use elsewhere. Scenarios 1 and 3 indicate free ridership. Under these two scenarios, free ridership occurs because the units would have been removed from the grid even though they were not recycled through the program. As a result, the program cannot claim energy savings generated by recycling these appliances.To determine the percentage of participants in each of the scenarios—and, therefore, assess the program’s free ridership, the evaluation team asked each surveyed participant what would likely have occurred to the appliance had it not been recycled by AIC. The participants gave these responses:
Kept it and continued to operate the appliance. Kept it but stored it unplugged indefinitely. Sold it to a private party, either by running an ad or to someone they knew. Sold it to a used appliance dealer. Gave it to a private party, such as a friend or neighbor.
8 Don’t know responses are not included. There were 12 respondents who did not know how they would have disposed of their appliance had they not participated in the program and two gave open ended responses that did not fit into one of the categories (“find out what was legal” and “some other way”).
opiniondynamics.com
Page 30
Appendix: Net Savings
Gave it to a charity organization, such as Goodwill Industries or a church. Had it removed by the dealer from whom the new or replacement appliance
was purchased. Hauled it to the dump or recycling center. Hired someone to haul it away for junking or dumping.
To ensure the highest quality of responses possible—and in an effort to mitigate possible socially responsible response bias—the team asked some participants follow-up questions to test the reliability of their initial response. For example, through interviews with market actors conducted for other recent evaluations, the team determined that used appliance dealers are unlikely to purchase appliances more than 15 years old. We then asked participants who had an appliance more than 15 years old and who indicated they “would have sold their unit to a used appliance dealer” what they would have likely done had they been unable to sell the unit to a dealer. The responses to this subsequent question facilitated the assessment of free ridership. (In the team’s experience, this dynamic, market research-based approach to surveying improves the reliability of the hypothetical self-reported actions of participants.)Upon validating the participant’s hypothetical action to the extent possible through an iterative approach, the evaluation team assessed whether each participant’s response indicated free ridership. Some responses clearly did: “I would have taken it to the dump or recycling center myself.” Other responses clearly did not indicate free ridership, as the appliance would have remained active within the participating home (“I would have kept it”) or elsewhere within service territory (“I would have given it to a family member, neighbor, or friend”).The results are shown in Table 22. The results for both primary and secondary refrigerators are within the range typically observed in APR programs and similar to the 37% free ridership in PY4.
Table 22. Free Ridership by Refrigerator Designation
Designation Free RidershipPrimary 38%Secondary 46%Total 42%
To test if free ridership scores for each designation differed significantly, the evaluation team ran a two-sample t-test. The test produced a p-value of 0.331—a value too large to reject the null hypothesis at 95% confidence. This indicates that there is no statistically significant difference in free ridership between primary and secondary refrigerators.
opiniondynamics.com
Page

Appendix: Net Savings
Table 23. Free Ridership Test for Significant Difference between Usage
Use nFree
Ridership
Std Err t-statistic p-value
Primary 61 38% 6% 0.98 0.33Secondary 67 46% 6%
In PY4, the difference in free ridership between primary and secondary refrigerators was around 1% with primary refrigerators more likely to be free riders. The difference in PY4 was also not statistically significant. Therefore, the evaluation team concluded that free ridership does not vary significantly by refrigerator designation and recommends an overall refrigerator free ridership rate of 42% for future evaluations.
SPILLOVERParticipants may be influenced by the program to install other energy-efficiency measures outside of AIC’s programs. The evaluation team asked participants to list additional, energy-efficient items they installed on their own, that is, not through an AIC program. We also asked them to rate the program’s influence on their installation decision. If a customer said the program was extremely influential in their installation decision and they were determined to be induced replacements, we counted that measure as spillover. For each type of measure, the evaluation team estimated energy savings, either in comparison to federal standard efficiency using the ENERGY STAR calculator or using savings estimates from other AIC programs.9 As shown in Error: Referencesource not found, insulation, heat pump, and refrigerator savings accounted for nearly three-quarters of spillover.
9 The team calculated the spillover rate for refrigerators and freezers together.
opiniondynamics.com
Page

Appendix: Net Savings
Table 24. Spillover Measures Reported by Program Participants
Spillover Measure Units Installed
Per-Unit Savings (kWh)
Total kWh
ENERGY STAR Refrigerator1 6 119 713ENERGY STAR Washer 9 41 366ENERGY STAR Water Heater 9 43 383Insulation 6 183 1,098ENERGY STAR Heat Pump 1 944 944ENERGY STAR Furnace 2 109 218Total 32 N/A 3,7231 Induced replacements are not eligible for spillover savings because induced replacement adjustments already account for whether or not the replacement appliance was ENERGY STAR or standard efficiency
The total spillover reported by the participant sample equaled 3,723 kWh, while total savings of the participant sample equaled 132,277 kWh. The following equation provided the program spillover rate:
Spillover%=Total participant sample spillover(kWh)Total participant sample savings(kWh)
= 3,723 kWh129,865 kWh
=2.87%
INDUCED REPLACEMENTThe TRM states that evaluators must account for the energy consumption of replacement units only when the program induces the replacement (that is, when the participant would not have purchased the replacement refrigerator in the absence of the recycling program). For non-induced replacements, the energy consumption of the replacement appliance is not material to the savings analysis since that appliance would have been acquired, regardless of the program. However, the acquisition of another appliance in conjunction with participation in the ARP does not necessarily indicate induced replacement. The evaluation team relied on information from the PY5 participant survey to determine if any of the replacement refrigerators acquired by participants were induced by the program. First, we determined the total number of replacements—induced or otherwise. Survey results indicated the ARP continued to reduce the total number of used appliances operating within AIC’s service territory and raised the average efficiency of the active appliance stock. Next, we estimated the proportion of replacements induced by customer participation in the ARP. Specifically, we asked each participant indicating they replaced the participating appliance, “Were you already planning to replace your refrigerator before you decided to recycle your existing unit through AIC’s program?”
opiniondynamics.com
Page

Appendix: Net Savings
Since a $50 incentive is unlikely to be sufficient motivation for most participants to purchase an otherwise-unplanned replacement unit (which can cost $500 to $2,000), the evaluation team asked a follow-up question of participants who responded with “no.” This question sought to confirm the participants’ assertion that only the program itself caused them to replace an appliance: “Let me just make sure I understand: The program motivated you to replace your refrigerator, is that correct?”Induced replacement is not solely motivated by a program incentive. In fact, the program’s help removing the unit from the home (which often requires dealing with stairs) is a major driver of an appliance recycling program’s high levels of customer satisfaction. In this context, assistance removing an appliance, which the customer otherwise may not have been able to remove independently, can also generate induced replacement. To further increase the reliability of these self-reported actions, the induced replacement analysis also considered: (1) whether or not the refrigerator served as a primary unit; and (2) the participant’s stated intentions in the program’s absence. For example, if a participant indicated the primary refrigerator would have been discarded independently of the program, the evaluation team did not consider the replacement induced since it would be extremely unlikely for the participant to live without a primary refrigerator. For all other usage types and stated intention combinations, however, induced replacement presents a viable response. The analysis indicated that only a portion of the total replacements were induced, with 14 of the 106 refrigerator replacements induced by the program. Thus, the program induced 11% of all refrigerator participants to acquire a replacement unit.Combining the number of induced replacements with energy consumption data from the ENERGY STAR website, the evaluation team calculated the energy impact of induced replacements on the ARP’s net savings. PY5-induced replacement generated a per-unit increase of 40 kWh for refrigerators as shown in Figure 6.
Figure 6. Inducted Replacement—Refrigerators
Table 25 compares the induced replacement findings from PY4 and PY5 for refrigerators. The number of respondents reporting induced replacement increased from 3% in PY4 to 11% in PY5.
Table 25. AIU Refrigerators Induced Replacement by Year Progra Participants New Unit Average Percent of
opiniondynamics.com
Page
Appendix: Net Savings
m Year
Reporting Program-Induced
Replacement (%)
Consumption (kWh)
Replacement Adjustment
(kWh)Gross Per-
Unit Savings
PY5 11% 365 40 5%PY4 3% 476 14 1%
The PY5 survey shifted the focus of the induced replacement questions from the incentive to the program as a whole. The survey also included a follow-up question for those reporting induced replacement that asked what exactly about the program influenced their decision. Responses indicated that the incentive (40%) and the convenience of the home pick-up (60%) were the major reasons for induced replacement. By broadening the induced replacement question beyond just the program incentive, this change may have contributed to a higher induced replacement rate.Respondents were also more likely to have replaced their appliance in PY5, an increase from 67% to 74% replaced. This also contributed to the increase in induced replacement by approximately 1%.The remainder of the increase reflects the fact that individual point estimates vary from year to year.Table 26 compares rates of induced replacement from several recent evaluations. Though on the higher end, the induced replacement rate for AIC is within the range of other evaluation findings at 11%.
Table 26. Induced Replacement Rates ComparisonUtility and
Corresponding AIC Program Year
Induced Replacement
RateAIC (PY5) 11%Midwest Utility (PY4) 13%Northwest Utility (PY 5 and 6) 4%Midwest Utility 2 (PY1) 5%Mid-Atlantic (PY3) 11%
opiniondynamics.com
Page


