Embed Size (px)
Citation preview

Illinois Statewide Technical Reference Manual – Volume 3: Residential Measures
Illinois Statewide Technical Reference
Manual for Energy Efficiency
Version 6.0
Volume 3: Residential Measures
DRAFTJanuary 25th, 2017
Effective:January 1st, 2018
IL TRM v6.0 Vol. 3_January 25th, 2017_DRAFT Page 1 of 296

Illinois Statewide Technical Reference Manual – Volume 3: Residential Measures
[INTENTIONALLY LEFT BLANK]
IL TRM v6.0 Vol. 3_January 25th, 2017_DRAFT Page 2 of 296

Illinois Statewide Technical Reference Manual – Volume 3: Residential Measures
VOLUME 1: OVERVIEW AND USER GUIDE
VOLUME 2: COMMERCIAL AND INDUSTRIAL MEASURES
VOLUME 3: RESIDENTIAL MEASURES........................................................55.1 APPLIANCES END USE...................................................................................................................................... 5
5.1.1 ENERGY STAR Air Purifier/Cleaner............................................................................................................5
5.1.2 ENERGY STAR and ENERGY STAR Most Efficient Clothes Washers............................................................8
5.1.3 ENERGY STAR Dehumidifier....................................................................................................................14
5.1.4 ENERGY STAR Dishwasher.......................................................................................................................17
5.1.5 ENERGY STAR Freezer.............................................................................................................................22
5.1.6 ENERGY STAR and CEE Tier 2 Refrigerator..............................................................................................26
5.1.7 ENERGY STAR Room Air Conditioner.......................................................................................................33
5.1.8 Refrigerator and Freezer Recycling.........................................................................................................38
5.1.9 Room Air Conditioner Recycling..............................................................................................................43
5.1.10 ENERGY STAR Clothes Dryer...............................................................................................................46
5.1.11 ENERGY STAR Water Coolers..............................................................................................................50
5.2 CONSUMER ELECTRONICS END USE................................................................................................................... 53
5.2.1 Advanced Power Strip – Tier 1................................................................................................................53
5.2.2 Tier 2 Advanced Power Strips (APS) – Residential Audio Visual..............................................................56
5.3 HVAC END USE........................................................................................................................................... 60
5.3.1 Air Source Heat Pump.............................................................................................................................60
5.3.2 Boiler Pipe Insulation..............................................................................................................................68
5.3.3 Central Air Conditioning..........................................................................................................................71
5.3.4 Duct Insulation and Sealing.....................................................................................................................77
5.3.5 Furnace Blower Motor............................................................................................................................90
5.3.6 Gas High Efficiency Boiler........................................................................................................................94
5.3.7 Gas High Efficiency Furnace....................................................................................................................99
5.3.8 Ground Source Heat Pump....................................................................................................................105
5.3.9 High Efficiency Bathroom Exhaust Fan..................................................................................................123
5.3.10 HVAC Tune Up (Central Air Conditioning or Air Source Heat Pump)................................................126
5.3.11 Programmable Thermostats.............................................................................................................130
5.3.12 Ductless Heat Pumps........................................................................................................................135
5.3.13 Residential Furnace Tune-Up............................................................................................................147
5.3.14 Boiler Reset Controls........................................................................................................................152
5.3.15 ENERGY STAR Ceiling Fan.................................................................................................................155
IL TRM v6.0 Vol. 3_January 25th, 2017_DRAFT Page 5 of 296

Illinois Statewide Technical Reference Manual – Volume 3: Residential Measures
5.3.16 Advanced Thermostats.....................................................................................................................159
5.4 HOT WATER END USE................................................................................................................................. 167
5.4.1 Domestic Hot Water Pipe Insulation.....................................................................................................167
5.4.2 Gas Water Heater.................................................................................................................................170
5.4.3 Heat Pump Water Heaters....................................................................................................................174
5.4.4 Low Flow Faucet Aerators.....................................................................................................................179
5.4.5 Low Flow Showerheads.........................................................................................................................187
5.4.6 Water Heater Temperature Setback.....................................................................................................193
5.4.7 Water Heater Wrap...............................................................................................................................196
5.4.8 Thermostatic Restrictor Shower Valve..................................................................................................199
5.4.9 Shower Timer........................................................................................................................................206
5.5 LIGHTING END USE..................................................................................................................................... 210
5.5.1 Compact Fluorescent Lamp (CFL)..........................................................................................................210
5.5.2 ENERGY STAR Specialty Compact Fluorescent Lamp (CFL)....................................................................218
5.5.3 ENERGY STAR Torchiere........................................................................................................................228
5.5.4 Exterior Hardwired Compact Fluorescent Lamp (CFL) Fixture...............................................................233
5.5.5 Interior Hardwired Compact Fluorescent Lamp (CFL) Fixture...............................................................237
5.5.6 LED Specialty Lamps..............................................................................................................................243
5.5.7 LED Exit Signs........................................................................................................................................254
5.5.8 LED Screw Based Omnidirectional Bulbs...............................................................................................258
5.6 SHELL END USE.......................................................................................................................................... 267
5.6.1 Air Sealing.............................................................................................................................................267
5.6.2 Basement Sidewall Insulation...............................................................................................................277
5.6.3 Floor Insulation Above Crawlspace.......................................................................................................284
5.6.4 Wall and Ceiling/Attic Insulation...........................................................................................................290
5.7 MISCELLANEOUS......................................................................................................................................... 297
5.6.5 High Efficiency Pool Pumps...................................................................................................................297
VOLUME 4: CROSS-CUTTING MEASURES AND ATTACHMENTS
IL TRM v6.0 Vol. 3_January 25th, 2017_DRAFT Page 6 of 296
Illinois Statewide Technical Reference Manual – 5.1.1 ENERGY STAR Air Purifier/Cleaner
Volume 3: Residential Measures5.1 Appliances End Use5.1.1 ENERGY STAR Air Purifier/Cleaner
DESCRIPTION
An air purifier (cleaner) meeting the efficiency specifications of ENERGY STAR is purchased and installed in place of a model meeting the current federal standard.
This measure was developed to be applicable to the following program types: TOS, NC.
If applied to other program types, the measure savings should be verified.
DEFINITION OF EFFICIENT EQUIPMENT
The efficient equipment is defined as an air purifier meeting the efficiency specifications of ENERGY STAR as provided below.
Must produce a minimum 50 Clean Air Delivery Rate (CADR) for Dust1 to be considered under this specification.
Minimum Performance Requirement: = 2.0 CADR/Watt (Dust) Standby Power Requirement: = 2.0 Watts Qualifying models that perform secondary consumer functions
(e.g. clock, remote control) must meet the standby power requirement. UL Safety Requirement: Models that emit ozone as a byproduct of air cleaning must meet UL Standard
867 (ozone production must not exceed 50ppb)
DEFINITION OF BASELINE EQUIPMENT
The baseline equipment is assumed to be a conventional unit2.
DEEMED LIFETIME OF EFFICIENT EQUIPMENT
The measure life is assumed to be 9 years3.
DEEMED MEASURE COST
The incremental cost for this measure is $70.4
LOADSHAPE
Loadshape C53 - Flat
COINCIDENCE FACTOR
The summer peak coincidence factor for this measure is assumed to be 100 % (the unit is assumed to be always on).
1 Measured according to the latest ANSI/AHAM AC-1 (AC-1) Standard 2 As defined as the average of non-ENERGY STAR products found in EPA research, 2011, ENERGY STAR Qualified Room Air Cleaner Calculator.3 ENERGY STAR Qualified Room Air Cleaner Calculator. 4 Ibid
IL TRM v6.0 Vol. 3_January 25th, 2017_DRAFT Page 5 of 296
Illinois Statewide Technical Reference Manual – 5.1.1 ENERGY STAR Air Purifier/Cleaner
Algorithm
CALCULATION OF SAVINGS
ELECTRIC ENERGY SAVINGS
ΔkWh = kWhBase - kWhESTAR
Where:
kWhBASE = Baseline kWh consumption per year5
= see table below
kWhESTAR = ENERGY STAR kWh consumption per year6
= see table below
Clean Air Delivery Rate (CADR)CADR used in calculation (midpoint)
Baseline Unit Energy Consumption (kWh/year)
ENERGY STAR Unit Energy Consumption (kWh/year)
ΔkWH
CADR 51-100 75 441 148 293CADR 101-150 125 733 245 488CADR 151-200 175 1025 342 683CADR 201-250 225 1317 440 877CADR Over 250 300 1755 586 1169
SUMMER COINCIDENT PEAK DEMAND SAVINGS
∆kW = ∆kWh/Hours *CF
Where:
∆kWh = Gross customer annual kWh savings for the measure
Hours = Average hours of use per year
= 5844 hours7
CF = Summer Peak Coincidence Factor for measure
= 66.7%8
Clean Air Delivery Rate ΔkWCADR 51-100 0.033CADR 101-150 0.056CADR 151-200 0.078CADR 201-250 0.100CADR Over 250 0.133
NATURAL GAS SAVINGS
N/A
5 ENERGY STAR Qualified Room Air Cleaner Calculator.6 Ibid.7 Consistent with ENERGY STAR Qualified Room Air Cleaner Calculator assumption of 16 hours per day (16 * 365.25 = 5844).8 Assumes that the purifier usage is evenly spread throughout the year, therefore coincident peak is calculated as 5844/8766 = 66.7%.
IL TRM v6.0 Vol. 3_January 25th, 2017_DRAFT Page 6 of 296
Illinois Statewide Technical Reference Manual – 5.1.1 ENERGY STAR Air Purifier/Cleaner
WATER IMPACT DESCRIPTIONS AND CALCULATION
N/A
DEEMED O&M COST ADJUSTMENT CALCULATION
There are no operation and maintenance cost adjustments for this measure.9
MEASURE CODE: RS-APL-ESAP-V02-160601
REVIEW DEADLINE: 1/1/2023
9 Some types of room air cleaners require filter replacement or periodic cleaning, but this is likely to be true for both efficient and baseline units and so no difference in cost is assumed.
IL TRM v6.0 Vol. 3_January 25th, 2017_DRAFT Page 7 of 296

Illinois Statewide Technical Reference Manual – 5.1.1 ENERGY STAR Air Purifier/Cleaner
5.1.2 ENERGY STAR and ENERGY STAR Most Efficient Clothes Washers
DESCRIPTION
This measure relates to the installation of a clothes washer meeting the ENERGY STAR, or ENERGY STAR Most Efficient minimum qualifications. Note if the DHW and dryer fuels of the installations are unknown (for example through a retail program) savings should be based on a weighted blend using RECS data (the resultant values (kWh, therms and gallons of water) are provided). The algorithms can also be used to calculate site specific savings where DHW and dryer fuels are known.
This measure was developed to be applicable to the following program types: TOS, NC.
If applied to other program types, the measure savings should be verified.
DEFINITION OF EFFICIENT EQUIPMENT
Clothes washer must meet the ENERGY STAR or ENERGY STAR Most Efficient minimum qualifications, as required by the program.
DEFINITION OF BASELINE EQUIPMENT
The baseline condition is a standard sized clothes washer meeting the minimum federal baseline as of March 201510.
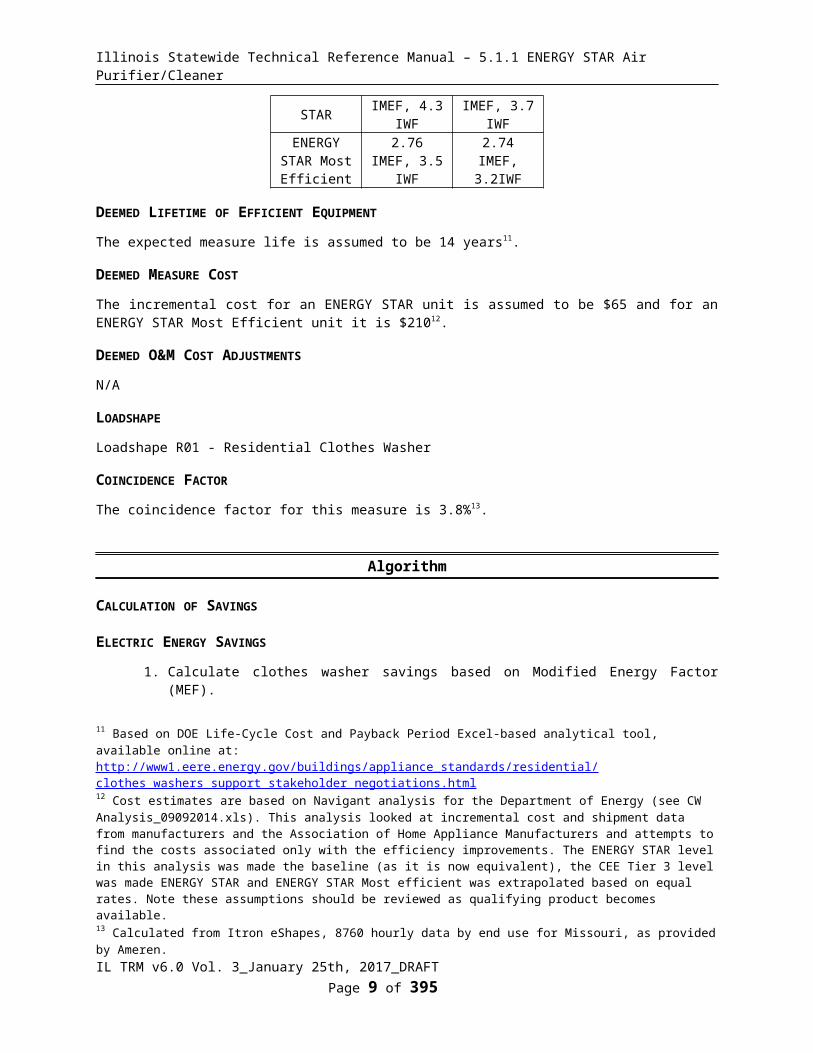
Efficiency Level
Top loading >2.5 Cu ft
Front Loading >2.5 Cu ft
Federal Standard
1.29 IMEF, 8.4 IWF
1.84 IMEF, 4.7 IWF
ENERGY STAR 2.06 IMEF, 4.3 IWF
2.38 IMEF, 3.7 IWF
ENERGY STAR Most Efficient
2.76 IMEF, 3.5 IWF
2.74 IMEF, 3.2IWF
DEEMED LIFETIME OF EFFICIENT EQUIPMENT
The expected measure life is assumed to be 14 years11.
DEEMED MEASURE COST
The incremental cost for an ENERGY STAR unit is assumed to be $65 and for an ENERGY STAR Most Efficient unit it is $21012.
DEEMED O&M COST ADJUSTMENTS
N/A
10 See http://www1.eere.energy.gov/buildings/appliance_standards/product.aspx/productid/39.11 Based on DOE Life-Cycle Cost and Payback Period Excel-based analytical tool, available online at:http://www1.eere.energy.gov/buildings/appliance_standards/residential/clothes_washers_support_stakeholder_negotiations.html12 Cost estimates are based on Navigant analysis for the Department of Energy (see CW Analysis_09092014.xls). This analysis looked at incremental cost and shipment data from manufacturers and the Association of Home Appliance Manufacturers and attempts to find the costs associated only with the efficiency improvements. The ENERGY STAR level in this analysis was made the baseline (as it is now equivalent), the CEE Tier 3 level was made ENERGY STAR and ENERGY STAR Most efficient was extrapolated based on equal rates. Note these assumptions should be reviewed as qualifying product becomes available.
IL TRM v6.0 Vol. 3_January 25th, 2017_DRAFT Page 8 of 296

Illinois Statewide Technical Reference Manual – 5.1.1 ENERGY STAR Air Purifier/Cleaner
LOADSHAPE
Loadshape R01 - Residential Clothes Washer
COINCIDENCE FACTOR
The coincidence factor for this measure is 3.8%13.
Algorithm
CALCULATION OF SAVINGS
ELECTRIC ENERGY SAVINGS
1. Calculate clothes washer savings based on Modified Energy Factor (MEF).
The Modified Energy Factor (MEF) includes unit operation, water heating and drying energy use: "MEF is the quotient of the capacity of the clothes container, C, divided by the total clothes washer energy consumption per cycle, with such energy consumption expressed as the sum of the machine electrical energy consumption, M, the hot water energy consumption, E, and the energy required for removal of the remaining moisture in the wash load, D" 14.
The hot water and dryer savings calculated here assumes electric DHW and Dryer (this will be separated in Step 2).
IMEFsavings15 = Capacity * (1/IMEFbase - 1/IMEFeff) * Ncycles
Where
Capacity = Clothes Washer capacity (cubic feet)
= Actual. If capacity is unknown assume 3.45 cubic feet 16
IMEFbase = Integrated Modified Energy Factor of baseline unit
= 1.6617
IMEFeff = Integrated Modified Energy Factor of efficient unit
= Actual. If unknown assume average values provided below.
Ncycles = Number of Cycles per year
= 29518
IMEFsavings is provided below based on deemed values19:
13 Calculated from Itron eShapes, 8760 hourly data by end use for Missouri, as provided by Ameren.14 Definition provided on the Energy star website.15 IMEFsavings represents total kWh only when water heating and drying are 100% electric.16 Based on the average clothes washer volume of all units that pass the new Federal Standard on the California Energy Commission (CEC) database of Clothes Washer products accessed on 08/28/2014. If utilities have specific evaluation results providing a more appropriate assumption for homes in a particular market or geographical area then that should be used.17 Weighted average IMEF of Federal Standard rating for Front Loading and Top Loading units. Weighting is based upon the relative top v front loading percentage of available non-ENERGY STAR product in the CEC database.18 Weighted average of 295 clothes washer cycles per year (based on 2009 Residential Energy Consumption Survey (RECS) national sample survey of housing appliances section, state of IL: http://www.eia.gov/consumption/residential/data/2009/If utilities have specific evaluation results providing a more appropriate assumption for single-family or multi-family homes, in a particular market, or geographical area then that should be used.19 IMEF values are the weighted average of the new ENERGY STAR specifications. Weighting is based upon the relative top v
IL TRM v6.0 Vol. 3_January 25th, 2017_DRAFT Page 9 of 296

Illinois Statewide Technical Reference Manual – 5.1.1 ENERGY STAR Air Purifier/Cleaner
Efficiency Level IMEF IMEFSavings (kWh)
Federal Standard 1.66 0.0ENERGY STAR 2.26 163ENERGY STAR Most Efficient 2.74 242
2. Break out savings calculated in Step 1 for electric DHW and electric dryer
∆kWh = [Capacity * 1/IMEFbase * Ncycles * (%CWbase + (%DHWbase * %Electric_DHW) + (%Dryerbase * %Electric_Dryer))] - [Capacity * 1/IMEFeff * Ncycles * (%CWeff + (%DHWeff * %Electric_DHW) + (%Dryereff * %Electric_Dryer))]
Where:
%CW = Percentage of total energy consumption for Clothes Washer operation (different for baseline and efficient unit – see table below)
%DHW = Percentage of total energy consumption used for water heating (different for baseline and efficient unit – see table below)
%Dryer = Percentage of total energy consumption for dryer operation (different for baseline and efficient unit – see table below)
Percentage of Total Energy Consumption20
%CW %DHW %DryerBaseline 7.6% 31.2% 61.2%ENERGY STAR 8.1% 23.4% 68.5%ENERGY STAR Most Efficient 13.6% 10% 76.3%
%Electric_DHW = Percentage of DHW savings assumed to be electric
DHW fuel %Electric_DHWElectric 100%Natural Gas 0%Unknown 16%21
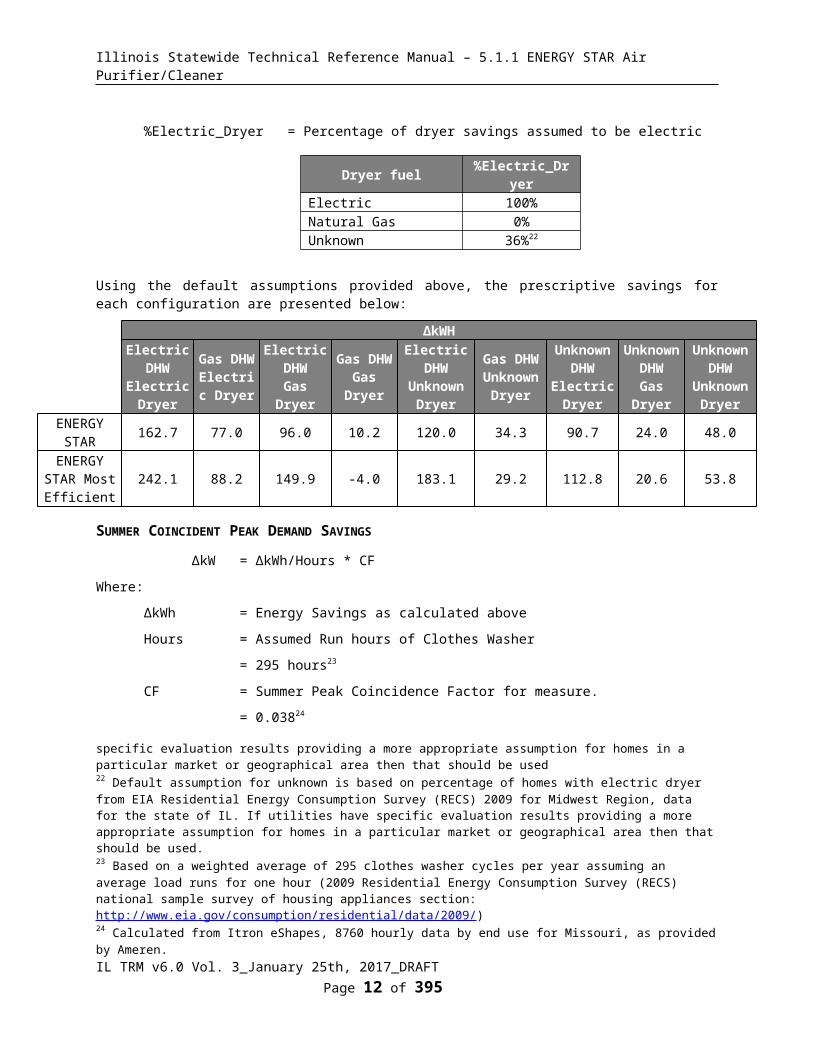
%Electric_Dryer = Percentage of dryer savings assumed to be electric
Dryer fuel %Electric_DryerElectric 100%Natural Gas 0%Unknown 36%22
front loading percentage of available ENERGY STAR and ENERGY STAR Most Efficient product in the CEC database. See “CW Analysis_01142016.xls” for the calculation.20 The percentage of total energy consumption that is used for the machine, heating the hot water or by the dryer is different depending on the efficiency of the unit. Values are based on a weighted average of top loading and front loading units based on data from DOE Life-Cycle Cost and Payback Period Excel-based analytical tool. See “CW Analysis_01142016.xls” for the calculation.21 Default assumption for unknown fuel is based on EIA Residential Energy Consumption Survey (RECS) 2009 for Midwest Region, data for the state of IL. If utilities have specific evaluation results providing a more appropriate assumption for homes in a particular market or geographical area then that should be used22 Default assumption for unknown is based on percentage of homes with electric dryer from EIA Residential Energy Consumption Survey (RECS) 2009 for Midwest Region, data for the state of IL. If utilities have specific evaluation results
IL TRM v6.0 Vol. 3_January 25th, 2017_DRAFT Page 10 of 296
Illinois Statewide Technical Reference Manual – 5.1.1 ENERGY STAR Air Purifier/Cleaner
Using the default assumptions provided above, the prescriptive savings for each configuration are presented below:
ΔkWHElectric DHW
Electric Dryer
Gas DHWElectric Dryer
Electric DHW
Gas Dryer
Gas DHWGas Dryer
Electric DHW Unknown
Dryer
Gas DHW Unknown
Dryer
Unknown DHW
Electric Dryer
Unknown DHW
Gas Dryer
Unknown DHW
Unknown Dryer
ENERGY STAR 162.7 77.0 96.0 10.2 120.0 34.3 90.7 24.0 48.0ENERGY STAR Most Efficient 242.1 88.2 149.9 -4.0 183.1 29.2 112.8 20.6 53.8
SUMMER COINCIDENT PEAK DEMAND SAVINGS
ΔkW = ΔkWh/Hours * CF
Where:
ΔkWh = Energy Savings as calculated above
Hours = Assumed Run hours of Clothes Washer
= 295 hours23
CF = Summer Peak Coincidence Factor for measure.
= 0.03824
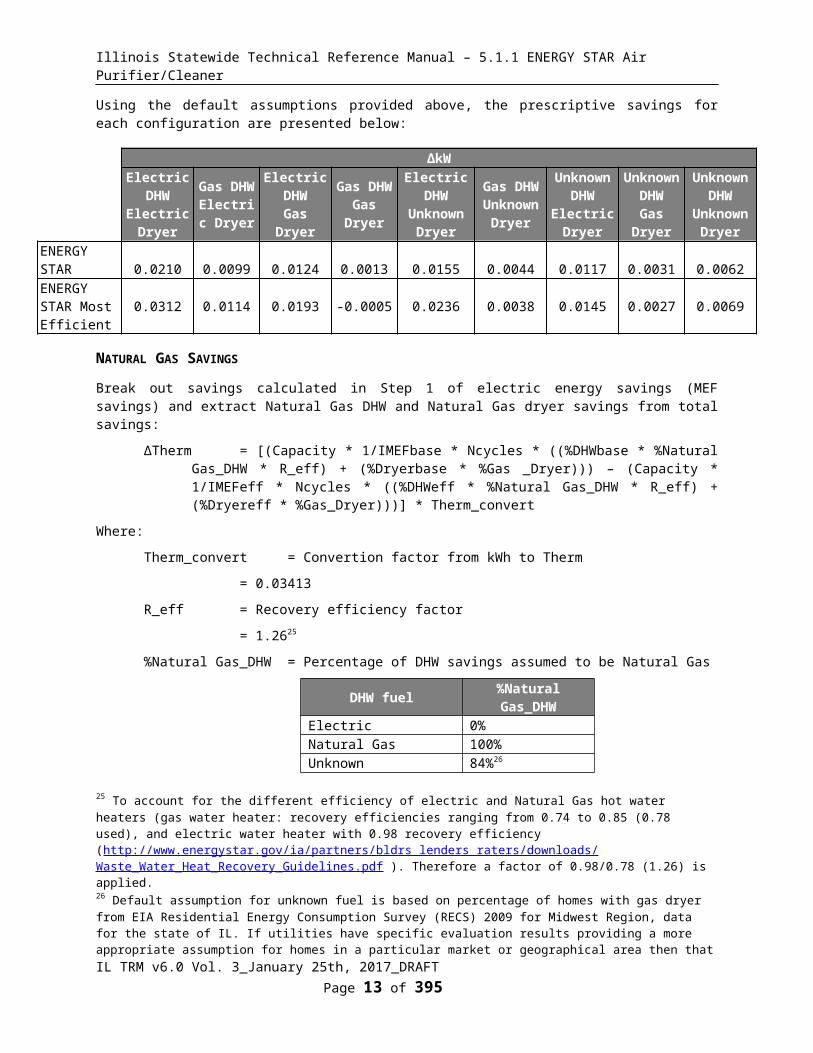
Using the default assumptions provided above, the prescriptive savings for each configuration are presented below:
ΔkWElectric DHW
Electric Dryer
Gas DHWElectric Dryer
Electric DHW
Gas Dryer
Gas DHWGas Dryer
Electric DHW Unknown
Dryer
Gas DHW Unknown
Dryer
Unknown DHW
Electric Dryer
Unknown DHW
Gas Dryer
Unknown DHW
Unknown Dryer
ENERGY STAR 0.0210 0.0099 0.0124 0.0013 0.0155 0.0044 0.0117 0.0031 0.0062ENERGY STAR Most Efficient 0.0312 0.0114 0.0193 -0.0005 0.0236 0.0038 0.0145 0.0027 0.0069
NATURAL GAS SAVINGS
Break out savings calculated in Step 1 of electric energy savings (MEF savings) and extract Natural Gas DHW and Natural Gas dryer savings from total savings:
∆Therm = [(Capacity * 1/IMEFbase * Ncycles * ((%DHWbase * %Natural Gas_DHW * R_eff) + (%Dryerbase * %Gas _Dryer))) – (Capacity * 1/IMEFeff * Ncycles * ((%DHWeff * %Natural Gas_DHW * R_eff) + (%Dryereff * %Gas_Dryer)))] * Therm_convert
Where:
Therm_convert = Convertion factor from kWh to Therm
providing a more appropriate assumption for homes in a particular market or geographical area then that should be used.23 Based on a weighted average of 295 clothes washer cycles per year assuming an average load runs for one hour (2009 Residential Energy Consumption Survey (RECS) national sample survey of housing appliances section: http://www.eia.gov/consumption/residential/data/2009/)24 Calculated from Itron eShapes, 8760 hourly data by end use for Missouri, as provided by Ameren.
IL TRM v6.0 Vol. 3_January 25th, 2017_DRAFT Page 11 of 296

Illinois Statewide Technical Reference Manual – 5.1.1 ENERGY STAR Air Purifier/Cleaner
= 0.03413
R_eff = Recovery efficiency factor
= 1.2625
%Natural Gas_DHW = Percentage of DHW savings assumed to be Natural Gas
DHW fuel %Natural Gas_DHWElectric 0%Natural Gas 100%Unknown 84%26
%Gas_Dryer = Percentage of dryer savings assumed to be Natural Gas
Dryer fuel %Gas_DryerElectric 0%Natural Gas 100%Unknown 58%27
Other factors as defined above
Using the default assumptions provided above, the prescriptive savings for each configuration are presented below:
ΔThermsElectric DHW
Electric Dryer
Gas DHWElectric Dryer
Electric DHW
Gas Dryer
Gas DHWGas Dryer
Electric DHW Unknown
Dryer
Gas DHW Unknown
Dryer
Unknown DHW
Electric Dryer
Unknown DHW
Gas Dryer
Unknown DHW
Unknown Dryer
ENERGY STAR 0.00 3.7 2.3 6.0 1.3 5.0 3.1 5.4 4.4ENERGY STAR Most Efficient 0.00 6.6 3.1 9.8 1.8 8.4 5.6 8.7 7.4
WATER IMPACT DESCRIPTIONS AND CALCULATION
∆Water (gallons) = Capacity * (IWFbase - IWFeff) * Ncycles
Where
IWFbase = Integrated Water Factor of baseline clothes washer
= 5.9228
IWFeff = Water Factor of efficient clothes washer
= Actual. If unknown assume average values provided below.
Using the default assumptions provided above, the prescriptive water savings for each efficiency level are
25 To account for the different efficiency of electric and Natural Gas hot water heaters (gas water heater: recovery efficiencies ranging from 0.74 to 0.85 (0.78 used), and electric water heater with 0.98 recovery efficiency (http://www.energystar.gov/ia/partners/bldrs_lenders_raters/downloads/Waste_Water_Heat_Recovery_Guidelines.pdf ). Therefore a factor of 0.98/0.78 (1.26) is applied. 26 Default assumption for unknown fuel is based on percentage of homes with gas dryer from EIA Residential Energy Consumption Survey (RECS) 2009 for Midwest Region, data for the state of IL. If utilities have specific evaluation results providing a more appropriate assumption for homes in a particular market or geographical area then that should be used27 Ibid.28 Weighted average IWF of Federal Standard rating for Front Loading and Top Loading units. Weighting is based upon the relative top v front loading percentage of available non-ENERGY STAR product in the CEC database.
IL TRM v6.0 Vol. 3_January 25th, 2017_DRAFT Page 12 of 296

Illinois Statewide Technical Reference Manual – 5.1.1 ENERGY STAR Air Purifier/Cleaner
presented below:
Efficiency Level IWF29∆Water
(gallons per year)
Federal Standard 5.92 0.0ENERGY STAR 3.93 2024ENERGY STAR Most Efficient 3.21 2760
DEEMED O&M COST ADJUSTMENT CALCULATION
N/A
MEASURE CODE: RS-APL-ESCL-V04-160601
REVIEW DEADLINE: 1/1/2021
29 IWF values are the weighted average of the new ENERGY STAR specifications. Weighting is based upon the relative top v front loading percentage of available ENERGY STAR and ENERGY STAR Most Efficient product in the CEC database. See “CW Analysis_01142016.xls” for the calculation.
IL TRM v6.0 Vol. 3_January 25th, 2017_DRAFT Page 13 of 296
Illinois Statewide Technical Reference Manual – 5.1.1 ENERGY STAR Air Purifier/Cleaner
5.1.3 ENERGY STAR Dehumidifier
DESCRIPTION
A dehumidifier meeting the minimum qualifying efficiency standard established by the current ENERGY STAR Version 3.0 (effective 10/1/2012)is purchased and installed in a residential setting in place of a unit that meets the minimum federal standard efficiency.
This measure was developed to be applicable to the following program types: TOS, NC.
If applied to other program types, the measure savings should be verified.
DEFINITION OF EFFICIENT EQUIPMENT
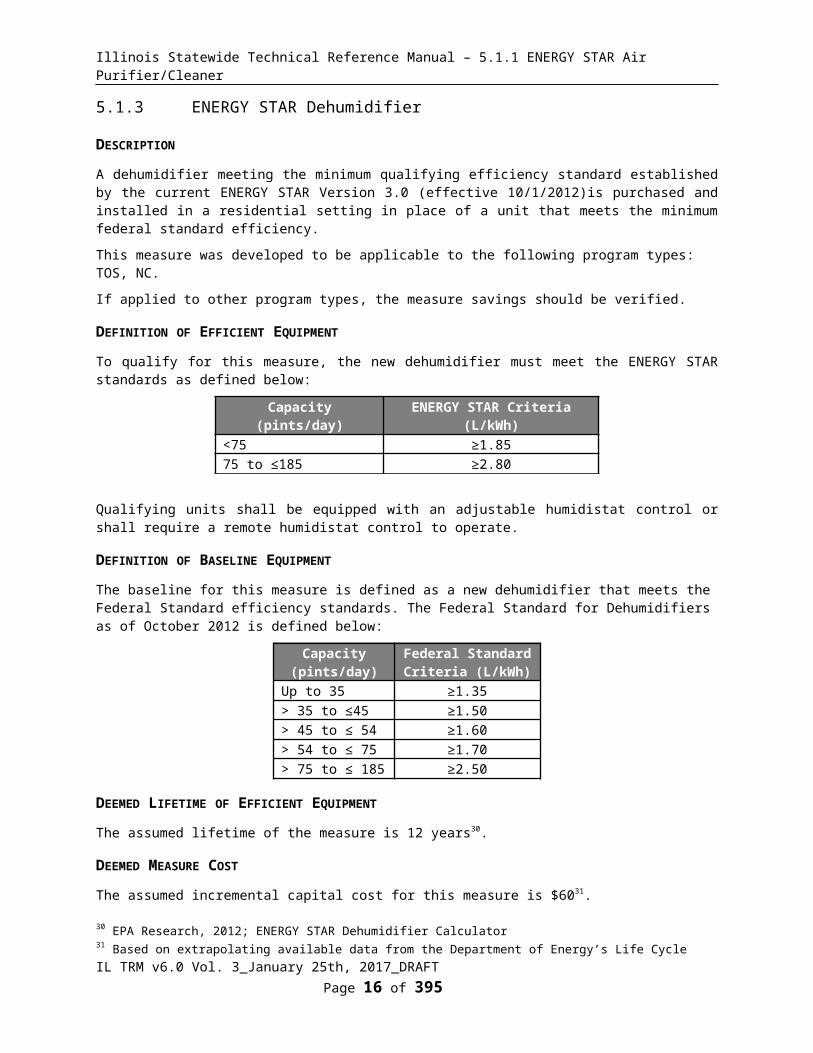
To qualify for this measure, the new dehumidifier must meet the ENERGY STAR standards as defined below:
Capacity(pints/day)
ENERGY STAR Criteria(L/kWh)
<75 ≥1.8575 to ≤185 ≥2.80
Qualifying units shall be equipped with an adjustable humidistat control or shall require a remote humidistat control to operate.
DEFINITION OF BASELINE EQUIPMENT
The baseline for this measure is defined as a new dehumidifier that meets the Federal Standard efficiency standards. The Federal Standard for Dehumidifiers as of October 2012 is defined below:
Capacity (pints/day)
Federal Standard Criteria (L/kWh)
Up to 35 ≥1.35> 35 to ≤45 ≥1.50> 45 to ≤ 54 ≥1.60> 54 to ≤ 75 ≥1.70> 75 to ≤ 185 ≥2.50
DEEMED LIFETIME OF EFFICIENT EQUIPMENT
The assumed lifetime of the measure is 12 years30.
DEEMED MEASURE COST
The assumed incremental capital cost for this measure is $6031.
LOADSHAPE
Loadshape R12 - Residential - Dehumidifier
30 EPA Research, 2012; ENERGY STAR Dehumidifier Calculator 31 Based on extrapolating available data from the Department of Energy’s Life Cycle Cost analysis spreadsheet and weighting based on volume of units available: See ‘DOE life cycle cost_dehumidifier.xls’ for calculation.
IL TRM v6.0 Vol. 3_January 25th, 2017_DRAFT Page 14 of 296
Illinois Statewide Technical Reference Manual – 5.1.1 ENERGY STAR Air Purifier/Cleaner
COINCIDENCE FACTOR
The coincidence factor is assumed to be 37% 32.
Algorithm
CALCULATION OF SAVINGS
ELECTRIC ENERGY SAVINGS
ΔkWh = (((Avg Capacity * 0.473) / 24) * Hours) * (1 / (L/kWh_Base) – 1 / (L/kWh_Eff))
Where:
Avg Capacity = Average capacity of the unit (pints/day)
= Actual, if unknown assume capacity in each capacity range as provided in table below, or if capacity range unknown assume average.
0.473 = Constant to convert Pints to Liters
24 = Constant to convert Liters/day to Liters/hour
Hours = Run hours per year
= 1632 33
L/kWh = Liters of water per kWh consumed, as provided in tables above
Annual kWh results for each capacity class are presented below:
Annual kWh
Capacity Range Capacity UsedCapacity Used(pints/day)
Federal Standard Criteria
ENERGY STAR Criteria Federal
StandardENERGY
STAR Savings
(pints/day) (≥ L/kWh) (≥ L/kWh)≤25 20 1.35 1.85 477 348 129
> 25 to ≤35 30 1.35 1.85 715 522 193> 35 to ≤45 40 1.5 1.85 858 695 162> 45 to ≤ 54 50 1.6 1.85 1005 869 136> 54 to ≤ 75 65 1.7 1.85 1230 1130 100
> 75 to ≤ 185 130 2.5 2.8 1673 1493 179Average34 140
SUMMER COINCIDENT PEAK DEMAND SAVINGS
ΔkW = ΔkWh/Hours * CF
Where:
Hours = Annual operating hours
32 Assume usage is evenly distributed day vs. night, weekend vs. weekday and is used between April through the end of September (4392 possible hours). 1632 operating hours from ENERGY STAR Dehumidifier Calculator. Coincidence peak during summer peak is therefore 1632/4392 = 37.2%33 ENERGY STAR Dehumidifier Calculator; 24 hour operation over 68 days of the year. Capacity Used
34 The relative weighting of each product class is based on number of units on the ENERGY STAR certified list. See “Dehumidifier Calcs.xls.
IL TRM v6.0 Vol. 3_January 25th, 2017_DRAFT Page 15 of 296

Illinois Statewide Technical Reference Manual – 5.1.1 ENERGY STAR Air Purifier/Cleaner
= 1632 hours 35
CF = Summer Peak Coincidence Factor for measure
= 0.37 36
Summer coincident peak demand results for each capacity class are presented below:
Capacity(pints/day) Range
Annual Summer peak kW Savings
≤25 0.029> 25 to ≤35 0.044> 35 to ≤45 0.037> 45 to ≤ 54 0.031> 54 to ≤ 75 0.023
> 75 to ≤ 185 0.041Average 0.032
NATURAL GAS SAVINGS
N/A
WATER IMPACT DESCRIPTIONS AND CALCULATION
N/A
DEEMED O&M COST ADJUSTMENT CALCULATION
N/A
MEASURE CODE: RS-APL-ESDH-V03-160601
REVIEW DEADLINE: 1/1/2019
35 Based on 68 days of 24 hour operation; ENERGY STAR Dehumidifier Calculator 36 Assume usage is evenly distributed day vs. night, weekend vs. weekday and is used between April through the end of September (4392 possible hours). 1632 operating hours from ENERGY STAR Dehumidifier Calculator. Coincidence peak during summer peak is therefore 1632/4392 = 37.2%
IL TRM v6.0 Vol. 3_January 25th, 2017_DRAFT Page 16 of 296

Illinois Statewide Technical Reference Manual – 5.1.1 ENERGY STAR Air Purifier/Cleaner
5.1.4 ENERGY STAR Dishwasher
DESCRIPTION
A dishwasher meeting the efficiency specifications of ENERGY STAR is installed in place of a model meeting the federal standard. This measure is only for standard dishwashers, not compact dishwashers. A compact dishwasher is a unit that holds less than eight place settings with six serving pieces.
This measure was developed to be applicable to the following program types: TOS, NC.
If applied to other program types, the measure savings should be verified.
DEFINITION OF EFFICIENT EQUIPMENT
The efficient equipment is defined as a dishwasher meeting the efficiency specifications of ENERGY STAR. The Energy Star standard is presented in the table below:
Dishwasher Type Maximum kWh/year
Maximum gallons/cycle
Standard (≥ 8 place settings + six serving pieces) 270
3.5Standard with Connected Functionality37 283Compact (< 8 place settings + six serving pieces) 203 3.1
DEFINITION OF BASELINE EQUIPMENT
The Baseline reflects the minimum federal efficiency standards for dishwashers effective May 30, 2013, as presented in the table below38.
Dishwasher Type
Maximum kWh/year
Maximum gallons/cycle
Standard 307 5.0Compact 222 3.5
DEEMED LIFETIME OF EFFICIENT EQUIPMENT
The assumed lifetime of the measure is 13 years39.
DEEMED MEASURE COST
The incremental cost for this measure is $5040.
37 The new ENERGY STAR specification “establishes optional connected criteria for dishwashers. ENERGY STAR certified dishwashers with connected functionality offer favorable attributes for demand response programs to consider, since their peak energy consumption is relatively high, driven by water heating. ENERGY STAR certified dishwashers with connected functionality will offer consumers new convenience and energy-saving features, such as alerts for cycle completion and/or recommended maintenance, as well as feedback on the energy use of the product”. See ‘ENERGY STAR Residential Dishwasher Final Version 6.0 Cover Memo.pdf’. Calculated as per Version 6.0 specification; “ENERGY STAR Residential Dishwasher Version 6.0 Final Program Requirements.pdf”. Note that the potential for demand response and additional peak savings from units with Connected Functionality have not been explored. This could be a potential addition in a future version.38 http://www1.eere.energy.gov/buildings/appliance_standards/product.aspx/productid/6739 Koomey, Jonathan et al. (Lawrence Berkeley National Lab), Projected Regional Impacts of Appliance Efficiency Standards for the U.S. Residential Sector, February 1998.40 Estimate based on review of Energy Star stakeholder documents
IL TRM v6.0 Vol. 3_January 25th, 2017_DRAFT Page 17 of 296
Illinois Statewide Technical Reference Manual – 5.1.1 ENERGY STAR Air Purifier/Cleaner
LOADSHAPE
Loadshape R02 - Residential Dish Washer
COINCIDENCE FACTOR
The coincidence factor is assumed to be 2.6%41.
Algorithm
CALCULATION OF SAVINGS
ELECTRIC ENERGY SAVINGS
ΔkWh42 = ((kWhBase - kWhESTAR) * (%kWh_op + (%kWh_heat * %Electric_DHW )))
Where:
kWhBASE = Baseline kWh consumption per year
Dishwasher Type Maximum kWh/year
Standard 307Compact 222
kWhESTAR = ENERGY STAR kWh annual consumption
Dishwasher Type Maximum kWh/year
Standard 270Standard with Connected Functionality 283Compact 203
%kWh_op = Percentage of dishwasher energy consumption used for unit operation
= 1 - 56%43
= 44%
%kWh_heat = Percentage of dishwasher energy consumption used for water heating
= 56%44
%Electric_DHW = Percentage of DHW savings assumed to be electric
DHW fuel %Electric_DHWElectric 100%Natural Gas 0%
41 Calculated from Itron eShapes, 8760 hourly data by end use for Missouri, as provided by Ameren.42 The Federal Standard and ENERGY STAR annual consumption values include electric consumption for both the operation of the machine and for heating the water that is used by the machine.43 ENERGY STAR Dishwasher Calculator (http://www.energystar.gov/ia/business/bulk_purchasing/bpsavings_calc/CalculatorConsumerDishwasher.xls ) 44 Ibid.
IL TRM v6.0 Vol. 3_January 25th, 2017_DRAFT Page 18 of 296

Illinois Statewide Technical Reference Manual – 5.1.1 ENERGY STAR Air Purifier/Cleaner
DHW fuel %Electric_DHWUnknown 16%45
Dishwasher TypeΔkWh
With Electric DHW With Gas DHW With Unknown DHW
ENERGY STAR Standard 37.0 16.3 19.6ENERGY STAR Standard with Connected Functionality 24.0 10.6 12.7
ENERGY STAR Compact 19.0 8.4 10.1
SUMMER COINCIDENT PEAK DEMAND SAVINGS46
ΔkW = ΔkWh/Hours * CF
Where:
Hours = Annual operating hours47
= 252 hours
CF = Summer Peak Coincidence Factor
= 2.6% 48
Dishwasher TypeΔkW
With Electric DHW With Gas DHW With Unknown DHW
ENERGY STAR Standard 0.0038 0.0017 0.0020ENERGY STAR Standard with Connected Functionality 0.0025 0.0011 0.0013
ENERGY STAR Compact 0.0020 0.0009 0.0010
NATURAL GAS SAVINGS
Δ Therm = (kWhBase - kWhESTAR) * %kWh_heat * %Natural Gas_DHW * R_eff * 0.03413
Where
%kWh_heat = % of dishwasher energy used for water heating
= 56%
%Natural Gas_DHW = Percentage of DHW savings assumed to be Natural Gas
45 Default assumption for unknown fuel is based on EIA Residential Energy Consumption Survey (RECS) 2009 for Midwest Region, data for the state of IL. If utilities have specific evaluation results providing a more appropriate assumption for homes in a particular market or geographical area then that should be used.46 Note that the potential for demand response and additional peak savings from units with Connected Functionality have not been explored. This could be a potential addition in a future version.47 Assuming one and a half hours per cycle and 168 cycles per year therefore 252 operating hours per year; 168 cycles per year is based on a weighted average of dishwasher usage in Illinois derived from the 2009 RECs data; http://205.254.135.7/consumption/residential/data/2009/ 48 End use data from Ameren representing the average DW load during peak hours/peak load.
IL TRM v6.0 Vol. 3_January 25th, 2017_DRAFT Page 19 of 296

Illinois Statewide Technical Reference Manual – 5.1.1 ENERGY STAR Air Purifier/Cleaner
DHW fuel %Natural Gas_DHWElectric 0%Natural Gas 100%Unknown 84%49
R_eff = Recovery efficiency factor
= 1.2650
0.03413 = factor to convert from kWh to Therm
Dishwasher TypeΔTherms
With Electric DHW With Gas DHW With Unknown DHW
ENERGY STAR Standard 0.00 0.89 0.75ENERGY STAR Standard with Connected Functionality 0.00 0.58 0.49
ENERGY STAR Compact 0.00 0.46 0.38
WATER IMPACT DESCRIPTIONS AND CALCULATION
ΔWater = WaterBase - WaterEFF
Where
WaterBase = water consumption of conventional unit
Dishwasher Type WaterBase
(gallons) 51
Standard 840Compact 588
WaterEFF = annual water consumption of efficient unit:
Dishwasher Type WaterEFF
(gallons) 52
Standard 588Compact 521
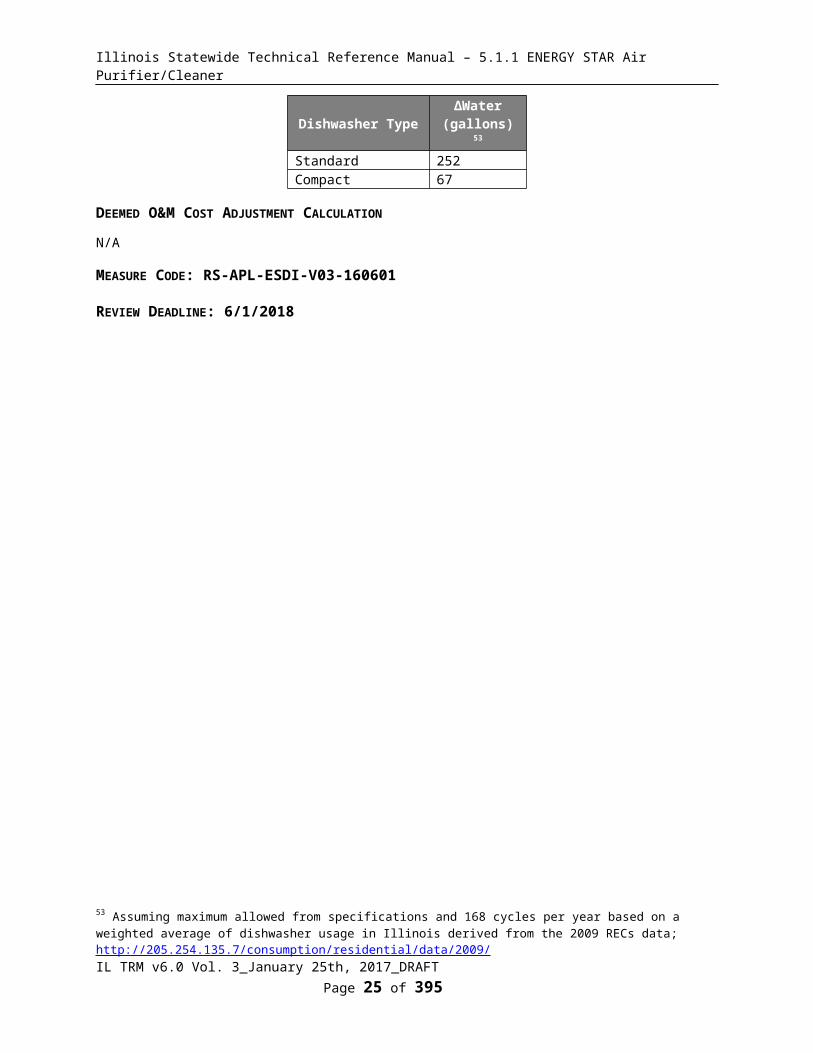
Dishwasher Type ΔWater (gallons) 53
Standard 252
49 Default assumption for unknown fuel is based on EIA Residential Energy Consumption Survey (RECS) 2009 for Midwest Region, data for the state of IL. If utilities have specific evaluation results providing a more appropriate assumption for homes in a particular market or geographical area then that should be used.50 To account for the different efficiency of electric and Natural Gas hot water heaters (gas water heater: recovery efficiencies ranging from 0.74 to 0.85 (0.78 used), and electric water heater with 0.98 recovery efficiency (http://www.energystar.gov/ia/partners/bldrs_lenders_raters/downloads/Waste_Water_Heat_Recovery_Guidelines.pdf). Therefore a factor of 0.98/0.78 (1.26) is applied. 51 Assuming maximum allowed from specifications and 168 cycles per year based on a weighted average of dishwasher usage in Illinois derived from the 2009 RECs data; http://205.254.135.7/consumption/residential/data/2009/ 52 Assuming maximum allowed from specifications and 168 cycles per year based on a weighted average of dishwasher usage in Illinois derived from the 2009 RECs data; http://205.254.135.7/consumption/residential/data/2009/ 53 Assuming maximum allowed from specifications and 168 cycles per year based on a weighted average of dishwasher usage in Illinois derived from the 2009 RECs data; http://205.254.135.7/consumption/residential/data/2009/
IL TRM v6.0 Vol. 3_January 25th, 2017_DRAFT Page 20 of 296
Illinois Statewide Technical Reference Manual – 5.1.1 ENERGY STAR Air Purifier/Cleaner
Dishwasher Type ΔWater (gallons)
Compact 67
DEEMED O&M COST ADJUSTMENT CALCULATION
N/A
MEASURE CODE: RS-APL-ESDI-V03-160601
REVIEW DEADLINE: 6/1/2018
IL TRM v6.0 Vol. 3_January 25th, 2017_DRAFT Page 21 of 296

Illinois Statewide Technical Reference Manual – 5.1.1 ENERGY STAR Air Purifier/Cleaner
5.1.5 ENERGY STAR Freezer
DESCRIPTION
A freezer meeting the efficiency specifications of ENERGY STAR is installed in place of a model meeting the federal standard (NAECA). Energy usage specifications are defined in the table below (note, AV is the freezer Adjusted Volume and is calculated as 1.73*Total Volume):
Product Category Volume(cubic feet)
Assumptions up to September 2014 Assumptions after September 2014Federal Baseline
Maximum Energy Usage in
kWh/year54
ENERGY STAR Maximum Energy
Usage in kWh/year55
Federal Baseline Maximum Energy
Usage in kWh/year56
ENERGY STAR Maximum Energy
Usage in kWh/year57
Upright Freezers with Manual Defrost 7.75 or greater 7.55*AV+258.3 6.795*AV+232.47 5.57*AV + 193.7 5.01*AV + 174.3
Upright Freezers with Automatic Defrost 7.75 or greater 12.43*AV+326.1 11.187*AV+293.49 8.62*AV + 228.3 7.76*AV + 205.5
Chest Freezers and all other Freezers except Compact Freezers
7.75 or greater 9.88*AV+143.7 8.892*AV+129.33 7.29*AV + 107.8 6.56*AV + 97.0
Compact Upright Freezers with Manual Defrost
< 7.75 and 36 inches or less in height
9.78*AV+250.8 7.824*AV+200.64 8.65*AV + 225.7 7.79*AV + 203.1
Compact Upright Freezers with Automatic Defrost
< 7.75 and 36 inches or less in height
11.40*AV+391 9.12*AV+312.8 10.17*AV + 351.9 9.15*AV + 316.7
Compact Chest Freezers<7.75 and 36 inches or less in height
10.45*AV+152 8.36*AV+121.6 9.25*AV + 136.8 8.33*AV + 123.1
This measure was developed to be applicable to the following program types: TOS, NC.
If applied to other program types, the measure savings should be verified.
DEFINITION OF EFFICIENT EQUIPMENT
The efficient equipment is defined as a freezer meeting the efficiency specifications of ENERGY STAR, as defined below and calculated above:
Equipment Volume Criteria
Full Size Freezer 7.75 cubic feet or greaterAt least 10% more energy efficient than the minimum federal government standard (NAECA).
Compact Freezer Less than 7.75 cubic feet and 36 At least 20% more energy efficient
54 http://www1.eere.energy.gov/buildings/appliance_standards/product.aspx/productid/4355 http://www.energystar.gov/ia/products/appliances/refrig/NAECA_calculation.xls?c827-f74656 http://www1.eere.energy.gov/buildings/appliance_standards/product.aspx/productid/4357http://www.energystar.gov/products/specs/sites/products/files/ENERGY%20STAR%20Final%20Version%205.0%20Residential%20Refrigerators%20and%20Freezers%20Specification.pdf
IL TRM v6.0 Vol. 3_January 25th, 2017_DRAFT Page 22 of 296

Illinois Statewide Technical Reference Manual – 5.1.1 ENERGY STAR Air Purifier/Cleaner
Equipment Volume Criteria
inches or less in height than the minimum federal government standard (NAECA).
DEFINITION OF BASELINE EQUIPMENT
The baseline equipment is assumed to be a model that meets the federal minimum standard for energy efficiency. The standard varies depending on the size and configuration of the freezer (chest freezer or upright freezer, automatic or manual defrost) and is defined in the table above.
DEEMED LIFETIME OF EFFICIENT EQUIPMENT
The measure life is assumed to be 11 years58.
DEEMED MEASURE COST
The incremental cost for this measure is $3559.
LOADSHAPE
Loadshape R04 - Residential Freezer
COINCIDENCE FACTOR
The summer peak coincidence factor for this measure is assumed to be 95%60.
Algorithm
CALCULATION OF SAVINGS
ELECTRIC ENERGY SAVINGS:
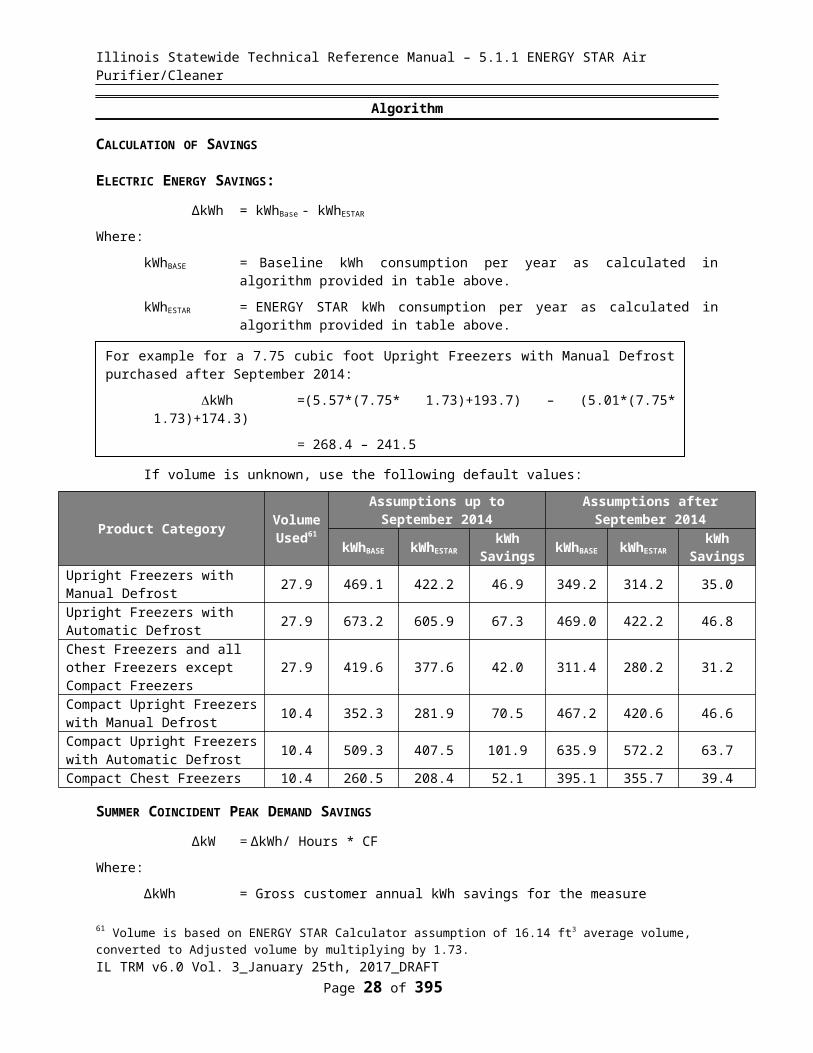
ΔkWh = kWhBase - kWhESTAR
Where:
kWhBASE = Baseline kWh consumption per year as calculated in algorithm provided in table above.
kWhESTAR = ENERGY STAR kWh consumption per year as calculated in algorithm provided in table above.
If volume is unknown, use the following default values:
58 Energy Star Freezer Calculator; http://www.energystar.gov/ia/business/bulk_purchasing/bpsavings_calc/Consumer_Residential_Freezer_Sav_Calc.xls?570a-f000 59 Based on review of data from the Northeast Regional ENERGY STAR Consumer Products Initiative; “2009 ENERGY STAR Appliances Practices Report”, submitted by Lockheed Martin, December 2009.60 Based on eShapes Residential Freezer load data as provided by Ameren.
IL TRM v6.0 Vol. 3_January 25th, 2017_DRAFT Page 23 of 296
For example for a 7.75 cubic foot Upright Freezers with Manual Defrost purchased after September 2014:
kWh =(5.57*(7.75* 1.73)+193.7) – (5.01*(7.75* 1.73)+174.3)
= 268.4 – 241.5
= 26.9 kWh

Illinois Statewide Technical Reference Manual – 5.1.1 ENERGY STAR Air Purifier/Cleaner
Product Category Volume Used61
Assumptions up to September 2014 Assumptions after September 2014
kWhBASE kWhESTARkWh
Savings kWhBASE kWhESTARkWh
SavingsUpright Freezers with Manual Defrost 27.9 469.1 422.2 46.9 349.2 314.2 35.0
Upright Freezers with Automatic Defrost 27.9 673.2 605.9 67.3 469.0 422.2 46.8
Chest Freezers and all other Freezers except Compact Freezers 27.9 419.6 377.6 42.0 311.4 280.2 31.2
Compact Upright Freezers with Manual Defrost 10.4 352.3 281.9 70.5 467.2 420.6 46.6
Compact Upright Freezers with Automatic Defrost 10.4 509.3 407.5 101.9 635.9 572.2 63.7
Compact Chest Freezers 10.4 260.5 208.4 52.1 395.1 355.7 39.4
SUMMER COINCIDENT PEAK DEMAND SAVINGS
∆kW = ∆kWh/ Hours * CF
Where:
∆kWh = Gross customer annual kWh savings for the measure
Hours = Full Load hours per year
= 589062
CF = Summer Peak Coincident Factor
= 0.95 63
If volume is unknown, use the following default values:
Product CategoryAssumptions up to
September 2014Assumptions after September 2014
kW Savings kW SavingsUpright Freezers with Manual Defrost 0.0076 0.0057
Upright Freezers with Automatic Defrost 0.0109 0.0076
Chest Freezers and all other Freezers except Compact Freezers
0.0068 0.0050
Compact Upright Freezers with Manual Defrost 0.0114 0.0075
61 Volume is based on ENERGY STAR Calculator assumption of 16.14 ft3 average volume, converted to Adjusted volume by multiplying by 1.73.62 Calculated from eShapes Residential Freezer load data as provided by Ameren by dividing total annual load by the maximum kW in any one hour.63 Based on eShapes Residential Freezer load data as provided by Ameren.
IL TRM v6.0 Vol. 3_January 25th, 2017_DRAFT Page 24 of 296
For example for a 7.75 cubic foot Upright Freezers with Manual Defrost:
kW = 26.9/5890 * 0.95
= 0.0043 kW

Illinois Statewide Technical Reference Manual – 5.1.1 ENERGY STAR Air Purifier/Cleaner
Product CategoryAssumptions up to
September 2014Assumptions after September 2014
kW Savings kW SavingsCompact Upright Freezers with
Automatic Defrost 0.0164 0.0103
Compact Chest Freezers 0.0084 0.0064
NATURAL GAS SAVINGS
N/A
WATER IMPACT DESCRIPTIONS AND CALCULATION
N/A
DEEMED O&M COST ADJUSTMENT CALCULATION
N/A
MEASURE CODE: RS-APL-ESFR-V02-140601
REVIEW DEADLINE: 1/1/2021
IL TRM v6.0 Vol. 3_January 25th, 2017_DRAFT Page 25 of 296

Illinois Statewide Technical Reference Manual – 5.1.1 ENERGY STAR Air Purifier/Cleaner
5.1.6 ENERGY STAR and CEE Tier 2 Refrigerator
DESCRIPTION
This measure relates to:
a) Time of Sale: the purchase and installation of a new refrigerator meeting either ENERGY STAR or CEE TIER 2 specifications.
b) Early Replacement: the early removal of an existing residential inefficient Refrigerator from service, prior to its natural end of life, and replacement with a new ENERGY STAR or CEE Tier 2 qualifying unit. Savings are calculated between existing unit and efficient unit consumption during the remaining life of the existing unit, and between new baseline unit and efficient unit consumption for the remainder of the measure life.
Energy usage specifications are defined in the table below (note, Adjusted Volume is calculated as the fresh volume + (1.63 * Freezer Volume):
Product Category
Existing Unit Assumptions up to September 2014 Assumptions after September 2014
Based on Refrigerator
Recycling algorithm
Federal Baseline
Maximum Energy Usage in kWh/year64
ENERGY STAR Maximum
Energy Usage in kWh/year65
Federal Baseline Maximum
Energy Usage in kWh/year66
ENERGY STAR Maximum
Energy Usage in kWh/year67
1. Refrigerators and Refrigerator-freezers with manual defrost
Use Algorithm in 5.1.8 Refrigerator and Freezer Recycling measure to estimate existing unit consumption
8.82*AV+248.4 7.056*AV+198.72 6.79AV + 193.6 6.11 * AV + 174.2
2. Refrigerator-Freezer--partial automatic defrost
8.82*AV+248.4 7.056*AV+198.72 7.99AV + 225.0 7.19 * AV + 202.5
3. Refrigerator-Freezers--automatic defrost with top-mounted freezer without through-the-door ice service and all-refrigerators--automatic defrost
9.80*AV+276 7.84*AV+220.8 8.07AV + 233.7 7.26 * AV + 210.3
4. Refrigerator-Freezers--automatic defrost with side-mounted freezer without through-the-door ice service
4.91*AV+507.5
3.928*AV+406 8.51AV + 297.8 7.66 * AV + 268.0
5. Refrigerator-Freezers--automatic defrost with bottom-mounted freezer
4.60*AV+459 3.68*AV+367.2 8.85AV + 317.0 7.97 * AV + 285.3
64 http://www1.eere.energy.gov/buildings/appliance_standards/product.aspx/productid/4365 http://www.energystar.gov/ia/products/appliances/refrig/NAECA_calculation.xls?c827-f746 66 http://www1.eere.energy.gov/buildings/appliance_standards/product.aspx/productid/4367http://www.energystar.gov/products/specs/sites/products/files/ENERGY%20STAR%20Final%20Version%205.0%20Residential%20Refrigerators%20and%20Freezers%20Specification.pdf
IL TRM v6.0 Vol. 3_January 25th, 2017_DRAFT Page 26 of 296
Illinois Statewide Technical Reference Manual – 5.1.1 ENERGY STAR Air Purifier/Cleaner
Product Category
Existing Unit Assumptions up to September 2014 Assumptions after September 2014
Based on Refrigerator
Recycling algorithm
Federal Baseline
Maximum Energy Usage in kWh/year
ENERGY STAR Maximum
Energy Usage in kWh/year
Federal Baseline Maximum
Energy Usage in kWh/year
ENERGY STAR Maximum
Energy Usage in kWh/year
without through-the-door ice service5A Refrigerator-freezer—automatic defrost with bottom-mounted freezer with through-the-door ice service
N/A N/A 9.25AV + 475.4 8.33 * AV + 436.3
6. Refrigerator-Freezers--automatic defrost with top-mounted freezer with through-the-door ice service
10.20*AV+356 8.16*AV+284.8 8.40AV + 385.4 7.56 * AV + 355.3
7. Refrigerator-Freezers--automatic defrost with side-mounted freezer with through-the-door ice service
10.10*AV+406 8.08*AV+324.8 8.54AV + 432.8 7.69 * AV + 397.9
Note CEE Tier 2 standard criteria is 25% less consumption than a new baseline unit. It is assumed that after September 2014 when the Federal Standard and ENERGY STAR specifications change, the CEE Tier 2 will remain set at 25% less that the new baseline assumption.
This measure was developed to be applicable to the following program types: TOS, NC, EREP.
If applied to other program types, the measure savings should be verified.
DEFINITION OF EFFICIENT EQUIPMENT
The efficient equipment is defined as a refrigerator meeting the efficiency specifications of ENERGY STAR or CEE Tier 2 (defined as requiring >= 20% or >= 25% less energy consumption than an equivalent unit meeting federal standard requirements respectively). The ENERGY STAR standard varies according to the size and configuration of the unit, as shown in table above.
DEFINITION OF BASELINE EQUIPMENT
Time of Sale: baseline is a new refrigerator meeting the minimum federal efficiency standard for refrigerator efficiency. The current federal minimum standard varies according to the size and configuration of the unit, as shown in table above.. Note also that this federal standard will be increased for units manufactured after September 1, 2014.
Early Replacement: the baseline is the existing refrigerator for the assumed remaining useful life of the unit and the new baseline as defined above for the remainder of the measure life.
DEEMED LIFETIME OF EFFICIENT EQUIPMENT
The measure life is assumed to be 12 years.68
68 From ENERGY STAR calculator:
IL TRM v6.0 Vol. 3_January 25th, 2017_DRAFT Page 27 of 296

Illinois Statewide Technical Reference Manual – 5.1.1 ENERGY STAR Air Purifier/Cleaner
Remaining life of existing equipment is assumed to be 4 years69
DEEMED MEASURE COST
Time of Sale: The incremental cost for this measure is assumed to be $40 70 for an ENERGY STAR unit and $14071 for a CEE Tier 2 unit.
Early Replacement: The measure cost is the full cost of removing the existing unit and installing a new one. The actual program cost should be used. If unavailable assume $451 for ENERGY STAR unit and $551 for CEE Tier 2 unit72.
The avoided replacement cost (after 4 years) of a baseline replacement refrigerator is $413 73. This cost should be discounted to present value using the nominal societal discount rate.
LOADSHAPE
Loadshape R05 - Residential Refrigerator
COINCIDENCE FACTOR
A coincidence factor is not used to calculate peak demand savings for this measure, see below.
Algorithm
CALCULATION OF SAVINGS
ELECTRIC ENERGY SAVINGS:
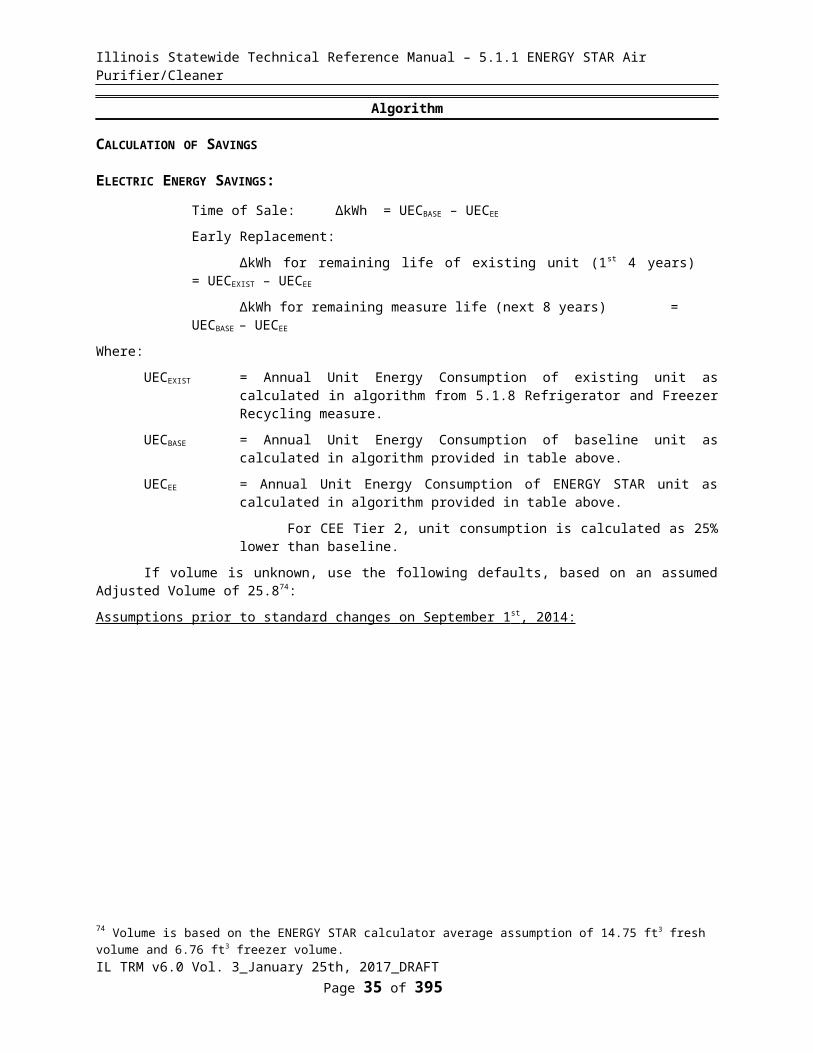
Time of Sale: ΔkWh = UECBASE – UECEE
Early Replacement:
ΔkWh for remaining life of existing unit (1st 4 years) = UECEXIST – UECEE
ΔkWh for remaining measure life (next 8 years) = UECBASE – UECEE
Where:
UECEXIST = Annual Unit Energy Consumption of existing unit as calculated in algorithm from 5.1.8 Refrigerator and Freezer Recycling measure.
UECBASE = Annual Unit Energy Consumption of baseline unit as calculated in algorithm provided in table above.
UECEE = Annual Unit Energy Consumption of ENERGY STAR unit as calculated in algorithm provided in table above.
http://www.energystar.gov/buildings/sites/default/uploads/files/appliance_calculator.xlsx?7224-046c=&7224-__046ceiling_fan_calculator_xlsx=&f7d8-39dd&f7d8-39dd69 Standard assumption of one third of effective useful life. 70 From ENERGY STAR calculator linked above.71 Based on weighted average of units participating in Efficiency Vermont program and retail cost data provided in Department of Energy, “TECHNICAL REPORT: Analysis of Amended Energy Conservation Standards for Residential Refrigerator-Freezers”, October 2005; http://www1.eere.energy.gov/buildings/appliance_standards/pdfs/refrigerator_report_1.pdf72 ENERGY STAR full cost is based upon IL PHA Efficient Living Program data on sample size of 910 replaced units finding average cost of $430 plus an average recycling/removal cost of $21. The CEE Tier 2 estimate uses the delta from the Time of Sale estimate.73 Calculated using incremental cost from Time of Sale measure and applying inflation rate of 1.91%.
IL TRM v6.0 Vol. 3_January 25th, 2017_DRAFT Page 28 of 296

Illinois Statewide Technical Reference Manual – 5.1.1 ENERGY STAR Air Purifier/Cleaner
For CEE Tier 2, unit consumption is calculated as 25% lower than baseline.
If volume is unknown, use the following defaults, based on an assumed Adjusted Volume of 25.874:
Assumptions prior to standard changes on September 1 st , 2014:
Product Category
Existing Unit UE
CEXIST75
New Baseline UECBASE
New EfficientUECEE
Early Replacement (1st 4 years)
ΔkWh
Time of Sale and Early Replacement
(last 8 years) ΔkWh
ENERGY STAR CEE T2 ENERGY
STAR CEE T2 ENERGY STAR CEE T2
1. Refrigerators and Refrigerator-freezers with manual defrost
1027.7 475.7 380.5 356.8 647.2 671.0 95.1 118.9
2. Refrigerator-Freezer--partial automatic defrost 1027.7 475.7 380.5 356.8 647.2 671.0 95.1 118.9
3. Refrigerator-Freezers--automatic defrost with top-mounted freezer without through-the-door ice service and all-refrigerators--automatic defrost
814.5 528.5 422.8 396.4 391.7 418.1 105.7 132.1
4. Refrigerator-Freezers--automatic defrost with side-mounted freezer without through-the-door ice service
1241.0 634.0 507.2 475.5 733.7 765.4 126.8 158.5
5. Refrigerator-Freezers--automatic defrost with bottom-mounted freezer without through-the-door ice service
814.5 577.5 462.0 433.2 352.5 381.4 115.5 144.4
6. Refrigerator-Freezers--automatic defrost with top-mounted freezer with through-the-door ice service
814.5 618.8 495.1 464.1 319.5 350.4 123.8 154.7
7. Refrigerator-Freezers--automatic defrost with side-mounted freezer with through-the-door ice service
1241.0 666.3 533.0 499.7 707.9 741.3 133.3 166.6
Assumptions after standard changes on September 1 st , 2014:
74 Volume is based on the ENERGY STAR calculator average assumption of 14.75 ft3 fresh volume and 6.76 ft3 freezer volume.75 Estimates of existing unit consumption are based on using the 5.1.8 Refrigerator and Freezer Recycling algorithm and the inputs described here: Age = 10 years, Pre-1990 = 0, Size = 21.5 ft3 (from ENERGY STAR calc and consistent with AV of 25.8), Single Door = 0, Side by side = 1 for classifications stating side by side, 0 for classifications stating top/bottom, and 0.5 for classifications that do not distinguish, Primary appliances = 1, unconditioned = 0, Part use factor = 0.
IL TRM v6.0 Vol. 3_January 25th, 2017_DRAFT Page 29 of 296
Illinois Statewide Technical Reference Manual – 5.1.1 ENERGY STAR Air Purifier/Cleaner
Product Category
Existing Unit UE
CEXIST76
New Baseline UECBASE
New Efficient
UECEE
Early Replacement
(1st 4 years)
ΔkWh
Time of Sale and
Early Replacement (last 8 years)
ΔkWh
ENERGY STAR CEE T2 ENERGY
STAR CEE T2 ENERGY STAR CEE T2
1. Refrigerators and Refrigerator-freezers with manual defrost
1027.7 368.6 331.6 276.4 696.1 751.3 36.9 92.1
2. Refrigerator-Freezer--partial automatic defrost
1027.7 430.9 387.8 323.2 640.0 704.6 43.1 107.7
3. Refrigerator-Freezers--automatic defrost with top-mounted freezer without through-the-door ice service and all-refrigerators--automatic defrost
814.5 441.7 397.4 331.2 417.2 483.3 44.3 110.4
4. Refrigerator-Freezers--automatic defrost with side-mounted freezer without through-the-door ice service
1241.0 517.1 465.4 387.8 775.6 853.1 51.7 129.3
5. Refrigerator-Freezers--automatic defrost with bottom-mounted freezer without through-the-door ice service
814.5 545.1 490.7 408.8 323.9 405.8 54.4 136.3
5A Refrigerator-freezer—automatic defrost with bottom-mounted freezer with through-the-door ice service
814.5 713.8 651.0 535.3 163.6 279.2 62.8 178.4
6. Refrigerator-Freezers--automatic defrost with top-mounted freezer with through-the-door ice service
814.5 601.9 550.1 451.4 264.4 363.2 51.7 150.5
7. Refrigerator-Freezers--automatic defrost with side-mounted freezer with through-the-door ice service
1241.0 652.9 596.1 489.6 644.9 751.3 56.8 163.2
SUMMER COINCIDENT PEAK DEMAND SAVINGS
ΔkW = (ΔkWh/8766) * TAF * LSAF
Where:
TAF = Temperature Adjustment Factor
= 1.2577
77 Average temperature adjustment factor (to account for temperature conditions during peak period as compared to year as a whole) based on Blasnik, Michael, "Measurement and Verification of Residential Refrigerator Energy Use, Final Report, 2003-2004 Metering Study", July 29, 2004 (p. 47). It assumes 90 °F average outside temperature during peak period, 71°F average temperature in kitchens and 65°F average temperature in basement, and uses assumption that 66% of homes in Illinois have
IL TRM v6.0 Vol. 3_January 25th, 2017_DRAFT Page 30 of 296

Illinois Statewide Technical Reference Manual – 5.1.1 ENERGY STAR Air Purifier/Cleaner
LSAF = Load Shape Adjustment Factor
= 1.057 78
If volume is unknown, use the following defaults:
Product Category
Assumptions prior to September 2014 standard change ΔkW
Assumptions after September 2014 standard change ΔkW
Early Replacement (1st 4 years)
Time of Sale and Early Replacement (last 8
years)
Early Replacement (1st
4 years)
Time of Sale and Early Replacement
(last 8 years)ENERGY
STAR CEE T2 ENERGY STAR CEE T2 ENERGY
STAR CEE T2 ENERGY STAR CEE T2
1. Refrigerators and Refrigerator-freezers with manual defrost 0.098 0.101 0.014 0.018 0.105 0.113 0.006 0.014
2. Refrigerator-Freezer--partial automatic defrost 0.098 0.101 0.014 0.018 0.096 0.106 0.006 0.016
3. Refrigerator-Freezers--automatic defrost with top-mounted freezer without through-the-door ice service and all-refrigerators--automatic defrost
0.059 0.063 0.016 0.020 0.063 0.073 0.007 0.017
4. Refrigerator-Freezers--automatic defrost with side-mounted freezer without through-the-door ice service
0.111 0.115 0.019 0.024 0.117 0.129 0.008 0.019
5. Refrigerator-Freezers--automatic defrost with bottom-mounted freezer without through-the-door ice service
0.053 0.057 0.017 0.022 0.049 0.061 0.008 0.021
5A Refrigerator-freezer—automatic defrost with bottom-mounted freezer with through-the-door ice service
n/a n/a n/a n/a 0.025 0.042 0.009 0.027
6. Refrigerator-Freezers--automatic defrost with top-mounted freezer with through-the-door ice service
0.048 0.053 0.019 0.023 0.040 0.055 0.008 0.023
7. Refrigerator-Freezers--automatic defrost with side-mounted freezer with through-the-door ice service
0.107 0.112 0.020 0.025 0.097 0.113 0.009 0.025
NATURAL GAS SAVINGS
N/A
central cooling (CAC saturation: "Table HC7.9 Air Conditioning in Homes in Midwest Region, Divisions, and States, 2009 from Energy Information Administration", 2009 Residential Energy Consumption Survey; http://www.eia.gov/consumption/residential/data/2009/xls/HC7.9%20Air%20Conditioning%20in%20Midwest%20Region.xls )78 Daily load shape adjustment factor (average load in peak period /average daily load) also based on Blasnik, Michael, "Measurement and Verification of Residential Refrigerator Energy Use, Final Report, 2003-2004 Metering Study", July 29, 2004 (p. 48, using the average Existing Units Summer Profile for hours 13 through 17)
IL TRM v6.0 Vol. 3_January 25th, 2017_DRAFT Page 31 of 296

Illinois Statewide Technical Reference Manual – 5.1.1 ENERGY STAR Air Purifier/Cleaner
WATER IMPACT DESCRIPTIONS AND CALCULATION
N/A
DEEMED O&M COST ADJUSTMENT CALCULATION
N/A
MEASURE CODE: RS-APL-ESRE-V05-180101
REVIEW DEADLINE: 1/1/2021
IL TRM v6.0 Vol. 3_January 25th, 2017_DRAFT Page 32 of 296

Illinois Statewide Technical Reference Manual – 5.1.1 ENERGY STAR Air Purifier/Cleaner
5.1.7 ENERGY STAR Room Air Conditioner
DESCRIPTION
This measure relates to:
a) Time of Sale the purchase and installation of a room air conditioning unit that meets ENERGY STAR version 4.0 which is effective October 26th 2015), in place of a baseline unit. The baseline is based on the Federal Standard effective June 1st, 2014.
Product Type and Class (Btu/hr)
Federal Standard with louvered sides
(CEER) 79
Federal Standard without
louvered sides(CEER)
ENERGY STAR v4.0 with louvered
sides (CEER) 80
ENERGY STAR v4.0 without
louvered sides (CEER)
Without Reverse
Cycle
< 8,000 11.0 10.0 11.5 10.58,000 to 10,999 10.9 9.6 11.4 10.1
11,000 to 13,999 10.9 9.5 11.4 10.014,000 to 19,999 10.7 9.3 11.2 9.720,000 to 24,999 9.4 9.4 9.8 9.8
>=25,000 9.0 9.4 9.4 9.8With
Reverse Cycle
<14,000 9.8 9.3 10.3 9.714,000 to 19,999 9.8 8.7 10.3 9.1
>=20,000 9.3 8.7 9.7 9.1Casement only 9.5 10.0
Casement-Slider 10.4 10.8Side louvers extend from a room air conditioner model in order to position the unit in a window. A model without louvered sides is placed in a built-in wall sleeve and are commonly referred to as "through-the-wall" or "built-in" models.
Casement-only refers to a room air conditioner designed for mounting in a casement window of a specific size.
Casement-slider refers to a room air conditioner with an encased assembly designed for mounting in a sliding or casement window of a specific size.
Reverse cycle refers to the heating function found in certain room air conditioner models.
b) Early Replacement: the early removal of an existing residential inefficient Room AC unit from service, prior to its natural end of life, and replacement with a new ENERGY STAR qualifying unit. Savings are calculated between existing unit and efficient unit consumption during the remaining life of the existing unit, and between new baseline unit and efficient unit consumption for the remainder of the measure life.
This measure was developed to be applicable to the following program types: TOS, NC, EREP.
If applied to other program types, the measure savings should be verified.
DEFINITION OF EFFICIENT EQUIPMENT
To qualify for this measure the new room air conditioning unit must meet the ENERGY STAR version 4.0 (effective October 26th 2015)81 efficiency standards presented above.
79 See DOE’s Appliance and Equipment Standards for Room AC; https://www1.eere.energy.gov/buildings/appliance_standards/product.aspx/productid/4180 ENERGY STAR Version 4.0 Room Air Conditioners Program Requirements81 ENERGY STAR Version 4.0 Room Air Conditioners Program Requirements
IL TRM v6.0 Vol. 3_January 25th, 2017_DRAFT Page 33 of 296

Illinois Statewide Technical Reference Manual – 5.1.1 ENERGY STAR Air Purifier/Cleaner
DEFINITION OF BASELINE EQUIPMENT
Time of Sale: the baseline assumption is a new room air conditioning unit that meets the Federal Standard (effective June 1st, 2014)82 efficiency standards as presented above.
Early Replacement: the baseline is the existing Room AC for the assumed remaining useful life of the unit and the new baseline as defined above for the remainder of the measure life.
DEEMED LIFETIME OF EFFICIENT EQUIPMENT
The measure life is assumed to be 12 years83.
Remaining life of existing equipment is assumed to be 4 years84
DEEMED MEASURE COST
Time of Sale: The incremental cost for this measure is assumed to be $40 for a ENERGY STAR unit85.
Early Replacement: The measure cost is the full cost of removing the existing unit and installing a new one. The actual program cost should be used. If unavailable assume $448 for ENERGY STAR unit86.
The avoided replacement cost (after 4 years) of a baseline replacement unit is $432. 87 This cost should be discounted to present value using the nominal societal discount rate.
LOADSHAPE
Loadshape R08 - Residential Cooling
COINCIDENCE FACTOR
The coincidence factor for this measure is assumed to be 0.388.
Algorithm
CALCULATION OF SAVINGS
ELECTRIC ENERGY SAVINGS
Time of Sale: ΔkWh = (FLHRoomAC * Btu/H * (1/CEERbase - 1/CEERee))/1000
Early Replacment:
ΔkWh for remaining life of existing unit (1 st 4 years) = (FLHRoomAC * Btu/H * (1/(EERexist/1.01) - 1/CEERee))/1000
82 See DOE’s Appliance and Equipment Standards for Room AC; https://www1.eere.energy.gov/buildings/appliance_standards/product.aspx/productid/4183 Measure Life Report, Residential and Commercial/Industrial Lighting and HVAC Measures, GDS Associates, June 2007.http://neep.org/uploads/EMV%20Forum/EMV%20Studies/measure_life_GDS%5B1%5D.pdf 84 Standard assumption of one third of effective useful life. 85 Incremental cost based on field study conducted by Efficiency Vermont.86 Based on IL PHA Efficient Living Program Data for 810 replaced units showing $416 per unit plus $32 average recycling/removal cost.87 Estimate based upon Time of Sale incremental costs and applying inflation rate of 1.91%.88 Consistent with coincidence factors found in: RLW Report: Final Report Coincidence Factor Study Residential Room Air Conditioners, June 23, 2008 (http://www.puc.nh.gov/Electric/Monitoring%20and%20Evaluation%20Reports/National%20Grid/117_RLW_CF%20Res%20RAC.pdf)
IL TRM v6.0 Vol. 3_January 25th, 2017_DRAFT Page 34 of 296

Illinois Statewide Technical Reference Manual – 5.1.1 ENERGY STAR Air Purifier/Cleaner
ΔkWh for remaining measure life (next 8 years) = (FLHRoomAC * Btu/H * (1/CEERbase - 1/CEERee))/1000
Where:
FLHRoomAC = Full Load Hours of room air conditioning unit
= dependent on location89:
Climate Zone(City based upon) FLHRoomAC
1 (Rockford) 2202 (Chicago) 2103 (Springfield) 3194 (Belleville) 4285 (Marion) 374Weighted Average90 248
Btu/H = Size of rebated unit
= Actual. If unknown assume 8500 Btu/hr91
EERexist =Efficiency of existing unit
= Actual. If unknown assume 7.792
1.01 = Factor to convert EER to CEER (CEER includes standby and off power consumption)93.
CEERbase = Combined Energy Efficiency Ratio of baseline unit
= As provided in tables above
CEERee = Combined Energy Efficiency Ratio of ENERGY STAR unit
= Actual. If unknown assume minimum qualifying standard as provided in tables above
89 Full load hours for room AC is significantly lower than for central AC. The average ratio of FLH for Room AC (provided in RLW Report: Final Report Coincidence Factor Study Residential Room Air Conditioners, June 23, 2008) to FLH for Central Cooling for the same location (provided by AHRI: http://www.energystar.gov/ia/business/bulk_purchasing/bpsavings_calc/Calc_CAC.xls) is 31%. This ratio is applied to those IL cities that have FLH for Central Cooling provided in the Energy Star calculator. For other cities this is extrapolated using the FLH assumptions VEIC have developed for Central AC. There is a county mapping table in Volume 1, Section 3.7 providing the appropriate city to use for each county of Illinois.90 Weighted based on number of residential occupied housing units in each zone.91 Based on maximum capacity average from the RLW Report: Final Report Coincidence Factor Study Residential Room Air Conditioners, June 23, 200892 Based on Nexus Market Research Inc, RLW Analytics, December 2005; “Impact, Process, and Market Study of the Connecticut Appliance Retirement Program: Overall Report.”93 Since the existing unit will be rated in EER, this factor is used to appropriately compare with the new CEER rating. Version 3.0 of the ENERGY STAR specification provided equivalent EER and CEER ratings and for the most popular size band the EER rating is approximately 1% higher than the CEER. See ‘ENERGY STAR Version 3.0 Room Air Conditioners Program Requirements’.
IL TRM v6.0 Vol. 3_January 25th, 2017_DRAFT Page 35 of 296

Illinois Statewide Technical Reference Manual – 5.1.1 ENERGY STAR Air Purifier/Cleaner
SUMMER COINCIDENT PEAK DEMAND SAVINGS
Time of Sale: ΔkW = Btu/H * ((1/(CEERbase *1.01) - 1/(CEERee * 1.01)))/1000) * CF
Early Replacement: ΔkW = Btu/H * ((1/EERexist - 1/(CEERee * 1.01)))/1000) * CF
Where:
CF = Summer Peak Coincidence Factor for measure
= 0.394
1.01 = Factor to convert CEER to EER (CEER includes standby and off power consumption)95.
Other variable as defined above
94 Consistent with coincidence factors found in: RLW Report: Final Report Coincidence Factor Study Residential Room Air Conditioners, June 23, 200895 Since the new CEER rating includes standby and off power consumption, for peak calculations it is more appropriate to apply the EER rating, but it appears as though new units will only be rated with a CEER rating. Version 3.0 of the ENERGY STAR specification provided equivalent EER and CEER ratings and for the most popular size band the EER rating is approximately 1% higher than the CEER. See ‘ENERGY STAR Version 3.0 Room Air Conditioners Program Requirements’.
IL TRM v6.0 Vol. 3_January 25th, 2017_DRAFT Page 36 of 296
Time of Sale:
For example for an 8,500 Btu/H capacity unit, with louvered sides, in an unknown location:
ΔkWHCEE TIER 1 = (248 * 8500 * (1/10.9 – 1/11.4)) / 1000
= 8.5 kWh
Early Replacement:
A 7.7EER, 9000Btu/h unit is removed from a home in Springfield and replaced with an ENERGY STAR unit with louvered sides:
ΔkWh for remaining life of existing unit (1st 4 years) = (319 * 9000 * (1/(7.7/1.01) - 1/11.4))/1000
= 124.7 kWh
ΔkWh for remaining measure life (next 8 years) = (319 * 9000 * (1/10.9 - 1/11.4))/1000
= 11.6 kWh
Time of Sale:
For example for an 8,500 Btu/H capacity unit, with louvered sides, for an unknown location:
ΔkWCEE TIER 1 = (8500 * (1/(10.9 * 1.01) – 1/(11.4*1.01))) / 1000 * 0.3
= 0.010 kW
Early Replacement:
A 7.7 EER, 9000Btu/h unit is removed from a home in Springfield and replaced with an ENERGY STAR unit with louvered sides:
ΔkW for remaining life of existing unit (1st 4 years) = (9000 * (1/7.7 - 1/(11.4 * 1.01)))/1000 * 0.3
= 0.12 kW
ΔkW for remaining measure life (next 8 years) = (9000 * (1/(10.9 * 1.01) - 1/(11.4 * 1.01)))/1000 * 0.3
= 0.011 kW
Illinois Statewide Technical Reference Manual – 5.1.1 ENERGY STAR Air Purifier/Cleaner
NATURAL GAS SAVINGS
N/A
WATER IMPACT DESCRIPTIONS AND CALCULATION
N/A
DEEMED O&M COST ADJUSTMENT CALCULATION
N/A
MEASURE CODE: RS-APL-ESRA-V06-180101
REVIEW DEADLINE: 1/1/2021
IL TRM v6.0 Vol. 3_January 25th, 2017_DRAFT Page 37 of 296

Illinois Statewide Technical Reference Manual – 5.1.1 ENERGY STAR Air Purifier/Cleaner
5.1.8 Refrigerator and Freezer Recycling
DESCRIPTION
This measure describes savings from the retirement and recycling of inefficient but operational refrigerators and freezers. Savings are provided based on a 2013 workpaper provided by Cadmus that used data from a 2012 ComEd metering study and metering data from a Michigan study, to develop a regression equation that uses key inputs describing the retired unit. The savings are equivalent to the Unit Energy Consumption of the retired unit and should be claimed for the assumed remaining useful life of that unit. A part use factor is applied to account for those secondary units that are not in use throughout the entire year. The reader should note that the regression algorithm is designed to provide an accurate portrayal of savings for the population as a whole and includes those parameters that have a significant effect on the consumption. The precision of savings for individual units will vary.
The Net to Gross factor applied to these units should incorporate adjustments that account for:
Those participants who would have removed the unit from the grid anyway (e.g. customers replacing their refrigerator via a big box store and using the pick-up option, customers taking their unit to the landfill or recycling station);
Those participants who decided, based on the incentive provided by the Appliance Recycling program alone, to replace their existing inefficient unit with a new unit. This segment of participants is expected to be very small and documentation of their intentions will be gathered via telephone surveys (i.e., primary data sources). For such customers, the consumption of the new unit should be subtracted from the retired unit consumption and savings claimed for the remaining life of the existing unit. Note that participants who were already planning to replace their unit, and the incentive just ensured that the retired unit was recycled and not placed on the secondary market, should not be included in this adjustment.
This measure was developed to be applicable to the following program types: ERET.
If applied to other program types, the measure savings should be verified.
DEFINITION OF EFFICIENT EQUIPMENT
N/A
DEFINITION OF BASELINE EQUIPMENT
The existing inefficient unit must be operational and have a capacity of between 10 and 30 cubic feet.
DEEMED LIFETIME OF EFFICIENT EQUIPMENT
The estimated remaining useful life of the recycling units is 8 years 96.
DEEMED MEASURE COST
Measure cost includes the customer’s value placed on their lost amenity, any customer transaction costs, and the cost of pickup and recycling of the refrigerator/freezer and should be based on actual costs of running the program. The payment (bounty) a Program Administrator makes to the customer serves as a proxy for the value the customer places on their lost amenity and any customer transaction costs. If unknown assume $17097 per unit.
96 KEMA “Residential refrigerator recycling ninth year retention study”, 2004 97 The $170 default assumption is based on $120 cost of pickup and recycling per unit and $50 proxy for customer transaction costs and value customer places on their lost amenity. $120 is cost of pickup and recycling based on similar Efficiency Vermont program. $50 is bounty, based on Ameren and ComEd program offerings as of 7/27/15.
IL TRM v6.0 Vol. 3_January 25th, 2017_DRAFT Page 38 of 296

Illinois Statewide Technical Reference Manual – 5.1.1 ENERGY STAR Air Purifier/Cleaner
LOADSHAPE
Loadshape R05 - Residential Refrigerator
COINCIDENCE FACTOR
The coincidence factor is assumed to be 0.00012.
Algorithm
CALCULATION OF SAVINGS
ENERGY SAVINGS98
Refrigerators:
Energy savings for refrigerators are based upon a linear regression model using the following coefficients99:
Independent Variable Description Estimate CoefficientIntercept 83.324Age (years) 3.678Pre-1990 (=1 if manufactured pre-1990) 485.037Size (cubic feet) 27.149Dummy: Side-by-Side (= 1 if side-by-side) 406.779Dummy: Primary Usage Type (in absence of the program) (= 1 if primary unit) 161.857
Interaction: Located in Unconditioned Space x CDD/365.25 15.366Interaction: Located in Unconditioned Space x HDD/365.25 -11.067
ΔkWh = [83.32 + (Age * 3.68) + (Pre-1990 * 485.04) + (Size * 27.15) + (Side-by-side * 406.78) + (Proportion of Primary Appliances * 161.86) + (CDD/365.25 * unconditioned * 15.37) + (HDD/365.25 *unconditioned *-11.07)] * Part Use Factor
Where:
Age = Age of retired unit
Pre-1990 = Pre-1990 dummy (=1 if manufactured pre-1990, else 0)
Size = Capacity (cubic feet) of retired unit
Side-by-side = Side-by-side dummy (= 1 if side-by-side, else 0)
Primary Usage = Primary Usage Type (in absence of the program) dummy
(= 1 if Primary, else 0)
Interaction: Located in Unconditioned Space x CDD/365.25
98 Based on the specified regression, a small number of units may have negative energy and demand consumption. These are a function of the unit size and age, and should comprise a very small fraction of the population. While on an individual basis this result is counterintuitive it is important that these negative results remain such that as a population the average savings is appropriate.99 Energy savings are based on an average 30-year TMY temperature of 51.1 degrees. Coefficients provided in July 30, 2014 memo from Cadmus: “Appliance Recycling Update no single door July 30 2014”.
IL TRM v6.0 Vol. 3_January 25th, 2017_DRAFT Page 39 of 296

Illinois Statewide Technical Reference Manual – 5.1.1 ENERGY STAR Air Purifier/Cleaner
(=1 * CDD/365.25 if in unconditioned space)
CDD = Cooling Degree Days
= Dependent on location100:
Climate Zone(City based
upon)CDD 65 CDD/365.25
1 (Rockford) 820 2.252 (Chicago) 842 2.313 (Springfield) 1,108 3.034 (Belleville) 1,570 4.305 (Marion) 1,370 3.75
Interaction: Located in Unconditioned Space x HDD/365.25
(=1 * HDD/365.25 if in unconditioned space)
HDD = Heating Degree Days
= Dependent on location:101
Climate Zone(City based upon) HDD 65 HDD/365.25
1 (Rockford) 6,569 17.982 (Chicago) 6,339 17.363 (Springfield) 5,497 15.054 (Belleville) 4,379 11.995 (Marion) 4,476 12.25
Part Use Factor = To account for those units that are not running throughout the entire year. The most recent part-use factor participant survey results available at the start of the current program year shall be used102. For illustration purposes, this example uses 0.93.103
Freezers:
Energy savings for freezers are based upon a linear regression model using the following
100 National Climatic Data Center, calculated from 1981-2010 climate normals with a base temp of 65°F.101 National Climatic Data Center, calculated from 1981-2010 climate normals with a base temp of 65°F. 102 For example, the part-use factor that shall be applied to the current program year t (PYt) for savings verification purposes should be determined through the PYt-2 participant surveys conducted in the respective utility’s service territory, if available. If an evaluation was not performed in PYt-2 the latest available evaluation should be used. 103 Most recent refrigerator part-use factor from Ameren Illinois PY5 evaluation.
IL TRM v6.0 Vol. 3_January 25th, 2017_DRAFT Page 40 of 296
For example, the program averages for AIC’s ARP in PY4 produce the following equation:
ΔkWh = [83.32 + (22.81 * 3.68) + (0.45 * 485.04) + (18.82 * 27.15) + (0.17 * 406.78) + (0.34 * 161.86) + (1.29 * 15.37) + (6.49 * -11.07)] * 0.93
= 969 * 0.93
= 900.9 kWh

Illinois Statewide Technical Reference Manual – 5.1.1 ENERGY STAR Air Purifier/Cleaner
coefficients104:
Independent Variable Description Estimate CoefficientIntercept 132.122Age (years) 12.130Pre-1990 (=1 if manufactured pre-1990) 156.181Size (cubic feet) 31.839Chest Freezer Configuration (=1 if chest freezer) -19.709Interaction: Located in Unconditioned Space x CDD/365.25 9.778Interaction: Located in Unconditioned Space x HDD/365.25 -12.755
ΔkWh = [132.12 + (Age * 12.13) + (Pre-1990 * 156.18) + (Size * 31.84) + (Chest Freezer * -19.71) + (CDDs* unconditioned *9.78) + (HDDs*unconditioned *-12.75)] * Part Use Factor
Where:
Age = Age of retired unit
Pre-1990 = Pre-1990 dummy (=1 if manufactured pre-1990, else 0)
Size = Capacity (cubic feet) of retired unit
Chest Freezer = Chest Freezer dummy (= 1 if chest freezer, else 0)
Interaction: Located in Unconditioned Space x CDD/365.25
(=1 * CDD/365.25 if in unconditioned space)
CDD = Cooling Degree Days (see table above)
Interaction: Located in Unconditioned Space x HDD/365.25
(=1 * HDD/365.25 if in unconditioned space)
HDD = Heating Degree Days (see table above)
Part Use Factor = To account for those units that are not running throughout the entire year. The most recent part-use factor participant survey results available at the start of the current program year shall be used105. . For illustration purposes, the example uses 0.85.106
104 Energy savings are based on an average 30-year TMY temperature of 51.1 degrees. Coefficients provided in January 31, 2013 memo from Cadmus: “Appliance Recycling Update”.105 For example, the part-use factor that shall be applied to the current program year t (PYt) for savings verification purposes should be determined through the PYt-2 participant surveys conducted in the respective utility’s service territory, if available. If an evaluation was not performed in PYt-2 the latest available evaluation should be used. 106 Most recent freezer part-use factor from Ameren Illnois Company PY5 evaluation.
IL TRM v6.0 Vol. 3_January 25th, 2017_DRAFT Page 41 of 296
The program averages for AIC’s ARP PY4 program are used as an example.
ΔkWh = [132.12 + (26.92 * 12.13) + (0.6 * 156.18) + (15.9 * 31.84) + (0.48 * -19.71) + (6.61 * 9.78) + (1.3 * -12.75)] * 0.825
= 977 * 0.825
= 905 kWh

Illinois Statewide Technical Reference Manual – 5.1.1 ENERGY STAR Air Purifier/Cleaner
SUMMER COINCIDENT PEAK DEMAND SAVINGS
ΔkW = kWh/8766 * CF
Where:
kWh = Savings provided in algorithm above
CF = Coincident factor defined as summer kW/average kW
= 1.081 for Refrigerators
= 1.028 for Freezers107
NATURAL GAS SAVINGS
N/A
WATER IMPACT DESCRIPTIONS AND CALCULATION
N/A
DEEMED O&M COST ADJUSTMENT CALCULATION
N/A
MEASURE CODE: RS-APL-RFRC-V06-160601
REVIEW DEADLINE: 1/1/2022
107 Cadmus memo, February 12, 2013; “Appliance Recycling Update”
IL TRM v6.0 Vol. 3_January 25th, 2017_DRAFT Page 42 of 296
For example, the program averages for AIC’s ARP in PY4 produce the following equation:
ΔkW = 806/8766 * 1.081
= 0.099 kW
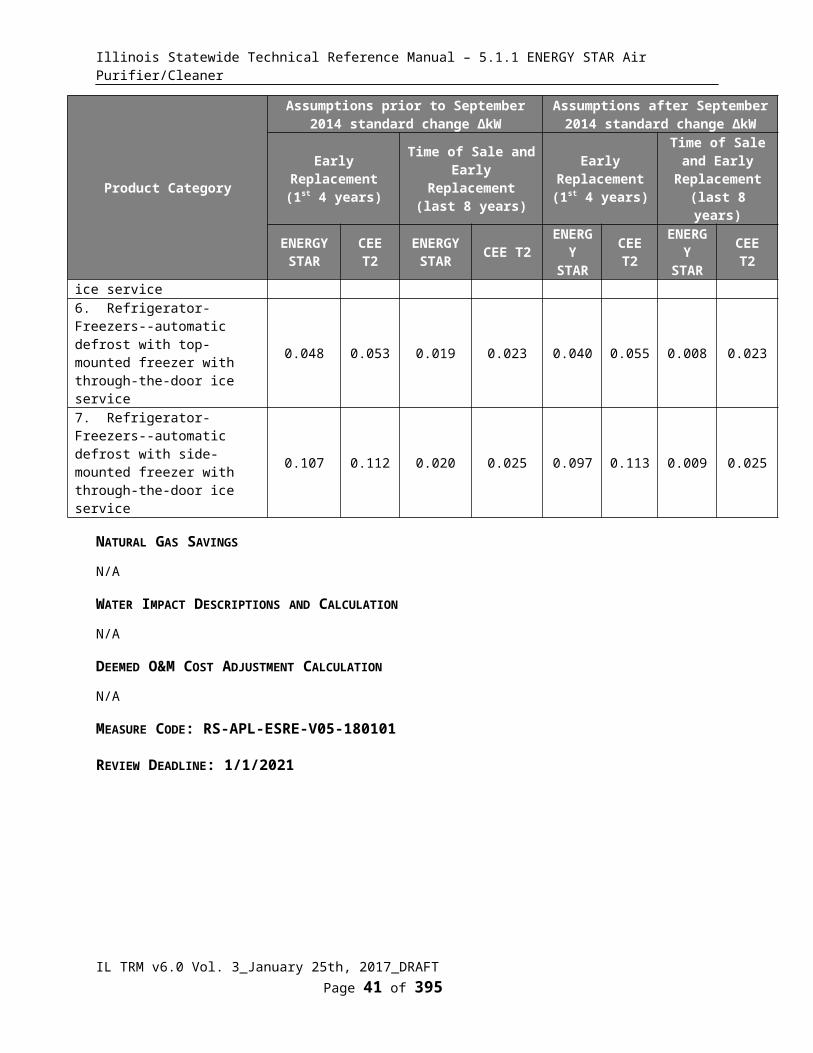
Illinois Statewide Technical Reference Manual – 5.1.1 ENERGY STAR Air Purifier/Cleaner
5.1.9 Room Air Conditioner Recycling
DESCRIPTION
This measure describes the savings resulting from running a drop off service taking existing residential, inefficient Room Air Conditioner units from service, prior to their natural end of life. This measure assumes that though a percentage of these units will be replaced this is not captured in the savings algorithm since it is unlikely that the incentive made someone retire a unit that they weren’t already planning to retire. The savings therefore relate to the unit being taken off the grid as opposed to entering the secondary market. The Net to Gross factor applied to these units should incorporate adjustments that account for those participants who would have removed the unit from the grid anyway.
This measure was developed to be applicable to the following program types: ERET.
If applied to other program types, the measure savings should be verified.
DEFINITION OF EFFICIENT EQUIPMENT
N/A. This measure relates to the retiring of an existing inefficient unit.
DEFINITION OF BASELINE EQUIPMENT
The baseline condition is the existing inefficient room air conditioning unit.
DEEMED LIFETIME OF EFFICIENT EQUIPMENT
The assumed remaining useful life of the existing room air conditioning unit being retired is 4 years108.
DEEMED MEASURE COST
The actual implementation cost for recycling the existing unit should be used.
LOADSHAPE
Loadshape R08 - Residential Cooling
COINCIDENCE FACTOR
The coincidence factor for this measure is assumed to be 30%109.
Algorithm
CALCULATION OF SAVINGS
ELECTRIC ENERGY SAVINGS
ΔkWh = ((FLHRoomAC * Btu/hr * (1/EERexist))/1000)
Where:
FLHRoomAC= Full Load Hours of room air conditioning unit
108 A third of assumed measure life for Room AC.109 Consistent with coincidence factors found in: RLW Report: Final Report Coincidence Factor Study Residential Room Air Conditioners, June 23, 2008 (http://www.puc.nh.gov/Electric/Monitoring%20and%20Evaluation%20Reports/National%20Grid/117_RLW_CF%20Res%20RAC.pdf)
IL TRM v6.0 Vol. 3_January 25th, 2017_DRAFT Page 43 of 296
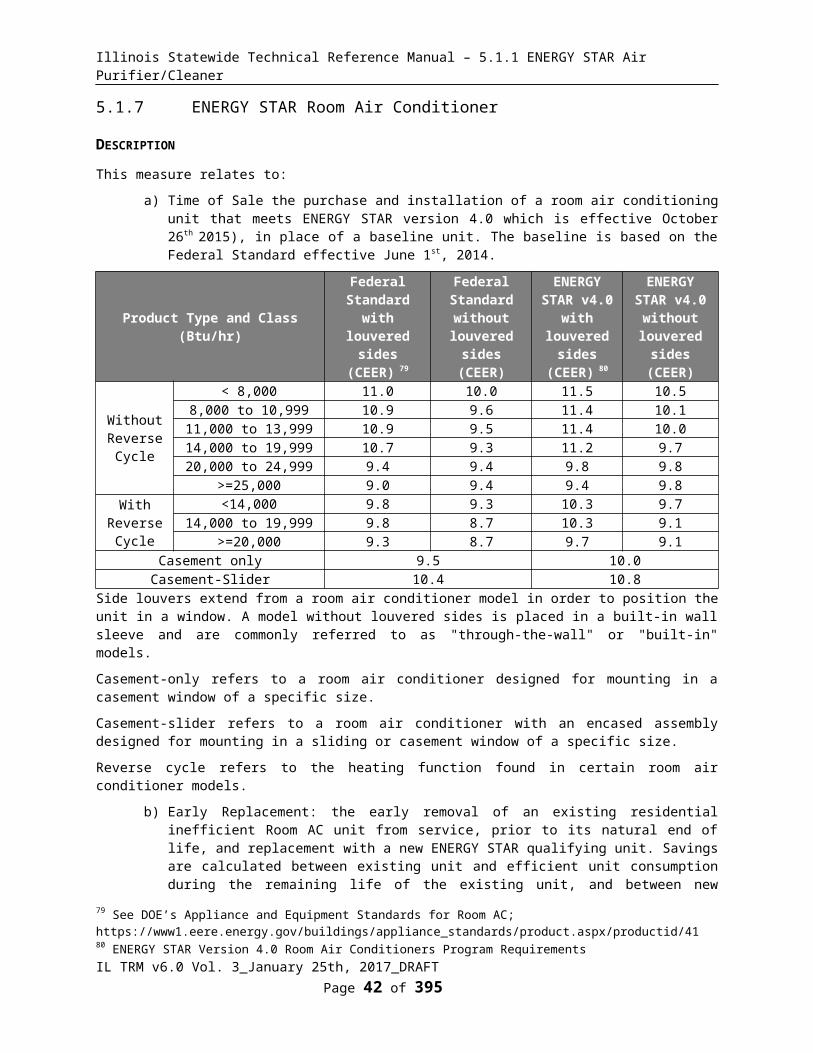
Illinois Statewide Technical Reference Manual – 5.1.1 ENERGY STAR Air Purifier/Cleaner
= dependent on location110:
Climate Zone(City based upon) FLHRoomAC
1 (Rockford) 2202 (Chicago) 2103 (Springfield) 3194 (Belleville) 4285 (Marion) 374Weighted Average111 248
Btu/H = Size of retired unit
= Actual. If unknown assume 8500 Btu/hr 112
EERexist = Efficiency of existing unit
= 7.7113
SUMMER COINCIDENT PEAK DEMAND SAVINGS
ΔkW = (Btu/hr * (1/EERexist))/1000) * CF
Where:
CF = Summer Peak Coincidence Factor for measure
= 0.3114
110 The average ratio of FLH for Room AC (provided in RLW Report: Final Report Coincidence Factor Study Residential Room Air Conditioners, June 23, 2008: http://www.puc.nh.gov/Electric/Monitoring%20and%20Evaluation%20Reports/National%20Grid/117_RLW_CF%20Res%20RAC.pdf) to FLH for Central Cooling for the same location (provided by AHRI: http://www.energystar.gov/ia/business/bulk_purchasing/bpsavings_calc/Calc_CAC.xls) is 31%. This ratio is applied to those IL cities that have FLH for Central Cooling provided in the Energy Star calculator. For other cities this is extrapolated using the FLH assumptions VEIC have developed for Central AC. There is a county mapping table in Volume 1, Section 3.7 providing the appropriate city to use for each county of Illinois.111 Weighted based on number of residential occupied housing units in each zone.112 Based on maximum capacity average from the RLW Report: Final Report Coincidence Factor Study Residential Room Air Conditioners, June 23, 2008113 Based on Nexus Market Research Inc, RLW Analytics, December 2005; “Impact, Process, and Market Study of the Connecticut Appliance Retirement Program: Overall Report.”114 Consistent with coincidence factors found in:RLW Report: Final Report Coincidence Factor Study Residential Room Air Conditioners, June 23, 2008 (http://www.puc.nh.gov/Electric/Monitoring%20and%20Evaluation%20Reports/National%20Grid/117_RLW_CF%20Res%20RAC.pdf)
IL TRM v6.0 Vol. 3_January 25th, 2017_DRAFT Page 44 of 296
For example for an 8500 Btu/h unit in Springfield:
kWh = ((319 * 8500 * (1/7.7)) / 1000)
= 352 kWh
For example an 8500 Btu/h unit:
kW = (8500 * (1/7.7)) / 1000) * 0.3
= 0.33 kW

Illinois Statewide Technical Reference Manual – 5.1.1 ENERGY STAR Air Purifier/Cleaner
NATURAL GAS SAVINGS
N/A
WATER IMPACT DESCRIPTIONS AND CALCULATION
N/A
DEEMED O&M COST ADJUSTMENT CALCULATION
N/A
MEASURE CODE: RS-APL-RARC-V01-120601
REVIEW DEADLINE: 1/1/2019
IL TRM v6.0 Vol. 3_January 25th, 2017_DRAFT Page 45 of 296

Illinois Statewide Technical Reference Manual – 5.1.1 ENERGY STAR Air Purifier/Cleaner
5.1.10 ENERGY STAR Clothes Dryer
DESCRIPTION
This measure relates to the installation of a residential clothes dryer meeting the ENERGY STAR criteria. ENERGY STAR qualified clothes dryers save energy through a combination of more efficient drying and reduced runtime of the drying cycle. More efficient drying is achieved through increased insulation, modifying operating conditions such as air flow and/or heat input rate, improving air circulation through better drum design or booster fans, and improving efficiency of motors. Reducing the runtime of dryers through automatic termination by temperature and moisture sensors is believed to have the greatest potential for reducing energy use in clothes dryers 115. ENERGY STAR provides criteria for both gas and electric clothes dryers.
This measure was developed to be applicable to the following program types: TOS, NC. If applied to other program types, the measure savings should be verified.
DEFINITION OF EFFICIENT EQUIPMENT
Clothes dryer must meet the ENERGY STAR criteria, as required by the program.
DEFINITION OF BASELINE EQUIPMENT
The baseline condition is a clothes dryer meeting the minimum federal requirements for units manufactured on or after January 1, 2015.
DEEMED LIFETIME OF EFFICIENT EQUIPMENT
The expected measure life is assumed to be 14 years116.
DEEMED MEASURE COST
The incremental cost for an ENERGY STAR clothes dryer is assumed to be $152117
LOADSHAPE
N/A
COINCIDENCE FACTOR
The coincidence factor for this measure is 3.8%118.
115 ENERGY STAR Market & Industry Scoping Report. Residential Clothes Dryers. Table 8. November 2011. http://www.energystar.gov/ia/products/downloads/ENERGY_STAR_Scoping_Report_Residential_Clothes_Dryers.pdf116 Based on an average estimated range of 12-16 years. ENERGY STAR Market & Industry Scoping Report. Residential Clothes Dryers. November 2011. http://www.energystar.gov/ia/products/downloads/ENERGY_STAR_Scoping_Report_Residential_Clothes_Dryers.pdf117 Based on the difference in installed cost for an efficient dryer ($716) and standard dryer ($564). http://www.aceee.org/files/proceedings/2012/data/papers/0193-000286.pdf118 Based on coincidence factor of 3.8% for clothes washers
IL TRM v6.0 Vol. 3_January 25th, 2017_DRAFT Page 46 of 296
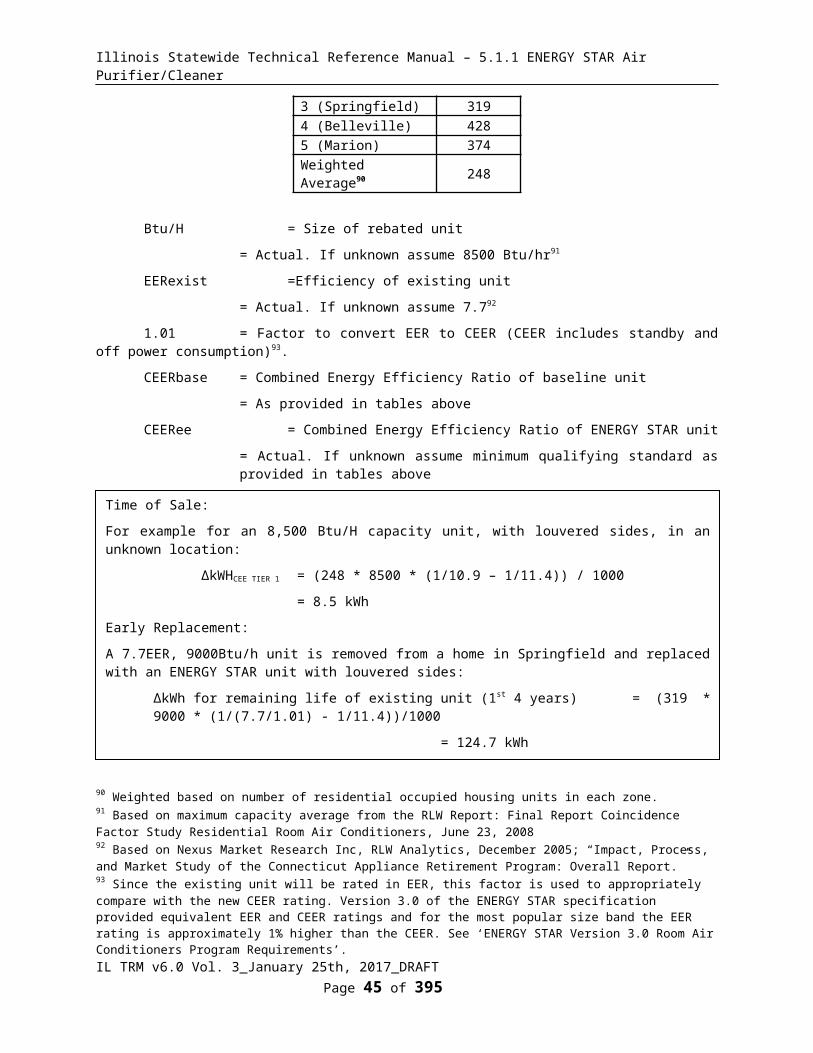
Illinois Statewide Technical Reference Manual – 5.1.1 ENERGY STAR Air Purifier/Cleaner
Algorithm
CALCULATION OF ENERGY SAVINGS
ELECTRIC ENERGY SAVINGS
∆kWh = (Load/CEFbase – Load/CEFeff) * Ncycles * %Electric
Where:
Load = The average total weight (lbs) of clothes per drying cycle. If dryer size is unknown, assume standard.
Dryer Size Load (lbs)119
Standard 8.45Compact 3
CEFbase = Combined energy factor (CEF) (lbs/kWh) of the baseline unit is based on existing federal standards energy factor and adjusted to CEF as performed in the ENERGY STAR analysis120. If product class unknown, assume electric, standard.
Product Class CEF (lbs/kWh)Vented Electric, Standard (≥ 4.4 ft3) 3.11Vented Electric, Compact (120V) (< 4.4 ft3) 3.01Vented Electric, Compact (240V) (<4.4 ft3) 2.73Ventless Electric, Compact (240V) (<4.4 ft3) 2.13Vented Gas 2.84121
CEFeff = CEF (lbs/kWh) of the ENERGY STAR unit based on ENERGY STAR requirements. 122 If product class unknown, assume electric, standard.
Product Class CEF (lbs/kWh)Vented or Ventless Electric, Standard (≥ 4.4 ft3) 3.93Vented or Ventless Electric, Compact (120V) (< 4.4 ft3) 3.80Vented Electric, Compact (240V) (< 4.4 ft3) 3.45Ventless Electric, Compact (240V) (< 4.4 ft3) 2.68Vented Gas 3.48123
Ncycles = Number of dryer cycles per year. Use actual data if available. If unknown, use 283
119 Based on ENERGY STAR test procedures. https://www.energystar.gov/index.cfm?c=clothesdry.pr_crit_clothes_dryers120 ENERGY STAR Draft 2 Version 1.0 Clothes Dryers Data and Analysis121 Federal standards report CEF for gas clothes dryers in terms of lbs/kWh. To determine gas savings, this number is later converted to therms.122 ENERGY STAR Clothes Dryers Key Product Criteria. https://www.energystar.gov/index.cfm?c=clothesdry.pr_crit_clothes_dryers123 Federal standards report CEF for gas clothes dryers in terms of lbs/kWh. To determine gas savings, this number is later converted to therms.
IL TRM v6.0 Vol. 3_January 25th, 2017_DRAFT Page 47 of 296

Illinois Statewide Technical Reference Manual – 5.1.1 ENERGY STAR Air Purifier/Cleaner
cycles per year.124
%Electric = The percent of overall savings coming from electricity
= 100% for electric dryers, 16% for gas dryers125
SUMMER COINCIDENT PEAK DEMAND SAVINGS
ΔkW = ΔkWh/Hours * CF
Where:
ΔkWh = Energy Savings as calculated above
Hours = Annual run hours of clothes dryer. Use actual data if available. If unknown, use 283 hours per year.126
CF = Summer Peak Coincidence Factor for measure
= 3.8%127
NATURAL GAS SAVINGS
Natural gas savings only apply to ENERGY STAR vented gas clothes dryers.
∆Therm = (Load/EFbase – Load/CEFeff) * Ncycles * Therm_convert * %Gas
Where:
Therm_convert = Conversion factor from kWh to Therm
= 0.03413
%Gas = Percent of overall savings coming from gas
= 0% for electric units and 84% for gas units128
124 Appendix D to Subpart B of Part 430 – Uniform Test Method for Measuring the Energy Consumption of Dryers.125 %Electric accounts for the fact that some of the savings on gas dryers comes from electricity (motors, controls, etc). 16% was determined using a ratio of the electric to total savings from gas dryers given by ENERGY STAR Draft 2 Version 1.0 Clothes Dryers Data and Analysis.126 ENERGY STAR qualified dryers have a maximum test cycle time of 80 minutes. Assume one hour per dryer cycle.127 Based on coincidence factor of 3.8% for clothes washers.128 %Gas accounts for the fact that some of the savings on gas dryers comes from electricity (motors, controls, etc). 84% was determined using a ratio of the gas to total savings from gas dryers given by ENERGY STAR Draft 2 Version 1.0 Clothes Dryers
IL TRM v6.0 Vol. 3_January 25th, 2017_DRAFT Page 48 of 296
EXAMPLE
Time of Sale: For example, a standard, vented, electric clothes dryer:
ΔkWh = ((8.45/3.11 – 8.45/3.93) * 283 * 100%)
= 160 kWh
EXAMPLE
Time of Sale: For example, a standard, vented, electric clothes dryer:
ΔkW = 160/283 * 3.8%
= 0.0215 kW

Illinois Statewide Technical Reference Manual – 5.1.1 ENERGY STAR Air Purifier/Cleaner
WATER IMPACT DESCRIPTIONS AND CALCULATION
N/A
DEEMED O&M COST ADJUSTMENT CALCULATION
N/A
MEASURE CODE: RS-APL-ESDR-V01-150601
REVIEW DEADLINE: 1/1/2021
Data and Analysis.
IL TRM v6.0 Vol. 3_January 25th, 2017_DRAFT Page 49 of 296
EXAMPLE
Time of Sale: For example, a standard, vented, gas clothes dryer:
ΔTherm = (8.45/2.84 – 8.45/3.48) * 283 * 0.03413 * 0.84
= 4.44 therms

Illinois Statewide Technical Reference Manual – 5.1.1 ENERGY STAR Air Purifier/Cleaner
5.1.11 ENERGY STAR Water Coolers
DESCRIPTION
Water coolers are a home appliance that offer consumers the ability to enjoy hot and/or cold water on demand. This measure is the characterization of the purchasing and use of an ENERGY STAR certified water cooler in place of a conventional water cooler.
This measure was developed to be applicable to the following program types: TOS, NC.
If applied to other program types, the measure savings should be verified.
DEFINITION OF EFFICIENT EQUIPMENT
The high efficiency equipment is an ENERGY STAR certified water cooler meeting the ENERGY STAR 2.0 efficiency criteria.
DEFINITION OF BASELINE EQUIPMENT
The baseline equipment is a standard or conventional, non-ENERGY STAR certified water cooler.
DEEMED LIFETIME OF EFFICIENT EQUIPMENT
The estimated useful life for a water cooler is 10 years129.
DEEMED MEASURE COST
The incremental cost for this measure is estimated at $17130.
LOADSHAPE
Loadshape C53: Flat
COINCIDENCE FACTOR
The summer peak coincidence factor is assumed to be 1.0.
Algorithm
CALCULATION OF ENERGY SAVINGS
ELECTRIC ENERGY SAVINGS
ΔkWh = (kWhbase – kWhee) * Days
Where:
kWhbase = Daily energy use (kWh/day) for baseline water cooler131
Type of Water Cooler kWhbase
Hot and Cold Water – Storage 1.090Hot and Cold Water – On Demand 0.330Cold Water Only 0.290
129 Savings Calculator for ENERGY STAR Certified Water Coolers, last updated 2009.130 Ameren Missouri PY3 Evaluation Report.131 Savings Calculator for ENERGY STAR Certified Water Coolers, last updated 2009.
IL TRM v6.0 Vol. 3_January 25th, 2017_DRAFT Page 50 of 296
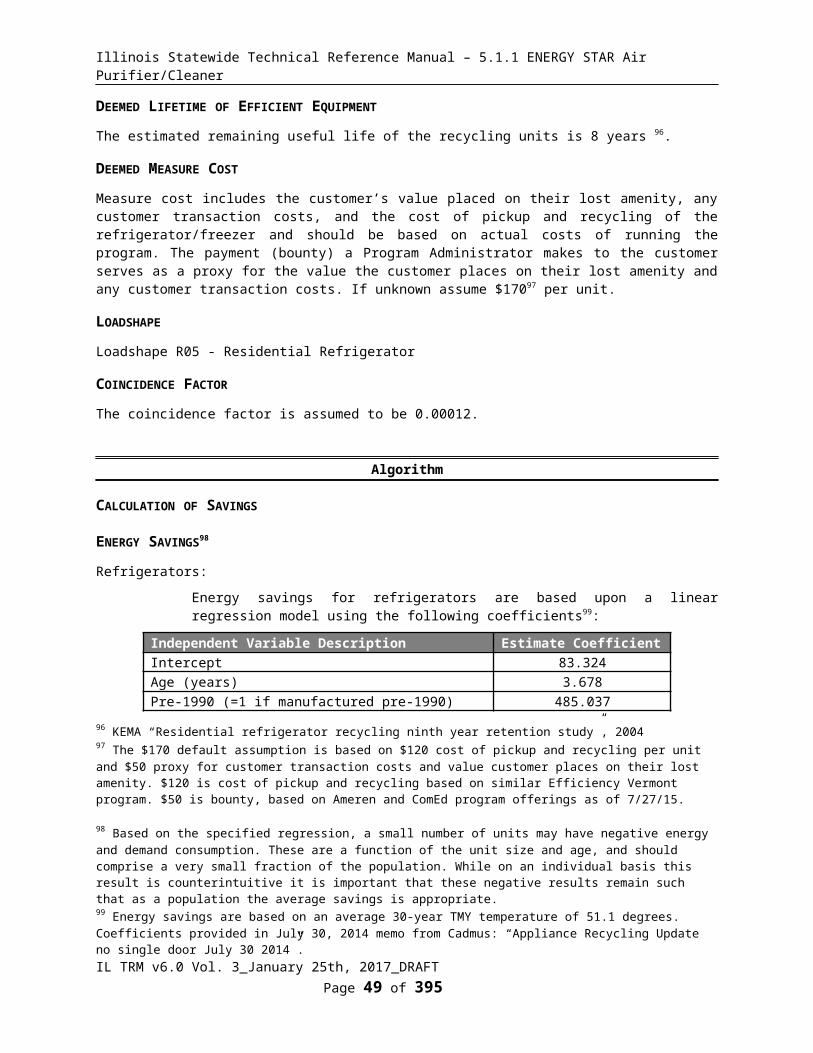
Illinois Statewide Technical Reference Manual – 5.1.1 ENERGY STAR Air Purifier/Cleaner
kWhee = Daily energy use (kWh/day) for ENERGY STAR water cooler132
Type of Water Cooler kWhee
Hot and Cold Water – Storage 0.747Hot and Cold Water – On Demand 0.170Cold Water Only 0.157
Days = Number of days per year that the water cooler is in use = 365.25 days133
Energy Savings:
Type of Water Cooler ΔkWh
Hot and Cold Water – Storage 125.4Hot and Cold Water – On Demand 58.4Cold Water Only 48.7
DEMAND SAVINGS
ΔkW = ΔkWh / Hours * CF
Where:
Hours = Number of hours per year water cooler is in use= 8766 hours134
CF = Summer Peak Coincidence Factor for measure
= 1.0
Demand Savings:
Type of Water Cooler ΔkW
Hot and Cold Water - Storage 0.0143Hot and Cold Water – On Demand 0.0067Cold Water Only 0.0056
NATURAL GAS SAVINGS
N/A
WATER AND OTHER NON-ENERGY IMPACT DESCRIPTIONS AND CALCULATION
N/A
DEEMED O&M COST ADJUSTMENT CALCULATION
N/A
132 Average kWh/day for from the ENERGY STAR efficient product database. 133 Savings Calculator for ENERGY STAR Certified Water Coolers, last updated 2009. 134 Assumed 365 days per year and 24 hours per day as utilized in daily energy consumption from ENERGY STAR Program Requirements Product Specification for Water Coolers Test Method.
IL TRM v6.0 Vol. 3_January 25th, 2017_DRAFT Page 51 of 296
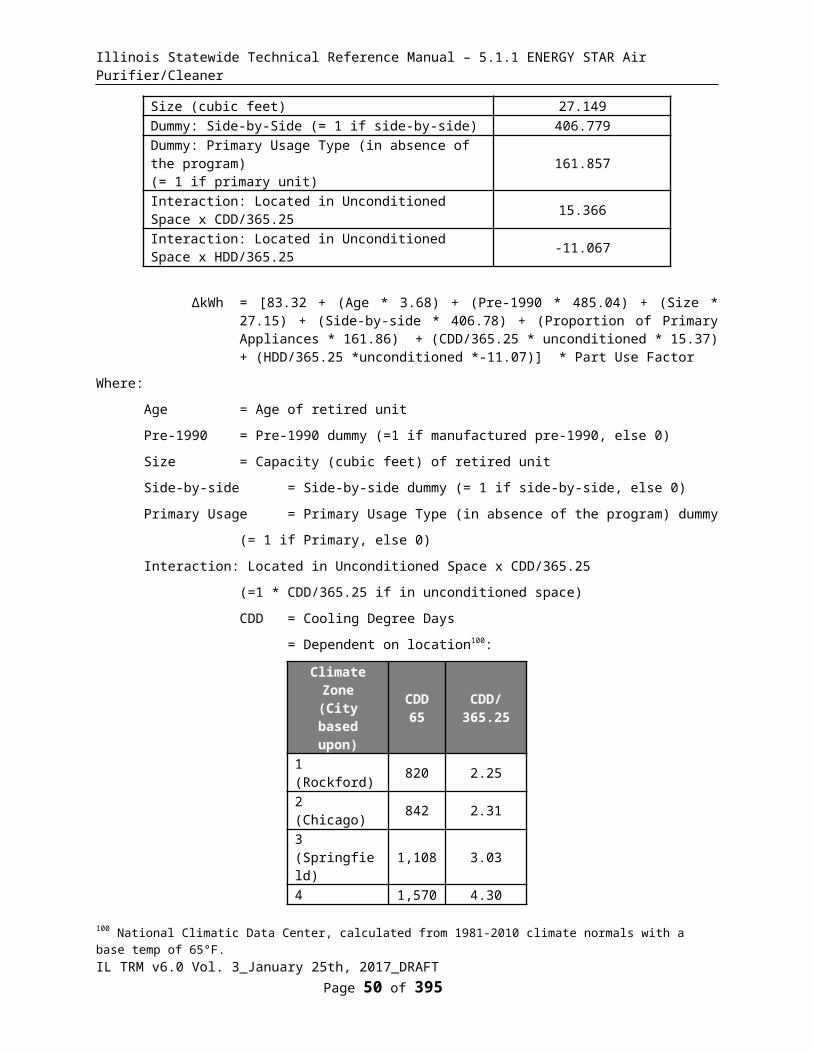
Illinois Statewide Technical Reference Manual – 5.1.1 ENERGY STAR Air Purifier/Cleaner
MEASURE CODE: RS-APL-WTCL-V01-180101
REVIEW DEADLINE: 1/1/2024
IL TRM v6.0 Vol. 3_January 25th, 2017_DRAFT Page 52 of 296

Illinois Statewide Technical Reference Manual – 5.1.1 ENERGY STAR Air Purifier/Cleaner
5.2 Consumer Electronics End Use5.2.1 Advanced Power Strip – Tier 1
DESCRIPTION
This measure relates to Advanced Power Strips – Tier 1 which are multi-plug surge protector power strips with the ability to automatically disconnect specific connected loads depending upon the power draw of a control load, also plugged into the strip. Power is disconnected from the switched (controlled) outlets when the control load power draw is reduced below a certain adjustable threshold, thus turning off the appliances plugged into the switched outlets. By disconnecting, the standby load of the controlled devices, the overall load of a centralized group of equipment (i.e. entertainment centers and home office) can be reduced. Uncontrolled outlets are also provided that are not affected by the control device and so are always providing power to any device plugged into it. This measure characterization provides savings for a 5-plug strip and a 7-plug strip.
This measure was developed to be applicable to the following program types: TOS, NC, DI, KITS.
If applied to other program types, the measure savings should be verified.
DEFINITION OF EFFICIENT EQUIPMENT
The efficient case is the use of a 5 or 7-plug advanced power strip.
DEFINITION OF BASELINE EQUIPMENT
For time of sale or new construction applications, the assumed baseline is a standard power strip that does not control connected loads.
For direct install and kits, the baseline is the existing equipment utilized in the home.
DEEMED LIFETIME OF EFFICIENT EQUIPMENT
The assumed lifetime of the advanced power strip is 7 years135.
DEEMED MEASURE COST
For time of sale or new construction the incremental cost of an advanced Tier 1 power strip over a standard power strip with surge protection is assumed to be $10136.
For direct install the actual full install cost (including labor) and for kits the full equipment cost should be used.
LOADSHAPE
Loadshape R13 - Residential Standby Losses – Entertainment
Loadshape R14 - Residential Standby Losses - Home Office
COINCIDENCE FACTOR
The summer peak coincidence factor for this measure is assumed to be 80%137.
135 This is a consistent assumption with 5.2.2 Advanced Power Strip – Tier 2. 136 Price survey performed by Illume Advising LLC for IL TRM workpaper, see “Current Surge Protector Costs and Comparison 7-2016” spreadsheet.137 Efficiency Vermont 2016 TRM coincidence factor for advanced power strip measure –in the absence of empirical evaluation data, this was based on assumptions of the typical run pattern for televisions and computers in homes.
IL TRM v6.0 Vol. 3_January 25th, 2017_DRAFT Page 53 of 296

Illinois Statewide Technical Reference Manual – 5.1.1 ENERGY STAR Air Purifier/Cleaner
Algorithm
CALCULATION OF SAVINGS
ELECTRIC ENERGY SAVINGS
ΔkWh = kWh * ISR
Where:
kWh = Assumed annual kWh savings per unit
= 56.5 kWh for 5-plug units or 103 kWh for 7-plug units138
ISR = In Service Rate, dependent on delivery mechanism
Delivery Mechanism ISREnergy Efficiency Kit 69%139
All other delivery mechanisms 100%
Using assumptions above:
# Plugs Delivery Mechanism ΔkWh
5- plugEnergy Efficiency Kit 39.0All other delivery mechanisms 56.5
7-plugEnergy Efficiency Kit 71.1All other delivery mechanisms 103.0
Unknown140 Energy Efficiency Kit 55.0All other delivery mechanisms 80.0
SUMMER COINCIDENT PEAK DEMAND SAVINGS
∆kW = ∆kWh / Hours * CF
Where:
Hours = Annual number of hours during which the controlled standby loads are turned off by the Tier 1 Advanced power Strip.
= 7,129 141
CF = Summer Peak Coincidence Factor for measure
138 NYSERDA Measure Characterization for Advanced Power Strips. Study based on review of:Smart Strip Electrical Savings and Usability, Power Smart Engineering, October 27, 2008.Final Field Research Report, Ecos Consulting, October 31, 2006. Prepared for California Energy Commission’s PIER Program.Developing and Testing Low Power Mode Measurement Methods, Lawrence Berkeley National Laboratory (LBNL), September 2004. Prepared for California Energy Commission’s Public Interest Energy Research (PIER) Program. 2005 Intrusive Residential Standby Survey Report, Energy Efficient Strategies, March, 2006. Smart Strip Portfolio of the Future, Navigant Consulting for San Diego G&E, March 31, 2009.“Smart strip” in this context refers to the category of Advanced Power Strips, does not specifically signify Smart Strip® from BITS Limited, and was used without permission. Smart Strip® is a registered trademark of BITS Smart Strip, LLC.139Average of Ameren Missouri, Potomac Edison, and PPL Electric ISR for smart strips in kits.Cadmus, “Ameren Missouri RebateSavers Impact and Process Evaluation: Program Year 2013” p. 75. Cadmus, “Process Evaluation Report, PPL Electric EE&C Plan, Program Year Five.” p. 94“Smart strip” in this context refers to the category of Advanced Power Strips, does not specifically signify Smart Strip® from BITS Limited, and was used without permission. Smart Strip® is a registered trademark of BITS Smart Strip, LLC.140 Calculated as average of 5 and 7 plug savings assumptions.141 Average of hours for controlled TV and computer from; NYSERDA Measure Characterization for Advanced Power Strips
IL TRM v6.0 Vol. 3_January 25th, 2017_DRAFT Page 54 of 296
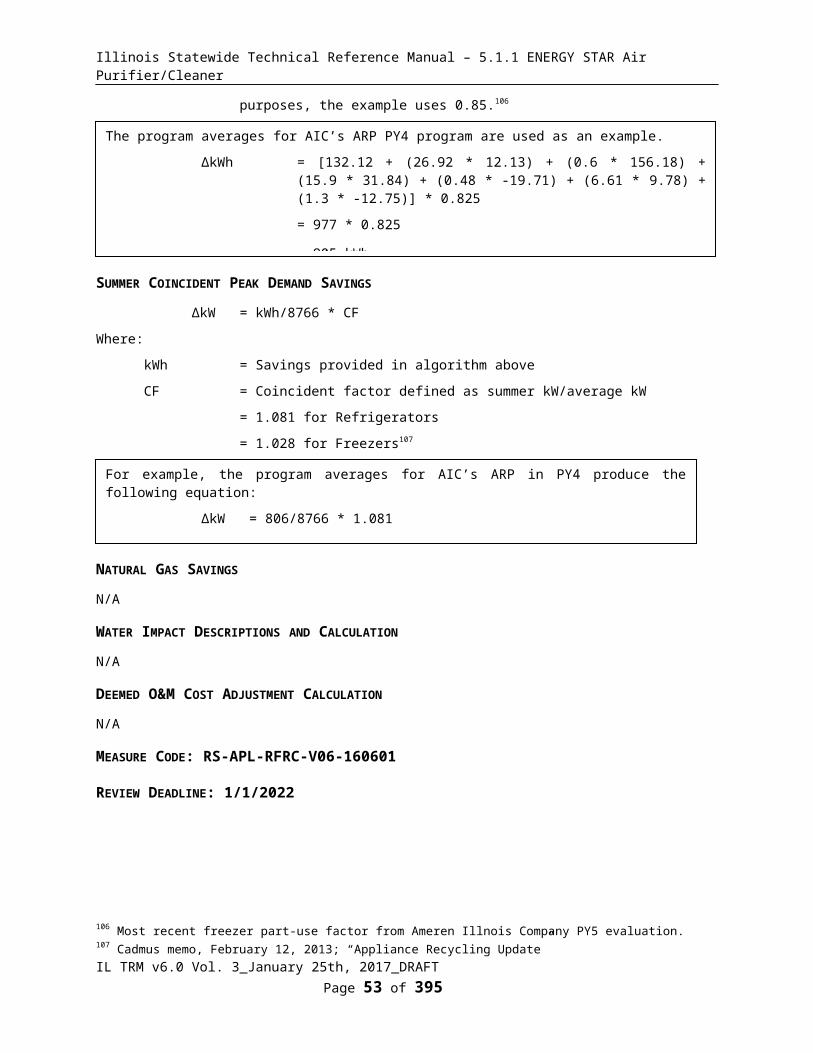
Illinois Statewide Technical Reference Manual – 5.1.1 ENERGY STAR Air Purifier/Cleaner
= 0.8 142
# Plugs Delivery Mechanism ΔkW
5- plugEnergy Efficiency Kit 0.0044All other delivery mechanisms 0.0063
7-plugEnergy Efficiency Kit 0.0080All other delivery mechanisms 0.0116
Unknown143 Energy Efficiency Kit 0.0062All other delivery mechanisms 0.0090
NATURAL GAS SAVINGS
N/A
WATER IMPACT DESCRIPTIONS AND CALCULATION
N/A
DEEMED O&M COST ADJUSTMENT CALCULATION
N/A
MEASURE CODE: RS-CEL-SSTR-V03-180101
REVIEW DEADLINE: 1/1/2021
142 Efficiency Vermont 2016 TRM coincidence factor for advanced power strip measure –in the absence of empirical evaluation data, this was based on assumptions of the typical run pattern for televisions and computers in homes.143 Calculated as average of 5 and 7 plug savings assumptions.
IL TRM v6.0 Vol. 3_January 25th, 2017_DRAFT Page 55 of 296

Illinois Statewide Technical Reference Manual – 5.1.1 ENERGY STAR Air Purifier/Cleaner
5.2.2 Tier 2 Advanced Power Strips (APS) – Residential Audio Visual
DESCRIPTION
This measure relates to the installation of a Tier 2 Advanced Power Strip / surge protector for household audio visual environments (Tier 2 AV APS). Tier 2 AV APS are multi-plug power strips that remove power from audio visual equipment through intelligent control and monitoring strategies.
By utilizing advanced control strategies such as a countdown timer, external sensors (e.g. of infra-red remote usage and/or occupancy sensors, true RMS (Root Mean Square) power sensing; both active power loads and
IL TRM v6.0 Vol. 3_January 25th, 2017_DRAFT Page 56 of 296

Illinois Statewide Technical Reference Manual – 5.1.1 ENERGY STAR Air Purifier/Cleaner
standby power loads of controlled devices are managed by Tier 2 AV APS devices144. Monitoring and controlling both active and standby power loads of controlled devices will reduce the overall load of a centralized group of electrical equipment (i.e. the home entertainment center). This more intelligent sensing and control process has been demonstrated to deliver increased energy savings and demand reduction compared with ‘Tier 1 Advanced Power Strips’.
The Tier 2 APS market is a relatively new and developing one. With several new Tier 2 APS products coming to market, it is important that energy savings are clearly demonstrated through independent field trials. The IL Technical Advisory Committee have developed a protocol whereby product manufacturers must submit independent field trial evidence of the Energy Reduction Percentage of their particular product either to the TRM Administrator for consideration during the TRM update process (August – December), or engage with a Program Administrator’s independent evaluation team to review at other times. The product will be assigned a Product Class (A-H) corresponding to the proven savings and all products in a class will claim consistent savings. The IL TRM Administrator will maintain a list of eligible product and class on the IL TRM Sharepoint site. If a mid-year review has taken place, supporting information should be posted on the Sharepoint site such that other program administrators can review.
Due to the inherent variance day to day and week to week for hours of use of AV systems, it is critical that field trial studies effectively address the variability in usage patterns. There is significant discussion in the EM&V and academic domain on the optimal methodology for controlling for these factors and in submitting evidence of energy savings, it is critical that it is demonstrated that these issues are adequately addressed.
This measure was developed to be applicable to the following program types: DI. If applied to other program delivery types, the installation characteristics including the number of AV devices under control and an appropriate in service rate should be verified through evaluation.
Current evaluation is limited to Direct Install applications. Through a Direct Install program it can be assured that the APS is appropriately set up and the customer is knowledgeable about its function and benefit. It is encouraged that additional implementation strategies are evaluated to provide an indication of whether the units are appropriately set up, used with AV equipment and that the customer is knowledgeable about its function and benefit. This will then facilitate a basis for broadening out the deployment methods of the APS technology category beyond Direct Install.
DEFINITION OF EFFICIENT EQUIPMENT
The efficient case is the use of a Tier 2 AV APS in a residential AV (home entertainment) environment that includes control of at least 2 AV devices with one being the television145.
Only Tier 2 AV APS products that have independent demonstrated energy savings via field trials are eligible.
The minimum product specifications for Tier 2 AV APS are:Safety & longevity
• Product and installation instructions shall comply with 2012 International Fire Code and 2000 NFPA 101 Life Safety Code (IL Fire Code).
• Third party tested to all applicable UL Standards.
• Contains a resettable circuit breaker
• Incorporates power switching electromechanical relays rated for 100,000 switching cycles at full 15 amp load (equivalent to more than 10 years of use).
Energy efficiency functionality144 Tier 2 AV APS identify when people are not engaged with their AV equipment and then remove power, for example a TV and its peripheral devices that are unintentionally left on when a person leaves the house or for instance where someone falls asleep while watching television.145 Given this requirement, an AV environment consisting of a television and DVD player or a TV and home theater would be eligible for a Tier 2 AV APS installation.
IL TRM v6.0 Vol. 3_January 25th, 2017_DRAFT Page 57 of 296

Illinois Statewide Technical Reference Manual – 5.1.1 ENERGY STAR Air Purifier/Cleaner
• Calculates real power as the time average of the instantaneous power, where instantaneous power is the product of instantaneous voltage and current.
• Delivers a warning when the countdown timer begins before an active power down event and maintains the warning until countdown is concluded or reset by use of the remote or other specified signal
• Uses an automatically adjustable power switching threshold.
DEFINITION OF BASELINE EQUIPMENT
The assumed baseline equipment is the existing equipment being used in the home (e.g. a standard power strip or wall socket) that does not control loads of connected AV equipment.
DEEMED LIFETIME OF EFFICIENT EQUIPMENT
The default deemed lifetime value for Tier 2 AV APS is assumed to be 7 years146.
DEEMED MEASURE COST
Direct Installation: The actual installed cost (including labor) of the new Tier 2 AV APS equipment should be used.
LOADSHAPE
Loadshape R13 - Residential Standby Losses – Entertainment
COINCIDENCE FACTOR
The summer peak coincidence factor for this measure is assumed to be 80%147
Algorithm
CALCULATION OF ENERGY SAVINGS
ELECTRIC ENERGY SAVINGS
ΔkWh = ERP * BaselineEnergyAV * ISR
Where:
ERP = Energy Reduction Percentage of qualifying Tier2 AV APS product range as provided below. See reference documents for Product Classification memo.
BaselineEnergyAV = 432 kWh148
Product Class Field trial ERP range ERP used BaselineEnergyAV
(kWh)A 55 – 60% 55% 238B 50 – 54% 50% 216C 45 – 49% 45% 194D 40 – 44% 40% 173
146 There is little evaluation to base a lifetime estimate upon. Based on review of assumptions from other jurisdictions and the relative treatment of In Service Rates and persistence, an estimate of 7 years was agreed by the Technical Advisory Committee, but further evaluation is recommended.147 In the absence of empirical evaluation data, this was based on assumptions of the typical run pattern for televisions and computers in homes.148 AESC, Inc, “Energy Savings of Tier 2 Advanced Power Strips in Residential AC Systems”, p28. Note that this load represents the average controlled AV devices only and will likely be lower than total AC usage.
IL TRM v6.0 Vol. 3_January 25th, 2017_DRAFT Page 58 of 296
Illinois Statewide Technical Reference Manual – 5.1.1 ENERGY STAR Air Purifier/Cleaner
Product Class Field trial ERP range ERP used BaselineEnergyAV
(kWh)E 35 – 39% 35% 151F 30 – 34% 30% 130G 25 – 29% 25% 108H 20 – 24% 20% 86
ISR = In Service Rate. See reference documents for Product Classification memo.
SUMMER COINCIDENT PEAK DEMAND SAVINGS
∆kW = ∆kWh / Hours * CF
Where:
∆kWh = Energy savings as calculated above
Hours = Annual number of hours during which the APS provides savings.
= 4,380 149
CF = Summer Peak Coincidence Factor for measure
= 0.8 150
NATURAL GAS SAVINGS
N/A151
WATER AND OTHER NON-ENERGY IMPACT DESCRIPTIONS AND CALCULATION
N/A
DEEMED O&M COST ADJUSTMENT CALCULATION
N/A
MEASURE CODE: RS-CEL-APS2-V02-180101
REVIEW DEADLINE: 1/1/2019
149 This is estimate based on assumption that approximately half of savings are during active hours (supported by AESC study) (assumed to be 5.3 hrs/day, 1936 per year (NYSERDA 2011. “Advanced Power Strip Research Report”)) and half during standby hours (8760-1936 = 6824 hours). The weighted average is 4380.150 In the absence of empirical evaluation data, this was based on assumptions of the typical run pattern for televisions and computers in homes. This appears to be supported by the Average Weekday AV Demand Profile and Reduction charts in the AESC study (p33-34). These show that the average demand reduction is relatively flat.151 Interactive effects of Tier 2 APS on space conditioning loads has not yet been adequately studied.
IL TRM v6.0 Vol. 3_January 25th, 2017_DRAFT Page 59 of 296
Illinois Statewide Technical Reference Manual – 5.1.1 ENERGY STAR Air Purifier/Cleaner
5.3 HVAC End Use5.3.1 Air Source Heat Pump
DESCRIPTION
A heat pump provides heating or cooling by moving heat between indoor and outdoor air.
This measure characterizes:
a) Time of Sale:
a. The installation of a new residential sized (<= 65,000 Btu/hr) air source heat pump that is more efficient than required by federal standards. This could relate to the replacement of an existing unit at the end of its useful life, or the installation of a new system in a new home.
b) Early Replacement:
The early removal of functioning electric heating and cooling (SEER 10 or under if present) systems from service, prior to its natural end of life, and replacement with a new high efficiency air source heat pump unit.
Early Replacement determination will be based on meeting the following conditions:
• The existing unit is operational when replaced, or• The existing unit requires minor repairs (<$276 per ton)152. • All other conditions will be considered Time of Sale.
The Baseline SEER of the existing unit replaced:
• If the SEER of the existing unit is known and <=10, the Baseline SEER is the actual SEER value of the unit replaced. If the SEER is >10, the Baseline SEER = 14.
• If the SEER of the existing unit is unknown use assumptions in variable list below (SEER_exist and HSPF_exist).
• If the operational status or repair cost of the existing unit is unknown, use time of sale assumptions.
A weighted average early replacement rate is provided for use when the actual baseline early replacement rates are unknown.153
Deemed Early Replacement Rates For ASHP
Deemed Early Replacement RateEarly Replacement Rate for ASHP participants 7%
This measure was developed to be applicable to the following program types: TOS, NC, EREP. If applied to other program types, the measure savings should be verified.
DEFINITION OF EFFICIENT EQUIPMENT
A new residential sized (<= 65,000 Btu/hr) air source heat pump with specifications to be determined by program.
152 The Technical Advisory Committee agreed that if the cost of repair is less than 20% of the new baseline replacement cost it can be considered early replacement. Note the non-inflated cost is used as this would be a cost consideration in the program year.153 Based upon research from “Home Energy Efficiency Rebate Program GPY2 Evaluation Report” which outlines early replacement rates for both primary and secondary central air cooling (CAC) and residential furnaces. This is used as a reasonable proxy for ASHP installations since ASHP specific data is not available. Report presented to Nicor Gas Company February 27, 2014, available at http://www.ilsag.info/evaluation-documents.html.
IL TRM v6.0 Vol. 3_January 25th, 2017_DRAFT Page 60 of 296
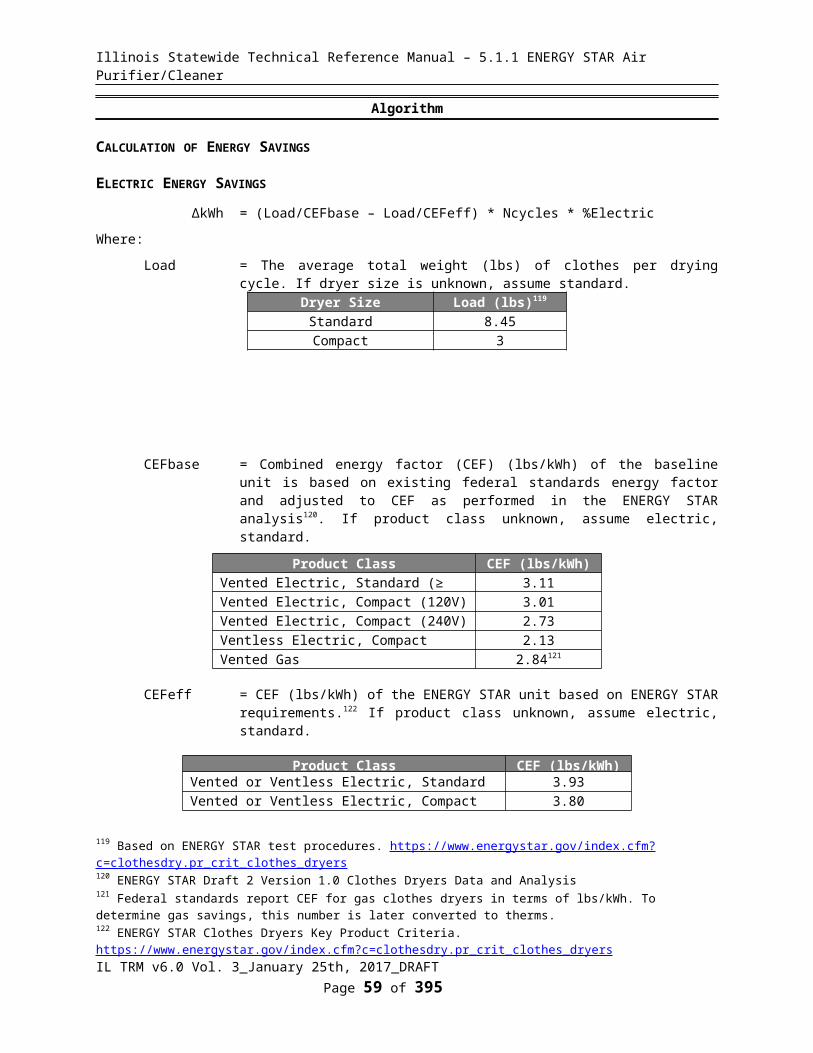
Illinois Statewide Technical Reference Manual – 5.1.1 ENERGY STAR Air Purifier/Cleaner
DEFINITION OF BASELINE EQUIPMENT
A new residential sized (<= 65,000 Btu/hr) air source heat pump meeting federal standards.
The baseline for the Time of Sale measure is based on the current Federal Standard efficiency level as of January 1 st
2015; 14 SEER and 8.2HSPF.
The baseline for the early replacement measure is the efficiency of the existing equipment for the assumed remaining useful life of the unit and the new baseline as defined above for the remainder of the measure life.
DEEMED LIFETIME OF EFFICIENT EQUIPMENT
The expected measure life is assumed to be 18 years.154
Remaining life of existing ASHP/CAC equipment is assumed to be 6 years155 and 18 years for electric resistance.
DEEMED MEASURE COST
Time of sale: The incremental capital cost for this measure is dependent on the efficiency of the new unit156.
Efficiency (SEER)
Incremental Cost ($/unit)
14.5 $12315 $30316 $43817 $72418 $724
Early replacement: The full install cost for this measure is the actual cost of removing the existing unit and installing the new one. If this is unknown, assume the following (note these costs are per ton of unit capacity)157:
Efficiency (SEER)
Full Retrofit Cost (including labor)
14.5 $1,381 / ton + $12315 $1,381 / ton + $30316 $1,381 / ton + $43817 $1,381 / ton + $72418 $1,381 / ton + $724
Assumed deferred cost (after 6 years) of replacing existing equipment with new baseline unit is assumed to be $1,518 per ton of capacity158. This cost should be discounted to present value using the nominal societal discount rate.
LOADSHAPE
Loadshape R10 - Residential Electric Heating and Cooling
154 Measure Life Report, Residential and Commercial/Industrial Lighting and HVAC Measures, GDS Associates, June 2007,http://www.ctsavesenergy.org/files/Measure%20Life%20Report%202007.pdf 155 Assumed to be one third of effective useful life156 Based on incremental cost results from Cadmus “HVAC Program: Incremental Cost Analysis Update”, December 19, 2016.157 Baseline cost per ton derived from DEER 2008 Database Technology and Measure Cost Data (www.deeresources.com). See ‘ASHP_Revised DEER Measure Cost Summary.xls’ for calculation. Efficiency cost increment consistent with Cadmus study results.158 Ibid. $1381 per ton inflated using rate of 1.91%.
IL TRM v6.0 Vol. 3_January 25th, 2017_DRAFT Page 61 of 296
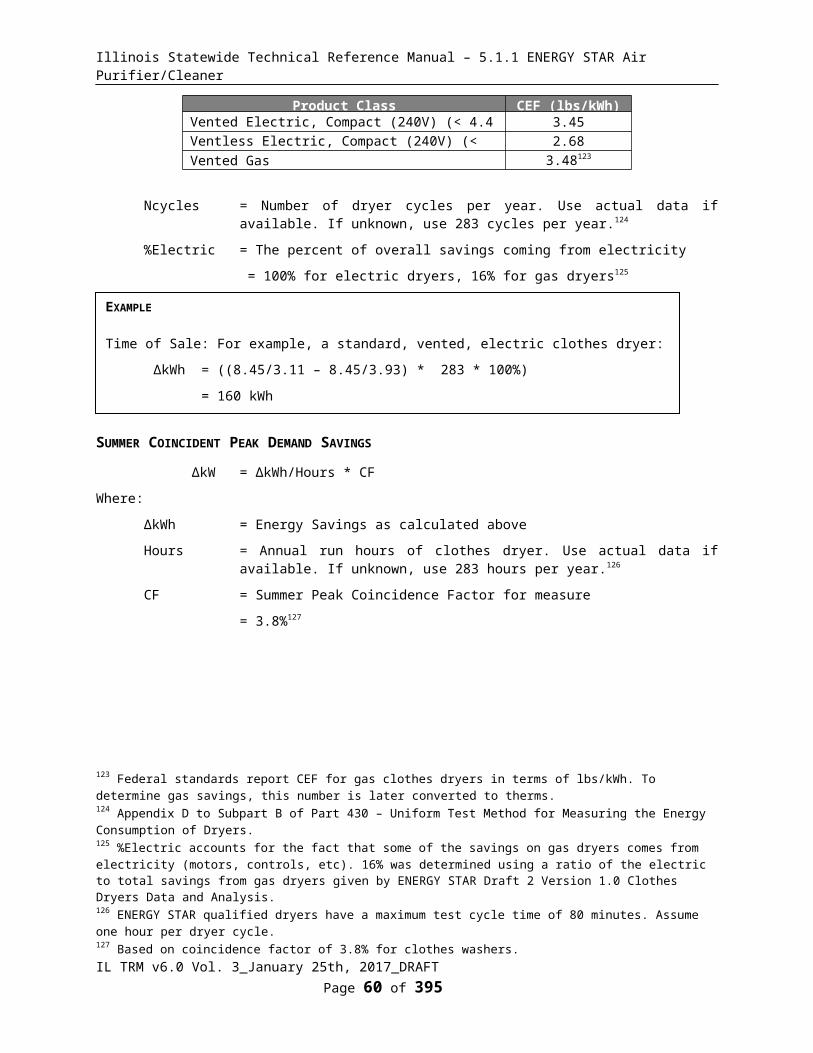
Illinois Statewide Technical Reference Manual – 5.1.1 ENERGY STAR Air Purifier/Cleaner
COINCIDENCE FACTOR
The summer peak coincidence factor for cooling is provided in two different ways below. The first is used to estimate peak savings during the utility peak hour and is most indicative of actual peak benefits, and the second represents the average savings over the defined summer peak period, and is presented so that savings can be bid into PJM’s Forward Capacity Market.
CFSSP SF = Summer System Peak Coincidence Factor for Heat Pumps in single-family homes (during utility peak hour)
= 72%159
CFPJM SF = PJM Summer Peak Coincidence Factor for Heat Pumps in single-family homes (average during PJM peak period)
= 46.6%160
CFSSP, MF = Summer System Peak Coincidence Factor for Heat Pumps in multi-family homes (during system peak hour)
= 67%161
CFPJM, MF = PJM Summer Peak Coincidence Factor for Heat Pumps in multi-family homes (average during peak period)
= 28.5%
Algorithm
CALCULATION OF SAVINGS
ELECTRIC ENERGY SAVINGS
Time of sale:
ΔkWh = ((FLH_cooling * Capacity_cooling * (1/SEER_base - 1/SEER_ee)) / 1000) + ((FLH_heat * Capacity_heating * (1/HSPF_base - 1/HSFP_ee)) / 1000)
Early replacement162:
ΔkWH for remaining life of existing unit (1st 6 years for replacing an ASHP, 18 years for replacing electric resistance):
= ((FLH_cooling * Capacity_cooling * (1/SEER_exist - 1/SEER_ee)) / 1000) + ((FLH_heat * Capacity_heating * (1/HSPF_exist - 1/HSFP_ee)) / 1000)
ΔkWH for remaining measure life (next 12 years if replacing an ASHP):
159 Based on analysis of metering results from 24 heat pumps in Ameren Illinois service territory in PY5 coincident with AIC’s 2010 system peak; ‘Impact and Process Evaluation of Ameren Illinois Company’s Residential HVAC Program (PY5)’.160 Based on analysis of Itron eShape data for Missouri, calibrated to Illinois loads, supplied by Ameren. The average AC load over the PJM peak period (1-5pm, M-F, June through August) is divided by the maximum AC load during the year.161 Multifamily coincidence factors both from; All-Electric Homes PY6 Metering Results: Multifamily HVAC Systems, Cadmus, October 2015162 The two equations are provided to show how savings are determined during the initial phase of the measure (existing to efficient) and the remaining phase (new baseline to efficient). In practice, the screening tools used may either require a First Year savings (using the first equation) and then a “number of years to adjustment” and “savings adjustment” input which would be the (new base to efficient savings)/(existing to efficient savings).
IL TRM v6.0 Vol. 3_January 25th, 2017_DRAFT Page 62 of 296
Illinois Statewide Technical Reference Manual – 5.1.1 ENERGY STAR Air Purifier/Cleaner
= ((FLH_cooling * Capacity_cooling * (1/SEER_base - 1/SEER_ee)) / 1000) + ((FLH_heat * Capacity_heating * (1/HSPF_base - 1/HSFP_ee)) / 1000)
Where:
FLH_cooling = Full load hours of air conditioning
= dependent on location:
Climate Zone(City based upon)
FLH_cooling (single family) 163
FLH_cooling (general multi
family) 164
FLH_cooling (weatherized multi
family) 165
1 (Rockford) 512 467 2992 (Chicago) 570 506 3243 (Springfield) 730 663 4254 (Belleville) 1,035 940 6035 (Marion) 903 820 526Weighted Average166 629 564 362
Capacity_cooling = Cooling Capacity of Air Source Heat Pump (Btu/hr)
= Actual (1 ton = 12,000Btu/hr)
SEER_exist = Seasonal Energy Efficiency Ratio of existing cooling system (kBtu/kWh)
= Use actual SEER rating where it is possible to measure or reasonably estimate.
Existing Cooling System SEER_exist167
Air Source Heat Pump 9.12Central AC 8.60No central cooling168 Make ‘1/SEER_exist’ = 0
SEER_base = Seasonal Energy Efficiency Ratio of baseline Air Source Heat Pump (kBtu/kWh)
163 Full load hours for Chicago, Moline and Rockford are provided in “Final Evaluation Report: Central Air Conditioning Efficiency Services (CACES), 2010, Navigant Consulting”, p.33. An average FLH/Cooling Degree Day (from NCDC) ratio was calculated for these locations and applied to the CDD of the other locations in order to estimate FLH. There is a county mapping table in Volume 1, Section 3.7 providing the appropriate city to use for each county of Illinois.164 Ibid.165 All-Electric Homes PY6 Metering Results: Multifamily HVAC Systems, Cadmus, October 2015. The multifamily units within this study had undergone significant shell improvements (air sealing and insulation) and therefore this set of assumptions is only appropriate for units that have recently participated in a weatherization or other shell program. Note that the FLHcool where recalculated based on existing efficiencies consistent with the TRM rather than from the metering study.166 Weighted based on number of occupied residential housing units in each zone.167 Average nameplate efficiencies of all Early Replacement qualifying equipment in Ameren PY3-PY4.168 If there is no central cooling in place but the incentive encourages installation of a new ASHP with cooling, the added cooling load should be subtracted from any heating benefit.
IL TRM v6.0 Vol. 3_January 25th, 2017_DRAFT Page 63 of 296
Illinois Statewide Technical Reference Manual – 5.1.1 ENERGY STAR Air Purifier/Cleaner
= 14 169
SEER_ee = Seasonal Energy Efficiency Ratio of efficient Air Source Heat Pump (kBtu/kWh)
= Actual
FLH_heat = Full load hours of heating
= Dependent on location and home type:
Climate Zone(City based upon)
FLH_heat(single family and
general multi family)170
FLH heat(weatherize
d multi family) 171
1 (Rockford) 1,969 7482 (Chicago) 1,840 6993 (Springfield) 1,754 6674 (Belleville) 1,266 4815 (Marion) 1,288 489Weighted Average172 1,821 692
Capacity_heating = Heating Capacity of Air Source Heat Pump (Btu/hr)
= Actual (1 ton = 12,000Btu/hr)
HSPF_exist =Heating System Performance Factor173 of existing heating system (kBtu/kWh)
= Use actual HSPF rating where it is possible to measure or reasonably estimate. If not available use:
Existing Heating System HSPF_existAir Source Heat Pump 5.44 174
Electric Resistance 3.41175
HSPF_base =Heating System Performance Factor of baseline Air Source Heat Pump (kBtu/kWh)
= 8.2 176
HSFP_ee =Heating System Performance Factor of efficient Air Source Heat Pump
(kBtu/kWh)
= Actual
169 Based on Minimum Federal Standard effective 1/1/2015; http://www.gpo.gov/fdsys/pkg/CFR-2012-title10-vol3/pdf/CFR-2012-title10-vol3-sec430-32.pdf.170 Full load heating hours for heat pumps are provided for Rockford, Chicago and Springfield in the Energy Star Calculator. Estimates for the other locations were calculated based on the FLH to Heating Degree Day (from NCDC) ratio. VEIC consider Energy Star estimates to be high due to oversizing not being adequately addressed. Using average Illinois billing data (from http://www.icc.illinois.gov/ags/consumereducation.aspx) VEIC estimated the average gas heating load and used this to estimate the average home heating output (using 83% average gas heat efficiency). Dividing this by a typical 36,000 Btu/hr ASHP gives an estimate of average ASHP FLH_heat of 1821 hours. We used the ratio of this value to the average of the locations using the Energy Star data (1994 hours) to scale down the Energy Star estimates. There is a county mapping table in Volume 1, Section 3.7 providing the appropriate city to use for each county of Illinois.171 All-Electric Homes PY6 Metering Results: Multifamily HVAC Systems, Cadmus, October 2015. 172 Weighted based on number of occupied residential housing units in each zone.
IL TRM v6.0 Vol. 3_January 25th, 2017_DRAFT Page 64 of 296

Illinois Statewide Technical Reference Manual – 5.1.1 ENERGY STAR Air Purifier/Cleaner
SUMMER COINCIDENT PEAK DEMAND SAVINGS
Time of sale:
ΔkW = (Capacity_cooling * (1/EER_base - 1/EER_ee)) / 1000) * CF
Early replacement177:
ΔkW for remaining life of existing unit (1st 6 years for replacing an ASHP, 18 years for replacing electric resistance):
= ((Capacity_cooling * (1/EERexist - 1/EERee))/1000 * CF);
ΔkW for remaining measure life (next 12 years if replacing an ASHP):
= ((Capacity_cooling * (1/EERbase - 1/EERee))/1000 * CF)
Where:
EER_exist = Energy Efficiency Ratio of existing cooling system (kBtu/hr / kW)
173 HSPF ratings for Heat Pumps account for the seasonal average efficiency of the units and are based on testing within zone 4 which encompasses most of Illinois. Furthermore, a recent Cadmus/Opinion Dynamics metering study, “Impact and Process Evaluation of Ameren Illinois Company’s Residential HVAC Program (PY5)”, found no significant variance between metered performance and that presented in the TRM174 This is estimated based on finding the average HSPF/SEER ratio from the AHRI directory data (using the least efficient models – SEER 12 and SEER 13) – 0.596, and applying to the average nameplate SEER rating of all Early Replacement qualifying equipment in Ameren PY3-PY4. This estimation methodology appears to provide a result within 10% of actual HSPF.175 Electric resistance has a COP of 1.0 which equals 1/0.293 = 3.41 HSPF.176 Based on Minimum Federal Standard effective 1/1/2015; http://www.gpo.gov/fdsys/pkg/CFR-2012-title10-vol3/pdf/CFR-2012-title10-vol3-sec430-32.pdf177 The two equations are provided to show how savings are determined during the initial phase of the measure (existing to efficient) and the remaining phase (new baseline to efficient). In practice, the screening tools used may either require a First Year savings (using the first equation) and then a “number of years to adjustment” and “savings adjustment” input which would be the (new base to efficient savings)/(existing to efficient savings).
IL TRM v6.0 Vol. 3_January 25th, 2017_DRAFT Page 65 of 296
Time of Sale:
For example, a three ton, 15 SEER, 12EER, 9 HSPF Air Source Heat Pump installed in a single family home in Marion:
ΔkWh = ((903 * 36,000 * (1/14 - 1/15)) / 1000) + ((1,288 * 36,000 * (1/8.2 - 1/9)) / 1000)
= 657 kWh
Early Replacement:
For example, a three ton, 15 SEER, 12EER, 9 HSPF Air Source Heat Pump replaces an existing working Air Source Heat Pump with unknown efficiency ratings in a single family home in Marion:
ΔkWH for remaining life of existing unit (1st 6 years):
= ((903 * 36,000 * (1/9.12 - 1/15)) / 1000) + ((1,288 * 36,000 * (1/5.44 - 1/9)) / 1000)
= 4769 kWh
ΔkWH for remaining measure life (next 12 years):
= ((903 * 36,000 * (1/14 - 1/15)) / 1000) + ((1,288 * 36,000 * (1/8.2 - 1/9)) / 1000)
= 657 kWh

Illinois Statewide Technical Reference Manual – 5.1.1 ENERGY STAR Air Purifier/Cleaner
= Use actual EER rating where it is possible to measure or reasonably estimate. If EER unknown but SEER available convert using the equation:
EER_base = (-0.02 * SEER_exist2) + (1.12 * SEER_exist) 178
If SEER or EER rating unavailable use:
Existing Cooling System EER_exist179
Air Source Heat Pump 8.55Central AC 8.15No central cooling180 Make ‘1/EER_exist’ = 0
EER_base = Energy Efficiency Ratio of baseline Air Source Heat Pump (kBtu/hr / kW)
= 11.8 181
EER_ee = Energy Efficiency Ratio of efficient Air Source Heat Pump (kBtu/hr / kW)
= Actual, If not provided convert SEER to EER using this formula:182
= (-0.02 * SEER_ee2) + (1.12 * SEER_ee)
CFSSP SF = Summer System Peak Coincidence Factor for Heat Pumps in single-family homes (during system peak hour)
= 72%%183
CFPJM SF = PJM Summer Peak Coincidence Factor for Heat Pumps in single-family homes (average during peak period)
= 46.6%184
CFSSP, MF = Summer System Peak Coincidence Factor for Heat Pumps in multi-family homes (during system peak hour)
= 67%185
CFPJM, MF = PJM Summer Peak Coincidence Factor for Heat Pumps in multi-family homes (average during peak period)
= 28.5%35
178 From Wassmer, M. (2003). A Component-Based Model for Residential Air Conditioner and Heat Pump Energy Calculations. Masters Thesis, University of Colorado at Boulder.179 Average nameplate efficiencies of all Early Replacement qualifying equipment in Ameren PY3-PY4.180 If there is no central cooling in place but the incentive encourages installation of a new ASHP with cooling, the added cooling load should be subtracted from any heating benefit. 181 The Federal Standard does not include an EER requirement, so it is approximated with this formula: (-0.02 * SEER2) + (1.12 * SEER) Wassmer, M. (2003). A Component-Based Model for Residential Air Conditioner and Heat Pump Energy Calculations. Masters Thesis, University of Colorado at Boulder. Note this is appropriate for single speed units only.182 Based on Wassmer, M. (2003). A Component-Based Model for Residential Air Conditioner and Heat Pump Energy Calculations. Masters Thesis, University of Colorado at Boulder. Note this is appropriate for single speed units only.183 Based on analysis of metering results from 24 heat pumps in Ameren Illinois service territory in PY5 coincident with AIC’s 2010 system peak; ‘Impact and Process Evaluation of Ameren Illinois Company’s Residential HVAC Program (PY5)’.184 Based on analysis of Itron eShape data for Missouri, calibrated to Illinois loads, supplied by Ameren. The average AC load over the PJM peak period (1-5pm, M-F, June through August) is divided by the maximum AC load during the year.185 All-Electric Homes PY6 Metering Results: Multifamily HVAC Systems, Cadmus, October 2015
IL TRM v6.0 Vol. 3_January 25th, 2017_DRAFT Page 66 of 296

Illinois Statewide Technical Reference Manual – 5.1.1 ENERGY STAR Air Purifier/Cleaner
NATURAL GAS SAVINGS
N/A
WATER IMPACT DESCRIPTIONS AND CALCULATION
N/A
DEEMED O&M COST ADJUSTMENT CALCULATION
N/A
MEASURE CODE: RS-HVC-ASHP-V07-180101
REVIEW DEADLINE: 1/1/2021
IL TRM v6.0 Vol. 3_January 25th, 2017_DRAFT Page 67 of 296
Time of Sale:
For example, a three ton, 15 SEER, 12EER, 9 HSPF Air Source Heat Pump installed in single-family home in Marion:
ΔkWSSP = ((36,000 * (1/11.8 – 1/12)) / 1000) * 0.72
= 0.037 kW
ΔkWPJM = ((36,000 * (1/11.8 – 1/12)) / 1000) * 0.466
= 0.024 kW
Early Replacement:
For example, a three ton, 15 SEER, 12EER, 9 HSPF Air Source Heat Pump replaces an existing working Air Source Heat Pump with unknown efficiency ratings in single-family home in Marion:
ΔkWSSP for remaining life of existing unit (1st 6 years):
= ((36,000 * (1/8.55 - 1/12)) / 1000) * 0.72
= 0.872 kW
ΔkWSSP for remaining measure life (next 12 years):
= ((36,000 * (1/11.8 – 1/12)) / 1000) * 0.72
= 0.037 kW
ΔkWPJM for remaining life of existing unit (1st 6 years):
= ((36,000 * (1/8.55 - 1/12)) / 1000) * 0.466
= 0.564 kW
ΔkWPJM for remaining measure life (next 12 years):
= ((36,000 * (1/11.8 – 1/12)) / 1000) * 0.466
= 0.024 kW

Illinois Statewide Technical Reference Manual – 5.1.1 ENERGY STAR Air Purifier/Cleaner
5.3.2 Boiler Pipe Insulation
DESCRIPTION
This measure describes adding insulation to un-insulated boiler pipes in un-conditioned basements or crawlspaces.
This measure was developed to be applicable to the following program types: TOS, RNC, RF, DI.
If applied to other program types, the measure savings should be verified.
DEFINITION OF EFFICIENT EQUIPMENT
The efficient case is installing pipe wrap insulation to a length of boiler pipe.
DEFINITION OF BASELINE EQUIPMENT
The baseline is an un-insulated boiler pipe.
DEEMED LIFETIME OF EFFICIENT EQUIPMENT
The measure life is assumed to be 15 years186.
DEEMED MEASURE COST
The measure cost including material and installation is assumed to be $3 per linear foot187.
LOADSHAPE
N/A
COINCIDENCE FACTOR
N/A
Algorithm
CALCULATION OF SAVINGS
ELECTRIC ENERGY SAVINGS
N/A
SUMMER COINCIDENT PEAK DEMAND SAVINGS
N/A
NATURAL GAS SAVINGS
ΔTherm = (((1/Rexist * Cexist) – (1/Rnew * Cnew)) * FLH_heat * L * ΔT ) / ηBoiler /100,000
Where:
Rexist = Pipe heat loss coefficient of uninsulated pipe (existing) [(hr-°F-ft2)/Btu]
186 Measure Life Report, Residential and Commercial/Industrial Lighting and HVAC Measures, GDS Associates, June 2007.http://www.ctsavesenergy.org/files/Measure%20Life%20Report%202007.pdf187 Consistent with DEER 2008 Database Technology and Measure Cost Data (www.deeresources.com).
IL TRM v6.0 Vol. 3_January 25th, 2017_DRAFT Page 68 of 296
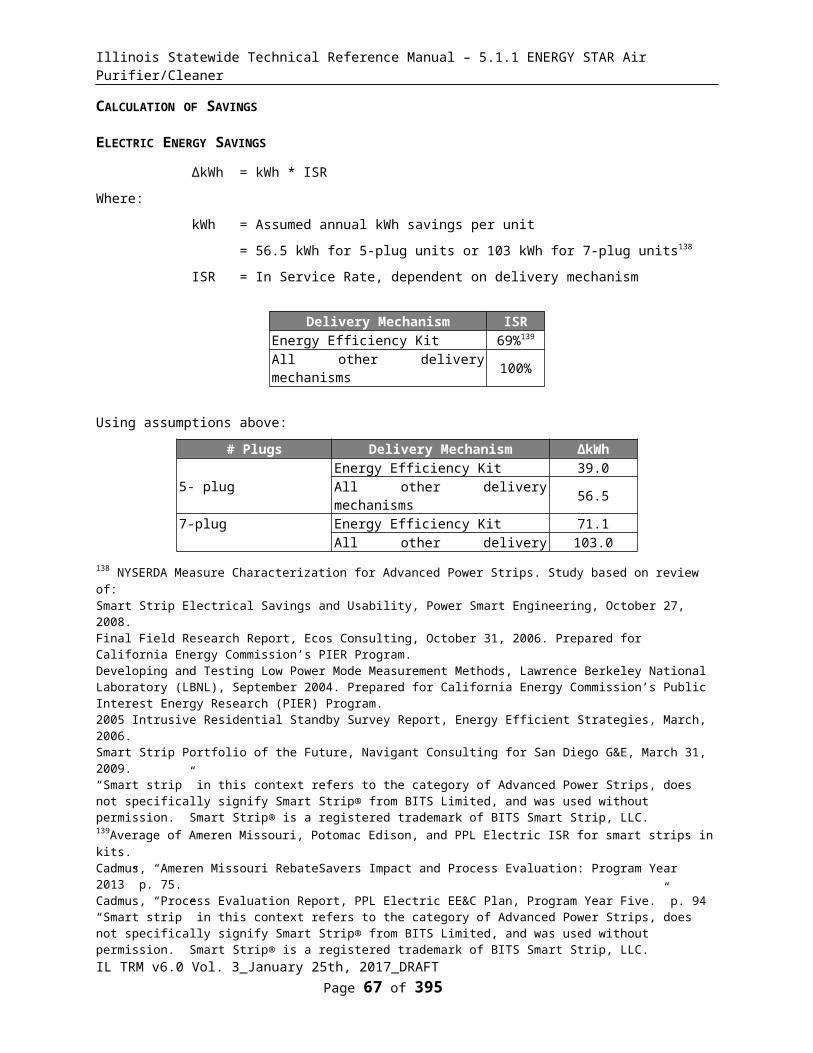
Illinois Statewide Technical Reference Manual – 5.1.1 ENERGY STAR Air Purifier/Cleaner
= 0.5188
Rnew = Pipe heat loss coefficient of insulated pipe (new) [(hr-°F-ft2)/Btu]
= Actual (0.5 + R value of insulation)
FLH_heat = Full load hours of heating
= Dependent on location189:
Climate Zone(City based upon) FLH_heat
1 (Rockford) 1,9692 (Chicago) 1,8403 (Springfield) 1,7544 (Belleville) 1,2665 (Marion) 1,288Weighted Average190 1,821
L = Length of boiler pipe in unconditioned space covered by pipe wrap (ft)
= Actual
Cexist = Circumference of bare pipe (ft) (Diameter (in) * π/12)
= Actual (0.5” pipe = 0.131ft, 0.75” pipe = 0.196ft)
Cnew = Circumference of pipe with insulation (ft) ([Diameter of pipe (in)] + ([Thickness of Insulation (in)]*2)) * π/12)
= Actual
ΔT = Average temperature difference between circulated heated water and unconditioned space air temperature (°F) 191
Pipes in unconditioned basement:
Outdoor reset controls ΔT (°F)Boiler without reset control 110Boiler with reset control 70
Pipes in crawl space:
188 Assumption based on data obtained from the 3E Plus heat loss calculation software provided by the NAIMA (North American Insulation Manufacturer Association) and derived from Table 15 and Table 16 of 2009 ASHRAE Fundamentals Handbook, Chapter 23 Insulation for Mechanical Systems, page 23.17.189 Full load heating hours for heat pumps are provided for Rockford, Chicago and Springfield in the Energy Star Calculator. Estimates for the other locations were calculated based on the FLH to Heating Degree Day (from NCDC) ratio. VEIC consider Energy Star estimates to be high due to oversizing not being adequately addressed. Using average Illinois billing data (from http://www.icc.illinois.gov/ags/consumereducation.aspx) VEIC estimated the average gas heating load and used this to estimate the average home heating output (using 83% average gas heat efficiency). Dividing this by a typical 36,000 Btu/hr ASHP gives an estimate of average ASHP FLH_heat of 1821 hours. We used the ratio of this value to the average of the locations using the Energy Star data (1994 hours) to scale down the Energy Star estimates. There is a county mapping table in Volume 1, Section 3.7 providing the appropriate city to use for each county of Illinois.190 Weighted based on number of occupied residential housing units in each zone.191 Assumes 160°F water temp for a boiler without reset control, 120°F for a boiler with reset control, and 50°F air temperature for pipes in unconditioned basements and the following average heating season outdoor temperatures as the air temperature in crawl spaces: Zone 1 – 33.1, Zone 2 – 34.4, Zone 3 – 37.7, Zone 4 – 40.0, Zone 5 – 39.8, Weighted Average – 35.3 (NCDC 1881-2010 Normals, average of monthly averages Nov – Apr for zones 1-3 and Nov-March for zones 4 and 5).
IL TRM v6.0 Vol. 3_January 25th, 2017_DRAFT Page 69 of 296

Illinois Statewide Technical Reference Manual – 5.1.1 ENERGY STAR Air Purifier/Cleaner
Climate Zone(City based upon)
ΔT (°F)Boiler without reset control
Boiler with reset control
1 (Rockford) 127 872 (Chicago) 126 863 (Springfield) 122 824 (Belleville) 120 805 (Marion) 120 80Weighted Average192 125 85
ηBoiler = Efficiency of boiler
= 0.819 193
WATER IMPACT DESCRIPTIONS AND CALCULATION
N/A
DEEMED O&M COST ADJUSTMENT CALCULATION
N/A
MEASURE CODE: RS-HVC-PINS-V02-160601
REVIEW DEADLINE: 1/1/2022
192 Weighted based on number of occupied residential housing units in each zone.193 Average efficiency of boiler units found in Ameren PY3-PY4 data.
IL TRM v6.0 Vol. 3_January 25th, 2017_DRAFT Page 70 of 296
For example, insulating 10 feet of 0.75” pipe with R-3 wrap (0.75” thickness) in a crawl space of a Marion home with a boiler without reset control:
ΔTherm = (((1/0.5 * 0.196) – (1/3.5 * 0.589)) * 10 * 120 * 1288) / 0.819 / 100,000
= 4.2 therms
Illinois Statewide Technical Reference Manual – 5.1.1 ENERGY STAR Air Purifier/Cleaner
5.3.3 Central Air Conditioning
DESCRIPTION
This measure characterizes:
a) Time of Sale:
a. The installation of a new residential sized (<= 65,000 Btu/hr) Central Air Conditioning ducted split system meeting ENERGY STAR efficiency standards presented below. This could relate to the replacement of an existing unit at the end of its useful life, or the installation of a new system in a new home.
b) Early Replacement:
Early Replacement determination will be based on meeting the following conditions:
• The existing unit is operational when replaced, or• The existing unit requires minor repairs (<$190 per ton)194. • All other conditions will be considered Time of Sale.
The Baseline SEER of the existing Central Air Conditioning unit replaced:
• If the SEER of the existing unit is known and <=10, the Baseline SEER is the actual SEER value of the unit replaced. If the SEER is >10, the Baseline SEER = 13.
• If the SEER of the existing unit is unknown, use assumptions in variable list below (SEER_exist).
• If the operational status or repair cost of the existing unit is unknown, use time of sale assumptions.
A weighted average early replacement rate is provided for use when the actual baseline early replacement rate is unknown195.
Deemed Early Replacement Rates For CAC Units in Combined System Replacement (CSR) Projects
Replacement Scenario for the CAC Unit Deemed Early Replacement RateEarly Replacement Rate for a CAC unit when the CAC unit is the Primary unit in a CSR project 14%
Early Replacement Rate for a CAC unit when the CAC unit is the Secondary unit in a CSR project 40%
This measure was developed to be applicable to the following program types: TOS, NC, EREP. If applied to other program types, the measure savings should be verified.
DEFINITION OF EFFICIENT EQUIPMENT
In order for this characterization to apply, the efficient equipment is assumed to be a ducted split central air
194 The Technical Advisory Committee agreed that if the cost of repair is less than 20% of the new baseline replacement cost it can be considered early replacement. Note the non-inflated cost is used as this would be a cost consideration in the program year.195 Based upon research from “Home Energy Efficiency Rebate Program GPY2 Evaluation Report” which outlines early replacement rates for both primary and secondary central air cooling (CAC) and residential funaces. The unit (furnace or CAC unit) that initially caused the customer to contact a trade ally is defined as the “primary unit”. The furnace or CAC unit that was also replaced but did not initially prompt the customer to contact a trade ally is defined as the “secondary unit”. This evaluation used different criteria for early replacement due to the availability of data after the fact; cost of any repairs < $550 and age of unit < 20 years. Report presented to Nicor Gas Company February 27, 2014, available at http://www.ilsag.info/evaluation-documents.html.
IL TRM v6.0 Vol. 3_January 25th, 2017_DRAFT Page 71 of 296
Illinois Statewide Technical Reference Manual – 5.1.1 ENERGY STAR Air Purifier/Cleaner
conditioning unit meeting the minimum ENERGY STAR efficiency level standards; 14.5 SEER and 12 EER.
DEFINITION OF BASELINE EQUIPMENT
The baseline for the Time of Sale measure is based on the current Federal Standard efficiency level; 13 SEER and 11 EER.
The baseline for the early replacement measure is the efficiency of the existing equipment for the assumed remaining useful life of the unit and the new baseline as defined above196 for the remainder of the measure life.
DEEMED LIFETIME OF EFFICIENT EQUIPMENT
The expected measure life is assumed to be 18 years 197.
Remaining life of existing equipment is assumed to be 6 years198.
DEEMED MEASURE COST
Time of sale: The incremental capital cost for this measure is dependent on efficiency. Assumed incremental costs are provided below199:
Efficiency Level(SEER)
Incremental Cost
14 $015 $10816 $22117 $62018 $620
Early replacement: The full install cost for this measure is the actual cost of removing the existing unit and installing the new one. If this is unknown, assume defaults below200.
Efficiency Level (SEER)
Full Retrofit Cost (including labor)
14 $952 / ton + $015 $952 / ton + $10816 $952 / ton + $22117 $952 / ton + $62018 $952 / ton + $620
Assumed deferred cost (after 6 years) of replacing existing equipment with new baseline unit is assumed to be $3,140201. This cost should be discounted to present value using the nominal societal discount rate.196 Baseline SEER and EER should be updated when new minimum federal standards become effective.197 Measure Life Report, Residential and Commercial/Industrial Lighting and HVAC Measures, GDS Associates, June 2007.http://www.ctsavesenergy.org/files/Measure%20Life%20Report%202007.pdf The "lifespan" of a central air conditioner is about 15 to 20 years (US DOE: http://www.energysavers.gov/your_home/space_heating_cooling/index.cfm/mytopic=12440).198 Assumed to be one third of effective useful life199 Based on incremental cost results from Cadmus “HVAC Program: Incremental Cost Analysis Update”, December 19, 2016.200 Based on 3 ton initial cost estimate for a conventional unit from ENERGY STAR Central AC calculator, $2,857 (http://www.energystar.gov/ia/business/bulk_purchasing/bpsavings_calc/Calc_CAC.xls). Efficiency cost increment consistent with Cadmus study results.
201 Based on 3 ton initial cost estimate for a conventional unit from ENERGY STAR Central AC calculator, $2,857, and applying inflation rate of 1.91% (http://www.energystar.gov/ia/business/bulk_purchasing/bpsavings_calc/Calc_CAC.xls). While
IL TRM v6.0 Vol. 3_January 25th, 2017_DRAFT Page 72 of 296
Illinois Statewide Technical Reference Manual – 5.1.1 ENERGY STAR Air Purifier/Cleaner
LOADSHAPE
Loadshape R08 - Residential Cooling
COINCIDENCE FACTOR
The summer peak coincidence factor for cooling is provided in two different ways below. The first is used to estimate peak savings during the utility peak hour and is most indicative of actual peak benefits, and the second represents the average savings over the defined summer peak period, and is presented so that savings can be bid into PJM’s Forward Capacity Market.
CFSSP = Summer System Peak Coincidence Factor for Central A/C (during system peak hour)= 68%202
CFPJM = PJM Summer Peak Coincidence Factor for Central A/C (average during PJM peak period)= 46.6%203
Algorithm
CALCULATION OF SAVINGS
ELECTRIC ENERGY SAVINGS
Time of sale:
ΔkWH = (FLHcool * Btu/hr * (1/SEERbase - 1/SEERee))/1000
Early replacement204:
ΔkWH for remaining life of existing unit (1st 6 years):
=((FLHcool * Capacity * (1/SEERexist - 1/SEERee))/1000);
ΔkWH for remaining measure life (next 12 years):
= ((FLHcool * Capacity * (1/SEERbase - 1/SEERee))/1000)
Where:
FLHcool = Full load cooling hours
= dependent on location and building type205:
baselines are likely to shift in the future, there is currently no good indication of what the cost of a new baseline unit will be in 6 years. In the absence of this information, assuming a constant federal baseline cost is within the range of error for this prescriptive measure.202 Based on metering of 24 homes with central AC during PY4 and PY5 in Ameren Illinois service territory.203 Based on analysis of Itron eShape data for Missouri, calibrated to Illinois loads, supplied by Ameren. The average AC load over the PJM peak period (1-5pm, M-F, June through August) is divided by the maximum AC load during the year.204 The two equations are provided to show how savings are determined during the initial phase of the measure (existing to efficient) and the remaining phase (new baseline to efficient). In practice, the screening tools used may either require a First Year savings (using the first equation) and then a “number of years to adjustment” and “savings adjustment” input which would be the (new base to efficient savings)/(existing to efficient savings).205 Full load hours for Chicago, Moline and Rockford are provided in “Final Evaluation Report: Central Air Conditioning Efficiency Services (CACES), 2010, Navigant Consulting”, p.33. An average FLH/Cooling Degree Day (from NCDC) ratio was calculated for these locations and applied to the CDD of the other locations in order to estimate FLH. There is a county mapping table in Volume 1, Section 3.7 providing the appropriate city to use for each county of Illinois.
IL TRM v6.0 Vol. 3_January 25th, 2017_DRAFT Page 73 of 296

Illinois Statewide Technical Reference Manual – 5.1.1 ENERGY STAR Air Purifier/Cleaner
Climate Zone(City based upon)
FLHcool (single family)
FLHcool (multi family)
1 (Rockford) 512 4672 (Chicago) 570 5063 (Springfield) 730 6634 (Belleville) 1035 9405 (Marion) 903 820Weighted Average206 629 564
Capacity = Size of new equipment in Btu/hr (note 1 ton = 12,000Btu/hr)
= Actual installed, or if actual size unknown 33,600Btu/hr for single-family buildings207
SEERbase = Seasonal Energy Efficiency Ratio of baseline unit (kBtu/kWh)
= 13208
SEERexist = Seasonal Energy Efficiency Ratio of existing unit (kBtu/kWh)
= Use actual SEER rating where it is possible to measure or reasonably estimate. If unknown assume 10.0209.
SEERee = Seasonal Energy Efficiency Ratio of ENERGY STAR unit (kBtu/kWh)
= Actual installed or 14.5 if unknown
SUMMER COINCIDENT PEAK DEMAND SAVINGS
Time of sale:
206 Weighted based on number of residential occupied housing units in each zone.207 Actual unit size required for multi-family building, no size assumption provided because the unit size and resulting savings can vary greatly depending on the number of units.208 Based on Minimum Federal Standard; http://www1.eere.energy.gov/buildings/appliance_standards/residential/residential_cac_hp.html.209 VEIC estimate based on Department of Energy Federal Standard between 1992 and 2006. If utilities have specific evaluation results providing a more appropriate assumption for homes in a particular market or geographical area then that should be used.
IL TRM v6.0 Vol. 3_January 25th, 2017_DRAFT Page 74 of 296
Time of sale example: a 3 ton unit with SEER rating of 14.5, in unknown location:
ΔkWH = (629 * 36,000 * (1/13 – 1/14.5)) / 1000
= 180 kWh
Early replacement example: a 3 ton unit, with SEER rating of 14.5 replaces an existing unit in unknown location:
ΔkWH(for first 6 years) = (629 * 36,000 * (1/10 – 1/14.5)) / 1000
= 702 kWh
ΔkWH(for next 12 years) = (629 * 36,000 * (1/13 – 1/14.5)) / 1000
= 180 kWh
Therefore savings adjustment of 26% (180/702) after 6 years.

Illinois Statewide Technical Reference Manual – 5.1.1 ENERGY STAR Air Purifier/Cleaner
ΔkW = (Capacity * (1/EERbase - 1/EERee))/1000 * CF
Early replacement210:
ΔkW for remaining life of existing unit (1st 6 years):
= ((Capacity * (1/EERexist - 1/EERee))/1000 * CF);
ΔkW for remaining measure life (next 12 years):
= ((Capacity * (1/EERbase - 1/EERee))/1000 * CF)
Where:
EERbase = EER Efficiency of baseline unit
= 11.2 211
EERexist = EER Efficiency of existing unit
= Actual EER of unit should be used, if EER is unknown, use 9.2212 EERee = EER Efficiency of ENERGY STAR unit
= Actual installed or 12 if unknown
CFSSP = Summer System Peak Coincidence Factor for Central A/C (during system peak hour)
= 68%213
CFPJM = PJM Summer Peak Coincidence Factor for Central A/C (average during peak period)
= 46.6%214
210 The two equations are provided to show how savings are determined during the initial phase of the measure (existing to efficient) and the remaining phase (new baseline to efficient). In practice, the screening tools used may either require a First Year savings (using the first equation) and then a “number of years to adjustment” and “savings adjustment” input which would be the (new base to efficient savings)/(existing to efficient savings).211 The federal Standard does not currently include an EER component. The value is approximated based on the SEER standard (13) and equals EER 11.2. To perform this calculation we are using this formula: (-0.02 * SEER2) + (1.12 * SEER) (from Wassmer, M. (2003). A Component-Based Model for Residential Air Conditioner and Heat Pump Energy Calculations. Masters Thesis, University of Colorado at Boulder).212 Based on SEER of 10,0, using formula above to give 9.2 EER.213 Based on metering of 24 homes with central AC during PY4 and PY5 in Ameren Illinois service territory.214 Based on analysis of Itron eShape data for Missouri, calibrated to Illinois loads, supplied by Ameren. The average AC load over the PJM peak period (1-5pm, M-F, June through August) is divided by the maximum AC load during the year.
IL TRM v6.0 Vol. 3_January 25th, 2017_DRAFT Page 75 of 296

Illinois Statewide Technical Reference Manual – 5.1.1 ENERGY STAR Air Purifier/Cleaner
NATURAL GAS SAVINGS
N/A
WATER IMPACT DESCRIPTIONS AND CALCULATION
N/A
DEEMED O&M COST ADJUSTMENT CALCULATION
N/A
MEASURE CODE: RS-HVC-CAC1-V07-180101
REVIEW DEADLINE: 1/1/2021
IL TRM v6.0 Vol. 3_January 25th, 2017_DRAFT Page 76 of 296
Time of sale example: a 3 ton unit with EER rating of 12:
ΔkW SSP = (36,000 * (1/11.2– 1/12)) / 1000 * 0.68
= 0.146 kW
ΔkW PJM = (36,000 * (1/11.2– 1/12)) / 1000 * 0.466
= 0.100 kW
Early replacement example: a 3 ton unit with EER rating of 12 replaces an existing unit:
ΔkW SSP (for first 6 years) = (36,000 * (1/9.2– 1/12)) / 1000 * 0.68
= 0.621 kW
ΔkW SSP (for next 12 years) = (36,000 * (1/11.2– 1/12)) / 1000 * 0.68
= 0.146 kW
ΔkW PJM (for first 6 years) = (36,000 * (1/9.2– 1/12)) / 1000 * 0.466
= 0.425 kW
ΔkW PJM (for next 12 years)= (36,000 * (1/11.2– 1/12)) / 1000 * 0.466
= 0.100 kW
Illinois Statewide Technical Reference Manual – 5.1.1 ENERGY STAR Air Purifier/Cleaner
5.3.4 Duct Insulation and Sealing
DESCRIPTION
This measure describes evaluating the savings associated with performing duct sealing using mastic sealant or metal tape to the distribution system of homes with either central air conditioning or a ducted heating system.
Two methodologies for estimating the savings associate from sealing the ducts are provided. The first preferred method requires the use of a blower door and the second requires careful inspection of the duct work.
1. Modified Blower Door Subtraction – this technique is described in detail on p.44 of the Energy Conservatory Blower Door Manual; which can be found on the Energy Conservatory website (As of Oct 2014: http://www.energyconservatory.com/sites/default/files/documents/mod_3-4_dg700_-_new_flow_rings_-_cr_-_tpt_-_no_fr_switch_manual_ce_0.pdf)
2. Evaluation of Distribution Efficiency – this methodology requires the evaluation of three duct characteristics below, and use of the Building Performance Institutes ‘Distribution Efficiency Look-Up Table’;
http://www.bpi.org/files/pdf/DistributionEfficiencyTable-BlueSheet.pdf
a. Percentage of duct work found within the conditioned space
b. Duct leakage evaluation
c. Duct insulation evaluation
This measure was developed to be applicable to the following program types: RF.
If applied to other program types, the measure savings should be verified.
DEFINITION OF EFFICIENT EQUIPMENT
The efficient condition is sealed duct work throughout the unconditioned or semi-conditioned space in the home. A non conditioned space is defined as a space outside of the thermal envelope of the building that is not‐ intentionally heated for occupancy (crawl space, roof attic, etc). A semi-conditioned space is defined as a space within the thermal envelop that is not intentionally heated for occupancy (unfinished basement)215.
DEFINITION OF BASELINE EQUIPMENT
The existing baseline condition is leaky duct work within the unconditioned or semi-conditioned space in the home.
DEEMED LIFETIME OF EFFICIENT EQUIPMENT
The assumed lifetime of this measure is 20 years216.
DEEMED MEASURE COST
The actual duct sealing measure cost should be used.
LOADSHAPE
Loadshape R08 - Residential Cooling
215 Definition matches Regain factor discussed in Home Energy Services Impact Evaluation, prepared for the Massachusetts Residential Retrofit and Low Income Program Area Evaluation, Cadmus Group, Inc., August 2012216 Measure Life Report, Residential and Commercial/Industrial Lighting and HVAC Measures, GDS Associates, June 2007.http://neep.org/uploads/EMV%20Forum/EMV%20Studies/measure_life_GDS%5B1%5D.pdf
IL TRM v6.0 Vol. 3_January 25th, 2017_DRAFT Page 77 of 296

Illinois Statewide Technical Reference Manual – 5.1.1 ENERGY STAR Air Purifier/Cleaner
Loadshape R09 - Residential Electric Space HeatLoadshape R10 - Residential Electric Heating and Cooling (Shell Measures)
COINCIDENCE FACTOR
The summer peak coincidence factor for cooling is provided in two different ways below. The first is used to estimate peak savings during the utility peak hour and is most indicative of actual peak benefits, and the second represents the average savings over the defined summer peak period, and is presented so that savings can be bid into PJM’s Forward Capacity Market.
CFSSP = Summer System Peak Coincidence Factor for Central A/C (during utility peak hour)
= 68%217
CFPJM = PJM Summer Peak Coincidence Factor for Central A/C (average during PJM peak period)
= 46.6%218
Algorithm
CALCULATION OF SAVINGS
ELECTRIC ENERGY SAVINGS
Methodology 1: Modified Blower Door Subtraction
a) Determine Duct Leakage rate before and after performing duct sealing:Duct Leakage (CFM50DL) = (CFM50Whole House – CFM50Envelope Only) * SCF
Where:
CFM50Whole House = Standard Blower Door test result finding Cubic Feet per Minute at 50 Pascal pressure differential
CFM50Envelope Only = Blower Door test result finding Cubic Feet per Minute at 50 Pascal pressure differential with all supply and return registers sealed.
SCF = Subtraction Correction Factor to account for underestimation of duct leakage due to connections between the duct system and the home. Determined by measuring pressure in duct system with registers sealed and using look up table provided by Energy Conservatory.
b) Calculate duct leakage reduction, convert to CFM25DL and factor in Supply and Return Loss FactorsDuct Leakage Reduction (∆CFM25DL) = (Pre CFM50DL – Post CFM50DL) * 0.64 * (SLF + RLF)
Where:
0.64 = Converts CFM50 to CFM25219
SLF = Supply Loss Factor
217 Based on metering of 24 homes with central AC during PY4 and PY5 in Ameren Illinois service territory.218 Based on analysis of Itron eShape data for Missouri, calibrated to Illinois loads, supplied by Ameren. The average AC load over the PJM peak period (1-5pm, M-F, June through August) is divided by the maximum AC load during the year.219 25 Pascals is the standard assumption for typical pressures experienced in the duct system under normal operating conditions. To convert CFM50 to CFM25 you multiply by 0.64 (inverse of the “Can’t Reach Fifty” factor for CFM25; see Energy Conservatory Blower Door Manual).
IL TRM v6.0 Vol. 3_January 25th, 2017_DRAFT Page 78 of 296

Illinois Statewide Technical Reference Manual – 5.1.1 ENERGY STAR Air Purifier/Cleaner
= % leaks sealed located in Supply ducts * 1 220
Default = 0.5221
RLF = Return Loss Factor
= % leaks sealed located in Return ducts * 0.5222
Default = 0.25223
c) Calculate Electric Energy Savings:
ΔkWh = ΔkWhcooling + ΔkWhFan
ΔkWhcooling = ((∆CFM25DL/ ((CapacityCool/12,000) * 400)) * FLHcool * CapacityCool * TRFcool) / 1000 / ηCool
ΔkWhFan = (ΔTherms * Fe * 29.3)
Where:
∆CFM25DL = Duct leakage reduction in CFM25
= calculated above
CapacityCool = Capacity of Air Cooling system (Btu/hr)
=Actual
12,000 = Converts Btu/H capacity to tons
400 = Converts capacity in tons to CFM (400CFM / ton)224
FLHcool = Full load cooling hours
= Dependent on location as below225:
Climate Zone(City based upon)
FLHcoolSingle Family
FLHcoolMultifamily
1 (Rockford) 512 4672 (Chicago) 570 5063 (Springfield) 730 6634 (Belleville) 1,035 940
220 Assumes that for each percent of supply air loss there is one percent annual energy penalty. This assumes supply side leaks are direct losses to the outside and are not recaptured back to the house. This could be adjusted downward to reflect regain of usable energy to the house from duct leaks. For example, during the winter some of the energy lost from supply leaks in a crawlspace will probably be regained back to the house (sometimes 1/2 or more may be regained). More information provided in “Appendix E Estimating HVAC System Loss From Duct Airtightness Measurements” from http://www.energyconservatory.com/download/dbmanual.pdf221 Assumes 50% of leaks are in supply ducts. 222 Assumes that for each percent of return air loss there is a half percent annual energy penalty. Note that this assumes that return leaks contribute less to energy losses than do supply leaks. This value could be adjusted upward if there was reason to suspect that the return leaks contribute significantly more energy loss than “average” (e.g. pulling return air from a super heated attic), or can be adjusted downward to represent significantly less energy loss (e.g. pulling return air from a moderate temperature crawl space) . More information provided in “Appendix E Estimating HVAC System Loss From Duct Airtightness Measurements” from http://www.energyconservatory.com/download/dbmanual.pdf 223 Assumes 50% of leaks are in return ducts.224 This conversion is an industry rule of thumb; e.g. see http://www.hvacsalesandsupply.com/Linked%20Documents/Tech%20Tips/61-Why%20400%20CFM%20per%20ton.pdf225 Based on Full Load Hours from ENERGY Star with adjustments made in a Navigant Evaluation, other cities were scaled using those results and CDD. There is a county mapping table in Volume 1, Section 3.7 providing the appropriate city to use for each county of Illinois.
IL TRM v6.0 Vol. 3_January 25th, 2017_DRAFT Page 79 of 296
Illinois Statewide Technical Reference Manual – 5.1.1 ENERGY STAR Air Purifier/Cleaner
Climate Zone(City based upon)
FLHcoolSingle Family
FLHcoolMultifamily
5 (Marion) 903 820Weighted Average226 629 564
TRFcool = Thermal Regain Factor for cooling by space type
= 1.0 for Unconditioned Spaces
= 0.0 for Semi-Conditioned Spaces227
1000 = Converts Btu to kBtu
ηCool = Efficiency (SEER) of Air Conditioning equipment (kBtu/kWh)
= Actual. If unknown assume the following228:
Age of Equipment SEER EstimateBefore 2006 10After 2006 - 2014 13Central AC After 1/1/2015 13Heat Pump After 1/1/2015 14
ΔTherms = Therm savings as calculated in Natural Gas Savings
Fe = Furnace Fan energy consumption as a percentage of annual fuel consumption
= 3.14%229
29.3 = kWh per therm
226 Weighted based on number of occupied residential housing units in each zone.227 Thermal regain (i.e. the potential for conditioned air escaping from ducts not being lost to the atmosphere) for residential pipe insulation measures is discussed in Home Energy Services Impact Evaluation, prepared for the Massachusetts Residential Retrofit and Low Income Program Area Evaluation, Cadmus Group, Inc., August 2012.228 These default system efficiencies are based on the applicable minimum Federal Standards. In 2006 the Federal Standard for Central AC was adjusted. While one would expect the average system efficiency to be higher than this minimum, the likely degradation of efficiencies over time mean that using the minimum standard is appropriate.229 Fe is not one of the AHRI certified ratings provided for residential furnaces, but can be reasonably estimated from a calculation based on the certified values for fuel energy (Ef in MMBtu/yr) and Eae (kWh/yr). An average of a 300 record sample (non-random) out of 1495 was 3.14%. This is, appropriately, ~50% greater than the Energy Star version 3 criteria for 2% Fe. See “Programmable Thermostats Furnace Fan Analysis.xlsx” for reference.
IL TRM v6.0 Vol. 3_January 25th, 2017_DRAFT Page 80 of 296

Illinois Statewide Technical Reference Manual – 5.1.1 ENERGY STAR Air Purifier/Cleaner
Heating savings for homes with electric heat:
ΔkWhheating = ((∆CFM25DL /((OutputCapacityHeat/12,000) * 400)) * FLHheat * OutputCapacityHeat * TRFheat) / ηHeat / 3412
Where:
OutputCapacityHeat = Heating output capacity (Btu/hr) of electric heat
=Actual
FLHheat = Full load heating hours
= Dependent on location as below230:
Climate Zone(City based upon) FLH_heat
1 (Rockford) 1,9692 (Chicago) 1,8403 (Springfield) 1,754
230 Heating EFLH based on ENERGY Star EFLH for Rockford, Chicago, and Springfield and on NCDC/NOAA HDD for the other two cities. In all cases, the hours were adjusted based on average natural gas heating consumption in IL.
IL TRM v6.0 Vol. 3_January 25th, 2017_DRAFT Page 81 of 296
For example, duct sealing in unconditioned space a single family house in Springfield with a 36,000 Btu/H, SEER 11 central air conditioning, an 80% AFUE, 105,000 Btu/H natural gas furnace and the following blower door test results:
Before: CFM50Whole House = 4800 CFM50
CFM50Envelope Only = 4500 CFM50
House to duct pressure of 45 Pascals. = 1.29 SCF (Energy Conservatory look up table)
After: CFM50Whole House = 4600 CFM50
CFM50Envelope Only = 4500 CFM50
House to duct pressure of 43 Pascals = 1.39 SCF (Energy Conservatory look up table)
Duct Leakage:
CFM50DL before = (4800 – 4500) * 1.29
= 387 CFM
CFM50DL after = (4600 – 4500) * 1.39
= 139 CFM
Duct Leakage reduction at CFM25:
∆CFM25DL = (387 – 139) * 0.64 * (0.5 + 0.25)
= 119 CFM25
Energy Savings:
ΔkWhcooling = [((119 / ((36,000/12,000) * 400)) * 730 * 36,000 * 1) / 1000 / 11] + (212 * 0.0314 * 29.3)
= 237 + 195
= 432 kWh

Illinois Statewide Technical Reference Manual – 5.1.1 ENERGY STAR Air Purifier/Cleaner
Climate Zone(City based upon) FLH_heat
4 (Belleville) 1,2665 (Marion) 1,288Weighted Average231 1,821
TRFheat = Thermal Regain Factor for heating by space type
= 0.40 for Semi-Conditioned Spaces
= 1.0 for Unconditioned Spaces232
ηHeat = Efficiency in COP of Heating equipment
= Actual. If not available use233:
System Type Age of Equipment HSPF Estimate
COP Estimate
Heat PumpBefore 2006 6.8 2.00After 2006 - 2014 7.7 2.262015 on 8.2 2.40
Resistance N/A N/A 1.00
3412 = Converts Btu to kWh
Methodology 2: Evaluation of Distribution Efficiency
Determine Distribution Efficiency by evaluating duct system before and after duct sealing using Building Performance Institute “Distribution Efficiency Look-Up Table”
ΔkWh = ((((DEafter – DEbefore) / DEafter) * FLHcool * CapacityCool * TRFcool)/1000 / ηCool) + (ΔTherms * Fe * 29.3)
Where:
DEafter = Distribution Efficiency after duct sealing
DEbefore = Distribution Efficiency before duct sealing
FLHcool = Full load cooling hours
231 Weighted based on number of occupied residential housing units in each zone.232 Thermal regain (i.e. the potential for conditioned air escaping from ducts not being lost to the atmosphere) for residential pipe insulation measures is discussed in Home Energy Services Impact Evaluation, prepared for the Massachusetts Residential Retrofit and Low Income Program Area Evaluation, Cadmus Group, Inc., August 2012.233 These default system efficiencies are based on the applicable minimum Federal Standards. In 2006 the Federal Standard for Heat Pumps was adjusted. While one would expect the average system efficiency to be higher than this minimum, the likely degradation of efficiencies over time mean that using the minimum standard is appropriate.
IL TRM v6.0 Vol. 3_January 25th, 2017_DRAFT Page 82 of 296
For example, duct sealing in unconditioned space in a 36,000 Btu/H 2.5 COP heat pump heated single family house in Springfield with the blower door results described above:
ΔkWhheating = ((119 / ((36,000/12,000) * 400)) * 1,754 * 36,000 * 1) / 2.5 / 3412
= 734 kWh

Illinois Statewide Technical Reference Manual – 5.1.1 ENERGY STAR Air Purifier/Cleaner
= Dependent on location as below234:
Climate Zone(City based upon)
FLHcoolSingle Family
FLHcoolMultifamily
1 (Rockford) 512 4672 (Chicago) 570 5063 (Springfield) 730 6634 (Belleville) 1,035 9405 (Marion) 903 820Weighted Average235 629 564
CapacityCool = Capacity of Air Cooling system (Btu/hr)
=Actual
TRFcool = Thermal Regain Factor for cooling by space type
= 1.0 for Unconditioned Spaces
= 0.0 for Semi-Conditioned Spaces236
1000 = Converts Btu to kBtu
ηCool = Efficiency (SEER) of Air Conditioning equipment (kBtu/kWh)
= Actual. If unknown assume237:
Age of Equipment SEER EstimateBefore 2006 10After 2006 - 2014 13Central AC After 1/1/2015 13Heat Pump After 1/1/2015 14
234 Based on Full Load Hours from ENERGY Star with adjustments made in a Navigant Evaluation, other cities were scaled using those results and CDD. There is a county mapping table in Volume 1, Section 3.7 providing the appropriate city to use for each county of Illinois.235 Weighted based on number of occupied residential housing units in each zone.236 Thermal regain for residential pipe insulation measures is discussed in Home Energy Services Impact Evaluation, prepared for the Massachusetts Residential Retrofit and Low Income Program Area Evaluation, Cadmus Group, Inc., August 2012.237 These default system efficiencies are based on the applicable minimum Federal Standards. In 2006 the Federal Standard for Central AC was adjusted. While one would expect the average system efficiency to be higher than this minimum, the likely degradation of efficiencies over time mean that using the minimum standard is appropriate.
IL TRM v6.0 Vol. 3_January 25th, 2017_DRAFT Page 83 of 296
For example, duct sealing in unconditioned space in a single family house in Springfield, with 36,000 Btu/H SEER 11 central air conditioning, an 80% AFUE, 105,000 Btu/H natural gas furnace and the following duct evaluation results:
DEbefore = 0.85
DEafter = 0.92
Energy Savings:
ΔkWhcooling = ((((0.92 – 0.85)/0.92) * 730 * 36,000 * 1) / 1000 / 11) + (212 * 0.0314 * 29.3)
= 182 + 195
= 377 kWh

Illinois Statewide Technical Reference Manual – 5.1.1 ENERGY STAR Air Purifier/Cleaner
Heating savings for homes with electric heat:
ΔkWhheating = ((DEafter – DEbefore)/ DEafter)) * FLHheat * OutputCapacityHeat * TRFheat) / ηHeat / 3412
Where:
OutputCapacityHeat = Heating output capacity (Btu/hr) of the electric heat
=Actual
FLHheat = Full load heating hours
= Dependent on location as below238:
Climate Zone(City based upon) FLH_heat
1 (Rockford) 1,9692 (Chicago) 1,8403 (Springfield) 1,7544 (Belleville) 1,2665 (Marion) 1,288Weighted Average239 1,821
TRFheat = Thermal Regain Factor for heating by space type
= 0.40 for Semi-Conditioned Spaces
= 1.0 for Unconditioned Spaces240
COP = Coefficient of Performance of electric heating system241
= Actual. If not available use242:
System Type Age of Equipment HSPF Estimate COP Estimate
Heat PumpBefore 2006 6.8 2.00After 2006 - 2014 7.7 2.262015 on 8.2 2.40
Resistance N/A N/A 1.00
238 Heating EFLH based on ENERGY Star EFLH for Rockford, Chicago, and Springfield and on NCDC/NOAA HDD for the other two cities. In all cases, the hours were adjusted based on average natural gas heating consumption in IL.239 Weighted based on number of occupied residential housing units in each zone.240 Thermal regain for residential pipe insulation measures is discussed in Home Energy Services Impact Evaluation, prepared for the Massachusetts Residential Retrofit and Low Income Program Area Evaluation, Cadmus Group, Inc., August 2012.241 Note that the HSPF of a heat pump is equal to the COP * 3.413.242 These default system efficiencies are based on the applicable minimum Federal Standards. In 2006 the Federal Standard for Heat Pumps was adjusted. While one would expect the average system efficiency to be higher than this minimum, the likely degradation of efficiencies over time mean that using the minimum standard is appropriate.
IL TRM v6.0 Vol. 3_January 25th, 2017_DRAFT Page 84 of 296
Illinois Statewide Technical Reference Manual – 5.1.1 ENERGY STAR Air Purifier/Cleaner
SUMMER COINCIDENT PEAK DEMAND SAVINGS
ΔkW = ΔkWhcooling/ FLHcool * CF
Where:
FLHcool = Full load cooling hours:
= Dependent on location as below243:
Climate Zone(City based upon)
FLHcoolSingle Family
FLHcoolMultifamily
1 (Rockford) 512 4672 (Chicago) 570 5063 (Springfield) 730 6634 (Belleville) 1,035 9405 (Marion) 903 820Weighted Average244 629 564
CFSSP = Summer System Peak Coincidence Factor for Central A/C (during system peak hour)
= 68%245
CFPJM = PJM Summer Peak Coincidence Factor for Central A/C (average during peak period)
= 46.6%246
NATURAL GAS SAVINGS
For homes with Natural Gas Heating:
Methodology 1: Modified Blower Door Subtraction
ΔTherm = (((∆CFM25DL / (InputCapacityHeat * 0.0123)) * FLHheat * InputCapacityHeat * TRFheat * (ηEquipment / ηSystem)) / 100,000
Where:
243 Based on Full Load Hours from ENERGY Star with adjustments made in a Navigant Evaluation, other cities were scaled using those results and CDD. There is a county mapping table in Volume 1, Section 3.7 providing the appropriate city to use for each county of Illinois.244 Weighted based on number of occupied residential housing units in each zone.245 Based on metering of 24 homes with central AC during PY4 and PY5 in Ameren Illinois service territory.246 Based on analysis of Itron eShape data for Missouri, calibrated to Illinois loads, supplied by Ameren. The average AC load over the PJM peak period (1-5pm, M-F, June through August) is divided by the maximum AC load during the year.
IL TRM v6.0 Vol. 3_January 25th, 2017_DRAFT Page 85 of 296
For example, duct sealing in unconditioned space in a 36,000 Btu/H, 2.5 COP heat pump heated single family house in Springfield with the following duct evaluation results:
DEafter = 0.92
DEbefore = 0.85
Energy Savings:
ΔkWhheating = ((0.92 – 0.85)/0.92) * 1,754 * 36,000 * 1) / 2.5) / 3412
= 563 kWh

Illinois Statewide Technical Reference Manual – 5.1.1 ENERGY STAR Air Purifier/Cleaner
∆CFM25DL = Duct leakage reduction in CFM25
InputCapacityHeat = Heating input capacity (Btu/hr)
=Actual
0.0123 = Conversion of Capacity to CFM (0.0123CFM / Btu/hr)247
FLHheat = Full load heating hours
=Dependent on location as below248:
Climate Zone(City based upon) FLH_heat
1 (Rockford) 1,9692 (Chicago) 1,8403 (Springfield) 1,7544 (Belleville) 1,2665 (Marion) 1,288Weighted Average249 1,821
TRFheat = Thermal Regain Factor for heating by space type
= 0.40 for Semi-Conditioned Spaces
= 1.0 for Unconditioned Spaces250
100,000 = Converts Btu to therms
ηEquipment = Heating Equipment Efficiency
= Actual251. If not available use 83%252
ηSystem = Pre duct sealing Heating System Efficiency (Equipment Efficiency * Pre Distribution 247 Based on Natural Draft Furnaces requiring 100 CFM per 10,000 Btu, Induced Draft Furnaces requiring 130CFM per 10,000Btu and Condensing Furnaces requiring 150 CFM per 10,000 Btu (rule of thumb from http://contractingbusiness.com/enewsletters/cb_imp_43580/). Data provided by GAMA during the federal rule-making process for furnace efficiency standards, suggested that in 2000, 24% of furnaces purchased in Illinois were condensing units. Therefore a weighted average required airflow rate is calculated assuming a 50:50 split of natural v induced draft non-condensing furnaces, as 123 per 10,000Btu or 0.0123/Btu.248 Heating EFLH based on ENERGY Star EFLH for Rockford, Chicago, and Springfield and on NCDC/NOAA HDD for the other two cities. In all cases, the hours were adjusted based on average natural gas heating consumption in IL.249 Weighted based on number of occupied residential housing units in each zone.250 Thermal regain for residential pipe insulation measures is discussed in Home Energy Services Impact Evaluation, prepared for the Massachusetts Residential Retrofit and Low Income Program Area Evaluation, Cadmus Group, Inc., August 2012.251 The Equipment Efficiency can be obtained either by recording the AFUE of the unit, or performing a steady state efficiency test. If there are more than one heating systems, the weighted (by consumption) average efficiency should be used. If the heating system or distribution is being upgraded within a package of measures together with the insulation upgrade, the new average heating system efficiency should be used.252 This has been estimated assuming that natural gas central furnace heating is typical for Illinois residences (66% of Illinois homes have a Natural Gas Furnace (based on Energy Information Administration, 2009 Residential Energy Consumption Survey: http://www.eia.gov/consumption/residential/data/2009/xls/HC6.9%20Space%20Heating%20in%20Midwest%20Region.xls))In 2000, 24% of furnaces purchased in Illinois were condensing (based on data from GAMA, provided to Department of Energy during the federal standard setting process for residential heating equipment - see Furnace Penetration.xls). Furnaces tend to last up to 20 years and so units purchased 10 years ago provide a reasonable proxy for the current mix of furnaces in the State. Assuming typical efficiencies for condensing and non-condensing furnaces and duct losses, the average heating system efficiency is estimated as follows: (0.24*0.92) + (0.76*0.8) = 0.829
IL TRM v6.0 Vol. 3_January 25th, 2017_DRAFT Page 86 of 296
Illinois Statewide Technical Reference Manual – 5.1.1 ENERGY STAR Air Purifier/Cleaner
Efficiency)253
= Actual. If not available use 70%254
Methodology 2: Evaluation of Distribution Efficiency
ΔTherm = ((DEafter – DEbefore)/ DEafter)) * FLHheat * InputCapacityHeat * TRFheat * (ηEquipment / ηSystem)) / 100,000
Where:
DEafter = Distribution Efficiency after duct sealing
DEbefore = Distribution Efficiency before duct sealing
Other variables as defined above
253 The Distribution Efficiency can be estimated via a visual inspection and by referring to a look up table such as that provided by the Building Performance Institute: (http://www.bpi.org/files/pdf/DistributionEfficiencyTable-BlueSheet.pdf) or by performing duct blaster testing.254 Estimated as follows: 0.829 * (1-0.15) = 0.70
IL TRM v6.0 Vol. 3_January 25th, 2017_DRAFT Page 87 of 296
For example, duct sealing in unconditioned space in a house in Springfield with an 80% AFUE, 105,000 Btu/H (input capacity) natural gas furnace and the following blower door test results:
Before: CFM50Whole House = 4800 CFM50
CFM50Envelope Only = 4500CFM50
House to duct pressure of 45 Pascals = 1.29 SCF (Energy Conservatory look up table)
After: CFM50Whole House = 4600 CFM50
CFM50Envelope Only = 4500CFM50
House to duct pressure of 43 Pascals = 1.39 SCF (Energy Conservatory look up table)
Duct Leakage:
CFM50DL before = (4800 – 4500) * 1.29
= 387 CFM
CFM50DL after = (4600 – 4500) * 1.39
= 119 CFM
Duct Leakage reduction at CFM25:
∆CFM25DL = (387 – 139) * 0.64 * (0.5 + 0.25)
= 119 CFM25
Energy Savings:
Pre Distribution Efficiency = 1 – (387/4800) = 92%
ηSystem = 80% * 92% = 74%
ΔTherm = ((119/ (105,000 * 0.0123)) * 1,754 * 105,000 * 1 *(0.8/0.74)) / 100,000
= 183 therms
Illinois Statewide Technical Reference Manual – 5.1.1 ENERGY STAR Air Purifier/Cleaner
WATER IMPACT DESCRIPTIONS AND CALCULATION
N/A
DEEMED O&M COST ADJUSTMENT CALCULATION
N/A
MEASURE CODE: RS-HVC-DINS-V06-160601
REVIEW DEADLINE: 1/1/2022
IL TRM v6.0 Vol. 3_January 25th, 2017_DRAFT Page 88 of 296
For example, duct sealing in unconditioned space in a house in Springfield an 80% AFUE, 105,000 Btu/H (input capacity) natural gas furnace and the following duct evaluation results:
DEafter = 0.92
DEbefore = 0.85
Energy Savings:
ηSystem = 80% * 85% = 68%
ΔTherm = ((0.92 – 0.85)/0.92) * 1,754 * 105,000 * 1 * (0.8/0.68)) / 100,000
= 164 therm

Illinois Statewide Technical Reference Manual – 5.1.1 ENERGY STAR Air Purifier/Cleaner
5.3.5 Furnace Blower Motor
DESCRIPTION
A new furnace with a brushless permanent magnet (BPM) blower motor is installed instead of a new furnace with a lower efficiency motor. This measure characterizes only the electric savings associated with the fan and could be coupled with gas savings associated with a more efficient furnace. Savings decrease sharply with static pressure so duct improvements, and clean, low pressure drop filters can maximize savings. Savings improve when the blower is used for cooling as well and when it is used for continuous ventilation, but only if the non-BPM motor would have been used for continuous ventilation too. If the resident runs the BPM blower continuously because it is a more efficient motor and would not run a non-BPM motor that way, savings are near zero and possibly negative. This characterization uses a 2009 Focus on Energy study of BPM blower motor savings in Wisconsin, which accounted for the effects of this behavioral impact.
This measure was developed to be applicable to the following program types: TOS, NC.
If applied to other program types, the measure savings should be verified.
DEFINITION OF EFFICIENT EQUIPMENT
A furnace with a brushless permanent magnet (BPM) blower motor, also known by the trademark ECM, BLDC, and other names.
DEFINITION OF BASELINE EQUIPMENT
A furnace with a non-BPM blower motor.
DEEMED LIFETIME OF EFFICIENT EQUIPMENT
The expected measure life is assumed to be 20 years255.
DEEMED MEASURE COST
The capital cost for this measure is assumed to be $97256.
LOADSHAPE
Loadshape R08 - Residential CoolingLoadshape R09 - Residential Electric Space HeatLoadshape R10 - Residential Electric Heating and Cooling
COINCIDENCE FACTOR
The summer peak coincidence factor for cooling is provided in two different ways below. The first is used to estimate peak savings during the utility peak hour and is most indicative of actual peak benefits, and the second represents the average savings over the defined summer peak period, and is presented so that savings can be bid into PJM’s Forward Capacity Market.
CFSSP = Summer System Peak Coincidence Factor for Central A/C (during utility peak hour)
= 68%257
255 Consistent with assumed life of a new gas furnace. Table 8.3.3 The Technical support documents for federal residential appliance standards: http://www1.eere.energy.gov/buildings/appliance_standards/residential/pdfs/fb_fr_tsd/chapter_8.pdf256 Adapted from Tables 8.2.3 and 8.2.13 in http://www1.eere.energy.gov/buildings/appliance_standards/residential/pdfs/hvac_ch_08_lcc_2011-06-24.pdf 257 Based on metering of 24 homes with central AC during PY4 and PY5 in Ameren Illinois service territory.
IL TRM v6.0 Vol. 3_January 25th, 2017_DRAFT Page 89 of 296

Illinois Statewide Technical Reference Manual – 5.1.1 ENERGY STAR Air Purifier/Cleaner
CFPJM = PJM Summer Peak Coincidence Factor for Central A/C (average during PJM peak period)
= 46.6%258
Algorithm
CALCULATION OF SAVINGS
ELECTRIC ENERGY SAVINGS
ΔkWh = Heating Savings + Cooling Savings + Shoulder Season Savings
Where:
Heating Savings = Blower motor savings during heating season
= 418 kWh259
Cooling Savings = Blower motor savings during cooling season
If Central AC = 263 kWh
If No Central AC = 175 kWh
If unknown (weighted average)
= 241 kWh260
Shoulder Season Savings = Blower motor savings during shoulder seasons
= 51 kWh
SUMMER COINCIDENT PEAK DEMAND SAVINGS
ΔkW = Cooling Savings / FLH_cooling * CF
Where:
FLH_cooling = Full load hours of air conditioning
= Dependent on location261:
258 Based on analysis of Itron eShape data for Missouri, calibrated to Illinois loads, supplied by Ameren. The average AC load over the PJM peak period (1-5pm, M-F, June through August) is divided by the maximum AC load during the year.259 To estimate heating, cooling and shoulder season savings for Illinois, VEIC adapted results from a 2009 Focus on Energy study of BPM blower motor savings in Wisconsin. This study included effects of behavior change based on the efficiency of new motor greatly increasing the amount of people that run the fan continuously. The savings from the Wisconsin study were adjusted to account for different run hour assumptions (average values used) for Illinois. See: FOE to IL Blower Savings.xlsx.260 The weighted average value is based on assumption that 75% of homes installing BPM furnace blower motors have Central AC. 66% of IL housing units have CAC and 66% have gas furnaces. It is logical these two groups overlap to a large extent (like the 95% in the FOE study above).261 Full load hours for Chicago, Moline and Rockford are provided in “Final Evaluation Report: Central Air Conditioning Efficiency Services (CACES), 2010, Navigant Consulting”, p.33. An average FLH/Cooling Degree Day (from NCDC) ratio was calculated for
IL TRM v6.0 Vol. 3_January 25th, 2017_DRAFT Page 90 of 296
For example, a blower motor in a home where Central AC presence is unknown:
ΔkWh = Heating Savings + Cooling Savings + Shoulder Season Savings
= 418 +263 + 51
= 732 kWh

Illinois Statewide Technical Reference Manual – 5.1.1 ENERGY STAR Air Purifier/Cleaner
Climate Zone(City based upon) FLH_cooling
1 (Rockford) 5122 (Chicago) 5703 (Springfield) 7304 (Belleville) 1,0355 (Marion) 903Weighted Average262 629
CFSSP = Summer System Peak Coincidence Factor for Central A/C (during system peak hour)
= 68%263
CFPJM = PJM Summer Peak Coincidence Factor for Central A/C (average during peak period)
= 46.6%264
NATURAL GAS SAVINGS
Δtherms265 = - Heating Savings * 0.03412/ AFUE
Where:
0.03412 = Converts kWh to therms
AFUE = Efficiency of the Furnace
= Actual. If unknown assume 95%266 if in new furnace or 64.4 AFUE% 267 if in existing furnace
Using defaults:
For new Furnace = - (418 * 0.03412) / 0.95
= - 15.0 therms
For existing Furnace = - (418 * 0.03412) / 0.644
= - 22.1 therms
these locations and applied to the CDD of the other locations in order to estimate FLH. There is a county mapping table in Volume 1, Section 3.7 providing the appropriate city to use for each county of Illinois.262 Weighted based on number of occupied residential housing units in each zone.263 Based on metering of 24 homes with central AC during PY4 and PY5 in Ameren Illinois service territory.264 Based on analysis of Itron eShape data for Missouri, calibrated to Illinois loads, supplied by Ameren. The average AC load over the PJM peak period (1-5pm, M-F, June through August) is divided by the maximum AC load during the year.265 The blower fan is in the heating duct so all, or very nearly all, of its waste heat is delivered to the conditioned space. Negative value since this measure will increase the heating load due to reduced waste heat.266 Minimum ENERGY STAR efficiency after 2.1.2012.267 Average nameplate efficiencies of all Early Replacement qualifying equipment in Ameren PY3-PY4.
IL TRM v6.0 Vol. 3_January 25th, 2017_DRAFT Page 91 of 296
For example, a blower motor in a home of unknown location where Central AC prevalence is unknown:
ΔkWSSP = 251 / 629 * 0.68
= 0.271 kW
ΔkWSSP = 251 / 629 * 0.466
= 0.186 kW

Illinois Statewide Technical Reference Manual – 5.1.1 ENERGY STAR Air Purifier/Cleaner
WATER IMPACT DESCRIPTIONS AND CALCULATION
N/A
DEEMED O&M COST ADJUSTMENT CALCULATION
N/A
MEASURE CODE: RS-HVC-FBMT-V03-150601
REVIEW DEADLINE: 1/1/2020
IL TRM v6.0 Vol. 3_January 25th, 2017_DRAFT Page 92 of 296
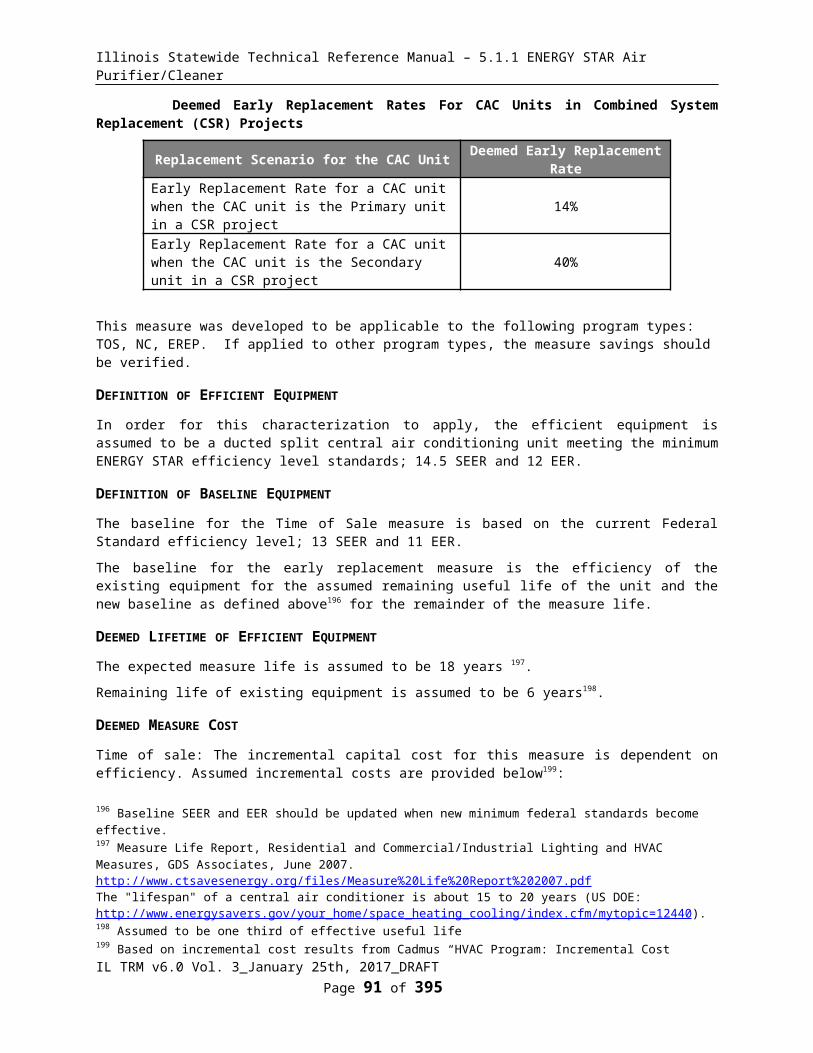
Illinois Statewide Technical Reference Manual – 5.1.1 ENERGY STAR Air Purifier/Cleaner
5.3.6 Gas High Efficiency Boiler
DESCRIPTION
High efficiency boilers achieve most gas savings through the utilization of a sealed combustion chamber and multiple heat exchangers that remove a significant portion of the waste heat from flue gasses. Because multiple heat exchangers are used to remove waste heat from the escaping flue gasses, some of the flue gasses condense and must be drained.
This measure characterizes:
a) Time of Sale:
a. The installation of a new high efficiency, gas-fired hot water boiler in a residential location. This could relate to the replacement of an existing unit at the end of its useful life, or the installation of a new system in a new home.
b) Early Replacement:
Early Replacement determination will be based on meeting the following conditions:
• The existing unit is operational when replaced, or• The existing unit requires minor repairs (<$709)268. • All other conditions will be considered Time of Sale.
The Baseline AFUE of the existing unit replaced:
• If the AFUE of the existing unit is known and <=75%, the Baseline AFUE is the actual AFUE value of the unit replaced. If the AFUE is >75%, the Baseline AFUE = 82%.
• If the AFUE of the existing unit is unknown, use assumptions in variable list below (AFUE(exist)).
• If the operational status or repair cost of the existing unit is unknown, use time of sale assumptions.
A weighted average early replacement rate is provided for use when the actual baseline early replacement rates are unknown269.
Deemed Early Replacement Rates For Boilers
Deemed Early Replacement RateEarly Replacement Rate for Boiler participants 7%
This measure was developed to be applicable to the following program types: TOS, NC, EREP. If applied to other program types, the measure savings should be verified.
DEFINITION OF EFFICIENT EQUIPMENT
To qualify for this measure the installed Boiler must be ENERGY STAR qualified (AFUE rated at or greater than 85% and input capacity less than 300,000 Btu/hr).
268 The Technical Advisory Committee agreed that if the cost of repair is less than 20% of the new baseline replacement cost it can be considered early replacement. Note the non-inflated cost is used as this would be a cost consideration in the program year.269 Based upon research from “Home Energy Efficiency Rebate Program GPY2 Evaluation Report” which outlines early replacement rates for both primary and secondary central air cooling (CAC) and residential furnaces. This is used as a reasonable proxy for boiler installations since boiler specific data is not available. Report presented to Nicor Gas Company February 27, 2014, available at http://www.ilsag.info/evaluation-documents.html.
IL TRM v6.0 Vol. 3_January 25th, 2017_DRAFT Page 93 of 296
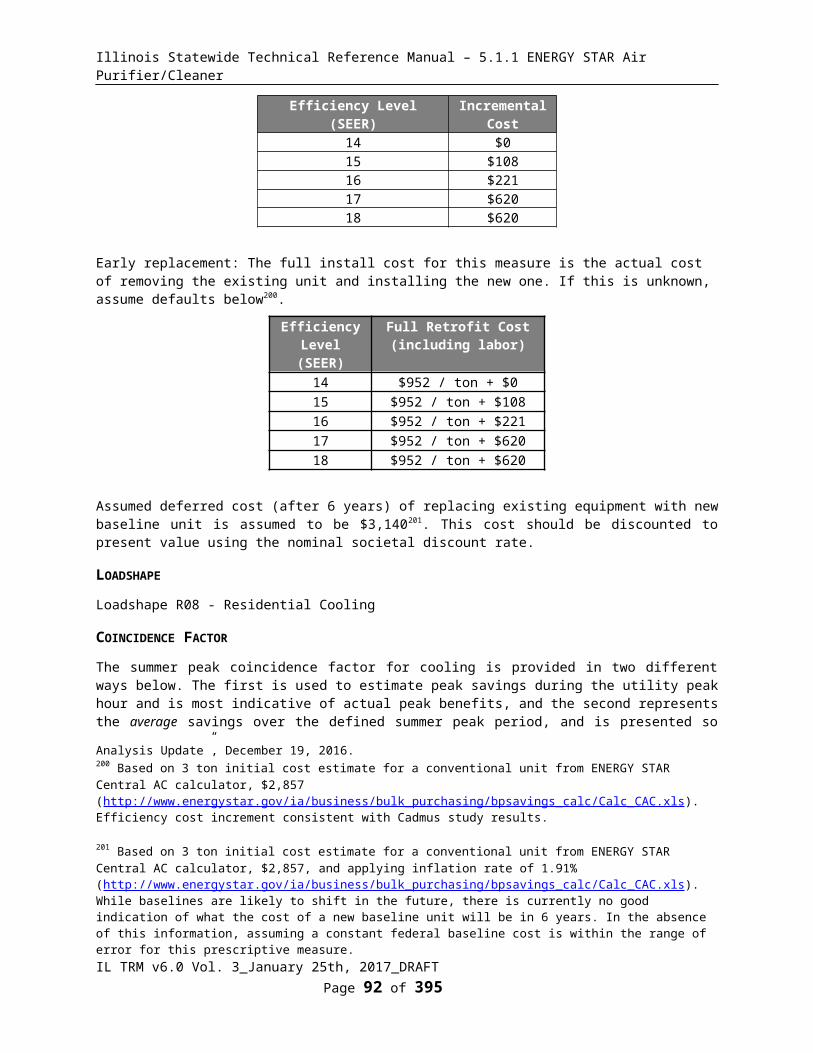
Illinois Statewide Technical Reference Manual – 5.1.1 ENERGY STAR Air Purifier/Cleaner
DEFINITION OF BASELINE EQUIPMENT
Time of sale: The baseline equipment for this measure is a new, gas-fired, standard-efficiency water boiler. The current Federal Standard minimum is 82% AFUE.
Early replacement: The baseline for this measure is the efficiency of the existing equipment for the assumed remaining useful life of the unit and the new baseline as defined above for the remainder of the measure life.
DEEMED LIFETIME OF EFFICIENT EQUIPMENT
The expected measure life is assumed to be 25 years270.
Early replacement: Remaining life of existing equipment is assumed to be 8 years271.
DEEMED MEASURE COST
Time of sale: The incremental install cost for this measure is dependent on tier272:
Measure Type Installation Cost Incremental Install Cost
AFUE 82% $3543 n/aAFUE 85% (Energy Star Minimum)
$4268 $725
AFUE 90% $4815 $1,272AFUE 95% $5328 $1,785
Early Replacement: The full installation cost is provided in the table above. The assumed deferred cost (after 8 years) of replacing existing equipment with a new baseline unit is assumed to be $4,045 273. This cost should be discounted to present value using the nominal discount rate.
LOADSHAPE
N/A
COINCIDENCE FACTOR
N/A
Algorithm
CALCULATION OF SAVINGS
ELECTRIC ENERGY SAVINGS
N/A
270 Table 8.3.3 The Technical support documents for federal residential appliance standards: http://www1.eere.energy.gov/buildings/appliance_standards/residential/pdfs/fb_fr_tsd/chapter_8.pdf271 Assumed to be one third of effective useful life272 Based on data provided in Appendix E of the Appliance Standards Technical Support Documents including equipment cost and installation labor (http://www1.eere.energy.gov/buildings/appliance_standards/residential/pdfs/fb_fr_tsd/appendix_e.pdf). Where efficiency ratings are not provided, the values are interpolated from those that are.273 $3543 inflated using 1.91% rate.
IL TRM v6.0 Vol. 3_January 25th, 2017_DRAFT Page 94 of 296

Illinois Statewide Technical Reference Manual – 5.1.1 ENERGY STAR Air Purifier/Cleaner
SUMMER COINCIDENT PEAK DEMAND SAVINGS
N/A
NATURAL GAS SAVINGS
Time of Sale:
ΔTherms = Gas_Boiler_Load * HF * (1/AFUE(base) - 1/AFUE(eff))
Early replacement274:
ΔTherms for remaining life of existing unit (1st 8 years):
= Gas_Boiler_Load * HF * (1/AFUE(exist) - 1/AFUE(eff)))
ΔTherms for remaining measure life (next 17 years):
= Gas_Boiler_Load * HF * (1/AFUE(base) - 1/AFUE(eff)))
Where:
Gas_Boiler_Load275 = Estimate of annual household Load for gas boiler heated single-family homes. If location is unknown, assume the average below276.
= or Actual if informed by site-specific load calculations, ACCA Manual J or equivalent277.
Climate Zone(City based upon)
Gas_Boiler Load(therms)
1 (Rockford) 12752 (Chicago) 12183 (Springfield) 10434 (Belleville) 8055 (Marion) 819Average 1158
HF = Household factor, to adjust heating consumption for non-single-family households.
Household Type HFSingle-Family 100%
274 The two equations are provided to show how savings are determined during the initial phase of the measure (existing to efficient) and the remaining phase (new baseline to efficient). In practice, the screening tools used may either require a First Year savings (using the first equation) and then a “number of years to adjustment” and “savings adjustment” input which would be the (new base to efficient savings)/(existing to efficient savings).275 Boiler consumption values are informed by an evaluation which did not identify any fraction of heating load due to domestic hot water (DHW) provided by the boiler. Thus these values are an average of both homes with boilers only providing heat, and homes with boilers that also provide DHW. Heating load is used to describe the household heating need, which is equal to (gas heating consumption * AFUE )276 Values are based on household heating consumption values and inferred average AFUE results from Table 3-4, Program Sample Analysis, Nicor R29 Res Rebate Evaluation Report 092611_REV FINAL to Nicor). Adjusting to a statewide average using relative HDD values to adjust for the evaluation results focus on northern region. Values for individual cities are then calculated by comparing average HDD to the individual city’s HDD.277 The Air Conditioning Contractors of America Manual J, Residential Load Calculation 8th Edition produces equipment sizing loads for Single Family, Multi-single, and Condominiums using input characteristics of the home. A best practice for equipment selection and installation of Heating and Air Conditioning, load calculations should be completed by contractors during the selection process and may be readily available for program data purposes.
IL TRM v6.0 Vol. 3_January 25th, 2017_DRAFT Page 95 of 296
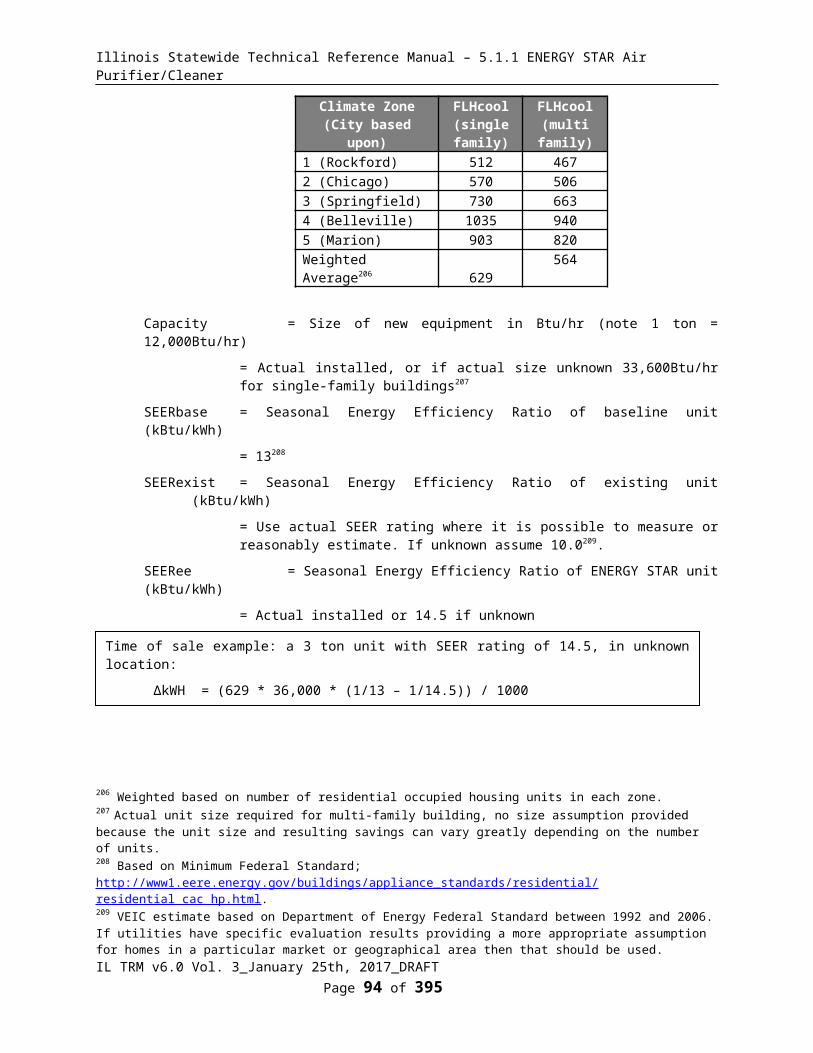
Illinois Statewide Technical Reference Manual – 5.1.1 ENERGY STAR Air Purifier/Cleaner
Household Type HFMulti-Family 65%278
Actual Custom279
AFUE(exist) = Existing Boiler Annual Fuel Utilization Efficiency Rating
= Use actual AFUE rating where it is possible to measure or reasonably estimate.
If unknown, assume 61.6 AFUE% 280.
AFUE(base) = Baseline Boiler Annual Fuel Utilization Efficiency Rating
= 82%
AFUE(eff) = Efficent Boiler Annual Fuel Utilization Efficiency Rating
= Actual. If unknown, use defaults dependent281 on tier as listed below:
Measure Type AFUE(eff)ENERGY STAR® 87.5%AFUE 90% 92.5%AFUE 95% 95%
WATER IMPACT DESCRIPTIONS AND CALCULATION
N/A
278 Multifamily household heating consumption relative to single-family households is affected by overall household square footage and exposure to the exterior. This 65% factor is applied to MF homes based on professional judgment that average household size, and heat loads of MF households are smaller than single-family homes 279 Program-specific household factors may be utilized on the basis of sufficiently validated program evaluations. 280 Average nameplate efficiencies of all Early Replacement qualifying equipment in Ameren PY3-PY4.281 Default values per tier selected based upon the average AFUE value for the tier range except for the top tier where the minimum is used due to proximity to the maximum possible.
IL TRM v6.0 Vol. 3_January 25th, 2017_DRAFT Page 96 of 296
Time of Sale:
For example, a default sized ENERGY STAR boiler purchased and installed near Springfield
ΔTherms = 1043 * (1/0.82 - 1/0.875)
= 80.0 Therms
Early Replacement:
For example, an existing function boiler with unknown efficiency is replaced with an ENERGY STAR boiler purchased and installed in Springfield.
ΔTherms for remaining life of existing unit (1st 8 years):
= 1043 * (1/0.616 – 1/0.875)
= 501 Therms
ΔTherms for remaining measure life (next 17 years):
= (1043) * (1/0.82 - 1/0.875)
= 80.0 Therms
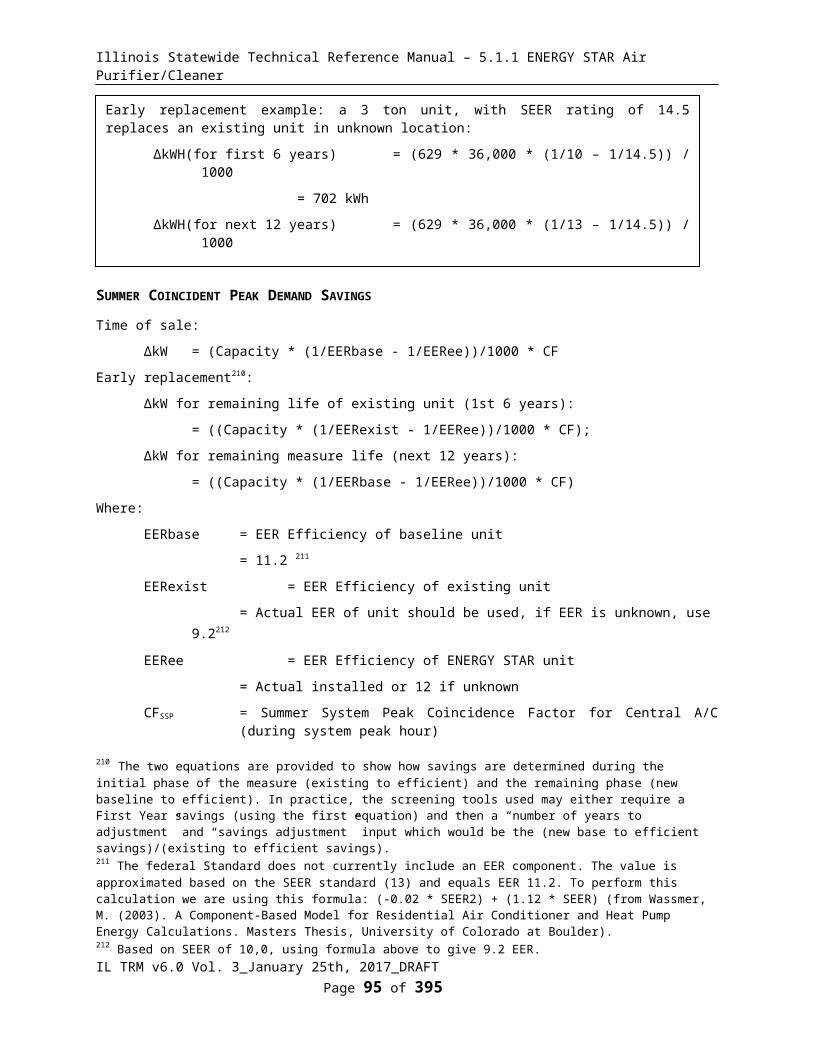
Illinois Statewide Technical Reference Manual – 5.1.1 ENERGY STAR Air Purifier/Cleaner
DEEMED O&M COST ADJUSTMENT CALCULATION
N/A
MEASURE CODE: RS-HVC-GHEB-V06-180101
REVIEW DEADLINE: 1/1/2021
IL TRM v6.0 Vol. 3_January 25th, 2017_DRAFT Page 97 of 296

Illinois Statewide Technical Reference Manual – 5.1.1 ENERGY STAR Air Purifier/Cleaner
5.3.7 Gas High Efficiency Furnace
DESCRIPTION
High efficiency furnace features may include improved heat exchangers and modulating multi-stage burners.
This measure characterizes:
a) Time of sale:
a. The installation of a new high efficiency, gas-fired condensing furnace in a residential location. This could relate to the replacement of an existing unit at the end of its useful life, or the installation of a new system in a new home.
b) Early Replacement:
Early Replacement determination will be based on meeting the following conditions:
• The existing unit is operational when replaced, or• The existing unit requires minor repairs (<$528)282. • All other conditions will be considered Time of Sale.
The Baseline AFUE of the existing unit replaced:
• If the AFUE of the existing unit is known and <=75%, the Baseline AFUE is the actual AFUE value of the unit replaced. If the AFUE is >75%, the Baseline AFUE = 80%.
• If the AFUE of the existing unit is unknown, use assumptions in variable list below (AFUE(exist)).
• If the operational status or repair cost of the existing unit is unknown, use time of sale assumptions.
A weighted average early replacement rate is provided for use when the actual baseline early replacement rate is unknown283.
Deemed Early Replacement Rates For Furnaces
Replacement Scenario for the Furnace Deemed Early Replacement Rate
Early Replacement Rate for Furnace-only participants 7%Early Replacement Rate for a furnace when the furnace is the Primary unit in a Combined System Replacement (CSR) project 14%
Early Replacement Rate for a furnace when the furnace is the Secondary unit in a CSR project 46%
Verified Quality Installation
This approach uses in-field measurement and interpretation of static pressures, identification and plotting of airflow, airflow measurement, temperature measurement and diagnostics, pressure measurements and duct design, and BTU measurement to ensure that newly installed equipment is operating according to manufacturers’
282 The Technical Advisory Committee agreed that if the cost of repair is less than 20% of the new baseline replacement cost it can be considered early replacement. Note the non-inflated cost is used as this would be a cost consideration in the program year.283 Based upon research from “Home Energy Efficiency Rebate Program GPY2 Evaluation Report” which outlines early replacement rates for both primary and secondary central air cooling (CAC) and residential funaces. The unit (furnace or CAC unit) that initially caused the customer to contact a trade ally is defined as the “primary unit”. The furnace or CAC unit that was also replaced but did not initially prompt the customer to contact a trade ally is defined as the “secondary unit”. This evaluation used different criteria for early replacement due to the availability of data after the fact; cost of any repairs < $550 and age of unit < 20 years. Report presented to Nicor Gas Company February 27, 2014, available at http://www.ilsag.info/evaluation-documents.html.
IL TRM v6.0 Vol. 3_January 25th, 2017_DRAFT Page 98 of 296
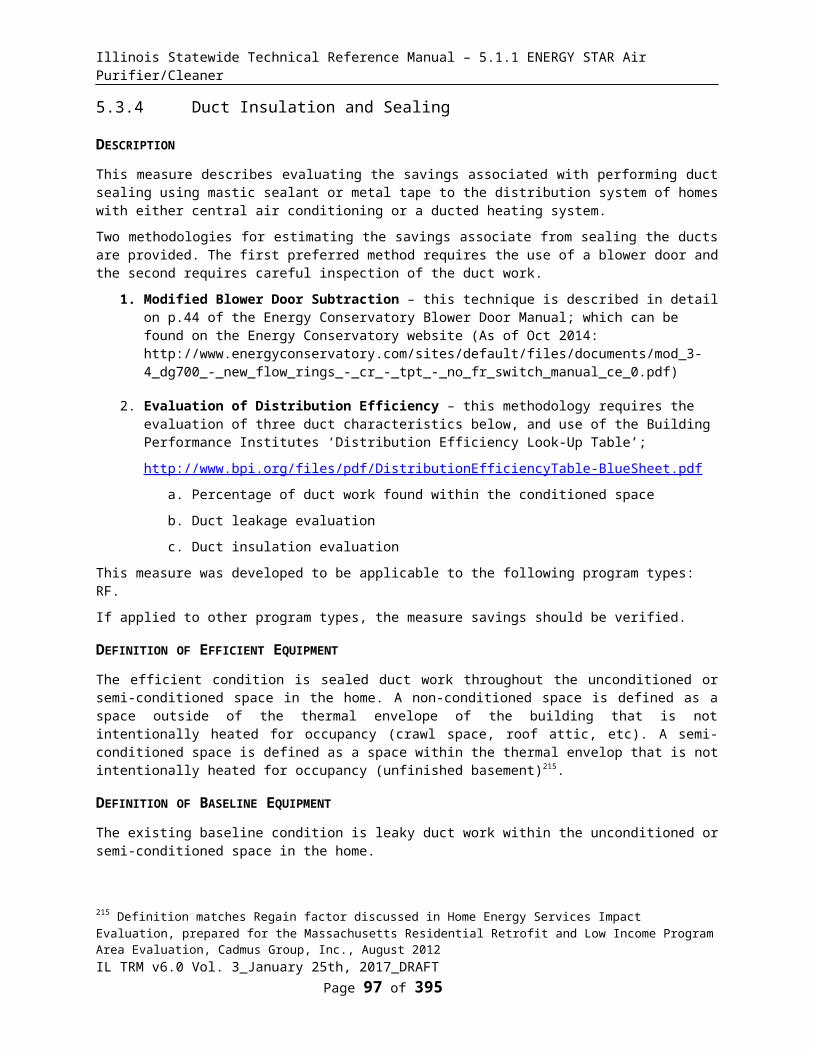
Illinois Statewide Technical Reference Manual – 5.1.1 ENERGY STAR Air Purifier/Cleaner
published potential performance. Installed equipment operating efficiency is largely dependent on the efficiency rating of the equipment, the skill of the installation contractor, the degree to which the equipment has aged or drifted from initial settings, and the system level constraints. When one or more of these key dependencies are operating sub-optimally, the overall efficiency of the equipment is degraded. A Verified Quality Install identifies sub-optimal performance and prescribes a solution during furnace installation.
This measure was developed to be applicable to the following program types: TOS, NC, EREP. If applied to other program types, the measure savings should be verified.
DEFINITION OF EFFICIENT EQUIPMENT
To qualify for this measure the installed equipment must be a residential sized (input energy less than 225,000 Btu/hr) natural gas fired furnace with an Annual Fuel Utilization Efficiency (AFUE) rating exceeding the program requirements.
DEFINITION OF BASELINE EQUIPMENT
Time of Sale: The current Federal Standard for gas furnaces is an AFUE rating of 80%. The baseline will be adjusted when the Federal Standard is updated.
Early replacement: The baseline for this measure is the efficiency of the existing equipment for the assumed remaining useful life of the unit and a new baseline unit for the remainder of the measure life. We estimate that the new baseline unit that could be purchased in the year the existing unit would have needed replacing is 90%.
DEEMED LIFETIME OF EFFICIENT EQUIPMENT
The expected measure life is assumed to be 20 years284.
For early replacement: Remaining life of existing equipment is assumed to be 6 years285.
DEEMED MEASURE COST
Time of sale: The incremental installed cost (retail equipment cost plus installation cost) for this measure depends on efficiency as listed below286:
AFUE Installed Cost Incremental Installed Cost80% $2011 n/a90% $2641 $63091% $2727 $71692% $2813 $80293% $3025 $101494% $3237 $122695% $3449 $143896% $3661 $1650
Early Replacement: The full installed cost is provided in the table above. The assumed deferred cost (after 6 years) of replacing existing equipment with a new 90% baseline unit is assumed to be $2903 287. This cost should be discounted to present value using the nominal discount rate.284 Table 8.3.3 The Technical support documents for federal residential appliance standards: http://www1.eere.energy.gov/buildings/appliance_standards/residential/pdfs/fb_fr_tsd/chapter_8.pdf285 Assumed to be one third of effective useful life286 Based on data from Table E.1.1 of Appendix E of the Appliance Standards Technical Support Documents including equipment cost and installation labor.(http://www1.eere.energy.gov/buildings/appliance_standards/residential/pdfs/fb_fr_tsd/appendix_e.pdf). Where efficiency ratings are not provided, the values are interpolated from those that are. Note that ECM furnace fan cost (refer to other measure in TRM) has been deducted from the 93%-96% AFUE values to avoid double counting.287 $2641 inflated using 1.91% rate.
IL TRM v6.0 Vol. 3_January 25th, 2017_DRAFT Page 99 of 296
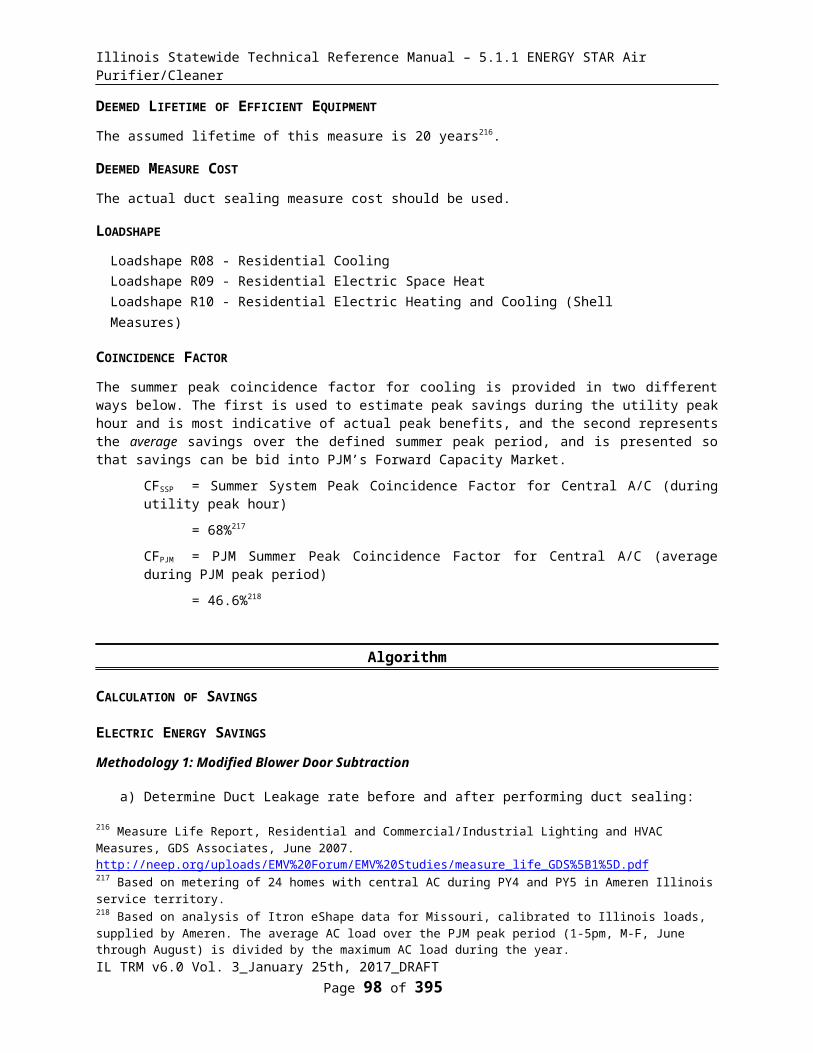
Illinois Statewide Technical Reference Manual – 5.1.1 ENERGY STAR Air Purifier/Cleaner
Verified Quality Installation: The additional design and installation work associated with verified quality installation has been estimated to take 1-2 hours (Tim Hanes, ESI). At $40/hr, VQI adds $60 to the installed cost.
LOADSHAPE
N/A
COINCIDENCE FACTOR
N/A
Algorithm
CALCULATION OF SAVINGS
ELECTRIC ENERGY SAVINGS
Electrical energy savings from the more fan-efficient (typically using brushless permanent magnet (BPM) blower motor) should also be claimed, please refer to “Furnace Blower Motor” characterization for details.
SUMMER COINCIDENT PEAK DEMAND SAVINGS
If the blower motor is also used for cooling, coincident peak demand savings should also be claimed, please refer to “Furnace Blower Motor” characterization for savings details.
NATURAL GAS SAVINGS
Time of Sale:
ΔTherms = Gas_Furnace_Heating_Load * HF * ((1/(AFUE(base)*(1-Derating(base)))) – (1/(AFUE(eff)*(1-Derating(eff)))))
Early replacement288:
ΔTherms for remaining life of existing unit (1st 6 years):
= Gas_Furnace_Heating_Load * HF * ((1/(AFUE(exist)*(1-Derating(exist)))) – (1/(AFUE(eff)*(1-Derating(eff)))))
ΔTherms for remaining measure life (next 14 years):
= Gas_Furnace_Heating_Load * HF * ((1/(AFUE(base)*(1-Derating(base)))) – (1/(AFUE(eff)*(1-Derating(eff)))))
Where:
Gas_Furnace_Heating_Load
= Estimate of annual household heating load 289 for gas furnace heated single-family homes. If location is unknown, assume the average below290.
288 The two equations are provided to show how savings are determined during the initial phase of the measure (existing to efficient) and the remaining phase (new baseline to efficient). In practice, the screening tools used may either require a First Year savings (using the first equation) and then a “number of years to adjustment” and “savings adjustment” input which would be the (new base to efficient savings)/(existing to efficient savings).289 Heating load is used to describe the household heating need, which is equal to (gas consumption * AFUE )290 Values are based on household heating consumption values and inferred average AFUE results from Table 2-1, Energy Efficiency / Demand Response Nicor Gas Plan Year 1 (6/1/2011-5/31/2012) Research Report: Furnace Metering Study (August 1,
IL TRM v6.0 Vol. 3_January 25th, 2017_DRAFT Page 100 of 296

Illinois Statewide Technical Reference Manual – 5.1.1 ENERGY STAR Air Purifier/Cleaner
= Actual if informed by site-specific load calculations, ACCA Manual J or equivalent291.
Climate Zone(City based upon)
Gas_Furnace_Heating_Load (therms)
1 (Rockford) 8732 (Chicago) 8343 (Springfield) 7144 (Belleville) 5515 (Marion) 561Average 793
HF = Household factor, to adjust heating consumption for non-single-family households.
Household Type HFSingle-Family 100%Multi-Family 65%292
Actual Custom293
AFUE(exist) = Existing Furnace Annual Fuel Utilization Efficiency Rating
= Use actual AFUE rating where it is possible to measure or reasonably estimate.
If unknown, assume 64.4 AFUE% 294.
AFUE(base) = Baseline Furnace Annual Fuel Utilization Efficiency Rating
= Dependent on program type as listed below295:
Program Year AFUE(base)Time of Sale 80%Early Replacement 296 90%
AFUE(eff) = Efficent Furnace Annual Fuel Utilization Efficiency Rating
= Actual. If unknown, assume 95%297
Derating(base) =Baseline furnace AFUE derating
2013) (prepared by Navigant Consulting, Inc.) and adjusting to a statewide average using relative HDD values to adjust for the evaluation results focus on northern region. Values for individual cities are then calculated by comparing average HDD to the individual city’s HDD.291 The Air Conditioning Contractors of America Manual J, Residential Load Calculation 8th Edition produces equipment sizing loads for Single Family, Multi-single, and Condominiums using input characteristics of the home. A best practice for equipment selection and installation of Heating and Air Conditioning, load calculations are commonly completed by contractors during the selection process and may be readily available for program data purposes.292 Multifamily household heating consumption relative to single-family households is affected by overall household square footage and exposure to the exterior. This 65% factor is applied to MF homes based on professional judgment that average household size, and heat loads of MF households are smaller than single-family homes 293 Program-specific household factors may be utilized on the basis of sufficiently validated program evaluations. 294 Average nameplate efficiencies of all Early Replacement qualifying equipment in Ameren PY3-PY4.295 Though the Federal Minimum AFUE is 78%, there were only 50 models listed in the AHRI database at that level. At AFUE 79% the total rises to 308. There are 3,548 active furnace models listed with AFUE ratings between 78 and 80.296 We estimate that the new baseline unit that could be purchased in the year the existing unit would have needed replacing is 90%.297 Minimum ENERGY STAR efficiency after 2.1.2012.
IL TRM v6.0 Vol. 3_January 25th, 2017_DRAFT Page 101 of 296
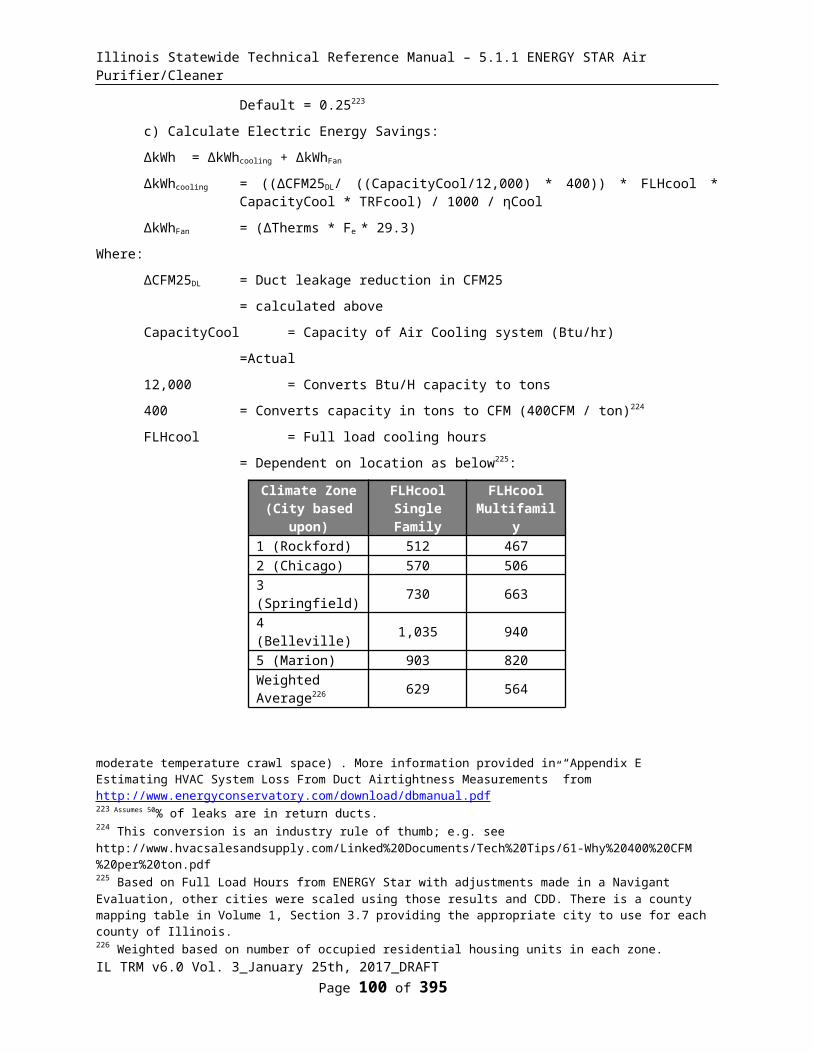
Illinois Statewide Technical Reference Manual – 5.1.1 ENERGY STAR Air Purifier/Cleaner
= 6.4%298
Derating(eff) =Efficent furnace AFUE derating
=0% if verified quality installation is performed
=6.4% if verified quality installation is not performed299
WATER IMPACT DESCRIPTIONS AND CALCULATION
N/A
DEEMED O&M COST ADJUSTMENT CALCULATION
N/A
MEASURE CODE: RS-HVC-GHEF-V07-180101
REVIEW DEADLINE: 1/1/2021
298 Brand, L., Yee, S., and Baker, J. “Improving Gas Furnace Performance: A Field and Laboratory Study at End of Life.” Building Technologies Office. National Renewable Energy Laboratory. 2015 http://apps1.eere.energy.gov/buildings/publications/pdfs/building_america/improving-gas-furnace-performance.pdf, accessed September 6th, 2016, DOE/GO--102015-4624299 Ibid
IL TRM v6.0 Vol. 3_January 25th, 2017_DRAFT Page 102 of 296
Time of Sale:
For example, a 95% AFUE furnace purchased and installed with verified quality installation for an existing home near Rockford:
ΔTherms = 873 * ((1/(0.8*(1-6.4%))) – (1/(0.95*(1-0%))))
=247 therms
For example, a 95% AFUE furnace purchased and installed without verified quality installation for an existing home near Rockford:
ΔTherms = 873 * ((1/(0.8*(1-6.4%))) – (1/(0.95*(1-6.4%))))
=184 therms
Early Replacement:
For example, an existing functioning furnace with unknown efficiency is replaced with an 95% furnace using quality installation in Rockford:
ΔTherms for remaining life of existing unit (1st 6 years):
= 873 * ((1/(0.644*(1-6.4%))) – (1/(0.95*(1-0%))))
= 529 therms
ΔTherms for remaining measure life (next 14 years):
= 873 * ((1/(0.9*(1-6.4%))) – (1/(0.95*(1-0%))))
=117 therms

Illinois Statewide Technical Reference Manual – 5.1.1 ENERGY STAR Air Purifier/Cleaner
5.3.8 Ground Source Heat Pump
DESCRIPTION
This measure characterizes the installation of a Ground Source Heat Pump under the following scenarios:
a) New Construction:
i. The installation of a new residential sized Ground Source Heat Pump system meeting ENERGY STAR efficiency standards presented below in a new home.
ii. Note the baseline in this case should be determined via EM&V and the algorithms are provided to allow savings to be calculated from any baseline condition.
b) Time of Sale:
i. The planned installation of a new residential sized Ground Source Heat Pump system meeting ENERGY STAR efficiency standards presented below to replace an existing system(s) that does not meet the criteria for early replacement described in section c below.
ii. Note the baseline in this case is an equivalent replacement system to that which exists currently in the home. The calculation of savings is dependent on whether an incentive for the installation has been provided by both a gas and electric utility, just an electric utility or just a gas utility.
iii. Additional DHW savings are calculated based upon the fuel and efficiency of the existing unit.
c) Early Replacement/Retrofit:
i. The early removal of functioning either electric or gas space heating and/or cooling systems from service, prior to the natural end of life, and replacement with a new high efficiency Ground Source Heat Pump system.
ii. Note the baseline in this case is the existing equipment being replaced. The calculation of savings is dependent on whether an incentive for the installation has been provided by both a gas and electric utility, just an electric utility or just a gas utility.
iii. Additional DHW savings are calculated based upon the fuel and efficiency of the existing unit.iv. Early Replacement determination will be based on meeting the following conditions:
• The existing unit is operational when replaced, or• The existing unit requires minor repairs, defined as costing less than300:
Existing System Maximum repair costAir Source Heat Pump $276 per tonCentral Air Conditioner $190 per tonBoiler $709Furnace $528Ground Source Heat Pump <$249 per ton
• All other conditions will be considered Time of Sale.
v. The Baseline efficiency of the existing unit replaced:• If the efficiency of the existing unit is less than the maximum shown below, the Baseline
efficiency is the actual efficiency value of the unit replaced. If the efficiency is greater than the maximum, the Baseline efficiency is shown in the “New Baseline” column below:
300 The Technical Advisory Committee agreed that if the cost of repair is less than 20% of the new baseline replacement cost it can be considered early replacement.
IL TRM v6.0 Vol. 3_January 25th, 2017_DRAFT Page 103 of 296

Illinois Statewide Technical Reference Manual – 5.1.1 ENERGY STAR Air Purifier/Cleaner
Existing System Maximum efficiency for Actual New Baseline
Air Source Heat Pump 10 SEER 14 SEERCentral Air Conditioner 10 SEER 13 SEERBoiler 75% AFUE 82% AFUEFurnace 75% AFUE 80% AFUEGround Source Heat Pump 10 SEER 13 SEER
• If the efficiency of the existing unit is unknown, use assumptions in variable list below (SEER, HSPF or AFUE exist).
• If the operational status or repair cost of the existing unit is unknown use time of sale assumptions.
This measure was developed to be applicable to the following program types: TOS, NC, EREP. If applied to other program types, the measure savings should be verified.
DEFINITION OF EFFICIENT EQUIPMENT
In order for this characterization to apply, the efficient equipment must be a Ground Source Heat Pump unit meeting the minimum ENERGY STAR efficiency level standards effective at the time of installation as detailed below:
ENERGY STAR Requirements (Effective January 1, 2012)
Product Type Cooling EER
Heating COP
Water-to-airClosed Loop 17.1 3.6Open Loop 21.1 4.1
Water-to-WaterClosed Loop 16.1 3.1Open Loop 20.1 3.5DGX 16 3.6
DEFINITION OF BASELINE EQUIPMENT
For these products, baseline equipment includes Air Conditioning, Space Heating and Water Heating.
New Construction:
To calculate savings with an electric baseline, the baseline equipment is assumed to be an Air Source Heat Pump meeting the Federal Standard efficiency level; 14 SEER, 8.2 HSPF and 11.8301 EER and a Federal Standard electric hot water heater.
To calculate savings with a furnace/central AC baseline, the baseline equipment is assumed to be an 80% AFUE Furnace and central AC meeting the Federal Standard efficiency level; 13 SEER, 11 EER. If a gas water heater, the Federal Standard baseline is calculated as follows302; for <=55 gallon tanks = 0.675 – (0.0015 * storage size in gallons) and for tanks >55 gallon = 0.8012 – (0.00078 * storage size in gallons). For a 40-gallon storage water heater this would be 0.615 EF.
301 The Federal Standard does not include an EER requirement, so it is approximated with this formula: (-0.02 * SEER2) + (1.12 * SEER) Wassmer, M. (2003). A Component-Based Model for Residential Air Conditioner and Heat Pump Energy Calculations. Masters Thesis, University of Colorado at Boulder.302 Minimum Federal Standard as of 4/1/2015;http://www.gpo.gov/fdsys/pkg/CFR-2012-title10-vol3/pdf/CFR-2012-title10-vol3-sec430-32.pdf
IL TRM v6.0 Vol. 3_January 25th, 2017_DRAFT Page 104 of 296
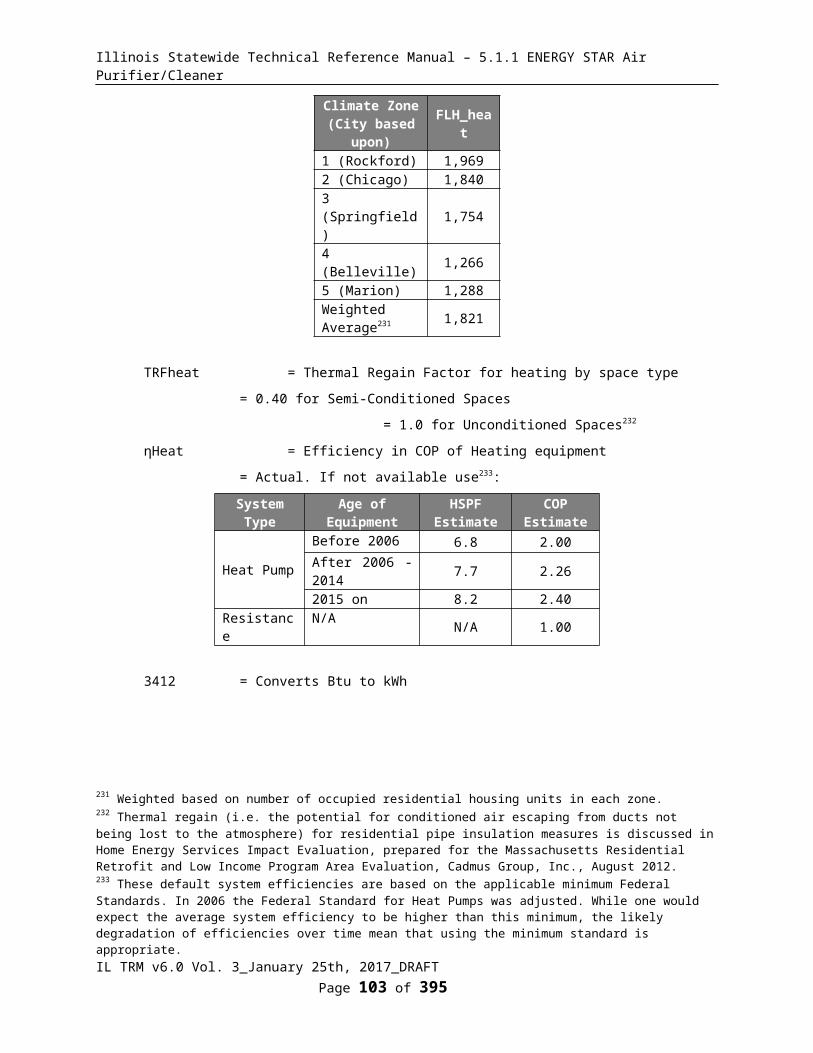
Illinois Statewide Technical Reference Manual – 5.1.1 ENERGY STAR Air Purifier/Cleaner
Time of Sale: The baseline for this measure is a new replacement unit of the same system type as the existing unit, meeting the baselines provided below.
Unit Type Efficiency StandardASHP 14 SEER, 11.8 EER, 8.2 HSPF Gas Furnace 80% AFUEGas Boiler 82% AFUECentral AC 13 SEER, 11 EER
Early replacement / Retrofit: The baseline for this measure is the efficiency of the existing heating, cooling and hot water equipment for the assumed remaining useful life of the existing unit and a new baseline heating and cooling system for the remainder of the measure life (as provided in table above except for Gas Furnace where new baseline assumption is 90% due to pending standard change).
DEEMED LIFETIME OF EFFICIENT EQUIPMENT
The expected measure life is assumed to be 25 years303.
For early replacement, the remaining life of existing equipment is assumed to be 8 years304.
DEEMED MEASURE COST
New Construction and Time of Sale: The actual installed cost of the Ground Source Heat Pump should be used (default of $3957 per ton305), minus the assumed installation cost of the baseline equipment ($1381 per ton for ASHP306 or $2011 for a new baseline 80% AFUE furnace or $3543 for a new 82% AFUE boiler307 and $952 per ton308
for new baseline Central AC replacement).
Early Replacement: The full installation cost of the Ground Source Heat Pump should be used (default provided above). The assumed deferred cost (after 8 years) of replacing existing equipment with a new baseline unit is assumed to be $1,518 per ton for a new baseline Air Source Heat Pump, or $2,903 for a new baseline 90% AFUE furnace or $4,045 for a new 82% AFUE boiler and 1,047 per ton for new baseline Central AC replacement 309. This future cost should be discounted to present value using the nominal societal discount rate.
LOADSHAPE
Loadshape R10 - Residential Electric Heating and Cooling (if replacing gas heat and central AC)310
Loadshape R09 - Residential Electric Space Heat (if replacing electric heat with no cooling)
Loadshape R10 - Residential Electric Heating and Cooling (if replacing ASHP)
303 System life of indoor components as per DOE estimate http://energy.gov/energysaver/articles/geothermal-heat-pumps. The ground loop has a much longer life, but the compressor and other mechanical components are the same as an ASHP. http://neep.org/uploads/EMV%20Forum/EMV%20Studies/measure_life_GDS%5B1%5D.pdf304 Assumed to be one third of effective useful life305 Based on data provided in ‘Results of HomE geothermal and air source heat pump rebate incentives documented by IL electric cooperatives’.306 Based on data provided on Home Advisor website, providing national average ASHP cost based on 2465 cost submittals. http://www.homeadvisor.com/cost/heating-and-cooling/install-a-heat-pump/307 Furnace and boiler costs are based on data provided in Appendix E of the Appliance Standards Technical Support Documents including equipment cost and installation labor (http://www1.eere.energy.gov/buildings/appliance_standards/residential/pdfs/fb_fr_tsd/appendix_e.pdf). Where efficiency ratings are not provided, the values are interpolated from those that are.308 Based on 3 ton initial cost estimate for a conventional unit from ENERGY STAR Central AC calculator (http://www.energystar.gov/ia/business/bulk_purchasing/bpsavings_calc/Calc_CAC.xls). 309 All baseline replacement costs are consistent with their respective measures and include inflation rate of 1.91%.310 The baseline for calculating electric savings is an Air Source Heat Pump.
IL TRM v6.0 Vol. 3_January 25th, 2017_DRAFT Page 105 of 296

Illinois Statewide Technical Reference Manual – 5.1.1 ENERGY STAR Air Purifier/Cleaner
Note for purpose of cost effectiveness screening a fuel switch scenario, the heating kWh increase and cooling kWh decrease should be calculated separately such that the appropriate loadshape (i.e. Loadshape R09 - Residential Electric Space Heat and Loadshape R08 – Residential Cooling respectively) can be applied.
COINCIDENCE FACTOR
The summer peak coincidence factor for cooling is provided in two different ways below. The first is used to estimate peak savings during the utility peak hour and is most indicative of actual peak benefits, and the second represents the average savings over the defined summer peak period, and is presented so that savings can be bid into PJM’s Forward Capacity Market.
CFSSP = Summer System Peak Coincidence Factor for Heat Pumps (during utility peak hour)
= 72%%311
CFPJM = PJM Summer Peak Coincidence Factor for Heat Pumps (average during PJM peak period)
= 46.6%312
Algorithm
CALCULATION OF SAVINGS
ELECTRIC ENERGY SAVINGS
New Construction and Time of Sale (non-fuel switch only):
ΔkWh = [Cooling savings] + [Heating savings] + [DHW savings]
= [(FLHcool * Capacity_cooling * (1/SEERbase– (1/EERPL)/1000] + [Elecheat * FLHheat * Capacity_heating * (1/HSPFbase – (1/COPPL * 3.412)))/1000] + [ElecDHW * %DHWDisplaced * (((1/EFELEC) * GPD * Household * 365.25 * γWater * (TOUT – TIN) * 1.0) / 3412)]
New Construction and Time of Sale (fuel switch only):
If measure is supported by gas utility only, ΔkWH = 0
If measure is supported by gas and electric utility or electric utility only, electric utility claim savings calculated below:
ΔkWh = [Cooling savings] + [Heating savings from base ASHP to GSHP] + [DHW savings]
= [(FLHcool * Capacity_cooling * (1/SEERbase– (1/EERPL)/1000] + [FLHheat * Capacity_heating * (1/HSPFASHP – (1/COPPL * 3.412)))/1000] + [ElecDHW * %DHWDisplaced * (((1/EFELEC) * GPD * Household * 365.25 * γWater * (TOUT – TIN) * 1.0) / 3412)]
Early replacement (non-fuel switch only)313:
311 Based on analysis of metering results from 24 heat pumps in Ameren Illinois service territory in PY5 coincident with AIC’s 2010 system peak; ‘Impact and Process Evaluation of Ameren Illinois Company’s Residential HVAC Program (PY5)’. http://www.icc.illinois.gov/downloads/public/edocket/368522.pdf312 Based on analysis of Itron eShape data for Missouri, calibrated to Illinois loads, supplied by Ameren. The average AC load over the PJM peak period (1-5pm, M-F, June through August) is divided by the maximum AC load during the year.313 The two equations are provided to show how savings are determined during the initial phase of the measure (existing to efficient) and the remaining phase (new baseline to efficient). In practice, the screening tools used may either require a First Year savings (using the first equation) and then a “number of years to adjustment” and “savings adjustment” input which would be the (new base to efficient savings)/(existing to efficient savings).
IL TRM v6.0 Vol. 3_January 25th, 2017_DRAFT Page 106 of 296
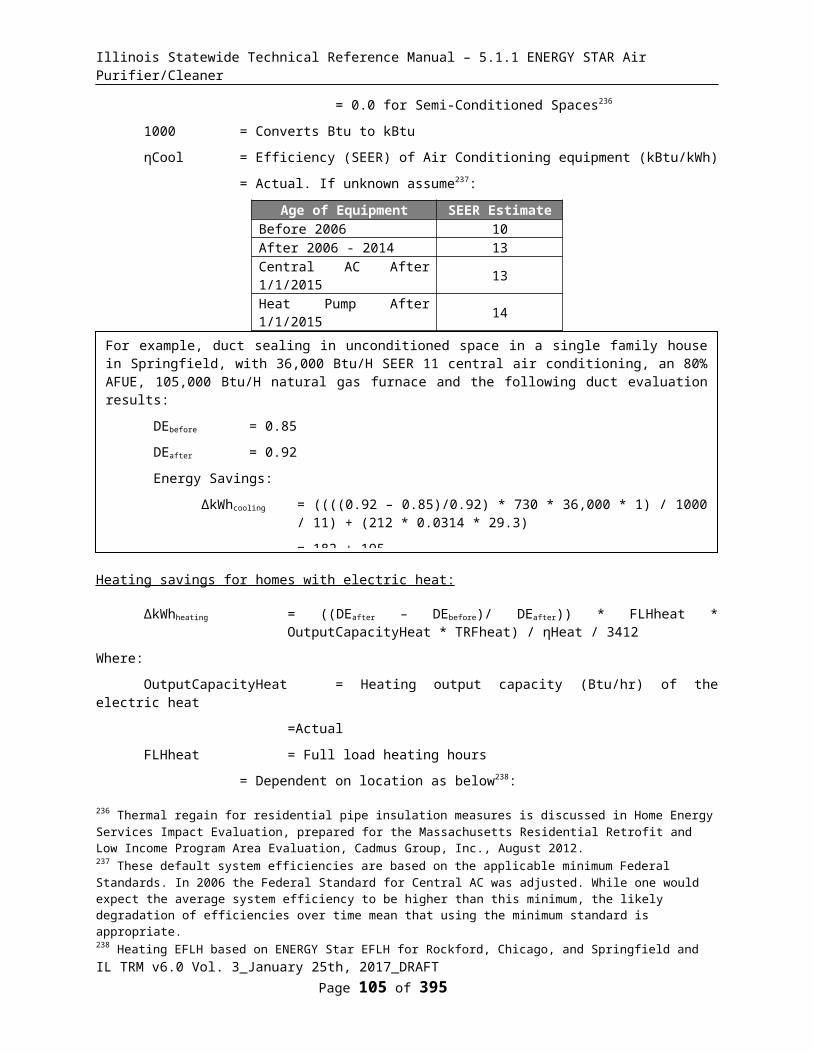
Illinois Statewide Technical Reference Manual – 5.1.1 ENERGY STAR Air Purifier/Cleaner
ΔkWH for remaining life of existing unit (1st 8 years):
= [Cooling savings] + [Heating savings] + [DHW savings]
= [(FLHcool * Capacity_cooling * (1/SEERexist – (1/EERPL)/1000] + [ElecHeat * (FLHheat * Capacity_heating * (1/HSPFexist) – (1/COPPL * 3.412)))/1000] + [ElecDHW * %DHWDisplaced * (((1/ EFELEC) * GPD * Household * 365.25 * γWater * (TOUT – TIN) * 1.0) / 3412)]
ΔkWH for remaining measure life (next 17 years):
= [(FLHcool * Capacity_cooling * (1/SEERbase – (1/EERPL)/1000] + [ElecHeat * (FLHheat * Capacity_heating * (1/HSPFbase) – (1/COPPL * 3.412)))/1000] + [ElecDHW * %DHWDisplaced * (((1/ EFELEC) * GPD * Household * 365.25 * γWater * (TOUT – TIN) * 1.0) / 3412)]
Early replacement - fuel switch only (see illustrative examples after Natural Gas section):
If measure is supported by gas utility only, ΔkWH = 0
If measure is supported by gas and electric utility or electric utility only, electric utility claim savings calculated below:
ΔkWh for remaining life of existing unit (1st 8 years):
= [Cooling savings] + [Heating savings from base ASHP to GSHP] + [DHW savings]
= [(FLHcool * Capacity_cooling * (1/SEERexist – (1/EERPL)/1000] + [(FLHheat * Capacity_heating * (1/HSPFASHP – (1/COPPL * 3.412)))/1000] + [ElecDHW * %DHWDisplaced * (((1/ EFELEC) * GPD * Household * 365.25 * γWater * (TOUT – TIN) * 1.0) / 3412)]
ΔkWh for remaining measure life (next 17 years):
= [Cooling savings] + [Heating savings from base ASHP to GSHP] + [DHW savings]
= [(FLHcool * Capacity_cooling * (1/SEERbase – (1/EERPL)/1000] + [(FLHheat * Capacity_heating * (1/HSPFASHP – (1/COPPL * 3.412)))/1000] + [ElecDHW * %DHWDisplaced * (((1/ EFELEC) * GPD * Household * 365.25 * γWater * (TOUT – TIN) * 1.0) / 3412)]
Where:
FLHcool = Full load cooling hours
Dependent on location as below314:
Climate Zone(City based upon)
FLHcoolSingle Family
FLHcoolMultifamily
1 (Rockford) 512 4672 (Chicago) 570 5063 (Springfield) 730 6634 (Belleville) 1,035 9405 (Marion) 903 820Weighted Average315 629 564
Capacity_cooling = Cooling Capacity of Ground Source Heat Pump (Btu/hr)
314 Based on Full Load Hours from ENERGY STAR with adjustments made in a Navigant Evaluation, other cities were scaled using those results and CDD. There is a county mapping table in Volume 1, Section 3.7 providing the appropriate city to use for each county of Illinois.315 Weighted based on number of occupied residential housing units in each zone.
IL TRM v6.0 Vol. 3_January 25th, 2017_DRAFT Page 107 of 296

Illinois Statewide Technical Reference Manual – 5.1.1 ENERGY STAR Air Purifier/Cleaner
= Actual (1 ton = 12,000Btu/hr)
SEERbase = SEER Efficiency of new replacement baseline unit
Existing Cooling System SEERbaseAir Source Heat Pump 14316
Central AC 13317
No central cooling 13318
SEERexist = SEER Efficiency of existing cooling unit
= Use actual SEER rating where it is possible to measure or reasonably estimate, if unknown assume default provided below:
Existing Cooling System SEER_existAir Source Heat Pump 9.12319
Central AC 8.60320
No central cooling 13 321
SEERASHP = SEER Efficiency of new baseline Air Source Heat Pump unit (for fuel switch)
= 14 322
EERPL = Part Load EER Efficiency of efficient GSHP unit323
= Actual installed
ElecHeat = 1 if existing building is electrically heated
= 0 if existing building is not electrically heated
FLHheat = Full load heating hours
Dependent on location as below324:
Climate Zone(City based upon) FLH_heat
1 (Rockford) 1,9692 (Chicago) 1,8403 (Springfield) 1,7544 (Belleville) 1,2665 (Marion) 1,288
316 Minimum Federal Standard as of 1/1/2015;http://www.gpo.gov/fdsys/pkg/CFR-2012-title10-vol3/pdf/CFR-2012-title10-vol3-sec430-32.pdf317 Minimum Federal Standard; Federal Register, Vol. 66, No. 14, Monday, January 22, 2001/Rules and Regulations, p. 7170-7200.318 Assumes that the decision to replace existing systems includes desire to add cooling.319 Average nameplate efficiencies of all Early Replacement qualifying equipment in Ameren PY3-PY4.320 Ibid.321 Assumes that the decision to replace existing systems includes desire to add cooling.322 Minimum Federal Standard as of 1/1/2015;http://www.gpo.gov/fdsys/pkg/CFR-2012-title10-vol3/pdf/CFR-2012-title10-vol3-sec430-32.pdf323 As per conversations with David Buss territory manager for Connor Co, the SEER and COP ratings of an ASHP equate most appropriately with the part load EER and COP of a GSHP.324 Heating EFLH based on ENERGY STAR EFLH for Rockford, Chicago, and Springfield and on NCDC/NOAA HDD for the other two cities. In all cases, the hours were adjusted based on average natural gas heating consumption in IL. There is a county mapping table in Volume 1, Section 3.7 providing the appropriate city to use for each county of Illinois.
IL TRM v6.0 Vol. 3_January 25th, 2017_DRAFT Page 108 of 296

Illinois Statewide Technical Reference Manual – 5.1.1 ENERGY STAR Air Purifier/Cleaner
Climate Zone(City based upon) FLH_heat
Weighted Average325 1,821
Capacity_heating = Heating Capacity of Ground Source Heat Pump (Btu/hr)
= Actual (1 ton = 12,000Btu/hr)
HSPFbase =Heating System Performance Factor of new replacement baseline heating system (kBtu/kWh)
Existing Heating System HSPF_baseAir Source Heat Pump 8.2Electric Resistance 3.41326
HSPF_exist =Heating System Performance Factor of existing heating system (kBtu/kWh)
= Use actual HSPF rating where it is possible to measure or reasonably estimate. If unknown assume default:
Existing Heating System HSPF_existAir Source Heat Pump 5.44Electric Resistance 3.41
HSPFASHP =Heating Season Performance Factor for new ASHP baseline unit (for fuel switch)
=8.2 327
COPPL = Part Load Coefficient of Performance of efficient unit328
= Actual Installed
3.412 = Constant to convert the COP of the unit to the Heating Season Performance Factor (HSPF).
ElecDHW = 1 if existing DHW is electrically heated
= 0 if existing DHW is not electrically heated
%DHWDisplaced = Percentage of total DHW load that the GSHP will provide
= Actual if known
= If unknown and if desuperheater installed assume 44%329
= 0% if no desuperheater installed
EFELEC = Energy Factor (efficiency) of electric water heater
= Actual. If unknown or for new construction assume federal standard330:
325 Weighted based on number of occupied residential housing units in each zone.326 Electric resistance has a COP of 1.0 which equals 1/0.293 = 3.41 HSPF.327 Minimum Federal Standard as of 1/1/2015;http://www.gpo.gov/fdsys/pkg/CFR-2012-title10-vol3/pdf/CFR-2012-title10-vol3-sec430-32.pdf328 As per conversations with David Buss territory manager for Connor Co, the SEER and COP ratings of an ASHP equate most appropriately with the part load EER and COP of a GSHP.329 Assumes that the desuperheater can provide two thirds of hot water needs for eight months of the year (2/3 * 2/3 = 44%). Based on input from Doug Dougherty, Geothermal Exchange Organization. 330 Minimum Federal Standard as of 4/1/2015;
IL TRM v6.0 Vol. 3_January 25th, 2017_DRAFT Page 109 of 296

Illinois Statewide Technical Reference Manual – 5.1.1 ENERGY STAR Air Purifier/Cleaner
For <=55 gallons: 0.96 – (0.0003 * rated volume in gallons)
For >55 gallons: 2.057 – (0.00113 * rated volume in gallons)
GPD = Gallons Per Day of hot water use per person
= 45.5 gallons hot water per day per household/2.59 people per household331
= 17.6
Household = Average number of people per household
Household Unit Type HouseholdSingle-Family - Deemed 2.56332
Custom Actual Occupancy or Number of Bedrooms333
365.25 = Days per year
γWater = Specific weight of water
= 8.33 pounds per gallon
TOUT = Tank temperature
= 125°F
TIN = Incoming water temperature from well or municiplal system
= 54°F334
1.0 = Heat Capacity of water (1 Btu/lb*°F)
3412 = Conversion from Btu to kWh
http://www.gpo.gov/fdsys/pkg/CFR-2012-title10-vol3/pdf/CFR-2012-title10-vol3-sec430-32.pdf331 Deoreo, B., and P. Mayer. Residential End Uses of Water Study Update. Forthcoming. ©2015 Water Research Foundation. Reprinted With Permission.332 ComEd Energy Efficiency/ Demand Response Plan: Plan Year 2 (6/1/2009-5/31/2010) Evaluation Report: All Electric Single Family Home Energy Performance Tune-Up Program citing 2006-2008 American Community Survey data from the US Census Bureau for Illinois cited on p. 17 of the PY2 Evaluation report. 2.75 * 93% evaluation adjustment333 Bedrooms are suitable proxies for household occupancy, and may be preferable to actual occupancy due to turnover rates in residency and non-adult population impacts.334 US DOE Building America Program. Building America Analysis Spreadsheet. For Chicago, IL http://www1.eere.energy.gov/buildings/building_america/analysis_spreadsheets.html
IL TRM v6.0 Vol. 3_January 25th, 2017_DRAFT Page 110 of 296

Illinois Statewide Technical Reference Manual – 5.1.1 ENERGY STAR Air Purifier/Cleaner
SUMMER COINCIDENT PEAK DEMAND SAVINGS
New Construction and Time of Sale:
ΔkW = (Capacity_cooling * (1/EERbase - 1/EERFL))/1000) * CF
Early replacement:
ΔkW for remaining life of existing unit (1st 8 years):
= (Capacity_cooling * (1/EERexist - 1/EERFL))/1000) * CF
ΔkW for remaining measure life (next 17 years):
= (Capacity_cooling * (1/EERbase - 1/EERFL))/1000) * CF
Where:
EERbase = EER Efficiency of new replacement unit
IL TRM v6.0 Vol. 3_January 25th, 2017_DRAFT Page 111 of 296
Illustrative Examples
New Construction using ASHP baseline:
For example, a 3 ton unit with Part Load EER rating of 19 and Part Load COP of 4.4 with desuperheater is installed with a 50 gallon electric water heater in single family house in Springfield:
ΔkWh = [(FLHcool * Capacity_cooling * (1/SEERbase – (1/EERPL)/1000] + [(FLHheat * Capacity_heating * (1/HSPFbase – (1/COPPL * 3.412)))/1000] + [ElecDHW * %DHWDisplaced * (((1/ EFELEC EXIST) * GPD * Household * 365.25 * γWater * (TOUT – TIN) * 1.0) / 3412)]
ΔkWh = [(730 * 36,000 * (1/14 – 1/19)) / 1000] + [(1754* 36,000 * (1/8.2 – 1/ (4.4*3.412))) / 1000] + [1 * 0.44 * (((1/0.945) * 17.6 * 2.56 *365.25 * 8.33 * (125-54) * 1)/3412)]
= 494 + 3494 + 1328
= 5316 kWh
Early Replacement – non-fuel switch (see example after Natural gas section for Fuel switch):
For example, a 3 ton unit with Part Load EER rating of 19 and Part Load COP of 4.4 with desuperheater is installed in single family house in Springfield with a 50 gallon electric water heater replacing an existing working Air Source Heat Pump with unknown efficiency ratings:
ΔkWH for remaining life of existing unit (1st 8 years):
= [(730 * 36,000 * (1/9.12 - 1/19)) / 1000] + [(1754 * 36,000 * (1/5.44 - 1/(4.4 * 3.412))) / 1000] + [0.44 * 1 * (((1/0.945) * 17.6 * 2.56 *365.25 * 8.33 * (125-54) * 1)/3412)]
= 1498 + 7401 + 1328
= 10,227 kWh
ΔkWH for remaining measure life (next 17 years):
= [(730 * 36,000 * (1/14 – 1/28)) / 1000] + [(1967 * 36,000 * (1/8.2 – 1/ (4.4 * 3.412)) / 1000] + [0.44 * 1 * (((1/0.945) * 17.6 * 2.56 *365.25 * 8.33 * (125-54) * 1)/3412)]
= 494 + 3494 + 1328
= 5316 kWh

Illinois Statewide Technical Reference Manual – 5.1.1 ENERGY STAR Air Purifier/Cleaner
Existing Cooling System EER_baseAir Source Heat Pump 11.8335
Central AC 11 336
No central cooling 11337
EERexist = Energy Efficiency Ratio of existing cooling unit (kBtu/hr / kW)
= Use actual EER rating where it is possible to measure or reasonably estimate. If EER unknown but SEER available convert using the equation:
EERexist = (-0.02 * SEERexist2) + (1.12 * SEERexist) 338
If SEER rating unavailable use:
Existing Cooling System EER_existAir Source Heat Pump 8.55339
Central AC 8.15340
No central cooling 11 341
EERFL = Full Load EER Efficiency of ENERGY STAR GSHP unit 342
CFSSP = Summer System Peak Coincidence Factor for Central A/C (during system peak hour)
= 72%%343
CFPJM = PJM Summer Peak Coincidence Factor for Central A/C (average during peak period)
= 46.6%344
335 The Federal Standard does not include an EER requirement, so it is approximated with the conversion formula from Wassmer, M. 2003 thesis refererenced below.336 Minimum Federal Standard; Federal Register, Vol. 66, No. 14, Monday, January 22, 2001/Rules and Regulations, p. 7170-7200.337 Assumes that the decision to replace existing systems includes desire to add cooling.338 From Wassmer, M. (2003). A Component-Based Model for Residential Air Conditioner and Heat Pump Energy Calculations. Masters Thesis, University of Colorado at Boulder.339 Average nameplate efficiencies of all Early Replacement qualifying equipment in Ameren PY3-PY4.340 Ibid.341 Assumes that the decision to replace existing systems includes desire to add cooling.342 As per conversations with David Buss territory manager for Connor Co, the EER rating of an ASHP equate most appropriately with the full load EER of a GSHP.343 Based on analysis of metering results from 24 heat pumps in Ameren Illinois service territory in PY5 coincident with AIC’s 2010 system peak; ‘Impact and Process Evaluation of Ameren Illinois Company’s Residential HVAC Program (PY5)’. http://www.icc.illinois.gov/downloads/public/edocket/368522.pdf344 Based on analysis of Itron eShape data for Missouri, calibrated to Illinois loads, supplied by Ameren. The average AC load over the PJM peak period (1-5pm, M-F, June through August) is divided by the maximum AC load during the year.
IL TRM v6.0 Vol. 3_January 25th, 2017_DRAFT Page 112 of 296
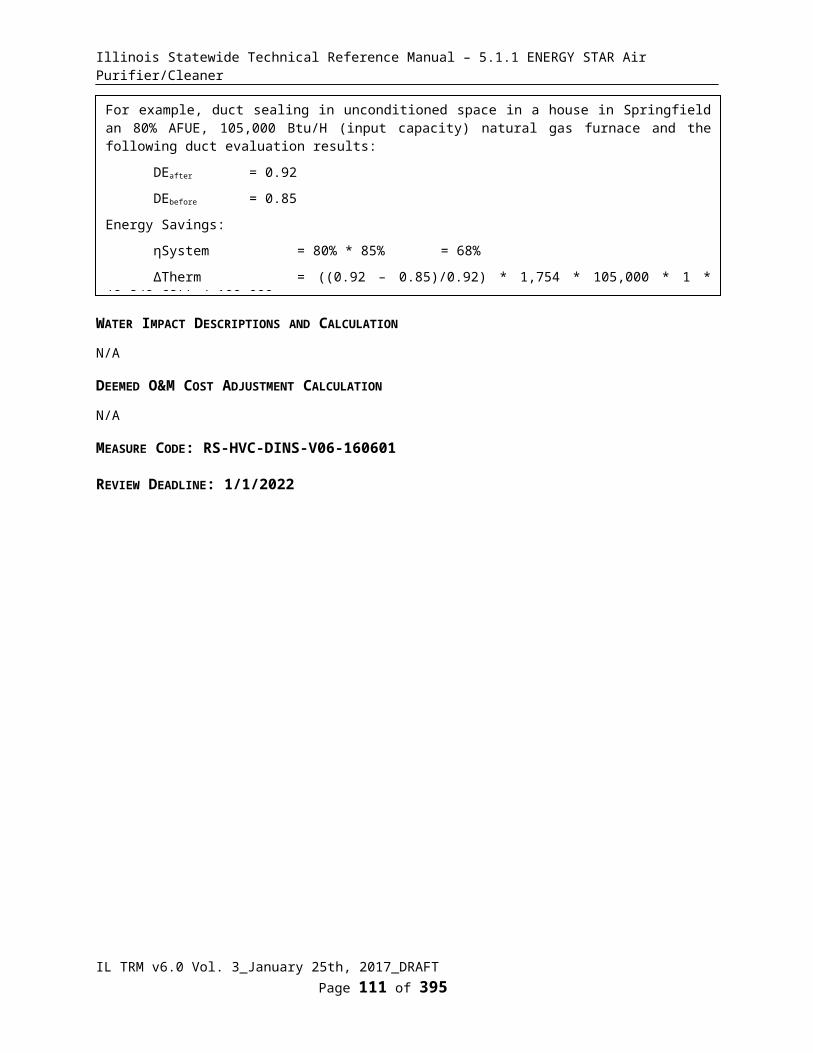
Illinois Statewide Technical Reference Manual – 5.1.1 ENERGY STAR Air Purifier/Cleaner
NATURAL GAS SAVINGS
New Construction and Time of Sale with baseline gas heat and/or hot water:
If measure is supported by gas utility only, gas utility claim savings calculated below:
ΔTherms = [Heating Savings] + [DHW Savings]
= [Replaced gas consumption – therm equivalent of GSHP source kWh] + [DHW Savings]
= [(1 – ElecHeat) * ((Gas_Heating_Load/AFUEbase) – (kWhtoTherm * FLHheat * Capacity_heating * 1/(COPPL * 3.412))/1000)] + [(1 – ElecDHW) * %DHWDisplaced * (1/ EFGAS EXIST * GPD * Household * 365.25 * γWater * (TOUT – TIN) * 1.0) / 100,000)]
If measure is supported by electric utility only, ΔTherms = 0
If measure is supported by gas and electric utility, gas utility claim savings calculated below, (electric savings is provided in Electric Energy Savings section):
ΔTherms = [Heating Savings] + [DHW Savings]
= [Replaced gas consumption – therm equivalent of base ASHP source kWh] + [DHW Savings]
= [(1 – ElecHeat) * ((Gas_Heating_Load/AFUEbase) – (kWhtoTherm * FLHheat *
IL TRM v6.0 Vol. 3_January 25th, 2017_DRAFT Page 113 of 296
New Construction or Time of Sale:
For example, a 3 ton unit with Full Load EER rating of 19:
ΔkWSSP = ((36,000 * (1/11.8 – 1/19))/1000) * 0.72
= 0.83 kW
ΔkWPJM = ((36,000 * (1/11 – 1/19))/1000) * 0.466
= 0.54 kW
Early Replacement:
For example, a 3 ton Full Load 19 EER replaces an existing working Air Source Heat Pump with unknown efficiency ratings in Marion:
ΔkWSSP for remaining life of existing unit (1st 8 years):
= ((36,000 * (1/8.55 – 1/19))/1000) * 0.72
= 1.67 kW
ΔkWSSP for remaining measure life (next 17 years):
= ((36,000 * (1/11.8 – 1/19))/1000) * 0.72
= 0.83 kW
ΔkWPJM for remaining life of existing unit (1st 8 years):
= ((36,000 * (1/8.55 – 1/19))/1000) * 0.466
= 1.08 kW
ΔkWPJM for remaining measure life (next 17 years):
= ((36,000 * (1/11.8 – 1/19))/1000) * 0.466
= 0.54 kW
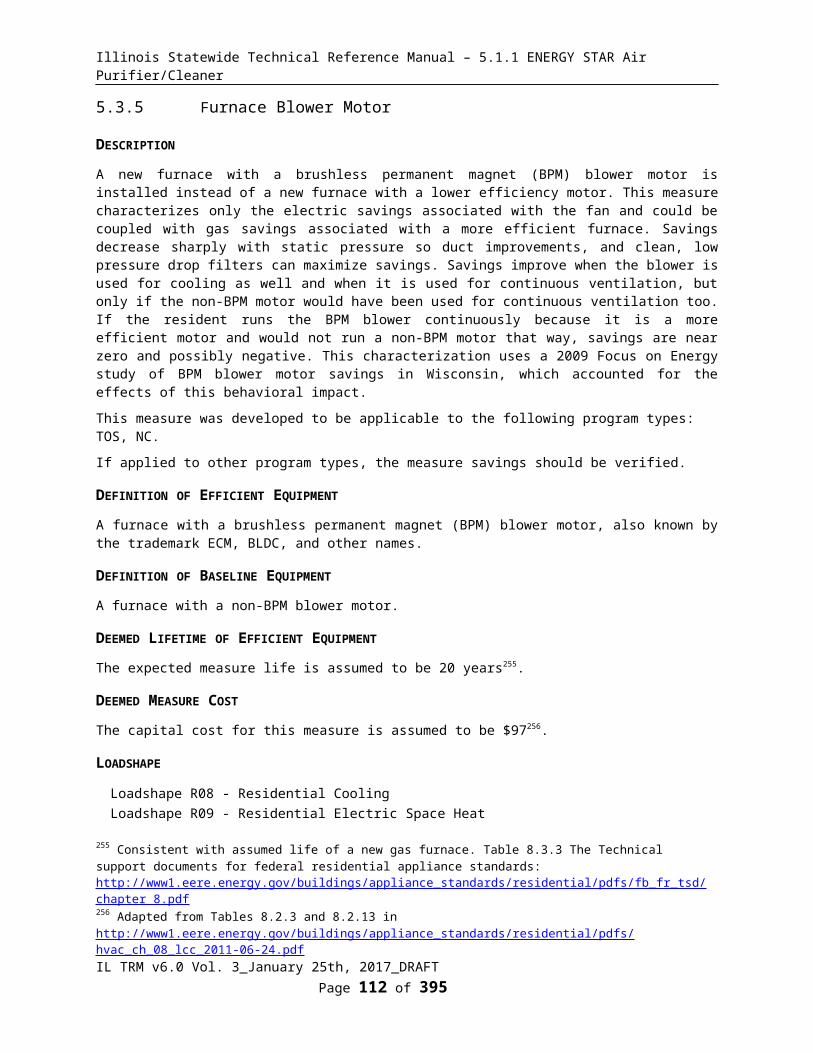
Illinois Statewide Technical Reference Manual – 5.1.1 ENERGY STAR Air Purifier/Cleaner
Capacity_heating * 1/HSPFASHP)/1000)] + [(1 – ElecDHW) * %DHWDisplaced * (1/ EFGAS
EXIST * GPD * Household * 365.25 * γWater * (TOUT – TIN) * 1.0) / 100,000)]
Early replacement for homes with existing gas heat and/or hot water:
If measure is supported by gas utility only, gas utility claim savings calculated below:
ΔTherms for remaining life of existing unit (1st 8 years):
= [Heating Savings] + [DHW Savings]
= [Replaced gas consumption – therm equivalent of GSHP source kWh] + [DHW Savings]
= [(1 – ElecHeat) * ((Gas_Heating_Load/AFUEexist) – (kWhtoTherm * FLHheat * Capacity_heating * 1/(COPPL * 3.412))/1000)] + [(1 – ElecDHW) * %DHWDisplaced * (1/ EFGAS EXIST * GPD * Household * 365.25 * γWater * (TOUT – TIN) * 1.0) / 100,000)]
ΔTherms for remaining measure life (next 17 years):
= [(1 – ElecHeat) * ((Gas_Heating_Load/AFUEbaseER) – (kWhtoTherm * FLHheat * Capacity_heating * 1/(COPPL * 3.412))/1000)] + [(1 – ElecDHW) * %DHWDisplaced * (1/ EFGAS EXIST * GPD * Household * 365.25 * γWater * (TOUT – TIN) * 1.0) / 100,000)]
If measure is supported by electric utility only, ΔTherms = 0
If measure is supported by gas and electric utility, gas utility claim savings calculated below:
ΔTherms for remaining life of existing unit (1st 8 years):
ΔTherms = [Heating Savings] + [DHW Savings]
= [Replaced gas consumption – therm equivalent of base ASHP source kWh] + [DHW Savings]
= [(1 – ElecHeat) * ((Gas_Heating_Load/AFUEexist) – (kWhtoTherm * FLHheat * Capacity_heating * 1/HSPFASHP)/1000)] + [(1 – ElecDHW) * %DHWDisplaced * (1/ EFGAS EXIST
* GPD * Household * 365.25 * γWater * (TOUT – TIN) * 1.0) / 100,000)]
ΔTherms for remaining measure life (next 17 years):
= [(1 – ElecHeat) * ((Gas_Heating_Load/AFUEbaseER) – (kWhtoTherm * FLHheat * Capacity_heating * 1/HSPFASHP)/1000)] + [(1 – ElecDHW) * %DHWDisplaced * (1/ EFGAS EXIST
* GPD * Household * 365.25 * γWater * (TOUT – TIN) * 1.0) / 100,000)]
Where:
ElecHeat = 1 if existing building is electrically heated
= 0 if existing building is not electrically heated
Gas_Heating_Load
= Estimate of annual household heating load 345 for gas furnace heated single-family homes. If location is unknown, assume the average below.
= Actual if informed by site-specific load calculations, ACCA Manual J or equivalent346.
345 Heating load is used to describe the household heating need, which is equal to (gas consumption * AFUE )346 The Air Conditioning Contractors of America Manual J, Residential Load Calculation 8th Edition produces equipment sizing loads for Single Family, Multi-single, and Condominiums using input characteristics of the home. A best practice for equipment selection and installation of Heating and Air Conditioning, load calculations are commonly completed by contractors during the selection process and may be readily available for program data purposes.
IL TRM v6.0 Vol. 3_January 25th, 2017_DRAFT Page 114 of 296
Illinois Statewide Technical Reference Manual – 5.1.1 ENERGY STAR Air Purifier/Cleaner
Climate Zone(City based upon)
Gas_Heating_Load if Furnace (therms) 347
Gas_Heating_Load if Boiler (therms) 348
1 (Rockford) 873 12752 (Chicago) 834 12183 (Springfield) 714 10434 (Belleville) 551 8055 (Marion) 561 819Average 793 1158
AFUEbase = Baseline Annual Fuel Utilization Efficiency Rating
= 80% if furnace and 82% if boiler.
AFUEexist = Existing Annual Fuel Utilization Efficiency Rating
= Use actual AFUE rating where it is possible to measure or reasonably estimate.
If unknown, assume 64.4% if furnace and 61.6% 349 if boiler.
AFUEbaseER = Baseline Annual Fuel Utilization Efficiency Rating for early replacement measure
= 90%350 if furnace and 82% if boiler.
kWhtoTherm = Converts source kWh to Therms
= Hgrid / 100000
Hgrid = Heat rate of the grid in btu/kWh based on the average fossil heat rate for the EPA eGRID subregion and includes a factor that takes into account T&D losses.
For systems operating less than 6,500 hrs per year:
Use the Non-baseload heat rate provided by EPA eGRID for RFC West region for ComEd territory (including independent providers connected to RFC West), and SERC Midwest region for Ameren territory (including independent providers connected to SERC Midwest)351. Also include any line losses.
For systems operating more than 6,500 hrs per year:
347 Values are based on household heating consumption values and inferred average AFUE results from Table 2-1, Energy Efficiency / Demand Response Nicor Gas Plan Year 1 (6/1/2011-5/31/2012) Research Report: Furnace Metering Study (August 1, 2013) (prepared by Navigant Consulting, Inc.) and adjusting to a statewide average using relative HDD values to adjust for the evaluation results focus on northern region. Values for individual cities are then calculated by comparing average HDD to the individual city’s HDD.348 Boiler consumption values are informed by an evaluation which did not identify any fraction of heating load due to domestic hot water (DHW) provided by the boiler. Thus these values are an average of both homes with boilers only providing heat, and homes with boilers that also provide DHW. Values are based on household heating consumption values and inferred average AFUE results from Table 3-4, Program Sample Analysis, Nicor R29 Res Rebate Evaluation Report 092611_REV FINAL to Nicor). Adjusting to a statewide average using relative HDD values to adjust for the evaluation results focus on northern region. Values for individual cities are then calculated by comparing average HDD to the individual city’s HDD.349 Average nameplate efficiencies of all Early Replacement qualifying equipment in Ameren PY3-PY4.350 Assumes that Federal Standard will have been increased to 90% by the time the existing unit would have to have been replaced.351 Refer to EPA eGRID data http://www.epa.gov/chp/documents/fuel_and_co2_savings.pdf, page 24 and http://www.epa.gov/cleanenergy/documents/egridzips/eGRID_9th_edition_V1-0_year_2010_Summary_Tables.pdf, page 9. Current values are:
- Non-Baseload RFC West: 9,811 Btu/kWh * (1 + Line Losses)- Non-Baseload SERC Midwest: 10,511 Btu/kWh * (1 + Line Losses)- All Fossil Average RFC West: 10,038 Btu/kWh * (1 + Line Losses)- All Fossil Average SERC Midwest: 10,364 Btu/kWh * (1 + Line Losses)
IL TRM v6.0 Vol. 3_January 25th, 2017_DRAFT Page 115 of 296
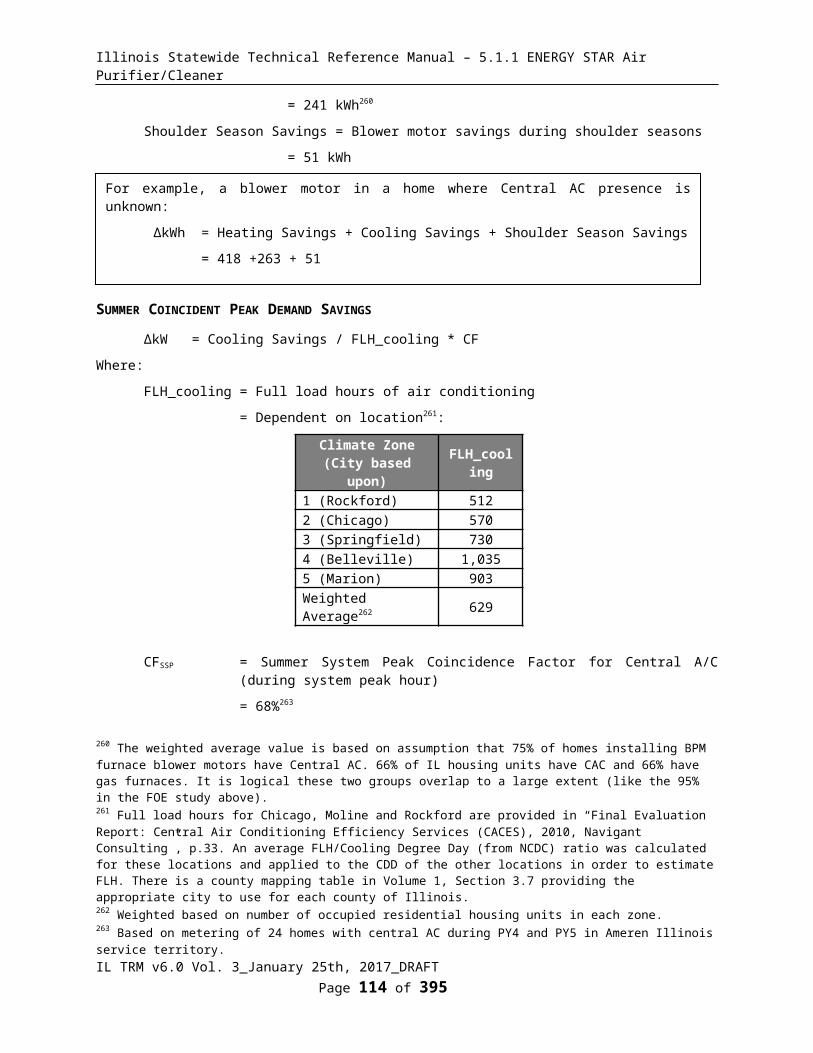
Illinois Statewide Technical Reference Manual – 5.1.1 ENERGY STAR Air Purifier/Cleaner
Use the All Fossil Average heat rate provided by EPA eGRID for RFC West region for ComEd territory, and SERC Midwest region for Ameren territory. Also include any line losses.
3.412 = Converts COP to HSPF
EFGAS EXIST = Energy Factor (efficiency) of existing gas water heater
= Actual. If unknown assume federal standard352:
For <=55 gallons: 0.675 – (0.0015 * tank_size)
For > 55 gallons 0.8012 – (0.00078 * tank size)
= If tank size unknown assume 40 gallons and EF_Baseline of 0.615
All other variables provided above
352 Minimum Federal Standard as of 4/1/2015;http://www.gpo.gov/fdsys/pkg/CFR-2012-title10-vol3/pdf/CFR-2012-title10-vol3-sec430-32.pdf
IL TRM v6.0 Vol. 3_January 25th, 2017_DRAFT Page 116 of 296

Illinois Statewide Technical Reference Manual – 5.1.1 ENERGY STAR Air Purifier/Cleaner
IL TRM v6.0 Vol. 3_January 25th, 2017_DRAFT Page 117 of 296
Illustrative Examples [for illustrative purposes a Heat Rate of 10,000 Btu/kWh is used]
New construction using gas furnace and central AC baseline, supported by Gas utility only:
For example, a 3 ton unit with Part Load EER rating of 19 and Part Load COP of 4.4 in single family house in Springfield with a 40 gallon gas water heater is installed in place of a natural gas furnace and 3 ton Central AC unit:
ΔkWH = 0
ΔTherms = [Heating Savings] + [DHW Savings]
= [Replaced gas consumption – therm equivalent of GSHP source kWh] + [DHW Savings]
= [(1 – ElecHeat) * ((Gas_Heating_Load/AFUEbase) – (kWhtoTherm * FLHheat * Capacity_heating * 1/(COPPL * 3.412)/1000)] + [(1 – ElecDHW) * %DHWDisplaced * (1/ EFGAS
EXIST * GPD * Household * 365.25 * γWater * (TOUT – TIN) * 1.0) / 100,000)]
= [(1-0) * ((714/0.80) – (10000/100000 * 1754 * 36,000 * 1/(4.4 * 3.412))/1000)] + [(1 – 0) * (0.44 * (1/ 0.615 * 17.6 * 2.56 *365.25 * 8.33 * (125-54) * 1) / 100,000)]
= 472 + 70
= 542 therms
Early Replacement fuel switch, supported by gas and electric utility:
For example, a 3 ton unit with Part Load EER rating of 19 and Part Load COP of 4.4 in single family house in Springfield with a 40 gallon gas water heater replaces an existing working natural gas furnace and 3 ton Central AC unit with unknown efficiency ratings:
ΔkWh for remaining life of existing unit (1st 8 years):
= [Cooling savings] + [Heating savings from base ASHP to GSHP] + [DHW savings]
= [(FLHcool * Capacity_cooling * (1/SEERexist – (1/EERPL)/1000] + [(FLHheat * Capacity_heating * (1/HSPFASHP – (1/COPPL * 3.412)))/1000] + [ElecDHW * %DHWDisplaced * (((1/ EFELEC) * GPD * Household * 365.25 * γWater * (TOUT – TIN) * 1.0) / 3412)]
= [(730* 36,000 * (1/8.6 - 1/19)) / 1000] + [(1754 * 36,000 * (1/8.2 - 1/(4.4 * 3.412))) / 1000] + [0 * 0.44 * (((1/0.904) * 17.6 * 2.56 *365.25 * 8.33 * (125-54) * 1)/3412)]
= 1673 + 3494 + 0
= 5167 kWh
Continued on next page.

Illinois Statewide Technical Reference Manual – 5.1.1 ENERGY STAR Air Purifier/Cleaner
WATER IMPACT DESCRIPTIONS AND CALCULATION
N/A
DEEMED O&M COST ADJUSTMENT CALCULATION
N/A
COST EFFECTIVENESS SCREENING AND LOAD REDUCTION FORECASTING WHEN FUEL SWITCHING
This measure can involve fuel switching from gas to electric.
For the purposes of forecasting load reductions due to fuel switch GSHP projects per Section 16-111.5B, changes in
IL TRM v6.0 Vol. 3_January 25th, 2017_DRAFT Page 118 of 296
Illustrative Example continued
ΔkWh for remaining measure life (next 17 years):
= [Cooling savings] + [Heating savings] + [DHW savings]
= [(FLHcool * Capacity_cooling * (1/SEERbase – (1/EERPL)/1000] + [(FLHheat * Capacity_heating * (1/HSPFASHP – (1/COPPL * 3.412)))/1000] + [ElecDHW * %DHWDisplaced * (((1/ EFELEC) * GPD * Household * 365.25 * γWater * (TOUT – TIN) * 1.0) /3412)]
= [(730 * 36,000 * (1/13 – 1/19)) / 1000] + [1754 * 36,000 * (1/8.2 – 1/ (4.4 *3.412)) / 1000] + [0 * 0.44 * (((1/0.904) * 17.6 * 2.56 *365.25 * 8.33 * (125-54) *1)/3412)]
= 638 + 3494 + 0
= 4132 kWh
ΔTherms for remaining life of existing unit (1st 8 years):
= [Heating Savings] + [DHW Savings]
= [Replaced gas consumption – therm equivalent of base ASHP source kWh] + [DHW Savings]
= [(1 – ElecHeat) * ((Gas_Heating_Load/AFUEexist) – (kWhtoTherm * FLHheat * Capacity_heating * 1/HSPFASHP)/1000)] + [(1 – ElecDHW) * %DHWDisplaced * (1/ EFGAS EXIST
* GPD * Household * 365.25 * γWater * (TOUT – TIN) * 1.0) / 100,000)]
= [(1-0) * ((714/0.644) – (10000/100000 * 1754 * 36,000 * 1/8.2)/1000)] + [(1 – 0) * (0.44 * (1/ 0.615 * 17.6 * 2.56 *365.25 * 8.33 * (125-54) * 1) / 100,000)]
= 339 + 70
= 408 therms
ΔTherms for remaining measure life (next 17 years):
= [(1 – ElecHeat) * ((Gas_Heating_Load/AFUEbaseER) – (kWhtoTherm * FLHheat * Capacity_heating * 1/HSPFASHP)/1000)] + [(1 – ElecDHW) * %DHWDisplaced * (1/ EFGAS EXIST
* GPD * Household * 365.25 * γWater * (TOUT – TIN) * 1.0) / 100,000)]
= [(1-0) * ((714/0.9) – (10000/100000 * 1754 * 36,000 * 1/8.2)/1000)] + [(1 – 0) * (0.44 * (1/ 0.615 * 17.6 * 2.56 *365.25 * 8.33 * (125-54) * 1) / 100,000)]
= 23 + 70
= 93 therms
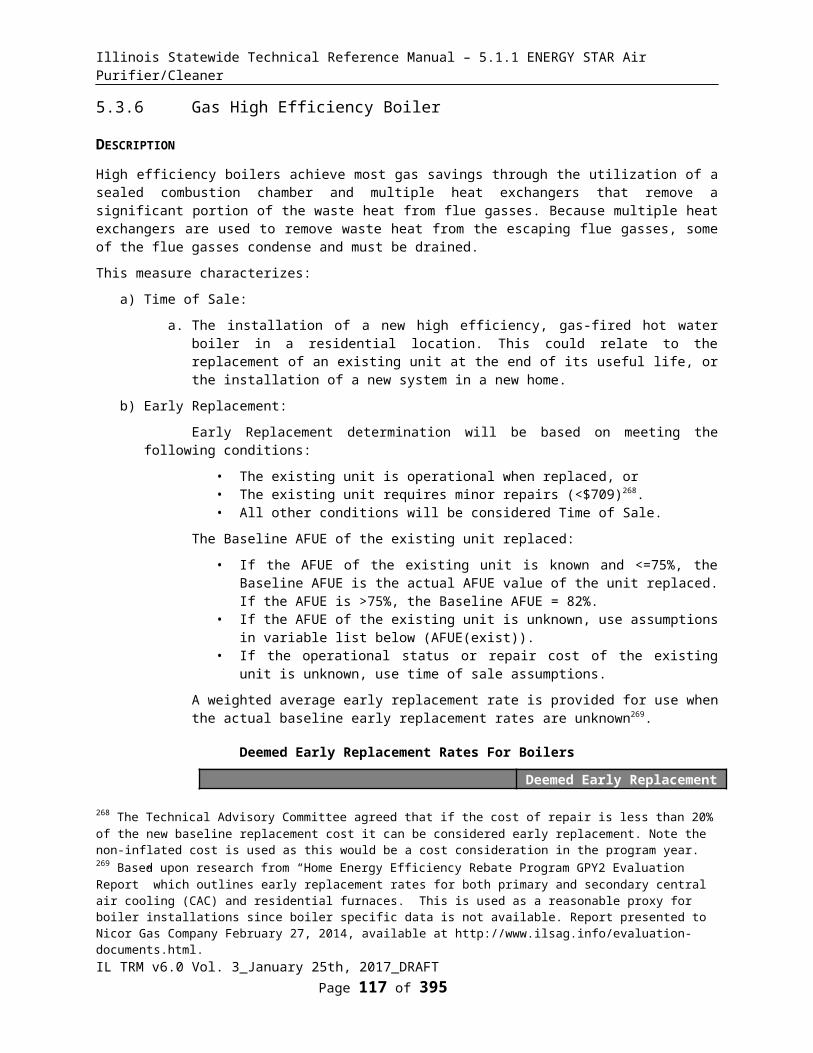
Illinois Statewide Technical Reference Manual – 5.1.1 ENERGY STAR Air Purifier/Cleaner
site energy use at the customer’s meter (using ΔkWh algorithm below) adjusted for utility line losses (at-the-busbar savings), customer switching estimates, NTG, and any other adjustment factors deemed appropriate, should be used.
The inputs to cost effectiveness screening should reflect the actual impacts on the electric and fuel consumption at the customer meter and, for fuel switching measures, this will not match the output of the calculation/allocation methodology presented in the “Electric Energy Savings” and “Natural Gas Savings” sections above. Therefore in addition to the calculation of savings claimed, the following values should be used to assess the cost effectiveness of the measure.
ΔTherms = [Heating Consumption Replaced353] + [DHW Savings if gas]
= [(1 – ElecHeat) * ((Gas_Heating_Load/AFUEbase)] + [(1 – ElecDHW) * %DHWDisplaced * (1/ EFGAS EXIST * GPD * Household * 365.25 * γWater * (TOUT – TIN) * 1.0) / 100,000)]
ΔkWh = - [GSHP heating consumption] + [Cooling savings354] + [DHW savings if electric]
= - [(FLHheat * Capacity_heating * (1/COPPL * 3.412))/1000] + [(FLHcool * Capacity_cooling * (1/SEERbase - 1/EERPL))/1000] + [ElecDHW * %DHWDisplaced * ((1/EFELEC * GPD * Household * 365.25 * γWater * (TOUT – TIN) * 1.0) / 3412)]
353 Note AFUEbase in the algorithm should be replaced with AFUEexist for early replacement measures.354 Note SEERbase in the algorithm should be replaced with SEERexist for early replacement measures.
IL TRM v6.0 Vol. 3_January 25th, 2017_DRAFT Page 119 of 296
Illustrative Example of Cost Effectiveness Inputs for Fuel Switching
For example, a 3 ton unit with Part Load EER rating of 19 and Part Load COP of 4.4 in single family house in Springfield with a 40 gallon gas water heater replaces an existing working natural gas furnace and 3 ton Central AC unit with unknown efficiency ratings. [Note the calculation provides the annual savings for the first 8 years of the measure life, an additional calculation (not shown) would be required to calculated the annual savings for the remaining life (years 9-25)]:
ΔTherms = [(1 – ElecHeat) * ((Gas_Heating_Load/AFUEexist)] + [(1 – ElecDHW) * %DHWDisplaced * (1/ EFGAS EXIST * GPD * Household * 365.25 * γWater * (TOUT – TIN) * 1.0) / 100,000)]
= [(1-0) * (714/0.644)] + [((1 – 0) * 0.44 * (1/ 0.615 * 17.6 * 2.56 *365.25 * 8.33 * (125-54) * 1) / 100,000)]
= 1109 + 70
= 1179 therms
ΔkWh = - [(FLHheat * Capacity_heating * (1/COPPL * 3.412))/1000] + [(FLHcool * Capacity_cooling * (1/SEERexist - 1/EERPL))/1000] + [ElecDHW * %DHWDisplaced * (((1/EFELEC) * GPD * Household * 365.25 * γWater * (TOUT – TIN) * 1.0) / 3412)]
= - [(1754 * 36,000 * (1/(4.4 * 3.412)))/ 1000] + [(730 * 36,000 * (1/8.6 - 1/19))/ 1000)] + [0 * 0.44 * (((1/0.904) * 17.6 * 2.56 *365.25 * 8.33 * (125-54) * 1)/3412)]
= -4206 + 1673 + 0
= -2533 kWh
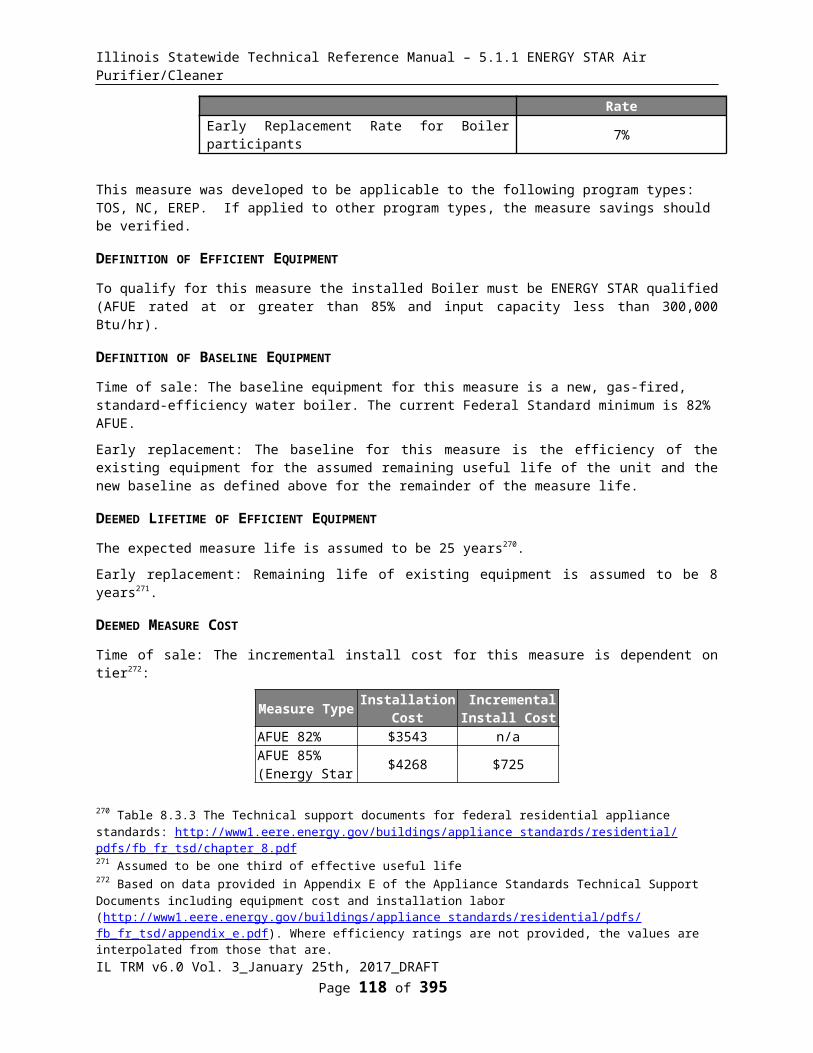
Illinois Statewide Technical Reference Manual – 5.1.1 ENERGY STAR Air Purifier/Cleaner
MEASURE CODE: RS-HVC-GSHP-V07-180101
REVIEW DEADLINE: 1/1/2021
IL TRM v6.0 Vol. 3_January 25th, 2017_DRAFT Page 120 of 296

Illinois Statewide Technical Reference Manual – 5.1.1 ENERGY STAR Air Purifier/Cleaner
5.3.9 High Efficiency Bathroom Exhaust Fan
DESCRIPTION
This market opportunity is defined by the need for continuous mechanical ventilation due to reduced air-infiltration from a tighter building shell. In retrofit projects, existing fans may be too loud, or insufficient in other ways, to be operated as required for proper ventilation. This measure assumes a fan capacity of 50 CFM rated at a sound level of less than 2.0 sones at 0.1 inches of water column static pressure. This measure may be applied to larger capacity, up to 130 CFM, efficient fans with bi-level controls because the savings and incremental costs are very similar. All eligible installations shall be sized to provide the mechanical ventilation rate indicated by ASHRAE 62.2.
This measure was developed to be applicable to the following program types: TOS, NC, RF.
If applied to other program types, the measure savings should be verified.
DEFINITION OF EFFICIENT EQUIPMENT
New efficient (average CFM/watt of 8.3 355) exhaust-only ventilation fan, quiet (< 2.0 sones) Continuous operation in accordance with recommended ventilation rate indicated by ASHRAE 62.2356
DEFINITION OF BASELINE EQUIPMENT
New standard efficiency (average CFM/Watt of 3.1357) exhaust-only ventilation fan, quiet (< 2.0 sones) operating in accordance with recommended ventilation rate indicated by ASHRAE 62.2 358
DEEMED LIFETIME OF EFFICIENT EQUIPMENT
The expected measure life is assumed to be 19 years359.
DEEMED MEASURE COST
Incremental cost per installed fan is $43.50 for quiet, efficient fans360.
LOADSHAPE
Loadshape R11 - Residential Ventilation
COINCIDENCE FACTOR
The summer Peak Coincidence Factor is assumed to be 100% because the fan runs continuously.
355 VEIC analysis looking at average efficient fan (i.e. Brushless Permanent Magnet) efficacies at static pressures of 0.1 and 0.25 inches of water column for quiet fans rated for 50 CFM.356 Bi-level controls may be used by efficient fans larger than 50 CFM357 VEIC analysis looking at average baseline fan (i.e. non-Brushless Permanent Magnet) efficacies at static pressures of 0.1 and 0.25 inches of water column for quiet fans rated for 50 CFM.358 On/off cycling controls may be required of baseline fans larger than 50CFM.359 Conservative estimate based upon GDS Associates Measure Life Report “Residential and C&I Lighting and HVAC measures” 25 years for whole-house fans, and 19 for thermostatically-controlled attic fans.360 VEIC analysis using cost data collected from wholesale vendor; http://www.westsidewholesale.com/ .
IL TRM v6.0 Vol. 3_January 25th, 2017_DRAFT Page 121 of 296
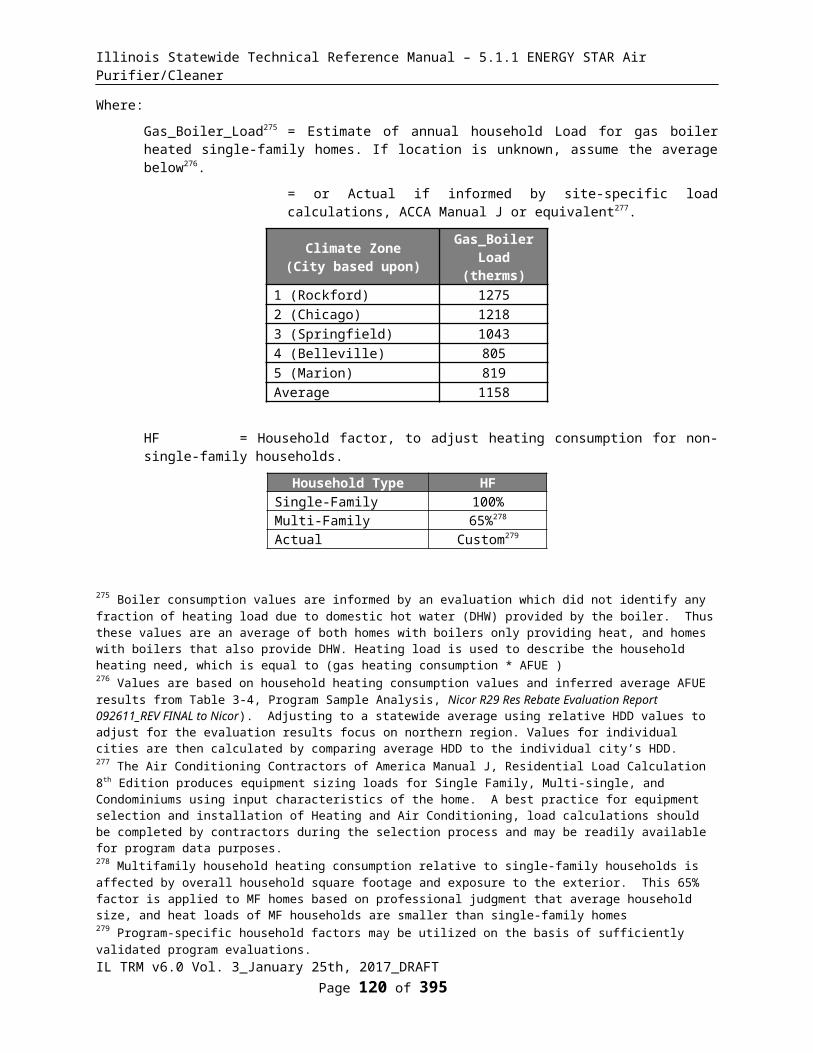
Illinois Statewide Technical Reference Manual – 5.1.1 ENERGY STAR Air Purifier/Cleaner
Algorithm
CALCULATION OF SAVINGS
ELECTRIC ENERGY SAVINGS
ΔkWh = (CFM * (1/η,BASELINE - 1/ηEFFICIENT)/1000) * Hours
Where:
CFM = Nominal Capacity of the exhaust fan
= 50 CFM361
ηBASELINE = Average efficacy for baseline fan
= 3.1 CFM/Watt362
ηEFFCIENT = Average efficacy for efficient fan
= 8.3 CFM/Watt363
Hours = assumed annual run hours,
= 8766 for continuous ventilation.
ΔkWh = (50 * (1/3.1 – 1/8.3)/1000) * 8766
= 88.6 kWh
SUMMER COINCIDENT PEAK DEMAND SAVINGS
ΔkW = (CFM * (1/ηBASELINE - 1/ηEFFICIENT)/1000) * CF
Where:
CF = Summer Peak Coincidence Factor
= 1.0 (continuous operation)
Other variables as defined above
ΔkW = (50 * (1/3.1 – 1/8.3)/1000) * 1.0
= 0.0101 kW
NATURAL GAS SAVINGS
N/A
WATER IMPACT DESCRIPTIONS AND CALCULATION
N/A
DEEMED O&M COST ADJUSTMENT CALCULATION
N/A
361 50CFM is the closest available fan size to ASHRAE 62.2 Section 4.1 Whole House Ventilation rates based upon typical square footage and bedrooms.362 VEIC analysis looking at average baseline fan (i.e. non-Brushless Permanent Magnet) efficacies at static pressures of 0.1 and 0.25 inches of water column for quiet fans rated for 50 CFM.363 VEIC analysis looking at average efficient fan (i.e. Brushless Permanent Magnet) efficacies at static pressures of 0.1 and 0.25 inches of water column for quiet fans rated for 50 CFM.
IL TRM v6.0 Vol. 3_January 25th, 2017_DRAFT Page 122 of 296

Illinois Statewide Technical Reference Manual – 5.1.1 ENERGY STAR Air Purifier/Cleaner
MEASURE CODE: RS-HVC-BAFA-V01-120601
REVIEW DEADLINE: 1/1/2019
IL TRM v6.0 Vol. 3_January 25th, 2017_DRAFT Page 123 of 296

Illinois Statewide Technical Reference Manual – 5.1.1 ENERGY STAR Air Purifier/Cleaner
5.3.10 HVAC Tune Up (Central Air Conditioning or Air Source Heat Pump)
DESCRIPTION
This measure involves the measurement of refrigerant charge levels and airflow over the central air conditioning or heat pump unit coil, correction of any problems found and post-treatment re-measurement. Measurements must be performed with standard industry tools and the results tracked by the efficiency program.
Savings from this measure are developed using a reputable Wisconsin study. It is recommended that future evaluation be conducted in Illinois to generate a more locally appropriate characterization.
This measure was developed to be applicable to the following program types: RF.
If applied to other program types, the measure savings should be verified.
DEFINITION OF EFFICIENT EQUIPMENT
N/A
DEFINITION OF BASELINE EQUIPMENT
This measure assumes that the existing unit being maintained is either a residential central air conditioning unit or an air source heat pump that has not been serviced for at least 3 years.
DEEMED LIFETIME OF EFFICIENT EQUIPMENT
The measure life is assumed to be 2 years364.
DEEMED MEASURE COST
If the implementation mechanism involves delivering and paying for the tune up service, the actual cost should be used. If however the customer is provided a rebate and the program relies on private contractors performing the work, the measure cost should be assumed to be $175365.
LOADSHAPE
Loadshape R08 - Residential Cooling
COINCIDENCE FACTOR
The summer peak coincidence factor for cooling is provided in two different ways below. The first is used to estimate peak savings during the utility peak hour and is most indicative of actual peak benefits, and the second represents the average savings over the defined summer peak period, and is presented so that savings can be bid into PJM’s Forward Capacity Market.
CFSSP = Summer System Peak Coincidence Factor for Central A/C (during utility peak hour)
= 68%366
CFSSP = Summer System Peak Coincidence Factor for Heat Pumps (during system peak hour)
= 72%%367
364 Based on VEIC professional judgment. 365 Based on personal communication with HVAC efficiency program consultant Buck Taylor or Roltay Inc., 6/21/10, who estimated the cost of tune up at $125 to $225, depending on the market and the implementation details.366 Based on metering of 24 homes with central AC during PY4 and PY5 in Ameren Illinois service territory.367 Based on analysis of metering results from 24 heat pumps in Ameren Illinois service territory in PY5 coincident with AIC’s 2010 system peak; ‘Impact and Process Evaluation of Ameren Illinois Company’s Residential HVAC Program (PY5)’.
IL TRM v6.0 Vol. 3_January 25th, 2017_DRAFT Page 124 of 296

Illinois Statewide Technical Reference Manual – 5.1.1 ENERGY STAR Air Purifier/Cleaner
CFPJM = PJM Summer Peak Coincidence Factor for Central A/C (average during PJM peak period)
= 46.6%368
Algorithm
CALCULATION OF SAVINGS
ELECTRIC ENERGY SAVINGS
ΔkWhCentral AC = (FLHcool * Capacity_cooling* (1/SEERCAC))/1000 * MFe
ΔkWhAir Source Heat Pump = ((FLHcool * Capacity_cooling * (1/SEERASHP))/1000 * MFe) + (FLHheat * Capacity_heating * (1/HSPFASHP))/1000 * MFe)
Where:
FLHcool = Full load cooling hours
Dependent on location as below:369
Climate Zone(City based upon)
FLHcoolSingle Family
FLHcoolMultifamily
1 (Rockford) 512 4672 (Chicago) 570 5063 (Springfield) 730 6634 (Belleville) 1,035 9405 (Marion) 903 820Weighted Average370 629 564
Capacity_cooling = Cooling cpacity of equipment in Btu/hr (note 1 ton = 12,000 Btu/hr)
= Actual
SEERCAC = SEER Efficiency of existing central air conditioning unit receiving maintenence
= Actual. If unknown assume 10 SEER 371
MFe = Maintenance energy savings factor
= 0.05372
SEERASHP = SEER Efficiency of existing air source heat pump unit receiving maintenence
= Actual. If unknown assume 10 SEER 373
368 Based on analysis of Itron eShape data for Missouri, calibrated to Illinois loads, supplied by Ameren. The average AC load over the PJM peak period (1-5pm, M-F, June through August) is divided by the maximum AC load during the year.369 Based on Full Load Hours from ENERGY Star with adjustments made in a Navigant Evaluation, other cities were scaled using those results and CDD. There is a county mapping table in Volume 1, Section 3.7 providing the appropriate city to use for each county of Illinois.370 Weighted based on number of occupied residential housing units in each zone.371 Use actual SEER rating where it is possible to measure or reasonably estimate. Unknown default of 10 SEER is a VEIC estimate of existing unit efficiency, based on minimum federal standard between the years of 1992 and 2006.372 Energy Center of Wisconsin, May 2008; “Central Air Conditioning in Wisconsin, A Compilation of Recent Field Research.”373 Use actual SEER rating where it is possible to measure or reasonably estimate. Unknown default of 10 SEER is a VEIC estimate of existing unit efficiency, based on minimum federal standard between the years of 1992 and 2006.
IL TRM v6.0 Vol. 3_January 25th, 2017_DRAFT Page 125 of 296

Illinois Statewide Technical Reference Manual – 5.1.1 ENERGY STAR Air Purifier/Cleaner
FLHheat = Full load heating hours
Dependent on location:374
Climate Zone(City based upon) FLHheat
1 (Rockford) 22082 (Chicago) 20643 (Springfield) 19674 (Belleville) 14205 (Marion) 1445Weighted Average375 1821
Capacity_heating = Heating cpacity of equipment in Btu/hr (note 1 ton = 12,000 Btu/hr)
= Actual
HSPFASHP = Heating Season Performance Factor of existing air source heat pump unit receiving maintenence
= Actual. If unknown assume 6.8 HSPF 376
SUMMER COINCIDENT PEAK DEMAND SAVINGS
∆kW = Capacity_cooling * (1/EER)/1000 * MFd * CF
Where:
EER = EER Efficiency of existing unit receiving maintenance in Btu/H/Watts
= Calculate using Actual SEER
= - 0.02*SEER2 + 1.12*SEER 377
374 Full load heating hours for heat pumps are provided for Rockford, Chicago and Springfield in the Energy Star Calculator. Estimates for the other locations were calculated based on the FLH to Heating Degree Day (from NCDC) ratio. VEIC consider Energy Star estimates to be high due to oversizing not being adequately addressed. Using average Illinois billing data (from http://www.icc.illinois.gov/ags/consumereducation.aspx) VEIC estimated the average gas heating load and used this to estimate the average home heating output (using 83% average gas heat efficiency). Dividing this by a typical 36,000 Btu/hr ASHP gives an estimate of average ASHP FLH_heat of 1821 hours. We used the ratio of this value to the average of the locations using the Energy Star data (1994 hours) to scale down the Energy Star estimates. There is a county mapping table in Volume 1, Section 3.7 providing the appropriate city to use for each county of Illinois.375 Weighted based on number of occupied residential housing units in each zone.376 Use actual HSPF rating where it is possible to measure or reasonably estimate. Unknown default of 6.8 HSPF is a VEIC estimate based on minimum Federal Standard between 1992 and 2006.377 Based on Wassmer, M. (2003). A Component-Based Model for Residential Air Conditioner and Heat Pump Energy Calculations. Masters Thesis, University of Colorado at Boulder. Note this is appropriate for single speed units only.
IL TRM v6.0 Vol. 3_January 25th, 2017_DRAFT Page 126 of 296
For example, maintenance of a 3-ton, SEER 10 air conditioning unit in a single family house in Springfield:
ΔkWhCAC = (730 * 36,000 * (1/10))/1000 * 0.05
= 131 kWh
For example, maintenance of a 3-ton, SEER 10, HSPF 6.8 air source heat pump unit in a single family house in Springfield:
ΔkWhASHP = ((730 * 36,000 * (1/10))/1000 * 0.05) + (1967 * 36,000 * (1/6.8))/1000 * 0.05)
= 652 kWh
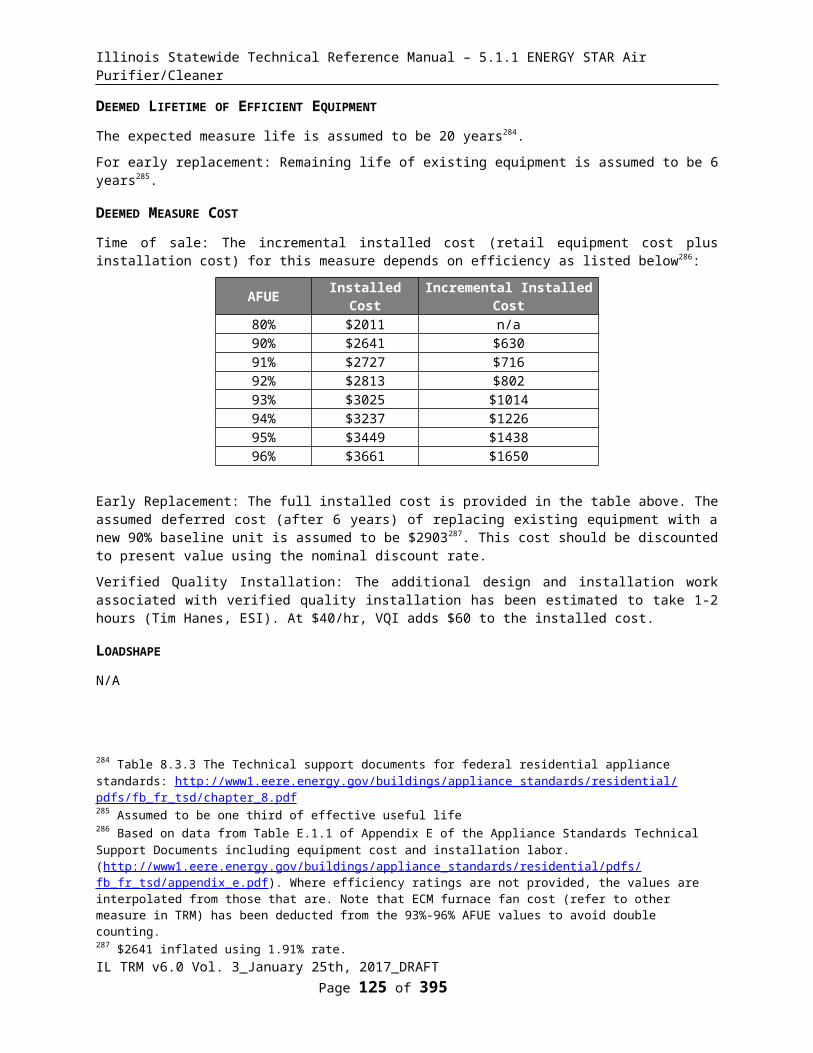
Illinois Statewide Technical Reference Manual – 5.1.1 ENERGY STAR Air Purifier/Cleaner
MFd = Maintenance demand savings factor
= 0.02 378
CFSSP = Summer System Peak Coincidence Factor for Central A/C (during system peak hour)
= 68%379
CFSSP = Summer System Peak Coincidence Factor for Heat Pumps (during system peak hour)
= 72%%380
CFPJM = PJM Summer Peak Coincidence Factor for Central A/C and Heat Pumps (average during peak period)
= 46.6%381
NATURAL GAS SAVINGS
N/A
WATER IMPACT DESCRIPTIONS AND CALCULATION
N/A
DEEMED O&M COST ADJUSTMENT CALCULATION
Conservatively not included.
MEASURE CODE: RS-HVC-TUNE-V03-160601
REVIEW DEADLINE: 1/1/2021
378 Based on June 2010 personal conversation with Scott Pigg, author of Energy Center of Wisconsin, May 2008; “Central Air Conditioning in Wisconsin, A Compilation of Recent Field Research” suggesting the average WI unit system draw of 2.8kW under peak conditions, and average peak savings of 50W.379 Based on metering of 24 homes with central AC during PY4 and PY5 in Ameren Illinois service territory.380 Based on analysis of metering results from 24 heat pumps in Ameren Illinois service territory in PY5 coincident with AIC’s 2010 system peak; ‘Impact and Process Evaluation of Ameren Illinois Company’s Residential HVAC Program (PY5)’.381 Based on analysis of Itron eShape data for Missouri, calibrated to Illinois loads, supplied by Ameren. The average AC load over the PJM peak period (1-5pm, M-F, June through August) is divided by the maximum AC load during the year.
IL TRM v6.0 Vol. 3_January 25th, 2017_DRAFT Page 127 of 296
For example, maintenance of 3-ton, SEER 10 (equals EER 9.2) CAC unit:
ΔkWSSP = 36,000 * 1/(9.2)/1000 * 0.02 * 0.68
= 0.0532 kW
ΔkWPJM = 36,000 * 1/(9.2)/1000 * 0.02 * 0.466
= 0.0365 kW

Illinois Statewide Technical Reference Manual – 5.6.5 High Efficiency Pool Pumps
5.3.11 Programmable Thermostats
DESCRIPTION
This measure characterizes the household energy savings from the installation of a new or reprogramming of an existing Programmable Thermostat for reduced heating energy consumption through temperature set-back during unoccupied or reduced demand times. Because a literature review was not conclusive in providing a defensible source of prescriptive cooling savings from programmable thermostats, cooling savings from programmable thermostats are assumed to be zero for this version of the measure. It is not appropriate to assume a similar pattern of savings from setting a thermostat down during the heating season and up during the cooling season. Note that the EPA’s EnergyStar program is developing a new specification for this project category, and if/when evaluation results demonstrate consistent cooling savings, subsequent versions of this measure will revisit this assumption382. Energy savings are applicable at the household level; all thermostats controlling household heat should be programmable and installation of multiple programmable thermostats per home does not accrue additional savings.
This measure was developed to be applicable to the following program types: TOS, NC, RF, DI.
If applied to other program types, the measure savings should be verified.
DEFINITION OF EFFICIENT EQUIPMENT
The criteria for this measure are established by replacement of a manual-only temperature control, with one that has the capability to adjust temperature setpoints according to a schedule without manual intervention. This category of equipment is broad and rapidly advancing in regards to the capability, and usability of the controls and their sophistication in setpoint adjustment and information display, but for the purposes of this characterization, eligibility is perhaps most simply defined by what it isn't: a manual only temperature control.
For the thermostat reprogramming measure, the auditor consults with the homeowner to determine an appropriate set back schedule, reprograms the thermostat and educates the homeowner on its appropriate use.
DEFINITION OF BASELINE EQUIPMENT
For new thermostats the baseline is a non-programmable thermostat requiring manual intervention to change temperature setpoint.
For the purpose of thermostat reprogramming, an existing programmable thermostat that an auditor determines is being used in override mode or otherwise effectively being operated like a manual thermostat.
DEEMED LIFETIME OF EFFICIENT EQUIPMENT
The expected measure life of a programmable thermostat is assumed to be 10 years 383 based upon equipment life only384. For the purposes of claiming savings for a new programmable thermostat, this is reduced by a 50% persistence factor to give final measures life of 5 years. For reprogramming, this is reduced further to give a measure life of 2 years.
DEEMED MEASURE COST
Actual material and labor costs should be used if the implementation method allows. If unknown (e.g. through a
382 The EnergyStar program discontinued its support for this measure category effective 12/31/09, and is presently developing a new specification for ‘Residential Climate Controls’. 383 Table 1, HVAC Controls, Measure Life Report, Residential and Commercial/Industrial Lighting and HVAC Measures, GDS Associates, 2007384 Future evaluation is strongly encouraged to inform the persistence of savings to further refine measure life assumption. As this characterization depends heavily upon a large scale but only 2-year study of the energy impacts of programmable thermostats, the longer term impacts should be assessed.
IL TRM v6.0 Vol. 3_January 25th, 2017_DRAFT Page 128 of 296

Illinois Statewide Technical Reference Manual – 5.6.5 High Efficiency Pool Pumps
retail program) the capital cost for the new installation measure is assumed to be $30 385. The cost for reprogramming is assumed to be $10 to account for the auditors time to reprogram and educate the homeowner.
LOADSHAPE
Loadshape R09 - Residential Electric Space Heat
COINCIDENCE FACTOR
N/A due to no savings attributable to cooling during the summer peak period.
Algorithm
CALCULATION OF SAVINGS
ELECTRIC ENERGY SAVINGS
ΔkWh386 = %ElectricHeat * Elec_Heating_Consumption * Heating_Reduction * HF * Eff_ISR + (∆Therms * Fe * 29.3)
Where:
%ElectricHeat = Percentage of heating savings assumed to be electric
Heating fuel %ElectricHeatElectric 100%Natural Gas 0%Unknown 6.5%387
Elec_Heating_ Consumption
= Estimate of annual household heating consumption for electrically heated single-family homes388. If location and heating type is unknown, assume 15,678 kWh389
385 Market prices vary significantly in this category, generally increasing with thermostat capability and sophistication. The basic functions required by this measure's eligibility criteria are available on units readily available in the market for the listed price. 386 Note the second part of the algorithm relates to furnace fan savings if the heating system is Natural Gas.387 Assumes that half of the electric heat in the state is a heat pump able to be controlled by an advanced thermostat (consistent with Potential Study results from the state). Average value of 13% electric space heating from 2010 Residential Energy Consumption Survey for Illinois. If utilities have specific evaluation results providing a more appropriate assumption for homes in a particular market or geographical area then that should be used.388 Values in table are based on converting an average household heating load (834 therms) for Chicago based on ‘Table E-1, Energy Efficiency/Demand Response Nicor Gas Plan Year 1: Research Report: Furnace Metering Study, Draft, Navigant, August 1 2013 to an electric heat load (divide by 0.03413) to electric resistance and ASHP heat load (resistance load reduced by 15% to account for distribution losses that occur in furnace heating but not in electric resistance while ASHP heat is assumed to suffer from similar distribution losses) and then to electric consumption assuming efficiencies of 100% for resistance and 200% for HP (see ‘Household Heating Load Summary Calculations_11062013.xls’). Finally these values were adjusted to a statewide average using relative HDD assumptions to adjust for the evaluation results focus on northern region. Values for individual cities are then calculated by comparing average HDD to the individual city’s HDD. 389 Assumption that 1/2 of electrically heated homes have electric resistance and 1/2 have Heat Pump, based on 2010 Residential Energy Consumption Survey for Illinois.
IL TRM v6.0 Vol. 3_January 25th, 2017_DRAFT Page 129 of 296
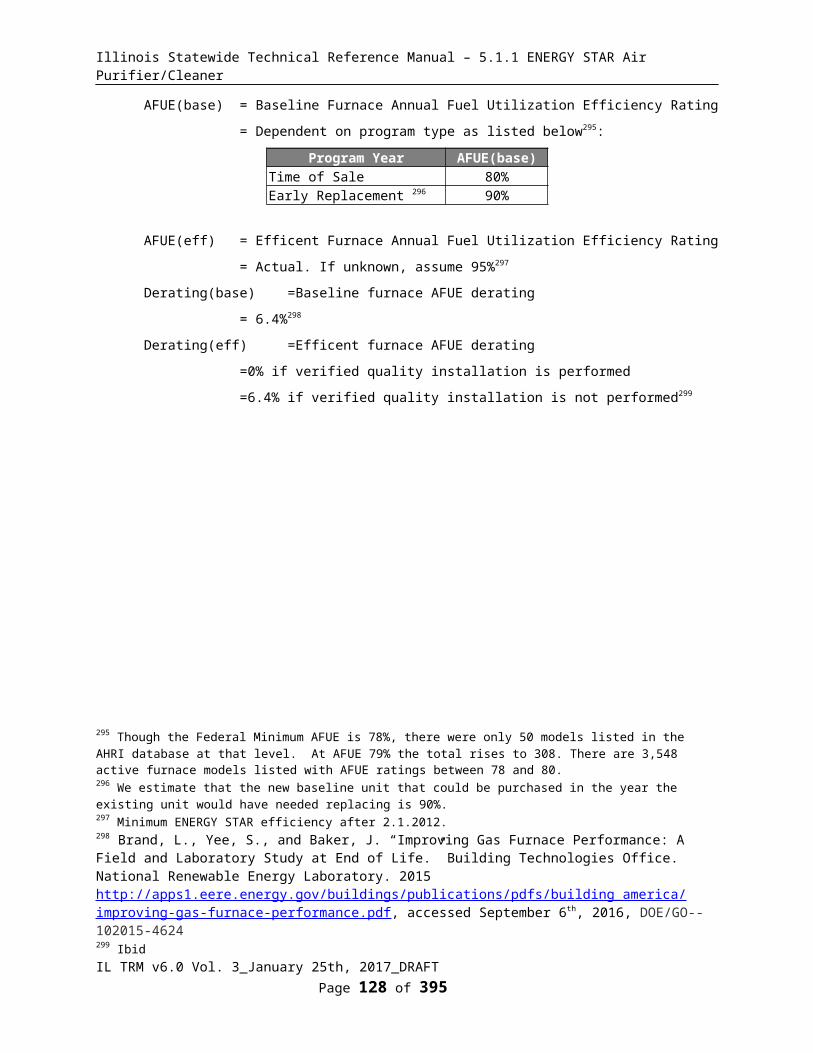
Illinois Statewide Technical Reference Manual – 5.6.5 High Efficiency Pool Pumps
Climate Zone(City based upon)
Electric ResistanceElec_Heating_ Consumption
(kWh)
Electric Heat PumpElec_Heating_ Consumption
(kWh)1 (Rockford) 21,741 12,7892 (Chicago) 20,771 12,2183 (Springfield) 17,789 10,4644 (Belleville) 13,722 8,0725 (Marion) 13,966 8,215Average 19,743 11,613
Heating_Reduction = Assumed percentage reduction in total household heating energy consumption due to programmable thermostat
= 6.2%390
HF = Household factor, to adjust heating consumption for non-single-family households.
Household Type HFSingle-Family 100%Multi-Family 65%391
Actual Custom392
Eff_ISR = Effective In-Service Rate, the percentage of thermostats installed and programmed effectively
Program Delivery Eff_ISRDirect Install 100%Other, or unknown 56%393
∆Therms = Therm savings if Natural Gas heating system
= See calculation in Natural Gas section below
Fe = Furnace Fan energy consumption as a percentage of annual fuel consumption
= 3.14%394
390 The savings from programmable thermostats are highly susceptible to many factors best addressed, so far for this category, by a study that controlled for the most significant issues with a very large sample size. To the extent that the treatment group is representative of the program participants for IL, this value is suitable. Higher and lower values would be justified based upon clear dissimilarities due to program and product attributes. Future evaluation work should assess program specific impacts associated with penetration rates, baseline levels, persistence, and other factors which this value represents.391 Multifamily household heating consumption relative to single-family households is affected by overall household square footage and exposure to the exterior. This 65% factor is applied to MF homes based on professional judgment that average household size, and heat loads of MF households are smaller than single-family homes 392 Program-specific household factors may be utilized on the basis of sufficiently validated program evaluations. 393“Programmable Thermostats. Report to KeySpan Energy Delivery on Energy Savings and Cost Effectiveness,” GDS Associates, Marietta, GA. 2002GDS394 Fe is not one of the AHRI certified ratings provided for residential furnaces, but can be reasonably estimated from a calculation based on the certified values for fuel energy (Ef in MMBtu/yr) and Eae (kWh/yr). An average of a 300 record sample (non-random) out of 1495 was 3.14%. This is, appropriately, ~50% greater than the Energy Star version 3 criteria for 2% Fe. See “Programmable Thermostats Furnace Fan Analysis.xlsx” for reference.
IL TRM v6.0 Vol. 3_January 25th, 2017_DRAFT Page 130 of 296
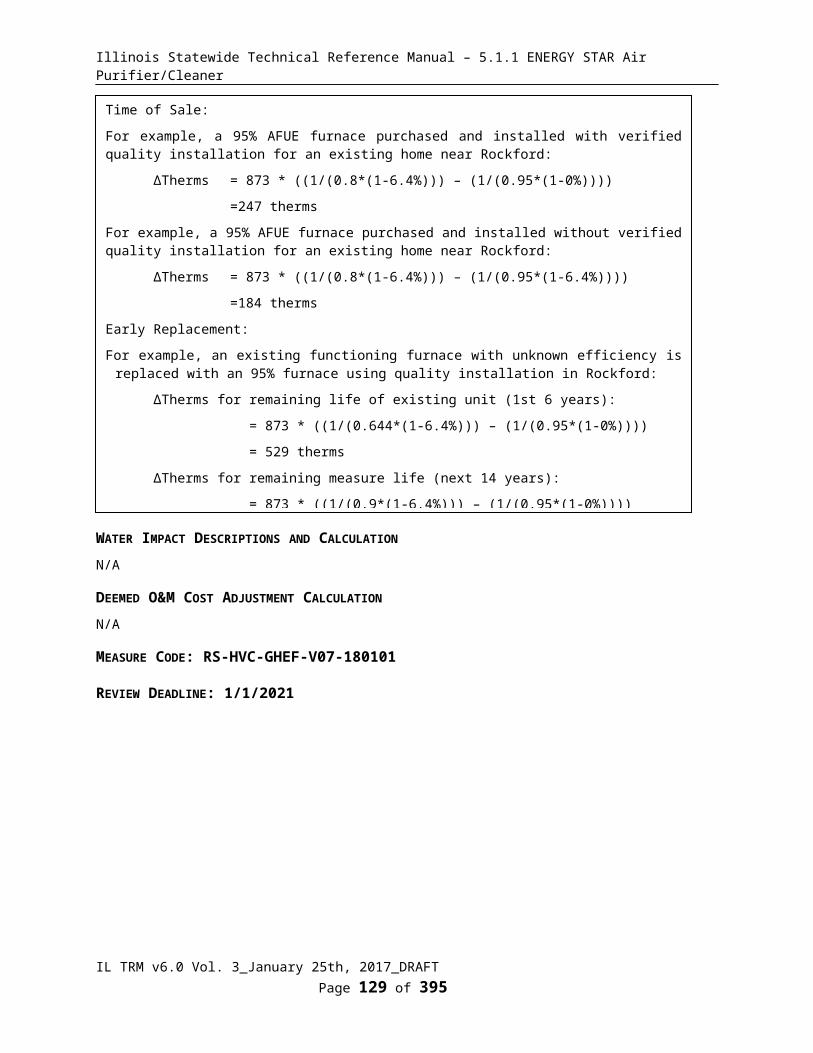
Illinois Statewide Technical Reference Manual – 5.6.5 High Efficiency Pool Pumps
29.3 = kWh per therm
SUMMER COINCIDENT PEAK DEMAND SAVINGS
N/A due to no savings from cooling during the summer peak period.
NATURAL GAS ENERGY SAVINGS
∆Therms = %FossilHeat * Gas_Heating_Consumption * Heating_Reduction * HF * Eff_ISR
Where:
%FossilHeat = Percentage of heating savings assumed to be Natural Gas
Heating fuel %FossilHeatElectric 0%Natural Gas 100%Unknown 93.5%395
Gas_Heating_Consumption
= Estimate of annual household heating consumption for gas heated single-family homes. If location is unknown, assume the average below396.
Climate Zone(City based upon)
Gas_Heating_ Consumption
(therms)1 (Rockford) 1,0522 (Chicago) 1,0053 (Springfield) 8614 (Belleville) 6645 (Marion) 676Average 955
395 Assumes that half of the electric heat in the state is a heat pump able to be controlled by an advanced thermostat. Data from 2010 Residential Energy Consumption Survey for Illinois. If utilities have specific evaluation results providing a more appropriate assumption for homes in a particular market or geographical area then that should be used.396 Values are based on adjusting the average household heating load (834 therms) for Chicago based on ‘Table E-1, Energy Efficiency / Demand Response Nicor Gas Plan Year 1, Research Report: Furnace Metering Study’, divided by standard assumption of existing unit efficiency of 83% (estimate based on 24% of furnaces purchased in Illinois were condensing in 2000 (based on data from GAMA, provided to Department of Energy), assuming typical efficiencies: (0.24*0.92) + (0.76*0.8) = 0.83) to give 1005 therms. This Chicago value was then adjusted to a statewide average using relative HDD assumptions to adjust for the evaluation results focus on northern region. Values for individual cities are then calculated by comparing average HDD to the individual city’s HDD.
IL TRM v6.0 Vol. 3_January 25th, 2017_DRAFT Page 131 of 296
For example, a programmable thermostat directly installed in an electric resistance heated, single-family home in Springfield:
ΔkWH = 1 * 17,789 * 0.062 * 100% * 100% + (0 * 0.0314 * 29.3)
= 1,103 kWh

Illinois Statewide Technical Reference Manual – 5.6.5 High Efficiency Pool Pumps
WATER IMPACT DESCRIPTIONS AND CALCULATION
N/A
DEEMED O&M COST ADJUSTMENT CALCULATION
N/A
MEASURE CODE: RS-HVC-PROG-V04-180101
REVIEW DEADLINE: 1/1/2021
IL TRM v6.0 Vol. 3_January 25th, 2017_DRAFT Page 132 of 296
For example, a programmable thermostat directly-installed in a gas heated single-family home in Chicago:
∆Therms = 1.0 * 1005 * 0.062 * 100% * 100%
= 62.3 therms
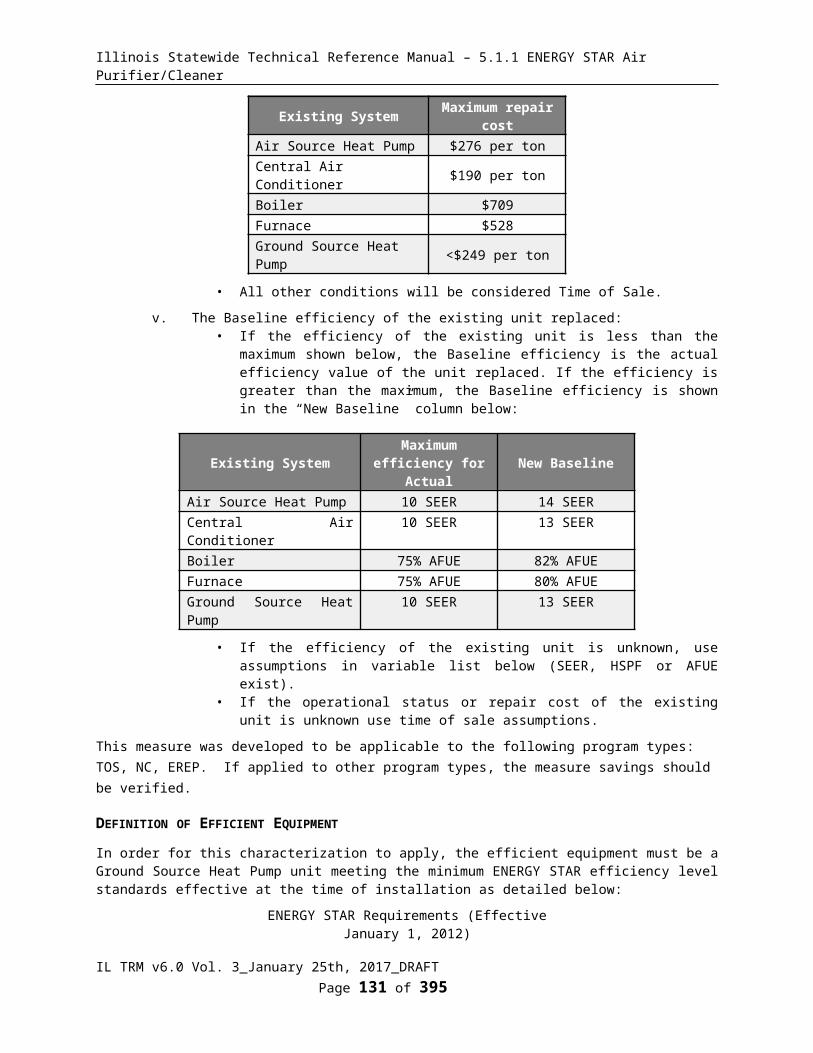
Illinois Statewide Technical Reference Manual – 5.6.5 High Efficiency Pool Pumps
5.3.12 Ductless Heat Pumps
DESCRIPTION
This measure is designed to calculate electric savings for the installation of a ductless mini-split heat pump (DMSHP). DMSHPs save energy in heating mode because they provide heat more efficiently than electric resistance heat and central ASHP systems. Additionally, DMSHPs use less fan energy to move heat and don’t incur heat loss through a duct distribution system.
For cooling, the proposed savings calculations are aligned with those of typical replacement systems. DMSHPs save energy in cooling mode because they provide cooling capacity more efficiently than other types of unitary cooling equipment. A DMSHP installed in a home with a central ASHP system will save energy by offsetting some of the cooling energy of the ASHP. In order for this measure to apply, the control strategy for the heat pump is assumed to be chosen to maximize savings per installer recommendation.397
This measure characterizes the following scenarios:
d) New Construction:
a. The installation of a new DMSHP meeting efficiency standards required by the program in a new home.
b. Note the baseline in this case should be determined via EM&V and the algorithms are provided to allow savings to be calculated from any baseline condition.
e) Time of Sale:
a. The planned installation of a new DMSHP meeting efficiency standards required by the program to replace an existing system(s) that does not meet the criteria for early replacement described in section c below.
b. Note the baseline in this case is an equivalent replacement system to that which exists currently in the home. The calculation of savings is dependent on whether an incentive for the installation has been provided by both a gas and electric utility, just an electric utility or just a gas utility.
f) Early Replacement/Retrofit:
a. The early removal or displacement of functioning either electric or gas space heating and/or cooling systems from service, prior to the natural end of life, and replacement with a new DMSHP.
b. Note the baseline in this case is the existing equipment being replaced/displaced. The calculation of savings is dependent on whether an incentive for the installation has been provided by both a gas and electric utility, just an electric utility or just a gas utility.
c. Early Replacement determination will be based on meeting the following conditions:• The existing unit is operational when replaced/displaced, or• The existing unit requires minor repairs, defined as costing less than398:
Existing System Maximum repair costAir Source Heat Pump $276 per tonCentral Air Conditioner $190 per ton
397 The whole purpose of installing ductless heat pumps is to conserve energy, so the installer can be assumed to be capable of recommending an appropriate controls strategy. For most applications, the heating setpoint for the ductless heat pump should be at least 2F higher than any remaining existing system and the cooling setpoint for the ductless heat pump should be at least 2F cooler than the existing system (this should apply to all periods of a programmable schedule, if applicable). This helps ensure that the ductless heat pump will be used to meet as much of the load as possible before the existing system operates to meet the remaining load. Ideally, the new ductless heat pump controls should be set to the current comfort settings, while the existing system setpoints should be adjusted down (heating) and up (cooling) to capture savings.398 The Technical Advisory Committee agreed that if the cost of repair is less than 20% of the new baseline replacement cost it can be considered early replacement.
IL TRM v6.0 Vol. 3_January 25th, 2017_DRAFT Page 133 of 296

Illinois Statewide Technical Reference Manual – 5.6.5 High Efficiency Pool Pumps
Existing System Maximum repair costBoiler $709Furnace $528Ground Source Heat Pump <$249 per ton
• All other conditions will be considered Time of Sale.
d. The Baseline efficiency of the existing unit replaced:• If the efficiency of the existing unit is less than the maximum shown below, the Baseline
efficiency is the actual efficiency value of the unit replaced. If the efficiency is greater than the maximum, the Baseline efficiency is shown in the “New Baseline” column below:
Existing System Maximum efficiency for Actual New Baseline399
Air Source Heat Pump 10 SEER 14 SEERCentral Air Conditioner 10 SEER 13 SEERBoiler 75% AFUE 82% AFUEFurnace 75% AFUE 80% AFUEGround Source Heat Pump 10 SEER 13 SEER
• If the efficiency of the existing unit is unknown, use assumptions in variable list below (SEER, HSPF or AFUE exist).
• If the operational status or repair cost of the existing unit is unknown use time of sale assumptions.
This measure was developed to be applicable to the following program types: RF, TOS, NC, EREP.
If applied to other program types, the measure savings should be verified.
DEFINITION OF EFFICIENT EQUIPMENT
In order for this characterization to apply, the new equipment must be a high-efficiency, variable-capacity (typically “inverter-driven” DC motor) ductless heat pump system that exceeds the program minimum efficiency requirements.
DEFINITION OF BASELINE EQUIPMENT
For these products, baseline equipment includes Air Conditioning and Space Heating:
New Construction:
To calculate savings with an electric baseline, the baseline equipment is assumed to be an Air Source Heat Pump meeting the Federal Standard efficiency level; 14 SEER, 8.2 HSPF and 11.8400 EER.
To calculate savings with a furnace/central AC baseline, the baseline equipment is assumed to be an 80% AFUE Furnace and central AC meeting the Federal Standard efficiency level; 13 SEER, 11 EER.
Time of Sale: The baseline for this measure is a new replacement unit of the same system type as the existing unit, meeting the baselines provided below.
Unit Type Efficiency StandardASHP 14 SEER, 11.8 EER, 8.2 HSPF
399 Based on relevant Federal Standards.400 The Federal Standard does not include an EER requirement, so it is approximated with this formula: (-0.02 * SEER2) + (1.12 * SEER) Wassmer, M. (2003). ‘A Component-Based Model for Residential Air Conditioner and Heat Pump Energy Calculations’ Masters Thesis, University of Colorado at Boulder.
IL TRM v6.0 Vol. 3_January 25th, 2017_DRAFT Page 134 of 296
Illinois Statewide Technical Reference Manual – 5.6.5 High Efficiency Pool Pumps
Unit Type Efficiency StandardGas Furnace 80% AFUEGas Boiler 82% AFUECentral AC 13 SEER, 11 EER
Early replacement / Retrofit: The baseline for this measure is the efficiency of the existing heating and cooling equipment for the assumed remaining useful life of the existing unit and a new baseline heating and cooling system for the remainder of the measure life (as provided in table above except for Gas Furnace where new baseline assumption is 90% due to pending standard change). Note that in order to claim cooling savings, there must be an existing air conditioning system.
For multifamily buildings, each residence must have existing individual heating equipment. Multifamily residences with central heating do not qualify for this characterization.
DEEMED LIFETIME OF EFFICIENT EQUIPMENT
The expected measure life is assumed to be 18 years401.
For early replacement, the remaining life of existing equipment is assumed to be 6 years402.
DEEMED MEASURE COST
New Construction and Time of Sale: The actual installed cost of the DMSHP should be used (defaults are provided below), minus the assumed installation cost of the baseline equipment ($1,381 per ton for ASHP403 or $2,011 for a new baseline 80% AFUE furnace or $3,543 for a new 82% AFUE boiler 404 and $952 per ton405 for new baseline Central AC replacement).
Unit Size Full Install Cost406
1-Ton $3,0001.5-Ton $37502-Ton $4,5002.5 – Ton $5,3133-Ton $6,188
Early Replacement/retrofit (replacing existing equipment): The full installation cost of the DMSHP should be used (default provided above). The assumed deferred cost (after 8 years) of replacing existing equipment with a new baseline unit is assumed to be $1,518 per ton for a new baseline Air Source Heat Pump, or $2,903 for a new baseline 90% AFUE furnace or $4,045 for a new 82% AFUE boiler and $1,047 per ton for new baseline Central AC replacement407. This future cost should be discounted to present value using the nominal societal discount rate.
Where the DMSHP is a supplemental HVAC system, the full installation cost of the DMSHP should be used (default provided above) without a deferred replacement cost.
401 Measure Life Report: Residential and Commercial/Industrial Lighting and HVAC Measures, GDS Associates, Inc., June 2007402 Assumed to be one third of effective useful life403 Based on data provided on Home Advisor website, providing national average ASHP cost based on 2465 cost submittals. http://www.homeadvisor.com/cost/heating-and-cooling/install-a-heat-pump/404 Furnace and boiler costs are based on data provided in Appendix E of the Appliance Standards Technical Support Documents including equipment cost and installation labor (http://www1.eere.energy.gov/buildings/appliance_standards/residential/pdfs/fb_fr_tsd/appendix_e.pdf). Where efficiency ratings are not provided, the values are interpolated from those that are.405 Based on 3 ton initial cost estimate for a conventional unit from ENERGY STAR Central AC calculator (http://www.energystar.gov/ia/business/bulk_purchasing/bpsavings_calc/Calc_CAC.xls). 406
407 All baseline replacement costs are consistent with their respective measures and include inflation rate of 1.91%.
IL TRM v6.0 Vol. 3_January 25th, 2017_DRAFT Page 135 of 296

Illinois Statewide Technical Reference Manual – 5.6.5 High Efficiency Pool Pumps
LOADSHAPE
Loadshape R10 - Residential Electric Heating and Cooling (if replacing gas heat and central AC)408
Loadshape R09 - Residential Electric Space Heat (if replacing electric heat with no cooling)
Loadshape R10 - Residential Electric Heating and Cooling (if replacing ASHP)
Note for purpose of cost effectiveness screening a fuel switch scenario, the heating kWh increase and cooling kWh decrease should be calculated separately such that the appropriate loadshape (i.e. Loadshape R09 - Residential Electric Space Heat and Loadshape R08 – Residential Cooling respectively) can be applied.
COINCIDENCE FACTOR
The summer peak coincidence factor for cooling is provided in four different ways below. The first two relate to the use of DMSHP to supplement existing cooling or provide limited zonal cooling, the second two relate to use of the DMSHP to provide whole house cooling. In each pair, the first is used to estimate peak savings during the utility peak hour and is most indicative of actual peak benefits, and the second represents the average savings over the defined summer peak period, and is presented so that savings can be bid into PJM’s Forward Capacity Market. Both values provided are based on metering data for 40 DMSHPs in Ameren Illinois service territory409.
For supplemental or limited zonal cooling:
CFSSP = Summer System Peak Coincidence Factor for DMSHP (during utility peak hour)
= 43.1%%410
CFPJM = PJM Summer Peak Coincidence Factor for DMSHP (average during PJM peak period)
= 28.0%411
For whole house cooling:
CFSSP = Summer System Peak Coincidence Factor for Heat Pumps (during utility peak hour)
= 72%%412
CFPJM = PJM Summer Peak Coincidence Factor for Heat Pumps (average during PJM peak period)
= 46.6%413
408 The baseline for calculating electric savings is an Air Source Heat Pump.409 All-Electric Homes PY6 Metering Results: Multifamily HVAC Systems, Cadmus, October 2015410 Based on analysis of metering results from 24 heat pumps in Ameren Illinois service territory in PY5 coincident with AIC’s 2010 system peak; ‘Impact and Process Evaluation of Ameren Illinois Company’s Residential HVAC Program (PY5)’.411 Based on analysis of Itron eShape data for Missouri, calibrated to Illinois loads, supplied by Ameren. The average AC load over the PJM peak period (1-5pm, M-F, June through August) is divided by the maximum AC load during the year.412 Based on analysis of metering results from 24 heat pumps in Ameren Illinois service territory in PY5 coincident with AIC’s 2010 system peak; ‘Impact and Process Evaluation of Ameren Illinois Company’s Residential HVAC Program (PY5)’. http://www.icc.illinois.gov/downloads/public/edocket/368522.pdf413 Based on analysis of Itron eShape data for Missouri, calibrated to Illinois loads, supplied by Ameren. The average AC load over the PJM peak period (1-5pm, M-F, June through August) is divided by the maximum AC load during the year.
IL TRM v6.0 Vol. 3_January 25th, 2017_DRAFT Page 136 of 296

Illinois Statewide Technical Reference Manual – 5.6.5 High Efficiency Pool Pumps
Algorithms
CALCULATION OF SAVINGS
ELECTRIC ENERGY SAVINGS
New Construction and Time of Sale (non-fuel switch only):
ΔkWh = [Heating Savings] + [Cooling Savings]
= [(Elecheat * Capacityheat * EFLHheat * (1/HSPFBase - 1/HSPFee)) / 1000] + [(Capacitycool* EFLHcool * (1/SEERBase- 1/SEERee)) / 1000]
New Construction and Time of Sale (fuel switch only):
If measure is supported by gas utility only, ΔkWH = 0
If measure is supported by gas and electric utility or electric utility only, electric utility claim savings calculated below:
ΔkWh = [Heating Savings from base ASHP to DMSHP] + [Cooling Savings]
= [(Capacityheat * EFLHheat * (1/HSPFASHP - 1/HSPFee)) / 1000] + [(Capacitycool* EFLHcool * (1/SEERBase- 1/SEERee)) / 1000]
Early replacement (non-fuel switch only)414:
ΔkWH for remaining life of existing unit (1st 6 years):
ΔkWh = [Heating Savings] + [Cooling Savings]
= [(Elecheat * Capacityheat * EFLHheat * (1/HSPFExist - 1/HSPFee)) / 1000] + [(Capacitycool* EFLHcool * (1/SEERExist - 1/SEERee)) / 1000]
ΔkWH for remaining measure life (next 12 years):
ΔkWh = [Heating Savings] + [Cooling Savings]
= [(Elecheat * Capacityheat * EFLHheat * (1/HSPFBase - 1/HSPFee)) / 1000] + [(Capacitycool* EFLHcool * (1/SEERBase - 1/SEERee)) / 1000]
Early replacement - fuel switch only :
If measure is supported by gas utility only, ΔkWH = 0
If measure is supported by gas and electric utility or electric utility only, electric utility claim savings calculated below:
ΔkWh for remaining life of existing unit (1st 6 years):
ΔkWh = [Heating Savings from base ASHP to DMSHP] + [Cooling Savings]
= [(Capacityheat * EFLHheat * (1/HSPFASHP - 1/HSPFee)) / 1000] + [(Capacitycool* EFLHcool * (1/SEERExist - 1/SEERee)) / 1000]
ΔkWh for remaining measure life (next 12 years):
ΔkWh = [Heating Savings from base ASHP to DMSHP] + [Cooling Savings]
= [(Capacityheat * EFLHheat * (1/HSPFASHP - 1/HSPFee)) / 1000] + [(Capacitycool* EFLHcool *
414 The two equations are provided to show how savings are determined during the initial phase of the measure (existing to efficient) and the remaining phase (new baseline to efficient). In practice, the screening tools used may either require a First Year savings (using the first equation) and then a “number of years to adjustment” and “savings adjustment” input which would be the (new base to efficient savings)/(existing to efficient savings).
IL TRM v6.0 Vol. 3_January 25th, 2017_DRAFT Page 137 of 296
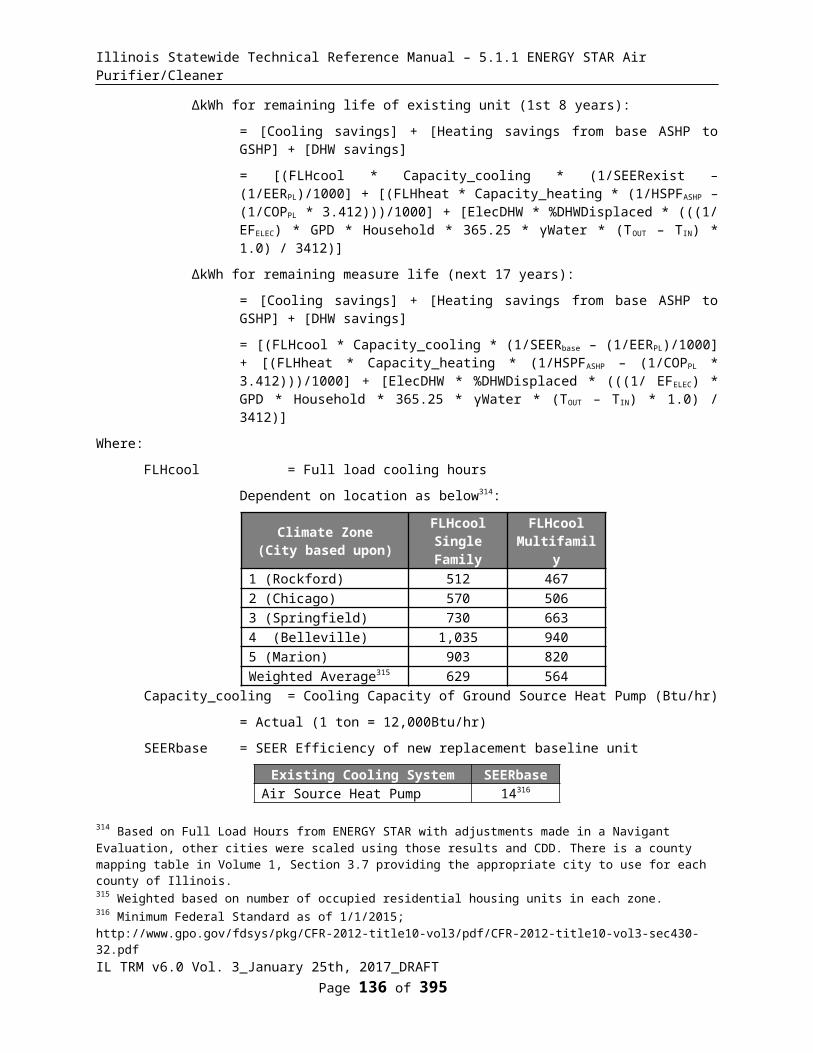
Illinois Statewide Technical Reference Manual – 5.6.5 High Efficiency Pool Pumps
(1/SEERBase - 1/SEERee)) / 1000]
Where:
ElecHeat = 1 if existing building is electrically heated
= 0 if existing building is not electrically heated
Capacityheat = Heating capacity of the ductless heat pump unit in Btu/hr
= Actual
EFLHheat = Equivalent Full Load Hours for heating. Depends on location. See table below
Climate Zone(City based upon) EFLHheat
415
1 (Rockford) 1,5202 (Chicago) 1,4213 (Springfield) 1,3474 (Belleville) 9775 (Marion) 994Weighted Average 1,406
HSPFbase =Heating System Performance Factor of new replacement baseline heating system (kBtu/kWh)
Existing Heating System HSPF_baseAir Source Heat Pump 8.2Electric Resistance 3.41416
HSPFexist = HSPF rating of existing equipment (kbtu/kwh)
= Use actual HSPF rating where it is possible to measure or reasonably estimate. If unknown assume default:
Existing Equipment Type HSPFexist
Electric resistance heating 3.412417
Air Source Heat Pump 5.44418
HSPFASHP =Heating Season Performance Factor for new ASHP baseline unit (for fuel switch)
=8.2 419
HSPFee = HSPF rating of new equipment (kbtu/kwh)
415 All-Electric Homes PY6 Metering Results: Multifamily HVAC Systems, Cadmus, October 2015. FLH values are based on metering of multi-family units that were used as the primary heating source to the whole home, and in buildings that had received weatherization improvements. A DMSHP installed in a single-family home may be used more sporadically, especially if the DMSHP serves only a room, and buildings that have not been weatherized may require longer hours. Additional evaluation is recommended to refine the EFLH assumptions for the general population.416 Electric resistance has a COP of 1.0 which equals 1/0.293 = 3.41 HSPF.417 Electric resistance has a COP of 1.0 which equals 1/0.293 = 3.41 HSPF.418 This is from the ASHP measure which estimated HSPF based on finding the average HSPF/SEER ratio from the AHRI directory data (using the least efficient models – SEER 12 and SEER 13) – 0.596, and applying to the average nameplate SEER rating of all Early Replacement qualifying equipment in Ameren PY3-PY4. This estimation methodology appears to provide a result within 10% of actual HSPF.419 Minimum Federal Standard as of 1/1/2015;http://www.gpo.gov/fdsys/pkg/CFR-2012-title10-vol3/pdf/CFR-2012-title10-vol3-sec430-32.pdf
IL TRM v6.0 Vol. 3_January 25th, 2017_DRAFT Page 138 of 296

Illinois Statewide Technical Reference Manual – 5.6.5 High Efficiency Pool Pumps
= Actual installed
Capacitycool = the cooling capacity of the ductless heat pump unit in Btu/hr420.
= Actual installed
SEERbase = SEER Efficiency of new replacement baseline unit
Existing Cooling System SEERbaseAir Source Heat Pump 14421
Central AC 13422
No central cooling 13423
SEERee = SEER rating of new equipment (kbtu/kwh)
= Actual installed424
SEERexist = SEER rating of existing equipment (kbtu/kwh)
= Use actual value. If unknown, see table below
Existing Cooling System SEER_exist425
Air Source Heat Pump 9.12Central AC 8.60Room AC 8.0426
No existing cooling427 Make ‘1/SEER_exist’ = 0
EFLHcool = Equivalent Full Load Hours for cooling. Depends on location. See table below428.
Climate Zone(City based upon) EFLHcool
1 (Rockford) 3232 (Chicago) 3083 (Springfield) 4684 (Belleville) 6295 (Marion) 549Weighted Average429 364
420 1 Ton = 12 kBtu/hr421 Minimum Federal Standard as of 1/1/2015;http://www.gpo.gov/fdsys/pkg/CFR-2012-title10-vol3/pdf/CFR-2012-title10-vol3-sec430-32.pdf422 Minimum Federal Standard; Federal Register, Vol. 66, No. 14, Monday, January 22, 2001/Rules and Regulations, p. 7170-7200.423 Assumes that the decision to replace existing systems includes desire to add cooling.424 Note that if only an EER rating is available, use the following conversion equation; EER_base = (-0.02 * SEER_base2) + (1.12 * SEER). From Wassmer, M. (2003). A Component-Based Model for Residential Air Conditioner and Heat Pump Energy Calculations. Masters Thesis, University of Colorado at Boulder. 425 Average nameplate efficiencies of all Early Replacement qualifying equipment in Ameren PY3-PY4.426 Estimated by converting the EER assumption using the conversion equation; EER_base = (-0.02 * SEER_base2) + (1.12 * SEER). From Wassmer, M. (2003). ‘A Component-Based Model for Residential Air Conditioner and Heat Pump Energy Calculations’, Masters Thesis, University of Colorado at Boulder. 427 If there is no existing cooling in place but the incentive encourages installation of a new DMSHP with cooling, the added cooling load should be subtracted from any heating benefit. 428 All-Electric Homes PY6 Metering Results: Multifamily HVAC Systems, Cadmus, October 2015. FLH values are based on metering of multi-family units, and in buildings that had received weatherization improvements. Additional evaluation is recommended to refine the EFLH assumptions for the general population.
IL TRM v6.0 Vol. 3_January 25th, 2017_DRAFT Page 139 of 296
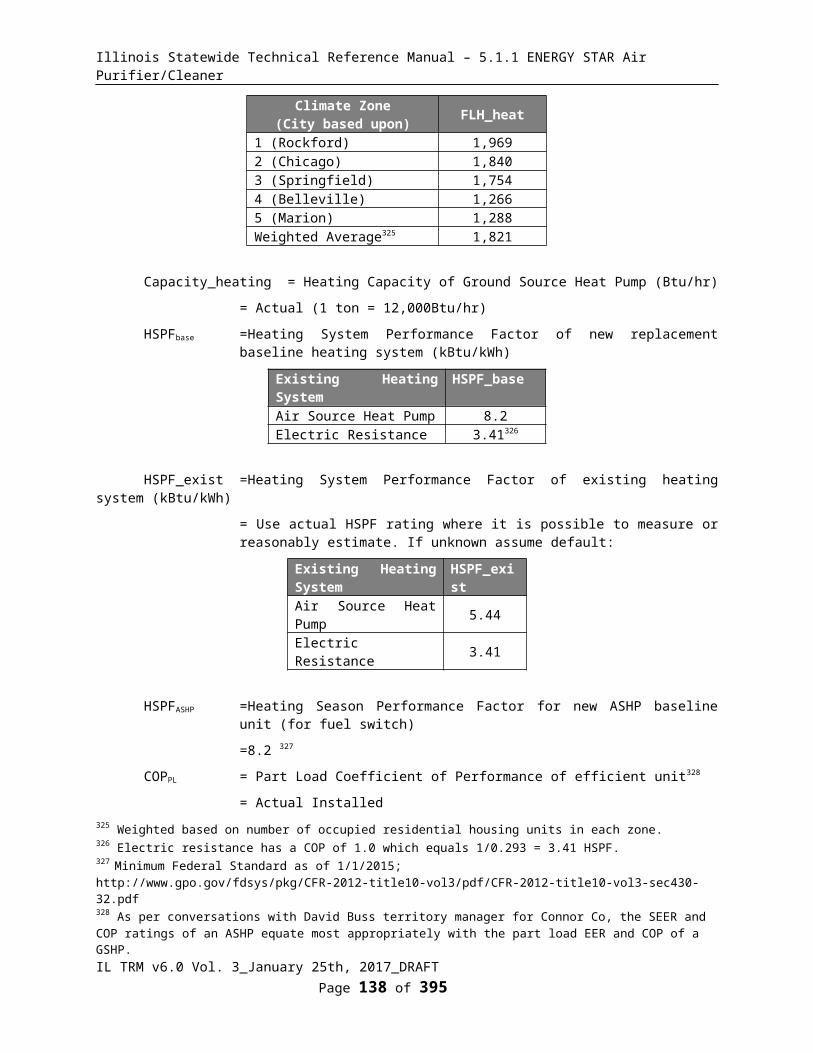
Illinois Statewide Technical Reference Manual – 5.6.5 High Efficiency Pool Pumps
SUMMER COINCIDENT PEAK DEMAND SAVINGS
New Construction and Time of Sale:
ΔkW = (Capacitycool * (1/EERbase - 1/EERee)) / 1000) * CF
Early replacement:
ΔkW for remaining life of existing unit (1st 6 years):
ΔkW = (Capacitycool * (1/EERexist - 1/EERee)) / 1000) * CF
ΔkW for remaining measure life (next 12 years):
ΔkW = (Capacitycool * (1/EERbase - 1/EERee)) / 1000) * CF
Where:
EERbase = EER Efficiency of new replacement unit
Existing Cooling System EER_baseAir Source Heat Pump 11.8430
Central AC 11 431
No central cooling 11432
EERexist = Energy Efficiency Ratio of existing cooling system (kBtu/hr / kW)
= Use actual EER rating where it is possible to measure or reasonably estimate. If EER unknown but SEER available convert using the equation:
EERexist = (-0.02 * SEERexist2) + (1.12 * SEERexist) 433
If SEER rating unavailable use:
Existing Cooling System EER_existAir Source Heat Pump 8.55434
Central AC 8.15435
Room AC 7.7436
429 Weighted based on number of residential occupied housing units in each zone.430 The Federal Standard does not include an EER requirement, so it is approximated with the conversion formula from Wassmer, M. 2003 thesis referenced below.431 Minimum Federal Standard; Federal Register, Vol. 66, No. 14, Monday, January 22, 2001/Rules and Regulations, p. 7170-7200.432 Assumes that the decision to replace existing systems includes desire to add cooling.433 From Wassmer, M. (2003). A Component-Based Model for Residential Air Conditioner and Heat Pump Energy Calculations. Masters Thesis, University of Colorado at Boulder.434 Average nameplate efficiencies of all Early Replacement qualifying equipment in Ameren PY3-PY4.435 Ibid.
IL TRM v6.0 Vol. 3_January 25th, 2017_DRAFT Page 140 of 296
For example, installing a 1.5-ton (heating and cooling capacity) ductless heat pump unit rated at 8 HSPF and 14 SEER in a single-family home in Chicago to displace electric baseboard heat and replace a window air conditioner of unknown efficiency, savings are:
ΔkWhheat = (18000 * 1421 * (1/3.412 – 1/8))/1000 = 4,299 kWh
ΔkWhcool = (18000 * 308 *(1/8.0 – 1/14)) /1000 = 297 kWh
ΔkWh = 4,299 + 297 = 4,596 kWh

Illinois Statewide Technical Reference Manual – 5.6.5 High Efficiency Pool Pumps
Existing Cooling System EER_existNo existing cooling437 Make ‘1/EER_exist’ = 0
EER_ee = Energy Efficiency Ratio of new ductless Air Source Heat Pump (kBtu/hr / kW)
= Actual, If not provided convert SEER to EER using this formula: 438
= (-0.02 * SEER2) + (1.12 * SEER)
For supplemental or limited zonal cooling:
CFSSP = Summer System Peak Coincidence Factor for DMSHP (during utility peak hour)
= 43.1%439
CFPJM = PJM Summer Peak Coincidence Factor for DMSHP (average during PJM peak period)
= 28.0%440
For whole house cooling:
CFSSP = Summer System Peak Coincidence Factor for Heat Pumps (during utility peak hour)
= 72%441
CFPJM = PJM Summer Peak Coincidence Factor for Heat Pumps (average during PJM peak period)
= 46.6%442
NATURAL GAS SAVINGS
New Construction and Time of Sale with baseline gas heat:
If measure is supported by gas utility only, gas utility claim savings calculated below:
ΔTherms = [Heating Savings]
= [Replaced gas consumption – therm equivalent of DMSHP source kWh]
= [(1 – ElecHeat) * ((Gas_Heating_Load/AFUEbase) – (kWhtoTherm * Capacityheat *
EFLHheat * 1/HSPFee)/1000)]
If measure is supported by electric utility only, ΔTherms = 0
If measure is supported by gas and electric utility, gas utility claim savings calculated below, (electric savings is provided in Electric Energy Savings section):
436 Same EER as Window AC recycling. Based on Nexus Market Research Inc, RLW Analytics, December 2005; “Impact, Process, and Market Study of the Connecticut Appliance Retirement Program: Overall Report.”437 If there is no central cooling in place but the incentive encourages installation of a new DMSHP with cooling, the added cooling load should be subtracted from any heating benefit. 438 Based on Wassmer, M. (2003). A Component-Based Model for Residential Air Conditioner and Heat Pump Energy Calculations. Masters Thesis, University of Colorado at Boulder. Note this is appropriate for single speed units only.439 Based on analysis of metering results from 24 heat pumps in Ameren Illinois service territory in PY5 coincident with AIC’s 2010 system peak; ‘Impact and Process Evaluation of Ameren Illinois Company’s Residential HVAC Program (PY5)’.440 Based on analysis of Itron eShape data for Missouri, calibrated to Illinois loads, supplied by Ameren. The average AC load over the PJM peak period (1-5pm, M-F, June through August) is divided by the maximum AC load during the year.441 Based on analysis of metering results from 24 heat pumps in Ameren Illinois service territory in PY5 coincident with AIC’s 2010 system peak; ‘Impact and Process Evaluation of Ameren Illinois Company’s Residential HVAC Program (PY5)’. http://www.icc.illinois.gov/downloads/public/edocket/368522.pdf442 Based on analysis of Itron eShape data for Missouri, calibrated to Illinois loads, supplied by Ameren. The average AC load over the PJM peak period (1-5pm, M-F, June through August) is divided by the maximum AC load during the year.
IL TRM v6.0 Vol. 3_January 25th, 2017_DRAFT Page 141 of 296

Illinois Statewide Technical Reference Manual – 5.6.5 High Efficiency Pool Pumps
ΔTherms = [Heating Savings]
= [Replaced gas consumption – therm equivalent of base ASHP source kWh]
= [(1 – ElecHeat) * ((Gas_Heating_Load/AFUEbase) – (kWhtoTherm * Capacityheat *
EFLHheat * 1/HSPFASHP)/1000)]
Early replacement for homes with existing gas heat:
If measure is supported by gas utility only, gas utility claim savings calculated below:
ΔTherms for remaining life of existing unit (1st 6 years):
= [Heating Savings]
= [Replaced gas consumption – therm equivalent of DMSHP source kWh]
= [(1 – ElecHeat) * ((Gas_Heating_Load/AFUEexist) – (kWhtoTherm * Capacityheat *
EFLHheat * 1/HSPFee)/1000)]
ΔTherms for remaining measure life (next 12 years):
= [(1 – ElecHeat) * ((Gas_Heating_Load/AFUEbaseER) – (kWhtoTherm * Capacityheat *
EFLHheat * 1/HSPFee)/1000)]
If measure is supported by electric utility only, ΔTherms = 0
If measure is supported by gas and electric utility, gas utility claim savings calculated below:
ΔTherms for remaining life of existing unit (1st 6 years):
ΔTherms = [Heating Savings]
= [Replaced gas consumption – therm equivalent of base ASHP source kWh]
= [(1 – ElecHeat) * ((Gas_Heating_Load/AFUEexist) – (kWhtoTherm * Capacityheat *
EFLHheat * 1/HSPFASHP)/1000)]
ΔTherms for remaining measure life (next 12 years):
= [(1 – ElecHeat) * ((Gas_Heating_Load/AFUEbaseER) – (kWhtoTherm * Capacityheat *
EFLHheat * 1/HSPFASHP)/1000)]
Where:
ElecHeat = 1 if existing building is electrically heated
= 0 if existing building is not electrically heated
Gas_Heating_Load
= Estimate of annual household heating load 443 for gas furnace heated single-family homes. If location is unknown, assume the average below.
= Actual if informed by site-specific load calculations, ACCA Manual J or equivalent444.
443 Heating load is used to describe the household heating need, which is equal to (gas consumption * AFUE )444 The Air Conditioning Contractors of America Manual J, Residential Load Calculation 8th Edition produces equipment sizing loads for Single Family, Multi-single, and Condominiums using input characteristics of the home. A best practice for equipment selection and installation of Heating and Air Conditioning, load calculations are commonly completed by contractors during the selection process and may be readily available for program data purposes.
IL TRM v6.0 Vol. 3_January 25th, 2017_DRAFT Page 142 of 296

Illinois Statewide Technical Reference Manual – 5.6.5 High Efficiency Pool Pumps
Climate Zone(City based upon)
Gas_Heating_Load if Furnace (therms) 445
Gas_Heating_Load if Boiler (therms) 446
1 (Rockford) 873 12752 (Chicago) 834 1218
3 (Springfield) 714 10434 (Belleville) 551 8055 (Marion) 561 819
Average 793 1158
AFUEbase = Baseline Annual Fuel Utilization Efficiency Rating
= 80% if furnace and 82% if boiler.
AFUEexist = Existing Annual Fuel Utilization Efficiency Rating
= Use actual AFUE rating where it is possible to measure or reasonably estimate.
If unknown, assume 64.4% if furnace and 61.6% 447 if boiler.
AFUEbaseER = Baseline Annual Fuel Utilization Efficiency Rating for early replacement measure
= 90%448 if furnace and 82% if boiler.
kWhtoTherm = Converts source kWh to Therms
= Hgrid / 100000
Hgrid = Heat rate of the grid in btu/kWh based on the average fossil heat rate for the EPA eGRID subregion and includes a factor that takes into account T&D losses.
For systems operating less than 6,500 hrs per year:
Use the Non-baseload heat rate provided by EPA eGRID for RFC West region for ComEd territory (including independent providers connected to RFC West), and SERC Midwest region for Ameren territory (including independent providers connected to SERC Midwest)449. Also include any line losses.
For systems operating more than 6,500 hrs per year:
Use the All Fossil Average heat rate provided by EPA eGRID for RFC West region 445 Values are based on household heating consumption values and inferred average AFUE results from Table 2-1, Energy Efficiency / Demand Response Nicor Gas Plan Year 1 (6/1/2011-5/31/2012) Research Report: Furnace Metering Study (August 1, 2013) (prepared by Navigant Consulting, Inc.) and adjusting to a statewide average using relative HDD values to adjust for the evaluation results focus on northern region. Values for individual cities are then calculated by comparing average HDD to the individual city’s HDD.446 Boiler consumption values are informed by an evaluation which did not identify any fraction of heating load due to domestic hot water (DHW) provided by the boiler. Thus these values are an average of both homes with boilers only providing heat, and homes with boilers that also provide DHW. Values are based on household heating consumption values and inferred average AFUE results from Table 3-4, Program Sample Analysis, Nicor R29 Res Rebate Evaluation Report 092611_REV FINAL to Nicor). Adjusting to a statewide average using relative HDD values to adjust for the evaluation results focus on northern region. Values for individual cities are then calculated by comparing average HDD to the individual city’s HDD.447 Average nameplate efficiencies of all Early Replacement qualifying equipment in Ameren PY3-PY4.448 Assumes that Federal Standard will have been increased to 90% by the time the existing unit would have to have been replaced.449 These values are subject to regular updates so should be reviewed regularly to ensure the current assumptions are correct. Refer to the latest EPA eGRID data. Current values, based on eGrid 2014 are:
- Non-Baseload RFC West: 9,346 Btu/kWh * (1 + Line Losses)- Non-Baseload SERC Midwest: 9,157 Btu/kWh * (1 + Line Losses)- All Fossil Average RFC West: 9,931 Btu/kWh * (1 + Line Losses)- All Fossil Average SERC Midwest: 10,209 Btu/kWh * (1 + Line Losses)
IL TRM v6.0 Vol. 3_January 25th, 2017_DRAFT Page 143 of 296
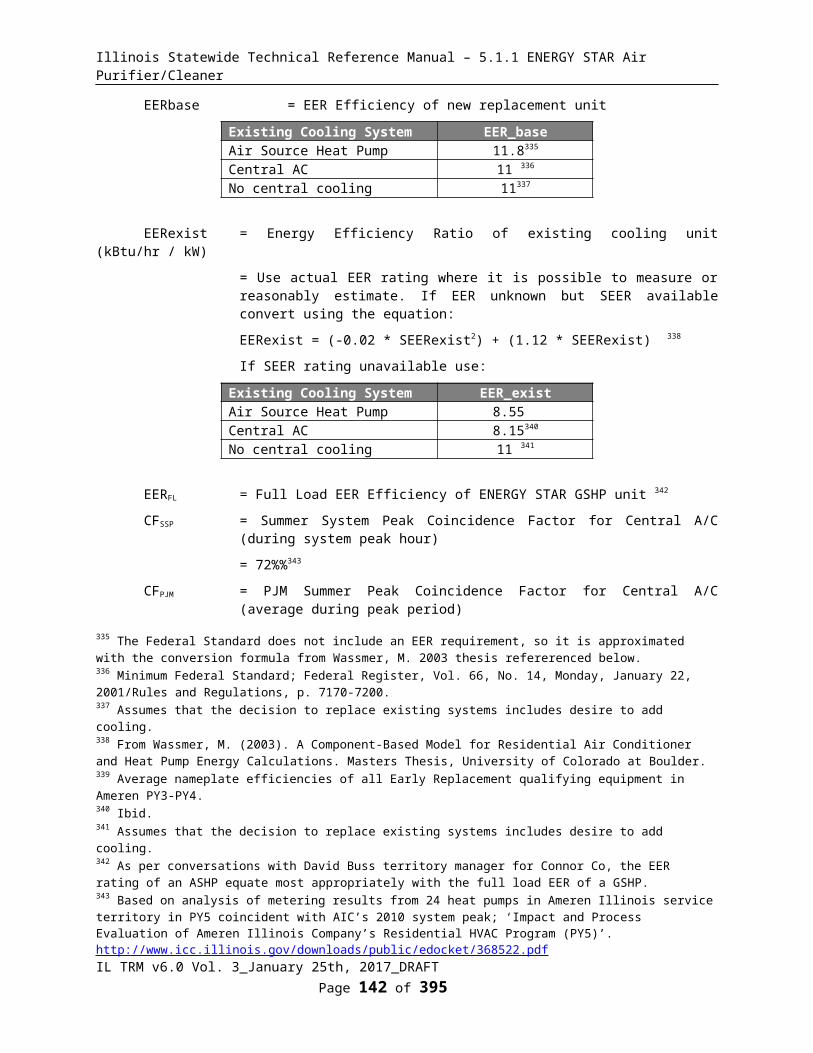
Illinois Statewide Technical Reference Manual – 5.6.5 High Efficiency Pool Pumps
for ComEd territory, and SERC Midwest region for Ameren territory. Also include any line losses.
All other variables provided above
WATER IMPACT DESCRIPTIONS AND CALCULATION
N/A
DEEMED O&M COST ADJUSTMENT CALCULATION
N/A
COST EFFECTIVENESS SCREENING AND LOAD REDUCTION FORECASTING WHEN FUEL SWITCHING
This measure can involve fuel switching from gas to electric.
For the purposes of forecasting load reductions due to fuel switch DMSHP projects per Section 16-111.5B, changes in site energy use at the customer’s meter (using ΔkWh algorithm below) adjusted for utility line losses (at-the-busbar savings), customer switching estimates, NTG, and any other adjustment factors deemed appropriate, should be used.
The inputs to cost effectiveness screening should reflect the actual impacts on the electric and fuel consumption at the customer meter and, for fuel switching measures, this will not match the output of the calculation/allocation methodology presented in the “Electric Energy Savings” and “Natural Gas Savings” sections above. Therefore in addition to the calculation of savings claimed, the following values should be used to assess the cost effectiveness of the measure.
ΔTherms = [Heating Consumption Replaced450]
= [(1 – ElecHeat) * ((Gas_Heating_Load/AFUEbase)]
ΔkWh = - [DMSHP heating consumption] + [Cooling savings451]
= - [(Capacityheat * EFLHheat * 1/HSPFee)/1000] + [(Capacitycool* EFLHcool * (1/SEERBase- 1/SEERee)) / 1000]
MEASURE CODE: RS-HVC-DHP-V05-180101
REVIEW DEADLINE: 1/1/2020
450 Note AFUEbase in the algorithm should be replaced with AFUEexist for early replacement measures.451 Note SEERbase in the algorithm should be replaced with SEERexist for early replacement measures.
IL TRM v6.0 Vol. 3_January 25th, 2017_DRAFT Page 144 of 296

Illinois Statewide Technical Reference Manual – 5.6.5 High Efficiency Pool Pumps
5.3.13 Residential Furnace Tune-Up
DESCRIPTION
This measure is for a natural gas Residential furnace that provides space heating. The tune-up will improve furnace performance by inspecting, cleaning and adjusting the furnace and appurtenances for correct and efficient operation. Additional savings maybe realized through a complete system tune-up.
Two savings algorithms are provided for tune-up programs: through the HVAC SAVE program and for other tune-up programs, the difference being how relative efficiencies are measured.
This measure was developed to be applicable to the following program types: RF.
If applied to other program types, the measure savings should be verified.
DEFINITION OF EFFICIENT EQUIPMENT
To qualify for this measure an approved technician must complete the tune-up requirements452 listed below:
• Measure combustion efficiency using an electronic flue gas analyzer• Check and clean blower assembly and components per manufacturer’s recommendations• Where applicable Lubricate motor and inspect and replace fan belt if required• Inspect for gas leaks• Clean burner per manufacturer’s recommendations and adjust as needed• Check ignition system and safety systems and clean and adjust as needed • Check and clean heat exchanger per manufacturer’s recommendations• Inspect exhaust/flue for proper attachment and operation• Inspect control box, wiring and controls for proper connections and performance• Check air filter and clean or replace per manufacturer’s• Inspect duct work connected to furnace for leaks or blockages• Measure temperature rise and adjust flow as needed• Check for correct line and load volts/amps• Check thermostat operation is per manufacturer’s recommendations(if adjustments made, refer to
‘Residential Programmable Thermostat’ measure for savings estimate)• Perform Carbon Monoxide test and adjust heating system until results are within standard industry
acceptable limits
Verified Quality Maintenance:
This approach uses in-field measurement and interpretation of static pressures, identification and plotting of airflow, airflow measurement, temperature measurement and diagnostics, pressure measurements and duct design, and BTU measurement to ensure that existing equipment is operating according to manufacturers’ published potential performance. Installed equipment operating efficiency is largely dependent on the efficiency rating of the equipment, the skill of the installation contractor, the degree to which the equipment has aged or drifted from initial settings, and the system level constraints. When one or more of these key dependencies are operating sub-optimally, the overall efficiency of the equipment is degraded. A Verified Quality Maintenance identifies sub-optimal performance and prescribes a solution during furnace tune ups.
The HVAC SAVE program has its own certifications and requirements. In addition to the maintenance described above, the following are key activities that are provided through an HVAC SAVE Verified Quality Maintenance visit453:
Measure pressure drops at return, filter, coil and supply. Determine equipment air flow using OEM blower data or measuring. Measure temperature rise across heat exchanger.
452 American Standard Maintenance for Indoor Units: http://www.americanstandardair.com/owner-support/maintenance.html453 As provided in ANSI approved ACCA 4 specification for Quality Maintenance
IL TRM v6.0 Vol. 3_January 25th, 2017_DRAFT Page 145 of 296

Illinois Statewide Technical Reference Manual – 5.6.5 High Efficiency Pool Pumps
Determine on-rate for a furnace by clocking the gas meter. Record outdoor temperature & elevation, and complete test-in. Clean evaporator coil to OEM pressure drop specification. Clean/replace/modify air filter to OEM pressure drop specification. Reset air flow based on up design parameter and updated pressure conditions. Adjust/modify gas pressure and venting to OEM specifications. Complete final test-out, compare before and after
DEFINITION OF BASELINE EQUIPMENT
The baseline is furnace assumed not to have had a tune-up in the past 2 years.
HVAC SAVE tune-ups are a one-time measure and cannot be performed more than once on the same piece of equipment.
DEEMED LIFETIME OF EFFICIENT EQUIPMENT
The measure life for the tune up is 2 years.454
An HVAC SAVE tune-up lasts the remaining life of the equipment because they come from adjustments to fans and ducts that remain effective through normal operation of the equipment. Assume 10 years.
DEEMED MEASURE COST
The incremental cost for this measure should be the actual cost of tune up.
DEEMED O&M COST ADJUSTMENTS
There are no expected O&M savings associated with this measure.
LOADSHAPE
Loadshape R09 - Residential Electric Space Heat
COINCIDENCE FACTOR
N/A
Algorithms
CALCULATION OF ENERGY SAVINGS
ELECTRIC ENERGY SAVINGS
ΔkWh = ΔTherms * Fe * 29.3
Where:
ΔTherms = as calculated below
Fe = Furnace Fan energy consumption as a percentage of annual fuel consumption
= 3.14%455
454Act on Energy Commercial Technical Reference Manual No. 2010-4, 9.2.3 Gas Forced-Air Furnace Tune-up.455 Fe is not one of the AHRI certified ratings provided for residential furnaces, but can be reasonably estimated from a calculation based on the certified values for fuel energy (Ef in MMBtu/yr) and Eae (kWh/yr). An average of a 300 record sample (non-random) out of 1495 was 3.14%. This is, appropriately, ~50% greater than the Energy Star version 3 criteria for 2% Fe. See
IL TRM v6.0 Vol. 3_January 25th, 2017_DRAFT Page 146 of 296

Illinois Statewide Technical Reference Manual – 5.6.5 High Efficiency Pool Pumps
29.3 = kWh per therm
SUMMER COINCIDENT PEAK DEMAND SAVINGS
N/A
NATURAL GAS SAVINGS
1. Verified Quality Maintenance:
ΔTherms =( Gas_Furnace_Heating_Load * HF * (1 /(AFUE * (1 - Deratingpre)) – 1/(AFUE * (1 – Deratingpost) )
Where:
Gas_Furnace_Heating_Load = Estimate of annual household heating load456 for gas furnace heated single-family homes. If location is unknown, assume the average below457.
= Actual if informed by site-specific load calculations, ACCA Manual J or equivalent458.
Climate Zone(City based upon)
Gas_Furnace_Heating_Load (therms)
1 (Rockford) 8732 (Chicago) 8343 (Springfield) 7144 (Belleville) 5515 (Marion) 561Average 793
HF = Household factor, to adjust heating consumption for non-single-family households.
Household Type HFSingle-Family 100%Multi-Family 65%459
Actual Custom460
AFUE = Furnace Annual Fuel Utilization Efficiency Rating
= Actual
Deratingpre = Furnace AFUE Derating before HVAC SAVE tune-up
= 6.4%461
“Programmable Thermostats Furnace Fan Analysis.xlsx” for reference.456Heating load is used to describe the household heating need, which is equal to (gas consumption * AFUE ) 457 Values are based on household heating consumption values and inferred average AFUE results from Table 2-1, Energy Efficiency / Demand Response Nicor Gas Plan Year 1 (6/1/2011-5/31/2012) Research Report: Furnace Metering Study (August 1, 2013) (prepared by Navigant Consulting, Inc.) and adjusting to a statewide average using relative HDD values to adjust for the evaluation results focus on northern region. Values for individual cities are then calculated by comparing average HDD to the individual city’s HDD.458 The Air Conditioning Contractors of America Manual J, Residential Load Calculation 8th Edition produces equipment sizing loads for Single Family, Multi-single, and Condominiums using input characteristics of the home.459 Multifamily household heating consumption relative to single-family households is affected by overall household square footage and exposure to the exterior. This 65% factor is applied to MF homes, based on professional judgment that average household size, and heat loads of MF households are smaller than single-family homes460 Program-specific household factors may be utilized on the basis of sufficiently validated program evaluations.
IL TRM v6.0 Vol. 3_January 25th, 2017_DRAFT Page 147 of 296

Illinois Statewide Technical Reference Manual – 5.6.5 High Efficiency Pool Pumps
Deratingpost = Furnace AFUE Derating after HVAC SAVE tune-up
= 0%
2. Other Tune-Up Programs:
ΔTherms =(Gas_Furnace_Heating_Load *HF * (1/ Effbefore – 1/ (Effbefore + Ei)))
Where:
Gas_Furnace_Heating_Load = Estimate of annual household heating load462 for gas furnace heated single-family homes. If location is unknown, assume the average below463.
= Actual if informed by site-specific load calculations, ACCA Manual J or equivalent464.
Climate Zone(City based upon)
Gas_Furnace_Heating_Load (therms)
1 (Rockford) 8732 (Chicago) 8343 (Springfield) 7144 (Belleville) 5515 (Marion) 561Average 793
HF = Household factor, to adjust heating consumption for non-single-family households.
Household Type HFSingle-Family 100%Multi-Family 65%465
Actual Custom466
Effbefore = Efficiency of the furnace before the tune-up
= Actual
Note: Contractors should select a mid-level firing rate that appropriately represents the average building operating condition over the course of the heating season and take readings at a consistent firing rate for pre and post tune-up.
EI = Efficiency Improvement of the furnace tune-up measure
= Actual
461 Based on findings from Building America, US Department of Energy, Brand, Yee and Baker “Improving Gas Furnace Performance: A Field and Laboratory Study at End of Life”, February 2015. 462Heating load is used to describe the household heating need, which is equal to (gas consumption * AFUE ) 463 Values are based on household heating consumption values and inferred average AFUE results from Table 2-1, Energy Efficiency / Demand Response Nicor Gas Plan Year 1 (6/1/2011-5/31/2012) Research Report: Furnace Metering Study (August 1, 2013) (prepared by Navigant Consulting, Inc.) and adjusting to a statewide average using relative HDD values to adjust for the evaluation results focus on northern region. Values for individual cities are then calculated by comparing average HDD to the individual city’s HDD.464 The Air Conditioning Contractors of America Manual J, Residential Load Calculation 8th Edition produces equipment sizing loads for Single Family, Multi-single, and Condominiums using input characteristics of the home.465 Multifamily household heating consumption relative to single-family households is affected by overall household square footage and exposure to the exterior. This 65% factor is applied to MF homes, based on professional judgment that average household size, and heat loads of MF households are smaller than single-family homes466 Program-specific household factors may be utilized on the basis of sufficiently validated program evaluations.
IL TRM v6.0 Vol. 3_January 25th, 2017_DRAFT Page 148 of 296

Illinois Statewide Technical Reference Manual – 5.6.5 High Efficiency Pool Pumps
WATER IMPACT DESCRIPTIONS AND CALCULATION
N/A
DEEMED O&M COST ADJUSTMENT CALCULATION
N/A
MEASURE CODE: RS-HVC-FTUN-V03-180101
REVIEW DEADLINE: 1/1/2021
IL TRM v6.0 Vol. 3_January 25th, 2017_DRAFT Page 149 of 296

Illinois Statewide Technical Reference Manual – 5.6.5 High Efficiency Pool Pumps
5.3.14 Boiler Reset Controls
DESCRIPTION
This measure relates to improving system efficiency by adding controls to residential heating boilers to vary the boiler entering water temperature relative to heating load as a function of the outdoor air temperature to save energy. The water can be run a little cooler during fall and spring, and a little hotter during the coldest parts of the winter. A boiler reset control has two temperature sensors - one outside the house and one in the boiler water. As the outdoor temperature goes up and down, the control adjusts the water temperature setting to the lowest setting that is meeting the house heating demand. There are also limits in the controls to keep a boiler from operating outside of its safe performance range.467
This measure was developed to be applicable to the following program types: RF.
DEFINITION OF EFFICIENT EQUIPMENT
Natural gas single family residential customer adding boiler reset controls capable of resetting the boiler supply water temperature in an inverse fashion with outdoor air temperature. The system must be set so that the minimum temperature is not more than 10 degrees above manufacturer’s recommended minimum return temperature. This boiler reset measure is limited to existing condensing boilers serving a single family residence. Boiler reset controls for non-condensing boilers in single family residences should be implemented as a custom measure, and the cost-effectiveness should be confirmed.
DEFINITION OF BASELINE EQUIPMENT
Existing condensing boiler in a single family residential setting without boiler reset controls.
DEEMED LIFETIME OF EFFICIENT EQUIPMENT
The life of this measure is 20 years468
DEEMED MEASURE COST
The cost of this measure is $612469
LOADSHAPE
NA
COINCIDENCE FACTOR
N/A
467 Energy Solutions Center, a consortium of natural gas utilities, equipment manufacturers and vendors. Boiler Reset Control, accessed at http://naturalgasefficiency.org/residential/Boiler_Reset_Control.htm468CLEAResultreferences the Brooklyn Union Gas Company, High Efficiency Heating and Water and Controls, Gas Energy Efficiency Program Implementation Plan.469 Nexant. Questar DSM Market Characterization Report. August 9, 2006.
IL TRM v6.0 Vol. 3_January 25th, 2017_DRAFT Page 150 of 296

Illinois Statewide Technical Reference Manual – 5.6.5 High Efficiency Pool Pumps
Algorithm
CALCULATION OF ENERGY SAVINGS
ELECTRIC ENERGY SAVINGS
N/A
SUMMER COINCIDENT PEAK DEMAND SAVINGS
NA
NATURAL GAS SAVINGS
ΔTherms = Gas_Boiler_Load * (1/AFUE) * Savings Factor
Where:
Gas_Boiler_Load470
= Estimate of annual household Load for gas boiler heated single-family homes. If location is unknown, assume the average below471.
= or Actual if informed by site-specific load calculations, ACCA Manual J or equivalent472.
Climate Zone(City based upon)
Gas_Boiler Load(therms)
1 (Rockford) 12752 (Chicago) 12183 (Springfield) 10434 (Belleville) 8055 (Marion) 819Average 1158
AFUE = Existing Condensing Boiler Annual Fuel Utilization Efficiency Rating
= Actual.
SF = Savings Factor, 5%473
470 Boiler consumption values are informed by an evaluation which did not identify any fraction of heating load due to domestic hot water (DHW) provided by the boiler. Thus these values are an average of both homes with boilers only providing heat, and homes with boilers that also provide DHW. Heating load is used to describe the household heating need, which is equal to (gas heating consumption * AFUE )471 Values are based on household heating consumption values and inferred average AFUE results from Table 3-4, Program Sample Analysis, Nicor R29 Res Rebate Evaluation Report 092611_REV FINAL to Nicor). Adjusting to a statewide average using relative HDD values to adjust for the evaluation results focus on northern region. Values for individual cities are then calculated by comparing average HDD to the individual city’s HDD.472 The Air Conditioning Contractors of America Manual J, Residential Load Calculation 8th Edition produces equipment sizing loads for Single Family, Multi-single, and Condominiums using input characteristics of the home. A best practice for equipment selection and installation of Heating and Air Conditioning, load calculations should be completed by contractors during the selection process and may be readily available for program data purposes.473 Energy Solutions Center, a consortium of natural gas utilities, equipment manufacturers and vendors. Boiler Reset Control, accessed at http://naturalgasefficiency.org/residential/Boiler_Reset_Control.htm
IL TRM v6.0 Vol. 3_January 25th, 2017_DRAFT Page 151 of 296

Illinois Statewide Technical Reference Manual – 5.6.5 High Efficiency Pool Pumps
WATER IMPACT DESCRIPTIONS AND CALCULATION
N/A
DEEMED O&M COST ADJUSTMENT CALCULATION
N/A
MEASURE CODE: RS-HVC-BREC-V01-150601
REVIEW DEADLINE: 1/1/2021
IL TRM v6.0 Vol. 3_January 25th, 2017_DRAFT Page 152 of 296
EXAMPLE
For example, boiler reset controls on a 92.5 AFUE boiler at a household in Rockford, IL
ΔTherms = 1275 * (1/0.925) * 0.05
= 69 Therms
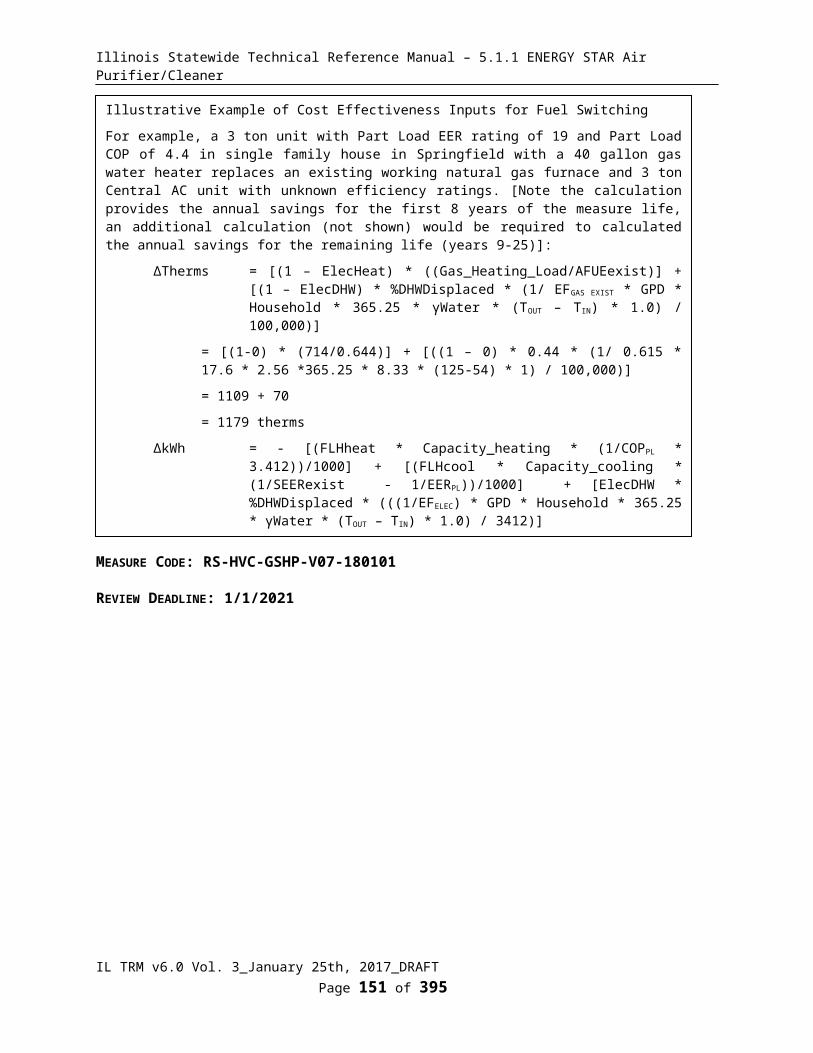
Illinois Statewide Technical Reference Manual – 5.6.5 High Efficiency Pool Pumps
5.3.15 ENERGY STAR Ceiling Fan
DESCRIPTION
A ceiling fan/light unit meeting the efficiency specifications of ENERGY STAR is installed in place of a model meeting the federal standard. ENERGY STAR qualified ceiling fan/light combination units are over 60% more efficient than conventional fan/light units, and use improved motors and blade designs474.
Due to the savings from this measure being derived from more efficient ventilation and more efficient lighting, and the loadshape and measure life for each component being very different, the savings are split in to the component parts and should be claimed together. Lighting savings should be estimated utilizing the 5.5.1 ENERGY STAR Compact Fluorescent Lamp measure.
This measure was developed to be applicable to the following program types: TOS, NC, RF.
If applied to other program types, the measure savings should be verified.
DEFINITION OF EFFICIENT EQUIPMENT
The efficient equipment is defined as an ENERGY STAR certified ceiling fan with integral CFL bulbs.
DEFINITION OF BASELINE EQUIPMENT
The baseline equipment is assumed to be a standard fan with efficient incandescent or halogen light bulbs. Production of 100W, standard efficacy incandescent lamps ended in 2012 followed by restrictions on 75W in 2013 and 60W and 40W in 2014, due to the Energy Independence and Security Act of 2007 (EISA). Finally, a provision in the EISA regulations requires that by January 1, 2020, all lamps meet efficiency criteria of at least 45 lumens per watt, in essence making the baseline equivalent to a current day CFL. Therefore the measure life (number of years that savings should be claimed) for the lighting portion of the savings should be reduced once the assumed lifetime of the bulb exceeds 2020. Due to expected delay in clearing retail inventory and to account for the operating life of a halogen incandescent potentially spanning over 2020, this shift is assumed not to occur until 2021.
DEEMED LIFETIME OF EFFICIENT EQUIPMENT
The fan savings measure life is assumed to be 10 years.2
The lighting savings measure life is assumed to be 3 years for lighting savings for units installed in 2018, and then for every subsequent year should be reduced by one year475 (see 5.5.1 ENERGY STAR Compact Fluorescent Lamp measure).
DEEMED MEASURE COST
Incremental cost of unit is $46.476
LOADSHAPE
R06 - Residential Indoor Lighting
R11 - Residential Ventilation
474 http://www.energystar.gov/products/certified-products/detail/ceiling-fans475 Since the replacement baseline bulb from 2020 on will be equivalent to a CFL, no additional savings should be claimed from that point. Due to expected delay in clearing stock from retail outlets and to account for the operating life of a halogen incandescent potentially spanning over 2020, this shift is assumed not to occur until 2021.476 ENERGY STAR Ceiling Fan Savings Calculatorhttp://www.energystar.gov/buildings/sites/default/uploads/files/light_fixture_ceiling_fan_calculator.xlsx?8178-e52c
IL TRM v6.0 Vol. 3_January 25th, 2017_DRAFT Page 153 of 296

Illinois Statewide Technical Reference Manual – 5.6.5 High Efficiency Pool Pumps
COINCIDENCE FACTOR
The summer peak coincidence factor for the ventilation savings is assumed to be 30%.477
For lighting savings, see 5.5.1 ENERGY STAR Compact Fluorescent Lamp measure.
Algorithm
CALCULATION OF SAVINGS
ELECTRIC ENERGY SAVINGS
∆kWh = ΔkWhfan + ΔkWhLight
∆kWhfan = [Days * FanHours * ((%Lowbase * WattsLowbase) + (%Medbase * WattsMedbase) + (%Highbase
* WattsHighbase))/1000 ] - [Days * FanHours * ((%LowES * WattsLowES) + (%MedES * WattsMedES) + (%HighES * WattsHighES))/1000]
∆kWhlight = see 5.5.1 ENERGY STAR Compact Fluorescent Lamp measure.
Where478:
Days = Days used per year
= Actual. If unknown use 365.25 days/year
FanHours = Daily Fan “On Hours”
= Actual. If unknown use 3 hours
%Lowbase = Percent of time spent at Low speed of baseline
= 40%
WattsLowbase = Fan wattage at Low speed of baseline
= Actual. If unknown use 15 watts
%Medbase = Percent of time spent at Medium speed of baseline
= 40%
WattsMedbase = Fan wattage at Medium speed of baseline
= Actual. If unknown use 34 watts
%Highbase = Percent of time spent at High speed of baseline
= 20%
WattsHighbase = Fan wattage at High speed of baseline
= Actual. If unknown use 67 watts
%LowES = Percent of time spent at Low speed of ENERGY STAR
= 40%
477 Assuming that the CF same as a Room AC. Consistent with coincidence factors found in: RLW Report: Final Report Coincidence Factor Study Residential Room Air Conditioners, June 23, 2008 (http://www.puc.nh.gov/Electric/Monitoring%20and%20Evaluation%20Reports/National%20Grid/117_RLW_CF%20Res%20RAC.pdf) 478 All fan default assumptions are based upon assumptions provided in the ENERGY STAR Ceiling Fan Savings Calculator;http://www.energystar.gov/buildings/sites/default/uploads/files/light_fixture_ceiling_fan_calculator.xlsx?8178-e52c
IL TRM v6.0 Vol. 3_January 25th, 2017_DRAFT Page 154 of 296
Illinois Statewide Technical Reference Manual – 5.6.5 High Efficiency Pool Pumps
WattsLowES = Fan wattage at Low speed of ENERGY STAR
= Actual. If unknown use 6 watts
%MedES = Percent of time spent at Medium speed of ENERGY STAR
= 40%
WattsMedES = Fan wattage at Medium speed of ENERGY STAR
= Actual. If unknown use 23 watts
%HighES = Percent of time spent at High speed of ENERGY STAR
= 20%
WattsHighES = Fan wattage at High speed of ENERGY STAR
= Actual. If unknown use 56 watts
For ease of reference, the fan assumptions are provided below in table form:
Low Speed Medium Speed High SpeedPercent of Time at Given Speed 40% 40% 20%Conventional Unit Wattage 15 34 67ENERGY STAR Unit Wattage 6 23 56∆W 9 11 11
If the lighting WattsBase and WattsEE is unknown, assume the following
WattsBase = 3 x 43 = 129 W
WattsEE = 1 x 42 = 42 W
Using the default assumptions provided above, the deemed savings is 81.2 kWh.
SUMMER COINCIDENT PEAK DEMAND SAVINGS
ΔkW = ΔkWFan + ΔkWlight
ΔkWFan = ((WattsHighbase - WattsHighES)/1000) * CFfan
ΔkWLight = see 5.5.1 ENERGY STAR Compact Fluorescent Lamp measure.
IL TRM v6.0 Vol. 3_January 25th, 2017_DRAFT Page 155 of 296
EXAMPLE
For example, a ceiling fan with three 43W bulb light fixtures, replaced with an ES ceiling fan with one 42W bulb light fixture, the savings are:
ΔkWhfan = [365.25*3*((0.4*15)+(0.4*34)+(0.2*67))/1000] – [365.25*3*((0.4*6)+(0.4*23)+(0.2*56))/1000]
= 36.2 – 25.0 = 11.2 kWh
ΔkWhlight =((129 – 42)/1000) *759 * 1.06
= 70.0 kWh
ΔkWh = 11.2 + 70
=81.2 kWh
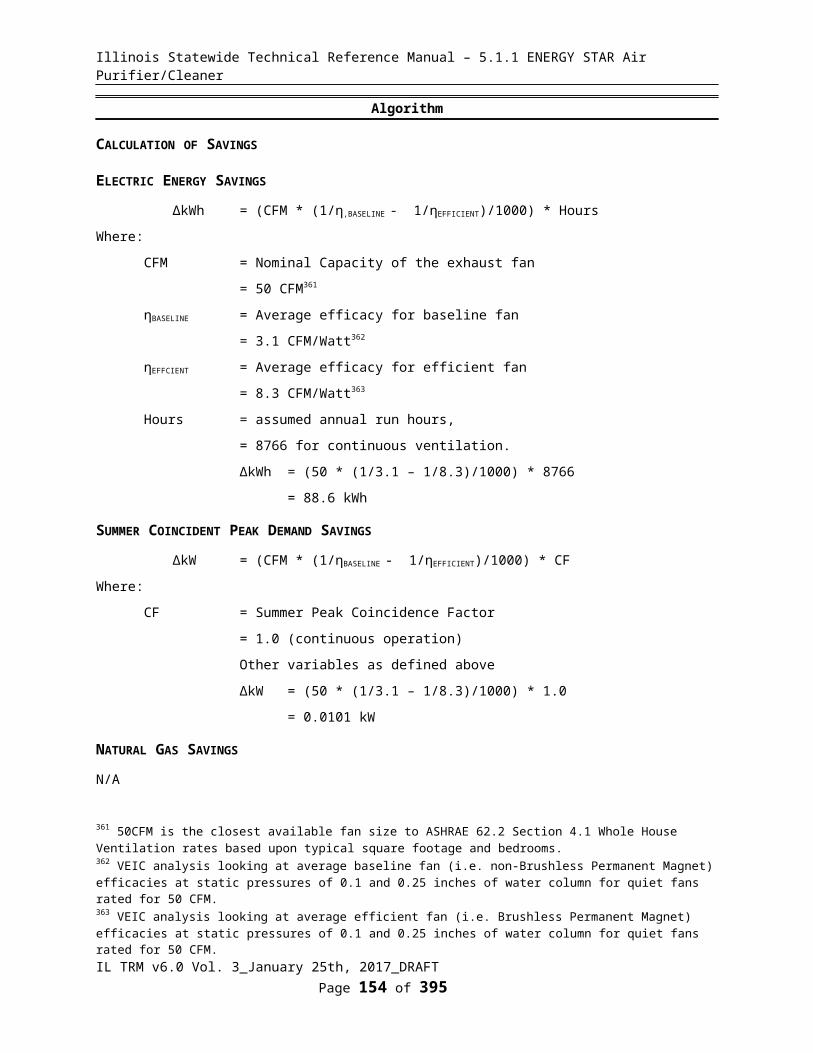
Illinois Statewide Technical Reference Manual – 5.6.5 High Efficiency Pool Pumps
Where:
CFfan = Summer Peak coincidence factor for ventilation savings
= 30%479
CFlight = Summer Peak coincidence factor for lighting savings
= 7.1%480
Using the default assumptions provided above, the deemed savings is 0.010kW.
NATURAL GAS SAVINGS
N/A
WATER IMPACT DESCRIPTIONS AND CALCULATION
N/A
DEEMED O&M COST ADJUSTMENT CALCULATION
See 5.5.1 ENERGY STAR Compact Fluorescent Lamp measure for bulb replacement costs.
MEASURE CODE: RS-HVC-CFAN-V02-180101
REVIEW DEADLINE: 1/1/2022
479 Assuming that the CF same as a Room AC. Consistent with coincidence factors found in: RLW Report: Final Report Coincidence Factor Study Residential Room Air Conditioners, June 23, 2008 (http://www.puc.nh.gov/Electric/Monitoring%20and%20Evaluation%20Reports/National%20Grid/117_RLW_CF%20Res%20RAC.pdf) 480 Based on lighting logger study conducted as part of the PY5/6 ComEd Residential Lighting Program evaluation.
IL TRM v6.0 Vol. 3_January 25th, 2017_DRAFT Page 156 of 296
EXAMPLE
For example a ceiling fan with three 43W bulb light fixtures, replaced with an ES ceiling fan with one 42W bulb light fixture, the savings are:
ΔkWfan = ((67-56)/1000) * 0.3
=0.0033 kW
ΔkWlight =((129 – 42)/1000) * 1.11 * 0.071
= 0.0068 kW
ΔkW = 0.0033 + 0.0068
= 0.010 kW

Illinois Statewide Technical Reference Manual – 5.6.5 High Efficiency Pool Pumps
5.3.16 Advanced Thermostats
DESCRIPTION
This measure characterizes the household energy savings from the installation of a new thermostat(s) for reduced heating and cooling consumption through a configurable schedule of temperature setpoints (like a programmable thermostat) and automatic variations to that schedule to better match HVAC system runtimes to meet occupant comfort needs. These schedules may be defaults, established through user interaction, and be changed manually at the device or remotely through a web or mobile app. Automatic variations to that schedule could be driven by local sensors and software algorithms, and/or through connectivity to an internet software service. Data triggers to automatic schedule changes might include, for example: occupancy/activity detection, arrival & departure of conditioned spaces, optimization based on historical or population-specific trends, weather data and forecasts. 481 This class of products and services are relatively new, diverse, and rapidly changing. Generally, the savings expected for this measure aren’t yet established at the level of individual features, but rather at the system level and how it performs overall. Like programmable thermostats, it is not suitable to assume that heating and cooling savings follow a similar pattern of usage and savings opportunity, and so here too this measure treats these savings independently. Note that it is a very active area of ongoing study to better map features to savings value, and establish standards of performance measurement based on field data so that a standard of efficiency can be developed.482 That work is not yet complete but does inform the treatment of some aspects of this characterization and recommendations. Energy savings are applicable at the household level; all thermostats controlling household heat should be programmable and installation of multiple advanced thermostats per home does not accrue additional savings.
Note that though these devices and service could potentially be used as part of a demand response program, the costs, delivery, impacts, and other aspects of DR-specific program delivery are not included in this characterization at this time, though they could be added in the future.
This measure was developed to be applicable to the following program types: TOS, NC, RF, DI. If applied to other program types, the measure savings should be verified.
DEFINITION OF EFFICIENT EQUIPMENT
The criteria for this measure are established by replacement of a manual-only or programmable thermostat, with one that has the default enabled capability—or the capability to automatically—establish a schedule of temperature setpoints according to driving device inputs above and beyond basic time and temperature data of conventional programmable thermostats. As summarized in the description, this category of products and services is broad and rapidly advancing in regards to their capability, usability, and sophistication, but at a minimum must be capable of two-way communication483 and exceed the typical performance of manual and conventional programmable thermostats through the automatic or default capabilities described above.
DEFINITION OF BASELINE EQUIPMENT
The baseline is either the actual type (manual or programmable) if it is known, 484 or an assumed mix of these two
481 For example, the capabilities of products and added services that use ultrasound, infrared, or geofencing sensor systems, automatically develop individual models of home’s thermal properties through user interaction, and optimize system operation based on equipment type and performance traits based on weather forecasts demonstrate the type of automatic schedule change functionality that apply to this measure characterization.482 The ENERGY STAR program discontinued its support for basic programmable thermostats effective 12/31/09, and is presently developing a new specification for ‘Residential Climate Controls’. 483 This measure recognizes that field data may be available, through this 2-way communication capability, to better inform characterization of efficiency criteria and savings calculations. It is recommended that program implementations incorporate this data into their planning and operation activities to improve understanding of the measure to manage risks and enhance savings results. 484 If the actual thermostat is programmable and it is found to be used in override mode or otherwise effectively being
IL TRM v6.0 Vol. 3_January 25th, 2017_DRAFT Page 157 of 296
Illinois Statewide Technical Reference Manual – 5.6.5 High Efficiency Pool Pumps
types based upon information available from evaluations or surveys that represent the population of program participants. This mix may vary by program, but as a default, 44% programmable and 56% manual thermostats may be assumed485.
DEEMED LIFETIME OF EFFICIENT EQUIPMENT
The expected measure life for advanced thermostats is assumed to be similar to that of a programmable thermostat 10 years486 based upon equipment life only.487
DEEMED MEASURE COST
For DI and other programs for which installation services are provided, the actual material, labor, and other costs should be used. For retail, Bring Your Own Thermostat (BYOT) programs488, or other program types actual costs are still preferable489 but if unknown then the average incremental cost for the new installation measure is assumed to be $175490.
LOADSHAPE
ΔkWh Loadshape R10 - Residential Electric Heating and CoolingΔkWhheating Loadshape R09 - Residential Electric Space HeatΔkWhcooling Loadshape R08 - Residential Cooling
COINCIDENCE FACTOR
In the absence of conclusive results from empirical studies on peak savings, the TAC agreed to a temporary assumption of 50% of the cooling coincidence factor, acknowledging that while the savings from the advanced Thermostat will track with the cooling load, the impact during peak periods may be lower. This is an assumption that could use future evaluation to improve these estimates.
CFSSP = Summer System Peak Coincidence Factor for Central A/C (during system peak hour)= 34%491
CFPJM = PJM Summer Peak Coincidence Factor for Central A/C (average during PJM peak period)
= 23.3%492
operated like a manual thermostat, then the baseline may be considered to be a manual thermostat 485 Based on Opinion Dynamics Corporation, “ComEd Residential Saturation/End Use, Market Penetration & Behavioral Study”, Appendix 3: Detailed Mail Survey Results, p34, April 2013.486 Table 1, HVAC Controls, Measure Life Report, Residential and Commercial/Industrial Lighting and HVAC Measures, GDS Associates, 2007487 Future evaluation is strongly encouraged to inform the persistence of savings to further refine measure life assumption. As this characterization depends heavily upon a number of savings studies that only lasted a single year or less, the longer term impacts should be assessed.488 In contrast to program designs that utilize program affiliated contractors or other trade ally partners that support customer participation through thermostat distribution, installation and other services , BYOT programs enroll customers after the time of purchase through online rebate and program integration sign-ups. 489 Including any one-time software integration or annual software maintenance, and or individual device energy feature fees.490 Market prices vary considerably in this category, generally increasing with thermostat capability and sophistication. The core suite of functions required by this measure's eligibility criteria are available on units readily available in the market roughly in the range of $200 and $250, excluding the availability of any wholesale or volume discounts. The assumed incremental cost is based on the middle of this range ($225) minus a cost of $50 for the baseline equipment blend of manual and programmable thermostats. Note that any add-on energy service costs, which may include one-time setup and/or annual per device costs are not included in this assumption.491 Assumes 50% of the cooling coincidence factor (based on metering of 24 homes with central AC during PY4 and PY5 in Ameren Illinois service territory).492 Assumes 50% of the cooling coincidence factor (based on analysis of Itron eShape data for Missouri, calibrated to Illinois loads, supplied by Ameren. The average AC load over the PJM peak period (1-5pm, M-F, June through August) is divided by the
IL TRM v6.0 Vol. 3_January 25th, 2017_DRAFT Page 158 of 296
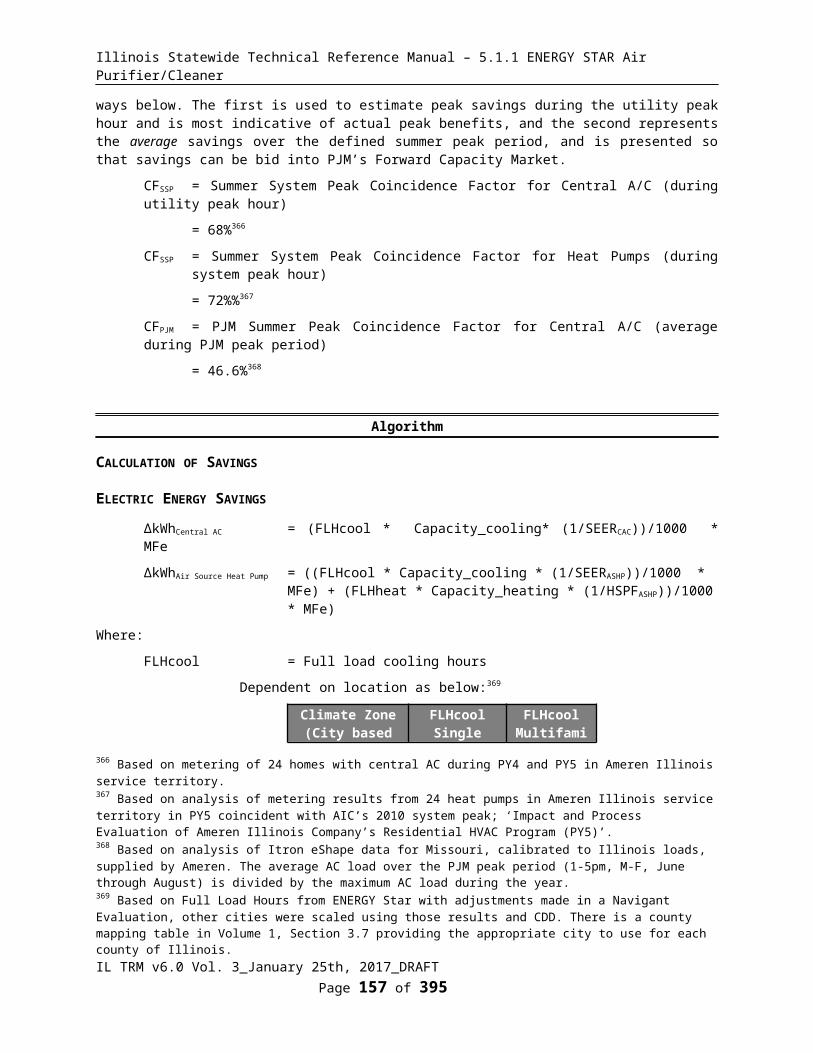
Illinois Statewide Technical Reference Manual – 5.6.5 High Efficiency Pool Pumps
Algorithm
CALCULATION OF SAVINGS
ELECTRIC ENERGY SAVINGS
ΔkWh493 = ΔkWhheating + ΔkWhcooling
ΔkWhheating = %ElectricHeat * Elec_Heating_Consumption * Heating_Reduction * HF * Eff_ISR + (∆Therms * Fe * 29.3)
ΔkWhcool = %AC * ((FLH * Btu/hr * 1/SEER)/1000) * Cooling_Reduction * Eff_ISR
Where:
%ElectricHeat = Percentage of heating savings assumed to be electric
Heating fuel %ElectricHeat Electric 100%Natural Gas 0%Unknown 6.5%494
Elec_Heating_Consumption
= Estimate of annual household heating consumption for electrically heated single-family homes495. If location and heating type is unknown, assume 15,678 kWh496
Climate Zone(City based upon)
Electric ResistanceElec_Heating_ Consumption
(kWh)
Electric Heat PumpElec_Heating_ Consumption
(kWh)1 (Rockford) 21,741 12,7892 (Chicago) 20,771 12,2183 (Springfield) 17,789 10,4644 (Belleville) 13,722 8,0725 (Marion) 13,966 8,215Average 19,743 11,613
Heating_Reduction = Assumed percentage reduction in total household heating energy
maximum AC load during the year.)493 Electrical savings are a function of both heating and cooling energy usage reductions. For heating this is a function of the percent of electric heat (heat pumps) and fan savings in the case of a natural gas furnace.494 Assumes that half of the electric heat in the state is a heat pump able to be controlled by an advanced thermostat (consistent with Potential Study results from the state). Average value of 13% electric space heating from 2010 Residential Energy Consumption Survey for Illinois. If utilities have specific evaluation results providing a more appropriate assumption for homes in a particular market or geographical area then that should be used.495 Values in table are based on converting an average household heating load (834 therms) for Chicago based on ‘Table E-1, Energy Efficiency/Demand Response Nicor Gas Plan Year 1: Research Report: Furnace Metering Study, Draft, Navigant, August 1 2013 to an electric heat load (divide by 0.03413) to electric resistance and ASHP heat load (resistance load reduced by 15% to account for distribution losses that occur in furnace heating but not in electric resistance while ASHP heat is assumed to suffer from similar distribution losses) and then to electric consumption assuming efficiencies of 100% for resistance and 200% for HP (see ‘Household Heating Load Summary Calculations_11062013.xls’). Finally these values were adjusted to a statewide average using relative HDD assumptions to adjust for the evaluation results focus on northern region. Values for individual cities are then calculated by comparing average HDD to the individual city’s HDD. 496 Assumption that 1/2 of electrically heated homes have electric resistance and 1/2 have Heat Pump, based on 2010 Residential Energy Consumption Survey for Illinois.
IL TRM v6.0 Vol. 3_January 25th, 2017_DRAFT Page 159 of 296

Illinois Statewide Technical Reference Manual – 5.6.5 High Efficiency Pool Pumps
consumption due to advanced thermostat
Existing Thermostat Type Heating_Reduction497
Manual 8.8%Programmable 5.6%Unknown (Blended) 7.4%
HF = Household factor, to adjust heating consumption for non-single-family households.
Household Type HFSingle-Family 100%Multi-Family 65%498
Actual Custom499
Eff_ISR = Effective In-Service Rate, the percentage of thermostats installed and configured effectively for 2-way communication. Note that retrospective adjustments should be made during evaluation verification activities through the use of a realization rate if the program design does not ensure that each advanced thermostat is actually installed and/or if the evaluation determines that the advanced thermostat is not actually installed in the Program Administrator’s service territory.
Program Delivery Eff_ISRDirect Install 100%Other 100%500
∆Therms = Therm savings if Natural Gas heating system
= See calculation in Natural Gas section below
Fe = Furnace Fan energy consumption as a percentage of annual fuel consumption
= 3.14%501
29.3 = kWh per therm
%AC = Fraction of customers with thermostat-controlled air-conditioning
497 These values represent adjusted baseline savings values (8.8% for manual, and 5.6% for programmable thermostats) as presented in Navigant’s PowerPoint on Impact Analysis from Preliminary Gas savings findings (slide 28 of ‘IL SAG Smart Thermostat Preliminary Gas Impact Findings 2015-12-08 to IL SAG.ppt’). These values are used as the basis for the weighted average savings value when the type of existing thermostat is not known. Using the default assumption of 56% manual and 44% programmable as described in the baseline definition section above the 7.4% savings value is equal to the sum of proportional savings for manual and programmable thermostats: 8.8% * 0.56 + 5.6% * 0.44. Further evaluation and regular review of this key assumption is encouraged.498 Multifamily household heating consumption relative to single-family households is affected by overall household square footage and exposure to the exterior. This 65% reduction factor is applied to MF homes, based on professional judgment that average household size, and heat loads of MF households are smaller than single-family homes 499 Program-specific household factors may be utilized on the basis of sufficiently validated program evaluations. 500 As a function of the method for determining savings impact of these devices, in-service rate effects are already incorporated into the savings value for heating_reduction above.501 Fe is not one of the AHRI certified ratings provided for residential furnaces, but can be reasonably estimated from a calculation based on the certified values for fuel energy (Ef in MMBTU/yr) and Eae (kWh/yr). An average of a 300 record sample (non-random) out of 1495 was 3.14%. This is, appropriately, ~50% greater than the Energy Star version 3 criteria for 2% Fe. See “Programmable Thermostats Furnace Fan Analysis.xlsx” for reference.
IL TRM v6.0 Vol. 3_January 25th, 2017_DRAFT Page 160 of 296

Illinois Statewide Technical Reference Manual – 5.6.5 High Efficiency Pool Pumps
Thermostat control of air conditioning? %AC
Yes 100%No 0%Unknown 66%502
Unknown Multi-Family 46% 503
Unknown Single Family 87%504
FLH = Estimate of annual household full load cooling hours for air conditioning equipment based on location and home type. If location and cooling type are unknown, assume the weighted average.
Climate zone(city based upon)
FLH(single family) 505
FLH(general
multifamily) 506
FLH_cooling (weatherized multi
family) 507
1 (Rockford) 512 467 2432 (Chicago) 570 506 2633 (Springfield) 730 663 3454 (Belleville) 1035 940 4895 (Marion) 903 820 426Weighted average508 629 564 293
Btu/hr = Size of AC unit509. (Note: One refrigeration ton is equal to 12,000 Btu/hr.)
Program Delivery Btu/hrDirect Install (Single Family known, or MF) ActualUnknown (Single family home only) 33,600
SEER = the cooling equipment’s Seasonal Energy Efficiency Ratio rating (kBtu/kWh)
= Use actual SEER rating where it is possible to measure or reasonably estimate.
Cooling System SEER510
Air Source Heat Pump 9.12Central AC 8.60
1/1000 = kBtu per Btu
502 66% of homes in Illinois having central cooling ("Table HC7.9 Air Conditioning in Homes in Midwest Region, Divisions, and States, 2009 from Energy Information Administration", 2009 Residential Energy Consumption Survey; 503 Based on Opinion Dynamics Corporation, “ComEd Residential Saturation/End Use, Market Penetration & Behavioral Study”, Appendix 3: Detailed Mail Survey Results, April 2013.504 Ibid.505 Full load hours for Chicago, Moline and Rockford are provided in “Final Evaluation Report: Central Air Conditioning Efficiency Services (CACES), 2010, Navigant Consulting”, p.33. An average FLH/Cooling Degree Day (from NCDC) ratio was calculated for these locations and applied to the CDD of the other locations in order to estimate FLH. There is a county mapping table in Volume 1, Section 3.7 providing the appropriate city to use for each county of Illinois.506 Ibid.507 All-Electric Homes PY6 Metering Results: Multifamily HVAC Systems, Cadmus, October 2015508 Weighted based on number of residential occupied housing units in each zone.509 Actual unit size required for multi-family building, no size assumption provided because the unit size and resulting savings can vary greatly depending on the number of units.510 Average nameplate efficiencies of all Early Replacement qualifying equipment in Ameren PY3-PY4.
IL TRM v6.0 Vol. 3_January 25th, 2017_DRAFT Page 161 of 296

Illinois Statewide Technical Reference Manual – 5.6.5 High Efficiency Pool Pumps
Cooling_Reduction = Assumed percentage reduction in total household cooling energy consumption due to installation of advanced thermostat511:
= 8.0%512
SUMMER COINCIDENT PEAK DEMAND SAVINGS
ΔkW = %AC * (Cooling_Reduction * Btu/hr * (1/EER))/1000 * EFF_ISR * CF
Where:
EER = Energy Efficiency Ratio of existing cooling system (kBtu/hr / kW)
= Use actual EER rating where it is possible to measure or reasonably estimate. If EER unknown but SEER available convert using the equation:
EER = (-0.02 * SEER_exist2) + (1.12 * SEER_exist) 513
If SEER or EER rating unavailable use:
Cooling System EER514
Air Source Heat Pump 8.55Central AC 8.15
CFSSP = Summer System Peak Coincidence Factor for Central A/C (during system peak hour)= 34%515
CFPJM = PJM Summer Peak Coincidence Factor for Central A/C (average during PJM peak period)
511 The Technical Advisory Committee is currently collaborating on a plan for an upcoming evaluation that will relate to the exact population this measure represents, and results of that evaluation will be used to update this assumption when it is finalized.512 This assumption is based upon the review of many evaluations from other regions in the US (see Navigant workpaper “Illinois Statewide TRM Workpaper_RES_Smart Thermostats_2015 11 02.docx” and VEIC summary “Studies informing the Illinois TRM Savings Characterization for Advanced Thermostats.docx”). These sources, are from different regions, products, and program delivery designs, but collectively form a sound basis, and directional guidance for the existence and magnitude of cooling savings. Because cooling savings are more volatile than those for heating due to variables in control behaviors, population, and product factors, conservatism is warranted and 8% was considered a conservative estimate based upon the array of results from these studies available at the time this value was developed. Further evaluation and regular review of this key assumption is encouraged. 513 From Wassmer, M. (2003). A Component-Based Model for Residential Air Conditioner and Heat Pump Energy Calculations. Masters Thesis, University of Colorado at Boulder.514 Average nameplate efficiencies of all Early Replacement qualifying equipment in Ameren PY3-PY4.515 Assumes 50% of the cooling coincidence factor (based on metering of 24 homes with central AC during PY4 and PY5 in Ameren Illinois service territory.)
IL TRM v6.0 Vol. 3_January 25th, 2017_DRAFT Page 162 of 296
For example, an advanced thermostat replacing a programmable thermostat directly installed in an electric heat pump heated, single-family home in Springfield with advanced thermostat-controlled air conditioning of a system of unknown size and seasonal efficiency rating:
ΔkWH = ΔkWhheating + ΔkWhcooling
= 1 * 10,464 * 5.6% * 100% * 100% + (0 * 0.0314 * 29.3) + 100% * ((730 * 33,600 * (1/9.12))/1000) * 8% * 100%
= 586kWh + 215 kWh
= 801 kWh

Illinois Statewide Technical Reference Manual – 5.6.5 High Efficiency Pool Pumps
= 23.3%516
Other variables as provided above
NATURAL GAS ENERGY SAVINGS
∆Therms = %FossilHeat * Gas_Heating_Consumption * Heating_Reduction * HF * Eff_ISR
Where:
%FossilHeat = Percentage of heating savings assumed to be Natural Gas
Heating fuel %FossilHeatElectric 0%Natural Gas 100%Unknown 93.5%517
Gas_Heating_Consumption
= Estimate of annual household heating consumption for gas heated single-family homes. If location is unknown, assume the average below518.
Climate Zone(City based upon)
Gas_Heating_ Consumption
(therms)1 (Rockford) 1,0522 (Chicago) 1,0053 (Springfield) 8614 (Belleville) 664
516 Assumes 50% of the cooling coincidence factor (based on analysis of Itron eShape data for Missouri, calibrated to Illinois loads, supplied by Ameren. The average AC load over the PJM peak period (1-5pm, M-F, June through August) is divided by the maximum AC load during the year.)517 Assumes that half of the electric heat in the state is a heat pump able to be controlled by an advanced thermostat. Data from 2010 Residential Energy Consumption Survey for Illinois. If utilities have specific evaluation results providing a more appropriate assumption for homes in a particular market or geographical area then that should be used.518 Values are based on adjusting the average household heating consumption (849 therms) for Chicago based on ‘Table 3-4, Program Sample Analysis, Nicor R29 Res Rebate Evaluation Report 092611_REV FINAL to Nicor’, calculating inferred heating load by dividing by average efficiency of new in program units in the study (94.4%) and then applying standard assumption of existing unit efficiency of 83% (estimate based on 24% of furnaces purchased in Illinois were condensing in 2000 (based on data from GAMA, provided to Department of Energy), assuming typical efficiencies: (0.24*0.92) + (0.76*0.8) = 0.83). This Chicago value was then adjusted to a statewide average using relative HDD assumptions to adjust for the evaluation results focus on northern region. Values for individual cities are then calculated by comparing average HDD to the individual city’s HDD.
IL TRM v6.0 Vol. 3_January 25th, 2017_DRAFT Page 163 of 296
For example, an advanced thermostat replacing a programmable thermostat directly installed in an electric resistance heated, single-family home in Springfield with advanced thermostat-controlled air conditioning of a system of unknown size and seasonal efficiency rating:
ΔkW SSP = 100% * 8% * 33,600 * (1/8.15))/1000) * 100% * 34%
= 0.11 kW
ΔkW PJM = 100% * 8% * 33,600 * (1/8.15))/1000) * 100% * 23.3%
= 0.077 kW

Illinois Statewide Technical Reference Manual – 5.6.5 High Efficiency Pool Pumps
Climate Zone(City based upon)
Gas_Heating_ Consumption
(therms)5 (Marion) 676Average 955
Other variables as provided above
WATER IMPACT DESCRIPTIONS AND CALCULATION
N/A
DEEMED O&M COST ADJUSTMENT CALCULATION
N/A
MEASURE CODE: RS-HVC-ADTH-V02-180101
REVIEW DEADLINE: 1/1/2019
IL TRM v6.0 Vol. 3_January 25th, 2017_DRAFT Page 164 of 296
For example, an advanced thermostat replacing a programmable thermostat directly-installed in a gas heated single-family home in Chicago:
∆Therms = 1.0 * 1005 * 5.6% * 100% * 100%
= 56.28 therms
Illinois Statewide Technical Reference Manual – 5.6.5 High Efficiency Pool Pumps
5.4 Hot Water End Use5.4.1 Domestic Hot Water Pipe Insulation
DESCRIPTION
This measure describes adding insulation to un-insulated domestic hot water pipes. The measure assumes the pipe wrap is installed to the first length of both the hot and cold pipe up to the first elbow. This is the most cost effective section to insulate since the water pipes act as an extension of the hot water tank up to the first elbow which acts as a heat trap. Insulating this length therefore helps reduce standby losses. Default savings are provided per 3ft length and are appropriate up to 6ft of the hot water pipe and 3ft of the cold.
This measure was developed to be applicable to the following program types: TOS, NC, RF.
If applied to other program types, the measure savings should be verified.
DEFINITION OF EFFICIENT EQUIPMENT
The efficient case is installing pipe wrap insulation to a length of hot water pipe.
DEFINITION OF BASELINE EQUIPMENT
The baseline is an un-insulated hot water pipe.
DEEMED LIFETIME OF EFFICIENT EQUIPMENT
The measure life is assumed to be 15 years519.
DEEMED MEASURE COST
The measure cost including material and installation is assumed to be $3 per linear foot520.
LOADSHAPE
Loadshape C53 - Flat
COINCIDENCE FACTOR
This measure assumes a flat loadshape since savings relate to reducing standby losses and as such the coincidence factor is 1.
Algorithm
CALCULATION OF SAVINGS
ELECTRIC ENERGY SAVINGS
For electric DHW systems:
ΔkWh = ((1/Rexist – 1/Rnew) * (L * C) * ΔT * 8,766)/ ηDHW / 3413
Where:
519 Measure Life Report, Residential and Commercial/Industrial Lighting and HVAC Measures, GDS Associates, June 2007.http://www.ctsavesenergy.org/files/Measure%20Life%20Report%202007.pdf520 Consistent with DEER 2008 Database Technology and Measure Cost Data (www.deeresources.com).
IL TRM v6.0 Vol. 3_January 25th, 2017_DRAFT Page 165 of 296
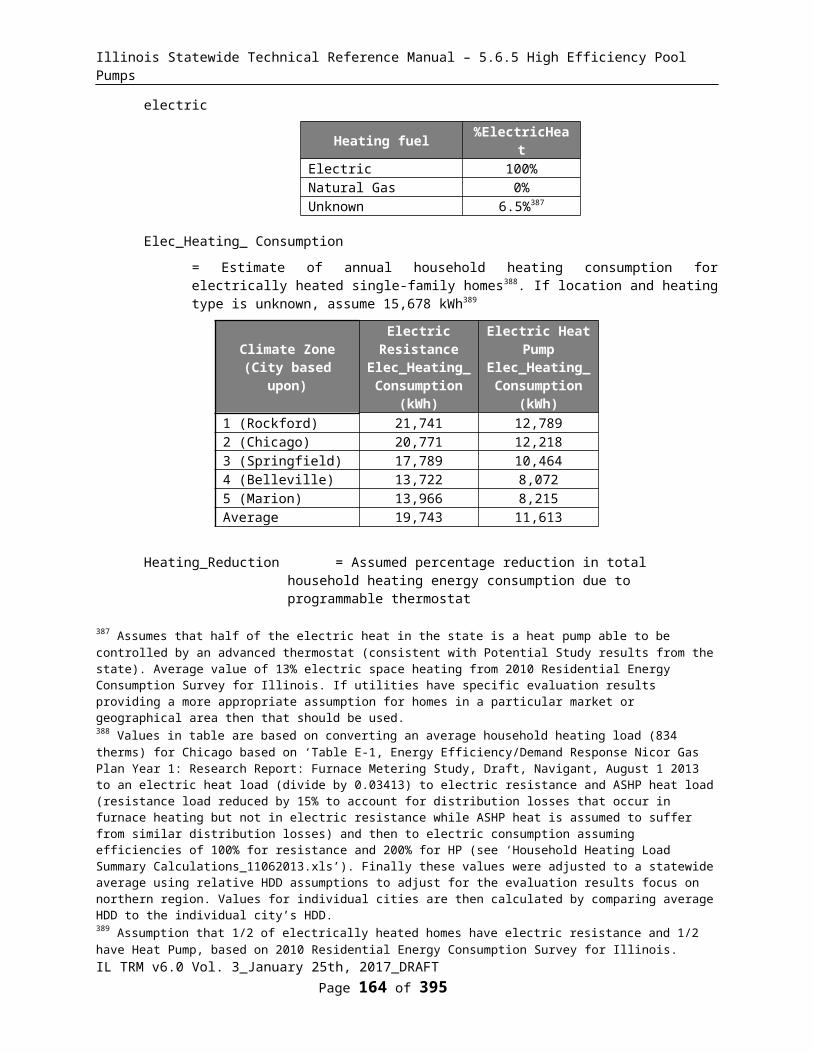
Illinois Statewide Technical Reference Manual – 5.6.5 High Efficiency Pool Pumps
Rexist = Pipe heat loss coefficient of uninsulated pipe (existing) [(hr-°F-ft)/Btu]
= 1.0521
Rnew = Pipe heat loss coefficient of insulated pipe (new) [(hr-°F-ft)/Btu]
= Actual (1.0 + R value of insulation)
L = Length of pipe from water heating source covered by pipe wrap (ft)
= Actual
C = Circumference of pipe (ft) (Diameter (in) * π/12)
= Actual (0.5” pipe = 0.131ft, 0.75” pipe = 0.196ft)
ΔT = Average temperature difference between supplied water and outside air temperature (°F)
= 60°F 522
8,766 = Hours per year
ηDHW = Recovery efficiency of electric hot water heater
= 0.98 523
3412 = Conversion from Btu to kWh
If inputs above are not available the following default per 3ft R-5 length can be used for up to 6 ft length on the hot pipe and 3 ft on the cold pipe.
ΔkWh = ((1/Rexist – 1/Rnew) * (L * C) * ΔT * 8,766) / ηDHW / 3412
= ((1/1– 1/(1+5)) * (3 * 0.196) * 60 * 8766) / 0.98 /3412
= 77.1 kWh per 3ft length
SUMMER COINCIDENT PEAK DEMAND SAVINGS
∆kW = ∆kWh / 8766
Where:
ΔkWh = kWh savings from pipe wrap installation
8766 = Number of hours in a year (since savings are assumed to be constant over year).
521 Navigant Consulting Inc., April 2009; “Measures and Assumptions for Demand Side Management (DSM) Planning; Appendix C Substantiation Sheets”, p77.522 Assumes 125°F water leaving the hot water tank and average temperature of basement of 65°F.523 Electric water heaters have recovery efficiency of 98%: http://www.ahridirectory.org/ahridirectory/pages/home.aspx
IL TRM v6.0 Vol. 3_January 25th, 2017_DRAFT Page 166 of 296
For example, insulating 5 feet of 0.75” pipe with R-5 wrap:
ΔkWh = ((1/Rexist – 1/Rnew) * (L * C) * ΔT * 8,766) / ηDHW / 3412
= ((1/1– 1/(1+5) * (5 * 0.196) * 60 * 8766) / 0.98 /3412
= 128 kWh
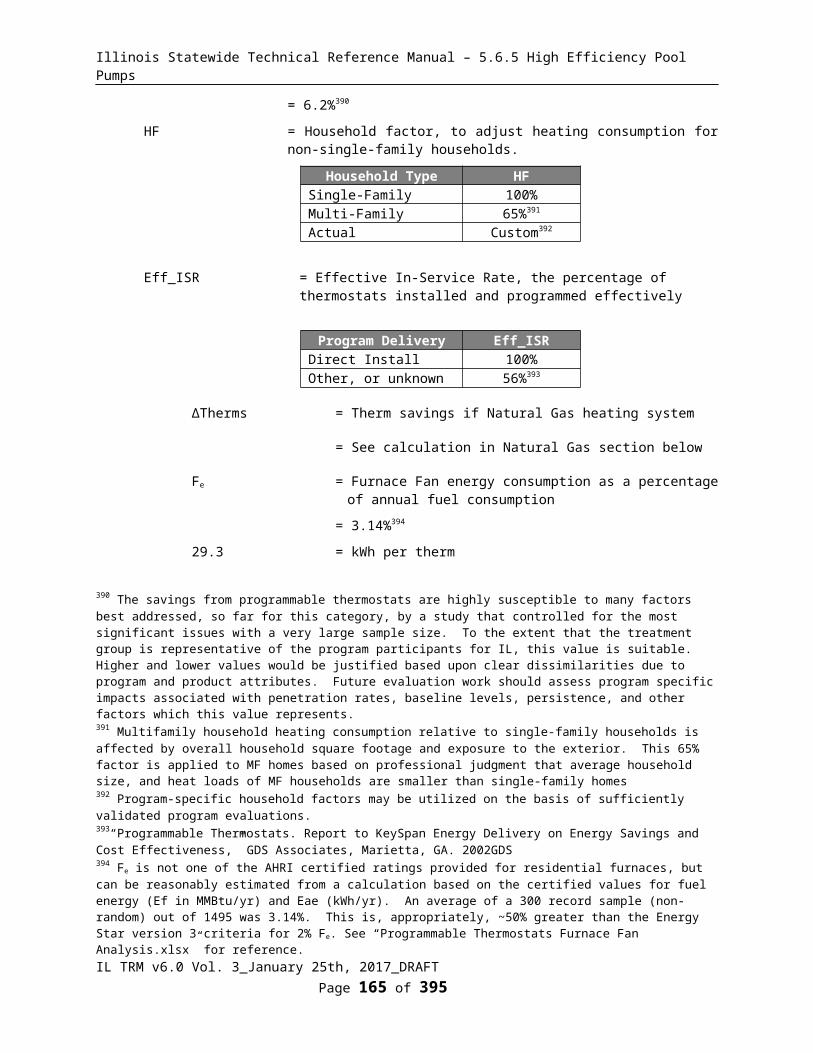
Illinois Statewide Technical Reference Manual – 5.6.5 High Efficiency Pool Pumps
If inputs above are not available the following default per 3ft R-4 length can be used for up to 6 ft length on the hot pipe and 3 ft on the cold pipe.
ΔkW = 77.1/8766
= 0.0088 kW
NATURAL GAS SAVINGS
For Natural Gas DHW systems:
ΔTherm = ((1/Rexist – 1/Rnew) * (L * C) * ΔT * 8,766) / ηDHW /100,000
Where:
ηDHW = Recovery efficiency of gas hot water heater
= 0.78 524
Other variables as defined above
If inputs above are not available the following default per 3ft R-4 length can be used for up to 6ft length on the hot pipe and 3ft on the cold pipe.
ΔTherm = ((1/Rexist – 1/Rnew) * (L * C) * ΔT * 8,766) / ηDHW / 100,000
= ((1/1– 1/(1+5)) * (3 * 0.196) * 60 * 8766) / 0.78 /100,000
= 3.30 therms per 3ft length
WATER IMPACT DESCRIPTIONS AND CALCULATION
N/A
DEEMED O&M COST ADJUSTMENT CALCULATION
N/A
MEASURE CODE: RS-HWE-PINS-V02-150601
REVIEW DEADLINE: 1/1/2019
524 Review of AHRI Directory suggests range of recovery efficiency ratings for new Gas DHW units of 70-87%. Average of existing units is estimated at 78%
IL TRM v6.0 Vol. 3_January 25th, 2017_DRAFT Page 167 of 296
For example, insulating 5 feet of 0.75” pipe with R-5 wrap:
ΔkW = 128/8766
= 0.015kW
For example, insulating 5 feet of 0.75” pipe with R-5 wrap:
ΔTherm = ((1/1– 1/(1+5)) * (5 * 0.196) * 60 * 8766) / 0.78 / 100,000
= 5.51 therms

Illinois Statewide Technical Reference Manual – 5.6.5 High Efficiency Pool Pumps
5.4.2 Gas Water Heater
DESCRIPTION
This measure characterizes:
a) Time of sale or new construction: The purchase and installation of a new efficient gas-fired water heater, in place of a Federal Standard unit in a residential setting. Savings are provided for power-vented, condensing storage, and whole-house tankless units meeting specific EF criteria.
b) Early replacement:The early removal of an existing functioning natural gas water heater from service, prior to its natural end of life, and replacement with a new high efficiency unit. Savings are calculated between existing unit and efficient unit consumption during the remaining life of the existing unit, and between new baseline unit and efficient unit consumption for the remainder of the measure life.
This measure was developed to be applicable to the following program types: TOS, NC, EREP.
If applied to other program types, the measure savings should be verified.
DEFINITION OF EFFICIENT EQUIPMENT
To qualify for this measure the efficient equipment must be a water heater rated with the following minimum efficiency ratings:
Water Heater Type Minimum Energy FactorGas Storage 0.67Condensing gas storage 0.80Tankless whole-house unit 0.82
DEFINITION OF BASELINE EQUIPMENT
Time of Sale or New Construction: The baseline condition is assumed to be a standard gas storage water heater of the same capacity as the efficient unit, rated at the federal minimum. For 20 to 55 gallon tanks the Federal Standard is calculated as 0.675 – (0.0015 * storage size in gallons) and for tanks 55 - 100 gallon 0.8012 – (0.00078 * storage size in gallons)525. For a 40-gallon storage water heater this would be 0.615 EF.
Early replacement: The baseline for this measure is the efficiency of the existing equipment for the assumed remaining useful life of the unit and a new baseline unit for the remainder of the measure life.
DEEMED LIFETIME OF EFFICIENT EQUIPMENT
The expected measure life is assumed to be 13 years.526
For early replacement: Remaining life of existing equipment is assumed to be 4 years527.
525 Minimum Federal Standard as of 4/1/2015;http://www.gpo.gov/fdsys/pkg/CFR-2012-title10-vol3/pdf/CFR-2012-title10-vol3-sec430-32.pdf526 DOE, 2010 Residential Heating Products Final Rule Technical Support Document, Table 8.2.14 http://www1.eere.energy.gov/buildings/appliance_standards/residential/pdfs/htgp_finalrule_ch8.pdf Note: This source is used to support this category in aggregate. For all water heaters, life expectancy will depend on local variables such as water chemistry and homeowner maintenance. Some categories, including condensing storage and tankless water heaters do not yet have sufficient field data to support separate values. Preliminary data show lifetimes may exceed 20 years, though this has yet to be sufficiently demonstrated.527 Assumed to be one third of effective useful life
IL TRM v6.0 Vol. 3_January 25th, 2017_DRAFT Page 168 of 296
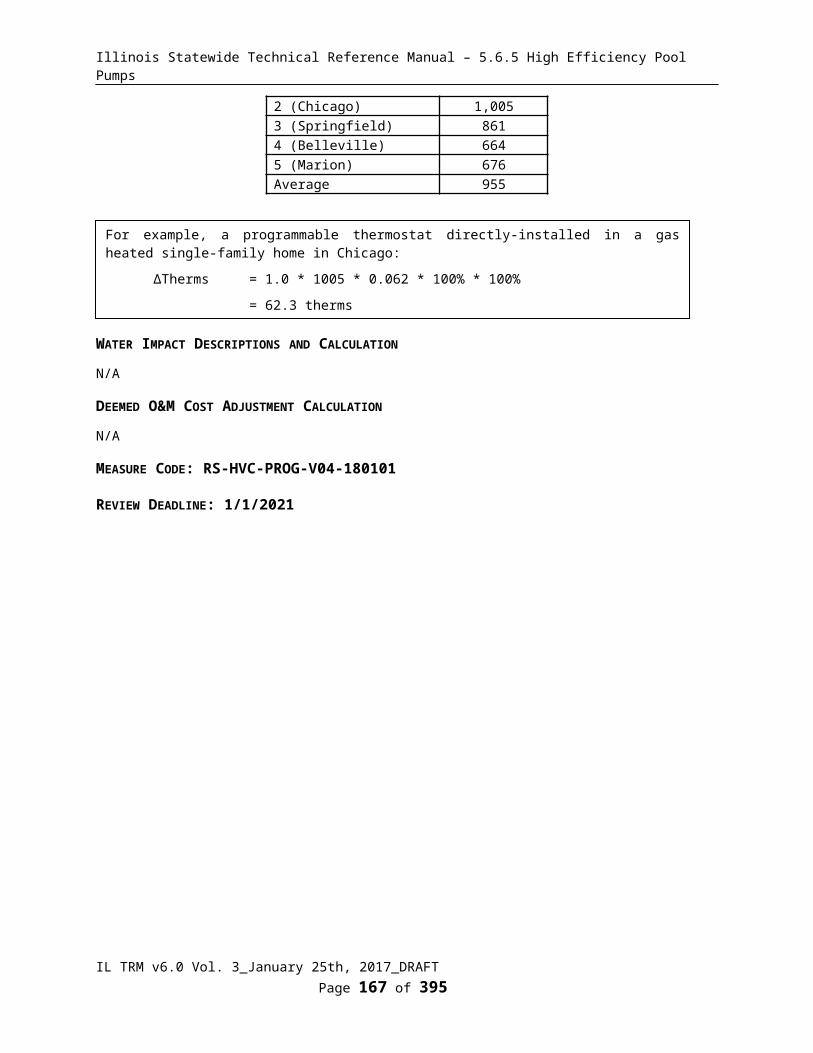
Illinois Statewide Technical Reference Manual – 5.6.5 High Efficiency Pool Pumps
DEEMED MEASURE COST
Time of Sale or New Construction:
The incremental capital cost for this measure is dependent on the type of water heater as listed below528.
Early Replacement: The full installed cost is provided in the table below. The assumed deferred cost (after 4 years) of replacing existing equipment with a new baseline unit is assumed to be $650 529. This cost should be discounted to present value using the nominal discount rate.
Water heater Type Incremental Cost Full Install Cost
Gas Storage $400 $1014Condensing gas storage $685 $1299Tankless whole-house unit $605 $1219
LOADSHAPE
N/A
COINCIDENCE FACTOR
N/A
Algorithm
CALCULATION OF SAVINGS
ELECTRIC ENERGY SAVINGS
N/A
SUMMER COINCIDENT PEAK DEMAND SAVINGS
N/A
NATURAL GAS ENERGY SAVINGS
Time of Sale or New Construction:
ΔTherms = (1/ EFBASE - 1/EFEFFICIENT) * (GPD * Household * 365.25 * γWater * (TOUT – TIN) * 1.0 )/100,000
Early replacement530:
ΔTherms for remaining life of existing unit (1st 4 years):
= (1/ EFEXISTING - 1/EFEFFICIENT) * (GPD * Household * 365.25 * γWater * (TOUT – TIN) * 1.0 )/100,000
ΔTherms for remaining measure life (next 9 years):
528 Source for cost info; DOE, 2010 Residential Heating Products Final Rule Technical Support Document, Table 8.2.14 (http://www1.eere.energy.gov/buildings/appliance_standards/residential/pdfs/htgp_finalrule_ch8.pdf)529 The deemed install cost of a Gas Storage heater is based upon DCEO Efficient Living Program Data for a sample size of 157 gas water heaters, and applying inflation rate of 1.91%.530 The two equations are provided to show how savings are determined during the initial phase of the measure (existing to efficient) and the remaining phase (new baseline to efficient). In practice, the screening tools used may either require a First Year savings (using the first equation) and then a “number of years to adjustment” and “savings adjustment” input which would be the (new base to efficient savings)/(existing to efficient savings).
IL TRM v6.0 Vol. 3_January 25th, 2017_DRAFT Page 169 of 296
Illinois Statewide Technical Reference Manual – 5.6.5 High Efficiency Pool Pumps
= (1/ EFBASE - 1/EFEFFICIENT) * (GPD * Household * 365.25 * γWater * (TOUT – TIN) * 1.0 )/100,000
Where:
EF_Baseline = Energy Factor rating for baseline equipment
For <=55 gallons: 0.675 – (0.0015 * tank_size)
For > 55 gallons: 0.8012 – (0.00078 * tank size)
= If tank size unknown assume 40 gallons and EF_Baseline of 0.615
EF_Efficient = Energy Factor Rating for efficient equipment
= Actual. If Tankless whole-house multiply rated efficiency by 0.91531. If unknown assume values in look up in table below
Water Heater Type EF_EfficientCondensing Gas Storage 0.80
Gas Storage 0.67Tankless whole-house 0.82 * 0.91 = 0.75
EF_Existing = Energy Factor rating for existing equipment
= Use actual EF rating where it is possible to measure or reasonably estimate.
= if unknown assume 0.52 532
GPD = Gallons Per Day of hot water use per person
= 45.5 gallons hot water per day per household/2.59 people per household533
= 17.6
Household = Average number of people per household
Household Unit Type HouseholdSingle-Family - Deemed 2.56534
Multi-Family - Deemed 2.1535
Custom Actual Occupancy or Number of Bedrooms536
365.25 = Days per year, on average
531 The disconnect between rated energy factor and in-situ energy consumption is markedly different for tankless units due to significantly higher contributions to overall household hot water usage from short draws. In tankless units the large burner and unit heat exchanger must fire and heat up for each draw. The additional energy losses incurred when the mass of the unit cools to the surrounding space in-between shorter draws was found to be 9% in a study prepared for Lawrence Berkeley National Laboratory by Davis Energy Group, 2006. “Field and Laboratory Testing of Tankless Gas Water Heater Performance” Due to the similarity (storage) between the other categories and the baseline, this derating factor is applied only to the tankless category.532 Based on DCEO Efficient Living Program Data for a sample size of 157 gas water heaters. 533 Deoreo, B., and P. Mayer. Residential End Uses of Water Study Update. Forthcoming. ©2015 Water Research Foundation. Reprinted With Permission.534 ComEd Energy Efficiency/ Demand Response Plan: Plan Year 2 (6/1/2009-5/31/2010) Evaluation Report: All Electric Single Family Home Energy Performance Tune-Up Program citing 2006-2008 American Community Survey data from the US Census Bureau for Illinois cited on p. 17 of the PY2 Evaluation report. 2.75 * 93% evaluation adjustment535 Navigant, ComEd PY3 Multi-Family Home Energy Savings Program Evaluation Report Final, May 16, 2012. 536 Bedrooms are suitable proxies for household occupancy, and may be preferable to actual occupancy due to turnover rates in residency and non-adult population impacts.
IL TRM v6.0 Vol. 3_January 25th, 2017_DRAFT Page 170 of 296
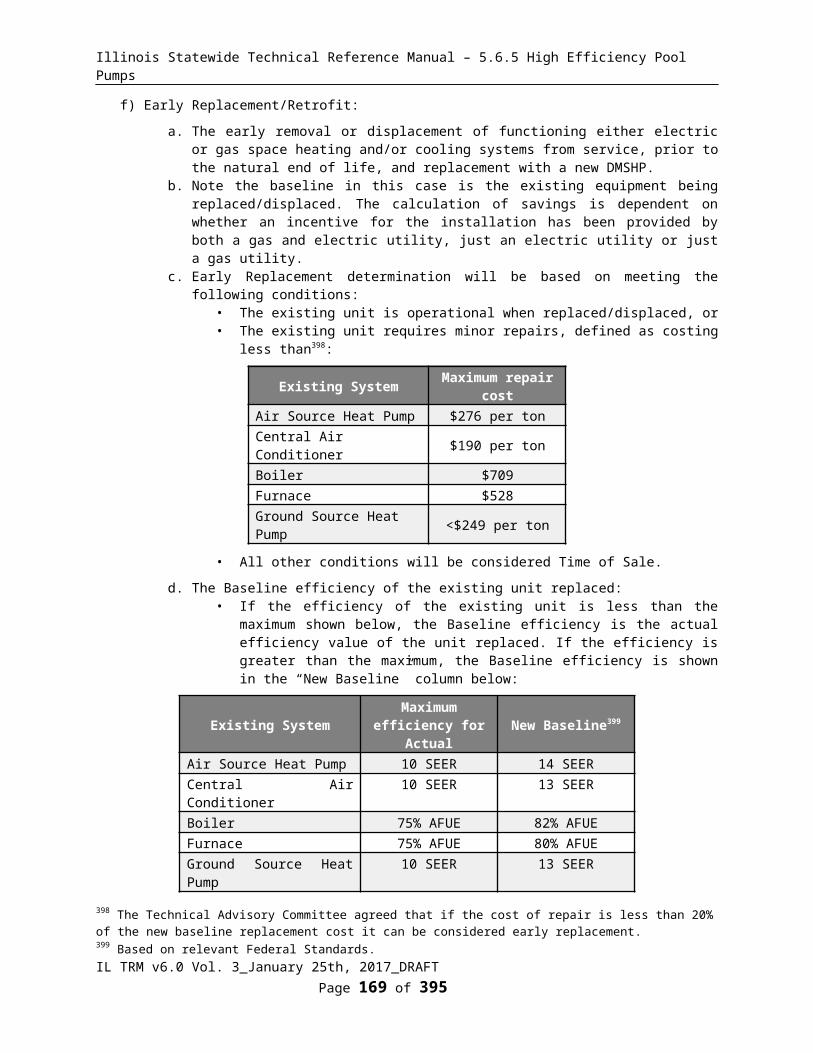
Illinois Statewide Technical Reference Manual – 5.6.5 High Efficiency Pool Pumps
γWater = Specific Weight of water
= 8.33 pounds per gallon
TOUT = Tank temperature
= 125°F
TIN = Incoming water temperature from well or municipal system
= 54°F537
1.0 = Heat Capacity of water (1 Btu/lb*°F)
WATER IMPACT DESCRIPTIONS AND CALCULATION
N/A
DEEMED O&M COST ADJUSTMENT CALCULATION
N/A
MEASURE CODE: RS-HWE-GWHT-V07-180101
REVIEW DEADLINE: 1/1/2021
537 US DOE Building America Program. Building America Analysis Spreadsheet. For Chicago, IL http://www1.eere.energy.gov/buildings/building_america/analysis_spreadsheets.html
IL TRM v6.0 Vol. 3_January 25th, 2017_DRAFT Page 171 of 296
For example, a 40 gallon condensing gas storage water heater, with an energy factor of 0.80 in a single family house:
ΔTherms = (1/0.615 - 1/0.8) * (17.6 * 2.56 * 365.25* 8.33 * (125 – 54) * 1) / 100,000
= 36.6 therms

Illinois Statewide Technical Reference Manual – 5.6.5 High Efficiency Pool Pumps
5.4.3 Heat Pump Water Heaters
DESCRIPTION
The installation of a heat pump domestic hot water heater in place of a standard electric water heater in a home. Savings are presented dependent on the heating system installed in the home due to the impact of the heat pump water heater on the heating loads.
This measure was developed to be applicable to the following program types: TOS, NC, RF.
If applied to other program types, the measure savings should be verified.
DEFINITION OF EFFICIENT EQUIPMENT
To qualify for this measure the installed equipment must be a Heat Pump domestic water heater.
DEFINITION OF BASELINE EQUIPMENT
The baseline condition is assumed to be a new electric water heater meeting federal minimum efficiency standards538:
For <=55 gallons: 0.96 – (0.0003 * rated volume in gallons)
For >55 gallons: 2.057 – (0.00113 * rated volume in gallons)
DEEMED LIFETIME OF EFFICIENT EQUIPMENT
The expected measure life is assumed to be 13 years.539
DEEMED MEASURE COST
The incremental capital cost for this measure is $1,000, for a HPWH with an energy factor of 2.0. The full cost, applicable in a retrofit, is $1,575. For a HPWH with an energy factor of 2.35, these costs are $1,134 and $1,703 respectively.540
LOADSHAPE
Loadshape R03 - Residential Electric DHW
COINCIDENCE FACTOR
The summer Peak Coincidence Factor is assumed to be 12%.541
Algorithm
538 Minimum Federal Standard as of 4/1/2015;http://www.gpo.gov/fdsys/pkg/CFR-2012-title10-vol3/pdf/CFR-2012-title10-vol3-sec430-32.pdf539 DOE, 2010 Residential Heating Products Final Rule Technical Support Document, Page 8-52 http://www1.eere.energy.gov/buildings/appliance_standards/residential/pdfs/htgp_finalrule_ch8.pdf 540 DOE, 2010 Residential Heating Products Final Rule Technical Support Document, Table 8.2.14 http://www1.eere.energy.gov/buildings/appliance_standards/residential/pdfs/htgp_finalrule_ch8.pdf 541 Calculated from Figure 8 "Combined six-unit summer weekday average electrical demand" in FEMP study; Field Testing of Pre-Production Prototype Residential Heat Pump Water Heatershttp://www1.eere.energy.gov/femp/pdfs/tir_heatpump.pdf as (average kW usage during peak period * hours in peak period) / [(annual kWh savings / FLH) * hours in peak period] = (0.1 kW * 5 hours) / [(2100 kWh (default assumptions) / 2533 hours) * 5 hours] = 0.12
IL TRM v6.0 Vol. 3_January 25th, 2017_DRAFT Page 172 of 296

Illinois Statewide Technical Reference Manual – 5.6.5 High Efficiency Pool Pumps
CALCULATION OF SAVINGS
ELECTRIC ENERGY SAVINGS
ΔkWh = (((1/EFBASE – 1/EFEFFICIENT) * GPD * Household * 365.25 * γWater * (TOUT – TIN) * 1.0) / 3412) + kWh_cooling - kWh_heating
Where:
EFBASE = Energy Factor (efficiency) of standard electric water heater according to federal standards542:
For <=55 gallons: 0.96 – (0.0003 * rated volume in gallons)
For >55 gallons: 2.057 – (0.00113 * rated volume in gallons)
= 0.945 for a 50 gallon tank, the most common size for HPWH
EFEFFICIENT = Energy Factor (efficiency) of Heat Pump water heater
= Actual
GPD = Gallons Per Day of hot water use per person
= 45.5 gallons hot water per day per household/2.59 people per household543
= 17.6
Household = Average number of people per household
Household Unit Type HouseholdSingle-Family - Deemed 2.56544
Multi-Family - Deemed 2.1545
Custom Actual Occupancy or Number of Bedrooms546
365.25 = Days per year
γWater = Specific weight of water
= 8.33 pounds per gallon
TOUT = Tank temperature
= 125°F
TIN = Incoming water temperature from well or municiple system
= 54°F547
542 Minimum Federal Standard as of 1/1/2015;http://www.gpo.gov/fdsys/pkg/CFR-2012-title10-vol3/pdf/CFR-2012-title10-vol3-sec430-32.pdf543 Deoreo, B., and P. Mayer. Residential End Uses of Water Study Update. Forthcoming. ©2015 Water Research Foundation. Reprinted With Permission.544 ComEd Energy Efficiency/ Demand Response Plan: Plan Year 2 (6/1/2009-5/31/2010) Evaluation Report: All Electric Single Family Home Energy Performance Tune-Up Program citing 2006-2008 American Community Survey data from the US Census Bureau for Illinois cited on p. 17 of the PY2 Evaluation report. 2.75 * 93% evaluation adjustment545 Navigant, ComEd PY3 Multi-Family Home Energy Savings Program Evaluation Report Final, May 16, 2012. 546 Bedrooms are suitable proxies for household occupancy, and may be preferable to actual occupancy due to turnover rates in residency and non-adult population impacts.547 US DOE Building America Program. Building America Analysis Spreadsheet. For Chicago, IL http://www1.eere.energy.gov/buildings/building_america/analysis_spreadsheets.html
IL TRM v6.0 Vol. 3_January 25th, 2017_DRAFT Page 173 of 296
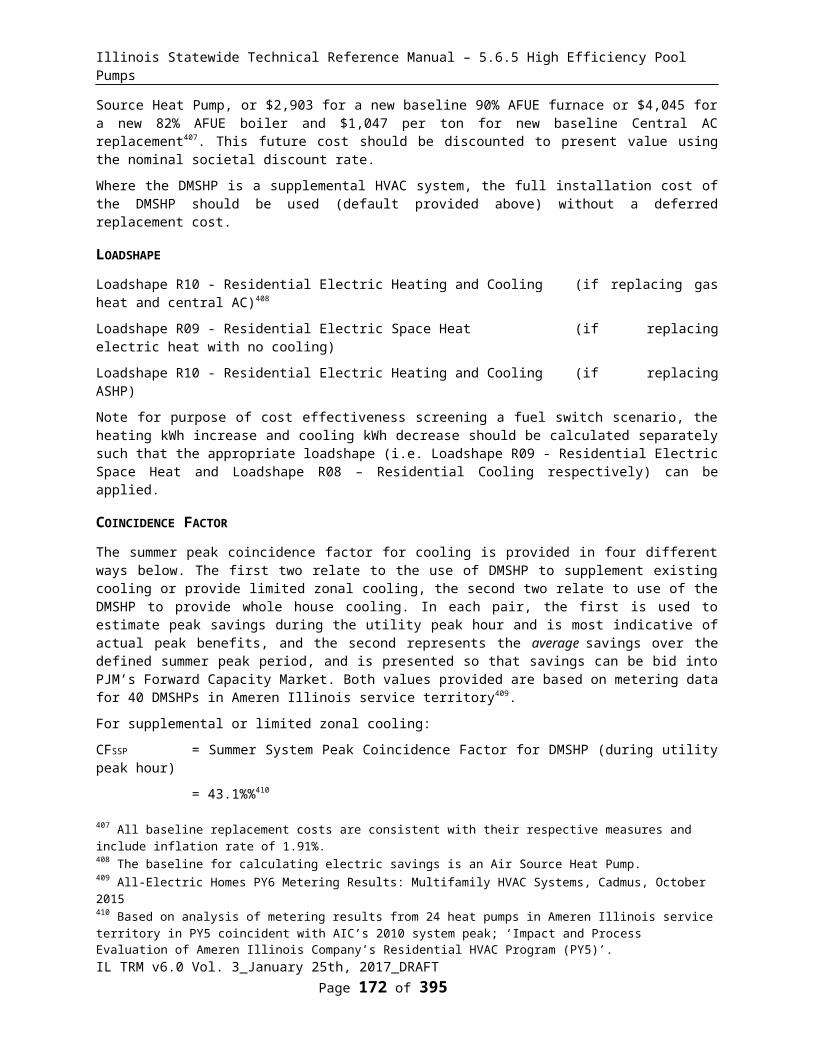
Illinois Statewide Technical Reference Manual – 5.6.5 High Efficiency Pool Pumps
1.0 = Heat Capacity of water (1 Btu/lb*°F)
3412 = Conversion from Btu to kWh
kWh_cooling548 = Cooling savings from conversion of heat in home to water heat
=(((((GPD * Household * 365.25 * γWater * (TOUT – TIN) * 1.0) / 3412) –
((1/ EFNEW * GPD * Household * 365.25 * γWater * (TOUT – TIN) * 1.0) / 3412)) * LF * 27%) / COPCOOL) * LM
Where:
LF = Location Factor
= 1.0 for HPWH installation in a conditioned space
= 0.5 for HPWH installation in an unknown location
= 0.0 for installation in an unconditioned space
27% = Portion of reduced waste heat that results in cooling savings549
COPCOOL = COP of central air conditioning
= Actual, if unknown, assume 3.08 (10.5 SEER / 3.412)
LM = Latent multiplier to account for latent cooling demand
= 1.33 550
kWh_heating = Heating cost from conversion of heat in home to water heat (dependent on heating fuel)
= (((((GPD * Household * 365.25 * γWater * (TOUT – TIN) * 1.0) / 3412) –
((1/ EFNEW * GPD * Household * 365.25 * γWater * (T OUT – TIN) * 1.0) / 3412)) * LF * 49%) / COPHEAT) * (1 - %NaturalGas)
Where:
49% = Portion of reduced waste heat that results in increased heating load551
COPHEAT = COP of electric heating system
= actual. If not available use552:
System Type Age of Equipment
HSPF Estimate
COPHEAT
(COP Estimate)= (HSPF/3.413)*0.85
548 This algorithm calculates the heat removed from the air by subtracting the HPWH electric consumption from the total water heating energy delivered. This is then adjusted to account for location of the HP unit and the coincidence of the waste heat with cooling requirements, the efficiency of the central cooling and latent cooling demands.549 REMRate determined percentage (27%) of lighting savings that result in reduced cooling loads (lighting is used as a proxy for hot water heating since load shapes suggest their seasonal usage patterns are similar).550 A sensible heat ratio (SHR) of 0.75 corresponds to a latent multiplier of 4/3 or 1.33. SHR of 0.75 for typical split system from page 10 of “Controlling Indoor Humidity Using Variable-Speed Compressors and Blowers” by M. A. Andrade and C. W. Bullard, 1999: www.ideals.illinois.edu/bitstream/handle/2142/11894/TR151.pdf551 REMRate determined percentage (49%) of lighting savings that result in increased heating loads (lighting is used as a proxy for hot water heating since load shapes suggest their seasonal usage patterns are similar).552 These default system efficiencies are based on the applicable minimum Federal Standards. In 2006 the Federal Standard for Heat Pumps was adjusted. While one would expect the average system efficiency to be higher than this minimum, the likely degradation of efficiencies over time mean that using the minimum standard is appropriate. Note efficiency should include duct losses. Defaults provided assume 15% duct loss for heat pumps.
IL TRM v6.0 Vol. 3_January 25th, 2017_DRAFT Page 174 of 296
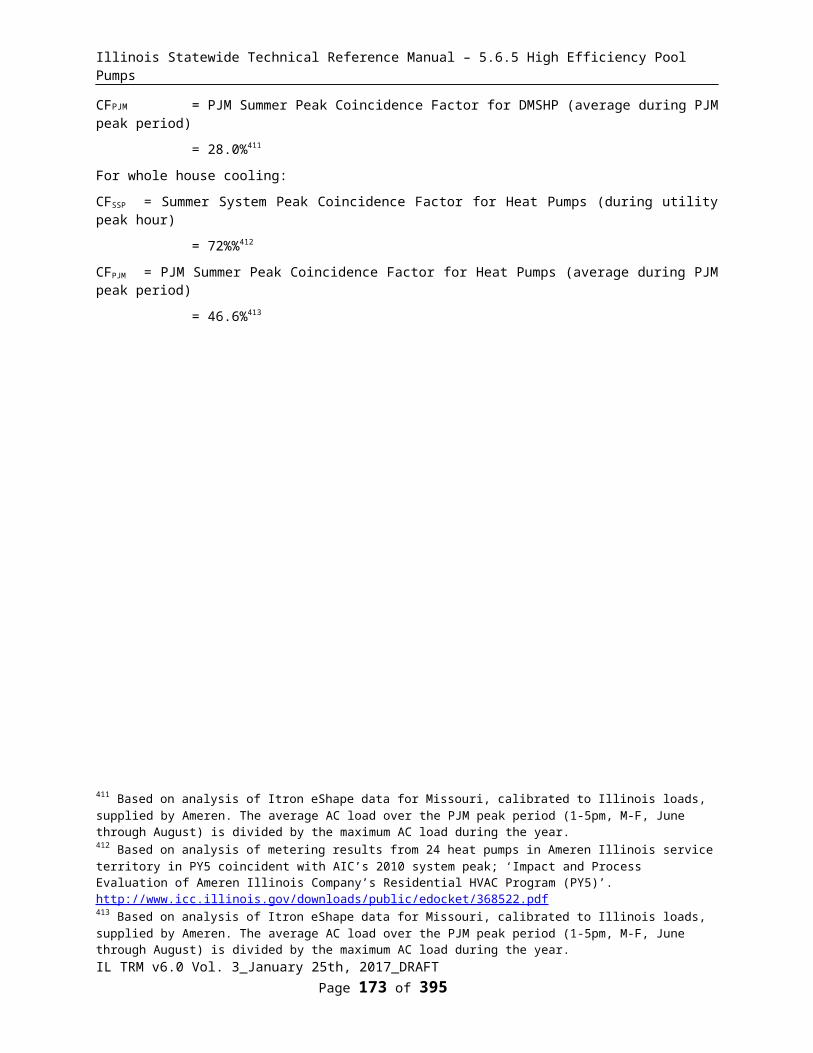
Illinois Statewide Technical Reference Manual – 5.6.5 High Efficiency Pool Pumps
Heat PumpBefore 2006 6.8 1.7After 2006 - 2014 7.7 1.922015 on 8.2 2.04
Resistance N/A N/A 1.00Unknown553 N/A N/A 1.28
SUMMER COINCIDENT PEAK DEMAND SAVINGS
ΔkW = ΔkWh / Hours * CF
Where:
Hours = Full load hours of water heater
= 2533 554
CF = Summer Peak Coincidence Factor for measure
= 0.12 555
NATURAL GAS SAVINGS
ΔTherms = - ((((GPD * Household * 365.25 * γWater * (TOUT – TIN) * 1.0) / 3412) – (((GPD * Household * 365.25 * γWater * (TOUT – TIN) * 1.0) / 3412) / EFEFFICIENT)) * LF * 49% * 0.03412) / ηHeat) * %NaturalGas
Where:
ΔTherms = Heating cost from conversion of heat in home to water heat for homes with Natural Gas heat.556
553 Calculation assumes 35% Heat Pump and 65% Resistance, which is based upon data from Energy Information Administration, 2009 Residential Energy Consumption Survey, see “HC6.9 Space Heating in Midwest Region.xls”, using average for East North Central Region. Average efficiency of heat pump is based on assumption that 50% are units from before 2006 and 50% from 2006-2014. Program or evaluation data should be used to improve this assumption if available.554 Full load hours assumption based on Efficiency Vermont analysis of Itron eShapes.555 Calculated from Figure 8 "Combined six-unit summer weekday average electrical demand" in FEMP study; Field Testing of Pre-Production Prototype Residential Heat Pump Water Heatershttp://www1.eere.energy.gov/femp/pdfs/tir_heatpump.pdf as (average kW usage during peak period * hours in peak period) / [(annual kWh savings / FLH) * hours in peak period] = (0.1 kW * 5 hours) / [(2100 kWh / 2533 hours) * 5 hours] = 0.12556 This is the additional energy consumption required to replace the heat removed from the home during the heating season by the heat pump water heater. kWh_heating (electric resistance) is that additional heating energy for a home with electric resistance heat (COP 1.0). This formula converts the additional heating kWh for an electric resistance home to the MMBtu required in a Natural Gas heated home, applying the relative efficiencies.
IL TRM v6.0 Vol. 3_January 25th, 2017_DRAFT Page 175 of 296
For example, a 2.0 EF heat pump water heater, in a conditioned space in a single family home with gas space heat and central air conditioning (SEER 10.5) in Belleville:
ΔkWh = [(1 / 0.945 – 1 / 2.0) * 17.6 * 2.56 * 365.25* 8.33 * (125 – 54)] / 3412 + 166.3 - 0
= 1759 kWh
For example, a 2.0 COP heat pump water heater, in a conditioned space in a single family home with gas space heat and central air conditioning in Belleville:
kW = 1759 / 2533 * 0.12
= 0.083 kW
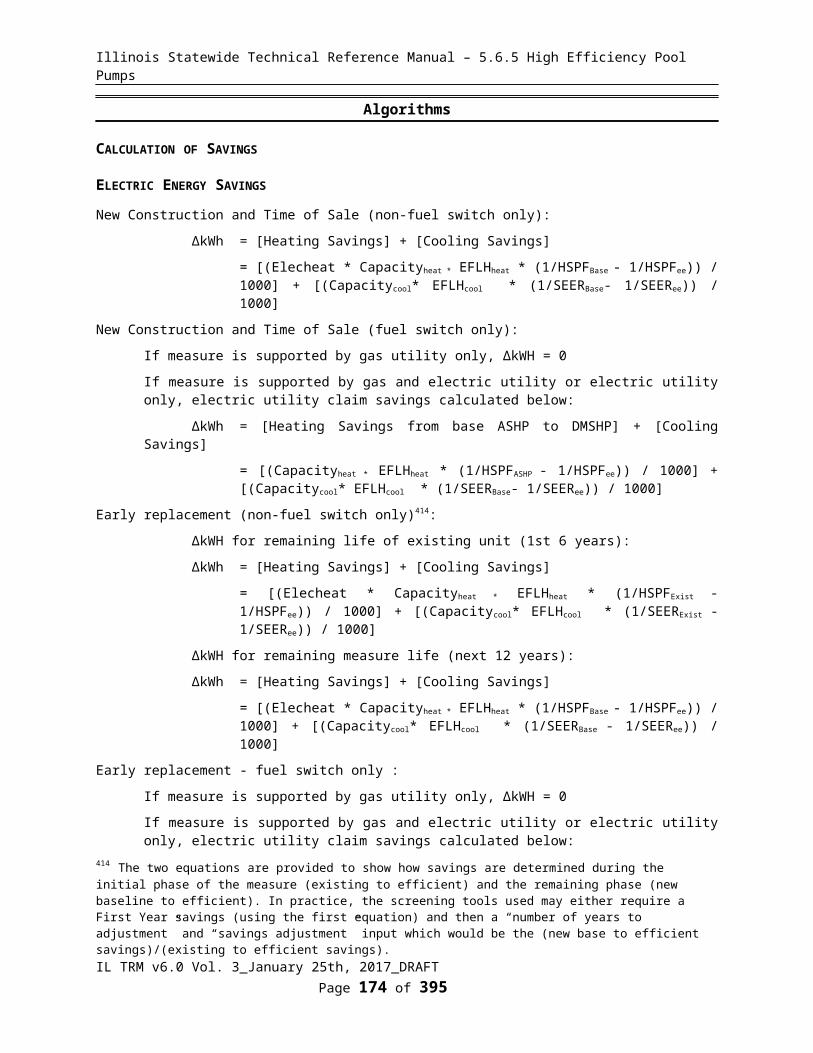
Illinois Statewide Technical Reference Manual – 5.6.5 High Efficiency Pool Pumps
0.03412 = conversion factor (therms per kWh)
ηHeat = Efficiency of heating system
= Actual.557 If not available use 70%.558
%NaturalGas = Factor dependent on heating fuel:
Heating System %NaturalGasElectric resistance or heat pump 0%Natural Gas 100%Unknown heating fuel559 87%
Other factors as defined above
WATER IMPACT DESCRIPTIONS AND CALCULATION
N/A
DEEMED O&M COST ADJUSTMENT CALCULATION
N/A
MEASURE CODE: RS-HWE-HPWH-V06-180101
REVIEW DEADLINE: 1/1/2021
557 Ideally, the System Efficiency should be obtained either by recording the AFUE of the unit, or performing a steady state efficiency test. The Distribution Efficiency can be estimated via a visual inspection and by referring to a look up table such as that provided by the Building Performance Institute: (http://www.bpi.org/files/pdf/DistributionEfficiencyTable-BlueSheet.pdf ) or by performing duct blaster testing.558 This has been estimated assuming that natural gas central furnace heating is typical for Illinois residences (66% of Illinois homes have a Natural Gas Furnace (based on Energy Information Administration, 2009 Residential Energy Consumption Survey: http://www.eia.gov/consumption/residential/data/2009/xls/HC6.9%20Space%20Heating%20in%20Midwest%20Region.xls ))In 2000, 24% of furnaces purchased in Illinois were condensing (based on data from GAMA, provided to Department of Energy during the federal standard setting process for residential heating equipment - see Furnace Penetration.xls). Furnaces tend to last up to 20 years and so units purchased 10 years ago provide a reasonable proxy for the current mix of furnaces in the State. Assuming typical efficiencies for condensing and non-condensing furnaces and duct losses, the average heating system efficiency is estimated as follows: (0.24*0.92) + (0.76*0.8) * (1-0.15) = 0.70559 2010 American Community Survey.
IL TRM v6.0 Vol. 3_January 25th, 2017_DRAFT Page 176 of 296
For example, a 2.0 COP heat pump water heater in conditioned space, in a single family home with gas space heat (70% system efficiency):
ΔTherms = -((((17.6 * 2.56 * 365.25* 8.33 * (125 – 54) * 1.0) / 3412) – (17.6 * 2.56 * 365.25* 8.33 * (125 – 54) * 1.0 / 3412 / 2.0)) * 1 * 0.49 * 0.03412) / (0.7 * 1)
= - 34.1 therms

Illinois Statewide Technical Reference Manual – 5.6.5 High Efficiency Pool Pumps
5.4.4 Low Flow Faucet Aerators
DESCRIPTION
This measure relates to the installation of a low flow faucet aerator in a household kitchen or bath faucet fixture.
This measure may be used for units provided through Efficiency Kit’s however the in service rate for such measures should be derived through evaluation results specifically for this implementation methodology.
This measure was developed to be applicable to the following program types: TOS, NC, RF, DI, KITS.
If applied to other program types, the measure savings should be verified.
DEFINITION OF EFFICIENT EQUIPMENT
To qualify for this measure the installed equipment must be a low flow faucet aerator, for bathrooms rated at 1.5 gallons per minute (GPM) or less, or for kitchens rated at 2.2 GPM or less. Savings are calculated on an average savings per faucet fixture basis.
DEFINITION OF BASELINE EQUIPMENT
The baseline condition is assumed to be a standard bathroom faucet aerator rated at 2.25 GPM or greater, or a standard kitchen faucet aerator rated at 2.75 GPM or greater. Average measured flow rates are used in the algorithm and are lower, reflecting the penetration of previously installed low flow fixtures (and therefore the freerider rate for this measure should be 0), use of the faucet at less than full flow, debris buildup, and lower water system pressure than fixtures are rated at.
DEEMED LIFETIME OF EFFICIENT EQUIPMENT
The expected measure life is assumed to be 9 years.560
DEEMED MEASURE COST
For time of sale or new construction the incremental cost for this measure is $3561 or program actual.
For faucet aerators provided through Direct Install or within Efficiency Kits, the actual program delivery costs (including labor if applicable) should be utilized. If unknown assume $8562 for Direct Install and $3 for Efficiency Kits.
LOADSHAPE
Loadshape R03 - Residential Electric DHW
COINCIDENCE FACTOR
The coincidence factor for this measure is assumed to be 2.2%.563
560 Table C-6, Measure Life Report, Residential and Commercial/Industrial Lighting and HVAC Measures, GDS Associates, June 2007. "http://neep.org/uploads/EMV%20Forum/EMV%20Studies/measure_life_GDS%5B1%5D.pdf"561 2011, Market research average of $3. 562 Includes assess and install labor time of $5 (20min @ $15/hr)563 Calculated as follows: Assume 18% aerator use takes place during peak hours (based on: Oreo et al, “The end uses of hot water in single family homes from flow trace analysis”, 2001.) There are 65 days in the summer peak period, so the percentage of total annual aerator use in peak period is 0.18*65/365 = 3.21%. The number of hours of recovery during peak periods is therefore assumed to be 3.21% *180 = 5.8 hours of recovery during peak period where 180 equals the average annual electric DHW recovery hours for faucet use including SF and MF homes. There are 260 hours in the peak period so the probability you will see savings during the peak period is 5.8/260 = 0.022
IL TRM v6.0 Vol. 3_January 25th, 2017_DRAFT Page 177 of 296

Illinois Statewide Technical Reference Manual – 5.6.5 High Efficiency Pool Pumps
Algorithm
CALCULATION OF SAVINGS
ELECTRIC ENERGY SAVINGS
Note these savings are per faucet retrofitted564 (unless faucet type is unknown, then it is per household).
ΔkWh = %ElectricDHW * ((GPM_base * L_base - GPM_low * L_low) * Household * 365.25 *DF / FPH) * EPG_electric * ISR
Where:
%ElectricDHW = proportion of water heating supplied by electric resistance heating
DHW fuel %ElectricDHWElectric 100%Natural Gas 0%Unknown 16%565
GPM_base = Average flow rate, in gallons per minute, of the baseline faucet “as-used.” This includes the effect of existing low flow fixtures and therefore the freerider rate for this measure should be 0.
= 1.39566 or custom based on metering studies567 or if measured during DI:
= Measured full throttle flow * 0.83 throttling factor568
GPM_low = Average flow rate, in gallons per minute, of the low-flow faucet aerator “as-used”
= 0.94569 or custom based on metering studies570 or if measured during DI:
= Rated full throttle flow * 0.95 throttling factor571
564 This algorithm calculates the amount of energy saved per aerator by determining the fraction of water consumption savings for the upgraded fixture. 565 Default assumption for unknown fuel is based on EIA Residential Energy Consumption Survey (RECS) 2009 for Midwest Region, data for the state of IL. If utilities have specific evaluation results providing a more appropriate assumption for homes in a particular market or geographical area then that should be used566 Deoreo, B., and P. Mayer. Residential End Uses of Water Study Update. Forthcoming. ©2015 Water Research Foundation. Reprinted With Permission.567 Measurement should be based on actual average flow consumed over a period of time rather than a onetime spot measurement for maximum flow. Studies have shown maximum flow rates do not correspond well to average flow rate due to occupant behavior which does not always use maximum flow.568 2008, Schultdt, Marc, and Debra Tachibana. Energy related Water Fixture Measurements: Securing the Baseline for Northwest Single Family Homes. 2008 ACEEE Summer Study on Energy Efficiency in Buildings. Page 1-265. www.seattle.gov/light/Conserve/Reports/paper_10.pdf569 Average retrofit flow rate for kitchen and bathroom faucet aerators from sources 2, 4, 5, and 7(see source table at end of characterization). This accounts for all throttling and differences from rated flow rates. Assumes all kitchen aerators at 2.2 gpm or less and all bathroom aerators at 1.5 gpm or less. The most comprehensive available studies did not disaggregate kitchen use from bathroom use, but instead looked at total flow and length of use for all faucets. This makes it difficult to reliably separate kitchen water use from bathroom water use. It is possible that programs installing low flow aerators lower than the 2.2 gpm for kitchens and 1.5 gpm for bathrooms will see a lower overall average retrofit flow rate.570 Measurement should be based on actual average flow consumed over a period of time rather than a onetime spot measurement for maximum flow. Studies have shown maximum flow rates do not correspond well to average flow rate due to occupant behavior which does not always use maximum flow.571 2008, Schultdt, Marc, and Debra Tachibana. Energy related Water Fixture Measurements: Securing the Baseline for Northwest Single Family Homes. 2008 ACEEE Summer Study on Energy Efficiency in Buildings. Page 1-265. www.seattle.gov/light/Conserve/Reports/paper_10.pdf
IL TRM v6.0 Vol. 3_January 25th, 2017_DRAFT Page 178 of 296

Illinois Statewide Technical Reference Manual – 5.6.5 High Efficiency Pool Pumps
L_base = Average baseline daily length faucet use per capita for faucet of interest in minutes
= if available custom based on metering studies, if not use:
Faucet Type L_base (min/person/day)Kitchen 4.5572
Bathroom 1.6573
If location unknown (total for household): Single-Family 9.0574
If location unknown (total for household): Multi-Family 6.9575
L_low = Average retrofit daily length faucet use per capita for faucet of interest in minutes
= if available custom based on metering studies, if not use:
Faucet Type L_low (min/person/day)Kitchen 4.5576
Bathroom 1.6577
If location unknown (total for household): Single-Family 9.0578
If location unknown (total for household): Multi-Family 6.9579
Household = Average number of people per household
Household Unit Type HouseholdSingle-Family - Deemed 2.56580
Multi-Family - Deemed 2.1581
Custom Actual Occupancy or Number of Bedrooms582
365.25 = Days in a year, on average.
572 Cadmus and Opinion Dynamics Showerhead and Faucet Aerator Meter Study Memorandum dated June 2013, directed to Michigan Evaluation Working Group. This study of 135 single and multi-family homes in Michigan metered energy parameters for efficient showerhead and faucet aerators.573 Ibid.574 One kitchen faucet plus 2.83 bathroom faucets. Based on findings from a 2009 ComEd residential survey of 140 sites, provided by Cadmus. 575 One kitchen faucet plus 1.5 bathroom faucets. Based on findings from a 2009 ComEd residential survey of 140 sites, provided by Cadmus.576 Cadmus and Opinion Dynamics Showerhead and Faucet Aerator Meter Study Memorandum dated June 2013, directed to Michigan Evaluation Working Group.577 Ibid.578 One kitchen faucet plus 2.83 bathroom faucets. Based on findings from a 2009 ComEd residential survey of 140 sites, provided by Cadmus.579 One kitchen faucet plus 1.5 bathroom faucets. Based on findings from a 2009 ComEd residential survey of 140 sites, provided by Cadmus.580 ComEd Energy Efficiency/ Demand Response Plan: Plan Year 2 (6/1/2009-5/31/2010) Evaluation Report: All Electric Single Family Home Energy Performance Tune-Up Program citing 2006-2008 American Community Survey data from the US Census Bureau for Illinois cited on p. 17 of the PY2 Evaluation report. 2.75 * 93% evaluation adjustment581 Navigant, ComEd PY3 Multi-Family Home Energy Savings Program Evaluation Report Final, May 16, 2012. 582 Bedrooms are suitable proxies for household occupancy, and may be preferable to actual occupancy due to turnover rates in residency and non-adult population impacts.
IL TRM v6.0 Vol. 3_January 25th, 2017_DRAFT Page 179 of 296
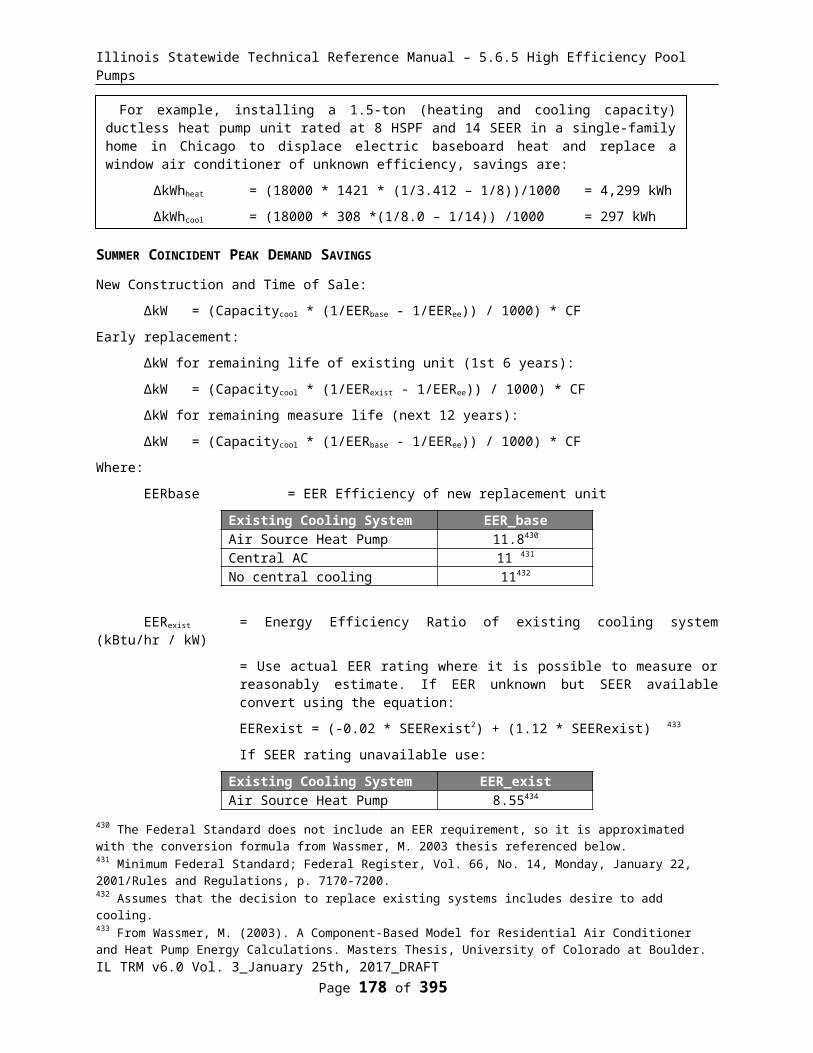
Illinois Statewide Technical Reference Manual – 5.6.5 High Efficiency Pool Pumps
DF = Drain Factor
Faucet Type Drain Factor583
Kitchen 75%Bath 90%Unknown 79.5%
FPH = Faucets Per Household
0 FPHKitchen Faucets Per Home (KFPH) 1
Bathroom Faucets Per Home (BFPH): Single-Family 2.83584
Bathroom Faucets Per Home (BFPH): Multi-Family 1.5585
If location unknown (total for household): Single-Family 3.83
If location unknown (total for household): Multi-Family 2.5
EPG_electric = Energy per gallon of water used by faucet supplied by electric water heater
= (8.33 * 1.0 * (WaterTemp - SupplyTemp)) / (RE_electric * 3412)
= (8.33 * 1.0 * (86 – 54.1)) / (0.98 * 3412)
= 0.0795 kWh/gal (Bath), 0.0969 kWh/gal (Kitchen), 0.0919 kWh/gal (Unknown)
8.33 = Specific weight of water (lbs/gallon)
1.0 = Heat Capacity of water (btu/lb-°F)
WaterTemp = Assumed temperature of mixed water
= 86F for Bath, 93F for Kitchen 91F for Unknown586
SupplyTemp = Assumed temperature of water entering house
= 54.1F 587
RE_electric = Recovery efficiency of electric water heater
= 98% 588
583 Because faucet usages are at times dictated by volume, only usage of the sort that would go straight down the drain will provide savings. VEIC is unaware of any metering study that has determined this specific factor and so through consensus with the Illinois Technical Advisory Group have deemed these values to be 75% for the kitchen and 90% for the bathroom. If the aerator location is unknown an average of 79.5% should be used which is based on the assumption that 70% of household water runs through the kitchen faucet and 30% through the bathroom (0.7*0.75)+(0.3*0.9)=0.795.584Based on findings from a 2009 ComEd residential survey of 140 sites, provided by Cadmus.585 Ibid.586 Cadmus and Opinion Dynamics Showerhead and Faucet Aerator Meter Study Memorandum dated June 2013, directed to Michigan Evaluation Working Group. If the aerator location is unknown an average of 91% should be used which is based on the assumption that 70% of household water runs through the kitchen faucet and 30% through the bathroom (0.7*93)+(0.3*86)=0.91.587 US DOE Building America Program. Building America Analysis Spreadsheet. For Chicago, IL http://www1.eere.energy.gov/buildings/building_america/analysis_spreadsheets.html. 588 Electric water heaters have recovery efficiency of 98%: http://www.ahridirectory.org/ahridirectory/pages/home.aspx
IL TRM v6.0 Vol. 3_January 25th, 2017_DRAFT Page 180 of 296

Illinois Statewide Technical Reference Manual – 5.6.5 High Efficiency Pool Pumps
3412 = Converts Btu to kWh (btu/kWh)
ISR = In service rate of faucet aerators dependant on install method as listed in table below
Selection ISR
Direct Install - Single Family 0.95589
Direct Install – Multi Family Kitchen 0.91590
Direct Install – Multi Family Bathroom 0.95591
Efficiency Kit Bathroom Aerator 0.63592
Efficiency Kit Kitchen Aerator 0.60593
Distributed School Efficiency Kit Aerator
To be determined through evaluation
SUMMER COINCIDENT PEAK DEMAND SAVINGS
ΔkW = ΔkWh / Hours * CF
Where:
ΔkWh = calculated value above
Hours = Annual electric DHW recovery hours for faucet use per faucet
589 ComEd Energy Efficiency/ Demand Response Plan: Plan Year 2 (6/1/2009-5/31/2010) Evaluation Report: All Electric Single Family Home Energy Performance Tune-Up Program Table 3-8590 Navigant, ComEd-Nicor Gas EPY4/GPY1 Multi-Family Home Energy Savings Program Evaluation Report DRAFT 2013-01-28591 Ibid.592 From Navigant memo, “Nicor Gas energySMART Energy Saving Kits Program In Service Rate and ProcessAnalysis”, August 28, 2015.593 Ibid.
IL TRM v6.0 Vol. 3_January 25th, 2017_DRAFT Page 181 of 296
For example, a direct installed kitchen low flow faucet aerator in a single-family electric DHW home:
ΔkWh = 1.0 * (((1.39 * 4.5 – 0.94 * 4.5) * 2.56 * 365.25 *0.75) / 1) * 0.0969 * 0.95
= 131 kWh
For example, a direct installed bath low flow faucet aerator in a multi-family electric DHW home:
ΔkWh = 1.0 * (((1.39 * 1.6 – 0.94 * 1.6) * 2.1 * 365.25 * 0.90) /1.5) * 0.0795 * 0.95
= 25.0 kWh
For example, a direct installed low flow faucet aerator in unknown faucet in a single-family electric DHW home:
ΔkWh = 1.0 * (((1.39 * 9.0 – 0.94 * 9.0) * 2.56 * 365.25 * 0.795) /3.83) * 0.0919 * 0.95
= 68.6 kWh

Illinois Statewide Technical Reference Manual – 5.6.5 High Efficiency Pool Pumps
= ((GPM_base * L_base) * Household/FPH * 365.25 * DF ) * 0.545594 / GPH
Building Type
Faucet location Calculation Hours per
faucet
Single Family
Kitchen ((1.39 * 4.5) * 2.56/1 * 365.25 * 0.75) * 0.545 / 25.5 94Bathroom ((1. 39 * 1.6) * 2.56/2.83 * 365.25 * 0.9) * 0.545 / 25.5 14Unknown ((1. 39 * 9.0) * 2.56/3.83 * 365.25 * 0.795) * 0.545 / 25.5 52
Multi Family
Kitchen ((1. 39 * 4.5) * 2.1/1 * 365.25 * 0.75) * 0.545 / 25.5 77Bathroom ((1. 39 * 1.6) * 2.1/1.5 * 365.25 * 0.9) * 0.545 / 25.5 22Unknown ((1. 39 * 6.9) * 2.1/2.5 * 365.25 * 0.795) * 0.545 / 25.5 50
GPH = Gallons per hour recovery of electric water heater calculated for 70.9F temp rise (125-54.1), 98% recovery efficiency, and typical 4.5kW electric resistance storage tank.
= 25.5
CF = Coincidence Factor for electric load reduction
= 0.022595
NATURAL GAS SAVINGS
ΔTherms = %FossilDHW * ((GPM_base * L_base - GPM_low * L_low) * Household * 365.25 *DF / FPH) * EPG_gas * ISR
Where:
%FossilDHW = proportion of water heating supplied by Natural Gas heating
DHW fuel %Fossil_DHWElectric 0%Natural Gas 100%Unknown 84%596
EPG_gas = Energy per gallon of Hot water supplied by gas
= (8.33 * 1.0 * (WaterTemp - SupplyTemp)) / (RE_gas * 100,000)
= 0.00341 Therm/gal for SF homes (Bath), 0.00415 Therm/gal for SF homes (Kitchen), 0.00394 Therm/gal for SF homes (Unknown)
= 0.00397 Therm/gal for MF homes (Bath), 0.00484 Therm/gal for MF homes (Kitchen),
594 54.5% is the proportion of hot 120F water mixed with 54.1F supply water to give 90F mixed faucet water. 595 Calculated as follows: Assume 18% aerator use takes place during peak hours (based on: Oreo et al, “The end uses of hot water in single family homes from flow trace analysis”, 2001.) There are 65 days in the summer peak period, so the percentage of total annual aerator use in peak period is 0.18*65/365 = 3.21%. The number of hours of recovery during peak periods is therefore assumed to be 3.21% *180 = 5.8 hours of recovery during peak period where 180 equals the average annual electric DHW recovery hours for faucet use including SF and MF homes. There are 260 hours in the peak period so the probability you will see savings during the peak period is 5.8/260 = 0.022596 Default assumption for unknown fuel is based on EIA Residential Energy Consumption Survey (RECS) 2009 for Midwest Region, data for the state of IL. If utilities have specific evaluation results providing a more appropriate assumption for homes in a particular market or geographical area then that should be used
IL TRM v6.0 Vol. 3_January 25th, 2017_DRAFT Page 182 of 296
For example, a direct installed kitchen low flow faucet aerator in a single family electric DHW home:
ΔkW = 131/94 * 0.022
= 0.0306 kW

Illinois Statewide Technical Reference Manual – 5.6.5 High Efficiency Pool Pumps
0.00459 Therm/gal for MF homes (Unknown)
RE_gas = Recovery efficiency of gas water heater
= 78% For SF homes597
= 67% For MF homes598
100,000 = Converts Btus to Therms (btu/Therm)
Other variables as defined above.
WATER IMPACT DESCRIPTIONS AND CALCULATION
Δgallons = ((GPM_base * L_base - GPM_low * L_low) * Household * 365.25 *DF / FPH) * ISR
Variables as defined above
597 DOE Final Rule discusses Recovery Efficiency with an average around 0.76 for Gas Fired Storage Water heaters and 0.78 for standard efficiency gas fired tankless water heaters up to 0.95 for the highest efficiency gas fired condensing tankless water heaters. These numbers represent the range of new units however, not the range of existing units in stock. Review of AHRI Directory suggests range of recovery efficiency ratings for new Gas DHW units of 70-87%. Average of existing units is estimated at 78%.598 Water heating in multi-family buildings is often provided by a larger central boiler. This suggests that the average recovery efficiency is somewhere between a typical central boiler efficiency of 0.59 and the 0.75 for single family homes. An average efficiency of 0.67 is used for this analysis as a default for multi-family buildings.
IL TRM v6.0 Vol. 3_January 25th, 2017_DRAFT Page 183 of 296
For example, a direct-installed kitchen low flow faucet aerator in a fuel DHW single-family home:
ΔTherms = 1.0 * (((1.39 * 4.5 – 0.94 * 4.5) * 2.56 * 365.25 *0.75) / 1) * 0.00415 * 0.95
= 5.60 Therms
For example, a direct installed bath low flow faucet aerator in a fuel DHW multi-family home:
ΔTherms = 1.0 * (((1.39 * 1.6 – 0.94 * 1.6) * 2.1 * 365.25 * 0.90) /1.5) * 0.003974 * 0.95
= 1.25 Therms
For example, a direct installed low flow faucet aerator in unknown faucet in a fuel DHW single-family home:
ΔTherms = 1.0 * (((1.39 * 9.0 – 0.94 * 9.0) * 2.56 * 365.25 * 0.795) /3.83) * 0.00394 * 0.95
= 2.94 Therms
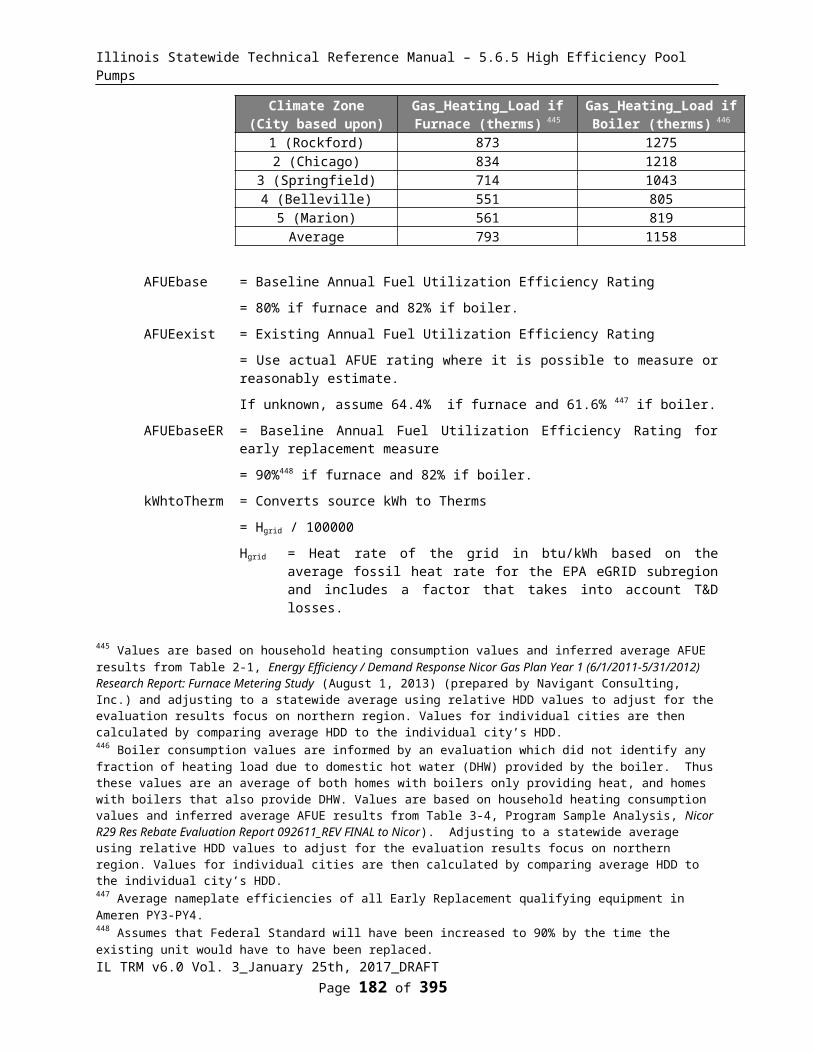
Illinois Statewide Technical Reference Manual – 5.6.5 High Efficiency Pool Pumps
DEEMED O&M COST ADJUSTMENT CALCULATION
N/A
SOURCES
Source ID Reference
1 2011, DeOreo, William. California Single Family Water Use Efficiency Study. April 20, 2011.
2 2000, Mayer, Peter, William DeOreo, and David Lewis. Seattle Home Water Conservation Study. December 2000.
3 1999, Mayer, Peter, William DeOreo. Residential End Uses of Water. Published by AWWA Research Foundation and American Water Works Association. 1999.
42003, Mayer, Peter, William DeOreo. Residential Indoor Water Conservation Study. Aquacraft, Inc. Water Engineering and Management. Prepared for East Bay Municipal Utility District and the US EPA. July 2003.
5 2011, DeOreo, William. Analysis of Water Use in New Single Family Homes. By Aquacraft. For Salt Lake City Corporation and US EPA. July 20, 2011.
6 2011, Aquacraft. Albuquerque Single Family Water Use Efficiency and Retrofit Study. For Albuquerque Bernalillo County Water Utility Authority. December 1, 2011.
72008, Schultdt, Marc, and Debra Tachibana. Energy related Water Fixture Measurements: Securing the Baseline for Northwest Single Family Homes. 2008 ACEEE Summer Study on Energy Efficiency in Buildings.
MEASURE CODE: RS-HWE-LFFA-V06-180101
REVIEW DEADLINE: 1/1/2021
IL TRM v6.0 Vol. 3_January 25th, 2017_DRAFT Page 184 of 296
For example, a direct-installed kitchen low flow aerator in a single family home
Δgallons = (((1.39 * 4.5 – 0.94 * 4.5) * 2.56 * 365.25 *0.75) / 1) * 0.95
= 1350 gallons
For example, a direct installed bath low flow faucet aerator in a multi-family home:
Δgallons = (((1.39 * 1.6 – 0.94 * 1.6) * 2.1 * 365.25 * 0.90) /1.5) * 0.95
= 314 gallons
For example, a direct installed low flow faucet aerator in unknown faucet in a single-family home:
Δgallons = (((1.39 * 9.0 – 0.94 * 9.0) * 2.56 * 365.25 * 0.795) /3.83) * 0.95
= 747 gallons

Illinois Statewide Technical Reference Manual – 5.6.5 High Efficiency Pool Pumps
5.4.5 Low Flow Showerheads
DESCRIPTION
This measure relates to the installation of a low flow showerhead in a single or multi-family household.
This measure may be used for units provided through Efficiency Kit’s however the in service rate for such measures should be derived through evaluation results specifically for this implementation methodology.
This measure was developed to be applicable to the following program types: TOS, RF, NC, DI, KITS.
If applied to other program types, the measure savings should be verified.
DEFINITION OF EFFICIENT EQUIPMENT
To qualify for this measure the installed equipment must be a low flow showerhead rated at 2.0 gallons per minute (GPM) or less. Savings are calculated on a per showerhead fixture basis.
DEFINITION OF BASELINE EQUIPMENT
For Direct-install programs, the baseline condition is assumed to be a standard showerhead rated at 2.5 GPM or greater.
For retrofit and time-of-sale programs, the baseline condition is assumed to be a representative average of existing showerhead flow rates of participating customers including a range of low flow showerheads, standard-flow showerheads, and high-flow showerheads.
DEEMED LIFETIME OF EFFICIENT EQUIPMENT
The expected measure life is assumed to be 10 years.599
DEEMED MEASURE COST
For time of sale or new construction the incremental cost for this measure is $7600 or program actual.
For low flow showerheads provided through Direct Install or within Efficiency Kits, the actual program delivery costs (including labor if applicable) should be utilized. If unknown assume $12601 for Direct Install and $7 for Efficiency Kits.
LOADSHAPE
Loadshape R03 - Residential Electric DHW
COINCIDENCE FACTOR
The coincidence factor for this measure is assumed to be 2.78%.602
599 Table C-6, Measure Life Report, Residential and Commercial/Industrial Lighting and HVAC Measures, GDS Associates, June 2007. Evaluations indicate that consumer dissatisfaction may lead to reductions in persistence, particularly in Multi-Family , "http://neep.org/uploads/EMV%20Forum/EMV%20Studies/measure_life_GDS%5B1%5D.pdf"600 Market research average of $7. 601 Includes assess and install labor time of $5 (20min @ $15/hr)602 Calculated as follows: Assume 11% showers take place during peak hours (based on: Oreo et al, “The end uses of hot water in single family homes from flow trace analysis”, 2001.). There are 65 days in the summer peak period, so the percentage of total annual aerator use in peak period is 0.11*65/365 = 1.96%. The number of hours of recovery during peak periods is therefore assumed to be 1.96% * 369 = 7.23 hours of recovery during peak period, where 369 equals the average annual electric DHW recovery hours for showerhead use including SF and MF homes with Direct Install and Retrofit/TOS measures. There are 260 hours in the peak period so the probability you will see savings during the peak period is 7.23/260 = 0.0278
IL TRM v6.0 Vol. 3_January 25th, 2017_DRAFT Page 185 of 296
Illinois Statewide Technical Reference Manual – 5.6.5 High Efficiency Pool Pumps
Algorithm
CALCULATION OF SAVINGS
ELECTRIC ENERGY SAVINGS
Note these savings are per showerhead fixture
ΔkWh = %ElectricDHW * ((GPM_base * L_base - GPM_low * L_low) * Household * SPCD * 365.25 / SPH) * EPG_electric * ISR
Where:
%ElectricDHW = proportion of water heating supplied by electric resistance heating
DHW fuel %ElectricDHWElectric 100%Natural Gas 0%Unknown 16%603
GPM_base = Flow rate of the baseline showerhead
Program GPM_baseDirect-install 2.67604
Retrofit, Efficiency Kits, NC or TOS 2.35605
GPM_low = As-used flow rate of the low-flow showerhead, which may, as a result of measurements of program evaulations deviate from rated flows, see table below:
Rated Flow2.0 GPM
1.75 GPM1.5 GPM
Custom or Actual606
L_base = Shower length in minutes with baseline showerhead
= 7.8 min607
603 Default assumption for unknown fuel is based on EIA Residential Energy Consumption Survey (RECS) 2009 for Midwest Region, data for the state of IL. If utilities have specific evaluation results providing a more appropriate assumption for homes in a particular market or geographical area then that should be used604 Based on measured data from Ameren IL EM&V of Direct-Install program. Program targets showers that are rated 2.5 GPM or above.605 Representative value from sources 1, 2, 4, 5, 6 and 7 (See Source Table at end of measure section) adjusted slightly upward to account for program participation which is expected to target customers with existing higher flow devices rather than those with existing low flow devices.606 Note that actual values may be either a) program-specific minimum flow rate, or b) program-specific evaluation-based value of actual effective flow-rate due to increased duration or temperatures. The latter increases in likelihood as the rated flow drops and may become significant at or below rated flows of 1.5 GPM. The impact can be viewed as the inverse of the throttling described in the footnote for baseline flowrate.607 Cadmus and Opinion Dynamics Showerhead and Faucet Aerator Meter Study Memorandum dated June 2013, directed to Michigan Evaluation Working Group. This study of 135 single and multi-family homes in Michigan metered energy parameters for efficient showerhead and faucet aerators.
IL TRM v6.0 Vol. 3_January 25th, 2017_DRAFT Page 186 of 296

Illinois Statewide Technical Reference Manual – 5.6.5 High Efficiency Pool Pumps
L_low = Shower length in minutes with low-flow showerhead
= 7.8 min608
Household = Average number of people per household
Household Unit Type609 HouseholdSingle-Family - Deemed 2.56610
Multi-Family - Deemed 2.1611
CustomActual Occupancy
or Number of Bedrooms612
SPCD = Showers Per Capita Per Day
= 0.6613
365.25 = Days per year, on average.
SPH = Showerheads Per Household so that per-showerhead savings fractions can be determined
Household Type SPHSingle-Family 1.79614
Multi-Family 1.3615
Custom Actual
EPG_electric = Energy per gallon of hot water supplied by electric
= (8.33 * 1.0 * (ShowerTemp - SupplyTemp)) / (RE_electric * 3412)
= (8.33 * 1.0 * (101 – 54.1)) / (0.98 * 3412)
= 0.117 kWh/gal
8.33 = Specific weight of water (lbs/gallon)
1.0 = Heat Capacity of water (btu/lb-°)
ShowerTemp = Assumed temperature of water
= 101F 616
SupplyTemp = Assumed temperature of water entering house
608 Ibid.609 If household type is unknown, as may be the case for time of sale measures, then single family deemed value shall be used.610 ComEd Energy Efficiency/ Demand Response Plan: Plan Year 2 (6/1/2009-5/31/2010) Evaluation Report: All Electric Single Family Home Energy Performance Tune-Up Program citing 2006-2008 American Community Survey data from the US Census Bureau for Illinois cited on p. 17 of the PY2 Evaluation report. 2.75 * 93% evaluation adjustment611 ComEd PY3 Multi-Family Evaluation Report REVISED DRAFT v5 2011-12-08.docx612 Bedrooms are suitable proxies for household occupancy, and may be preferable to actual occupancy due to turnover rates in residency and non-adult population impacts.613 Cadmus and Opinion Dynamics Showerhead and Faucet Aerator Meter Study Memorandum dated June 2013, directed to Michigan Evaluation Working Group.614 Based on findings from a 2009 ComEd residential survey of 140 sites, provided by Cadmus.615 Ibid.616 Cadmus and Opinion Dynamics Showerhead and Faucet Aerator Meter Study Memorandum dated June 2013, directed to Michigan Evaluation Working Group.
IL TRM v6.0 Vol. 3_January 25th, 2017_DRAFT Page 187 of 296

Illinois Statewide Technical Reference Manual – 5.6.5 High Efficiency Pool Pumps
= 54.1F 617
RE_electric = Recovery efficiency of electric water heater
= 98% 618
3412 = Converts Btu to kWh (btu/kWh)
ISR = In service rate of showerhead
= Dependant on program delivery method as listed in table below
Selection ISRDirect Install - Single Family 0.98619
Direct Install – Multi Family 0.95620
Efficiency Kits--One showerhead kit 0.65621
Efficiency Kits—Two showerhead kit 0.67622
Distributed School Efficiency Kit showerhead
To be determined through evaluation
SUMMER COINCIDENT PEAK DEMAND SAVINGS
ΔkW = ΔkWh/Hours * CF
Where:
ΔkWh = calculated value above
Hours = Annual electric DHW recovery hours for showerhead use
= ((GPM_base * L_base) * Household * SPCD * 365.25 ) * 0.712623 / GPH
= 302 for SF Direct Install; 248 for MF Direct Install
= 266 for SF Retrofit, Efficiency Kits, NC and TOS; 218 for MF Retrofit, Efficiency Kits, NC and TOS
GPH = Gallons per hour recovery of electric water heater calculated for 65.9F temp rise (120-54.1), 98% recovery efficiency, and typical 4.5kW electric resistance storage tank.
= 27.51
617 US DOE Building America Program. Building America Analysis Spreadsheet. For Chicago, IL http://www1.eere.energy.gov/buildings/building_america/analysis_spreadsheets.html. 618 Electric water heaters have recovery efficiency of 98%: http://www.ahridirectory.org/ahridirectory/pages/home.aspx619 Deemed values are from ComEd Energy Efficiency/ Demand Response Plan: Plan Year 2 (6/1/2009-5/31/2010) Evaluation Report: All Electric Single Family Home Energy Performance Tune-Up Program Table 3-8. Alternative ISRs may be developed for program delivery methods based on evaluation results.620 Navigant, ComEd-Nicor Gas EPY4/GPY1 Multi-Family Home Energy Savings Program Evaluation Report FINAL 2013-06-05621 From Navigant memo, “Nicor Gas energySMART Energy Saving Kits Program In Service Rate and ProcessAnalysis”, August 28, 2015.622 Ibid623 71.2% is the proportion of hot 120F water mixed with 54.1F supply water to give 101F shower water.
IL TRM v6.0 Vol. 3_January 25th, 2017_DRAFT Page 188 of 296
For example, a direct-installed 1.5 GPM low flow showerhead in a single family home with electric DHW where the number of showers is not known:
ΔkWh = 1.0 * ((2.67 * 7.8 – 1.5 * 7.8) * 2.56 * 0.6 * 365.25 / 1.79) * 0.117 * 0.98
= 328 kWh

Illinois Statewide Technical Reference Manual – 5.6.5 High Efficiency Pool Pumps
CF = Coincidence Factor for electric load reduction
= 0.0278624
NATURAL GAS SAVINGS
ΔTherms = %FossilDHW * ((GPM_base * L_base - GPM_low * L_low) * Household * SPCD * 365.25 / SPH) * EPG_gas * ISR
Where:
%FossilDHW = proportion of water heating supplied by Natural Gas heating
DHW fuel %Fossil_DHWElectric 0%Natural Gas 100%Unknown 84%625
EPG_gas = Energy per gallon of Hot water supplied by gas
= (8.33 * 1.0 * (ShowerTemp - SupplyTemp)) / (RE_gas * 100,000)
= 0.00501 Therm/gal for SF homes
= 0.00583 Therm/gal for MF homes
RE_gas = Recovery efficiency of gas water heater
= 78% For SF homes626
= 67% For MF homes627
100,000 = Converts Btus to Therms (btu/Therm)
Other variables as defined above.
624 Calculated as follows: Assume 11% showers take place during peak hours (based on: Oreo et al, “The end uses of hot water in single family homes from flow trace analysis”, 2001.). There are 65 days in the summer peak period, so the percentage of total annual aerator use in peak period is 0.11*65/365 = 1.96%. The number of hours of recovery during peak periods is therefore assumed to be 1.96% * 369 = 7.23 hours of recovery during peak period where 369 equals the average annual electric DHW recovery hours for showerhead use including SF and MF homes with Direct Install and Retrofit/TOS measures. There are 260 hours in the peak period so the probability you will see savings during the peak period is 7.23/260 = 0.0278625 Default assumption for unknown fuel is based on EIA Residential Energy Consumption Survey (RECS) 2009 for Midwest Region, data for the state of IL. If utilities have specific evaluation results providing a more appropriate assumption for homes in a particular market or geographical area then that should be used626 DOE Final Rule discusses Recovery Efficiency with an average around 0.76 for Gas Fired Storage Water heaters and 0.78 for standard efficiency gas fired tankless water heaters up to 0.95 for the highest efficiency gas fired condensing tankless water heaters. These numbers represent the range of new units however, not the range of existing units in stock. Review of AHRI Directory suggests range of recovery efficiency ratings for new Gas DHW units of 70-87%. Average of existing units is estimated at 78%.627 Water heating in multi-family buildings is often provided by a larger central boiler. This suggests that the average recovery efficiency is somewhere between a typical central boiler efficiency of 0.59 and the 0.75 for single family homes. An average efficiency of 0.67 is used for this analysis as a default for multi-family buildings.
IL TRM v6.0 Vol. 3_January 25th, 2017_DRAFT Page 189 of 296
For example, a direct installed 1.5 GPM low flow showerhead in a single family home with electric DHW where the number of showers is not known:
ΔkW = 328/302 * 0.0278
= 0.0302 kW

Illinois Statewide Technical Reference Manual – 5.6.5 High Efficiency Pool Pumps
WATER IMPACT DESCRIPTIONS AND CALCULATION
Δgallons = ((GPM_base * L_base - GPM_low * L_low) * Household * SPCD * 365.25 / SPH) * ISR
Variables as defined above
DEEMED O&M COST ADJUSTMENT CALCULATION
N/A
SOURCES
Source ID Reference1 2011, DeOreo, William. California Single Family Water Use Efficiency Study. April 20, 2011.
2 2000, Mayer, Peter, William DeOreo, and David Lewis. Seattle Home Water Conservation Study. December 2000.
3 1999, Mayer, Peter, William DeOreo. Residential End Uses of Water. Published by AWWA Research Foundation and American Water Works Association. 1999.
42003, Mayer, Peter, William DeOreo. Residential Indoor Water Conservation Study. Aquacraft, Inc. Water Engineering and Management. Prepared for East Bay Municipal Utility District and the US EPA. July 2003.
5 2011, DeOreo, William. Analysis of Water Use in New Single Family Homes. By Aquacraft. For Salt Lake City Corporation and US EPA. July 20, 2011.
6 2011, Aquacraft. Albuquerque Single Family Water Use Efficiency and Retrofit Study. For Albuquerque Bernalillo County Water Utility Authority. December 1, 2011.
72008, Schultdt, Marc, and Debra Tachibana. Energy related Water Fixture Measurements: Securing the Baseline for Northwest Single Family Homes. 2008 ACEEE Summer Study on Energy Efficiency in Buildings.
MEASURE CODE: RS-HWE-LFSH-V05-180101
REVIEW DEADLINE: 1/1/2023
IL TRM v6.0 Vol. 3_January 25th, 2017_DRAFT Page 190 of 296
For example, a direct installed 1.5 GPM low flow showerhead in a gas fired DHW single family home where the number of showers is not known:
ΔTherms = 1.0 * ((2.67 * 7.8 – 1.5 * 7.8) * 2.56 * 0.6 * 365.25 / 1.79) * 0.00501 * 0.98
= 14.0 therms
For example, a direct installed 1.5 GPM low flow showerhead in a single family home where the number of showers is not known:
Δgallons = ((2.67 * 7.8 – 1.5 * 7.8) * 2.56 * 0.6 * 365.25 / 1.79) * 0.98
= 2803 gallons

Illinois Statewide Technical Reference Manual – 5.6.5 High Efficiency Pool Pumps
5.4.6 Water Heater Temperature Setback
DESCRIPTION
This measure was developed to be applicable to the following program types: NC, RF, DI, KITS.
If applied to other program types, the measure savings should be verified.
DEFINITION OF EFFICIENT EQUIPMENT
High efficiency is a hot water tank with the thermostat reduced to no lower than 120 degrees.
DEFINITION OF BASELINE EQUIPMENT
The baseline condition is a hot water tank with a thermostat setting that is higher than 120 degrees, typically systems with settings of 130 degrees or higher. Note if there are more than one DHW tanks in the home at or higher than 130 degrees and they are all turned down, then the savings per tank can be multiplied by the number of tanks.
DEEMED LIFETIME OF EFFICIENT EQUIPMENT
The assumed lifetime of the measure is 2 years.
DEEMED MEASURE COST
The incremental cost of a setback is assumed to be $5 for contractor time, or no cost if the measure is self-installed.
LOADSHAPE
Loadshape R03 - Residential Electric DHW
COINCIDENCE FACTOR
The summer peak coincidence factor for this measure is assumed to be 1.
Algorithm
CALCULATION OF SAVINGS
ELECTRIC ENERGY SAVINGS
For homes with electric DHW tanks:
ΔkWh628 = (U * A * (Tpre – Tpost) * Hours * ISR) / (3412 * RE_electric)
Where:
U = Overall heat transfer coefficient of tank (Btu/Hr-°F-ft2).
= Actual if known. If unknown assume R-12, U = 0.083
628 Note this algorithm provides savings only from reduction in standby losses. The TAC considered avoided energy from not heating the water to the higher temperature but determined that dishwashers are likely to boost the temperature within the unit (roughly canceling out any savings), faucet and shower use is likely to be at the same temperature so there would need to be more lower temperature hot water being used (cancelling any savings) and clothes washers will only see savings if the water from the tank is taken without any temperature control. It was felt the potential impact was too small to be characterized.
IL TRM v6.0 Vol. 3_January 25th, 2017_DRAFT Page 191 of 296

Illinois Statewide Technical Reference Manual – 5.6.5 High Efficiency Pool Pumps
A = Surface area of storage tank (square feet)
= Actual if known. If unknown use table below based on capacity of tank. If capacity unknown assume 50 gal tank; A = 24.99ft2
Capacity (gal) A (ft2)629
30 19.1640 23.1850 24.9980 31.84
Tpre = Actual hot water setpoint prior to adjustment
Tpost = Actual new hot water setpoint, which may not be lower than 120 degrees
Default Hot Water Temperature InputsTpre 135Tpost 120
Hours = Number of hours in a year (since savings are assumed to be constant over year).
= 8766
ISR = In service rate of measure
= Dependant on program delivery method as listed in table below
Delivery method ISR
Instructions provided in a Kit To be determined through evaluation
All other 1.0
3412 = Conversion from Btu to kWh
RE_electric = Recovery efficiency of electric hot water heater
= 0.98 630
A deemed savings assumption, where site specific assumptions are not available would be as follows:
ΔkWh = (U * A * (Tpre – Tpost) * Hours) / (3412 * RE_electric)
= (((0.083 * 24.99) * (135 – 120) * 8766) / (3412 * 0.98)
= 81.6 kWh
SUMMER COINCIDENT PEAK DEMAND SAVINGS
∆kW = ∆kWh / Hours * CF
Where:
Hours = 8766
CF = Summer Peak Coincidence Factor for measure
= 1
629 Assumptions from PA TRM. Area values were calculated from average dimensions of several commercially available units, with radius values measured to the center of the insulation. 630 Electric water heaters have recovery efficiency of 98%: http://www.ahridirectory.org/ahridirectory/pages/home.aspx
IL TRM v6.0 Vol. 3_January 25th, 2017_DRAFT Page 192 of 296
Illinois Statewide Technical Reference Manual – 5.6.5 High Efficiency Pool Pumps
A deemed savings assumption, where site specific assumptions are not available would be as follows:
ΔkW = (81.6/ 8766) * 1
ΔkW default = 0.00931 kW
NATURAL GAS SAVINGS
For homes with gas water heaters:
ΔTherms = (U * A * (Tpre – Tpost) * Hours) / (100,000 * RE_gas)
Where
100,000 = Converts Btus to Therms (btu/Therm)
RE_gas = Recovery efficiency of gas water heater
= 78% For SF homes631
= 67% For MF homes632
A deemed savings assumption, where site specific assumptions are not available would be as follows:
For Single Family homes:
ΔTherms = (U * A * (Tpre – Tpost) * Hours) / (RE_gas)
= (((0.083 * 24.99) * (135 – 120) * 8766) / (100,000 * 0.78)
= 3.5 Therms
For Multi Family homes:
ΔTherms = (U * A * (Tpre – Tpost) * Hours) / (RE_gas)
= (((0.083 * 24.99) * (135 – 120) * 8766) / (100,000 * 0.67)
= 4.1 Therms
WATER IMPACT DESCRIPTIONS AND CALCULATION
N/A
DEEMED O&M COST ADJUSTMENT CALCULATION
N/A
MEASURE CODE: RS-HWE-TMPS-V05-160601
REVIEW DEADLINE: 1/1/2022
631 DOE Final Rule discusses Recovery Efficiency with an average around 0.76 for Gas Fired Storage Water heaters and 0.78 for standard efficiency gas fired tankless water heaters up to 0.95 for the highest efficiency gas fired condensing tankless water heaters. These numbers represent the range of new units however, not the range of existing units in stock. Review of AHRI Directory suggests range of recovery efficiency ratings for new Gas DHW units of 70-87%. Average of existing units is estimated at 78%.632 Water heating in multi-family buildings is often provided by a larger central boiler. This suggests that the average recovery efficiency is somewhere between a typical central boiler efficiency of 0.59 and the 0.75 for single family homes. An average efficiency of 0.67 is used for this analysis as a default for multi-family buildings.
IL TRM v6.0 Vol. 3_January 25th, 2017_DRAFT Page 193 of 296
Illinois Statewide Technical Reference Manual – 5.6.5 High Efficiency Pool Pumps
5.4.7 Water Heater Wrap
DESCRIPTION
This measure relates to a Tank Wrap or insulation “blanket” that is wrapped around the outside of a hot water tank to reduce stand-by losses. This measure applies only for homes that have an electric water heater that is not already well insulated. Generally this can be determined based upon the appearance of the tank.633
This measure was developed to be applicable to the following program types: RF, DI.
If applied to other program types, the measure savings should be verified.
DEFINITION OF EFFICIENT EQUIPMENT
The measure is a properly installed, R-8 or greater insulating tank wrap to reduce standby energy losses from the tank to the surrounding ambient area.
DEFINITION OF BASELINE EQUIPMENT
The baseline is a standard electric domestic hot water tank without an additional tank wrap. Gas storage water heaters are excluded due to the limitations of retrofit wrapping and the associated impacts on reduced savings and safety.
DEEMED LIFETIME OF EFFICIENT EQUIPMENT
The measure life is assumed to be 5 years634.
DEEMED MEASURE COST
The incremental cost for this measure will be the actual material cost of procuring and labor cost of installing the tank wrap.
LOADSHAPE
Loadshape R03 - Residential Electric DHW
COINCIDENCE FACTOR
This measure assumes a flat loadshape and as such the coincidence factor is 1.
Algorithm
CALCULATION OF SAVINGS
ELECTRIC ENERGY SAVINGS
For electric DHW systems:
ΔkWh = ((Abase / Rbase – Ainsul / Rinsul) * ΔT * Hours) / (3412 * ηDHW)
Where:
Rbase = Overall thermal resistance coefficient prior to adding tank wrap (Hr-°F-ft2/BTU).
633 Visually determine whether it is insulated by foam (newer, rigid, and more effective) or fiberglass (older, gives to gently pressure, and not as effective)634 This estimate assumes the tank wrap is installed on an existing unit with 5 years remaining life.
IL TRM v6.0 Vol. 3_January 25th, 2017_DRAFT Page 194 of 296

Illinois Statewide Technical Reference Manual – 5.6.5 High Efficiency Pool Pumps
Rinsul = Overall thermal resistance coefficient after addition of tank wrap (Hr-°F-ft2/BTU).
Abase = Surface area of storage tank prior to adding tank wrap (square feet)635
Ainsul = Surface area of storage tank after addition of tank wrap (square feet)636
ΔT = Average temperature difference between tank water and outside air temperature (°F)
= 60°F 637
Hours = Number of hours in a year (since savings are assumed to be constant over year).
= 8766
3412 = Conversion from Btu to kWh
ηDHW = Recovery efficiency of electric hot water heater
= 0.98 638
The following table has default savings for various tank capacity and pre and post R-VALUES.
Capacity (gal) Rbase Rinsul Abase (ft2)639 Ainsul (ft2)640 ΔkWh ΔkW30 8 16 19.16 20.94 171 0.019530 10 18 19.16 20.94 118 0.013530 12 20 19.16 20.94 86 0.009930 8 18 19.16 20.94 194 0.022130 10 20 19.16 20.94 137 0.015630 12 22 19.16 20.94 101 0.011640 8 16 23.18 25.31 207 0.023640 10 18 23.18 25.31 143 0.016440 12 20 23.18 25.31 105 0.012040 8 18 23.18 25.31 234 0.026840 10 20 23.18 25.31 165 0.018940 12 22 23.18 25.31 123 0.014050 8 16 24.99 27.06 225 0.025750 10 18 24.99 27.06 157 0.017950 12 20 24.99 27.06 115 0.013150 8 18 24.99 27.06 255 0.029150 10 20 24.99 27.06 180 0.020650 12 22 24.99 27.06 134 0.015380 8 16 31.84 34.14 290 0.033180 10 18 31.84 34.14 202 0.023180 12 20 31.84 34.14 149 0.017080 8 18 31.84 34.14 328 0.037480 10 20 31.84 34.14 232 0.026580 12 22 31.84 34.14 173 0.0198
635 Area includes tank sides and top to account for typical wrap coverage.636 Ibid.637 Assumes 125°F water leaving the hot water tank and average temperature of basement of 65°F.638 Electric water heaters have recovery efficiency of 98%: http://www.ahridirectory.org/ahridirectory/pages/home.aspx639 Assumptions from PA TRM. Area values were calculated from average dimensions of several commercially available units, with radius values measured to the center of the insulation. Area includes tank sides and top to account for typical wrap coverage.640 Assumptions from PA TRM. Ainsul was calculated by assuming that the water heater wrap is a 2” thick fiberglass material.
IL TRM v6.0 Vol. 3_January 25th, 2017_DRAFT Page 195 of 296

Illinois Statewide Technical Reference Manual – 5.6.5 High Efficiency Pool Pumps
SUMMER COINCIDENT PEAK DEMAND SAVINGS
∆kW = ∆kWh / 8766 * CF
Where:
ΔkWh = kWh savings from tank wrap installation
8766 = Number of hours in a year (since savings are assumed to be constant over year).
CF = Summer Coincidence Factor for this measure
= 1.0
The table above has default kW savings for various tank capacity and pre and post R-values.
NATURAL GAS SAVINGS
N/A
WATER IMPACT DESCRIPTIONS AND CALCULATION
N/A
DEEMED O&M COST ADJUSTMENT CALCULATION
N/A
MEASURE CODE: RS-HWE-WRAP-V02-150601
REVIEW DEADLINE: 1/1/2022
IL TRM v6.0 Vol. 3_January 25th, 2017_DRAFT Page 196 of 296

Illinois Statewide Technical Reference Manual – 5.6.5 High Efficiency Pool Pumps
5.4.8 Thermostatic Restrictor Shower Valve
DESCRIPTION
The measure is the installation of a thermostatic restrictor shower valve in a single or multi-family household. This is a valve attached to a residential showerhead which restricts hot water flow through the showerhead once the water reaches a set point (generally 95F or lower).
This measure was developed to be applicable to the following program types: RF, NC, DI. If applied to other program types, the measure savings should be verified.
DEFINITION OF EFFICIENT EQUIPMENT
To qualify for this measure the installed equipment must be a thermostatic restrictor shower valve installed on a residential showerhead.
DEFINITION OF BASELINE EQUIPMENT
The baseline equipment is the residential showerhead without the restrictor valve installed.
DEEMED LIFETIME OF EFFICIENT EQUIPMENT
The expected measure life is assumed to be 10 years. 641
DEEMED MEASURE COST
The incremental cost of the measure should be the actual program cost (including labor if applicable) or $30 642 plus $20 labor643 if not available.
LOADSHAPE
Loadshape R03 - Residential Electric DHW
COINCIDENCE FACTOR
The coincidence factor for this measure is assumed to be 0.22%.644
641 Assumptions based on NY TRM, Pacific Gas and Electric Company Work Paper PGECODHW113, and measure life of low-flow showerhead642 Based on actual cost of the SS-1002CP-SB Ladybug Water-Saving Shower-Head adapter from Evolve showerheads. 643 Estimate for contractor installation time.644 Calculated as follows: Assume 11% showers take place during peak hours (based on: Oreo et al, “The end uses of hot water in single family homes from flow trace analysis”, 2001.). There are 65 days in the summer peak period, so the percentage of total annual use in peak period is 0.11*65/365 = 1.96%. The number of hours of recovery during peak periods is therefore assumed to be 1.96% * 29.5 = 0.577 hours of recovery during peak period, where 29.5 equals the average annual electric DHW recovery hours for showerhead use prevented by the device including SF and MF homes with Direct Install and Retrofit/TOS measures. There are 260 hours in the peak period so the probability you will see savings during the peak period is 0.577/260 = 0.0022
IL TRM v6.0 Vol. 3_January 25th, 2017_DRAFT Page 197 of 296
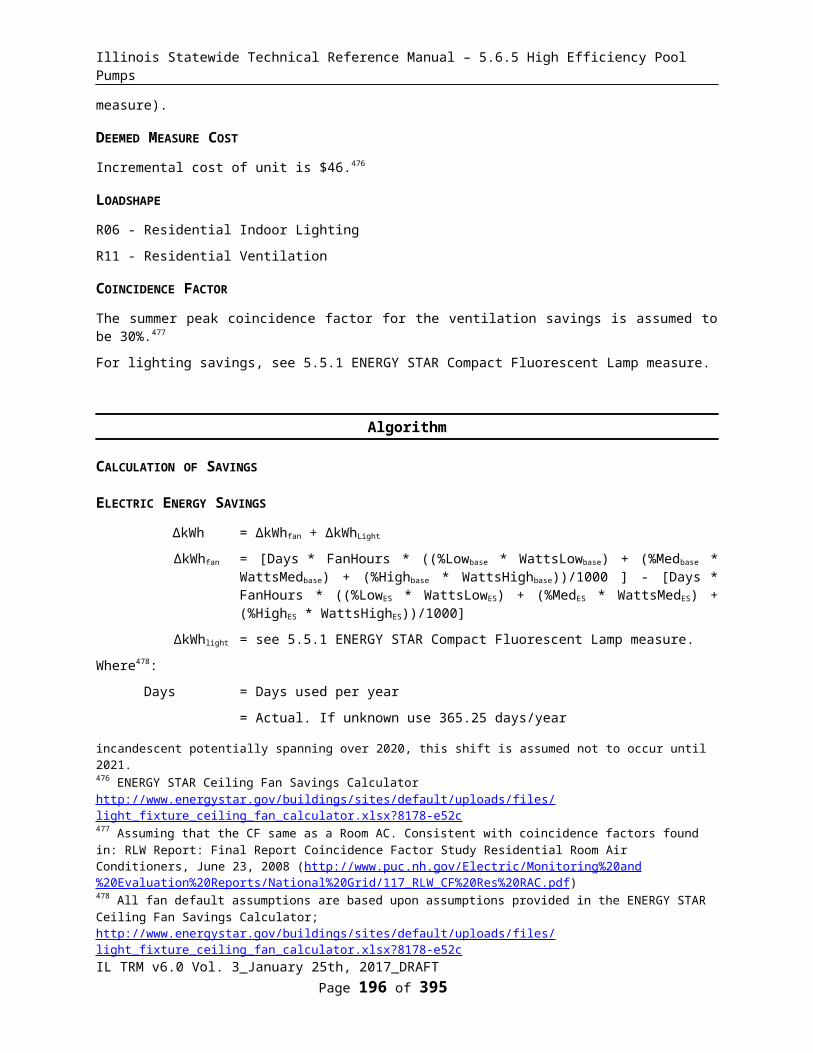
Illinois Statewide Technical Reference Manual – 5.6.5 High Efficiency Pool Pumps
Algorithm
CALCULATION OF ENERGY SAVINGS
ELECTRIC ENERGY SAVINGS
ΔkWh = %ElectricDHW * ((GPM_base_S * L_showerdevice) * Household * SPCD * 365.25 / SPH) * EPG_electric * ISR
Where:
%ElectricDHW = proportion of water heating supplied by electric resistance heating
DHW fuel %ElectricDHWElectric 100%Natural Gas 0%Unknown 16%645
GPM_base_S = Flow rate of the basecase showerhead, or actual if available
Program GPMDirect-install, device only 2.67646
New Construction or direct install of device and low flow showerhead
Rated or actual flow of program-installed
showerhead Retrofit or TOS 2.35647
L_showerdevice = Hot water waste time avoided due to thermostatic restrictor valve
= 0.89 minutes648
Household = Average number of people per household
Household Unit Type649 HouseholdSingle-Family - Deemed 2.56650
Multi-Family - Deemed 2.1651
CustomActual Occupancy
or Number of Bedrooms652
645 Default assumption for unknown fuel is based on EIA Residential Energy Consumption Survey (RECS) 2009 for Midwest Region, data for the state of IL. If utilities have specific evaluation results providing a more appropriate assumption for homes in a particular market or geographical area then that should be used646 Based on measured data from Ameren IL EM&V of Direct-Install program. Program targets showers that are rated 2.5 GPM or above. Assumes low flow showerhead not included in direct installation. 647 Representative value from sources 1, 2, 4, 5, 6 and 7 (See Source Table at end of measure section) adjusted slightly upward to account for program participation which is expected to target customers with existing higher flow devices rather than those with existing low flow devices.648 Average of the following sources: ShowerStart LLC survey; “Identifying, Quantifying and Reducing Behavioral Waste in the Shower: Exploring the Savings Potential of ShowerStart”, City of San Diego Water Department survey; “Water Conservation Program: ShowerStart Pilot Project White Paper”, and PG&E Work Paper PGECODHW113. 649 If household type is unknown, as may be the case for time of sale measures, then single family deemed value shall be used.650 ComEd Energy Efficiency/ Demand Response Plan: Plan Year 2 (6/1/2009-5/31/2010) Evaluation Report: All Electric Single Family Home Energy Performance Tune-Up Program citing 2006-2008 American Community Survey data from the US Census Bureau for Illinois cited on p. 17 of the PY2 Evaluation report. 2.75 * 93% evaluation adjustment651 ComEd PY3 Multi-Family Evaluation Report REVISED DRAFT v5 2011-12-08.docx
IL TRM v6.0 Vol. 3_January 25th, 2017_DRAFT Page 198 of 296

Illinois Statewide Technical Reference Manual – 5.6.5 High Efficiency Pool Pumps
SPCD = Showers Per Capita Per Day
= 0.6653
365.25 = Days per year, on average.
SPH = Showerheads Per Household so that per-showerhead savings fractions can be determined
Household Type SPHSingle-Family 1.79654
Multi-Family 1.3655
Custom Actual
EPG_electric = Energy per gallon of hot water supplied by electric
= (8.33 * 1.0 * (ShowerTemp - SupplyTemp)) / (RE_electric * 3412)
= (8.33 * 1.0 * (101 – 54.1)) / (0.98 * 3412)
= 0.117 kWh/gal
8.33 = Specific weight of water (lbs/gallon)
1.0 = Heat Capacity of water (btu/lb-°)
ShowerTemp = Assumed temperature of water
= 101F 656
SupplyTemp = Assumed temperature of water entering house
= 54.1F 657
RE_electric = Recovery efficiency of electric water heater
= 98% 658
3412 = Converts Btu to kWh (btu/kWh)
ISR = In service rate of showerhead
= Dependent on program delivery method as listed in table below
Selection ISRDirect Install - Single Family 0.98659
652 Bedrooms are suitable proxies for household occupancy, and may be preferable to actual occupancy due to turnover rates in residency and non-adult population impacts.653 Cadmus and Opinion Dynamics Showerhead and Faucet Aerator Meter Study Memorandum dated June 2013, directed to Michigan Evaluation Working Group.654 Based on findings from a 2009 ComEd residential survey of 140 sites, provided by Cadmus.655 Ibid.656 Cadmus and Opinion Dynamics Showerhead and Faucet Aerator Meter Study Memorandum dated June 2013, directed to Michigan Evaluation Working Group.657 US DOE Building America Program. Building America Analysis Spreadsheet. For Chicago, IL http://www1.eere.energy.gov/buildings/building_america/analysis_spreadsheets.html. 658 Electric water heaters have recovery efficiency of 98%: http://www.ahridirectory.org/ahridirectory/pages/home.aspx659 Deemed values are from ComEd Energy Efficiency/ Demand Response Plan: Plan Year 2 (6/1/2009-5/31/2010) Evaluation Report: All Electric Single Family Home Energy Performance Tune-Up Program Table 3-8. Alternative ISRs may be developed for program delivery methods based on evaluation results.
IL TRM v6.0 Vol. 3_January 25th, 2017_DRAFT Page 199 of 296
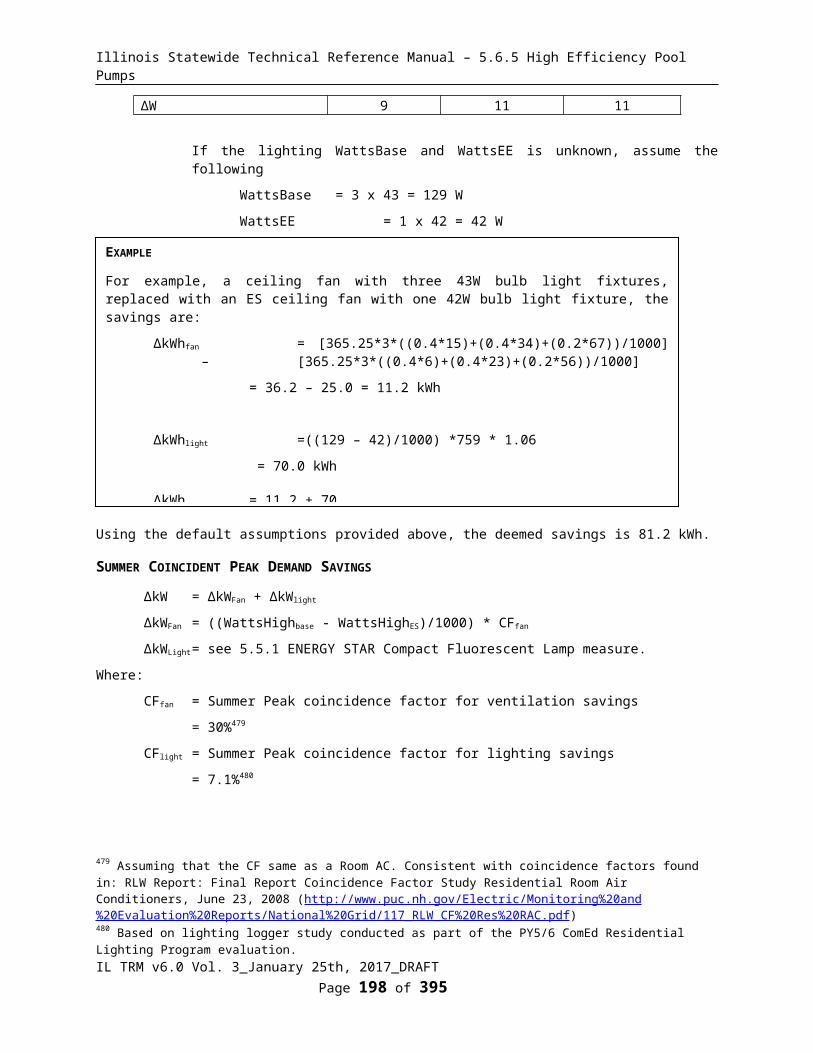
Illinois Statewide Technical Reference Manual – 5.6.5 High Efficiency Pool Pumps
Selection ISRDirect Install – Multi Family 0.95660
Efficiency Kits To be determined through evaluation
SUMMER COINCIDENT PEAK DEMAND SAVINGS
ΔkW = ΔkWh/Hours * CF
Where:
ΔkWh = calculated value above
Hours = Annual electric DHW recovery hours for wasted showerhead use prevented by device
= ((GPM_base_S * L_showerdevice) * Household * SPCD * 365.25 ) * 0.712661 / GPH
GPH = Gallons per hour recovery of electric water heater calculated for 65.9F temp rise (120-54.1), 98% recovery efficiency, and typical 4.5kW electric resistance storage tank.
= 27.51
= 34.4 for SF Direct Install; 28.3 for MF Direct Install
= 30.3 for SF Retrofit and TOS; 24.8 for MF Retrofit and TOS
CF = Coincidence Factor for electric load reduction
= 0.0022662
660 Navigant, ComEd-Nicor Gas EPY4/GPY1 Multi-Family Home Energy Savings Program Evaluation Report FINAL 2013-06-05661 71.2% is the proportion of hot 120F water mixed with 54.1F supply water to give 101F shower water. 662 Calculated as follows: Assume 11% showers take place during peak hours (based on: Oreo et al, “The end uses of hot water in single family homes from flow trace analysis”, 2001.). There are 65 days in the summer peak period, so the percentage of total annual use in peak period is 0.11*65/365 = 1.96%. The number of hours of recovery during peak periods is therefore assumed to be 1.96% * 29.5 = 0.577 hours of recovery during peak period, where 29.5 equals the average annual electric DHW recovery hours for showerhead use prevented by the device including SF and MF homes with Direct Install and Retrofit/TOS measures. There are 260 hours in the peak period so the probability you will see savings during the peak period is 0.577/260 = 0.0022
IL TRM v6.0 Vol. 3_January 25th, 2017_DRAFT Page 200 of 296
EXAMPLE
For example, a direct installed valve in a single-family home with electric DHW:
ΔkWh = 1.0 * (2.67 * 0.89 * 2.56 * 0.6 * 365.25 / 1.79) * 0.117 * 0.98
= 85 kWh
EXAMPLE
For example, a direct installed thermostatic restrictor device in a single family home with electric DHW where the number of showers is not known.
ΔkW = 85.3/34.4 * 0.0022
= 0.0055 kW

Illinois Statewide Technical Reference Manual – 5.6.5 High Efficiency Pool Pumps
NATURAL GAS SAVINGS
ΔTherms = %FossilDHW * ((GPM_base_S * L_showerdevice)* Household * SPCD * 365.25 / SPH) * EPG_gas * ISR
Where:
%FossilDHW = proportion of water heating supplied by Natural Gas heating
DHW fuel %Fossil_DHWElectric 0%Natural Gas 100%Unknown 84%663
EPG_gas = Energy per gallon of Hot water supplied by gas
= (8.33 * 1.0 * (ShowerTemp - SupplyTemp)) / (RE_gas * 100,000)
= 0.00501 Therm/gal for SF homes
= 0.00583 Therm/gal for MF homes
RE_gas = Recovery efficiency of gas water heater
= 78% For SF homes664
= 67% For MF homes665
100,000 = Converts Btus to Therms (btu/Therm)
Other variables as defined above.
WATER IMPACT DESCRIPTIONS AND CALCULATION
Δgallons = ((GPM_base_S * L_showerdevice) * Household * SPCD * 365.25 / SPH) * ISR
Variables as defined above
663 Default assumption for unknown fuel is based on EIA Residential Energy Consumption Survey (RECS) 2009 for Midwest Region, data for the state of IL. If utilities have specific evaluation results providing a more appropriate assumption for homes in a particular market or geographical area then that should be used664 DOE Final Rule discusses Recovery Efficiency with an average around 0.76 for Gas Fired Storage Water heaters and 0.78 for standard efficiency gas fired tankless water heaters up to 0.95 for the highest efficiency gas fired condensing tankless water heaters. These numbers represent the range of new units however, not the range of existing units in stock. Review of AHRI Directory suggests range of recovery efficiency ratings for new Gas DHW units of 70-87%. Average of existing units is estimated at 78%.665 Water heating in multi-family buildings is often provided by a larger central boiler. This suggests that the average recovery efficiency is somewhere between a typical central boiler efficiency of 0.59 and the 0.75 for single family homes. An average efficiency of 0.67 is used for this analysis as a default for multi-family buildings.
IL TRM v6.0 Vol. 3_January 25th, 2017_DRAFT Page 201 of 296
EXAMPLE
For example, a direct installed thermostatic restrictor device in a gas fired DHW single family home where the number of showers is not known:
ΔTherms = 1.0 * ((2.67 * 0.89) * 2.56 * 0.6 * 365.25 / 1.79) * 0.00501 * 0.98
= 3.7 therms

Illinois Statewide Technical Reference Manual – 5.6.5 High Efficiency Pool Pumps
DEEMED O&M COST ADJUSTMENT CALCULATION
N/A
SOURCES
Source ID Reference1 2011, DeOreo, William. California Single Family Water Use Efficiency Study. April 20, 2011.
2 2000, Mayer, Peter, William DeOreo, and David Lewis. Seattle Home Water Conservation Study. December 2000.
3 1999, Mayer, Peter, William DeOreo. Residential End Uses of Water. Published by AWWA Research Foundation and American Water Works Association. 1999.
42003, Mayer, Peter, William DeOreo. Residential Indoor Water Conservation Study. Aquacraft, Inc. Water Engineering and Management. Prepared for East Bay Municipal Utility District and the US EPA. July 2003.
5 2011, DeOreo, William. Analysis of Water Use in New Single Family Homes. By Aquacraft. For Salt Lake City Corporation and US EPA. July 20, 2011.
6 2011, Aquacraft. Albuquerque Single Family Water Use Efficiency and Retrofit Study. For Albuquerque Bernalillo County Water Utility Authority. December 1, 2011.
72008, Schultdt, Marc, and Debra Tachibana. Energy related Water Fixture Measurements: Securing the Baseline for Northwest Single Family Homes. 2008 ACEEE Summer Study on Energy Efficiency in Buildings.
82011, Lutz, Jim. “Water and Energy Wasted During Residential Shower Events: Findings from a Pilot Field Study of Hot Water Distribution Systems”, Energy Analysis Department Lawrence Berkeley National Laboratory, September 2011.
9 2008, Water Conservation Program: ShowerStart Pilot Project White Paper, City of San Diego, CA.
10 2012, Pacific Gas and Electric Company, Work Paper PGECODHW113, Low Flow Showerhead and Thermostatic Shower Restriction Valve, Revision # 4, August 2012.
11 2008, “Simply & Cost Effectively Reducing Shower Based Warm-Up Waste: Increasing Convenience & Conservation by Attaching ShowerStart to Existing Showerheads”, ShowerStart LLC.
12 2014, New York State Record of Revision to the TRM, Case 07-M-0548, June 19, 2014.
MEASURE CODE: RS-HWE-TRVA-V03-180101
REVIEW DEADLINE: 1/1/2023
IL TRM v6.0 Vol. 3_January 25th, 2017_DRAFT Page 202 of 296
EXAMPLE
For example, a direct installed thermostatic restrictor device in a single family home where the number of showers is not known:
Δgallons = ((2.67 * 0.89) * 2.56 * 0.6 * 365.25 / 1.79) * 0.98
= 730 gallons
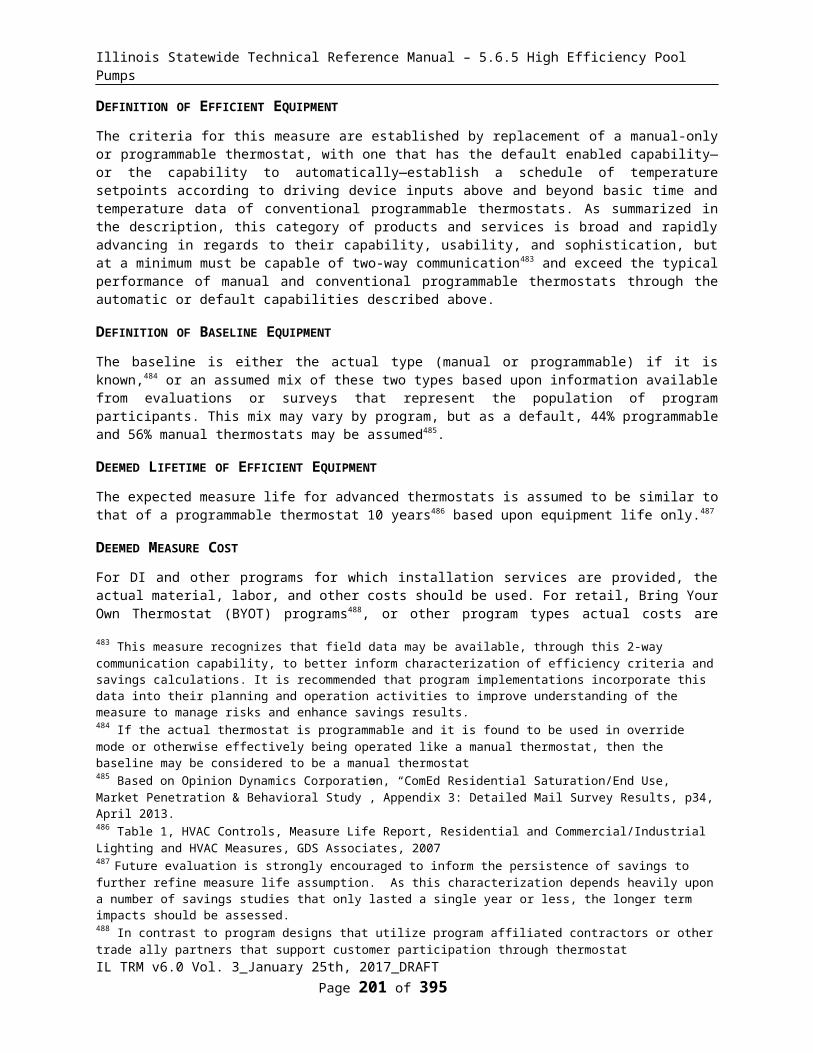
Illinois Statewide Technical Reference Manual – 5.6.5 High Efficiency Pool Pumps
5.4.9 Shower Timer
DESCRIPTION
Shower Timers are designed to make it easy for people to consistently take short showers, resulting in water and energy savings.
The shower timer provides a reminder to participants on length of their shower visually or auditorily.
This measure was developed to be applicable to the following program type: KITS, DI.
If applied to other program types, the measure savings should be verified.
DEFINITION OF EFFICIENT EQUIPMENT
The shower timer should provide a reminder to participants to keep showers to a length of 5 minutes or less.
DEFINITION OF BASELINE EQUIPMENT
The baseline is no shower timer.
DEEMED LIFETIME OF EFFICIENT EQUIPMENT
The deemed lifetime is 2 years666.
DEEMED MEASURE COST
For shower timers provided in Efficiency Kits, the actual program delivery costs should be utilized.
LOADSHAPE
Loadshape R03 - Residential Electric DHW
COINCIDENCE FACTOR
The coincidence factor for this measure is assumed to be 2.78%.667
Algorithm
CALCULATION OF ENERGY SAVINGS
ELECTRIC ENERGY SAVINGS
∆kWh = %Electric DHW * GPM * (L_base – L_timer) * Household * Days/yr * SPCD * UsageFactor * EPG_Electric
Where:
%Electric DHW = Proportion of water heating supplied by electric resistance heating
666 Estimate of persistence of behavior change instigated by the shower timer.667 Calculated as follows: Assume 11% showers take place during peak hours (based on: Oreo et al, “The end uses of hot water in single family homes from flow trace analysis”, 2001.). There are 65 days in the summer peak period, so the percentage of total annual aerator use in peak period is 0.11*65/365 = 1.96%. The number of hours of recovery during peak periods is therefore assumed to be 1.96% * 369 = 7.23 hours of recovery during peak period, where 369 equals the average annual electric DHW recovery hours for showerhead use including SF and MF homes with Direct Install and Retrofit/TOS measures. There are 260 hours in the peak period so the probability you will see savings during the peak period is 7.23/260 = 0.0278
IL TRM v6.0 Vol. 3_January 25th, 2017_DRAFT Page 203 of 296
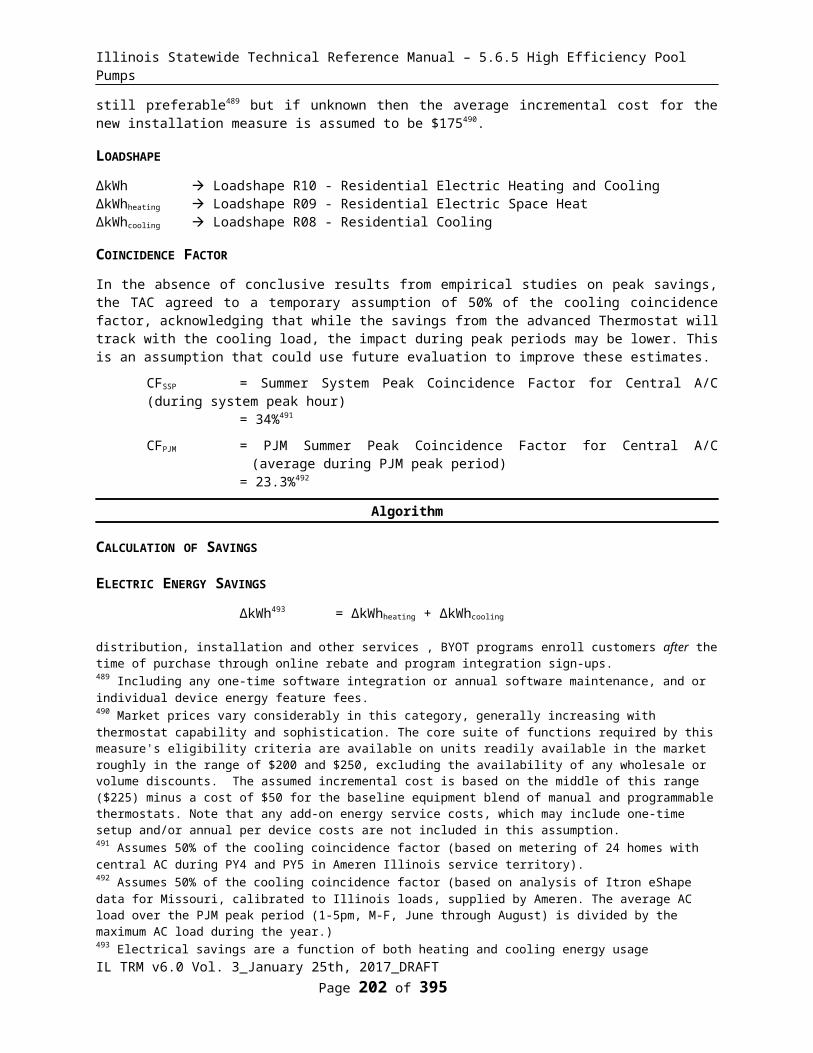
Illinois Statewide Technical Reference Manual – 5.6.5 High Efficiency Pool Pumps
DHW fuel %ElectricDHWElectric 100%Natural Gas 0%Unknown 16%668
GPM = Flow rate of showerhead as used
= Custom, to be determined through evaluation. If data is not available use 1.93669
L_base = Number of minutes in shower without a shower timer
=7.8 minutes670
L_timer = Number of minutes in shower after shower timer
= Custom, to be determined through evaluation. If data is not available use 5.79671
Household = Number in household using timer
Household Unit Type672 HouseholdSingle-Family - Deemed 2.56673
Multi-Family - Deemed 2.1674
CustomActual Occupancy
or Number of Bedrooms675
Days/yr = 365.25
SPCD = Showers Per Capita Per Day
= 0.6676
UsageFactor = How often each participant is using shower timer
=Custom, to be determined through evaluation. If data is not available use 0.34677
EPG_Electric = Energy per gallon of hot water supplied by electric
= (8.33 * 1.0 * (ShowerTemp - SupplyTemp)) / (RE_electric * 3412)
= (8.33 * 1.0 * (101 – 54.1)) / (0.98 * 3412)
668 Default assumption for unknown fuel is based on EIA Residential Energy Consumption Survey (RECS) 2009 for Midwest Region, data for the state of IL. If utilities have specific evaluation results providing a more appropriate assumption for homes in a particular market or geographical area then that should be used669 Navigant Elementary Education GPY4 Evaluation Report, dated May 12, 2016. Average of all utilities.670 Cadmus and Opinion Dynamics Showerhead and Faucet Aerator Meter Study Memorandum dated June 2013, directed to Michigan Evaluation Working Group. This study of 135 single and multi-family homes in Michigan metered energy parameters for efficient showerhead and faucet aerators. 671 Navigant Elementary Education GPY4 Evaluation Report, dated May 12, 2016. Average of all utilities.672 If household type is unknown, as may be the case for time of sale measures, then single family deemed value shall be used.673 ComEd Energy Efficiency/ Demand Response Plan: Plan Year 2 (6/1/2009-5/31/2010) Evaluation Report: All Electric Single Family Home Energy Performance Tune-Up Program citing 2006-2008 American Community Survey data from the US Census Bureau for Illinois cited on p. 17 of the PY2 Evaluation report. 2.75 * 93% evaluation adjustment674 ComEd PY3 Multi-Family Evaluation Report REVISED DRAFT v5 2011-12-08.docx675 Bedrooms are suitable proxies for household occupancy, and may be preferable to actual occupancy due to turnover rates in residency and non-adult population impacts.676 Cadmus and Opinion Dynamics Showerhead and Faucet Aerator Meter Study Memorandum dated June 2013, directed to Michigan Evaluation Working Group. 677 Navigant Elementary Education GPY4 Evaluation Report, dated May 12, 2016. Average of all utilities.
IL TRM v6.0 Vol. 3_January 25th, 2017_DRAFT Page 204 of 296
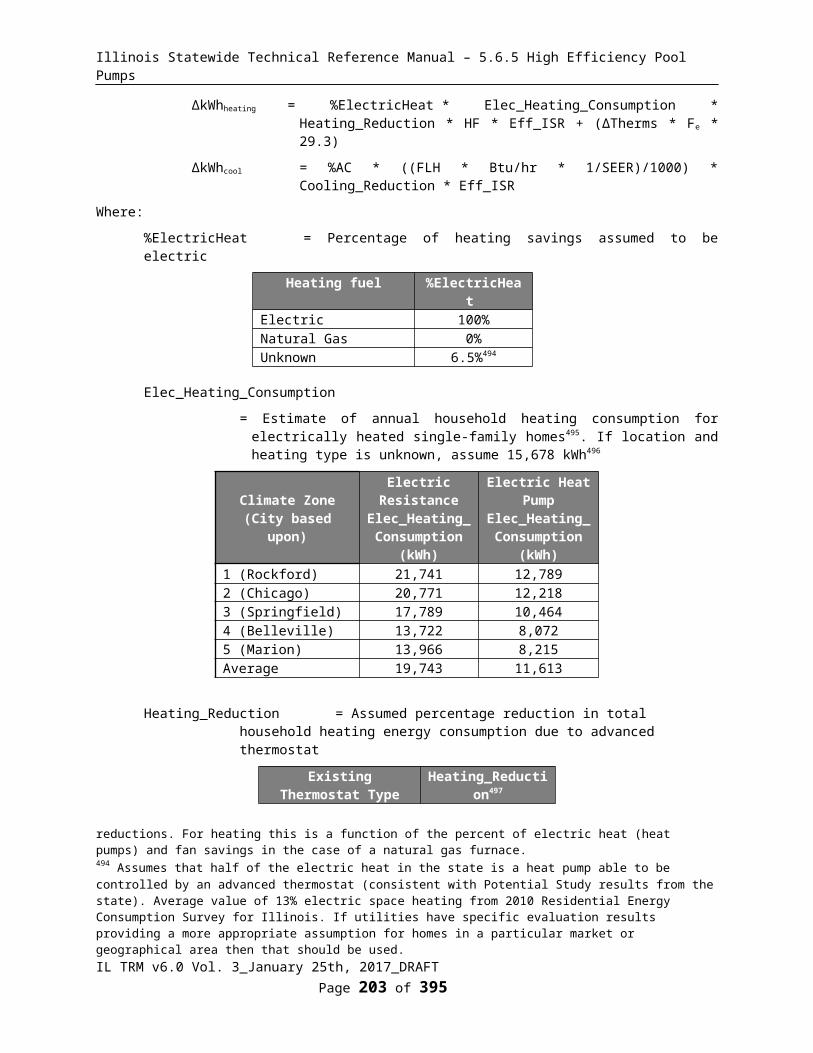
Illinois Statewide Technical Reference Manual – 5.6.5 High Efficiency Pool Pumps
=0.117 kWh/gal
Based on default assumptions provided above, the savings for a single family home would be:
∆kWh = %Electric DHW * GPM * (L_base – L_timer) * Household * Days/yr * SPCD * UsageFactor * EPG_Electric
= 0.16 * 1.93 * (7.8 – 5.79) * 2.56 * 365.25 * 0.6 * 0.34 * 0.117
=13.9kWh
SUMMER COINCIDENT PEAK DEMAND SAVINGS
ΔkW = ΔkWh/Hours * CF
Where:
ΔkWh = calculated value above
Hours = Annual electric DHW recovery hours for showerhead use
= ((GPM_base * L_base) * Household Users * SPCD * 365.25 ) * 0.712 / GPH
GPH = Gallons per hour recovery of electric water heater calculated for 65.9F temp rise (120-54.1), 98% recovery efficiency, and typical 4.5kW electric resistance storage tank.
= 27.51
CF = Coincidence Factor for electric load reduction
= 0.0278678
Based on default assumptions provided above, the savings for a single family home would be:
ΔkW = ΔkWh/Hours * CF
= 0.0013 kW
NATURAL GAS SAVINGS
∆Therms = %FossilDHW * GPM * (L_base – L_timer) * Household * Days/yr * SPCD * UsageFactor * EPG_Gas
%FossilDHW = Proportion of water heating supplied by electric resistance heating
DHW fuel %FossilDHWElectric 0%Natural Gas 100%Unknown 84%679
EPG_gas = Energy per gallon of Hot water supplied by gas
= (8.33 * 1.0 * (ShowerTemp - SupplyTemp)) / (RE_gas * 100,000)
= 0.00501 Therm/gal for SF homes
678 Calculated as follows: Assume 11% showers take place during peak hours (based on: Oreo et al, “The end uses of hot water in single family homes from flow trace analysis”, 2001.). There are 65 days in the summer peak period, so the percentage of total annual aerator use in peak period is 0.11*65/365 = 1.96%. The number of hours of recovery during peak periods is therefore assumed to be 1.96% * 369 = 7.23 hours of recovery during peak period where 369 equals the average annual electric DHW recovery hours for showerhead use including SF and MF homes with Direct Install and Retrofit/TOS measures. There are 260 hours in the peak period so the probability you will see savings during the peak period is 7.23/260 = 0.0278679 Default assumption for unknown fuel is based on EIA Residential Energy Consumption Survey (RECS) 2009 for Midwest Region, data for the state of IL. If utilities have specific evaluation results providing a more appropriate assumption for homes in a particular market or geographical area then that should be used
IL TRM v6.0 Vol. 3_January 25th, 2017_DRAFT Page 205 of 296
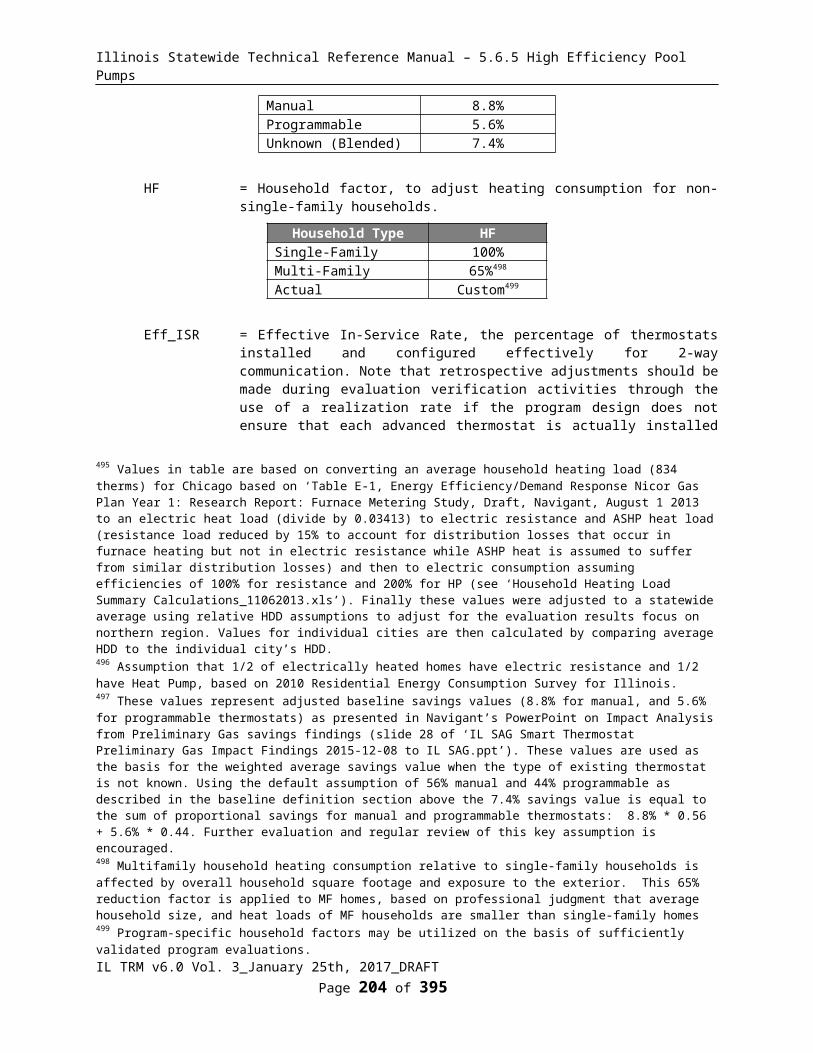
Illinois Statewide Technical Reference Manual – 5.6.5 High Efficiency Pool Pumps
= 0.00583 Therm/gal for MF homes
RE_gas = Recovery efficiency of gas water heater
= 78% For SF homes 680
= 67% For MF homes681 100,000 = Converts Btus to Therms (btu/Therm)
Other variables as defined above.
Based on default assumptions provided above, the savings for a single family home would be:
∆ Therms = %FossilDHW * GPM * (L_base – L_timer) * Household * Days/yr * SPCD * UsageFactor * EPG_Gas
= 0.84 * 1.93 * (7.8 – 5.79) * 2.56 * 365.25 * 0.6 * 0.34 * 0.00501
= 3.1 Therms
WATER DESCRIPTIONS AND CALCULATION
ΔGallons = GPM * (L_base – L_timer) * Household * Days/yr * SPCD * UsageFactor
Variables as defined above
Based on default assumptions provided above, the savings for a single family home would be:
ΔGallons = GPM * (L_base – L_timer) * Household * Days/yr * SPCD * UsageFactor
= 1.93 * (7.8 – 5.79) * 2.56 * 365.25 * 0.6 * 0.34
= 740.0 gallons
DEEMED O&M COST ADJUSTMENT CALCULATION
N/A
MEASURE CODE: RS-DHW-SHTM-V01-180101
REVIEW DEADLINE: 1/1/2019
680 DOE Final Rule discusses Recovery Efficiency with an average around 0.76 for Gas Fired Storage Water heaters and 0.78 for standard efficiency gas fired tankless water heaters up to 0.95 for the highest efficiency gas fired condensing tankless water heaters. These numbers represent the range of new units however, not the range of existing units in stock. Review of AHRI Directory suggests range of recovery efficiency ratings for new Gas DHW units of 70-87%. Average of existing units is estimated at 78%. 681 Water heating in multi-family buildings is often provided by a larger central boiler. This suggests that the average recovery efficiency is somewhere between a typical central boiler efficiency of 0.59 and the 0.75 for single family homes. An average efficiency of 0.67 is used for this analysis as a default for multi-family buildings.
IL TRM v6.0 Vol. 3_January 25th, 2017_DRAFT Page 206 of 296

Illinois Statewide Technical Reference Manual – 5.6.5 High Efficiency Pool Pumps
5.5 Lighting End Use5.5.1 Compact Fluorescent Lamp (CFL)
DESCRIPTION
A low wattage qualified compact fluorescent screw-in bulb (CFL) is installed in place of a baseline screw-in bulb. Note a new ENERGY STAR specification v2.0 becomes effective on 1/2/2017 (https://www.energystar.gov/products/spec/lamps_specification_version_2_0_pd). The efficacy requirements cannot currently be met by Compact Fluorescent Lamps, and therefore this specification has been removed. ENERGY STAR will maintain a list on their website with the final qualifying list of products prior to this change and it is strongly recommended that programs continue to use this list as qualifying criteria for products in the programs.
This characterization assumes that the CFL is installed in a residential location. If the implementation strategy does not allow for the installation location to be known (e.g. an upstream retail program), a deemed split of 95% Residential and 5% Commercial assumptions should be used682. Federal legislation stemming from the Energy Independence and Security Act of 2007 (EISA) required all general-purpose light bulbs between 40W and 100W to be approximately 30% more energy efficient than current incandescent bulbs. Production of 100W, standard efficacy incandescent lamps ended in 2012, followed by restrictions on 75W in 2013 and 60W and 40W in 2014. The baseline for this measure has therefore become bulbs (improved incandescent or halogen) that meet the new standard.
A provision in the EISA regulations requires that by January 1, 2020, all lamps meet efficiency criteria of at least 45 lumens per watt, in essence making the baseline equivalent to a current day CFL. Therefore the measure life (number of years that savings should be claimed) should be reduced once the assumed lifetime of the bulb exceeds 2020. Due to expected delay in clearing retail inventory and to account for the operating life of a halogen incandescent potentially spanning over 2020, this shift is assumed not to occur until 2021.
This measure was developed to be applicable to the following program types: TOS, NC, DI, KITS. If applied to other program types, the measure savings should be verified.
DEFINITION OF EFFICIENT EQUIPMENT
In order for this characterization to apply, the high-efficiency equipment must be a standard qualified compact fluorescent lamp.
DEFINITION OF BASELINE EQUIPMENT
The baseline equipment is assumed to be an EISA qualified incandescent or halogen as provided in the table provided in the Electric Energy Savings section.
DEEMED LIFETIME OF EFFICIENT EQUIPMENT
The expected measure life (number of years that savings should be claimed) for bulbs installed in 2018 is assumed to be 3 years and then for every subsequent year should be reduced by one year683.
DEEMED MEASURE COST
For the Retail (Time of Sale) measure, the incremental capital cost is $1.20684.
682 RES v C&I split is based on a weighted (by sales volume) average of ComEd PY6, PY7 and PY8 and Ameren PY5, PY6 and PY8 in store intercept survey results. See ‘RESvCI Split_112016.xls’.683 Since the replacement baseline bulb from 2020 on will be equivalent to a CFL, no additional savings should be claimed from that point. Due to expected delay in clearing stock from retail outlets and to account for the operating life of a halogen incandescent potentially spanning over 2020, this shift is assumed not to occur until 2021.684 Based upon field data collected by CLEAResult and provided by ComEd. See ComEd Pricing Projections 06302016.xlsx for
IL TRM v6.0 Vol. 3_January 25th, 2017_DRAFT Page 207 of 296

Illinois Statewide Technical Reference Manual – 5.6.5 High Efficiency Pool Pumps
For the Direct Install measure, the full cost of $2.45 per bulb should be used, plus $5 labor cost685 for a total of $7.45 per bulb. However actual program delivery costs should be utilized if available.
For bulbs provided in Efficiency Kits, the actual program delivery costs should be utilized.
LOADSHAPE
Loadshape R06 - Residential Indoor Lighting
Loadshape R07 - Residential Outdoor Lighting
COINCIDENCE FACTOR
The summer peak coincidence factor is assumed to be 7.1% for Time of Sale Residential and in-unit Multi Family bulbs, 27.3% for exterior bulbs and 8.1% for unknown686 and 7.4% for Residential Direct Install687.
Algorithm
CALCULATION OF SAVINGS
ELECTRIC ENERGY SAVINGS
∆kWh = ((WattsBase - WattsEE) / 1000) * ISR * (1-Leakage) * Hours * WHFe
Where:
WattsBase = Based on lumens of CFL bulb and program year installed:
Minimum Lumens Maximum Lumens
Incandescent Equivalent Post-
EISA 2007 (WattsBase)
5280 6209 3003000 5279 2002601 2999 1501490 2600 721050 1489 53750 1049 43310 749 29250 309 25
WattsEE = Actual wattage of CFL purchased / installed
ISR = In Service Rate, the percentage of units rebated that are actually in service.
analysis.685 Based on 15 minutes at $20 an hour. Includes some portion of travel time to site.686 Based on lighting logger study conducted as part of the PY5/6 ComEd Residential Lighting Program evaluation.687 Based on lighting logger study conducted as part of the PY5/PY6 ComEd Residential Lighting Program evaluation and excluding all logged bulbs installed in closets.
IL TRM v6.0 Vol. 3_January 25th, 2017_DRAFT Page 208 of 296
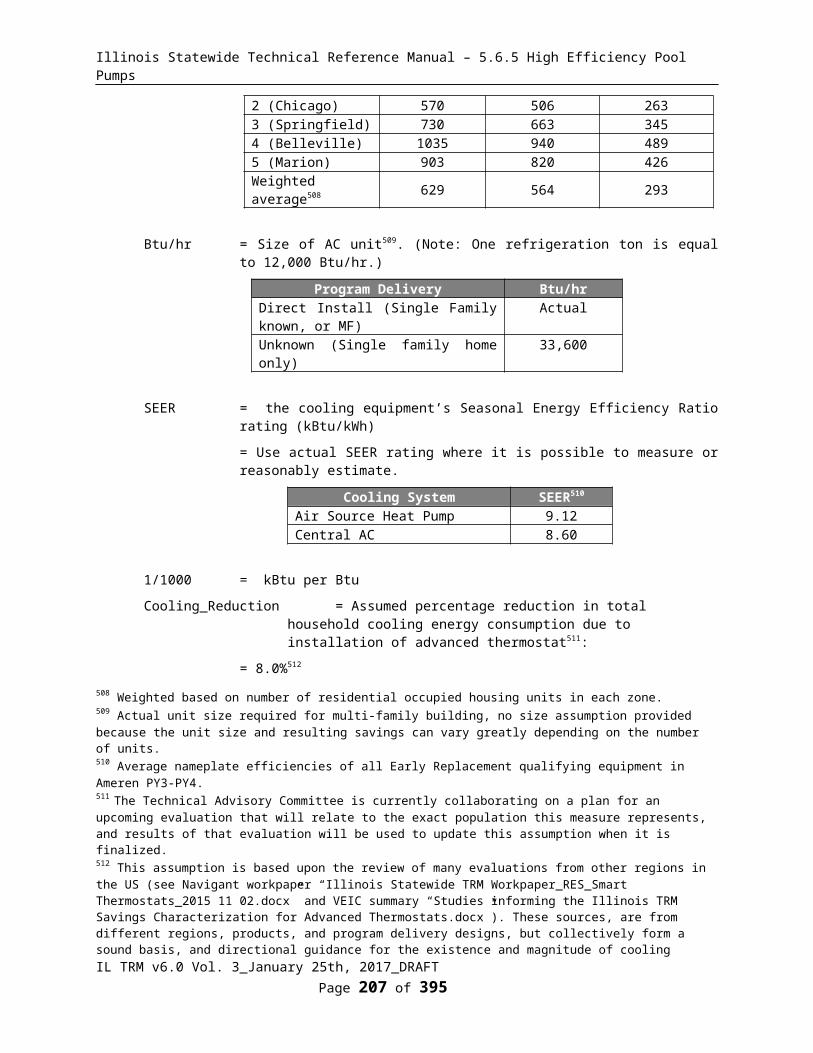
Illinois Statewide Technical Reference Manual – 5.6.5 High Efficiency Pool Pumps
Program
Weighted Average
1st Year In Service
Rate (ISR)
2nd year Installations
3rd year Installations
Final Lifetime In
Service Rate
Retail (Time of Sale) 76.5%688 11.6% 9.9% 98.0%689
Direct Install 96.9%690
Efficiency Kits691
CFL Distribution692 59% 13% 11% 83%School Kits693 61% 13% 11% 86%Direct Mail Kits694 66% 14% 12% 93%
Leakage = Adjustment to account for the percentage of program bulbs that move out (and in if deemed appropriate695) of the Utility Jurisdiction.
KITS programs = Determined through evaluation
Upstream (TOS) Lighting programs = Determined through evaluation or use deemed assumptions below696:
ComEd: 2.1%
Ameren: 13.1%
All other programs = 0
Hours = Average hours of use per year
Program Delivery Installation Location Hours697
Retail (Time of Sale) and Efficiency Kits
Residential Interior and in-unit Multi Family
759
Exterior 2,475 698
Unknown 847 699
Direct InstallResidential Interior and in-unit Multi Family
793
Exterior 2,475
WHFe = Waste heat factor for energy to account for cooling energy savings from efficient lighting
Bulb Location WHFeInterior single family or unknown location 1.06 700
688 1st year in service rate is based upon review of PY6-8 evaluations from ComEd and PY5,6 and 8 for Ameren (see ‘IL RES Lighting ISR_112016.xls’ for more information). The average first year ISR for each utility was calculated weighted by the number of bulbs in the each year’s survey. This was then weighted by annual sales to give a statewide assumption.689 The 98% Lifetime ISR assumption is based upon review of two evaluations:‘Nexus Market Research, RLW Analytics and GDS Associates study; “New England Residential Lighting Markdown Impact Evaluation, January 20, 2009’ and ‘KEMA Inc, Feb 2010, Final Evaluation Report:, Upstream Lighting Program, Volume 1.’ This implies that only 2% of bulbs purchased are never installed. The second and third year installations are based upon Ameren analysis of the Californian KEMA study showing that 54% of future installs occur in year 2 and 46% in year 3. The 2nd and 3rd year installations should be counted as part of those future program year savings.690 Based upon review of the PY2 and PY3 ComEd Direct Install program surveys. This value includes bulb failures in the 1st year to be consistent with the Commission approval of annualization of savings for first year savings claims. ComEd PY2 All Electric Single Family Home Energy Performance Tune-Up Program Evaluation, Navigant Consulting, December 21, 2010. 691 In Service Rates provided are for the CFL bulb within a kit only. Given the significant differences in program design and the level of education provided through Efficiency Kits programs, the evaluators should apply the ISR estimated through evaluations (either past evaluations or the current program year evaluation) of the specific Efficiency Kits program. In cases where program-specific evaluation results for an ISR are unavailable, the default ISR values for Efficiency Kits provided may be used.
IL TRM v6.0 Vol. 3_January 25th, 2017_DRAFT Page 209 of 296
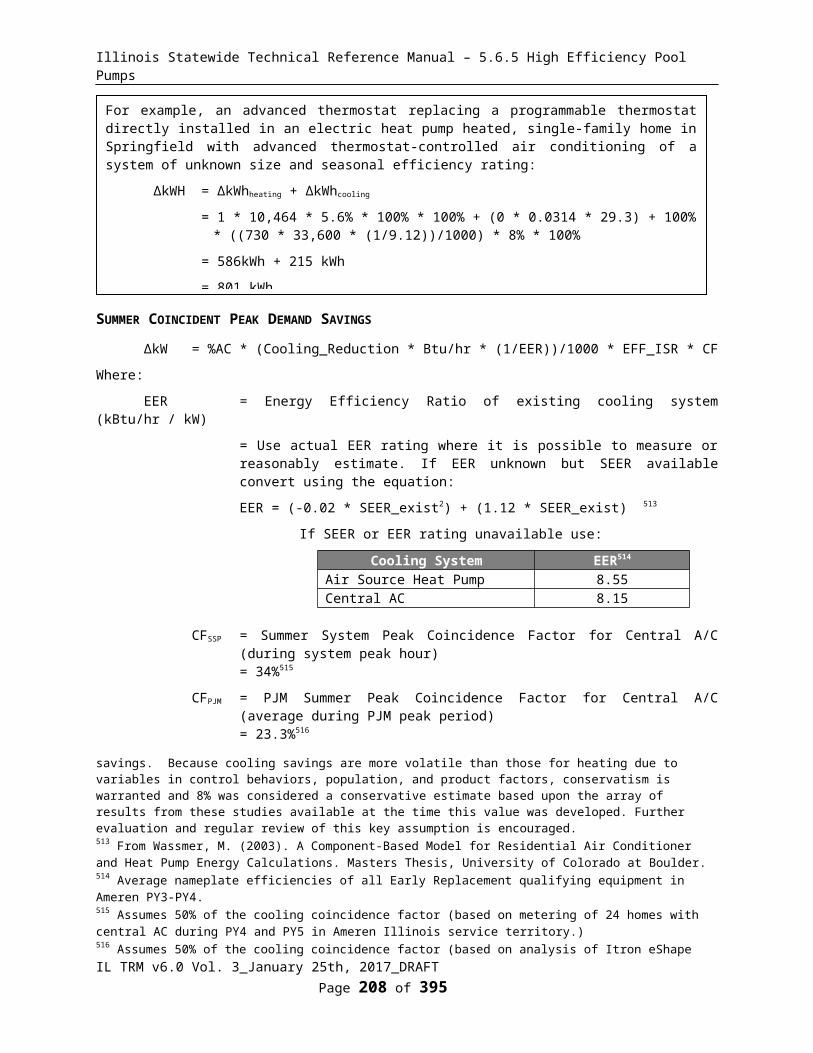
Illinois Statewide Technical Reference Manual – 5.6.5 High Efficiency Pool Pumps
Multi family in unit 1.04 701
Exterior or uncooled location 1.0
DEFERRED INSTALLS
As presented above, the characterization assumes that a percentage of bulbs purchased are not installed until Year 2 and Year 3 (see ISR assumption above). The Illinois Technical Advisory Committee has determined the following methodology for calculating the savings of these future installs.
Year 1 (Purchase Year) installs: Characterized using assumptions provided above or evaluated assumptions if available.
Year 2 and 3 installs: Characterized using delta watts assumption and hours of use from the Install Year i.e. the actual deemed (or evaluated if available) assumptions active in Year 2 and 3 should be applied.
The NTG factor for the Purchase Year should be applied.
HEATING PENALTY
If electric heated home (if heating fuel is unknown assume gas, see Natural Gas section):
IL TRM v6.0 Vol. 3_January 25th, 2017_DRAFT Page 210 of 296
For example, for a 14W CFL (60W standard incandescent and 43W EISA qualified incandescent/halogen):
ΔkWH1st year installs = ((43 - 14) / 1000) * 0.765 * 847 * 1.06
= 19.9 kWh
ΔkWH2nd year installs = ((43 - 14) / 1000) * 0.116 * 847 * 1.06
= 3.0 kWh
Note: Here we assume no change in hours assumption. NTG value from Purchase year applied.
ΔkWH3rd year installs = ((43 - 14) / 1000) * 0.099 * 847 * 1.06
= 2.6 kWh

Illinois Statewide Technical Reference Manual – 5.6.5 High Efficiency Pool Pumps
∆kWh702 = - (((WattsBase - WattsEE) / 1000) * ISR * Hours * HF) / ηHeat
Where:
HF = Heating Factor or percentage of light savings that must be heated
= 49%703 for interior or unknown location
= 0% for exterior or unheated location
ηHeat = Efficiency in COP of Heating equipment
= actual. If not available use704:
System Type Age of Equipment HSPF Estimate
COPHEAT
(COP Estimate) = (HSPF/3.413)*0.85
Heat PumpBefore 2006 6.8 1.7After 2006 - 2014 7.7 1.922015 on 8.2 2.04
Resistance N/A N/A 1.00Unknown705 N/A N/A 1.28
692 Free bulbs provided without request, with little or no education. Based on ‘Impact and Process Evaluation of 2013 (PY6) Ameren Illinois Company Residential CFL Distribution Program’, Report Table 11 and Appendix B.693 Kits provided free to students through school, with education program. Based on ‘Impact and Process Evaluation of 2013 (PY6) Ameren Illinois Company Residential Efficiency Kits Program’, table 10. Final ISR assumptions are based upon comparing with CFL Distribution First year ISR and multiplying by the CFL Distribution Final ISR value, and second and third year estimates based on same proportion of future installs. 694 Opt-in program to receive kits via mail, with little or no education. Based on ‘Impact and Process Evaluation of 2013 (PY6) Ameren Illinois Company Residential Efficiency Kits Program’, table 10, as above.695 Leakage in is only appropriate to credit to IL utility program savings if it is reasonably expected that the IL utility program marketing efforts played an important role in influencing customer to purchase the light bulbs. Furthermore, consideration that such customers might be free riders should be addressed. If leakage in is assessed, efforts should be made to ensure no double counting of savings occurs if the evaluation is estimating both leakage in and spillover savings of light bulbs.696 Leakage rate is based upon review of PY6-8 evaluations from ComEd and PY5,6 and 8 for Ameren (see ‘IL Leakage Rates_112016.xls’ for more information).697 Except where noted, based on lighting logger study conducted as part of the PY5/PY6 ComEd Residential Lighting Program evaluation. Direct Install value excludes all logged bulbs installed in closets.698 Based on secondary research conducted as part of the PY5/PY6 ComEd Residential Lighting Program evaluation.699 Assumes 5% exterior lighting, based on PYPY5/PY6 ComEd Residential Lighting Program evaluation. 700 The value is estimated at 1.06 (calculated as 1 + (0.66*(0.27 / 2.8)). Based on cooling loads decreasing by 27% of the lighting savings (average result from REMRate modeling of several different configurations and IL locations of homes), assuming typical cooling system operating efficiency of 2.8 COP (starting from standard assumption of SEER 10.5 central AC unit, converted to 9.5 EER using algorithm (-0.02 * SEER2) + (1.12 * SEER) (from Wassmer, M. (2003). A Component-Based Model for Residential Air Conditioner and Heat Pump Energy Calculations. Masters Thesis, University of Colorado at Boulder), converted to COP = EER/3.412 = 2.8COP) and 66% of homes in Illinois having central cooling ("Table HC7.9 Air Conditioning in Homes in Midwest Region, Divisions, and States, 2009 from Energy Information Administration", 2009 Residential Energy Consumption Survey)701 As above but using estimate of 45% of multi family buildings in Illinois having central cooling (based on data from “Table HC7.1 Air Conditioning in U.S. Homes, By Housing Unit Type, 2009” which is for the whole of the US, scaled to IL air conditioning prevalence compared to US average) 702 Negative value because this is an increase in heating consumption due to the efficient lighting.703 This means that heating loads increase by 49% of the lighting savings. This is based on the average result from REMRate modeling of several different configurations and IL locations of homes.704 These default system efficiencies are based on the applicable minimum Federal Standards. In 2006 the Federal Standard for Heat Pumps was adjusted. While one would expect the average system efficiency to be higher than this minimum, the likely degradation of efficiencies over time mean that using the minimum standard is appropriate. Note efficiency should include duct losses. Defaults provided assume 15% duct loss for heat pumps.705 Calculation assumes 35% Heat Pump and 65% Resistance, which is based upon data from Energy Information
IL TRM v6.0 Vol. 3_January 25th, 2017_DRAFT Page 211 of 296
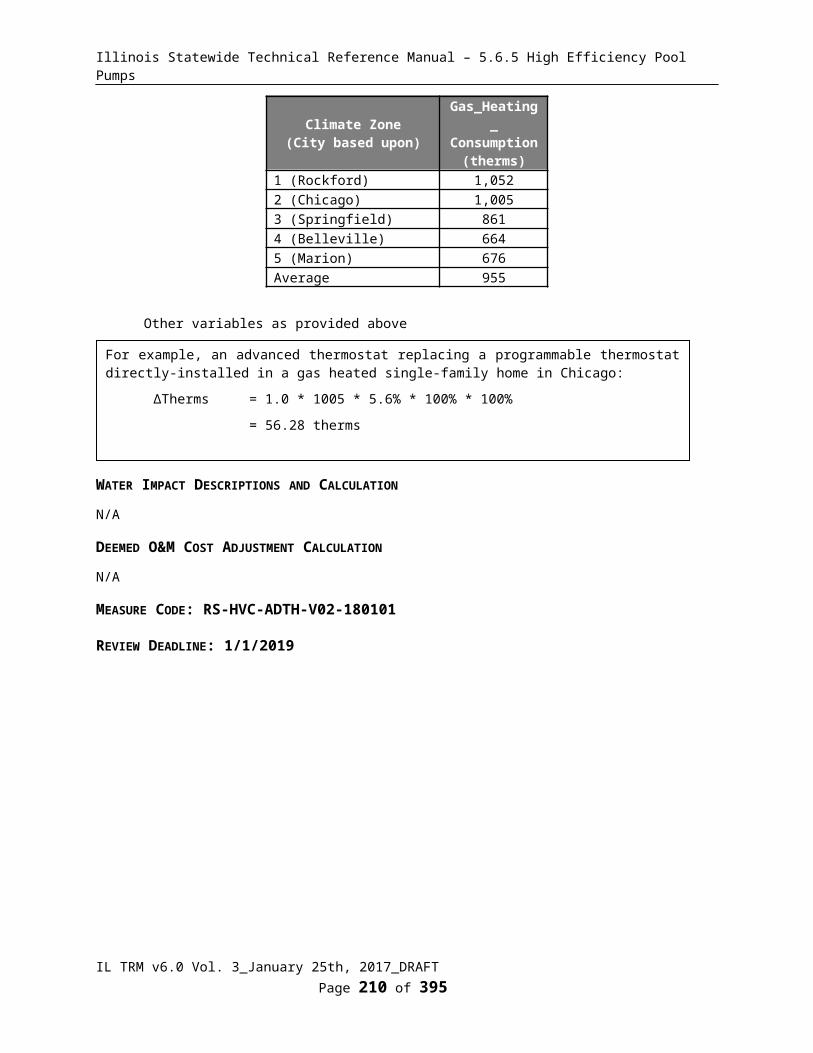
Illinois Statewide Technical Reference Manual – 5.6.5 High Efficiency Pool Pumps
SUMMER COINCIDENT PEAK DEMAND SAVINGS
∆kW = ((WattsBase - WattsEE) / 1 000) * ISR * WHFd * CF
Where:
WHFd = Waste heat factor for demand to account for cooling savings from efficient lighting.
Bulb Location WHFdInterior single family or unknown location 1.11706
Multi family in unit 1.07707
Exterior or uncooled location 1.0
CF = Summer Peak Coincidence Factor for measure.
Program Delivery Bulb Location CF708
Retail(Time of Sale)
Interior single family or Multi Family in unit 7.1%
Exterior 27.3%Unknown location 8.1%
Direct Install Residential 7.4%
Other factors as defined above
Administration, 2009 Residential Energy Consumption Survey, see “HC6.9 Space Heating in Midwest Region.xls”, using average for East North Central Region. Average efficiency of heat pump is based on assumption that 50% are units from before 2006 and 50% from 2006-2014. Program or evaluation data should be used to improve this assumption if available.706 The value is estimated at 1.11 (calculated as 1 + (0.66 * 0.466 / 2.8)). See footnote relating to WHFe for details. Note the 46.6% factor represents the average Residential cooling coincidence factor calculated by dividing average load during the peak hours divided by the maximum cooling load. 707 As above but using estimate of 45% of multi family buildings in Illinois having central cooling (based on data from “Table HC7.1 Air Conditioning in U.S. Homes, By Housing Unit Type, 2009” which is for the whole of the US, scaled to IL air conditioning prevalence compared to US average) 708 Based on lighting logger study conducted as part of the PY5/6 ComEd Residential Lighting Program evaluation. Direct Install value is based on resut excluding all logged bulbs installed in closets.
IL TRM v6.0 Vol. 3_January 25th, 2017_DRAFT Page 212 of 296
For example, a 14W standard CFL is purchased and installed in home with 2.0 COP (including duct loss) Heat Pump:
∆kWh1st year = - (((43 - 14) / 1000) * 0.765 * 759 * 0.49) / 2.0
= - 4.2 kWh
Second and third year install savings should be calculated using the appropriate ISR and the delta watts and hours from the install year.
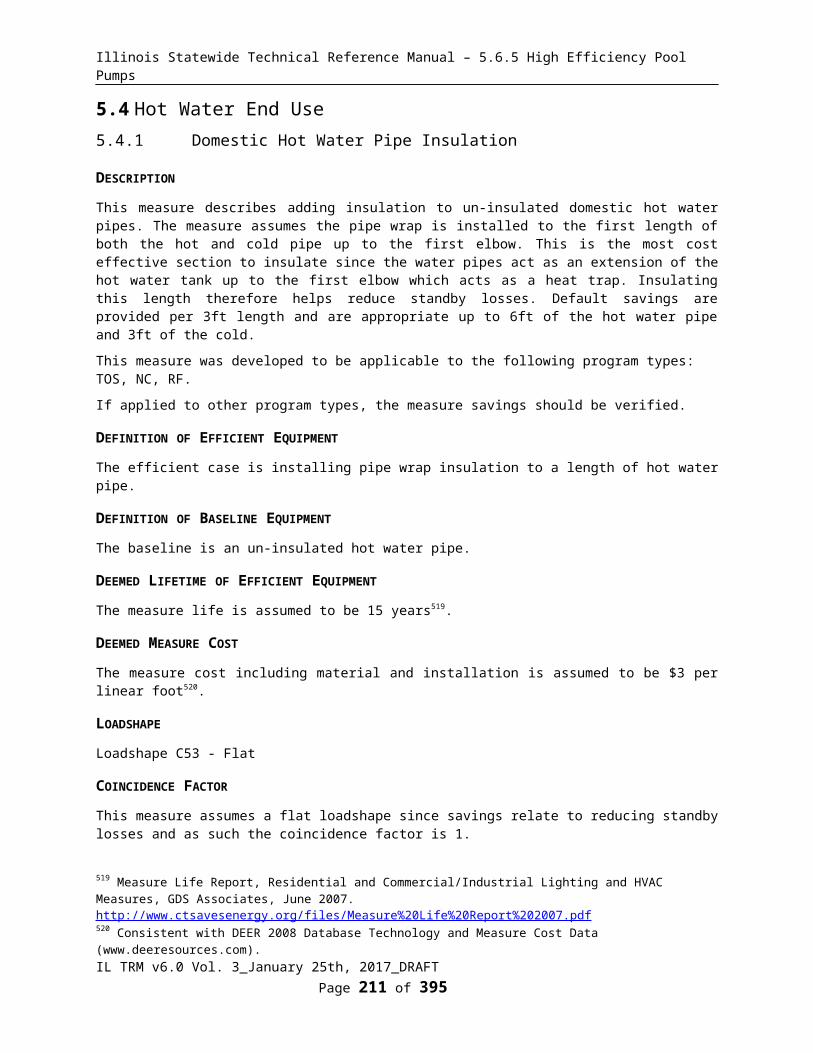
Illinois Statewide Technical Reference Manual – 5.6.5 High Efficiency Pool Pumps
NATURAL GAS SAVINGS
Heating Penalty if Natural Gas heated home (or if heating fuel is unknown):
ΔTherms709 = - (((WattsBase - WattsEE) / 1000) * ISR * Hours * HF * 0.03412) / ηHeat
Where:
HF = Heating Factor or percentage of light savings that must be heated
= 49%710 for interior or unknown location
= 0% for exterior or unheated location
0.03412 =Converts kWh to Therms
ηHeat = Efficiency of heating system
=70%711
WATER IMPACT DESCRIPTIONS AND CALCULATION
N/A
DEEMED O&M COST ADJUSTMENT CALCULATION
The O&M assumptions that should be used in cost effectiveness calculations are provided below:
709 Negative value because this is an increase in heating consumption due to the efficient lighting.710 This means that heating loads increase by 49% of the lighting savings. This is based on the average result from REMRate modeling of several different configurations and IL locations of homes.711 This has been estimated assuming that natural gas central furnace heating is typical for Illinois residences (66% of Illinois homes have a Natural Gas Furnace (based on Energy Information Administration, 2009 Residential Energy Consumption Survey)In 2000, 24% of furnaces purchased in Illinois were condensing (based on data from GAMA, provided to Department of Energy during the federal standard setting process for residential heating equipment - see Furnace Penetration.xls). Furnaces tend to last up to 20 years and so units purchased 10 years ago provide a reasonable proxy for the current mix of furnaces in the State. Assuming typical efficiencies for condensing and non-condensing furnaces and duct losses, the average heating system efficiency is estimated as follows: (0.24*0.92) + (0.76*0.8) * (1-0.15) = 0.70
IL TRM v6.0 Vol. 3_January 25th, 2017_DRAFT Page 213 of 296
For example, a 14W standard CFL is purchased and installed in a single family interior location:
ΔkW = ((43 - 14) / 1000) * 0.765 * 1.11 * 0.071
= 0.0017 kW
Second and third year install savings should be calculated using the appropriate ISR and the delta watts and hours from the install year.
For example, a 14 standard CFL is purchased and installed in a home:
∆Therms = - (((43 - 14) / 1000) * 0.765 * 759 * 0.49 * 0.03412) / 0.7
= - 0.40 Therms
Second and third year install savings should be calculated using the appropriate ISR and the delta watts and hours from the install year.
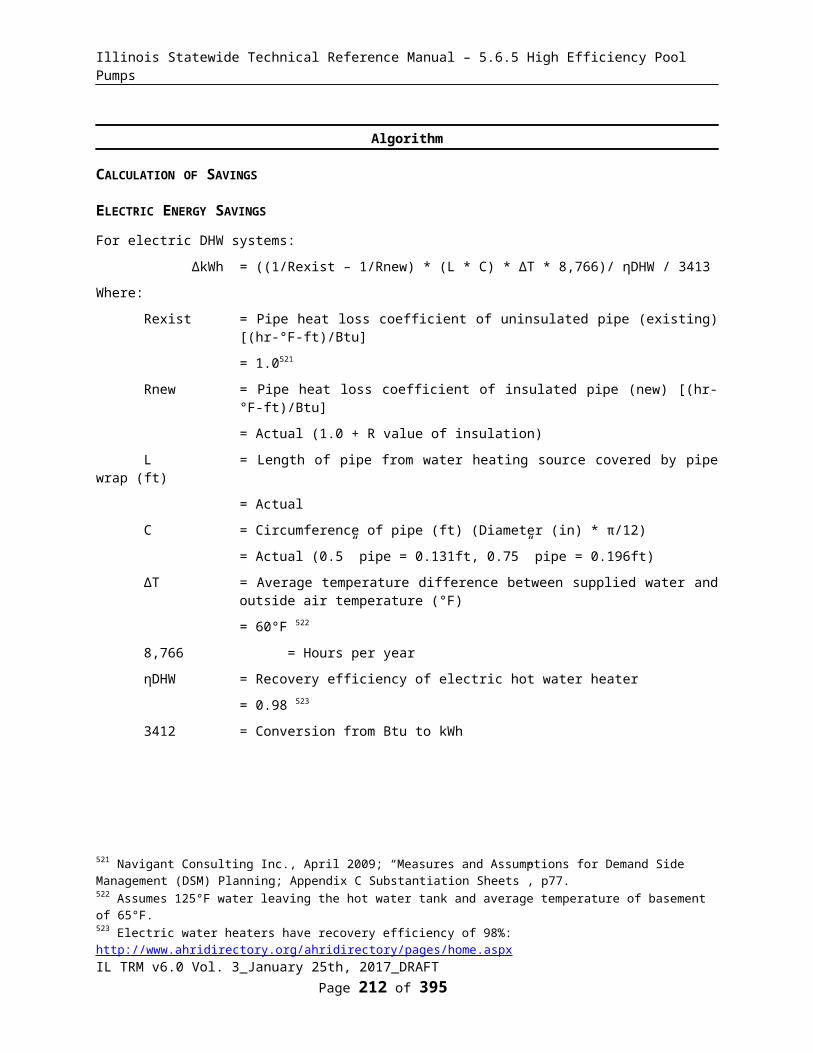
Illinois Statewide Technical Reference Manual – 5.6.5 High Efficiency Pool Pumps
Program Delivery Installation LocationReplacemen
t Period (years)712
Replacement Cost713
Retail (Time of Sale) and Efficiency Kits
Residential Interior and in-unit Multi Family
1.3
$1.25Exterior 0.4Unknown 1.2
Direct InstallResidential Interior and in-unit Multi Family
1.3
Exterior 0.4
It is important to note that for cost-effectiveness screening purposes, the O&M cost adjustments should only be applied in cases where the light bulbs are actually in service and so should be multiplied by the appropriate ISR.
MEASURE CODE: RS-LTG-ESCF-V06-180101
REVIEW DEADLINE: 1/1/2020
712 Calculated by dividing assumed rated life of baseline bulb by hours of use. Assumed lifetime of EISA qualified Halogen/ Incandescents is 1000 hours. The manufacturers are simply using a regular incandescent lamp with halogen fill gas rather than Halogen Infrared to meet the standard (as provided by G. Arnold, NEEP and confirmed by N. Horowitz at NRDC). 713 Based upon field data collected by CLEAResult and provided by ComEd. See ComEd Pricing Projections 06302016.xlsx for analysis.
IL TRM v6.0 Vol. 3_January 25th, 2017_DRAFT Page 214 of 296
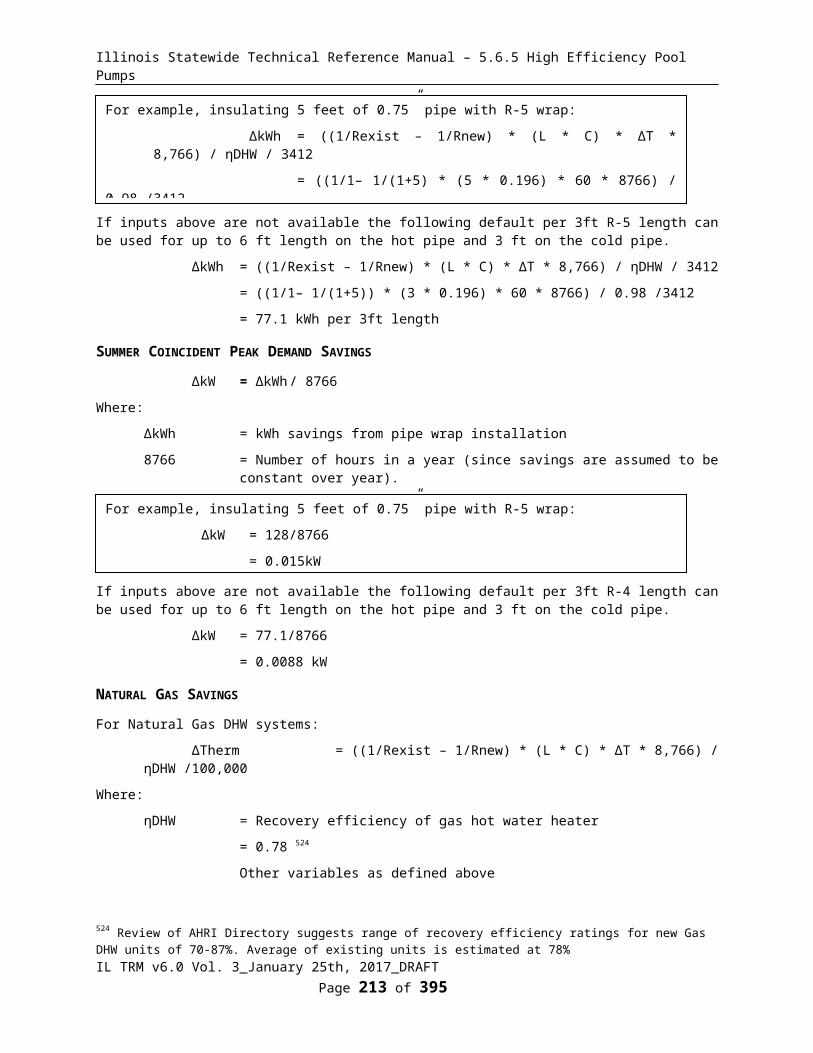
Illinois Statewide Technical Reference Manual – 5.6.5 High Efficiency Pool Pumps
5.5.2 ENERGY STAR Specialty Compact Fluorescent Lamp (CFL)
DESCRIPTION
A qualified specialty compact fluorescent bulb is installed in place of an incandescent specialty bulb.
Note a new ENERGY STAR specification v2.0 becomes effective on 1/2/2017 (https://www.energystar.gov/products/spec/lamps_specification_version_2_0_pd). The efficacy requirements cannot currently be met by Compact Fluorescent Lamps, and therefore this specification has been removed. ENERGY STAR will maintain a list on their website with the final qualifying list of products prior to this change and it is strongly recommended that programs continue to use this list as qualifying criteria for products in the programs.
This characterization assumes that the specialty CFL is installed in a residential location. If the implementation strategy does not allow for the installation location to be known (e.g. an upstream retail program) a deemed split of 95% Residential and 5% Commercial assumptions should be used714.
This measure was developed to be applicable to the following program types: TOS, NC, DI, KITS.
If applied to other program types, the measure savings should be verified.
DEFINITION OF EFFICIENT EQUIPMENT
In order for this characterization to apply, the high-efficiency equipment must be a qualified specialty compact fluorescent lamp.
DEFINITION OF BASELINE EQUIPMENT
The baseline is a specialty incandescent light bulb including those exempt of the EISA 2007 standard: three-way, plant light, daylight bulb, bug light, post light, globes G40 (<40W), candelabra base (<60W), vibration service bulb, decorative candle with medium or intermediate base (<40W), shatter resistant and reflector bulbs and standard bulbs greater than 2601 lumens, and those non-exempt from EISA 2007: dimmable, globes (less than 5” diameter and >40W), candle (shapes B, BA, CA >40W, candelabra base lamps (>60W) and intermediate base lamps (>40W).
DEEMED LIFETIME OF EFFICIENT EQUIPMENT
The expected measure life is assumed to be 6.8 year715 for bulbs exempt from EISA, or 3 years for bulbs non-exempt installed in 2018 and then for every subsequent year should be reduced by one year716.
DEEMED MEASURE COST
For the Retail (Time of Sale) measure, the incremental capital cost for this measure is $5717.
For the Direct Install measure, the full cost of $8.50 should be used plus $5 labor 718 for a total of $13.50. However actual program delivery costs should be utilized if available.
For bulbs provided in Efficiency Kits, the actual program delivery costs should be utilized.
714 RES v C&I split is based on a weighted (by sales volume) average of ComEd PY6, PY7 and PY8 and Ameren PY5, PY6 and PY8 in store intercept survey results. See ‘RESvCI Split_112015.xls’.715 The assumed measure life for the specialty bulb measure characterization was reported in "Residential Lighting Measure Life Study", Nexus Market Research, June 4, 2008 (measure life for markdown bulbs). Measure life estimate does not distinguish between equipment life and measure persistence. Measure life includes products that were installed and operated until failure (i.e., equipment life) as well as those that were retired early and permanently removed from service for any reason, be it early failure, breakage, or the respondent not liking the product (i.e., measure persistence).716 Since the replacement baseline bulb from 2020 on will be equivalent to a CFL, no additional savings should be claimed from that point. Due to expected delay in clearing stock from retail outlets and to account for the operating life of a halogen incandescent potentially spanning over 2020, this shift is assumed not to occur until 2021.717 NEEP Residential Lighting Survey, 2011718 Based on 15 minutes at $20 per hour.
IL TRM v6.0 Vol. 3_January 25th, 2017_DRAFT Page 215 of 296

Illinois Statewide Technical Reference Manual – 5.6.5 High Efficiency Pool Pumps
LOADSHAPE
Loadshape R06 - Residential Indoor LightingLoadshape R07 - Residential Outdoor Lighting
COINCIDENCE FACTOR
Unlike standard CFLs that could be installed in any room, certain types of specialty CFLs are more likely to be found in specific rooms, which affects the coincident peak factor. Coincidence factors by bulb types are presented below719
Bulb Type Peak CFThree-way 0.078720
Dimmable 0.078721
Interior reflector (incl. dimmable) 0.091Exterior reflector 0.273Candelabra base and candle medium and intermediate base 0.121Bug light 0.273Post light (>100W) 0.273Daylight 0.081Plant light 0.081Globe 0.075Vibration or shatterproof 0.081Standard spirals >= 2601 lumens, Residential, Multi-family in unit 0.071Standard spirals >= 2601 lumens, unknown 0.081Standard spirals >= 2601 lumens, exterior 0.273Specialty - Generic 0.081
Algorithm
CALCULATION OF SAVINGS
ELECTRIC ENERGY SAVINGS
∆kWh = ((WattsBase - WattsEE) / 1000) * ISR * (1-Leakage) * Hours * WHFe
Where:
WattsBase = Actual wattage equivalent of incandescent specialty bulb, use the tables below to obtain the incandescent bulb equivalent wattage722; use 60W if unknown723
EISA exempt bulb types:
719 Based on lighting logger study conducted as part of the PY5/6 ComEd Residential Lighting Program evaluation.720 Based on average of bedroom, dining room, office and living room results from the lighting logger study conducted as part of the PY5/6 ComEd Residential Lighting Program evaluation.721 Ibid722 Based upon the draft ENERGY STAR specification for lamps (http://energystar.gov/products/specs/sites/products/files/ENERGY_STAR_Lamps_V1_0_Draft%203.pdf) and the Energy Policy and Conservation Act of 2012.723 A 2006-2008 California Upstream Lighting Evaluation found an average incandescent wattage of 61.7 Watts (KEMA, Inc, The Cadmus Group, Itron, Inc, PA Consulting Group, Jai J. Mitchell Analytics, Draft Evaluation Report: Upstream Lighting Program. Prepared for the California Public Utilities Commission, Energy Division. December 10, 2009)
IL TRM v6.0 Vol. 3_January 25th, 2017_DRAFT Page 216 of 296

Illinois Statewide Technical Reference Manual – 5.6.5 High Efficiency Pool Pumps
Bulb Type Lower Lumen Range
Upper Lumen Range WattsBase
Standard Spirals >=26012601 2999 1503000 5279 2005280 6209 300
3-Way
250 449 25450 799 40800 1099 60
1100 1599 751600 1999 1002000 2549 1252550 2999 150
Globe(medium and intermediate bases less
than 750 lumens)
90 179 10180 249 15250 349 25350 749 40
Decorative(Shapes B, BA, C, CA, DC, F, G, medium and intermediate bases less than 750
lumens)
70 89 1090 149 15
150 299 25300 749 40
Globe(candelabra bases less than 1050
lumens)
90 179 10180 249 15250 349 25350 499 40500 1049 60
Decorative(Shapes B, BA, C, CA, DC, F, G,
candelabra bases less than 1050 lumens)
70 89 1090 149 15
150 299 25300 499 40500 1049 60
Directional Lamps - ENERGY STAR Minimum Luminous Efficacy = 40Lm/W for lamps with rated wattages less than 20Wand 50 Lm/W for lamps with rated wattages >= 20 watts724.
For Directional R, BR, and ER lamp types725:
Bulb TypeLower Lumen Range
Upper Lumen Range
WattsBase
R, ER, BR with medium screw bases w/ diameter >2.25" (*see exceptions below)
420 472 40473 524 45525 714 50715 937 65938 1259 75
1260 1399 901400 1739 1001740 2174 1202175 2624 1502625 2999 175
724 From pg 10 of the Energy Star Specification for lamps v1.1725 From pg 11 of the Energy Star Specification for lamps v1.1
IL TRM v6.0 Vol. 3_January 25th, 2017_DRAFT Page 217 of 296

Illinois Statewide Technical Reference Manual – 5.6.5 High Efficiency Pool Pumps
Bulb TypeLower Lumen Range
Upper Lumen Range
WattsBase
3000 4500 200
*R, BR, and ER with medium screw bases w/ diameter
<=2.25"
400 449 40450 499 45500 649 50650 1199 65
*ER30, BR30, BR40, or ER40400 449 40450 499 45500 649 50
*BR30, BR40, or ER40 650 1419 65
*R20 400 449 40450 719 45
*All reflector lamps below lumen ranges specified above
200 299 20300 399399 30
Directional lamps are exempt from EISA regulations.
For PAR, MR, and MRX Lamps Types:
For these highly focused directional lamp types, it is necessary to have Center Beam Candle Power (CBCP) and beam angle measurements to accurately estimate the equivalent baseline wattage. The formula below is based on the Energy Star Center Beam Candle Power tool.CBCP and beam angle information are not available, or if the equation below returns a negative value (or undefined), use the manufacturer’s recommended baseline wattage equivalent.727
Wattsbase=¿
375.1−4.355 (D )−√227,800−937.9 (D )−0.9903 (D2 )−1479 (BA )−12.02 (D∗BA )+14.69 (BA2 )−16,720∗ln (CBCP)
Where:
D = Bulb diameter (e.g. for PAR20 D = 20)
BA = Beam angle
CBCP = Center beam candle power
The result of the equation above should be rounded DOWN to the nearest wattage established by Energy Star:
Diameter Permitted Wattages16 20, 35, 40, 45, 50, 60, 7520 50
30S 40, 45, 50, 60, 7530L 50, 7538 40, 45, 50, 55, 60, 65, 75, 85, 90, 100, 120, 150, 250
EISA non-exempt bulb types:
399
726 http://energystar.supportportal.com/link/portal/23002/23018/Article/32655/727 The Energy Star Center Beam Candle Power tool does not accurately model baseline wattages for lamps with certain bulb characteristic combinations – specifically for lamps with very high CBCP.
IL TRM v6.0 Vol. 3_January 25th, 2017_DRAFT Page 218 of 296

Illinois Statewide Technical Reference Manual – 5.6.5 High Efficiency Pool Pumps
Bulb TypeLower Lumen Range
Upper Lumen Range
Incandescent Equivalent
Post-EISA 2007(WattsBase)
Dimmable Twist, Globe (less than 5" in diameter and > 749 lumens), candle
(shapes B, BA, CA > 749 lumens), Candelabra Base Lamps (>1049 lumens), Intermediate Base Lamps (>749 lumens)
310 749 29750 1049 43
1050 1489 53
1490 2600 72
WattsEE = Actual wattage of energy efficient specialty bulb purchased, use 15W if unknown728
ISR = In Service Rate, the percentage of units rebated that are actually in service.
ProgramWeighted Average 1st year In Service
Rate (ISR)
2nd year Installations
3rd year Installations
Final Lifetime In Service
RateRetail (Time of Sale) 88.0%729 5.4% 4.6% 98.0%730
Direct Install 96.9%731
Efficiency Kits732
CFL Distribution733 59% 13% 11% 83%
School Kits734 61% 13% 11% 86%Direct Mail Kits735 66% 14% 12% 93%
Leakage = Adjustment to account for the percentage of program bulbs that move out (and in if deemed appropriateJurisdiction.
KITS programs = Determined through evaluation
Upstream (TOS) Lighting programs = Determined through evaluation
728 An evaluation (Energy Efficiency / Demand Response Plan: Plan Year 2 (6/1/2009-5/31/2010) Evaluation Report: Residential Energy Star ® Lighting ) reported 13-17W as the most common specialty CFL wattage (69% of program bulbs). 2009 California data also reported an average CFL wattage of 15.5 Watts (KEMA, Inc, The Cadmus Group, Itron, Inc, PA Consulting Group, Jai J. Mitchell Analytics, Draft Evaluation Report: Upstream Lighting Program, Prepared for the California Public Utilities Commission, Energy Division. December 10, 2009).729 1st year in service rate is based upon review of PY4-6 evaluations from ComEd and PY5-6 from Ameren (see ‘IL RES Lighting ISR_122014.xls’ for more information. The average first year ISR was calculated weighted by the number of bulbs in the each year’s survey. 730 The 98% Lifetime ISR assumption is consistent with the assumption for standard CFLs (in the absence of evidence that it should be different for this bulb type) based upon review of two evaluations:‘Nexus Market Research, RLW Analytics and GDS Associates study; “New England Residential Lighting Markdown Impact Evaluation, January 20, 2009’ and ‘KEMA Inc, Feb 2010, Final Evaluation Report:, Upstream Lighting Program, Volume 1.’ This implies that only 2% of bulbs purchased are never installed. The second and third year installations are based upon Ameren analysis of the Californian KEMA study showing that 54% of future installs occur in year 2 and 46% in year 3. The 2nd and 3rd year installations should be counted as part of those future program year savings.731 Consistent with assumption for standard CFLs (in the absence of evidence that it should be different for this bulb type). Based upon review of the PY2 and PY3 ComEd Direct Install program surveys. This value includes bulb failures in the 1st year to be consistent with the Commission approval of annualization of savings for first year savings claims. ComEd PY2 All Electric Single Family Home Energy Performance Tune-Up Program Evaluation, Navigant Consulting, December 21, 2010.732 In Service Rates provided are for the bulb within a kit only. Given the significant differences in program design and the level of education provided through Efficiency Kits programs, the evaluators should apply the ISR estimated through evaluations (either past evaluations or the current program year evaluation) of the specific Efficiency Kits program. In cases where program-specific evaluation results for an ISR are unavailable, the default ISR values for Efficiency Kits provide may be used.
IL TRM v6.0 Vol. 3_January 25th, 2017_DRAFT Page 219 of 296

Illinois Statewide Technical Reference Manual – 5.6.5 High Efficiency Pool Pumps
or use deemed assumptions below737:
ComEd: 2.1%
Ameren: 13.1%
All other programs = 0
IL TRM v6.0 Vol. 3_January 25th, 2017_DRAFT Page 220 of 296

Illinois Statewide Technical Reference Manual – 5.6.5 High Efficiency Pool Pumps
Hours = Average hours of use per year, varies by bulb type as presented below:738
Bulb Type Annual hours of use (HOU)
Three-way 850Dimmable 850Interior reflector (incl. dimmable) 861Exterior reflector 2475Candelabra base and candle medium and intermediate base 1190
Bug light 2475Post light (>100W) 2475Daylight 847Plant light 847Globe 639Vibration or shatterproof 847Standard Spiral >2601 lumens, Residential, Multi Family in-unit 759
Standard Spiral >2601 lumens, unknown 847Standard Spiral >2601 lumens, Exterior 2475Specialty - Generic 847
WHFe = Waste heat factor for energy to account for cooling savings from efficient lighting
Bulb Location WHFeInterior single family or unknown location 1.06 739
Multi family in unit 1.04 740
Exterior or uncooled location 1.0
733 Free bulbs provided without request, with little or no education. Consistent with Standard CFL assumptions.734 Kits provided free to students through school, with education program. Consistent with Standard CFL assumptions.735 Opt-in program to receive kits via mail, with little or no education. Consistent with Standard CFL assumptions.736 Leakage in is only appropriate to credit to IL utility program savings if it is reasonably expected that the IL utility program marketing efforts played an important role in influencing customer to purchase the light bulbs. Furthermore, consideration that such customers might be free riders should be addressed. If leakage in is assessed, efforts should be made to ensure no double counting of savings occurs if the evaluation is estimating both leakage in and spillover savings of light bulbs.737 Leakage rate is based upon review of PY6-8 evaluations from ComEd and PY5,6 and 8 for Ameren (see ‘IL Leakage Rates_112016.xls’ for more information).738 Hours of use by specialty bulb type calculated using the average hours of use in locations or rooms where each type of specialty bulb is most commonly found. Values for Reflector, Decorative and Globe are taken directly from the lighting logger study conducted as part of the PY5/6 ComEd Residential Lighting Program evaluation. All other hours have been updated based on the room specific hours of use from the PY5/PY6 logger study. 739 The value is estimated at 1.06 (calculated as 1 + (0.66*(0.27 / 2.8)). Based on cooling loads decreasing by 27% of the lighting savings (average result from REMRate modeling of several different configurations and IL locations of homes), assuming typical cooling system operating efficiency of 2.8 COP (starting from standard assumption of SEER 10.5 central AC unit, converted to 9.5 EER using algorithm (-0.02 * SEER2) + (1.12 * SEER) (from Wassmer, M. (2003). A Component-Based Model for Residential Air Conditioner and Heat Pump Energy Calculations. Masters Thesis, University of Colorado at Boulder), converted to COP = EER/3.412 = 2.8COP) and 66% of homes in Illinois having central cooling ("Table HC7.9 Air Conditioning in Homes in Midwest Region, Divisions, and States, 2009 from Energy Information Administration", 2009 Residential Energy Consumption Survey)740 As above but using estimate of 45% of multi family buildings in Illinois having central cooling (based on data from “Table HC7.1 Air Conditioning in U.S. Homes, By Housing Unit Type, 2009” which is for the whole of the US, scaled to IL air conditioning prevalence compared to US average).
IL TRM v6.0 Vol. 3_January 25th, 2017_DRAFT Page 221 of 296
Illinois Statewide Technical Reference Manual – 5.6.5 High Efficiency Pool Pumps
DEFERRED INSTALLS
As presented above, the characterization assumes that a percentage of bulbs purchased are not installed until Year 2 and Year 3 (see ISR assumption above). The Illinois Technical Advisory Committee has determined the following methodology for calculating the savings of these future installs.
Year 1 (Purchase Year) installs: Characterized using assumptions provided above or evaluated assumptions if available.
Year 2 and 3 installs: Characterized using delta watts assumption and hours of use from the Install Year i.e. the actual deemed (or evaluated if available) assumptions active in Year 2 and 3 should be applied.
The NTG factor for the Purchase Year should be applied.
HEATING PENALTY
If electric heated home (if heating fuel is unknown assume gas, see Natural Gas section):
∆kWh741 = - (((WattsBase - WattsEE) / 1000) * ISR * Hours * HF) / ηHeat
Where:
HF = Heating Factor or percentage of light savings that must be heated
= 49%742 for interior or unknown location
= 0% for exterior location
ηHeat = Efficiency in COP of Heating equipment
= actual. If not available use743:
System Type Age of Equipment HSPF Estimate
COPHEAT
(COP Estimate)= (HSPF/3.413)*0.85
Heat Pump Before 2006 6.8 1.7After 2006 - 2014 7.7 1.92
741 Negative value because this is an increase in heating consumption due to the efficient lighting.742 This means that heating loads increase by 49% of the lighting savings. This is based on the average result from REMRate modeling of several different configurations and IL locations of homes.743 These default system efficiencies are based on the applicable minimum Federal Standards. In 2006 the Federal Standard for Heat Pumps was adjusted. While one would expect the average system efficiency to be higher than this minimum, the likely degradation of efficiencies over time mean that using the minimum standard is appropriate. Note efficiency should include duct losses. Defaults provided assume 15% duct loss for heat pumps.
IL TRM v6.0 Vol. 3_January 25th, 2017_DRAFT Page 222 of 296
For example, for a 13W dimmable CFL impacted by EISA 2007 (60W standard incandescent and 43W EISA qualified incandescent/halogen).
ΔkWH1st year installs = ((60 - 13) / 1000) * 0.823 * 850 * 1.06
= 34.9 kWh
ΔkWH2nd year installs = ((43 - 13) / 1000) * 0.085 * 850 * 1.06
= 2.3 kWh
Note: Here we assume no change in hours assumption. NTG value from Purchase year applied.
ΔkWH3rd year installs = ((43 - 13) / 1000) * 0.072 * 850 * 1.06
= 1.9 kWh
Note: delta watts is equivalent to install year. Here we assume no change in hours assumption.
Illinois Statewide Technical Reference Manual – 5.6.5 High Efficiency Pool Pumps
2015 on 8.2 2.04Resistance N/A N/A 1.00Unknown744 N/A N/A 1.28
SUMMER COINCIDENT PEAK DEMAND SAVINGS
∆kW =((WattsBase - WattsEE) / 1000) * ISR * WHFd * CF
Where:
WHFd = Waste heat factor for demand to account for cooling savings from efficient lighting.
Bulb Location WHFdInterior single family or unknown location 1.11745
Multi family in unit 1.07746
Exterior or uncooled location 1.0
CF = Summer Peak Coincidence Factor for measure. Coincidence factors by bulb types are presented below747
Bulb Type Peak CFThree-way 0.078748
Dimmable 0.078749
Interior reflector (incl. dimmable) 0.091Exterior reflector 0.273Candelabra base and candle medium and intermediate base 0.121Bug light 0.273Post light (>100W) 0.273Daylight 0.081Plant light 0.081Globe 0.075Vibration or shatterproof 0.081Standard Spiral >=2601 lumens, Residential, Multi-family in unit 0.071Standard spirals >= 2601 lumens, unknown 0.081
744 Calculation assumes 35% Heat Pump and 65% Resistance, which is based upon data from Energy Information Administration, 2009 Residential Energy Consumption Survey, see “HC6.9 Space Heating in Midwest Region.xls”, using average for East North Central Region. Average efficiency of heat pump is based on assumption that 50% are units from before 2006 and 50% from 2006-2014. Program or evaluation data should be used to improve this assumption if available.745 The value is estimated at 1.11 (calculated as 1 + (0.66 * 0.466 / 2.8)). See footnote relating to WHFe for details. Note the 46.6% factor represents the average Residential cooling coincidence factor calculated by dividing average load during the peak hours divided by the maximum cooling load. 746 As above but using estimate of 45% of multifamily buildings in Illinois having central cooling (based on data from “Table HC7.1 Air Conditioning in U.S. Homes, By Housing Unit Type, 2009” which is for the whole of the US, scaled to IL air conditioning prevalence compared to US average); http://205.254.135.7/consumption/residential/data/2009/xls/HC7.1%20Air%20Conditioning%20by%20Housing%20Unit%20Type.xls.
IL TRM v6.0 Vol. 3_January 25th, 2017_DRAFT Page 223 of 296
For example, a 15W globe CFL replacing a 60W incandescent specialty bulb installed in home with 2.0 COP Heat Pump (including duct loss):
∆kWh1st year = - (((60 - 15) / 1000) * 0.823 * 639 * 0.49) / 2.0
= - 5.8 kWh
Second and third year savings should be calculated using the appropriate ISR.

Illinois Statewide Technical Reference Manual – 5.6.5 High Efficiency Pool Pumps
Bulb Type Peak CFStandard spirals >= 2601 lumens, exterior 0.273Specialty - Generic 0.081
Other factors as defined above
NATURAL GAS SAVINGS
Heating Penalty if Natural Gas heated home (or if heating fuel is unknown):
∆Therms750 = - (((WattsBase - WattsEE) / 1000) * ISR * Hours * HF * 0.03412) / ηHeat
Where:
HF = Heating Factor or percentage of light savings that must be heated
= 49%751 for interior or unknown location
= 0% for exterior location
0.03412 =Converts kWh to Therms
ηHeat = Efficiency of heating system
=70%752
747 Based on lighting logger study conducted as part of the PY5/6 ComEd Residential Lighting Program evaluation.748 Based on average of bedroom, dining room, office and living room results from the lighting logger study conducted as part of the PY5/6 ComEd Residential Lighting Program evaluation.749 Ibid750 Negative value because this is an increase in heating consumption due to the efficient lighting.751 This means that heating loads increase by 49% of the lighting savings. This is based on the average result from REMRate modeling of several different configurations and IL locations of homes.752 This has been estimated assuming that natural gas central furnace heating is typical for Illinois residences (66% of Illinois homes have a Natural Gas Furnace (based on EIA Residential Energy Consumption Survey (RECS) 2009 for Midwest Region, data for the state of IL. If utilities have specific evaluation results providing a more appropriate assumption for homes in a particular market or geographical area then that should be used.)In 2000, 24% of furnaces purchased in Illinois were condensing (based on data from GAMA, provided to Department of Energy during the federal standard setting process for residential heating equipment - see Furnace Penetration.xls). Furnaces tend to last up to 20 years and so units purchased 10 years ago provide a reasonable proxy for the current mix of furnaces in the State. Assuming typical efficiencies for condensing and non-condensing furnaces and duct losses, the average heating system efficiency is estimated as follows: (0.24*0.92) + (0.76*0.8) * (1-0.15) = 0.70
IL TRM v6.0 Vol. 3_January 25th, 2017_DRAFT Page 224 of 296
For example, a 15W specialty CFL replacing a 60W incandescent specialty bulb:
ΔkW1st year = ((60 - 15) / 1000) * 0.823 * 1.11 * 0.081
= 0.003 kW
Second and third year savings should be calculated using the appropriate ISR.
For example, a 15W Globe specialty CFL replacing a 60W incandescent specialty bulb:
∆Therms = - (((60 - 15) / 1000) * 0. 823 * 639 * 0.49 * 0.03412) / 0.7
= - 0.57 Therms
Second and third year savings should be calculated using the appropriate ISR.

Illinois Statewide Technical Reference Manual – 5.6.5 High Efficiency Pool Pumps
WATER IMPACT DESCRIPTIONS AND CALCULATION
N/A
DEEMED O&M COST ADJUSTMENT CALCULATION
The following O&M assumptions should be used: Life of the baseline bulb is assumed to be 1.32 year 753; baseline replacement cost is assumed to be $3.5754.
It is important to note that for cost-effectiveness screening purposes, the O&M cost adjustments should only be applied in cases where the light bulbs area actually in service and so should be multiplied by the appropriate ISR.
MEASURE CODE: RS-LTG-ESCC-V05-180101
REVIEW DEADLINE: 1/1/2020
753 Assuming 1000 hour rated life for incandescent bulb: 1000/759 = 1.32754 NEEP Residential Lighting Survey, 2011
IL TRM v6.0 Vol. 3_January 25th, 2017_DRAFT Page 225 of 296

Illinois Statewide Technical Reference Manual – 5.6.5 High Efficiency Pool Pumps
5.5.3 ENERGY STAR Torchiere
DESCRIPTION
A high efficiency ENERGY STAR fluorescent torchiere is purchased in place of a baseline mix of halogen and incandescent torchieres and installed in a residential setting.
This measure was developed to be applicable to the following program types: TOS, NC.
If applied to other program types, the measure savings should be verified.
DEFINITION OF EFFICIENT EQUIPMENT
To qualify for this measure the fluorescent torchiere must meet ENERGY STAR efficiency standards.
DEFINITION OF BASELINE EQUIPMENT
The baseline is based on a mix of halogen and incandescent torchieres.
DEEMED LIFETIME OF EFFICIENT EQUIPMENT
The lifetime of the measure is assumed to be 8 years755.
DEEMED MEASURE COST
The incremental cost for this measure is assumed to be $5756.
LOADSHAPE
Loadshape R06 - Residential Indoor LightingLoadshape R07 - Residential Outdoor Lighting
COINCIDENCE FACTOR
The summer peak coincidence factor for this measure is 7.1% for Residential and in-unit Multi Family bulbs and 8.1% for bulbs installed in unknown locations757.
Algorithm
CALCULATION OF SAVINGS
ELECTRIC ENERGY SAVINGS
ΔkWh = ((ΔWatts) /1000) * ISR * (1-Leakage) * HOURS * WHFe
Where:
ΔWatts = Average delta watts per purchased ENERGY STAR torchiere
= 115.8 758
755 Measure Life Report, Residential and Commercial/Industrial Lighting and HVAC Measures, GDS Associates, June 2007.756 DEER 2008 Database Technology and Measure Cost Data (www.deeresources.com) and consistent with Efficiency Vermont TRM.757 Based on lighting logger study conducted as part of the PY5/6 ComEd Residential Lighting Program evaluation. 758 Nexus Market Research, “Impact Evaluation of the Massachusetts, Rhode Island and Vermont 2003 Residential Lighting Programs”, Final Report, October 1, 2004, p. 43 (Table 4-9)
IL TRM v6.0 Vol. 3_January 25th, 2017_DRAFT Page 226 of 296

Illinois Statewide Technical Reference Manual – 5.6.5 High Efficiency Pool Pumps
ISR = In Service Rate or percentage of units rebated that get installed.
= 0.86 759
Leakage = Adjustment to account for the percentage of program bulbs that move out (and in if deemed appropriate760) of the Utility Jurisdiction.
KITS programs = Determined through evaluation
Upstream (TOS) Lighting programs = Determined through evaluation
or use deemed assumptions below761:
ComEd: 2.1%
Ameren: 13.1%
All other programs = 0
HOURS = Average hours of use per year
Installation Location HoursResidential and in-unit Multi Family 1095 (3.0 hrs per day)762
WHFe = Waste Heat Factor for Energy to account for cooling savings from efficient lighting
Bulb Location WHFeInterior single family or unknown location 1.06 763
Multi family in unit 1.04 764
Exterior or uncooled location 1.0
For single family buildings:
ΔkWh = (115.8 /1000) * 0.86 * 1095 * 1.06
= 116 kWh
For multi family in unit:
759 Nexus Market Research, RLW Analytics “Impact Evaluation of the Massachusetts, Rhode Island, and Vermont 2003 Residential Lighting Programs” table 6-3 on p63 indicates that 86% torchieres were installed in year one. http://publicservice.vermont.gov/energy/ee_files/efficiency/eval/marivtreportfinal100104.pdf 760 Leakage in is only appropriate to credit to IL utility program savings if it is reasonably expected that the IL utility program marketing efforts played an important role in influencing customer to purchase the light bulbs. Furthermore, consideration that such customers might be free riders should be addressed. If leakage in is assessed, efforts should be made to ensure no double counting of savings occurs if the evaluation is estimating both leakage in and spillover savings of light bulbs.761 Leakage rate is based upon review of PY6-8 evaluations from ComEd and PY5,6 and 8 for Ameren (see ‘IL Leakage Rates_112016.xls’ for more information).762 Nexus Market Research, “Impact Evaluation of the Massachusetts, Rhode Island and Vermont 2003 Residential Lighting Programs”, Final Report, October 1, 2004, p. 104 (Table 9-7)763 The value is estimated at 1.06 (calculated as 1 + (0.66*(0.27 / 2.8)). Based on cooling loads decreasing by 27% of the lighting savings (average result from REMRate modeling of several different configurations and IL locations of homes), assuming typical cooling system operating efficiency of 2.8 COP (starting from standard assumption of SEER 10.5 central AC unit, converted to 9.5 EER using algorithm (-0.02 * SEER2) + (1.12 * SEER) (from Wassmer, M. (2003). A Component-Based Model for Residential Air Conditioner and Heat Pump Energy Calculations. Masters Thesis, University of Colorado at Boulder), converted to COP = EER/3.412 = 2.8COP) and 66% of homes in Illinois having central cooling ("Table HC7.9 Air Conditioning in Homes in Midwest Region, Divisions, and States, 2009 from Energy Information Administration", 2009 Residential Energy Consumption Survey)764 As above but using estimate of 45% of multi family buildings in Illinois having central cooling (based on data from “Table HC7.1 Air Conditioning in U.S. Homes, By Housing Unit Type, 2009” which is for the whole of the US, scaled to IL air conditioning prevalence compared to US average)
IL TRM v6.0 Vol. 3_January 25th, 2017_DRAFT Page 227 of 296
Illinois Statewide Technical Reference Manual – 5.6.5 High Efficiency Pool Pumps
ΔkWh = (115.8 /1000) * 0.86 * 1095 * 1.04
= 113 kWh
HEATING PENALTY
If electric heated home (if heating fuel is unknown assume gas, see Natural Gas section):
∆kWh765 = - ((ΔWatts) /1000) * ISR * HOURS * HF) / ηHeat
Where:
HF = Heating Factor or percentage of light savings that must be heated
= 49%766 for interior or unknown location
ηHeat = Efficiency in COP of Heating equipment
= Actual. If not available use defaults provided below767:
System Type Age of Equipment HSPF Estimate
COPHEAT
(COP Estimate)= (HSPF/3.413)*0.85
Heat PumpBefore 2006 6.8 1.7After 2006 - 2014 7.7 1.922015 on 8.2 2.04
Resistance N/A N/A 1.00Unknown768 N/A N/A 1.28
SUMMER COINCIDENT PEAK DEMAND SAVINGS
ΔkW = ((ΔWatts) /1000) * ISR * WHFd * CF
Where:
WHFd = Waste Heat Factor for Demand to account for cooling savings from efficient lighting
Bulb Location WHFdInterior single family or unknown location 1.11769
765 Negative value because this is an increase in heating consumption due to the efficient lighting.766 This means that heating loads increase by 49% of the lighting savings. This is based on the average result from REMRate modeling of several different configurations and IL locations of homes.767 These default system efficiencies are based on the applicable minimum Federal Standards. In 2006 the Federal Standard for Heat Pumps was adjusted. While one would expect the average system efficiency to be higher than this minimum, the likely degradation of efficiencies over time mean that using the minimum standard is appropriate. Note efficiency should include duct losses. Defaults provided assume 15% duct loss for heat pumps.768 Calculation assumes 35% Heat Pump and 65% Resistance, which is based upon data from Energy Information Administration, 2009 Residential Energy Consumption Survey, see “HC6.9 Space Heating in Midwest Region.xls”, using average for East North Central Region. Average efficiency of heat pump is based on assumption that 50% are units from before 2006 and 50% from 2006-2014. Program or evaluation data should be used to improve this assumption if available.769 The value is estimated at 1.11 (calculated as 1 + (0.66 * 0.466 / 2.8)). See footnote relating to WHFe for details. Note the 46.6% factor represents the average Residential cooling coincidence factor calculated by dividing average load during the peak
IL TRM v6.0 Vol. 3_January 25th, 2017_DRAFT Page 228 of 296
For example, an ES torchiere installed in a house with a 2016 heat pump:
ΔkWh = - ((115.8) / 1000) * 0.86 * 1095 * 0.49) / 2.04
= - 26.2 kWh

Illinois Statewide Technical Reference Manual – 5.6.5 High Efficiency Pool Pumps
Bulb Location WHFdMulti family in unit 1.07770
Exterior or uncooled location 1.0
CF = Summer Peak Coincidence Factor for measure
Bulb Location CF771
Interior single family or Multi family in unit 7.1%Unknown location 8.1%
For single family and multi-family in unit buildings:
ΔkW = (115.8 / 1000) * 0.86 * 1.11 * 0.071
= 0.008kW
For unknown location:
ΔkW = (115.8 / 1000) * 0.86 * 1.07 * 0.081
= 0.009 kW
NATURAL GAS SAVINGS
Heating penalty if Natural Gas heated home, or if heating fuel is unknown.
∆ThermsWH = - (((ΔWatts) /1000) * ISR * HOURS * 0.03412 * HF) / ηHeat
Where:
∆ThermsWH= gross customer annual heating fuel increased usage for the measure from the reduction in lighting heat in therms.
0.03412 = conversion from kWh to therms
HF = Heating Factor or percentage of light savings that must be heated
= 49% 772
ηHeat = average heating system efficiency
= 70% 773
∆ThermsWH = - ((115.8 / 1000) * 0.86 * 1095 * 0.03412 * 0.49) / 0.70
= - 2.60 therms
hours divided by the maximum cooling load. 770 As above but using estimate of 45% of multi family buildings in Illinois having central cooling (based on data from “Table HC7.1 Air Conditioning in U.S. Homes, By Housing Unit Type, 2009” which is for the whole of the US, scaled to IL air conditioning prevalence compared to US average) 771 Based on lighting logger study conducted as part of the PY5/6 ComEd Residential Lighting Program evaluation. 772 This means that heating loads increase by 49% of the lighting savings. This is based on the average result from REMRate modeling of several different configurations and IL locations of homes.773 This has been estimated assuming that natural gas central furnace heating is typical for Illinois residences (66% of Illinois homes have a Natural Gas Furnace (based on Energy Information Administration, 2009 Residential Energy Consumption Survey) In 2000, 24% of furnaces purchased in Illinois were condensing (based on data from GAMA, provided to Department of Energy during the federal standard setting process for residential heating equipment - see Furnace Penetration.xls). Furnaces tend to last up to 20 years and so units purchased 10 years ago provide a reasonable proxy for the current mix of furnaces in the State. Assuming typical efficiencies for condensing and non-condensing furnaces and duct losses, the average heating system efficiency is estimated as follows: (0.24*0.92) + (0.76*0.8) * (1-0.15) = 0.70
IL TRM v6.0 Vol. 3_January 25th, 2017_DRAFT Page 229 of 296

Illinois Statewide Technical Reference Manual – 5.6.5 High Efficiency Pool Pumps
WATER IMPACT DESCRIPTIONS AND CALCULATION
N/A
DEEMED O&M COST ADJUSTMENT CALCULATION
Life of the baseline bulb is assumed to be 1.83 years774 for residential and multifamily in unit. Baseline bulb cost replacement is assumed to be $6.775
It is important to note that for cost-effectiveness screening purposes, the O&M cost adjustments should only be applied in cases where the light bulbs area actually in service and so should be multiplied by the appropriate ISR.
MEASURE CODE: RS-LTG-ESTO-V04-180101
REVIEW DEADLINE: 1/1/2020
774 Based on VEIC assumption of baseline bulb (mix of incandescent and halogen) average rated life of 2000 hours, 2000/1095 = 1.83 years.775 Derived from Efficiency Vermont TRM.
IL TRM v6.0 Vol. 3_January 25th, 2017_DRAFT Page 230 of 296

Illinois Statewide Technical Reference Manual – 5.6.5 High Efficiency Pool Pumps
5.5.4 Exterior Hardwired Compact Fluorescent Lamp (CFL) Fixture
DESCRIPTION
An ENERGY STAR lighting fixture wired for exclusive use with pin-based compact fluorescent lamps is installed in an exterior residential setting. This measure could relate to either a fixture replacement or new installation (i.e. time of sale).
Federal legislation stemming from the Energy Independence and Security Act of 2007 required all general-purpose light bulbs between 40 and 100W to be approximately 30% more energy efficient than current incandescent bulbs. Production of 100W, standard efficacy incandescent lamps ends in 2012, followed by restrictions on 75W in 2013 and 60W and 40W in 2014. The baseline for this measure has therefore become bulbs (improved incandescent or halogen) that meet the new standard.
A provision in the EISA regulations requires that by January 1, 2020, all lamps meet efficiency criteria of at least 45 lumens per watt, in essence making the baseline equivalent to a current day CFL. Therefore the measure life (number of years that savings should be claimed) should be reduced once the assumed lifetime of the bulb exceeds 2020. Due to expected delay in clearing retail inventory and to account for the operating life of a halogen incandescent potentially spanning over 2020, this shift is assumed not to occur until 2021.
This measure was developed to be applicable to the following program types: TOS, NC. If applied to other program types, the measure savings should be verified.
DEFINITION OF EFFICIENT EQUIPMENT
The efficient condition is an ENERGY STAR lighting exterior fixture for pin-based compact fluorescent lamps.
DEFINITION OF BASELINE EQUIPMENT
The baseline condition is a standard EISA qualified incandescent or halogen exterior fixture as provided in the table provided in the Electric Energy Savings section.
DEEMED LIFETIME OF EFFICIENT EQUIPMENT
The expected life of an exterior fixture is 20 years776. However due to the backstop provision in the Energy Independence and Security Act of 2007 that requires by January 1, 2020, all lamps meet efficiency criteria of at least 45 lumens per watt, the baseline replacement would become a CFL in that year. The expected measure life for CFL fixtures installed in 2018 is therefore assumed to be 3 years. For bulbs installed in 2019, this would be reduced to 2 years777.
DEEMED MEASURE COST
The incremental cost for an exterior fixture is assumed to be $32778.
LOADSHAPE
Loadshape R07 - Residential Outdoor Lighting
776 Measure Life Report, Residential and Commercial/Industrial Lighting and HVAC Measures, GDS Associates, June 2007 (http://www.ctsavesenergy.org/files/Measure%20Life%20Report%202007.pdf) gives 20 years for an interior fluorescent fixture.777 Due to expected delay in clearing stock from retail outlets and to account for the operating life of a halogen incandescent potentially spanning over 2020, this shift is assumed not to occur until 2021.778 ENERGY STAR Qualified Lighting Savings Calculator default incremental cost input for exterior fixture (http://www.energystar.gov/buildings/sites/default/uploads/files/light_fixture_ceiling_fan_calculator.xlsx?4349-303e=&b6b3-3efd&b6b3-3efd)
IL TRM v6.0 Vol. 3_January 25th, 2017_DRAFT Page 231 of 296

Illinois Statewide Technical Reference Manual – 5.6.5 High Efficiency Pool Pumps
COINCIDENCE FACTOR
The summer peak coincidence factor is assumed to be 27.3%779.
Algorithm
CALCULATION OF SAVINGS
ELECTRIC ENERGY SAVINGS
ΔkWh =((WattsBase - WattsEE) / 1000) * ISR * (1-Leakage) * Hours
Where:
WattsBase = Based on lumens of CFL bulb and program year purchased:
Minimum Lumens Maximum Lumens
Incandescent Equivalent
Post-EISA 2007(WattsBase)
5280 6209 3003000 5279 2002601 2999 1501490 2600 721050 1489 53750 1049 43310 749 29250 309 25
WattsEE = Actual wattage of CFL purchased
ISR = In Service Rate or the percentage of units rebated that get installed.
Program
Weighted Average 1st
year In Service Rate (ISR)
2nd year Installations
3rd year Installations
Final Lifetime In
Service Rate
Retail (Time of Sale) 87.5%780 5.7% 4.8% 98.0%781
Direct Install 96.9782
Leakage = Adjustment to account for the percentage of program bulbs that move out (and in if
779 Based on lighting logger study conducted as part of the PY5/6 ComEd Residential Lighting Program evaluation.780 1st year in service rate is based upon review of PY2-3 evaluations from ComEd (see ‘IL RES Lighting ISR.xls’ for more information. The average first year ISR was calculated weighted by the number of bulbs in the each year’s survey. 781 The 98% Lifetime ISR assumption is consistent with the assumption for standard CFLs (in the absence of evidence that it should be different for this bulb type) based upon review of two evaluations:‘Nexus Market Research, RLW Analytics and GDS Associates study; “New England Residential Lighting Markdown Impact Evaluation, January 20, 2009’ and ‘KEMA Inc, Feb 2010, Final Evaluation Report:, Upstream Lighting Program, Volume 1.’ This implies that only 2% of bulbs purchased are never installed. The second and third year installations are based upon Ameren analysis of the Californian KEMA study showing that 54% of future installs occur in year 2 and 46% in year 3. The 2nd and 3rd year installations should be counted as part of those future program year savings. 782 In the absence of evaluation results for Direct Install Fixtures specifically, this is made consistent with the Direct Install CFL measure which is based upon review of the PY2 and PY3 ComEd Direct Install program surveys.
IL TRM v6.0 Vol. 3_January 25th, 2017_DRAFT Page 232 of 296
Illinois Statewide Technical Reference Manual – 5.6.5 High Efficiency Pool Pumps
deemed appropriate783) of the Utility Jurisdiction.
KITS programs = Determined through evaluation
Upstream (TOS) Lighting programs = Determined through evaluation
or use deemed assumptions below784:
ComEd: 1.05%
Ameren: 6.55%
All other programs = 0
Hours = Average hours of use per year
=2475 (6.78 hrs per day)785
DEFERRED INSTALLS
As presented above, the characterization assumes that a percentage of bulbs purchased are not installed until Year 2 and Year 3 (see ISR assumption above). The Illinois Technical Advisory Committee has determined the following methodology for calculating the savings of these future installs.
Year 1 (Purchase Year) installs: Characterized using assumptions provided above or evaluated assumptions if available.
Year 2 and 3 installs: Characterized using delta watts assumption and hours of use from the Install Year i.e. the actual deemed (or evaluated if available) assumptions active in Year 2 and 3 should be applied.
The NTG factor for the Purchase Year should be applied.
SUMMER COINCIDENT PEAK DEMAND SAVINGS
ΔkW = ((WattsBase - WattsEE) / 1 000) * ISR * CF
783 Leakage in is only appropriate to credit to IL utility program savings if it is reasonably expected that the IL utility program marketing efforts played an important role in influencing customer to purchase the light bulbs. Furthermore, consideration that such customers might be free riders should be addressed. If leakage in is assessed, efforts should be made to ensure no double counting of savings occurs if the evaluation is estimating both leakage in and spillover savings of light bulbs.784 Leakage rate is based upon TAC agreed 50% of the lamp leakage assumptions (based upon review of PY6-8 evaluations from ComEd and PY5,6 and 8 for Ameren (see ‘IL Leakage Rates_112016.xls’ for more information)).785 Based on lighting logger study conducted as part of the PY5/6 ComEd Residential Lighting Program evaluation.
IL TRM v6.0 Vol. 3_January 25th, 2017_DRAFT Page 233 of 296
For example, for a 2 x 14W pin based CFL fixture (43W EISA qualified incandescent/halogen).
ΔkWH1st year installs = ((86 - 28) / 1000) * 0.875 * 2475
= 125.6 kWh
ΔkWH2nd year installs = ((86 - 28) / 1000) * 0.057 * 2475
= 8.2 kWh
Note: Here we assume no change in hours assumption. NTG value from Purchase year applied.
ΔkWH3rd year installs = ((86 - 28) / 1000) * 0.048 * 2475
= 6.9 kWh
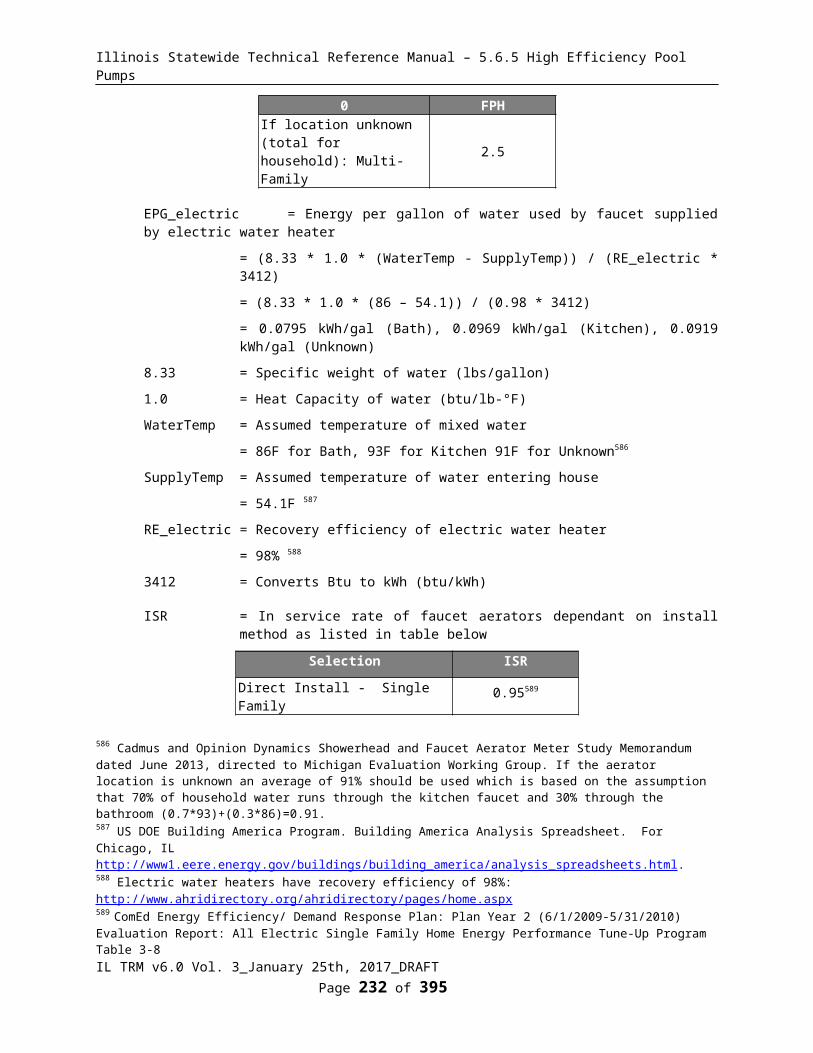
Illinois Statewide Technical Reference Manual – 5.6.5 High Efficiency Pool Pumps
Where:
CF = Summer Peak Coincidence Factor for measure.
= 27.3%786
Other factors as defined above
NATURAL GAS SAVINGS
N/A
WATER IMPACT DESCRIPTIONS AND CALCULATION
N/A
DEEMED O&M COST ADJUSTMENT CALCULATION
Life of the baseline bulb is assumed to be 0.4 years787 for exterior applications. Baseline bulb cost replacement is assumed to be $1.25.788
It is important to note that for cost-effectiveness screening purposes, the O&M cost adjustments should only be applied in cases where the light bulbs area actually in service and so should be multiplied by the appropriate ISR.
MEASURE CODE: RS-LRG-EFOX-V06-180101
REVIEW DEADLINE: 1/1/2020
786 Based on lighting logger study conducted as part of the PY5/6 ComEd Residential Lighting Program evaluation.787 Calculated by dividing assumed rated life of baseline bulb by hours of use. Assumed lifetime of EISA qualified Halogen/ Incandescents is 1000 hours. The manufacturers are simply using a regular incandescent lamp with halogen fill gas rather than Halogen Infrared to meet the standard (as provided by G. Arnold, NEEP and confirmed by N. Horowitz at NRDC).788 Based upon field data collected by CLEAResult and provided by ComEd. See ComEd Pricing Projections 06302016.xlsx for analysis.
IL TRM v6.0 Vol. 3_January 25th, 2017_DRAFT Page 234 of 296
For example, a 2 x 14W pin-based CFL fixture:
ΔkW1st year = ((86 - 28) / 1000) * 0.875 * 0.273
= 0.0142 kW
Second and third year install savings should be calculated using the appropriate ISR and the delta watts and hours from the install year.
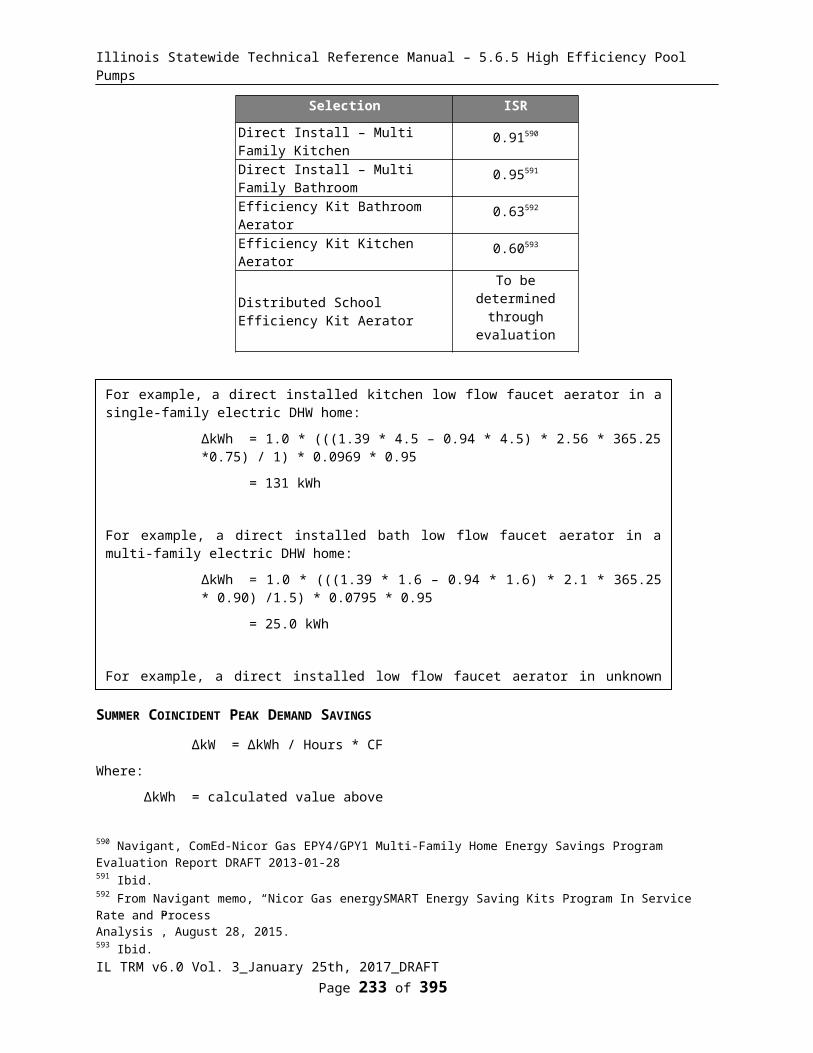
Illinois Statewide Technical Reference Manual – 5.6.5 High Efficiency Pool Pumps
5.5.5 Interior Hardwired Compact Fluorescent Lamp (CFL) Fixture
DESCRIPTION
An ENERGY STAR lighting fixture wired for exclusive use with pin-based compact fluorescent lamps is installed in an interior residential setting. This measure could relate to either a fixture replacement or new installation (i.e. time of sale).
Federal legislation stemming from the Energy Independence and Security Act of 2007 required all general-purpose light bulbs between 40 and 100W to be approximately 30% more energy efficient than current incandescent bulbs. Production of 100W, standard efficacy incandescent lamps ends in 2012, followed by restrictions on 75W in 2013 and 60W and 40W in 2014. The baseline for this measure has therefore become bulbs (improved incandescent or halogen) that meet the new standard.
A provision in the EISA regulations requires that by January 1, 2020, all lamps meet efficiency criteria of at least 45 lumens per watt, in essence making the baseline equivalent to a current day CFL. Therefore the measure life (number of years that savings should be claimed) should be reduced once the assumed lifetime of the bulb exceeds 2020. Due to expected delay in clearing retail inventory and to account for the operating life of a halogen incandescent potentially spanning over 2020, this shift is assumed not to occur until 2021.
This measure was developed to be applicable to the following program types: TOS, NC. If applied to other program types, the measure savings should be verified.
DEFINITION OF EFFICIENT EQUIPMENT
The efficient condition is an ENERGY STAR lighting interior fixture for pin-based compact fluorescent lamps.
DEFINITION OF BASELINE EQUIPMENT
The baseline condition is a standard EISA qualified incandescent or halogen interior fixture as provided in the table provided in the Electric Energy Savings section.
DEEMED LIFETIME OF EFFICIENT EQUIPMENT
The expected life of an interior fixture is 20 years789. However due to the backstop provision in the Energy Independence and Security Act of 2007 that requires by January 1, 2020, all lamps meet efficiency criteria of at least 45 lumens per watt, the baseline replacement would become equivalent to a CFL in that year. The expected measure life for CFL fixtures installed in 2018 is therefore assumed to be 3 years. For bulbs installed in 2019, this would be reduced to 2 years and should be reduced each year790.
DEEMED MEASURE COST
The incremental cost for an interior fixture is assumed to be $32791.
LOADSHAPE
Loadshape R06 - Residential Indoor Lighting
789 Measure Life Report, Residential and Commercial/Industrial Lighting and HVAC Measures, GDS Associates, June 2007 (http://www.ctsavesenergy.org/files/Measure%20Life%20Report%202007.pdf ) gives 20 years for an interior fluorescent fixture.790 Due to expected delay in clearing stock from retail outlets and to account for the operating life of a halogen incandescent potentially spanning over 2020, this shift is assumed not to occur until 2021.791 ENERGY STAR Qualified Lighting Savings Calculator default incremental cost input for interior fixture (http://www.energystar.gov/buildings/sites/default/uploads/files/light_fixture_ceiling_fan_calculator.xlsx?4349-303e=&b6b3-3efd&b6b3-3efd)
IL TRM v6.0 Vol. 3_January 25th, 2017_DRAFT Page 235 of 296
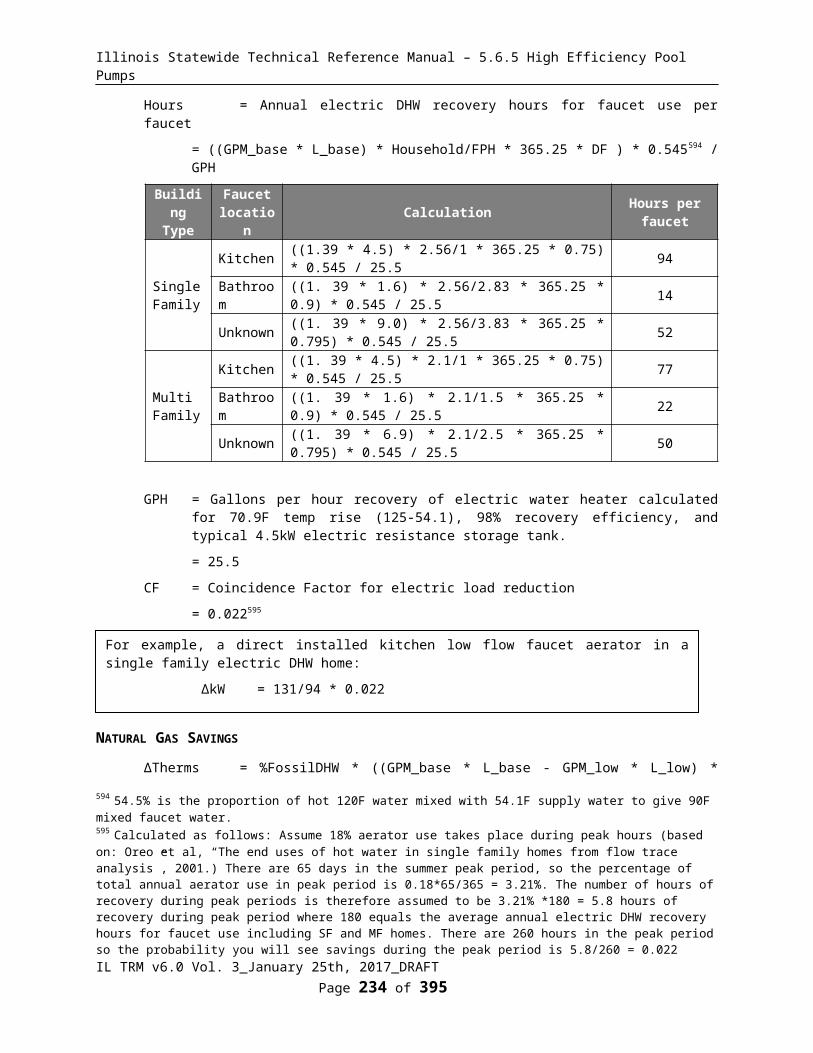
Illinois Statewide Technical Reference Manual – 5.6.5 High Efficiency Pool Pumps
COINCIDENCE FACTOR
The summer peak coincidence factor is assumed to be 7.1%792 for Residential and in-unit Multi Family bulbs.
Algorithm
CALCULATION OF SAVINGS
ELECTRIC ENERGY SAVINGS
ΔkWh = ((WattsBase - WattsEE) / 1000) * ISR * (1-Leakage) * Hours * WHFe
Where:
WattsBase = Based on lumens of CFL bulb and program year purchased:
Minimum Lumens Maximum Lumens
Incandescent Equivalent
Post-EISA 2007(WattsBase)
5280 6209 3003000 5279 2002601 2999 1501490 2600 721050 1489 53750 1049 43310 749 29250 309 25
WattsEE = Actual wattage of CFL purchased
ISR = In Service Rate or the percentage of units rebated that get installed.
Program
Weighted Average 1st
year In Service Rate
(ISR)
2nd year Installations
3rd year Installations
Final Lifetime In
Service Rate
Retail (Time of Sale) 87.5%793 5.7% 4.8% 98.0%794
Direct Install 96.9795
792 Based on lighting logger study conducted as part of the PY5/6 ComEd Residential Lighting Program evaluation.793 1st year in service rate is based upon review of PY2-3 evaluations from ComEd (see ‘IL RES Lighting ISR.xls’ for more information. The average first year ISR was calculated weighted by the number of bulbs in the each year’s survey. 794 The 98% Lifetime ISR assumption is consistent with the assumption for standard CFLs (in the absence of evidence that it should be different for this bulb type) based upon review of two evaluations:‘Nexus Market Research, RLW Analytics and GDS Associates study; “New England Residential Lighting Markdown Impact Evaluation, January 20, 2009’ and ‘KEMA Inc, Feb 2010, Final Evaluation Report:, Upstream Lighting Program, Volume 1.’ This implies that only 2% of bulbs purchased are never installed. The second and third year installations are based upon Ameren analysis of the Californian KEMA study showing that 54% of future installs occur in year 2 and 46% in year 3. The 2nd and 3rd year installations should be counted as part of those future program year savings. 795 In the absence of evaluation results for Direct Install Fixtures specifically, this is made consistent with the Direct Install CFL measure which is based upon review of the PY2 and PY3 ComEd Direct Install program surveys.
IL TRM v6.0 Vol. 3_January 25th, 2017_DRAFT Page 236 of 296

Illinois Statewide Technical Reference Manual – 5.6.5 High Efficiency Pool Pumps
Leakage = Adjustment to account for the percentage of program bulbs that move out (and in if deemed appropriate796) of the Utility Jurisdiction.
KITS programs = Determined through evaluation
Upstream (TOS) Lighting programs = Determined through evaluation
or use deemed assumptions below797:
ComEd: 1.05%
Ameren: 6.55%
All other programs = 0
Hours = Average hours of use per year
Installation Location HoursResidential and in-unit Multi Family 759 798
WHFe = Waste heat factor for energy to account for cooling energy savings from efficient lighting
Bulb Location WHFeInterior single family or unknown location 1.06 799
Multi family in unit 1.04 800
DEFERRED INSTALLS
As presented above, the characterization assumes that a percentage of bulbs purchased are not installed until Year 2 and Year 3 (see ISR assumption above). The Illinois Technical Advisory Committee has determined the following methodology for calculating the savings of these future installs.
Year 1 (Purchase Year) installs: Characterized using assumptions provided above or evaluated assumptions if available.
Year 2 and 3 installs: Characterized using delta watts assumption and hours of use from the Install Year i.e. the actual deemed (or evaluated if available) assumptions active in Year 2 and 3 should be applied.
The NTG factor for the Purchase Year should be applied.
796 Leakage in is only appropriate to credit to IL utility program savings if it is reasonably expected that the IL utility program marketing efforts played an important role in influencing customer to purchase the light bulbs. Furthermore, consideration that such customers might be free riders should be addressed. If leakage in is assessed, efforts should be made to ensure no double counting of savings occurs if the evaluation is estimating both leakage in and spillover savings of light bulbs.797 Leakage rate is based upon TAC agreed 50% of the lamp leakage assumptions (based upon review of PY6-8 evaluations from ComEd and PY5,6 and 8 for Ameren (see ‘IL Leakage Rates_112016.xls’ for more information)).798 Based on lighting logger study conducted as part of the PY5/6 ComEd Residential Lighting Program evaluation.799 The value is estimated at 1.06 (calculated as 1 + (0.66*(0.27 / 2.8)). Based on cooling loads decreasing by 27% of the lighting savings (average result from REMRate modeling of several different configurations and IL locations of homes), assuming typical cooling system operating efficiency of 2.8 COP (starting from standard assumption of SEER 10.5 central AC unit, converted to 9.5 EER using algorithm (-0.02 * SEER2) + (1.12 * SEER) (from Wassmer, M. (2003). A Component-Based Model for Residential Air Conditioner and Heat Pump Energy Calculations. Masters Thesis, University of Colorado at Boulder), converted to COP = EER/3.412 = 2.8COP) and 66% of homes in Illinois having central cooling ("Table HC7.9 Air Conditioning in Homes in Midwest Region, Divisions, and States, 2009 from Energy Information Administration", 2009 Residential Energy Consumption Survey)800 As above but using estimate of 45% of multi family buildings in Illinois having central cooling (based on data from “Table HC7.1 Air Conditioning in U.S. Homes, By Housing Unit Type, 2009” which is for the whole of the US, scaled to IL air conditioning prevalence compared to US average)
IL TRM v6.0 Vol. 3_January 25th, 2017_DRAFT Page 237 of 296

Illinois Statewide Technical Reference Manual – 5.6.5 High Efficiency Pool Pumps
HEATING PENALTY
If electric heated building:
∆kWh801 = - (((WattsBase - WattsEE) / 1000) * ISR * Hours * HF) / ηHeat
Where:
HF = Heating Factor or percentage of light savings that must be heated
= 49%802 for interior or unknown location
= 0% for unheated location
ηHeat = Efficiency in COP of Heating equipment
= actual. If not available use803:
System Type Age of Equipment HSPF Estimate
COPHEAT
(COP Estimate)= (HSPF/3.413)*0.85
Heat PumpBefore 2006 6.8 1.7After 2006 - 2014 7.7 1.922015 on 8.2 2.04
Resistance N/A N/A 1.00Unknown804 N/A N/A 1.28
801 Negative value because this is an increase in heating consumption due to the efficient lighting.802 This means that heating loads increase by 49% of the lighting savings. This is based on the average result from REMRate modeling of several different configurations and IL locations of homes.803 These default system efficiencies are based on the applicable minimum Federal Standards. In 2006 the Federal Standard for Heat Pumps was adjusted. While one would expect the average system efficiency to be higher than this minimum, the likely degradation of efficiencies over time mean that using the minimum standard is appropriate. Note efficiency should include duct losses. Defaults provided assume 15% duct loss for heat pumps.804 Calculation assumes 35% Heat Pump and 65% Resistance, which is based upon data from Energy Information Administration, 2009 Residential Energy Consumption Survey, see “HC6.9 Space Heating in Midwest Region.xls”, using average for East North Central Region. Average efficiency of heat pump is based on assumption that 50% are units from before 2006 and 50% from 2006-2014. Program or evaluation data should be used to improve this assumption if available.
IL TRM v6.0 Vol. 3_January 25th, 2017_DRAFT Page 238 of 296
For example, for a 2 x 14W pin based CFL fixture (43W EISA qualified incandescent/halogen):
ΔkWH1st year installs = ((86 - 28) / 1000) * 0.875 * 759 * 1.06
= 40.8 kWh
ΔkWH2nd year installs = ((86 - 28) / 1000) * 0.057 * 759 * 1.06
= 2.7 kWh
Note: Here we assume no change in hours assumption. NTG value from Purchase year applied.
ΔkWH3rd year installs = ((86 - 28) / 1000) * 0.048 * 759 * 1.06
= 2.2 kWh
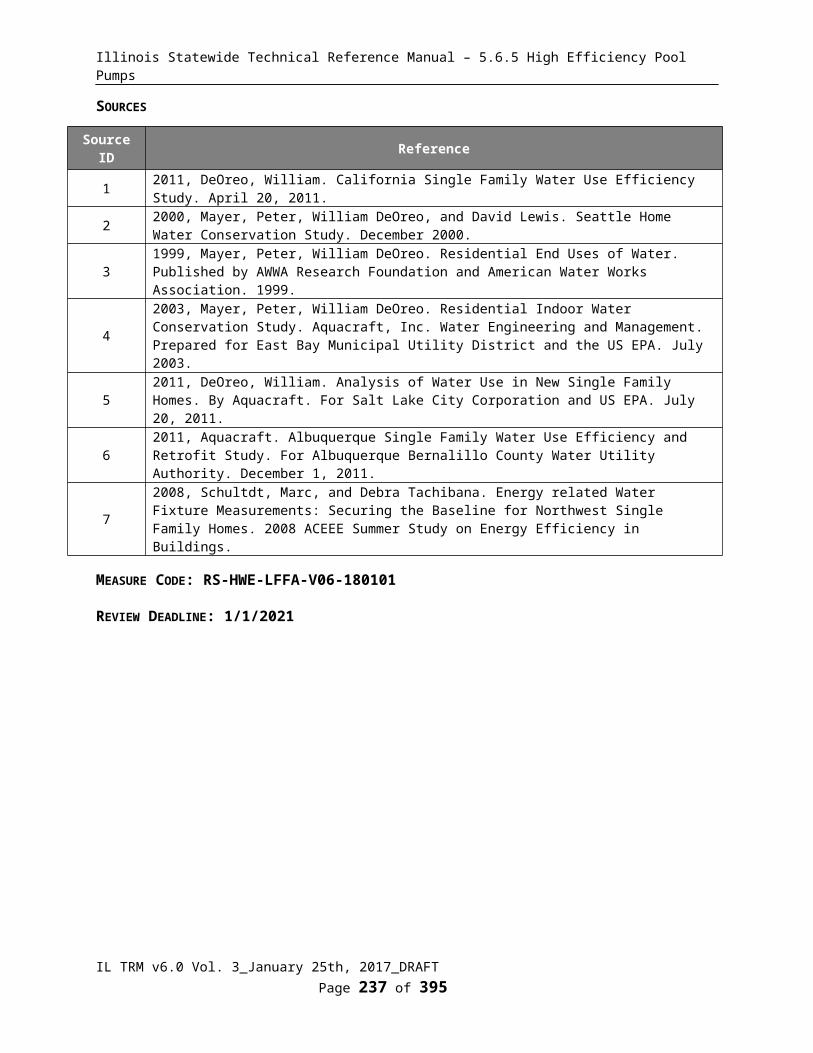
Illinois Statewide Technical Reference Manual – 5.6.5 High Efficiency Pool Pumps
SUMMER COINCIDENT PEAK DEMAND SAVINGS
ΔkW = ((WattsBase - WattsEE) / 1 000) * ISR * WHFd * CF
Where:
WHFd = Waste heat factor for demand to account for cooling savings from efficient lighting.
Bulb Location WHFdInterior single family or unknown location 1.11805
Multi family in unit 1.07806
Exterior or uncooled location 1.0
CF = Summer Peak Coincidence Factor for measure.
Bulb Location CF807
Interior single family or unknown location 7.1% Multi family in unit 7.1%
Other factors as defined above
NATURAL GAS SAVINGS
ΔTherms808 = - (((WattsBase - WattsEE) / 1000) * ISR * Hours * HF * 0.03412) / ηHeat
Where:
HF = Heating Factor or percentage of light savings that must be heated
= 49%809 for interior or unknown location805 The value is estimated at 1.11 (calculated as 1 + (0.66 * 0.466 / 2.8)). See footnote relating to WHFe for details. Note the 46.6% factor represents the average Residential cooling coincidence factor calculated by dividing average load during the peak hours divided by the maximum cooling load. 806 As above but using estimate of 45% of multi family buildings in Illinois having central cooling (based on data from “Table HC7.1 Air Conditioning in U.S. Homes, By Housing Unit Type, 2009” which is for the whole of the US, scaled to IL air conditioning prevalence compared to US average) 807 Based on lighting logger study conducted as part of the PY5/6 ComEd Residential Lighting Program evaluation.808 Negative value because this is an increase in heating consumption due to the efficient lighting.809 This means that heating loads increase by 49% of the lighting savings. This is based on the average result from REMRate
IL TRM v6.0 Vol. 3_January 25th, 2017_DRAFT Page 239 of 296
For example, a 2 x 14W pin-based CFL fixture is purchased and installed in home with 2.0 COP (including duct loss) Heat Pump:
∆kWh1st year = - (((86 – 28) / 1000) * 0.875 * 759 * 0.49) / 2.0
= - 9.4 kWh
Second and third year install savings should be calculated using the appropriate ISR and the delta watts and hours from the install year.
For example, a 14W pin-based CFL fixture:
∆kW1st year = ((86- 28) / 1000) * 0.875 * 1.11 * 0.071
= 0.004 kW
Second and third year install savings should be calculated using the appropriate ISR and the delta watts and hours from the install year.

Illinois Statewide Technical Reference Manual – 5.6.5 High Efficiency Pool Pumps
= 0% for unheated location
0.03412 =Converts kWh to Therms
ηHeat = Efficiency of heating system
=70%810
WATER IMPACT DESCRIPTIONS AND CALCULATION
N/A
DEEMED O&M COST ADJUSTMENT CALCULATION
Life of the baseline bulb is assumed to be 1.3 years811 for interior applications. Baseline bulb cost replacement is assumed to be $1.25.812
It is important to note that for cost-effectiveness screening purposes, the O&M cost adjustments should only be applied in cases where the light bulbs area actually in service and so should be multiplied by the appropriate ISR.
MEASURE CODE: RS-LTG-IFIX-V06-180101
REVIEW DEADLINE: 1/1/2020
modeling of several different configurations and IL locations of homes.810 This has been estimated assuming that natural gas central furnace heating is typical for Illinois residences (66% of Illinois homes have a Natural Gas Furnace (based on Energy Information Administration, 2009 Residential Energy Consumption Survey) In 2000, 24% of furnaces purchased in Illinois were condensing (based on data from GAMA, provided to Department of Energy during the federal standard setting process for residential heating equipment - see Furnace Penetration.xls). Furnaces tend to last up to 20 years and so units purchased 10 years ago provide a reasonable proxy for the current mix of furnaces in the State. Assuming typical efficiencies for condensing and non-condensing furnaces and duct losses, the average heating system efficiency is estimated as follows: (0.24*0.92) + (0.76*0.8) * (1-0.15) = 0.70811 Calculated by dividing assumed rated life of baseline bulb by hours of use. Assumed lifetime of EISA qualified Halogen/ Incandescents is 1000 hours. The manufacturers are simply using a regular incandescent lamp with halogen fill gas rather than Halogen Infrared to meet the standard (as provided by G. Arnold, NEEP and confirmed by N. Horowitz at NRDC).812 Based upon field data collected by CLEAResult and provided by ComEd. See ComEd Pricing Projections 06302016.xlsx for analysis.
IL TRM v6.0 Vol. 3_January 25th, 2017_DRAFT Page 240 of 296
For example, a 2 x 14W pin-based CFL fixture is purchased and installed in home with gas heat at 70% efficiency:
ΔTherms1st year = -((86 - 28) / 1000) * 0.875 * 759 * 0.49 * 0.03412) / 0.7
= - 0.9 Therms
Second and third year install savings should be calculated using the appropriate ISR and the delta watts and hours from the install year.

Illinois Statewide Technical Reference Manual – 5.6.5 High Efficiency Pool Pumps
5.5.6 LED Specialty Lamps
DESCRIPTION
This measure describes savings from a variety of specialty LED lamp types (including globe, decorative and downlights). This characterization assumes that the LED lamp or fixture is installed in a residential location. Where the implementation strategy does not allow for the installation location to be known (e.g. an upstream retail program) a deemed split of 95% Residential and 5% Commercial assumptions should be used813.
This measure was developed to be applicable to the following program types: TOS, NC.
If applied to other program types, the measure savings should be verified.
DEFINITION OF EFFICIENT EQUIPMENT
To qualify for this measure the installed equipment must be an ENERGY STAR LED lamp or fixture. Note a new ENERGY STAR specification v2.0 becomes effective on 1/2/2017 (https://www.energystar.gov/products/spec/lamps_specification_version_2_0_pd).
DEFINITION OF BASELINE EQUIPMENT
The baseline condition is assumed to be an incandescent/halogen lamp for all lamp types.
The baseline for the early replacement measure is the existing bulb being replaced.
DEEMED LIFETIME OF EFFICIENT EQUIPMENT
While LED rated lives are often 15,000 – 50,000 hours, all installations are assumed to be 10 years 814 except for recessed downlight and track lights at 15 years815
For early replacement measures, if replacing a halogen or incandescent bulb, the remaining life is assumed to be 333 hours. For CFL’s, the remaining life is 3,333 hours816.
DEEMED MEASURE COST
The price of LED lamps is falling quickly. Where possible, the actual cost should be used and compared to the baseline cost provided below. If the incremental cost is unknown, assume the following817:
Bulb Type Year Incandescent LED Incremental Cost
Recessed Downlight Luminaires All $4.00 $94.00 $90.00Track Lights All $4.00 $60.00 $56.00
Directional 2017 $3.53 $6.24 $2.712018-2019 $5.18 $1.65
Decorative and Globe 2017 $1.60 $3.50 $1.902018-2019 $1.74 $3.40 $1.66
813 RES v C&I split is based on a weighted (by sales volume) average of ComEd PY6, PY7 and PY8 and Ameren PY5, PY6 and PY8 in store intercept survey results. See ‘RESvCI Split_112016.xls’.814 Based on recommendation in the Dunsky Energy Consulting, Livingston Energy Innovations and Opinion Dynamics Corporation; NEEP Emerging Technology Research Report, p 6-18.815 Limited by persistence. NEEP EMV Emerging Technologies Research Report (December 2011)816 Representing a third of the expected lamp lifetime.817 Baseline and LED lamp costs for both directional and decorative and globe are based on field data collected by CLEAResult and provided by ComEd. See ComEd Pricing Projections 06302016.xlsx for analysis. Recessed downlight and track light costs are based on VEIC review of a year’s worth of LED sales data through VEIC implemented programs and the retail cost averaged (see 2015 LED Sales Review.xls) and of price reports provided to Efficiency Vermont by a number of manufacturers and retailers. Baseline cost based on “2010-2012 WA017 Ex Ante Measure Cost Study Draft Report”, Itron, February 28, 2014.
IL TRM v6.0 Vol. 3_January 25th, 2017_DRAFT Page 241 of 296

Illinois Statewide Technical Reference Manual – 5.6.5 High Efficiency Pool Pumps
LOADSHAPE
Loadshape R06 - Residential Indoor Lighting
Loadshape R07 - Residential Outdoor Lighting
COINCIDENCE FACTOR
Unlike standard lamps that could be installed in any room, certain types of specialty lamps are more likely to be found in specific rooms, which affects the coincident peak factor. Coincidence factors by bulb types are presented below818
Bulb Type Peak CFThree-way 0.078819
Dimmable 0.078820
Interior reflector (incl. dimmable) 0.091Exterior reflector 0.273Unknown reflector 0.094Candelabra base and candle medium and intermediate base 0.121Bug light 0.273Post light (>100W) 0.273Daylight 0.081Plant light 0.081Globe 0.075Vibration or shatterproof 0.081Standard Spiral >=2601 lumens, Residential, Multi-family in unit 0.071Standard spirals >= 2601 lumens, unknown 0.081Standard spirals >= 2601 lumens, exterior 0.273Specialty - Generic 0.081
Algorithm
CALCULATION OF SAVINGS
ELECTRIC ENERGY SAVINGS
∆kWh = ((WattsBase - WattsEE) / 1000) * ISR * (1-Leakage) * Hours * WHFe
Where:
Wattsbase = Input wattage of the existing or baseline system. Reference the table below for default values.
EISA exempt bulb types:
Bulb Type Lower Lumen Range
Upper Lumen Range WattsBase
Standard Spirals >=2601 2601 2999 1503000 5279 200
818 Based on lighting logger study conducted as part of the PY5/6 ComEd Residential Lighting Program evaluation.819 Based on average of bedroom, dining room, office and living room results from the lighting logger study conducted as part of the PY5/6 ComEd Residential Lighting Program evaluation.820 Ibid
IL TRM v6.0 Vol. 3_January 25th, 2017_DRAFT Page 242 of 296

Illinois Statewide Technical Reference Manual – 5.6.5 High Efficiency Pool Pumps
Bulb Type Lower Lumen Range
Upper Lumen Range WattsBase
5280 6209 300
3-Way
250 449 25450 799 40800 1099 60
1100 1599 751600 1999 1002000 2549 1252550 2999 150
Globe(medium and intermediate bases less
than 750 lumens)
90 179 10180 249 15250 349 25350 749 40
Decorative(Shapes B, BA, C, CA, DC, F, G, medium and intermediate bases less than 750
lumens)
70 89 1090 149 15
150 299 25300 749 40
Globe(candelabra bases less than 1050
lumens)
90 179 10180 249 15250 349 25350 499 40500 1049 60
Decorative(Shapes B, BA, C, CA, DC, F, G,
candelabra bases less than 1050 lumens)
70 89 1090 149 15
150 299 25300 499 40500 1049 60
Directional Lamps -
For Directional R, BR, and ER lamp types821:
Bulb TypeLower Lumen Range
Upper Lumen Range
WattsBase
R, ER, BR with medium screw
bases w/ diameter >2.25" (*see exceptions
below)
420 472 40473 524 45525 714 50715 937 65938 1259 75
1260 1399 901400 1739 1001740 2174 1202175 2624 1502625 2999 1753000 4500 200
*R, BR, and ER with medium
screw bases w/
400 449 40450 499 45500 649 50
821 From pg 11 of the Energy Star Specification for lamps v1.1
IL TRM v6.0 Vol. 3_January 25th, 2017_DRAFT Page 243 of 296

Illinois Statewide Technical Reference Manual – 5.6.5 High Efficiency Pool Pumps
Bulb TypeLower Lumen Range
Upper Lumen Range
WattsBase
diameter 650 1199 65
*ER30, BR30, BR40, or ER40
400 449 40450 499 45500 649 50
*BR30, BR40, or ER40 650 1419 65
*R20 400 449 40450 719 45
*All reflector lamps below lumen ranges
specified above
200 299 20
300 399399 30
Directional lamps are exempt from EISA regulations.
For PAR, MR, and MRX Lamps Types:
For these highly focused directional lamp types, it is necessary to have Center Beam Candle Power (CBCP) and beam angle measurements to accurately estimate the equivalent baseline wattage. The formula below is based on the Energy Star Center Beam Candle Power tool.822 If CBCP and beam angle information are not available or if the equation below returns a negative value (or undefined), use the manufacturer’s recommended baseline wattage equivalent.823
Wattsbase=¿
375.1−4.355 (D )−√227,800−937.9 (D )−0.9903 (D2 )−1479 (BA )−12.02 (D∗BA )+14.69 (BA2 )−16,720∗ln (CBCP)
Where:
D = Bulb diameter (e.g. for PAR20 D = 20)
BA = Beam angle
CBCP = Center beam candle power
The result of the equation above should be rounded DOWN to the nearest wattage established by Energy Star:
Diameter Permitted Wattages16 20, 35, 40, 45, 50, 60, 7520 50
30S 40, 45, 50, 60, 7530L 50, 7538 40, 45, 50, 55, 60, 65, 75, 85, 90, 100, 120, 150, 250
EISA non-exempt bulb types:
399
822 http://energystar.supportportal.com/link/portal/23002/23018/Article/32655/823 The Energy Star Center Beam Candle Power tool does not accurately model baseline wattages for lamps with certain bulb characteristic combinations – specifically for lamps with very high CBCP.
IL TRM v6.0 Vol. 3_January 25th, 2017_DRAFT Page 244 of 296
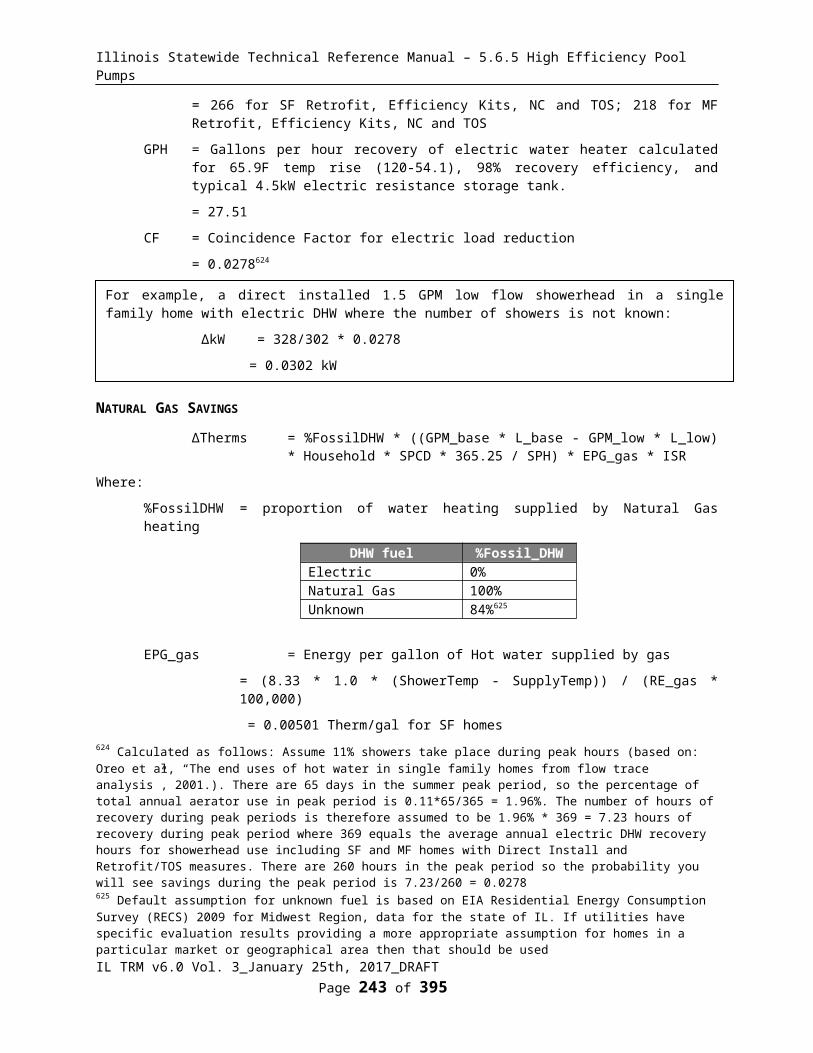
Illinois Statewide Technical Reference Manual – 5.6.5 High Efficiency Pool Pumps
Bulb TypeLower Lumen Range
Upper Lumen Range
Incandescent Equivalent
Post-EISA 2007(WattsBase)
Dimmable Twist, Globe (less than 5" in diameter and > 749 lumens), candle
(shapes B, BA, CA > 749 lumens), Candelabra Base Lamps (>1049 lumens), Intermediate Base Lamps (>749 lumens)
310 749 29750 1049 43
1050 1489 53
1490 2600 72
WattsEE = Actual wattage of LED purchased / installed.
ISR = In Service Rate or the percentage of units rebated that get installed
Program Bulb Type
Weighted Average 1st year In Service Rate
(ISR)
2nd year Installations
3rd year Installations
Final Lifetime In
Service Rate
Retail (Time of Sale)
Recessed downlight luminaries and Track Lights 100%824
All other lamps 93.5%825 2.4% 2.1% 98.0%826
Direct Install All lamps 96.9%827
Leakage = Adjustment to account for the percentage of program bulbs that move out (and in if deemed appropriate828) of the Utility Jurisdiction.
KITS programs = Determined through evaluation
Upstream (TOS) Lighting programs = Determined through evaluation
or use deemed assumptions below829:
ComEd: 2.1%
Ameren: 13.1%
824 NEEP EMV Emerging Technologies Research Report (December 2011)825 1st year in service rate is based upon analysis of ComEd PY7 and PY8 intercept data (see ‘IL RES Lighting ISR_112016.xls’ for more information).826 The 98% Lifetime ISR assumption is based upon the standard CFL measure in the absence of any better reference. This value is based upon review of two evaluations:‘Nexus Market Research, RLW Analytics and GDS Associates study; “New England Residential Lighting Markdown Impact Evaluation, January 20, 2009’ and ‘KEMA Inc, Feb 2010, Final Evaluation Report:, Upstream Lighting Program, Volume 1.’ This implies that only 2% of bulbs purchased are never installed. The second and third year installations are based upon Ameren analysis of the Californian KEMA study showing that 54% of future installs occur in year 2 and 46% in year 3. The 2nd and 3rd year installations should be counted as part of those future program year savings. 827 Consistent with assumption for standard CFLs (in the absence of evidence that it should be different for this bulb type). Based upon review of the PY2 and PY3 ComEd Direct Install program surveys. This value includes bulb failures in the 1st year to be consistent with the Commission approval of annualization of savings for first year savings claims. ComEd PY2 All Electric Single Family Home Energy Performance Tune-Up Program Evaluation, Navigant Consulting, December 21, 2010. 828 Leakage in is only appropriate to credit to IL utility program savings if it is reasonably expected that the IL utility program marketing efforts played an important role in influencing customer to purchase the light bulbs. Furthermore, consideration that such customers might be free riders should be addressed. If leakage in is assessed, efforts should be made to ensure no double counting of savings occurs if the evaluation is estimating both leakage in and spillover savings of light bulbs.829 Leakage rate is based upon review of PY6-8 evaluations from ComEd and PY5,6 and 8 for Ameren (see ‘IL Leakage Rates_112016.xls’ for more information).
IL TRM v6.0 Vol. 3_January 25th, 2017_DRAFT Page 245 of 296

Illinois Statewide Technical Reference Manual – 5.6.5 High Efficiency Pool Pumps
All other programs = 0
Hours = Average hours of use per year 830
Bulb Type Annual hours of use (HOU)
Three-way 850Dimmable 850Interior reflector (incl. dimmable) 861Exterior reflector 2475Unknown reflector 891Candelabra base and candle medium and intermediate base 1190
Bug light 2475Post light (>100W) 2475Daylight 847Plant light 847Globe 639Vibration or shatterproof 847Standard Spiral >2601 lumens, Residential, Multi Family in-unit 759
Standard Spiral >2601 lumens, unknown 847Standard Spiral >2601 lumens, Exterior 2475Specialty – Generic Interior 847Specialty – Generic Exterior 2475
WHFe = Waste heat factor for energy to account for cooling savings from efficient lighting
Bulb Location WHFeInterior single family or unknown location 1.06 831
Multi family in unit 1.04 832
Exterior or uncooled location 1.0
For example, a 13W PAR20 LED is installed in place of a 750 lumen PAR20 incandescent screw-in lamp with medium screw base, diameter >2.5", installed in single family interior location:
ΔkWh = ((45 - 13) / 1000) * 0.935 * 861 * 1.06
= 27.3 kWh
830 Hours of use by specialty bulb type calculated using the average hours of use in locations or rooms where each type of specialty bulb is most commonly found. Values for Reflector, Decorative and Globe are taken directly from the lighting logger study conducted as part of the PY5/6 ComEd Residential Lighting Program evaluation. All other hours have been updated based on the room specific hours of use from the PY5/PY6 logger study. 831 The value is estimated at 1.06 (calculated as 1 + (0.66*(0.27 / 2.8)). Based on cooling loads decreasing by 27% of the lighting savings (average result from REMRate modeling of several different configurations and IL locations of homes), assuming typical cooling system operating efficiency of 2.8 COP (starting from standard assumption of SEER 10.5 central AC unit, converted to 9.5 EER using algorithm (-0.02 * SEER2) + (1.12 * SEER) (from Wassmer, M. (2003). A Component-Based Model for Residential Air Conditioner and Heat Pump Energy Calculations. Masters Thesis, University of Colorado at Boulder), converted to COP = EER/3.412 = 2.8COP) and 66% of homes in Illinois having central cooling ("Table HC7.9 Air Conditioning in Homes in Midwest Region, Divisions, and States, 2009 from Energy Information Administration", 2009 Residential Energy Consumption Survey)832 As above but using estimate of 45% of multi family buildings in Illinois having central cooling (based on data from “Table HC7.1 Air Conditioning in U.S. Homes, By Housing Unit Type, 2009” which is for the whole of the US, scaled to IL air conditioning prevalence compared to US average)
IL TRM v6.0 Vol. 3_January 25th, 2017_DRAFT Page 246 of 296

Illinois Statewide Technical Reference Manual – 5.6.5 High Efficiency Pool Pumps
Mid Life Baseline Adjustment
For non-exempt lamps, an appropriate baseline adjustment should be included to account for the 2020 EISA backstop provision making replacement baseline lamps meet 45 lumens/watt. Due to expected delay in clearing retail inventory and to account for the operating life of a halogen incandescent potentially spanning over 2020, this shift is assumed not to occur until 2021.
Note for early replacement measures an additional baseline shift accounting for the replacement of the existing unit with a new baseline lamp should be accounted for.
HEATING PENALTY
If electric heated home (if heating fuel is unknown assume gas, see Natural Gas section):
∆kWh833 = - (((WattsBase - WattsEE) / 1000) * ISR * Hours * HF) / ηHeat
Where:
HF = Heating Factor or percentage of light savings that must be heated
= 49%834 for interior or unknown location
= 0% for exterior location
ηHeat = Efficiency in COP of Heating equipment
= Actual. If not available use: 835:
System Type Age of Equipment HSPF Estimate
COPHEAT
(COP Estimate)= (HSPF/3.413)*0.85
Heat PumpBefore 2006 6.8 1.7After 2006 - 2014 7.7 1.922015 on 8.2 2.04
Resistance N/A N/A 1.00Unknown836 N/A N/A 1.28
SUMMER COINCIDENT PEAK DEMAND SAVINGS
∆kW = ((WattsBase - WattsEE) / 1000) * ISR * WHFd * CF
833 Negative value because this is an increase in heating consumption due to the efficient lighting.834 This means that heating loads increase by 49% of the lighting savings. This is based on the average result from REMRate modeling of several different configurations and IL locations of homes.835 These default system efficiencies are based on the applicable minimum Federal Standards. In 2006 the Federal Standard for Heat Pumps was adjusted. While one would expect the average system efficiency to be higher than this minimum, the likely degradation of efficiencies over time mean that using the minimum standard is appropriate. Note efficiency should include duct losses. Defaults provided assume 15% duct loss for heat pumps.836 Calculation assumes 35% Heat Pump and 65% Resistance, which is based upon data from Energy Information Administration, 2009 Residential Energy Consumption Survey, see “HC6.9 Space Heating in Midwest Region.xls”, using average for East North Central Region. Average efficiency of heat pump is based on assumption that 50% are units from before 2006 and 50% from 2006-2014. Program or evaluation data should be used to improve this assumption if available.
IL TRM v6.0 Vol. 3_January 25th, 2017_DRAFT Page 247 of 296
For example, a 13W PAR20 LED is installed in place of a 750 lumen PAR20 incandescent screw-in lamp with medium screw base, diameter >2.5",installed in single family interior location with a 2016 heat pump:
ΔkWh = - ((45 - 13) / 1000) * 0.935 * 861 * 0.49) / 2.04
= - 6.19 kWh
Illinois Statewide Technical Reference Manual – 5.6.5 High Efficiency Pool Pumps
Where:
WHFd = Waste heat factor for demand to account for cooling savings from efficient lighting.
Bulb Location WHFdInterior single family or unknown location 1.11837
Multi family in unit 1.07838
Exterior or uncooled location 1.0
CF = Summer Peak Coincidence Factor for measure, see above for values. 839
Bulb Type Peak CFThree-way 0.078840
Dimmable 0.078841
Interior reflector (incl. dimmable) 0.091Exterior reflector 0.273Unknown reflector 0.094Candelabra base and candle medium and intermediate base 0.121Bug light 0.273Post light (>100W) 0.273Daylight 0.081Plant light 0.081Globe 0.075Vibration or shatterproof 0.081Standard Spiral >=2601 lumens, Residential, Multi-family in unit 0.071Standard spirals >= 2601 lumens, unknown 0.081Standard spirals >= 2601 lumens, exterior 0.273Specialty - Generic 0.081
Other factors as defined above
NATURAL GAS SAVINGS
Heating penalty if Natural Gas heated home, or if heating fuel is unknown.
Δtherms = - (((WattsBase - WattsEE) / 1000) * ISR * Hours * HF * 0.03412) / ηHeat
837 The value is estimated at 1.11 (calculated as 1 + (0.66 * 0.466 / 2.8)). See footnote relating to WHFe for details. Note the 46.6% factor represents the average Residential cooling coincidence factor calculated by dividing average load during the peak hours divided by the maximum cooling load. 838 As above but using estimate of 45% of multi family buildings in Illinois having central cooling (based on data from “Table HC7.1 Air Conditioning in U.S. Homes, By Housing Unit Type, 2009” which is for the whole of the US, scaled to IL air conditioning prevalence compared to US average) 839 Based on lighting logger study conducted as part of the PY5/6 ComEd Residential Lighting Program evaluation.840 Based on average of bedroom, dining room, office and living room results from the lighting logger study conducted as part of the PY5/6 ComEd Residential Lighting Program evaluation.841 Ibid
IL TRM v6.0 Vol. 3_January 25th, 2017_DRAFT Page 248 of 296
For example, a 13W PAR20 LED is installed in place of a 750 lumen PAR20 incandescent screw-in lamp with medium screw base, diameter >2.5", installed in single family interior location:
ΔkW = ((45 - 13) / 1000) * 0.935 * 1.11* 0.091
= 0.0030 kW
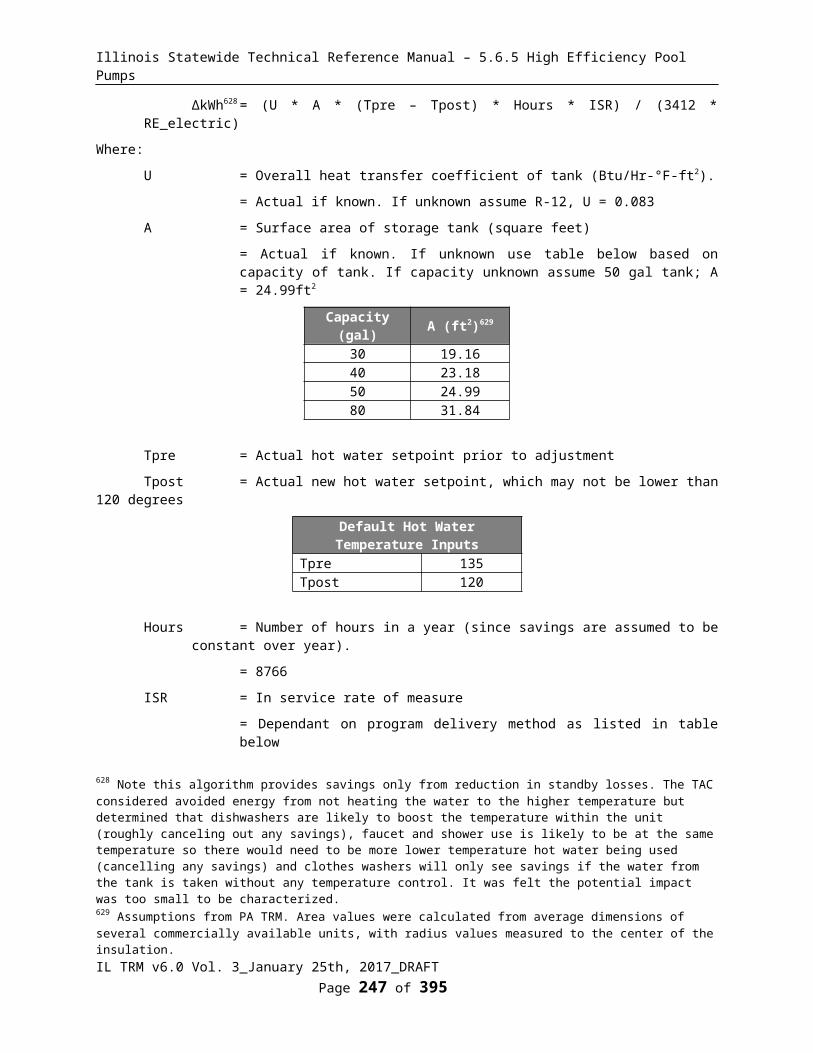
Illinois Statewide Technical Reference Manual – 5.6.5 High Efficiency Pool Pumps
Where:
HF = Heating factor, or percentage of lighting savings that must be replaced by heating system.
= 49% 842 for interior or unknown location
= 0% for exterior location
0.03412 = Converts kWh to Therms
ηHeat = Average heating system efficiency.
= 0.70 843
Other factors as defined above
WATER IMPACT DESCRIPTIONS AND CALCULATION
N/A
DEEMED O&M COST ADJUSTMENT CALCULATION
For those bulbs types exempt from EISA (except for reflectors) the following O&M assumptions should be used: Life of the baseline bulb is assumed to be 1.32 year844; baseline replacement cost is assumed to be $4.0.
For reflectors the life of the baseline bulb and the cost of its replacement is presented in the following table:
Lamp Type Baseline Lamp Life (hours)
Baseline Life(Single Family and in
unit Multifamily - 1010 hours)
Baseline Replacement
Cost
PAR20, PAR30, PAR38 screw-in lamps 2000 2.0 $4.00MR16/PAR16 pin-based lamps 2000 2.0 $3.00Recessed downlight luminaries 2000 2.0 $4.00Track lights 2000 2.0 $4.00
For non-exempt EISA bulb types defined above, in order to account for the shift in baseline due to the Energy Independence and Security Act of 2007, an equivalent annual levelized baseline replacement cost over the lifetime of the LED bulb is calculated. The key assumptions used in this calculation are documented below:842 Average result from REMRate modeling of several different configurations and IL locations of homes843 This has been estimated assuming that natural gas central furnace heating is typical for Illinois residences (66% of Illinois homes have a Natural Gas Furnace (based on Energy Information Administration, 2009 Residential Energy Consumption Survey)In 2000, 24% of furnaces purchased in Illinois were condensing (based on data from GAMA, provided to Department of Energy during the federal standard setting process for residential heating equipment - see Furnace Penetration.xls). Furnaces tend to last up to 20 years and so units purchased 10 years ago provide a reasonable proxy for the current mix of furnaces in the State. Assuming typical efficiencies for condensing and non-condensing furnaces and duct losses, the average heating system efficiency is estimated as follows: (0.24*0.92) + (0.76*0.8) * (1-0.15) = 0.70844 Assuming 1000 hour rated life for incandescent bulb: 1000/759 = 1.32
IL TRM v6.0 Vol. 3_January 25th, 2017_DRAFT Page 249 of 296
For example, a 13W PAR20 LED is installed in place of a 750 lumen PAR20 incandescent screw-in lamp with medium screw base, diameter >2.5", installed in single family interior location with gas heating at 70% total efficiency:
Δtherms = - (((45 - 13) / 1000) * 0.935 * 861 * 0.49* 0.03412) / 0.70
= - 0.62 therms

Illinois Statewide Technical Reference Manual – 5.6.5 High Efficiency Pool Pumps
Bulb replacement costs assumed in the O&M calculations are provided below845.
EISA Compliant Incandescent
/Halogen (Decorative/Globe)
Specialty CFL
2017 $1.74 N/A2018 $1.74 N/A2019 $1.74 N/A2020 & after N/A $3.40846
Installation LocationOmnidirectional
LED Measure Hours
Hours of Use per year 847
Measure Life in Years
(capped at 10)Interior and Unknown 15,000 847 10Exterior 15,000 2475 6.1
The NPV for replacement lamps and annual levelized replacement costs using the societal real discount rate of 0.46% are presented below848.
Location EISA Compliant Bulb TypeNPV of replacement costs for
periodLevelized annual replacement
cost savings2018 2019 2020 2018 2019 2020
Interior and
Unknown
Dimmable Twist, Globe (less than 5" in diameter and > 749 lumens), candle (shapes B, BA, CA > 749 lumens), Candelabra Base Lamps (>1049 lumens), Intermediate Base Lamps (>749 lumens)
$2.86 $2.86 $2.86 $0.29 $0.29 $0.29
Exterior $5.96 $5.96 $5.96 $0.61 $0.61 $0.61
It is important to note that for cost-effectiveness screening purposes, the O&M cost adjustments should only be applied in cases where the light bulbs area actually in service and so should be multiplied by the appropriate ISR.
MEASURE CODE: RS-LTG-LEDD-V07-180101
REVIEW DEADLINE: 1/1/2020
845 Baseline costs are based on field data collected by CLEAResult and provided by ComEd. See ComEd Pricing Projections 06302016.xlsx for analysis.846 Assumed consistent with LED cost.847 Based on lighting logger study conducted as part of the PY5/6 ComEd Residential Lighting Program evaluations.848 See “Specialty LED EISA compliant O&M Calc.xlsx” for calculation.
IL TRM v6.0 Vol. 3_January 25th, 2017_DRAFT Page 250 of 296
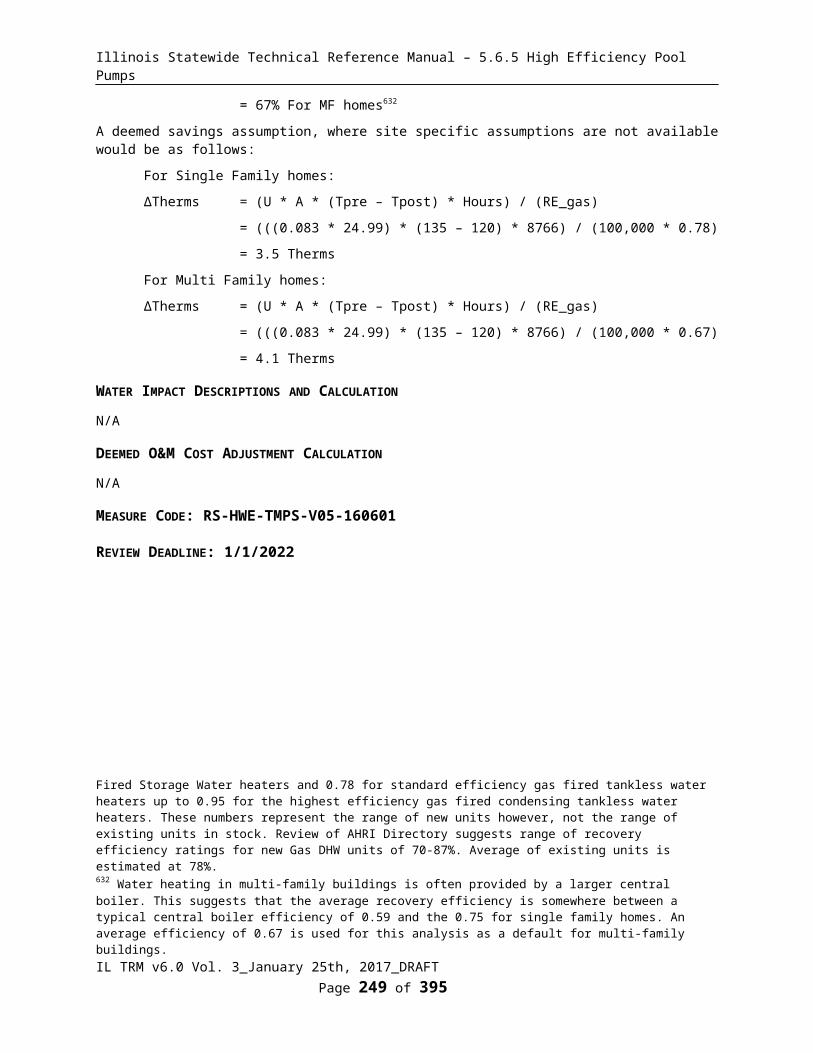
Illinois Statewide Technical Reference Manual – 5.6.5 High Efficiency Pool Pumps
5.5.7 LED Exit Signs
DESCRIPTION
This measure characterizes the savings associated with installing a Light Emitting Diode (LED) exit sign in place of a fluorescent or incandescent exit sign in a MultiFamily building. Light Emitting Diode exit signs have a string of very small, typically red or green, glowing LEDs arranged in a circle or oval. The LEDs may also be arranged in a line on the side, top or bottom of the exit sign. LED exit signs provide the best balance of safety, low maintenance, and very low energy usage compared to other exit sign technologies.
This measure was developed to be applicable to the following program types: TOS, NC, RF.
If applied to other program types, the measure savings should be verified.
DEFINITION OF EFFICIENT EQUIPMENT
The efficient equipment is assumed to be an exit sign illuminated by LEDs.
DEFINITION OF BASELINE EQUIPMENT
The baseline equipment is assumed to be a fluorescent or incandescent model.
DEEMED LIFETIME OF EFFICIENT EQUIPMENT
The measure life is assumed to be 16 years849.
DEEMED MEASURE COST
The incremental cost for this measure is assumed to be $30850.
LOADSHAPE
Loadshape C53 - Flat
COINCIDENCE FACTOR
The summer peak coincidence factor for this measure is assumed to be 100%851.
Algorithm
CALCULATION OF SAVINGS
ELECTRIC ENERGY SAVINGS
ΔkWh = ((WattsBase - WattsEE) / 1000) * HOURS * WHFe
Where:
WattsBase = Actual wattage if known, if unknown assume the following:
Baseline Type WattsBaseIncandescent 35W852
849 2008 Database for Energy-Efficiency Resources (DEER), Version 2008.2.05, “Effective/Remaining Useful Life Values”, California Public Utilities Commission, December 16, 2008.850 NYSERDA Deemed Savings Database, Labor cost assumes 25 minutes @ $18/hr.851 Assuming continuous operation of an LED exit sign, the Summer Peak Coincidence Factor is assumed to equal 1.0.
IL TRM v6.0 Vol. 3_January 25th, 2017_DRAFT Page 251 of 296

Illinois Statewide Technical Reference Manual – 5.6.5 High Efficiency Pool Pumps
Baseline Type WattsBaseFluorescent 11W853
Unknown (e.g. time of sale) 11W
WattsEE = Actual wattage if known, if unknown assume 2W854
HOURS = Annual operating hours
= 8766
WHFe = Waste heat factor for energy; accounts for cooling savings from efficient lighting.
= 1.04855 for multi family buildings
Default if replacing incandescent fixture
ΔkWH = (35 – 2)/1000 * 8766 * 1.04
= 301 kWh
Default if replacing fluorescent fixture
ΔkWH = (11 – 2)/1000 * 8766 * 1.04
= 82 kWh
HEATING PENALTY
If electric heated building (if heating fuel is unknown assume gas, see Natural Gas section):
∆kWh856 = - (((WattsBase - WattsEE) / 1000) * Hours * HF) / ηHeat
Where:
HF = Heating Factor or percentage of light savings that must be heated
= 49%857
ηHeat = Efficiency in COP of Heating equipment
= Actual. If not available use: 858:
852 Based on review of available product.853 Efficiency Vermont Technical Reference User Manual (TRM) Measure Savings Algorithms and Cost Assumptions, February, 19, 2010854 Efficiency Vermont Technical Reference User Manual (TRM) Measure Savings Algorithms and Cost Assumptions, February, 19, 2010855 The value is estimated at 1.04 (calculated as 1 + (0.45*(0.27 / 2.8)). Based on cooling loads decreasing by 27% of the lighting savings (average result from REMRate modeling of several different configurations and IL locations of homes), assuming typical cooling system operating efficiency of 3.1 COP (starting from standard assumption of SEER 10.5 central AC unit, converted to 9.5 EER using algorithm (-0.02 * SEER2) + (1.12 * SEER) (from Wassmer, M. (2003). A Component-Based Model for Residential Air Conditioner and Heat Pump Energy Calculations. Masters Thesis, University of Colorado at Boulder), converted to COP = EER/3.412 = 2.8COP) and estimate of 45% of multi family buildings in Illinois having central cooling (based on data from “Table HC7.1 Air Conditioning in U.S. Homes, By Housing Unit Type, 2009” which is for the whole of the US, scaled to IL air conditioning prevalence compared to US average) 856 Negative value because this is an increase in heating consumption due to the efficient lighting.857 This means that heating loads increase by 49% of the lighting savings. This is based on the average result from REMRate modeling of several different configurations and IL locations of homes.858 These default system efficiencies are based on the applicable minimum Federal Standards. In 2006 the Federal Standard for Heat Pumps was adjusted. While one would expect the average system efficiency to be higher than this minimum, the likely degradation of efficiencies over time mean that using the minimum standard is appropriate. Note efficiency should include duct losses. Defaults provided assume 15% duct loss for heat pumps.
IL TRM v6.0 Vol. 3_January 25th, 2017_DRAFT Page 252 of 296

Illinois Statewide Technical Reference Manual – 5.6.5 High Efficiency Pool Pumps
System Type Age of Equipment HSPF Estimate
COPHEAT
(COP Estimate)= (HSPF/3.413)*0.85
Heat PumpBefore 2006 6.8 1.7After 2006 - 2014 7.7 1.922015 on 8.2 2.04
Resistance N/A N/A 1.00Unknown859 N/A N/A 1.28
SUMMER COINCIDENT PEAK DEMAND SAVINGS
ΔkW = ((WattsBase - WattsEE) / 1000) * WHFd * CF
Where:
WHFd = Waste heat factor for demand to account for cooling savings from efficient lighting. The cooling savings are only added to the summer peak savings.
=1.07860 for multi family buildings
CF = Summer Peak Coincidence Factor for measure
= 1.0
Default if incandescent fixture
ΔkW = (35 – 2)/1000 * 1.07 * 1.0
= 0.035 kW
Default if fluorescent fixture
ΔkW = (11 – 2)/1000 * 1.07 * 1.0
= 0.0096 kW
NATURAL GAS SAVINGS
Heating penalty if Natural Gas heated building, or if heating fuel is unknown.
Δtherms = - (((WattsBase - WattsEE) / 1000) * Hours * HF * 0.03412) / ηHeat
Where:
859 Calculation assumes 35% Heat Pump and 65% Resistance, which is based upon data from Energy Information Administration, 2009 Residential Energy Consumption Survey, see “HC6.9 Space Heating in Midwest Region.xls”, using average for East North Central Region. Average efficiency of heat pump is based on assumption that 50% are units from before 2006 and 50% from 2006-2014. Program or evaluation data should be used to improve this assumption if available.860 The value is estimated at 1.11 (calculated as 1 + (0.45 * 0.466 / 2.8)). See footnote relating to WHFe for details. Note the 46.6% factor represents the average Residential cooling coincidence factor calculated by dividing average load during the peak hours divided by the maximum cooling load.
IL TRM v6.0 Vol. 3_January 25th, 2017_DRAFT Page 253 of 296
For example, a 2.0COP (including duct loss) Heat Pump heated building:
If incandescent fixture: ΔkWH = -((35 – 2)/1000 * 8766 * 0.49) / 2
= -71 kWh
If fluorescent fixture ΔkWH = -((11 – 2)/1000 * 8766 * 0.49) / 2
= -19 kWh

Illinois Statewide Technical Reference Manual – 5.6.5 High Efficiency Pool Pumps
HF = Heating factor, or percentage of lighting savings that must be replaced by heating system.
= 49% 861
0.03412 = Converts kWh to Therms
ηHeat = Average heating system efficiency.
= 0.70 862
Other factors as defined above
Default if incandescent fixture
Δtherms = - (((35 - 2) / 1000) * 8766 * 0.49* 0.03412) / 0.70
= -6.9 therms
Default if fluorescent fixture
Δtherms = - (((11 - 2) / 1000) * 8766 * 0.49* 0.03412) / 0.70
= -1.9 therms
WATER IMPACT DESCRIPTIONS AND CALCULATION
N/A
DEEMED O&M COST ADJUSTMENT CALCULATION
The annual O&M Cost Adjustment savings should be calculated using the following component costs and lifetimes.
Baseline MeasuresComponent Cost Life (yrs)Lamp $7.00863 1.37 years864
MEASURE CODE: RS-LTG-LEDE-V02-180101
REVIEW DEADLINE: 1/1/2019
861 Average result from REMRate modeling of several different configurations and IL locations of homes862 This has been estimated assuming that natural gas central furnace heating is typical for Illinois residences (66% of Illinois homes have a Natural Gas Furnace (based on Energy Information Administration, 2009 Residential Energy Consumption Survey)In 2000, 24% of furnaces purchased in Illinois were condensing (based on data from GAMA, provided to Department of Energy during the federal standard setting process for residential heating equipment - see Furnace Penetration.xls). Furnaces tend to last up to 20 years and so units purchased 10 years ago provide a reasonable proxy for the current mix of furnaces in the State. Assuming typical efficiencies for condensing and non-condensing furnaces and duct losses, the average heating system efficiency is estimated as follows: (0.24*0.92) + (0.76*0.8) * (1-0.15) = 0.70863 Consistent with assumption for a Standard CFL bulb with an estimated labor cost of $4.50 (assuming $18/hour and a task time of 15 minutes).864 Assumes a lamp life of 12,000 hours and 8766 run hours 12000/8766 = 1.37 years.
IL TRM v6.0 Vol. 3_January 25th, 2017_DRAFT Page 254 of 296
Illinois Statewide Technical Reference Manual – 5.6.5 High Efficiency Pool Pumps
5.5.8 LED Screw Based Omnidirectional Bulbs
DESCRIPTION
This characterization provides savings assumptions for LED Screw Based Omnidirectional (e.g. A-Type lamps) lamps within the residential and multifamily sectors. This characterization assumes that the LED lamp or fixture is installed in a residential location. Where the implementation strategy does not allow for the installation location to be known (e.g. an upstream retail program) a deemed split of 95% Residential and 5% Commercial assumptions should be used865.
This measure was developed to be applicable to the following program types: TOS, NC, EREP, KITS.
If applied to other program types, the measure savings should be verified.
DEFINITION OF EFFICIENT EQUIPMENT
In order for this characterization to apply, new lamps must be ENERGY STAR labeled. Note a new ENERGY STAR specification v2.0 becomes effective on 1/2/2017 (https://www.energystar.gov/products/spec/lamps_specification_version_2_0_pd).
DEFINITION OF BASELINE EQUIPMENT
In 2012, Federal legislation stemming from the Energy Independence and Security Act of 2007 (EIAS) will require all general-purpose light bulbs between 40 watts and 100 watts to have ~30% increased efficiency, essentially phasing out standard incandescent technology. In 2012, the 100 w lamp standards apply; in 2013 the 75 w lamp standards will apply, followed by restrictions on the 60 w and 40 w lamps in 2014. Since measures installed under this TRM all occur after 2014, baseline equipment are the values after EISA. These are shown in the baseline table below.
The baseline for the early replacement measure is the existing bulb being replaced.
DEEMED LIFETIME OF EFFICIENT EQUIPMENT
The deemed measure life is 6.1 years866 for exterior application. For all other applications, lifetimes are capped at 10 years867.
For early replacement measures, if replacing a halogen or incandescent bulb, the remaining life is assumed to be 333 hours. For CFL’s, the remaining life is 3,333 hours868.
DEEMED MEASURE COST
The price of LED lamps is falling quickly. Where possible, the actual LED lamp cost should be used and compared to the baseline cost provided below. If the incremental cost is unknown, assume the following869:
Year EISA Compliant Halogen LED-A Incremental
Cost2017
$1.25$3.21 $1.96
2018 $3.21 $1.962019 $3.11 $1.86
865 RES v C&I split is based on a weighted (by sales volume) average of ComEd PY6, PY7 and PY8 and Ameren PY5, PY6 and PY8 in store intercept survey results. See ‘RESvCI Split_112016.xls’.866 ENERGY STAR v2.0 requires omnidirectional LED bulbs to be rated for at least 15,000 hours. 15000/2475 (exterior hours of use) = 6.1 years.867 Based on recommendation in the Dunsky Energy Consulting, Livingston Energy Innovations and Opinion Dynamics Corporation; NEEP Emerging Technology Research Report, p 6-18.868 Representing a third of the expected lamp lifetime.869 Baseline and LED lamp costs are based on field data collected by CLEAResult and provided by ComEd. See ComEd Pricing Projections 06302016.xlsx for analysis.
IL TRM v6.0 Vol. 3_January 25th, 2017_DRAFT Page 255 of 296

Illinois Statewide Technical Reference Manual – 5.6.5 High Efficiency Pool Pumps
LOADSHAPE
Loadshape R06 – Residential Indoor Lighting
Loadshape R07 – Residential Outdoor Lighting
COINCIDENCE FACTOR
The summer peak coincidence factor is assumed to be 7.1% for Residential and in-unit Multi Family bulbs, 27.3% for exterior bulbs and 8.1% for unknown870.
Algorithm
CALCULATION OF SAVINGS
ELECTRIC ENERGY SAVINGS
ΔkWh = ((Wattsbase-WattsEE)/1000) * ISR * (1-Leakage) * Hours *WHFe
Where:
Wattsbase = Input wattage of the existing or baseline system. Reference the “LED New and Baseline Assumptions” table for default values.
WattsEE = Actual wattage of LED purchased / installed. If unknown, use default provided below:
LED New and Baseline Assumptions Table
Minimum Lumens
Maximum Lumens
Lumens used to calculate LED
Wattage(midpoint)
LED Wattage 871
(WattsEE)
Baseline 2014-2019
(WattsBase)
Delta Watts 2014-2019(WattsEE)
Baseline Post EISA 2020
requirement872 (WattsBase)
Delta Watts Post 2020(WattsEE)
5280 6209 5745 72.9 300.0 227.1 300.0 227.13000 5279 4140 52.5 200.0 147.5 200.0 147.52601 2999 2800 35.5 150.0 114.5 150.0 114.51490 2600 2045 26.0 72.0 46.0 45.4 19.51050 1489 1270 16.1 53.0 36.9 28.2 12.1750 1049 900 11.4 43.0 31.6 20.0 8.6310 749 530 6.7 29.0 22.3 11.8 5.0250 309 280 3.5 25.0 21.5 25.0 21.5
ISR = In Service Rate, the percentage of units rebated that are actually in service.
870 Based on lighting logger study conducted as part of the PY5/6 ComEd Residential Lighting Program evaluation.871 Based on ENERGY STAR V2.0 specs – for omnidirectional <90CRI: 80 lm/W and for omnidirectional >=90 CRI: 70 lm/W. To weight these two criteria, the ENERGY STAR qualified list was reviewed and found to contain 87.8% lamps <90CRI and 12.2% >=90CRI.872 Calculated as 45lm/W for all EISA non-exempt bulbs.
IL TRM v6.0 Vol. 3_January 25th, 2017_DRAFT Page 256 of 296

Illinois Statewide Technical Reference Manual – 5.6.5 High Efficiency Pool Pumps
Program
Weighted Average
1st year In Service
Rate (ISR)
2nd year Installations
3rd year Installations
Final Lifetime
In Service
RateRetail (Time of Sale) 89.9%873 4.3% 3.7% 98.0%874
Direct Install 96.9%875
Efficiency Kits876
CFL Distribution877 59% 13% 11% 83%School Kits878 61% 13% 11% 86%Direct Mail Kits879 66% 14% 12% 93%
Leakage = Adjustment to account for the percentage of program bulbs that move out (and in if deemed appropriate880) of the Utility Jurisdiction.
KITS programs = Determined through evaluation
Upstream (TOS) Lighting programs = Determined through evaluation
or use deemed assumptions below881:
ComEd: 2.1%
Ameren: 13.1%
All other programs = 0
Hours = Average hours of use per year
873 1st year in service rate is based upon analysis of ComEd PY7 and PY8 and Ameren PY8 intercept data (see ‘IL RES Lighting ISR_112016.xls’ for more information).874 The 98% Lifetime ISR assumption is based upon the standard CFL measure in the absence of any better reference. This value is based upon review of two evaluations:‘Nexus Market Research, RLW Analytics and GDS Associates study; “New England Residential Lighting Markdown Impact Evaluation, January 20, 2009’ and ‘KEMA Inc, Feb 2010, Final Evaluation Report:, Upstream Lighting Program, Volume 1.’ This implies that only 2% of bulbs purchased are never installed. The second and third year installations are based upon Ameren analysis of the Californian KEMA study showing that 54% of future installs occur in year 2 and 46% in year 3. The 2nd and 3rd year installations should be counted as part of those future program year savings. 875 Based upon Standard CFL assumption in the absence of better data, and is based upon review of the PY2 and PY3 ComEd Direct Install program surveys. This value includes bulb failures in the 1st year to be consistent with the Commission approval of annualization of savings for first year savings claims. ComEd PY2 All Electric Single Family Home Energy Performance Tune-Up Program Evaluation, Navigant Consulting, December 21, 2010. 876 In Service Rates provided are for the bulb within a kit only. Given the significant differences in program design and the level of education provided through Efficiency Kits programs, the evaluators should apply the ISR estimated through evaluations (either past evaluations or the current program year evaluation) of the specific Efficiency Kits program. In cases where program-specific evaluation results for an ISR are unavailable, the default ISR values for Efficiency Kits provide may be used.877 Free bulbs provided without request, with little or no education. Consistent with Standard CFL assumptions.878 Kits provided free to students through school, with education program. Consistent with Standard CFL assumptions.879 Opt-in program to receive kits via mail, with little or no education. Consistent with Standard CFL assumptions.880 Leakage in is only appropriate to credit to IL utility program savings if it is reasonably expected that the IL utility program marketing efforts played an important role in influencing customer to purchase the light bulbs. Furthermore, consideration that such customers might be free riders should be addressed. If leakage in is assessed, efforts should be made to ensure no double counting of savings occurs if the evaluation is estimating both leakage in and spillover savings of light bulbs.881 Leakage rate is based upon review of PY6-8 evaluations from ComEd and PY5,6 and 8 for Ameren (see ‘IL Leakage Rates_112016.xls’ for more information).
IL TRM v6.0 Vol. 3_January 25th, 2017_DRAFT Page 257 of 296

Illinois Statewide Technical Reference Manual – 5.6.5 High Efficiency Pool Pumps
Installation Location Hours882
Residential and in-unit Multi Family 759 Exterior 2475 Unknown 847
WHFe = Waste heat factor for energy to account for cooling energy savings from efficient lighting
Bulb Location WHFeInterior single family or unknown location 1.06 883
Multi family in unit 1.04 884
Exterior or uncooled location 1.0
Mid Life Baseline Adjustment
During the lifetime of a standard Omnidirectional LED, the baseline incandescent/halogen bulb would need to be replaced multiple times. Since the baseline bulb changes over time (except for <300 and 2600+ lumen lamps) the annual savings claim must be reduced within the life of the measure to account for this baseline shift.
For example, for 60W equivalent bulbs installed in 2018, the full savings (as calculated above in the Algorithm) should be claimed for the first three years, but a reduced annual savings (calculated energy savings above multiplied by the adjustment factor in the table below) claimed for the remainder of the measure life.
Minimum Lumens
Maximum Lumens
LED Wattage
(WattsEE)
Delta Watts 2014-2019(WattsEE)
Delta Watts Post 2020(WattsEE)
Mid Life adjustment (made from 01/2021) to first year savings
1490 2600 26.0 46.0 19.5 42.3%1050 1489 16.1 36.9 12.1 32.8%750 1049 11.4 31.6 8.6 27.1%310 749 6.7 22.3 5.0 22.6%
882 Based on lighting logger study conducted as part of the PY5/6 ComEd Residential Lighting Program evaluation.883 The value is estimated at 1.06 (calculated as 1 + (0.66*(0.27 / 2.8)). Based on cooling loads decreasing by 27% of the lighting savings (average result from REMRate modeling of several different configurations and IL locations of homes), assuming typical cooling system operating efficiency of 2.8 COP (starting from standard assumption of SEER 10.5 central AC unit, converted to 9.5 EER using algorithm (-0.02 * SEER2) + (1.12 * SEER) (from Wassmer, M. (2003). A Component-Based Model for Residential Air Conditioner and Heat Pump Energy Calculations. Masters Thesis, University of Colorado at Boulder), converted to COP = EER/3.412 = 2.8COP) and 66% of homes in Illinois having central cooling ("Table HC7.9 Air Conditioning in Homes in Midwest Region, Divisions, and States, 2009 from Energy Information Administration", 2009 Residential Energy Consumption Survey)884 As above but using estimate of 45% of multi family buildings in Illinois having central cooling (based on data from “Table HC7.1 Air Conditioning in U.S. Homes, By Housing Unit Type, 2009” which is for the whole of the US, scaled to IL air conditioning prevalence compared to US average)
IL TRM v6.0 Vol. 3_January 25th, 2017_DRAFT Page 258 of 296
For example, an 8W LED lamp, 450 lumens, is installed in the interior of a home. The customer purchased the lamp through an upstream program:
ΔkWH = ((29-6.7 /1000) * 847 * 1.06 * 0.899
= 18.0 kWh
This value should be claimed for three years, i.e. 2018-2020, but from 2021 until the end of the measure life for that same bulb, savings should be reduced to (18.0 * 0.226 =) 4.1 kWh for the remainder of the measure life. Note these adjustments should be applied to kW and fuel impacts as well.

Illinois Statewide Technical Reference Manual – 5.6.5 High Efficiency Pool Pumps
Note for early replacement measures an additional baseline shift accounting for the replacement of the existing unit with a new baseline lamp should be accounted for.
DEFERRED INSTALLS
As presented above, the characterization assumes that a percentage of bulbs purchased are not installed until Year 2 and Year 3 (see ISR assumption above). The Illinois Technical Advisory Committee has determined the following methodology for calculating the savings of these future installs.
Year 1 (Purchase Year) installs: Characterized using assumptions provided above or evaluated assumptions if available.
Year 2 and 3 installs: Characterized using delta watts assumption and hours of use from the Install Year i.e. the actual deemed (or evaluated if available) assumptions active in Year 2 and 3 should be applied.
The NTG factor for the Purchase Year should be applied.
HEATING PENALTY
If electric heated home (if heating fuel is unknown assume gas, see Natural Gas section):
∆kWh885 = - (((WattsBase - WattsEE) / 1000) * ISR * Hours * HF) / ηHeat
Where:
HF = Heating Factor or percentage of light savings that must be heated
= 49%886 for interior or unknown location
= 0% for exterior or unheated location
ηHeat = Efficiency in COP of Heating equipment
= actual. If not available use887:
System Type Age of Equipment HSPF Estimate
COPHEAT
(COP Estimate)= (HSPF/3.413)*0.85
Heat Pump Before 2006 6.8 1.7After 2006 - 2014 7.7 1.92
885 Negative value because this is an increase in heating consumption due to the efficient lighting.886 This means that heating loads increase by 49% of the lighting savings. This is based on the average result from REMRate modeling of several different configurations and IL locations of homes.887 These default system efficiencies are based on the applicable minimum Federal Standards. In 2006 the Federal Standard for Heat Pumps was adjusted. While one would expect the average system efficiency to be higher than this minimum, the likely degradation of efficiencies over time mean that using the minimum standard is appropriate. Note efficiency should include duct losses. Defaults provided assume 15% duct loss for heat pumps.
IL TRM v6.0 Vol. 3_January 25th, 2017_DRAFT Page 259 of 296
Using the example from above, for an 8W LED, 450 Lumens purchased for the interior of a residential homes through an upstream program.
ΔkWH1st year installs = ((29-6.7)/1000)*847*1.06*0.899
= 18.0 kWh
ΔkWH2nd year installs = ((29-6.7)/1000)*847*1.06*0.043
= 0.9 kWh
Note: Here we assume no change in hours assumption. NTG value from Purchase year applied.
ΔkWH3rd year installs = ((29-8/1000)*847*1.06*0.028
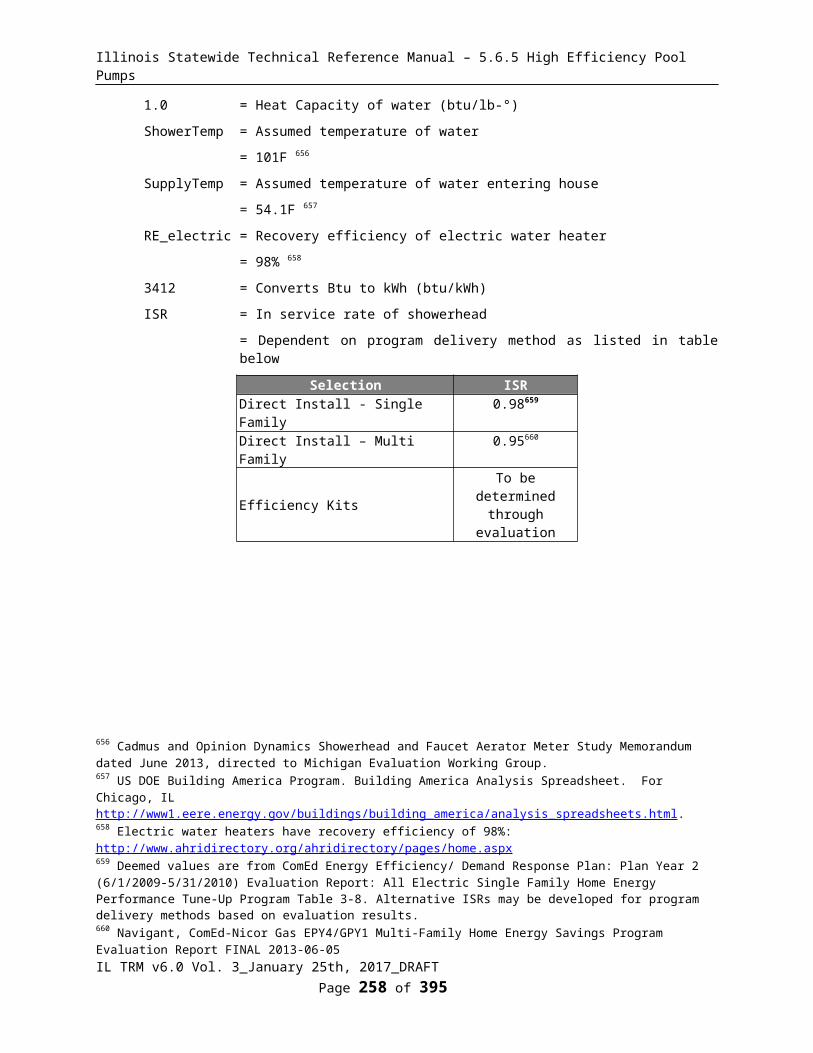
Illinois Statewide Technical Reference Manual – 5.6.5 High Efficiency Pool Pumps
2015 on 8.2 2.04Resistance N/A N/A 1.00Unknown888 N/A N/A 1.28
SUMMER COINCIDENT PEAK DEMAND SAVINGS
∆kW = ((WattsBase - WattsEE) / 1 000) * ISR * WHFd * CF
Where:
WHFd = Waste heat factor for demand to account for cooling savings from efficient lighting.
Bulb Location WHFdInterior single family or unknown location 1.11889
Multi family in unit 1.07890
Exterior or uncooled location 1.0
CF = Summer Peak Coincidence Factor for measure.
Bulb Location CF891
Interior single family or unknown location or Multi family in unit 7.1% Exterior 27.3%Unknown 8.1%
Other factors as defined above
888 Calculation assumes 35% Heat Pump and 65% Resistance, which is based upon data from Energy Information Administration, 2009 Residential Energy Consumption Survey, see “HC6.9 Space Heating in Midwest Region.xls”, using average for East North Central Region. Average efficiency of heat pump is based on assumption that 50% are units from before 2006 and 50% from 2006-2014. Program or evaluation data should be used to improve this assumption if available.889 The value is estimated at 1.11 (calculated as 1 + (0.66 * 0.466 / 2.8)). See footnote relating to WHFe for details. Note the 46.6% factor represents the average Residential cooling coincidence factor calculated by dividing average load during the peak hours divided by the maximum cooling load. 890 As above but using estimate of 45% of multi family buildings in Illinois having central cooling (based on data from “Table HC7.1 Air Conditioning in U.S. Homes, By Housing Unit Type, 2009” which is for the whole of the US, scaled to IL air conditioning prevalence compared to US average) 891 Based on lighting logger study conducted as part of the PY5/6 ComEd Residential Lighting Program evaluations.
IL TRM v6.0 Vol. 3_January 25th, 2017_DRAFT Page 260 of 296
Using the same 8 W LED that is installed in home with 2.0 COP Heat Pump (including duct loss):
∆kWh1st year = - (((29-6.7) / 1000) * 0.899 * 759 * 0.49) / 2.0
= - 3.7 kWh
Second and third year install savings should be calculated using the appropriate ISR and the delta watts and hours from the install year. The appropriate baseline shift adjustment should then be applied to all installs.

Illinois Statewide Technical Reference Manual – 5.6.5 High Efficiency Pool Pumps
NATURAL GAS SAVINGS
Heating penalty if Natural Gas heated home, or if heating fuel is unknown.
ΔTherms = - (((WattsBase - WattsEE) / 1000) * ISR * Hours * HF * 0.03412) / ηHeat
Where:
HF = Heating factor, or percentage of lighting savings that must be replaced by heating system.
= 49% 892 for interior or unknown location
= 0% for exterior location
0.03412 = Converts kWh to Therms
ηHeat = Average heating system efficiency.
= 0.70 893
WATER IMPACT DESCRIPTIONS AND CALCULATION
N/A
DEEMED O&M COST ADJUSTMENT CALCULATION
Bulb replacement costs assumed in the O&M calculations are provided below894.
Std Inc. EISA Compliant Halogen CFL LED-A
2017 $0.43 $1.25 N/A $3.212018 $0.43 $1.25 N/A $3.212019 $0.43 $1.25 N/A $3.112020 & after $0.43 N/A $2.45 $2.70
In order to account for the shift in baseline due to the Energy Independence and Security Act of 2007, an equivalent annual levelized baseline replacement cost over the lifetime of the LED bulb is calculated. The key
892 Average result from REMRate modeling of several different configurations and IL locations of homes893 This has been estimated assuming that natural gas central furnace heating is typical for Illinois residences (66% of Illinois homes have a Natural Gas Furnace (based on Energy Information Administration, 2009 Residential Energy Consumption Survey)In 2000, 24% of furnaces purchased in Illinois were condensing (based on data from GAMA, provided to Department of Energy during the federal standard setting process for residential heating equipment - see Furnace Penetration.xls). Furnaces tend to last up to 20 years and so units purchased 10 years ago provide a reasonable proxy for the current mix of furnaces in the State. Assuming typical efficiencies for condensing and non-condensing furnaces and duct losses, the average heating system efficiency is estimated as follows: (0.24*0.92) + (0.76*0.8) * (1-0.15) = 0.70894 Baseline and LED lamp costs are based on field data collected by CLEAResult and provided by ComEd. See ComEd Pricing Projections 06302016.xlsx for analysis.
IL TRM v6.0 Vol. 3_January 25th, 2017_DRAFT Page 261 of 296
For the same 8 W LED that is installed in a single family interior location, the demand savings are:
ΔkW = ((29-6.7) / 1000) * 0.899* 1.11 * 0.071
= 0.0016 kW
Second and third year install savings should be calculated using the appropriate ISR and the delta watts and hours from the install year. The appropriate baseline shift adjustment should then be applied to all installs.
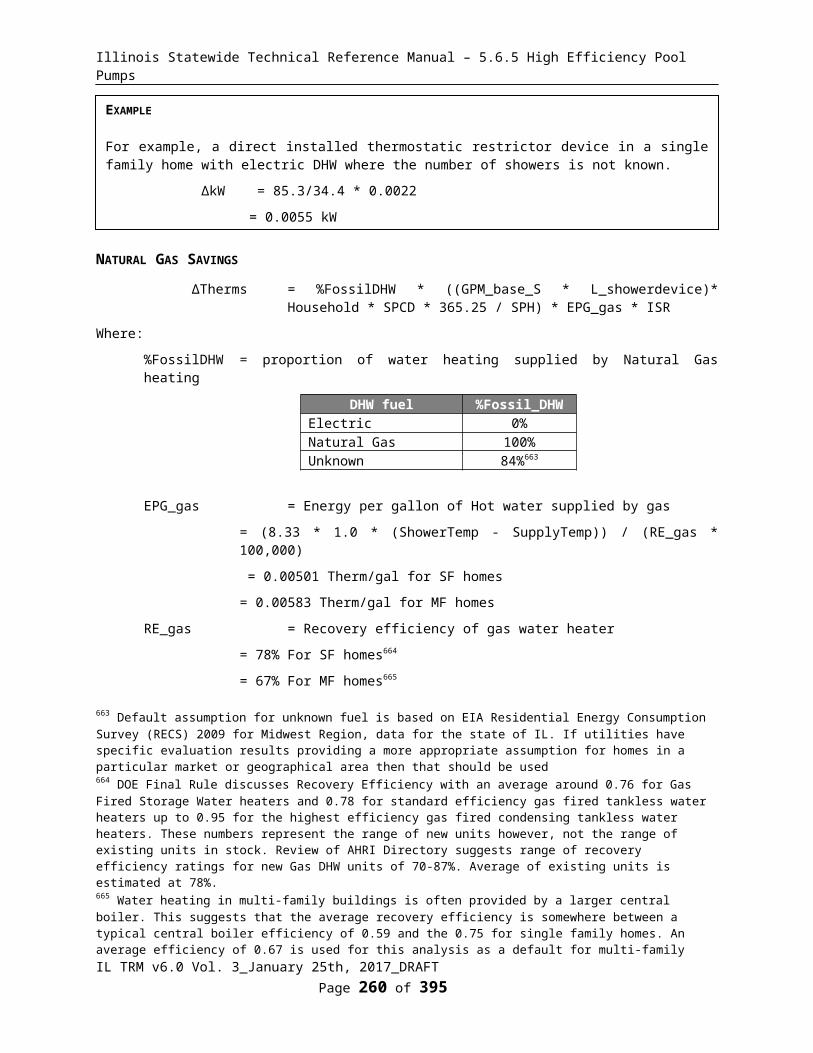
Illinois Statewide Technical Reference Manual – 5.6.5 High Efficiency Pool Pumps
assumptions used in this calculation are documented below:
Installation LocationOmnidirectional
LED Measure Hours
Hours of Use per year 895
Measure Life in Years
(capped at 10)Residential and in-unit Multi Family 15,000 759 10Exterior 15,000 2475 6.1Unknown 15,000 847 10
The NPV for replacement lamps and annual levelized replacement costs using the societal real discount rate of 0.46% are presented below896. It is important to note that for cost-effectiveness screening purposes, the O&M cost adjustments should only be applied in cases where the light bulbs area actually in service and so should be multiplied by the appropriate ISR:
Location Lumen LevelNPV of replacement costs for
periodLevelized annual replacement cost
savings2018 2019 2020 2018 2019 2020
Residential and in-unit Multi
Family
Lumens <310 or >2600 (non-EISA compliant)
$2.86 $2.86 $2.86 $0.29 $0.29 $0.29
Lumens ≥ 310 and ≤ 2600 (EISA compliant) $3.14 $2.38 $1.63 $0.32 $0.24 $0.17
Exterior
Lumens <310 or >2600 (non-EISA compliant)
$5.96 $5.96 $5.96 $0.61 $0.61 $0.61
Lumens ≥ 310 and ≤ 2600 (EISA compliant) $9.79 $7.34 $4.87 $1.00 $0.75 $0.50
Unknown
Lumens <310 or >2600 (non-EISA compliant)
$3.19 $3.19 $3.19 $0.33 $0.33 $0.33
Lumens ≥ 310 and ≤ 2600 (EISA compliant) $3.50 $2.66 $1.82 $0.36 $0.27 $0.19
Note incandescent lamps in lumen range <310 and >2600 are exempt from EISA. For halogen bulbs, we assume the same replacement cycle as incandescent bulbs.897 The replacement cycle is based on the location of the lamp and varies based on the hours of use for that location. Both incandescent and halogen lamps are assumed to last for 1,000 hours before needing replacement.
MEASURE CODE: RS-LTG-LEDA-V05-180101
REVIEW DEADLINE: 1/1/2020
895 Based on lighting logger study conducted as part of the PY5/6 ComEd Residential Lighting Program evaluations.896 See “LED TRM Examples_012017.xls” for calculation.897 The manufacturers of the new minimally compliant EISA Halogens are using regular incandescent lamps with halogen fill gas rather than halogen infrared to meet the standard and so the component rated life is equal to the standard incandescent.
IL TRM v6.0 Vol. 3_January 25th, 2017_DRAFT Page 262 of 296
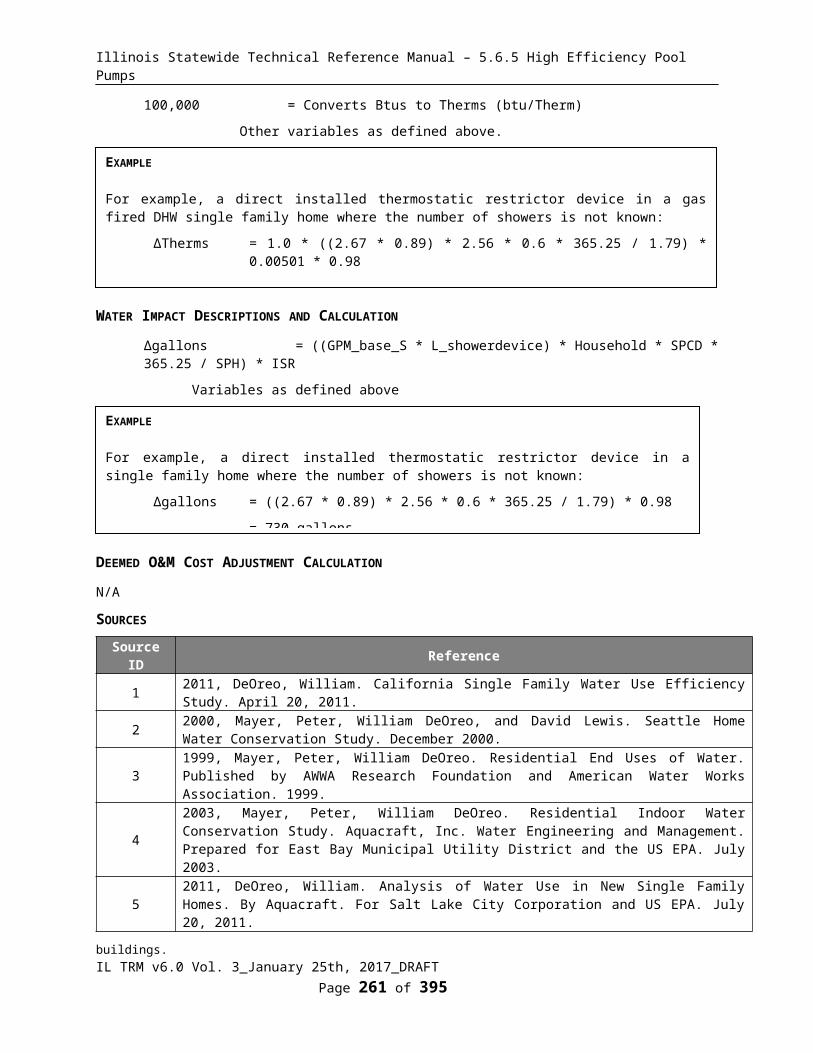
Illinois Statewide Technical Reference Manual – 5.6.5 High Efficiency Pool Pumps
5.6 Shell End Use5.6.1 Air Sealing
DESCRIPTION
Thermal shell air leaks are sealed through strategic use and location of air-tight materials. Leaks are detected and leakage rates measured with the assistance of a blower-door. The algorithm for this measure can be used when the program implementation does not allow for more detailed forecasting through the use of residential modeling software.
Prescriptive savings are provided for use only where a blower door test is not possible (for example in large multi family buildings).
This measure was developed to be applicable to the following program types: RF.
If applied to other program types, the measure savings should be verified.
DEFINITION OF EFFICIENT EQUIPMENT
Air sealing materials and diagnostic testing should meet all eligibility program qualification criteria. The initial and final tested leakage rates should be performed in such a manner that the identified reductions can be properly discerned, particularly in situations wherein multiple building envelope measures may be implemented simultaneously.
DEFINITION OF BASELINE EQUIPMENT
The existing air leakage should be determined through approved and appropriate test methods using a blower door. The baseline condition of a building upon first inspection significantly impacts the opportunity for cost-effective energy savings through air-sealing.
DEEMED LIFETIME OF EFFICIENT EQUIPMENT
The expected measure life is assumed to be 15 years.898
DEEMED MEASURE COST
The actual capital cost for this measure should be used in screening.
LOADSHAPE
Loadshape R08 - Residential CoolingLoadshape R09 - Residential Electric Space HeatLoadshape R10 - Residential Electric Heating and Cooling
COINCIDENCE FACTOR
The summer peak coincidence factor for cooling is provided in two different ways below. The first is used to estimate peak savings during the utility peak hour and is most indicative of actual peak benefits, and the second represents the average savings over the defined summer peak period, and is presented so that savings can be bid into PJM’s Forward Capacity Market.
CFSSP = Summer System Peak Coincidence Factor for Central A/C (during utility peak hour)
= 68%899
898 Measure Life Report, Residential and Commercial/Industrial Lighting and HVAC Measures, GDS Associates, 2007899 Based on metering of 24 homes with central AC during PY4 and PY5 in Ameren Illinois service territory.
IL TRM v6.0 Vol. 3_January 25th, 2017_DRAFT Page 263 of 296

Illinois Statewide Technical Reference Manual – 5.6.5 High Efficiency Pool Pumps
CFSSP = Summer System Peak Coincidence Factor for Heat Pumps (during system peak hour)
= 72%%900
CFPJM = PJM Summer Peak Coincidence Factor for Central A/C (average during PJM peak period)
= 46.6%901
Algorithm
CALCULATION OF SAVINGS
ELECTRIC ENERGY SAVINGS
Methodology 1: Blower Door Test
Preferred methodology unless blower door testing is not possible.
ΔkWh = ΔkWh_cooling + ΔkWh_heating
Where:
ΔkWh_cooling = If central cooling, reduction in annual cooling requirement due to air sealing
= [(((CFM50_existing - CFM50_new)/N_cool) * 60 * 24 * CDD * DUA * 0.018) / (1000 * ηCool)] * LM
CFM50_existing = Infiltration at 50 Pascals as measured by blower door before air sealing.
= Actual
CFM50_new = Infiltration at 50 Pascals as measured by blower door after air sealing.
= Actual
N_cool = Conversion factor from leakage at 50 Pascal to leakage at natural conditions
=Dependent on location and number of stories:902
Climate Zone(City based upon)
N_cool (by # of stories)1 1.5 2 3
1 (Rockford) 39.5 35.0 32.1 28.42 (Chicago) 38.9 34.4 31.6 28.03 (Springfield) 41.2 36.5 33.4 29.64 (St Louis, MO) 40.4 35.8 32.9 29.15 (Paducah, KY) 43.6 38.6 35.4 31.3
60 * 24 = Converts Cubic Feet per Minute to Cubic Feet per Day
CDD = Cooling Degree Days
900 Based on analysis of metering results from 24 heat pumps in Ameren Illinois service territory in PY5 coincident with AIC’s 2010 system peak; ‘Impact and Process Evaluation of Ameren Illinois Company’s Residential HVAC Program (PY5)’.901 Based on analysis of Itron eShape data for Missouri, calibrated to Illinois loads, supplied by Ameren. The average AC load over the PJM peak period (1-5pm, M-F, June through August) is divided by the maximum AC load during the year.902 N-factor is used to convert 50-pascal blower door air flows to natural air flows and is dependent on geographic location and # of stories. These were developed by applying the LBNL infiltration model (see LBNL paper 21040, Exegisis of Proposed ASHRAE Standard 119: Air Leakage Performance for Detached Single-Family Residential Buildings; Sherman, 1986; page v-vi, Appendix page 7-9) to the reported wind speeds and outdoor temperatures provided by the NRDC 30 year climate normals. For more information see Bruce Harley, CLEAResult “Infiltration Factor Calculations Methodology.doc”.
IL TRM v6.0 Vol. 3_January 25th, 2017_DRAFT Page 264 of 296

Illinois Statewide Technical Reference Manual – 5.6.5 High Efficiency Pool Pumps
= Dependent on location903:
Climate Zone (City based
upon)CDD 65
1 (Rockford) 8202 (Chicago) 8423 (Springfield) 1,1084 (Belleville) 1,5705 (Marion) 1,370
DUA = Discretionary Use Adjustment (reflects the fact that people do not always operate their AC when conditions may call for it).
= 0.75 904
0.018 = Specific Heat Capacity of Air (Btu/ft3*°F)
1000 = Converts Btu to kBtu
ηCool = Efficiency (SEER) of Air Conditioning equipment (kBtu/kWh)
= Actual (where it is possible to measure or reasonably estimate). If unknown assume the following905:
Age of Equipment SEER EstimateBefore 2006 102006 - 2014 13Central AC After 1/1/2015 13Heat Pump After 1/1/2015 14
LM = Latent multiplier to account for latent cooling demand906
Climate Zone(City based upon) LM
1 (Rockford) 3.32 (Chicago) 3.2
3 (Springfield) 3.74 (St Louis, MO) 3.65 (Paducah, KY) 3.7
ΔkWh_heating = If electric heat (resistance or heat pump), reduction in annual electric heating due toair sealing
= (((CFM50_existing - CFM50_new)/N_heat) * 60 * 24 * HDD * 0.018) / (ηHeat * 3,412)
N_heat = Conversion factor from leakage at 50 Pascal to leakage at natural conditions
903 National Climatic Data Center, calculated from 1981-2010 climate normals with a base temp of 65°F.904 This factor's source is: Energy Center of Wisconsin, May 2008 metering study; “Central Air Conditioning in Wisconsin, A Compilation of Recent Field Research”, p31. 905 These default system efficiencies are based on the applicable minimum Federal Standards. In 2006 the Federal Standard for Central AC was adjusted. While one would expect the average system efficiency to be higher than this minimum, the likely degradation of efficiencies over time mean that using the minimum standard is appropriate.906 Derived by calculating the sensible and total loads in each hour. For more information see Bruce Harley, CLEAResult “Infiltration Factor Calculations Methodology.doc”.
IL TRM v6.0 Vol. 3_January 25th, 2017_DRAFT Page 265 of 296
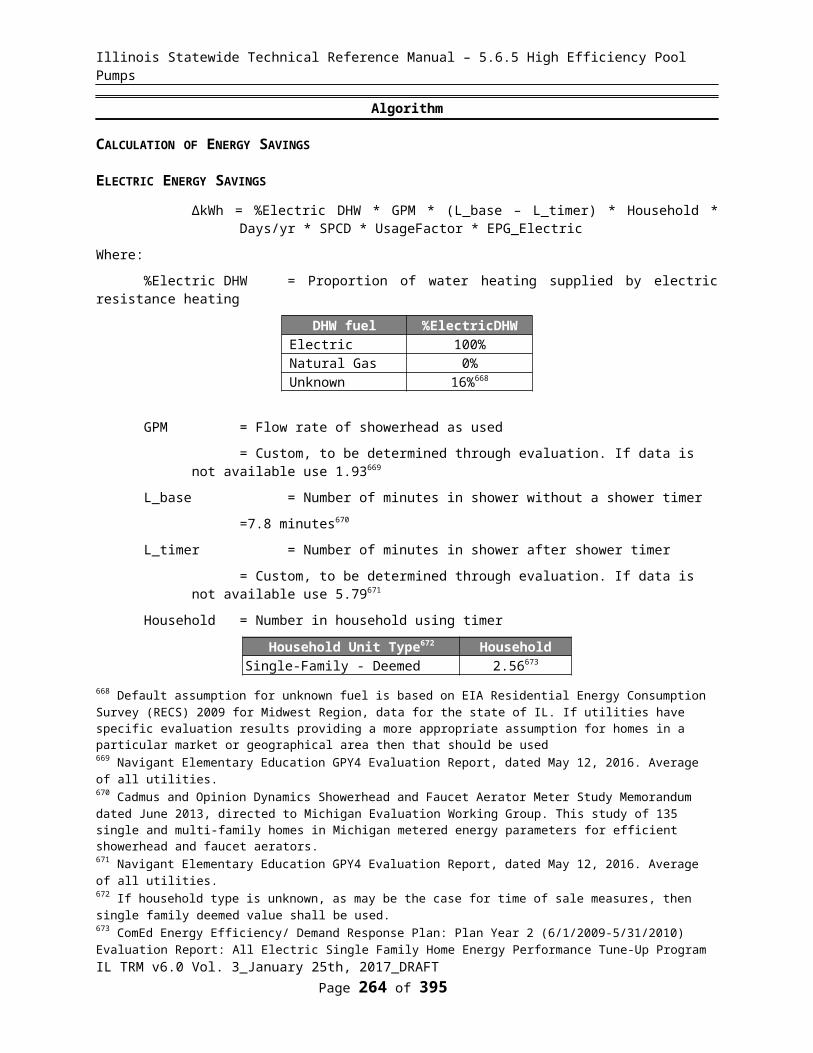
Illinois Statewide Technical Reference Manual – 5.6.5 High Efficiency Pool Pumps
= Based on climate zone, building height and exposure level:907
Climate Zone(City based upon)
N_heat (by # of stories)1 1.5 2 3
1 (Rockford) 23.8 21.1 19.3 17.12 (Chicago) 23.9 21.1 19.4 17.23 (Springfield) 24.2 21.5 19.7 17.44 (St Louis, MO) 25.4 22.5 20.7 18.35 (Paducah, KY) 27.8 24.6 22.6 20.0
HDD = Heating Degree Days
= Dependent on location:908
Climate Zone(City based upon) HDD 60
1 (Rockford) 5,3522 (Chicago) 5,1133 (Springfield) 4,3794 (Belleville) 3,3785 (Marion) 3,438
ηHeat = Efficiency of heating system
= Actual. If not available refer to default table below909:
System Type Age of Equipment
HSPF Estimate
ηHeat (Effective COP Estimate)=
(HSPF/3.413)*0.85
Heat PumpBefore 2006 6.8 1.72006 - 2014 7.7 1.922015 on 8.2 2.04
Resistance N/A N/A 1
3412 = Converts Btu to kWh
907 N-factor is used to convert 50-pascal blower door air flows to natural air flows and is dependent on geographic location and # of stories. These were developed by applying the LBNL infiltration model (see LBNL paper 21040, Exegisis of Proposed ASHRAE Standard 119: Air Leakage Performance for Detached Single-Family Residential Buildings; Sherman, 1986; page v-vi, Appendix page 7-9) to the reported wind speeds and outdoor temperatures provided by the NRDC 30 year climate normals. For more information see Bruce Harley, CLEAResult “Infiltration Factor Calculations Methodology.doc”.908 National Climatic Data Center, calculated from 1981-2010 climate normals with a base temp of 60°F. 909 These default system efficiencies are based on the applicable minimum Federal Standards. In 2006 the Federal Standard for Heat Pumps was adjusted. While one would expect the average system efficiency to be higher than this minimum, the likely degradation of efficiencies over time means that using the minimum standard is appropriate. An 85% distribution efficiency is then applied to account for duct losses for heat pumps.
IL TRM v6.0 Vol. 3_January 25th, 2017_DRAFT Page 266 of 296

Illinois Statewide Technical Reference Manual – 5.6.5 High Efficiency Pool Pumps
ΔkWh_heating = If gas furnace heat, kWh savings for reduction in fan run time
= ΔTherms * Fe * 29.3
Fe = Furnace Fan energy consumption as a percentage of annual fuel consumption
= 3.14%910
29.3 = kWh per therm
Methodology 2: Prescriptive Infiltration Reduction Measures911
Savings shall only be calculated via Methodology 2 if a blower door test is not feasible. Cooling savings are not quantified using Methodology 2.
ΔkWh_heating = (ΔkWhgasket * ngasket + ΔkWhsweep * nsweep + ΔkWhsealing * lfsealing + ΔkWhWX * lfWX) * ADJRxAirsealing
Where:
ΔkWhgasket = Annual kWh savings from installation of air sealing gasket on an electric outlet
Climate Zone(City based upon)
ΔkWhgasket / gasketElectric Resistance Heat Pump
1 (Rockford) 10.5 5.32 (Chicago) 10.2 5.1
3 (Springfield) 8.8 4.44 (Belleville) 7.0 3.5
910 Fe is not one of the AHRI certified ratings provided for residential furnaces, but can be reasonably estimated from a calculation based on the certified values for fuel energy (Ef in MMBtu/yr) and Eae (kWh/yr). An average of a 300 record sample (non-random) out of 1495 was 3.14%. This is, appropriately, ~50% greater than the Energy Star version 3 criteria for 2% Fe. See “Programmable Thermostats Furnace Fan Analysis.xlsx” for reference.911 Prescriptive savings are based upon “Evaluation of the Weatherization Residential Assistance Partnership and Helps Programs (WRAP/Helps).” Middletown, CT: KEMA, 2010. Accessed July 30, 2015, (http://www.energizect.com/sites/default/files/Final%20WRAP%20%20Helps%20Report.pdf) and adjusted for relative HDD of Bridgeport/Hartford CT with the IL climate zones. See ‘Rx Airsealing HDD adjustment.xls’ for more information.
IL TRM v6.0 Vol. 3_January 25th, 2017_DRAFT Page 267 of 296
For example, a 2 story single family home in Chicago with 10.5 SEER central cooling and a heat pump with COP of 2 (1.92 including distribution losses), has pre and post blower door test results of 3,400 and 2,250:
ΔkWh = ΔkWh_cooling + ΔkWh_heating
= [((((3,400 – 2,250) / 31.6) * 60 * 24 * 842 * 0.75 * 0.018) / (1000 * 10.5)) * 3.2] + [((3,400 – 2,250) / 19.4)) * 60 * 24 * 5113 * 0.018 / (1.92 * 3,412)]
= 182 + 1199
= 1,381 kWh
For example, a well shielded, 2 story single family home in Chicago with a gas furnace with system efficiency of 70%, has pre and post blower door test results of 3,400 and 2,250 (see therm calculation in Natural Gas Savings section:
ΔkWh = 109.1 * 0.0314 * 29.3
= 100 kWh

Illinois Statewide Technical Reference Manual – 5.6.5 High Efficiency Pool Pumps
Climate Zone(City based upon)
ΔkWhgasket / gasketElectric Resistance Heat Pump
5 (Marion) 7.2 3.6
ngasket = Number of gaskets installed
ΔkWhsweep =Annual kWh savings from installation of door sweep
Climate Zone(City based upon)
ΔkWhsweep / sweepElectric Resistance Heat Pump
1 (Rockford) 202.4 101.22 (Chicago) 195.3 97.6
3 (Springfield) 169.3 84.74 (Belleville) 134.9 67.55 (Marion) 137.9 68.9
nsweep = Number of sweeps installed
ΔkWhsealing = Annual kWh savings from foot of caulking, sealing, or polyethlylene tape
Climate Zone(City based upon)
ΔkWhsealing / ftElectric Resistance Heat Pump
1 (Rockford) 11.6 5.82 (Chicago) 11.2 5.6
3 (Springfield) 9.7 4.84 (Belleville) 7.7 3.95 (Marion) 7.9 3.9
lfsealing = linear feet of caulking, sealing, or polyethylene tape
ΔkWhWX = Annual kWh savings from window weatherstripping or door weatherstripping
Climate Zone(City based upon)
ΔkWhWX / ftElectric Resistance Heat Pump
1 (Rockford) 13.5 6.72 (Chicago) 13.0 6.5
3 (Springfield) 11.3 5.64 (Belleville) 9.0 4.55 (Marion) 9.2 4.6
lfWX = Linear feet of window weatherstripping or door weatherstripping
ADJRxAirsealing = Adjustment for air sealing savings to account for prescriptive estimates overclaiming savings912.
= 80%
SUMMER COINCIDENT PEAK DEMAND SAVINGS
ΔkW = (ΔkWh_cooling / FLH_cooling) * CF
912 Though we do not have a specific evaluation to point to, modeled savings have often been found to overclaim. Further VEIC reviewed these deemed estimates and consider them to likely be a high estimate. As such an 80% adjustment is applied, and this could be further refined with future evaluations.
IL TRM v6.0 Vol. 3_January 25th, 2017_DRAFT Page 268 of 296

Illinois Statewide Technical Reference Manual – 5.6.5 High Efficiency Pool Pumps
Where:
FLH_cooling = Full load hours of air conditioning
= Dependent on location913:
Climate Zone(City based
upon)
Single Family Multifamily
1 (Rockford) 512 4672 (Chicago) 570 5063 (Springfield) 730 6634 (Belleville) 1,035 9405 (Marion) 903 820
CFSSP = Summer System Peak Coincidence Factor for Central A/C (during system peak hour)
= 68%914
CFSSP = Summer System Peak Coincidence Factor for Heat Pumps (during system peak hour)
= 72%%915
CFPJM = PJM Summer Peak Coincidence Factor for Central A/C (average during peak period)
= 46.6%916
Other factors as defined above
NATURAL GAS SAVINGS
Methodology 1: Blower Door Test
Preferred methodology unless blower door testing is not possible.
If Natural Gas heating:
ΔTherms = (((CFM50_existing - CFM50_new)/N_heat) * 60 * 24 * HDD * 0.018) / (ηHeat * 100,000)
Where:
913 Full load hours for Chicago, Moline and Rockford are provided in “Final Evaluation Report: Central Air Conditioning Efficiency Services (CACES), 2010, Navigant Consulting”, p.33. An average FLH/Cooling Degree Day (from NCDC) ratio was calculated for these locations and applied to the CDD of the other locations in order to estimate FLH.914 Based on metering of 24 homes with central AC during PY4 and PY5 in Ameren Illinois service territory.915 Based on analysis of metering results from 24 heat pumps in Ameren Illinois service territory in PY5 coincident with AIC’s 2010 system peak; ‘Impact and Process Evaluation of Ameren Illinois Company’s Residential HVAC Program (PY5)’.916 Based on analysis of Itron eShape data for Missouri, calibrated to Illinois loads, supplied by Ameren. The average AC load over the PJM peak period (1-5pm, M-F, June through August) is divided by the maximum AC load during the year.
IL TRM v6.0 Vol. 3_January 25th, 2017_DRAFT Page 269 of 296
For example, a well shielded, 2 story single family home in Chicago with 10.5 SEER central cooling and a heat pump with COP of 2.0, has pre and post blower door test results of 3,400 and 2,250:
ΔkWSSP = 182 / 570 * 0.68
= 0.22 kW
ΔkWPJM = 182 / 570 * 0.466
= 0.15 kW

Illinois Statewide Technical Reference Manual – 5.6.5 High Efficiency Pool Pumps
N_heat = Conversion factor from leakage at 50 Pascal to leakage at natural conditions
= Based on climate zone and building height917
Climate Zone(City based upon)
N_heat (by # of stories)1 1.5 2 3
1 (Rockford) 23.8 21.1 19.3 17.12 (Chicago) 23.9 21.1 19.4 17.23 (Springfield) 24.2 21.5 19.7 17.44 (St Louis, MO) 25.4 22.5 20.7 18.35 (Paducah, KY) 27.8 24.6 22.6 20.0
HDD = Heating Degree Days
= dependent on location918:
Climate Zone(City based upon) HDD 60
1 (Rockford) 5,3522 (Chicago) 5,1133 (Springfield) 4,3794 (Belleville) 3,3785 (Marion) 3,438
ηHeat = Efficiency of heating system
= Equipment efficiency * distribution efficiency
= Actual919. If not available use 72%920.
Other factors as defined above
Methodology 2: Prescriptive Infiltration Reduction Measures921
917 N-factor is used to convert 50-pascal blower door air flows to natural air flows and is dependent on geographic location and # of stories. These were developed by applying the LBNL infiltration model (see LBNL paper 21040, Exegisis of Proposed ASHRAE Standard 119: Air Leakage Performance for Detached Single-Family Residential Buildings; Sherman, 1986; page v-vi, Appendix page 7-9) to the reported wind speeds and outdoor temperatures provided by the NRDC 30 year climate normals. For more information see Bruce Harley, CLEAResult “Infiltration Factor Calculations Methodology.doc”.918 National Climatic Data Center, calculated from 1981-2010 climate normals with a base temp of 60°F, consistent with the findings of Belzer and Cort, Pacific Northwest National Laboratory in “Statistical Analysis of Historical State-Level Residential Energy Consumption Trends,” 2004..919 Ideally, the System Efficiency should be obtained either by recording the AFUE of the unit, or performing a steady state efficiency test. The Distribution Efficiency can be estimated via a visual inspection and by referring to a look up table such as that provided by the Building Performance Institute: (http://www.bpi.org/files/pdf/DistributionEfficiencyTable-BlueSheet.pdf or by performing duct blaster testing.920 Based on average Nicor PY4 nameplate efficiencies derated by 15% for distribution losses.921 Prescriptive savings are based upon “Evaluation of the Weatherization Residential Assistance Partnership and Helps Programs (WRAP/Helps).” Middletown, CT: KEMA, 2010. Accessed July 30, 2015,
IL TRM v6.0 Vol. 3_January 25th, 2017_DRAFT Page 270 of 296
For example, a 2 story single family home in Chicago with a gas furnace with system efficiency of 70%, has pre and post blower door test results of 3,400 and 2,250:
ΔTherms = ((3,400 – 2,250)/19.4) * 60 * 24 * 5113 * 0.018) / (0.72 * 100,000)
= 109.1 therms
Illinois Statewide Technical Reference Manual – 5.6.5 High Efficiency Pool Pumps
Savings shall only be calculated via Methodology 2 if a blower door test is not feasible.
Δtherms = (Δthermsgasket * ngasket + Δthermssweep * nsweep + Δthermssealing * lfsealing + ΔthermsWX * lfWX) * ADJRxAirsealing
Where:
Δthermsgasket = Annual therm savings from installation of air sealing gasket on an electric outlet
Climate Zone(City based upon)
Δthermsgasket / gasketGas Heat
1 (Rockford) 0.492 (Chicago) 0.47
3 (Springfield) 0.414 (Belleville) 0.335 (Marion) 0.33
ngasket = Number of gaskets installed
Δthermssweep = Annual therm savings from installation of door sweep
Climate Zone(City based upon)
Δthermssweep / sweepGas Heat
1 (Rockford) 9.462 (Chicago) 9.13
3 (Springfield) 7.924 (Belleville) 6.315 (Marion) 6.45
nsweep = Number of sweeps installed
Δthermssealing = Annual therm savings from foot of caulking, sealing, or polyethlylene tape
Climate Zone(City based upon)
Δthermssealing / ftGas Heat
1 (Rockford) 0.542 (Chicago) 0.52
3 (Springfield) 0.454 (Belleville) 0.365 (Marion) 0.37
lfsealing = linear feet of caulking, sealing, or polyethylene tape
ΔthermsWX = Annual therm savings from window weatherstripping or door weatherstripping
Climate Zone(City based upon)
Δthermssx / ftGas Heat
1 (Rockford) 0.632 (Chicago) 0.61
3 (Springfield) 0.534 (Belleville) 0.425 (Marion) 0.43
(http://www.energizect.com/sites/default/files/Final%20WRAP%20%20Helps%20Report.pdf) and adjusted for relative HDD of Bridgeport/Hartford CT with the IL climate zones. See ‘Rx Airsealing HDD adjustment.xls’ for more information.
IL TRM v6.0 Vol. 3_January 25th, 2017_DRAFT Page 271 of 296

Illinois Statewide Technical Reference Manual – 5.6.5 High Efficiency Pool Pumps
lfWX = Linear feet of window weatherstripping or door weatherstripping
ADJRxAirsealing = Adjustment for air sealing savings to account for prescriptive estimates overclaiming savings922.
= 80%
WATER IMPACT DESCRIPTIONS AND CALCULATION
N/A
DEEMED O&M COST ADJUSTMENT CALCULATION
N/A
MEASURE CODE: RS-SHL-AIRS-V06-180101
REVIEW DEADLINE: 1/1/2020
922 Though we do not have a specific evaluation to point to, modeled savings have often been found to overclaim. Further VEIC reviewed these deemed estimates and consider them to likely be a high estimate. As such an 80% adjustment is applied, and this could be further refined with future evaluations.
IL TRM v6.0 Vol. 3_January 25th, 2017_DRAFT Page 272 of 296
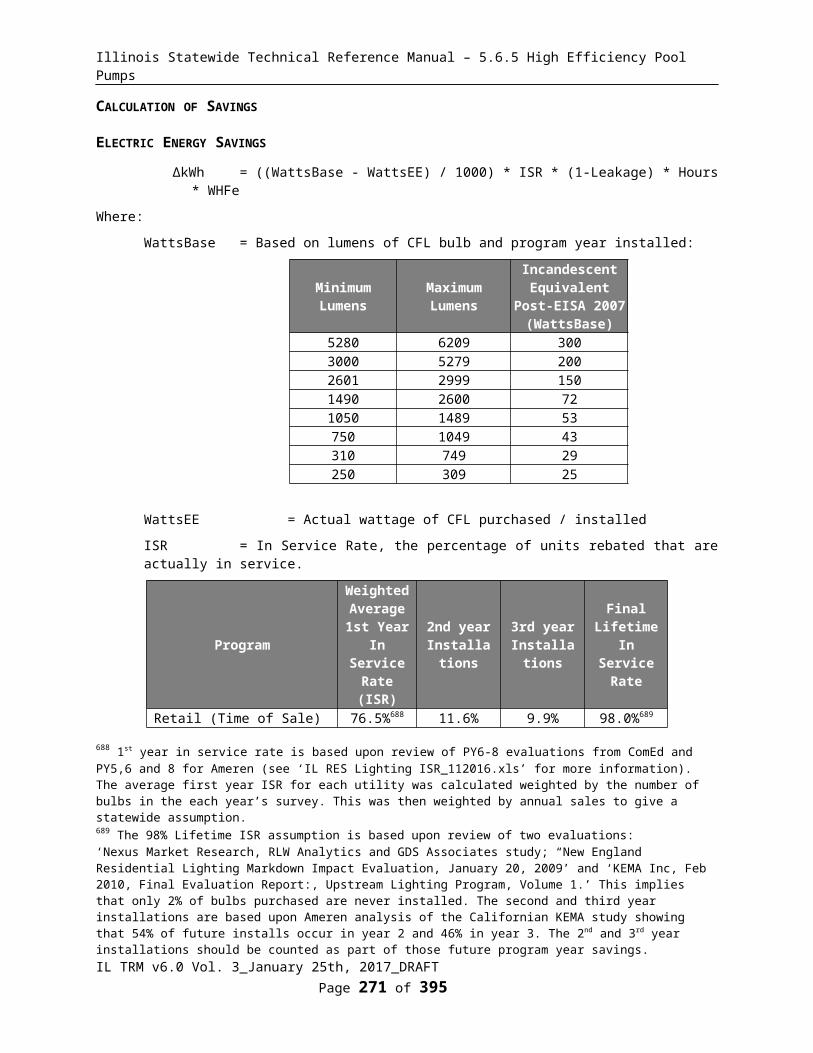
Illinois Statewide Technical Reference Manual – 5.6.5 High Efficiency Pool Pumps
5.6.2 Basement Sidewall Insulation
DESCRIPTION
Insulation is added to a basement or crawl space. Insulation added above ground in conditioned space is modeled the same as wall insulation. Below ground insulation is adjusted with an approximation of the thermal resistance of the ground. Insulation in unconditioned spaces is modeled by reducing the degree days to reflect the smaller but non-zero contribution to heating and cooling load. Cooling savings only consider above grade insulation, as below grade has little temperature difference during the cooling season.
This measure was developed to be applicable to the following program types: RF.
If applied to other program types, the measure savings should be verified.
DEFINITION OF EFFICIENT EQUIPMENT
This measure requires a member of the implementation staff or a participating contractor to evaluate the pre and post R-values and measure surface areas. The requirements for participation in the program will be defined by the utilities.
DEFINITION OF BASELINE EQUIPMENT
The existing condition will be evaluated by implementation staff or a participating contractor and is likely to be no basement wall or ceiling insulation.
DEEMED LIFETIME OF EFFICIENT EQUIPMENT
The expected measure life is assumed to be 25 years.923
DEEMED MEASURE COST
The actual installed cost for this measure should be used in screening.
DEEMED O&M COST ADJUSTMENTS
N/A
LOADSHAPE
Loadshape R08 - Residential CoolingLoadshape R09 - Residential Electric Space HeatLoadshape R10 - Residential Electric Heating and Cooling
COINCIDENCE FACTOR
The summer peak coincidence factor for cooling is provided in two different ways below. The first is used to estimate peak savings during the utility peak hour and is most indicative of actual peak benefits, and the second represents the average savings over the defined summer peak period, and is presented so that savings can be bid into PJM’s Forward Capacity Market.
CFSSP = Summer System Peak Coincidence Factor for Central A/C (during utility peak hour)
= 68%924
CFSSP = Summer System Peak Coincidence Factor for Heat Pumps (during system peak hour)
923 Measure Life Report, Residential and Commercial/Industrial Lighting and HVAC Measures, GDS Associates, 2007924 Based on metering of 24 homes with central AC during PY4 and PY5 in Ameren Illinois service territory.
IL TRM v6.0 Vol. 3_January 25th, 2017_DRAFT Page 273 of 296

Illinois Statewide Technical Reference Manual – 5.6.5 High Efficiency Pool Pumps
= 72%%925
CFPJM = PJM Summer Peak Coincidence Factor for Central A/C (average during PJM peak period)
= 46.6%926
Algorithm
CALCULATION OF SAVINGS
ELECTRIC ENERGY SAVINGS
Where available savings from shell insulation measures should be determined through a custom analysis. When that is not feasible for the program the following engineering algorithms can be used with the inclusion of an adjustment factor to de-rate the heating savings.
ΔkWh = (ΔkWh_cooling + ΔkWh_heating)
Where:
ΔkWh_cooling = If central cooling, reduction in annual cooling requirement due to insulation
= ((((1/R_old_AG - 1/(R_added+R_old_AG)) * L_basement_wall_total * H_basement_wall_AG * (1-Framing_factor)) * 24 * CDD * DUA) / (1000 * ηCool))) * ADJBasementCool
R_added = R-value of additional spray foam, rigid foam, or cavity insulation.
R_old_AG = R-value value of foundation wall above grade.
= Actual, if unknown assume 1.0927
L_basement_wall_total = Length of basement wall around the entire insulated perimeter (ft)
H_basement_wall_AG = Height of insulated basement wall above grade (ft)
Framing_factor = Adjustment to account for area of framing when cavity insulation is used
= 0% if Spray Foam or External Rigid Foam
= 25% if studs and cavity insulation928
24 = Converts hours to days
CDD = Cooling Degree Days
= Dependent on location and whether basement is conditioned:929
925 Based on analysis of metering results from 24 heat pumps in Ameren Illinois service territory in PY5 coincident with AIC’s 2010 system peak; ‘Impact and Process Evaluation of Ameren Illinois Company’s Residential HVAC Program (PY5)’.926 Based on analysis of Itron eShape data for Missouri, calibrated to Illinois loads, supplied by Ameren. The average AC load over the PJM peak period (1-5pm, M-F, June through August) is divided by the maximum AC load during the year.927 ORNL Builders Foundation Handbook, crawl space data from Table 5-5: Initial Effective R-values for Uninsulated Foundation System and Adjacent Soil, 1991, http://www.ornl.gov/sci/roofs+walls/foundation/ORNL_CON-295.pdf928 ASHRAE, 2001, “Characterization of Framing Factors for New Low-Rise Residential Building Envelopes (904-RP),” Table 7.1 929 National Climatic Data Center, calculated from 1981-2010 climate normals with a base temp of 65°F. There is a county mapping table in Volume 1, Section 3.7 providing the appropriate city to use for each county of Illinois.
IL TRM v6.0 Vol. 3_January 25th, 2017_DRAFT Page 274 of 296

Illinois Statewide Technical Reference Manual – 5.6.5 High Efficiency Pool Pumps
Climate Zone(City based upon)
Conditioned CDD 65
UnconditionedCDD 65930
1 (Rockford) 820 2632 (Chicago) 842 2813 (Springfield) 1,108 4364 (Belleville) 1,570 5385 (Marion) 1,370 570Weighted Average931 947 325
DUA = Discretionary Use Adjustment (reflects the fact that people do not always operate their AC when conditions may call for it).
= 0.75 932
1000 = Converts Btu to kBtu
ηCool = Seasonal Energy Efficiency Ratio of cooling system (kBtu/kWh)
= Actual (where it is possible to measure or reasonably estimate). If unknown assume the following:933
Age of Equipment ηCool EstimateBefore 2006 102006 - 2014 13Central AC After 1/1/2015 13Heat Pump After 1/1/2015 14
ADJBasementCool = Adjustment for cooling savings from basement wall insulation to account for prescriptive engineering algorithms overclaiming savings934.= 80%
ΔkWh_heating = If electric heat (resistance or heat pump), reduction in annual electric heating due to insulation
= ([((1/R_old_AG - 1/(R_added+R_old_AG)) * L_basement_wall_total * H_basement_wall_AG * (1-Framing_factor)) + ((1/(R_old_BG - 1/(R_added+R_old_BG)) * L_basement_wall_total * (H_basement_wall_total - H_basement_wall_AG) * (1-Framing_factor))] * 24 * HDD) / (3,412 * ηHeat)) * ADJBasementHeat
Where
R_old_BG = R-value value of foundation wall below grade (including thermal resistance of
930 Five year average cooling degree days with 75F base temp from DegreeDays.net were used in this table because the 30 year climate normals from NCDC used elsewhere are not available at base temps above 72F.931 Weighted based on number of occupied residential housing units in each zone.932 This factor's source is: Energy Center of Wisconsin, May 2008 metering study; “Central Air Conditioning in Wisconsin, A Compilation of Recent Field Research”, p31. 933 These default system efficiencies are based on the applicable minimum Federal Standards. In 2006 the Federal Standard for Central AC was adjusted. While one would expect the average system efficiency to be higher than this minimum, the likely degradation of efficiencies over time mean that using the minimum standard is appropriate.934 As demonstrated in two years of metering evaluation by Opinion Dynamics, see Memo “Results for AIC PY6 HPwES Billing Analysis”, dated February 20, 2015. TAC negotiated adjustment factor is 80%.
IL TRM v6.0 Vol. 3_January 25th, 2017_DRAFT Page 275 of 296
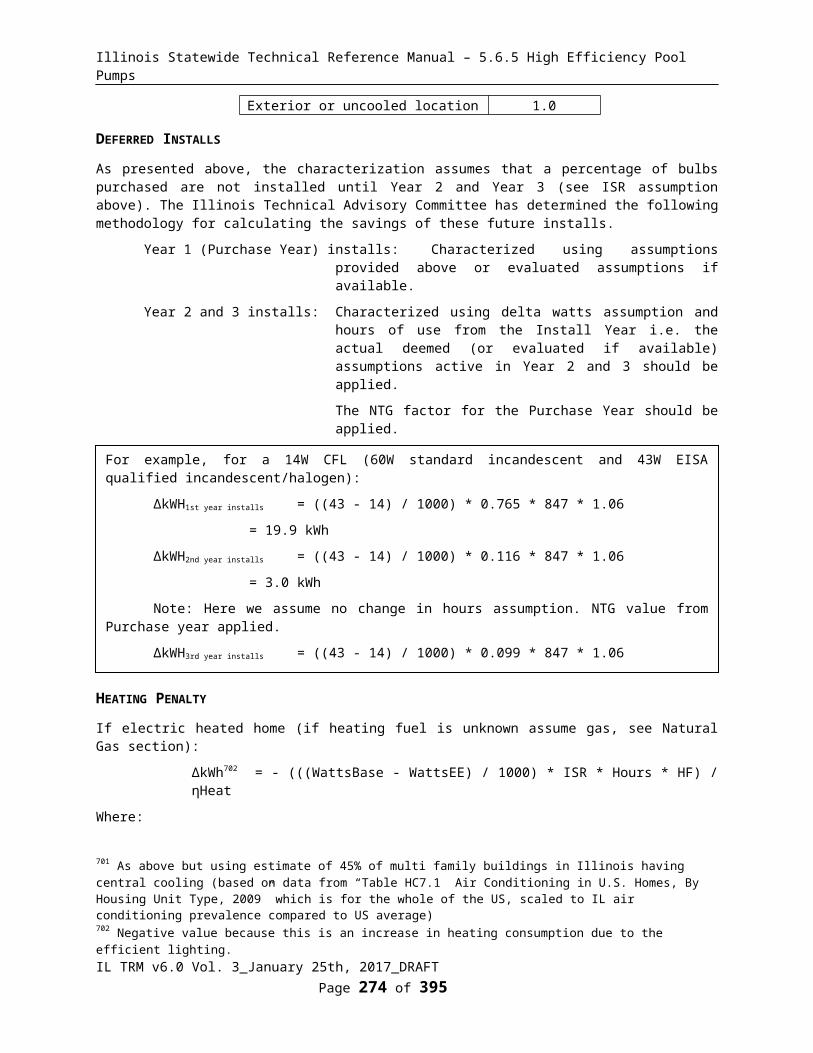
Illinois Statewide Technical Reference Manual – 5.6.5 High Efficiency Pool Pumps
the earth) 935
= dependent on depth of foundation (H_basement_wall_total – H_basement_wall_AG):
= Actual R-value of wall plus average earth R-value by depth in table below
Below Grade R-valueDepth below grade (ft) 0 1 2 3 4 5 6 7 8
Earth R-value(°F-ft2-h/Btu) 2.44 4.50 6.30 8.40 10.44 12.66 14.49 17.00 20.00
Average Earth R-value (°F-ft2-h/Btu) 2.44 3.47 4.41 5.41 6.42 7.46 8.46 9.53 10.69
Total BG R-value (earth + R-1.0 foundation) default 3.44 4.47 5.41 6.41 7.42 8.46 9.46 10.53 11.69
H_basement_wall_total = Total height of basement wall (ft)
HDD = Heating Degree Days
= dependent on location and whether basement is conditioned:936
Climate Zone(City based upon)
ConditionedHDD 60
UnconditionedHDD 50
1 (Rockford) 5,352 3,3222 (Chicago) 5,113 3,0793 (Springfield) 4,379 2,5504 (Belleville) 3,378 1,7895 (Marion) 3,438 1,796Weighted Average937 4,860 2,895
ηHeat = Efficiency of heating system
= Actual. If not available refer to default table below:938
System Type Age of Equipment HSPF Estimate
ηHeat (Effective COP Estimate)
(HSPF/3.413)*0.85
Heat Pump
Before 2006 6.8 1.7After 2006 -2014 7.7 1.92
2015 on 8.2 2.04
935 Adapted from Table 1, page 24.4, of the 1977 ASHRAE Fundamentals Handbook936 National Climatic Data Center, calculated from 1981-2010 climate normals with a base temp of 60°F for a conditioned basement and 50°F for an unconditioned basement), consistent with the findings of Belzer and Cort, Pacific Northwest National Laboratory in “Statistical Analysis of Historical State-Level Residential Energy Consumption Trends,” 2004. There is a county mapping table in Volume 1, Section 3.7 providing the appropriate city to use for each county of Illinois.937 Weighted based on number of occupied residential housing units in each zone.938 These default system efficiencies are based on the applicable minimum Federal Standards. In 2006 the Federal Standard for Heat Pumps was adjusted. While one would expect the average system efficiency to be higher than this minimum, the likely degradation of efficiencies over time means that using the minimum standard is appropriate. An 85% distribution efficiency is then applied to account for duct losses for heat pumps.
IL TRM v6.0 Vol. 3_January 25th, 2017_DRAFT Page 276 of 296
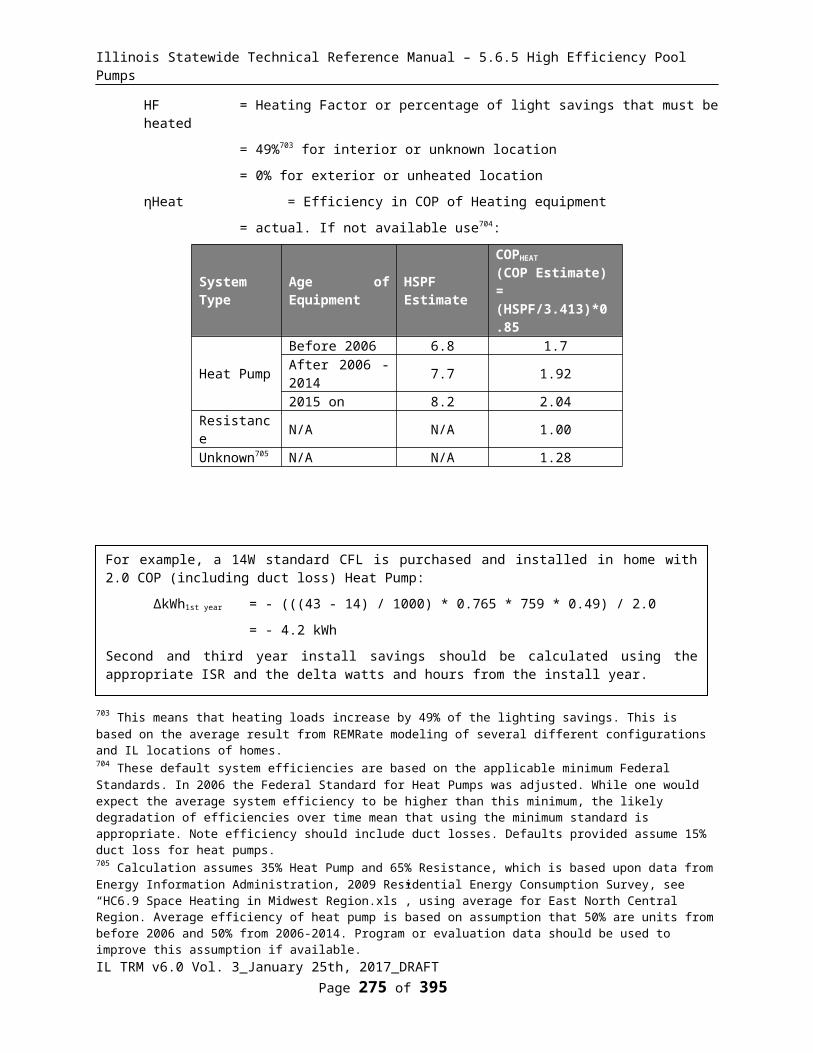
Illinois Statewide Technical Reference Manual – 5.6.5 High Efficiency Pool Pumps
System Type Age of Equipment HSPF Estimate
ηHeat (Effective COP Estimate)
(HSPF/3.413)*0.85Resistance N/A N/A 1
ADJBasementHeat = Adjustment for basement wall insulation to account for prescriptive engineering algorithms overclaiming savings939.
= 60%
ΔkWh_heating = If gas furnace heat, kWh savings for reduction in fan run time
= ΔTherms * Fe * 29.3
Fe = Furnace Fan energy consumption as a percentage of annual fuel consumption
= 3.14%940
29.3 = kWh per therm
SUMMER COINCIDENT PEAK DEMAND
ΔkW = (ΔkWh_cooling / FLH_cooling) * CF
Where:
FLH_cooling = Full load hours of air conditioning
= dependent on location941:
939 As demonstrated in two years of metering evaluation by Opinion Dynamics, see Memo “Results for AIC PY6 HPwES Billing Analysis”, dated February 20, 2015. TAC negotiated adjustment factor is 60%.940 Fe is not one of the AHRI certified ratings provided for residential furnaces, but can be reasonably estimated from a calculation based on the certified values for fuel energy (Ef in MMBtu/yr) and Eae (kWh/yr). An average of a 300 record sample (non-random) out of 1495 was 3.14%. This is, appropriately, ~50% greater than the Energy Star version 3 criteria for 2% Fe. See “Programmable Thermostats Furnace Fan Analysis.xlsx” for reference.941 Full load hours for Chicago, Moline and Rockford are provided in “Final Evaluation Report: Central Air Conditioning Efficiency
IL TRM v6.0 Vol. 3_January 25th, 2017_DRAFT Page 277 of 296
For example, a single family home in Chicago with a 20 by 25 by 7 foot R-2.25 basement, with 3 feet above grade, insulated with R-13 of interior spray foam, 10.5 SEER Central AC and 2.26 COP Heat Pump:
ΔkWh = (ΔkWh_cooling + ΔkWh_heating)
= [((((1/2.25 - 1/(13 + 2.25))*(20+25+20+25) * 3 * (1 - 0)) * 24 * 281 * 0.75)/(1000 * 10.5)) * 0.8] + [(((((1/2.25 - 1/(13 + 2.25)) * (20+25+20+25) * 3 * (1-0)) + ((1 / (2.25 + 6.42) – 1 / (13 + 2.25 + 6.42)) * (20+25+20+25) * 4 * (1-0))) * 24 * 3079) / (3412 * 1.92)) * 0.6]
= (39.4 + 860.9)
= 900.3 kWh
For example, a single family home in Chicago with a 20 by 25 by 7 foot unconditioned basement, with 3 feet above grade, insulated with R-13 of interior spray foam, and a 70% efficient furnace (for therm calculation see Natural Gas Savings section :
= 78.3 * 0.0314 * 29.3
= 72.0 kWh
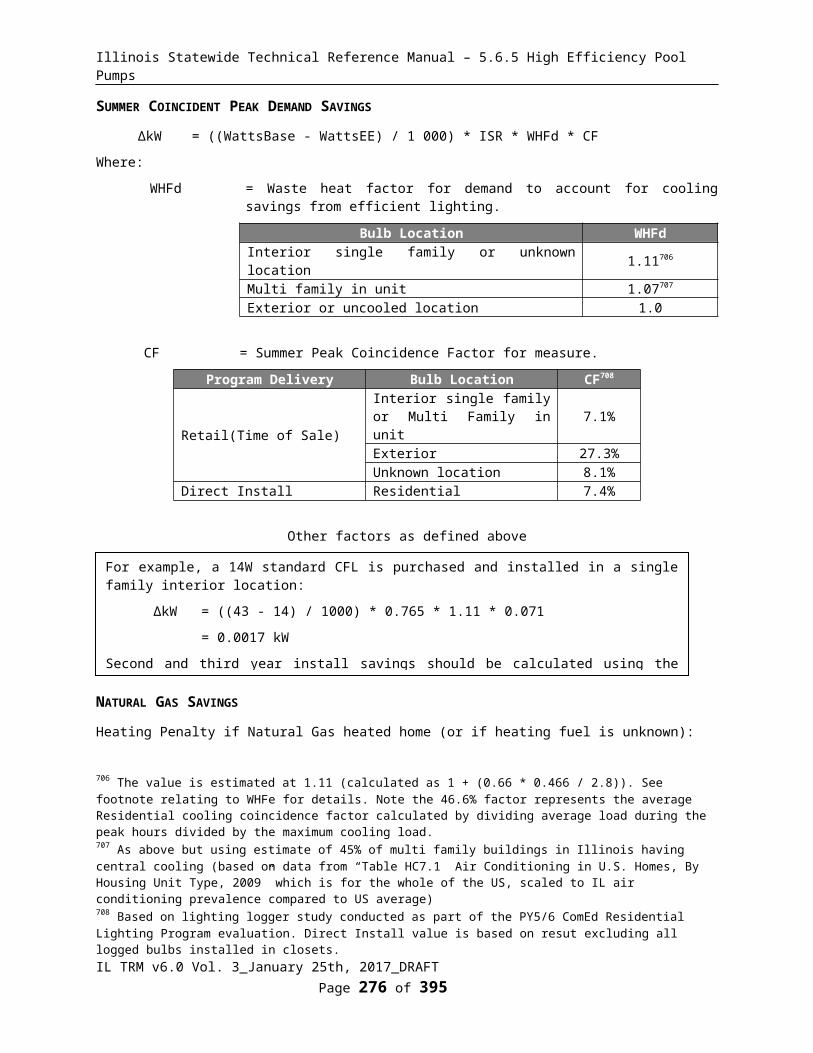
Illinois Statewide Technical Reference Manual – 5.6.5 High Efficiency Pool Pumps
Climate Zone(City based upon) Single Family Multifamily
1 (Rockford) 512 4672 (Chicago) 570 5063 (Springfield) 730 6634 (Belleville) 1,035 9405 (Marion) 903 820Weighted Average942 629 564
CFSSP = Summer System Peak Coincidence Factor for Central A/C (during system peak hour)
= 68%943
CFSSP = Summer System Peak Coincidence Factor for Heat Pumps (during system peak hour)
= 72%%944
CFPJM = PJM Summer Peak Coincidence Factor for Central A/C (average during peak period)
= 46.6%945
NATURAL GAS SAVINGS
If Natural Gas heating:
ΔTherms = [(([((1/R_old_AG - 1/(R_added+R_old_AG)) * L_basement_wall_total * H_basement_wall_AG * (1-Framing_factor) + (1/(R_old_BG - 1/(R_added+R_old_BG)) * L_basement_wall_total * (H_basement_wall_total - H_basement_wall_AG) * (1-Framing_factor)] * 24 * HDD) / (ηHeat * 100,067)] * ADJBasementHeat
ηHeat = Efficiency of heating system
= Equipment efficiency * distribution efficiency
= Actual. If unknown assume 72%946
Services (CACES), 2010, Navigant Consulting”, http://ilsagfiles.org/SAG_files/Evaluation_Documents/ComEd/ComEd%20EPY2%20Evaluation%20Reports/ComEd_Central_AC_Efficiency_Services_PY2_Evaluation_Report_Final.pdf, p.33. An average FLH/Cooling Degree Day (from NCDC) ratio was calculated for these locations and applied to the CDD of the other locations in order to estimate FLH. There is a county mapping table in Volume 1, Section 3.7 providing the appropriate city to use for each county of Illinois.942 Weighted based on number of occupied residential housing units in each zone.943 Based on metering of 24 homes with central AC during PY4 and PY5 in Ameren Illinois service territory.944 Based on analysis of metering results from 24 heat pumps in Ameren Illinois service territory in PY5 coincident with AIC’s 2010 system peak; ‘Impact and Process Evaluation of Ameren Illinois Company’s Residential HVAC Program (PY5)’.945 Based on analysis of Itron eShape data for Missouri, calibrated to Illinois loads, supplied by Ameren. The average AC load over the PJM peak period (1-5pm, M-F, June through August) is divided by the maximum AC load during the year.946 Based on average Nicor PY4 nameplate efficiencies derated by 15% for distribution losses.
IL TRM v6.0 Vol. 3_January 25th, 2017_DRAFT Page 278 of 296
For example, a single family home in Chicago with a 20 by 25 by 7 foot unconditioned basement, with 3 feet above grade, insulated with R-13 of interior spray foam, 10.5 SEER Central AC and 2.26 COP Heat Pump:
ΔkWSSP = 39.4 / 570 * 0.68
= 0.047 kW
ΔkWPJM = 39.4 / 570 * 0.466
= 0.032 kW
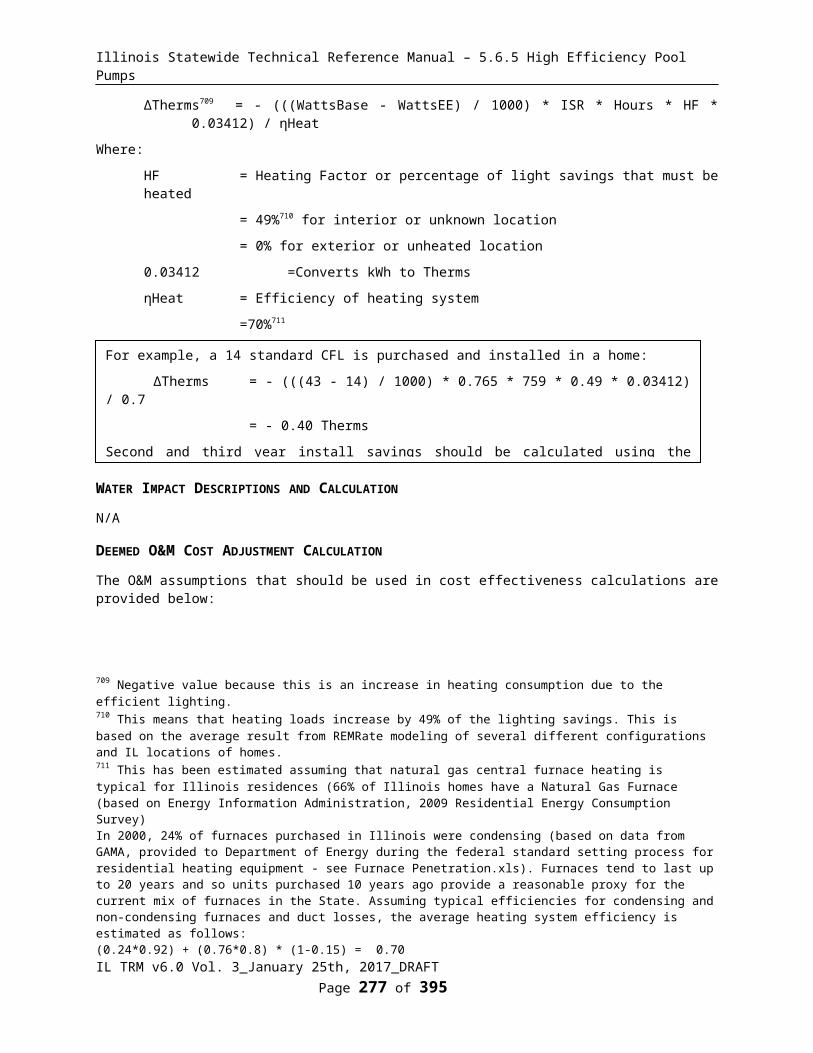
Illinois Statewide Technical Reference Manual – 5.6.5 High Efficiency Pool Pumps
Other factors as defined above
WATER IMPACT DESCRIPTIONS AND CALCULATION
N/A
DEEMED O&M COST ADJUSTMENT CALCULATION
N/A
MEASURE CODE: RS-SHL-BINS-V08-180101
REVIEW DEADLINE: 1/1/2020
IL TRM v6.0 Vol. 3_January 25th, 2017_DRAFT Page 279 of 296
For example, a single family home in Chicago with a 20 by 25 by 7 foot R-2.25 basement, with 3 feet above grade, insulated with R-13 of interior spray foam, and a 72% efficient furnace:
= ((1/2.25 - 1/(13 + 2.25)) * (20+25+20+25) * 3 * (1-0) + (1/8.67 - 1/(13 + 8.67)) * (20+25+20+25) * 4 * (1 - 0)) * 24 * 3079) / (0.72 * 100,067) * 0.60
= 78.3 therms

Illinois Statewide Technical Reference Manual – 5.6.5 High Efficiency Pool Pumps
5.6.3 Floor Insulation Above Crawlspace
DESCRIPTION
Insulation is added to the floor above a vented crawl space that does not contain pipes or HVAC equipment. If there are pipes, HVAC, or a basement, it is desirable to keep them within the conditioned space by insulating the crawl space walls and ground. Insulating the floor separates the conditioned space above from the space below the floor, and is only acceptable when there is nothing underneath that could freeze or would operate less efficiently in an environment resembling the outdoors. Even in the case of an empty, unvented crawl space, it is still considered best practice to seal and insulate the crawl space perimeter rather than the floor. Not only is there generally less area to insulate this way, but there are also moisture control benefits. There is a “Basement Insulation” measure for perimeter sealing and insulation. This measure assumes the insulation is installed above an unvented crawl space and should not be used in other situations.
This measure was developed to be applicable to the following program types: RF.
If applied to other program types, the measure savings should be verified.
DEFINITION OF EFFICIENT EQUIPMENT
This measure requires a member of the implementation staff or a participating contractor to evaluate the pre and post R-values and measure surface areas. The requirements for participation in the program will be defined by the utilities.
DEFINITION OF BASELINE EQUIPMENT
The existing condition will be evaluated by implementation staff or a participating contractor and is likely to be no insulation on any surface surrounding a crawl space.
DEEMED LIFETIME OF EFFICIENT EQUIPMENT
The expected measure life is assumed to be 25 years.947
DEEMED MEASURE COST
The actual installed cost for this measure should be used in screening.
DEEMED O&M COST ADJUSTMENTS
N/A
LOADSHAPE
Loadshape R08 - Residential CoolingLoadshape R09 - Residential Electric Space HeatLoadshape R10 - Residential Electric Heating and Cooling
COINCIDENCE FACTOR
The summer peak coincidence factor for cooling is provided in two different ways below. The first is used to estimate peak savings during the utility peak hour and is most indicative of actual peak benefits, and the second represents the average savings over the defined summer peak period, and is presented so that savings can be bid into PJM’s Forward Capacity Market.
CFSSP = Summer System Peak Coincidence Factor for Central A/C (during utility peak hour)
947 Measure Life Report, Residential and Commercial/Industrial Lighting and HVAC Measures, GDS Associates, 2007
IL TRM v6.0 Vol. 3_January 25th, 2017_DRAFT Page 280 of 296

Illinois Statewide Technical Reference Manual – 5.6.5 High Efficiency Pool Pumps
= 68%948
CFSSP = Summer System Peak Coincidence Factor for Heat Pumps (during system peak hour)
= 72%%949
CFPJM = PJM Summer Peak Coincidence Factor for Central A/C (average during PJM peak period)
= 46.6%950
Algorithm
CALCULATION OF SAVINGS
ELECTRIC ENERGY SAVINGS
Where available savings from shell insulation measures should be determined through a custom analysis. When that is not feasible for the program the following engineering algorithms can be used with the inclusion of an adjustment factor to de-rate the heating savings.
ΔkWh = (ΔkWh_cooling + ΔkWh_heating)
Where:
ΔkWh_cooling = If central cooling, reduction in annual cooling requirement due to insulation
= ((((1/R_old - 1/(R_added+R_old)) * Area * (1-Framing_factor)) * 24 * CDD * DUA) / (1000 * ηCool))) * ADJFloorCool
R_old = R-value value of floor before insulation, assuming 3/4” plywood subfloor and carpet with pad
= Actual. If unknown assume 3.96 951
R_added = R-value of additional spray foam, rigid foam, or cavity insulation.
Area = Total floor area to be insulated
Framing_factor = Adjustment to account for area of framing
= 12% 952
24 = Converts hours to days
CDD = Cooling Degree Days
Climate Zone(City based upon)
UnconditionedCDD953
1 (Rockford) 263
948 Based on metering of 24 homes with central AC during PY4 and PY5 in Ameren Illinois service territory.949 Based on analysis of metering results from 24 heat pumps in Ameren Illinois service territory in PY5 coincident with AIC’s 2010 system peak; ‘Impact and Process Evaluation of Ameren Illinois Company’s Residential HVAC Program (PY5)’.950 Based on analysis of Itron eShape data for Missouri, calibrated to Illinois loads, supplied by Ameren. The average AC load over the PJM peak period (1-5pm, M-F, June through August) is divided by the maximum AC load during the year.951 Based on 2005 ASHRAE Handbook – Fundamentals: assuming 2x8 joists, 16” OC, ¾” subfloor, ½” carpet with rubber pad, and accounting for a still air film above and below: 1/ [(0.85 cavity share of area / (0.68 + 0.94 + 1.23 + 0.68)) + (0.15 framing share / (0.68 + 7.5” * 1.25 R/in + 0.94 + 1.23 + 0.68))] = 3.96952 ASHRAE, 2001, “Characterization of Framing Factors for New Low-Rise Residential Building Envelopes (904-RP),” Table 7.1 953 Five year average cooling degree days with 75F base temp from DegreeDays.net were used in this table because the 30 year climate normals from NCDC used elsewhere are not available at base temps above 72F.
IL TRM v6.0 Vol. 3_January 25th, 2017_DRAFT Page 281 of 296

Illinois Statewide Technical Reference Manual – 5.6.5 High Efficiency Pool Pumps
Climate Zone(City based upon)
UnconditionedCDD
2 (Chicago) 2813 (Springfield) 4364 (Belleville) 5385 (Marion) 570Weighted Average954 325
DUA = Discretionary Use Adjustment (reflects the fact that people do not always operate their AC when conditions may call for it).
= 0.75 955
1000 = Converts Btu to kBtu
ηCool = Seasonal Energy Efficiency Ratio of cooling system (kBtu/kWh)
= Actual (where it is possible to measure or reasonably estimate). If unknown assume the following:956
Age of Equipment ηCool EstimateBefore 2006 102006 - 2014 13Central AC After 1/1/2015 13Heat Pump After 1/1/2015 14
ADJFloorCool = Adjustment for cooling savings from floor to account for prescriptive engineering algorithms overclaiming savings957.
= 80%
ΔkWh_heating = If electric heat (resistance or heat pump), reduction in annual electric heating due to insulation
= ((((1/R_old - 1/(R_added + R_old)) * Area * (1-Framing_factor) * 24 * HDD)/ (3,412 * ηHeat)) * ADJFloorHeat
HDD = Heating Degree Days:958
Climate Zone(City based upon)
Unconditioned HDD
1 (Rockford) 3,322
954 Weighted based on number of occupied residential housing units in each zone.955 Energy Center of Wisconsin, May 2008 metering study; “Central Air Conditioning in Wisconsin, A Compilation of Recent Field Research”, p31. 956 These default system efficiencies are based on the applicable minimum Federal Standards. In 2006 the Federal Standard for Central AC was adjusted. While one would expect the average system efficiency to be higher than this minimum, the likely degradation of efficiencies over time mean that using the minimum standard is appropriate.957 As demonstrated in two years of metering evaluation by Opinion Dynamics, see Memo “Results for AIC PY6 HPwES Billing Analysis”, dated February 20, 2015. TAC negotiated adjustment factor is 80%.958 National Climatic Data Center, Heating Degree Days with a base temp of 50°F to account for lower impact of unconditioned space on heating system. There is a county mapping table in Volume 1, Section 3.7 providing the appropriate city to use for each county of Illinois.
IL TRM v6.0 Vol. 3_January 25th, 2017_DRAFT Page 282 of 296
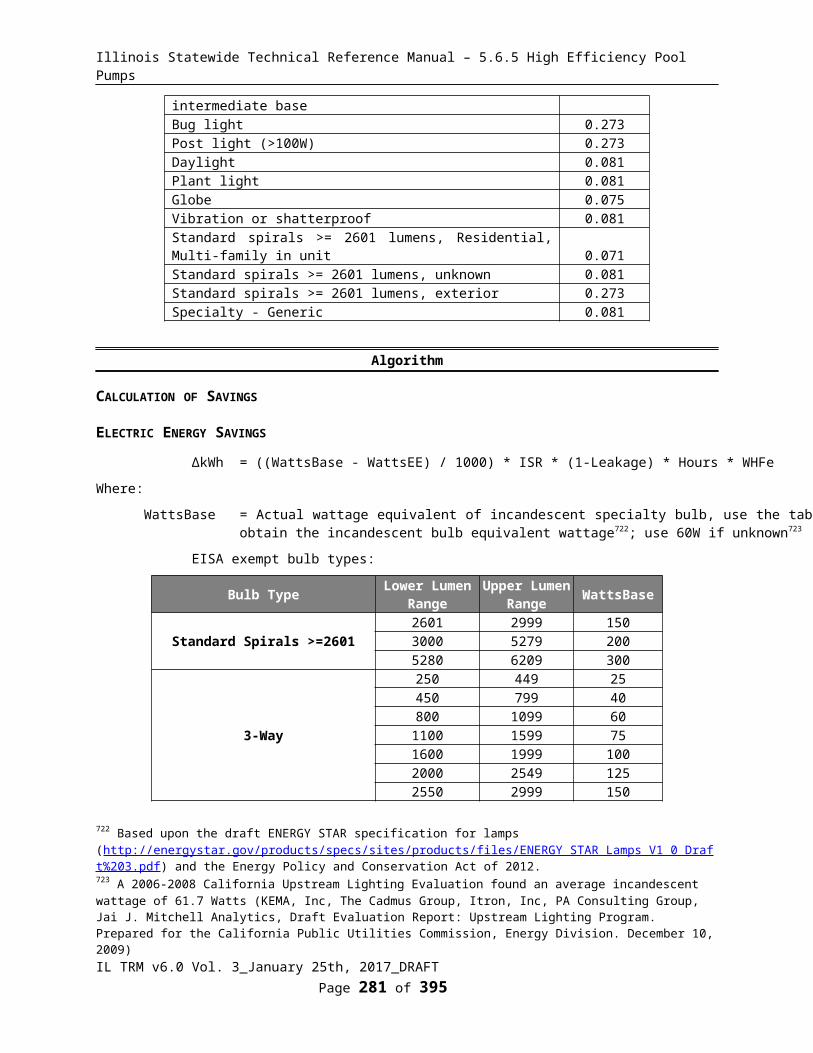
Illinois Statewide Technical Reference Manual – 5.6.5 High Efficiency Pool Pumps
2 (Chicago) 3,0793 (Springfield) 2,5504 (Belleville) 1,7895 (Marion) 1,796Weighted Average959 2,895
ηHeat = Efficiency of heating system
= Actual. If not available refer to default table below:960
System Type Age of Equipment HSPF Estimate
ηHeat (Effective COP Estimate)
(HSPF/3.413)*0.85
Heat PumpBefore 2006 6.8 1.72006 - 2014 7.7 1.922015 on 8.2 2.04
Resistance N/A N/A 1
ADJFloorHeat = Adjustment for floor insulation to account for prescriptive engineering algorithms overclaiming savings961.
= 60%
Other factors as defined above
ΔkWh_heating = If gas furnace heat, kWh savings for reduction in fan run time
= ΔTherms * Fe * 29.3
Fe = Furnace Fan energy consumption as a percentage of annual fuel consumption
= 3.14%962
959 Weighted based on number of occupied residential housing units in each zone.960 These default system efficiencies are based on the applicable minimum Federal Standards. In 2006 the Federal Standard for Heat Pumps was adjusted. While one would expect the average system efficiency to be higher than this minimum, the likely degradation of efficiencies over time means that using the minimum standard is appropriate. An 85% distribution efficiency is then applied to account for duct losses for heat pumps.961 As demonstrated in two years of metering evaluation by Opinion Dynamics, see Memo “Results for AIC PY6 HPwES Billing Analysis”, dated February 20, 2015. TAC negotiated adjustment factor is 60%.962 Fe is not one of the AHRI certified ratings provided for residential furnaces, but can be reasonably estimated from a calculation based on the certified values for fuel energy (Ef in MMBtu/yr) and Eae (kWh/yr). An average of a 300 record sample (non-random) out of 1495 was 3.14%. This is, appropriately, ~50% greater than the Energy Star version 3 criteria for 2% Fe. See
IL TRM v6.0 Vol. 3_January 25th, 2017_DRAFT Page 283 of 296
For example, a single family home in Chicago with a 20 by 25 footprint, insulated with R-30 spray foam above the crawlspace, a 10.5 SEER Central AC and a newer heat pump:
ΔkWh = (ΔkWh_cooling + ΔkWh_heating)
= ((((1/3.96 -1/(30+3.96))*(20*25)*(1-0.12)* 24 * 281*0.75)/(1000*10.5)) * 0.8 + (((1/3.96 -1/(30+3.96))*(20*25)*(1-0.15) * 24 * 3079)/(3412*1.92)) * 0.6)
= (37.8 + 641.7)
= 679.5 kWh

Illinois Statewide Technical Reference Manual – 5.6.5 High Efficiency Pool Pumps
29.3 = kWh per therm
SUMMER COINCIDENT PEAK DEMAND SAVINGS
ΔkW = (ΔkWh_cooling / FLH_cooling) * CF
Where:
FLH_cooling = Full load hours of air conditioning
= Dependent on location:963
Climate Zone(City based upon) Single Family Multifamily
1 (Rockford) 512 4672 (Chicago) 570 5063 (Springfield) 730 6634 (Belleville) 1,035 9405 (Marion) 903 820Weighted Average964 629 564
CFSSP = Summer System Peak Coincidence Factor for Central A/C (during system peak hour)
= 68%965
CFSSP = Summer System Peak Coincidence Factor for Heat Pumps (during system peak hour)
= 72%%966
CFPJM = PJM Summer Peak Coincidence Factor for Central A/C (average during peak period)
= 46.6%967
“Programmable Thermostats Furnace Fan Analysis.xlsx” for reference.963 Full load hours for Chicago, Moline and Rockford are provided in “Final Evaluation Report: Central Air Conditioning Efficiency Services (CACES), 2010, Navigant Consulting”, p.33. An average FLH/Cooling Degree Day (from NCDC) ratio was calculated for these locations and applied to the CDD of the other locations in order to estimate FLH. There is a county mapping table Volume 1, Section 3.7 providing the appropriate city to use for each county of Illinois.964 Weighted based on number of occupied residential housing units in each zone.965 Based on metering of 24 homes with central AC during PY4 and PY5 in Ameren Illinois service territory.966 Based on analysis of metering results from 24 heat pumps in Ameren Illinois service territory in PY5 coincident with AIC’s 2010 system peak; ‘Impact and Process Evaluation of Ameren Illinois Company’s Residential HVAC Program (PY5)’.967 Based on analysis of Itron eShape data for Missouri, calibrated to Illinois loads, supplied by Ameren. The average AC load over the PJM peak period (1-5pm, M-F, June through August) is divided by the maximum AC load during the year.
IL TRM v6.0 Vol. 3_January 25th, 2017_DRAFT Page 284 of 296
For example, a single family home in Chicago with a 20 by 25 footprint, insulated with R-30 spray foam above the crawlspace, and a 70% efficient furnace (for therm calculation see Natural Gas Savings section):
ΔkWh = 60.4 * 0.0314 * 29.3
= 55.6 kWh

Illinois Statewide Technical Reference Manual – 5.6.5 High Efficiency Pool Pumps
NATURAL GAS SAVINGS
If Natural Gas heating:
ΔTherms = (1/R_old - 1/(R_added+R_old)) * Area * (1-Framing_factor)) * 24 * HDD) / (100,000 * ηHeat) * ADJFloorHeat
Where
ηHeat = Efficiency of heating system
= Equipment efficiency * distribution efficiency
= Actual. If unknown assume 72%968
Other factors as defined above
WATER IMPACT DESCRIPTIONS AND CALCULATION
N/A
DEEMED O&M COST ADJUSTMENT CALCULATION
N/A
MEASURE CODE: RS-SHL-FINS-V08-180101
REVIEW DEADLINE: 1/1/2020
968 Based on average Nicor PY4 nameplate efficiencies derated by 15% for distribution losses.
IL TRM v6.0 Vol. 3_January 25th, 2017_DRAFT Page 285 of 296
For example, a single family home in Chicago with a 20 by 25 footprint, insulated with R-30 spray foam above the crawlspace, a 10.5 SEER Central AC and a newer heat pump:
ΔkWSSP = 37.8 / 570 * 0.68
= 0.045 kW
ΔkWSSP = 37.8 / 570 * 0.466
= 0.031 kW
For example, a single family home in Chicago with a 20 by 25 footprint, insulated with R-30 spray foam above the crawlspace, and a 72% efficient furnace:
ΔTherms = (1 / 3.96 – 1 /(30 + 3.96))*(20 * 25) * (1 - 0.12) * 24 * 3079) / (100,000 * 0.72) * 0.60
= 60.4 therms
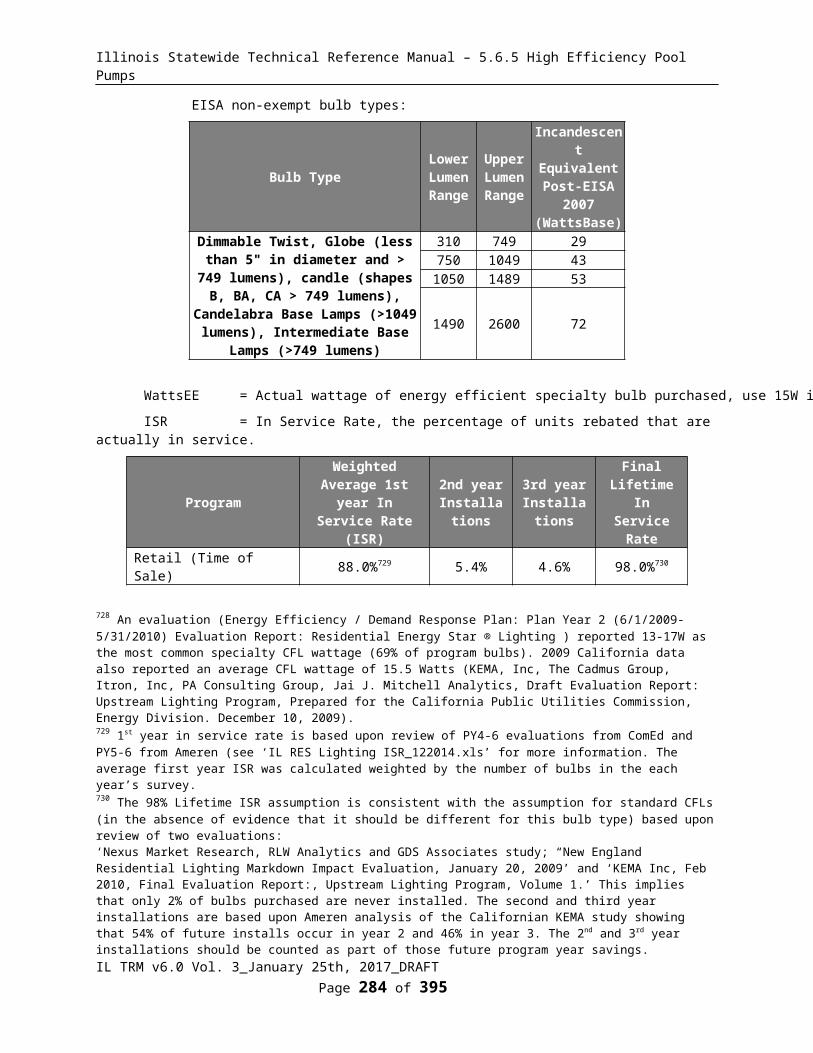
Illinois Statewide Technical Reference Manual – 5.6.5 High Efficiency Pool Pumps
5.6.4 Wall and Ceiling/Attic Insulation
DESCRIPTION
Insulation is added to wall cavities, and/or attic. This measure requires a member of the implementation staff evaluating the pre and post R-values and measure surface areas. The efficiency of the heating and cooling equipment in the home should also be evaluated if possible.
This measure was developed to be applicable to the following program types: RF.
If applied to other program types, the measure savings should be verified.
DEFINITION OF EFFICIENT EQUIPMENT
This measure requires a member of the implementation staff or a participating contractor to evaluate the pre and post R-values and measure surface areas. The requirements for participation in the program will be defined by the utilities.
DEFINITION OF BASELINE EQUIPMENT
The existing condition will be evaluated by implementation staff or a participating contractor and is likely to be empty wall cavities and little or no attic insulation.
DEEMED LIFETIME OF EFFICIENT EQUIPMENT
The expected measure life is assumed to be 25 years.969
DEEMED MEASURE COST
The actual installed cost for this measure should be used in screening.
LOADSHAPE
Loadshape R08 - Residential CoolingLoadshape R09 - Residential Electric Space HeatLoadshape R10 - Residential Electric Heating and Cooling
COINCIDENCE FACTOR
The summer peak coincidence factor for cooling is provided in two different ways below. The first is used to estimate peak savings during the utility peak hour and is most indicative of actual peak benefits, and the second represents the average savings over the defined summer peak period, and is presented so that savings can be bid into PJM’s Forward Capacity Market.
CFSSP = Summer System Peak Coincidence Factor for Central A/C (during utility peak hour)
= 68%970
CFSSP = Summer System Peak Coincidence Factor for Heat Pumps (during system peak hour)
= 72%%971
CFPJM = PJM Summer Peak Coincidence Factor for Central A/C (average during PJM peak period)
969 Measure Life Report, Residential and Commercial/Industrial Lighting and HVAC Measures, GDS Associates, 2007970 Based on metering of 24 homes with central AC during PY4 and PY5 in Ameren Illinois service territory.971 Based on analysis of metering results from 24 heat pumps in Ameren Illinois service territory in PY5 coincident with AIC’s 2010 system peak; ‘Impact and Process Evaluation of Ameren Illinois Company’s Residential HVAC Program (PY5)’.
IL TRM v6.0 Vol. 3_January 25th, 2017_DRAFT Page 286 of 296

Illinois Statewide Technical Reference Manual – 5.6.5 High Efficiency Pool Pumps
= 46.6%972
Algorithm
CALCULATION OF SAVINGS
ELECTRIC ENERGY SAVINGS
Where available savings from shell insulation measures should be determined through a custom analysis. When that is not feasible for the program the following engineering algorithms can be used with the inclusion of an adjustment factor to de-rate the heating savings.
ΔkWh = (ΔkWh_cooling + ΔkWh_heating)
Where
ΔkWh_cooling = If central cooling, reduction in annual cooling requirement due to insulation
= ((((1/R_old - 1/R_wall) * A_wall * (1-Framing_factor_wall) + (1/R_old - 1/R_attic) * A_attic * (1-Framing_factor_attic)) * 24 * CDD * DUA) / (1000 * ηCool)) * ADJWallAtticCool
R_wall = R-value of new wall assembly (including all layers between inside air and outside air).
R_attic = R-value of new attic assembly (including all layers between inside air and outside air).
R_old = R-value value of existing assemble and any existing insulation.
(Minimum of R-5 for uninsulated assemblies973)
A_wall = Net area of insulated wall (ft2)
A_attic = Total area of insulated ceiling/attic (ft2)
Framing_factor_wall = Adjustment to account for area of framing
= 25%974
Framing_factor_attic = Adjustment to account for area of framing
= 7%975
24 = Converts hours to days
CDD = Cooling Degree Days
= dependent on location:976
Climate Zone(City based upon)
CDD 65
1 (Rockford) 8202 (Chicago) 8423 (Springfield) 1,108
972 Based on analysis of Itron eShape data for Missouri, calibrated to Illinois loads, supplied by Ameren. The average AC load over the PJM peak period (1-5pm, M-F, June through August) is divided by the maximum AC load during the year.973 An estimate based on review of Madison Gas and Electric, Exterior Wall Insulation, R-value for no insulation in walls, and NREL's Building Energy Simulation Test for Existing Homes (BESTEST-EX).974 ASHRAE, 2001, “Characterization of Framing Factors for New Low-Rise Residential Building Envelopes (904-RP),” Table 7.1975 Ibid.976 National Climatic Data Center, Cooling Degree Days are based on a base temp of 65°F. There is a county mapping table Volume 1, Section 3.7 providing the appropriate city to use for each county of Illinois.
IL TRM v6.0 Vol. 3_January 25th, 2017_DRAFT Page 287 of 296
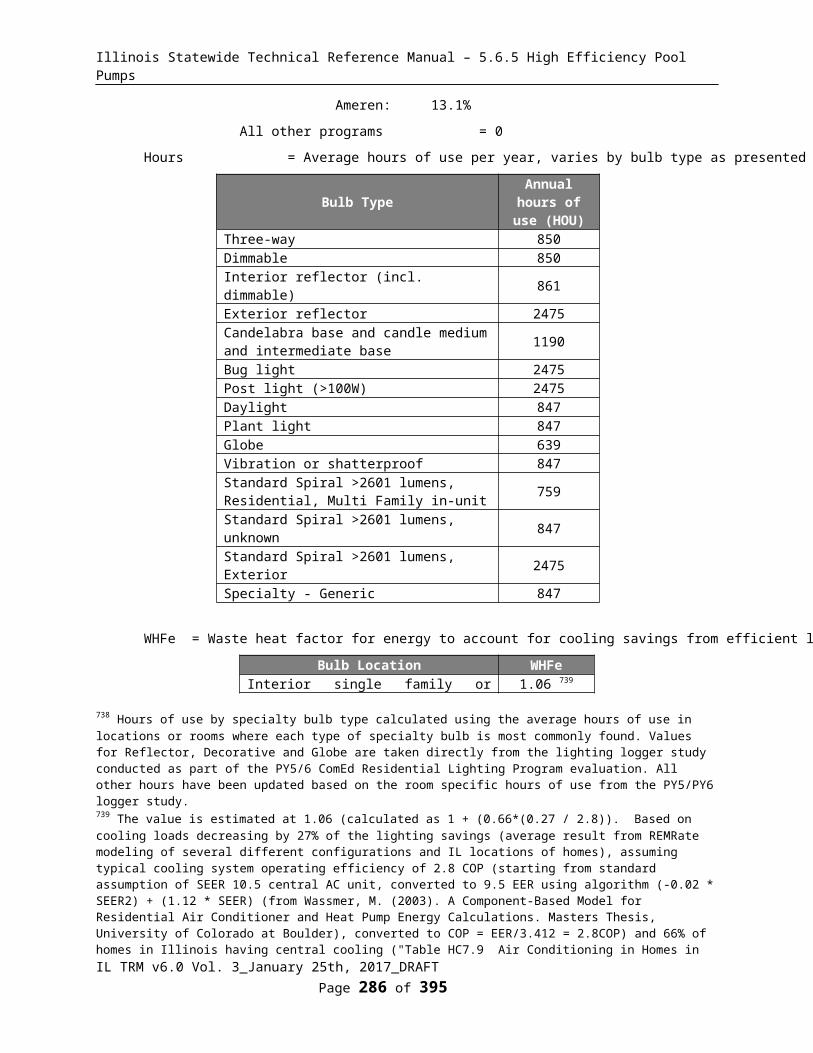
Illinois Statewide Technical Reference Manual – 5.6.5 High Efficiency Pool Pumps
Climate Zone(City based upon)
CDD 65
4 (Belleville) 1,5705 (Marion) 1,370Weighted Average977 947
DUA = Discretionary Use Adjustment (reflects the fact that people do not always operate their AC when conditions may call for it).
= 0.75 978
1000 = Converts Btu to kBtu
ηCool = Seasonal Energy Efficiency Ratio of cooling system (kBtu/kWh)
= Actual (where it is possible to measure or reasonably estimate). If unknown assume the following:979
Age of Equipment ηCool EstimateBefore 2006 102006 - 2014 13Central AC After 1/1/2015 13Heat Pump After 1/1/2015 14
ADJWallAtticCool = Adjustment for cooling savings from basement wall insulation to account for prescriptive engineering algorithms overclaiming savings980.
= 80%
kWh_heating = If electric heat (resistance or heat pump), reduction in annual electric heating due to insulation
= ((((1/R_old - 1/R_wall) * A_wall * (1-Framing_factor_wall)) + (1/R_old - 1/R_attic) * A_attic * (1-Framing_factor_attic)) * 24 * HDD] / (ηHeat * 3412)) * ADJWallAtticHeat
HDD = Heating Degree Days
= Dependent on location:981
Climate Zone(City based upon)
HDD 60
1 (Rockford) 5,352
977 Weighted based on number of occupied residential housing units in each zone.978 This factor's source is: Energy Center of Wisconsin, May 2008 metering study; “Central Air Conditioning in Wisconsin, A Compilation of Recent Field Research”, p31. 979 These default system efficiencies are based on the applicable minimum Federal Standards. In 2006 the Federal Standard for Central AC was adjusted. While one would expect the average system efficiency to be higher than this minimum, the likely degradation of efficiencies over time mean that using the minimum standard is appropriate.980 As demonstrated in two years of metering evaluation by Opinion Dynamics, see Memo “Results for AIC PY6 HPwES Billing Analysis”, dated February 20, 2015. TAC negotiated adjustment factor is 80%.981 National Climatic Data Center, calculated from 1981-2010 climate normals with a base temp of 60°F, consistent with the findings of Belzer and Cort, Pacific Northwest National Laboratory in “Statistical Analysis of Historical State-Level Residential Energy Consumption Trends,” 2004. There is a county mapping table in Volume 1, Section 3.7 providing the appropriate city to use for each county of Illinois.
IL TRM v6.0 Vol. 3_January 25th, 2017_DRAFT Page 288 of 296
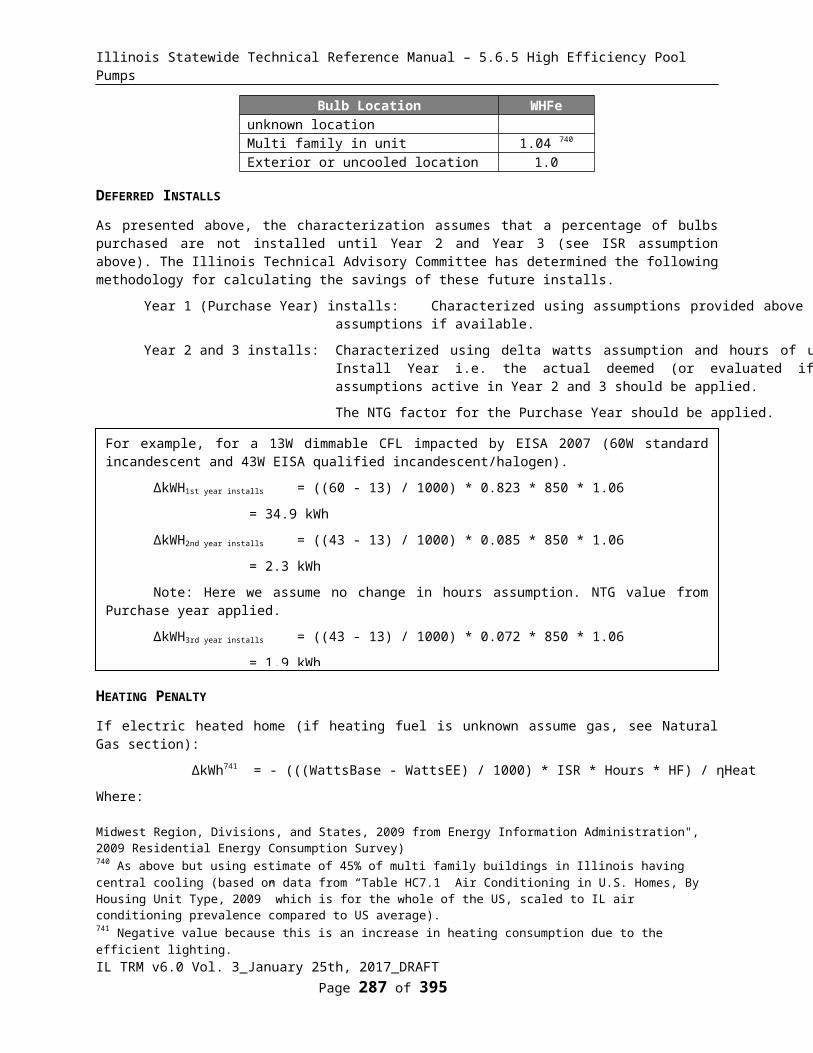
Illinois Statewide Technical Reference Manual – 5.6.5 High Efficiency Pool Pumps
Climate Zone(City based upon)
HDD 60
2 (Chicago) 5,1133 (Springfield) 4,3794 (Belleville) 3,3785 (Marion) 3,438Weighted Average982 4,860
ηHeat = Efficiency of heating system
= Actual. If not available refer to default table below:983
System TypeAge of
EquipmentHSPF
Estimate
ηHeat (Effective COP Estimate)
(HSPF/3.413)*0.85
Heat PumpBefore 2006 6.8 1.72006 - 2014 7.7 1.922015 on 8.2 2.04
Resistance N/A N/A 1
3412 = Converts Btu to kWh
ADJWallAtticHeat = Adjustment for wall and attic insulation to account for prescriptive engineering algorithms overclaiming savings984.
= 60%
ΔkWh_heating = If gas furnace heat, kWh savings for reduction in fan run time
= ΔTherms * Fe * 29.3
Fe = Furnace Fan energy consumption as a percentage of annual fuel consumption
982 Weighted based on number of occupied residential housing units in each zone.983 These default system efficiencies are based on the applicable minimum Federal Standards. In 2006 the Federal Standard for Heat Pumps was adjusted. While one would expect the average system efficiency to be higher than this minimum, the likely degradation of efficiencies over time means that using the minimum standard is appropriate. An 85% distribution efficiency is then applied to account for duct losses for heat pumps.984 As demonstrated in two years of metering evaluation by Opinion Dynamics, see Memo “Results for AIC PY6 HPwES Billing Analysis”, dated February 20, 2015. TAC negotiated adjustment factor is 60%.
IL TRM v6.0 Vol. 3_January 25th, 2017_DRAFT Page 289 of 296
For example, a single family home in Chicago with 990 ft2 of R-5 walls insulated to R-11 and 700 ft2 of R-5 attic insulated to R-38, 10.5 SEER Central AC and 2.26 (1.92 including distribution losses) COP Heat Pump:
ΔkWh = (ΔkWh_cooling + ΔkWh_heating)
= (((((1/5 - 1/11) * 990 * (1-0.25)) + ((1/5 - 1/38) * 700 * (1-0.07))) * 842 * 0.75 * 24)/ (1000 * 10.5)) * 0.8) + ((((((1/5 - 1/11) * 990 * (1-0.25)) + ((1/5 - 1/38) * 700 * (1-0.07))) * 5113 * 24) / (1.92 * 3412)) * 0.6)
= 224 + 2181
= 2405 kWh
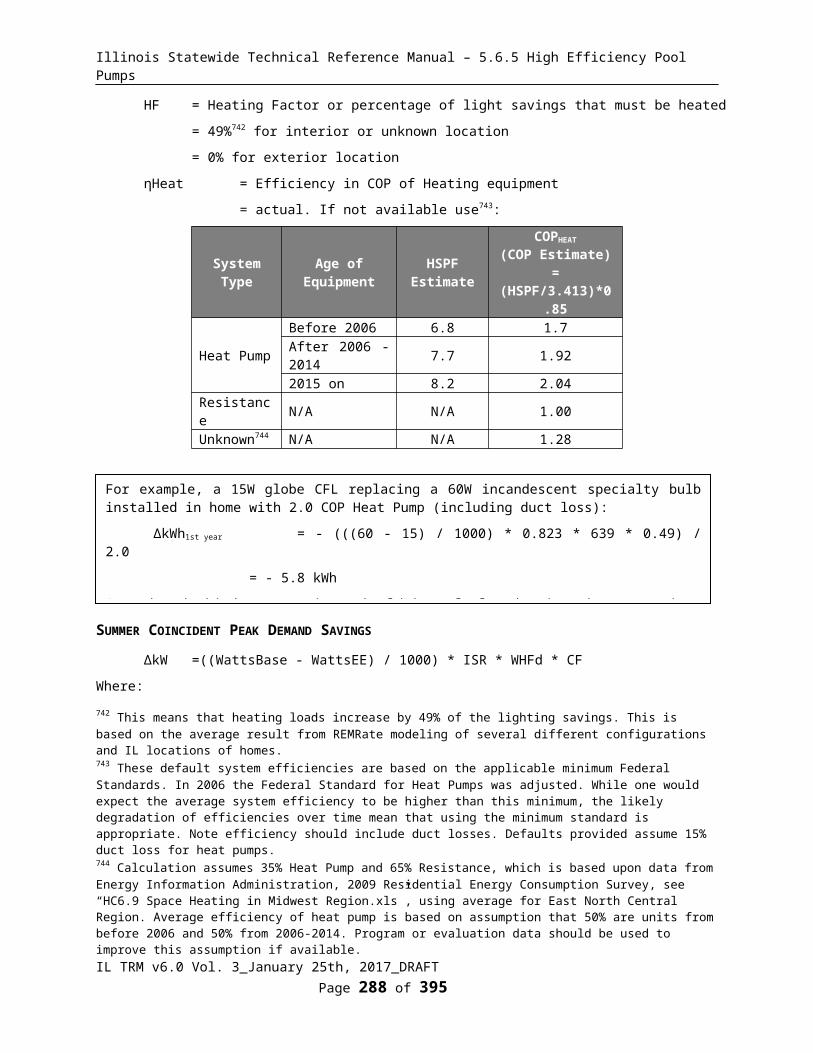
Illinois Statewide Technical Reference Manual – 5.6.5 High Efficiency Pool Pumps
= 3.14%985
29.3 = kWh per therm
SUMMER COINCIDENT PEAK DEMAND SAVINGS
ΔkW = (ΔkWh_cooling / FLH_cooling) * CF
Where:
FLH_cooling = Full load hours of air conditioning
= Dependent on location as below:986
Climate Zone(City based upon)
Single Family Multifamily
1 (Rockford) 512 4672 (Chicago) 570 5063 (Springfield) 730 6634 (Belleville) 1,035 9405 (Marion) 903 820Weighted Average987 629 564
CFSSP = Summer System Peak Coincidence Factor for Central A/C (during system peak hour)
= 68%988
CFSSP = Summer System Peak Coincidence Factor for Heat Pumps (during system peak hour)
72%%989
CFPJM = PJM Summer Peak Coincidence Factor for Central A/C (average during peak period)
= 46.6%990
985 Fe is not one of the AHRI certified ratings provided for residential furnaces, but can be reasonably estimated from a calculation based on the certified values for fuel energy (Ef in MMBtu/yr) and Eae (kWh/yr). An average of a 300 record sample (non-random) out of 1495 was 3.14%. This is, appropriately, ~50% greater than the Energy Star version 3 criteria for 2% Fe. See “Programmable Thermostats Furnace Fan Analysis.xlsx” for reference.986 Based on Full Load Hours from ENERGY Star with adjustments made in a Navigant Evaluation, other cities were scaled using those results and CDD. There is a county mapping table in Volume 1, Section 3.7 providing the appropriate city to use for each county of Illinois.987 Weighted based on number of occupied residential housing units in each zone.988 Based on metering of 24 homes with central AC during PY4 and PY5 in Ameren Illinois service territory.989 Based on analysis of metering results from 24 heat pumps in Ameren Illinois service territory in PY5 coincident with AIC’s 2010 system peak; ‘Impact and Process Evaluation of Ameren Illinois Company’s Residential HVAC Program (PY5)’.990 Based on analysis of Itron eShape data for Missouri, calibrated to Illinois loads, supplied by Ameren. The average AC load over the PJM peak period (1-5pm, M-F, June through August) is divided by the maximum AC load during the year.
IL TRM v6.0 Vol. 3_January 25th, 2017_DRAFT Page 290 of 296
For example, a single family home in Chicago with 990 ft2 of R-5 walls insulated to R-11 and 700 ft2 of R-5 attic insulated to R-38, with a gas furnace with system efficiency of 66% (for therm calculation see Natural Gas Savings section):
ΔkWh = 216.4 * 0.0314 * 29.3
= 199.1 kWh
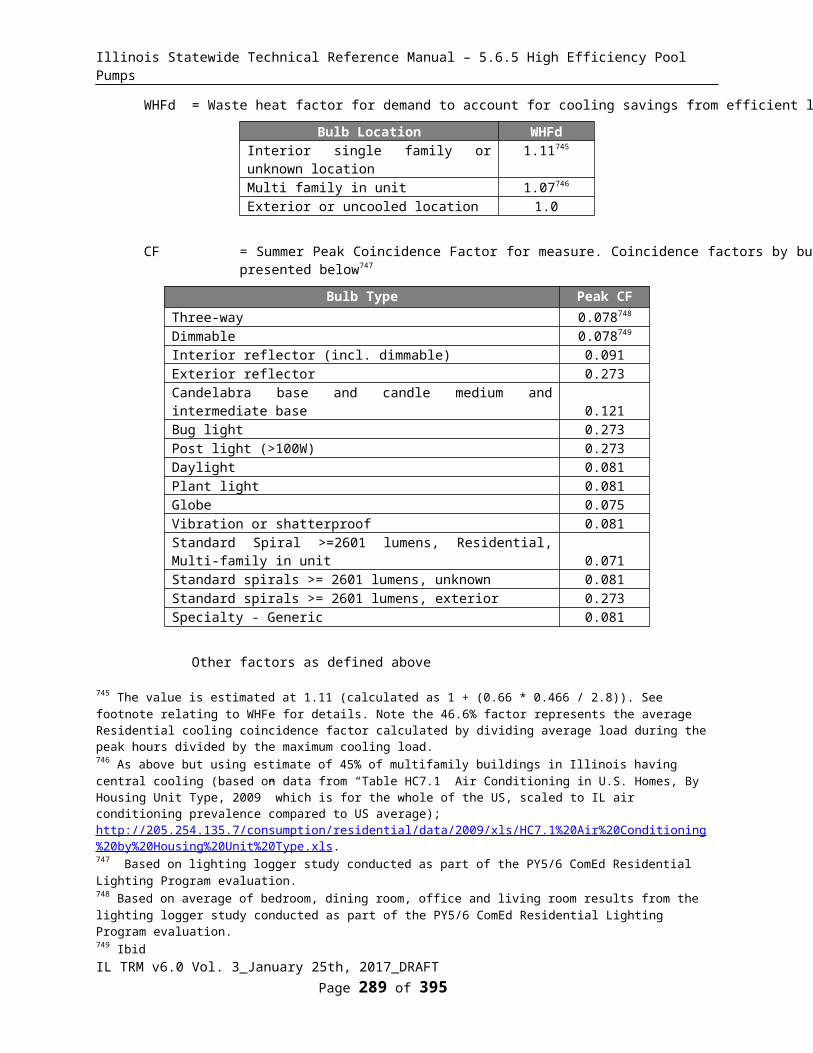
Illinois Statewide Technical Reference Manual – 5.6.5 High Efficiency Pool Pumps
NATURAL GAS SAVINGS
If Natural Gas heating:
ΔTherms = ((((1/R_old - 1/R_wall) * A_wall * (1-Framing_factor_wall)) + ((1/R_old - 1/R_attic) * A_attic * (1-Framing_factor_attic))) * 24 * HDD) / (ηHeat * 100,067 Btu/therm) * ADJWallAtticHeat
Where:
HDD = Heating Degree Days
= Dependent on location:991
Climate Zone(City based upon)
HDD 60
1 (Rockford) 5,3522 (Chicago) 5,1133 (Springfield) 4,3794 (Belleville) 3,3785 (Marion) 3,438Weighted Average992 4,860
ηHeat = Efficiency of heating system
= Equipment efficiency * distribution efficiency
= Actual.993 If unknown assume 72%.994
Other factors as defined above
991 National Climatic Data Center, calculated from 1981-2010 climate normals with a base temp of 60°F, consistent with the findings of Belzer and Cort, Pacific Northwest National Laboratory in “Statistical Analysis of Historical State-Level Residential Energy Consumption Trends,” 2004. There is a county mapping table in Volume 1, Section 3.7 providing the appropriate city to use for each county of Illinois.992 Weighted based on number of occupied residential housing units in each zone.993 Ideally, the System Efficiency should be obtained either by recording the AFUE of the unit, or performing a steady state efficiency test. The Distribution Efficiency can be estimated via a visual inspection and by referring to a look up table such as that provided by the Building Performance Institute: (http://www.bpi.org/files/pdf/DistributionEfficiencyTable-BlueSheet.pdf) or by performing duct blaster testing.994 Based on average Nicor PY4 nameplate efficiencies derated by 15% for distribution losses.
IL TRM v6.0 Vol. 3_January 25th, 2017_DRAFT Page 291 of 296
For example, a single family home in Chicago with 990 ft2 of R-5 walls insulated to R-11 and 700 ft2 of R-5 attic insulated to R-38, 10.5SEER Central AC and 2.26 COP Heat Pump:
ΔkWSSP = 224 / 570 * 0.68
= 0.27 kW
ΔkWPJM = 224 / 570 * 0.466
= 0.18 kW
For example, a single family home in Chicago with 990 ft 2 of R-5 walls insulated to R-11 and 700 ft2 of R-5 attic insulated to R-38, with a gas furnace with system efficiency of 66%:
ΔTherms = ((((1/5 - 1/11) * 990 * (1-0.25)) + ((1/5 - 1/38) * 700 * (1-0.07))) * 24 * 5113) / (0.66 * 100,067) * 0.60
= 216.4 therms

Illinois Statewide Technical Reference Manual – 5.6.5 High Efficiency Pool Pumps
WATER IMPACT DESCRIPTIONS AND CALCULATION
N/A
DEEMED O&M COST ADJUSTMENT CALCULATION
N/A
MEASURE CODE: RS-SHL-AINS-V07-180101
REVIEW DEADLINE: 1/1/2020
IL TRM v6.0 Vol. 3_January 25th, 2017_DRAFT Page 292 of 296

Illinois Statewide Technical Reference Manual – 5.6.5 High Efficiency Pool Pumps
5.7 Miscellaneous5.6.5 High Efficiency Pool Pumps
DESCRIPTION
Conventional residential outdoor pool pumps are single speed, often oversized, and run frequently at constant flow regardless of load. Single speed pool pumps require that the motor be sized for the task that requires the highest speed. As such, energy is wasted performing low speed tasks at high speed. Two speed and variable speed pool pumps reduce speed when less flow is required, such as when filtering is needed but not cleaning, and have timers that encourage programming for fewer on-hours. Variable speed pool pumps use advanced motor technologies to achieve efficiency ratings of 90% while the average single speed pump will have efficiency ratings between 30% and 70%995. This measure is the characterization of the purchasing and installing of an efficient two speed or variable speed residential pool pump motor in place of a standard single speed motor of equivalent horsepower.
This measure was developed to be applicable to the following program types: TOS, NC, RF.
If applied to other program types, the measure savings should be verified.
DEFINITION OF EFFICIENT EQUIPMENT
The high efficiency equipment is an ENERGY STAR two speed or variable speed residential pool pump for in-ground pools.
DEFINITION OF BASELINE EQUIPMENT
The baseline equipment is a single speed residential pool pump.
DEEMED LIFETIME OF EFFICIENT EQUIPMENT
The estimated useful life for a two speed or variable speed pool pump is 10 years996.
DEEMED MEASURE COST
The incremental cost is estimated as $235 for a two speed motor and $549 for a variable speed motor997.
LOADSHAPE
Loadshape R15 – Residential Pool Pumps
COINCIDENCE FACTOR
The coincidence factor for this measure is assumed to be 0.831998.
Algorithm
995 U.S. DOE, 2012. Measure Guideline: Replacing Single-Speed Pool Pumps with Variable Speed Pumps for Energy Savings. Report No. DOE/GO-102012-3534. 996 The CEE Efficient Residential Swimming Pool Initiative, p18, indicates that the average motor life for pools in use year round is 5-7 years. For pools in use for under a third of a year, you would expect the lifetime to be higher so 10 years is selected as an assumption. This is consistent with DEER, 2014 and the ENERGY STAR Pool Pump Calculator assumptions.997 ENERGY STAR Pool Pump Calculator.998 Based on assumptions of daily load pattern through pool season. Assumption was developed for Efficiency Vermont but is considered a reasonable estimate for Illinois.
IL TRM v6.0 Vol. 3_January 25th, 2017_DRAFT Page 293 of 296

Illinois Statewide Technical Reference Manual – 5.6.5 High Efficiency Pool Pumps
CALCULATION OF ENERGY SAVINGS
ELECTRIC ENERGY SAVINGS999
ΔkWh two speed = (((Hrs/Daybase * GPMbase * 60)/EFbase) - (((Hrs/Day2spH* GPM2spH * 60)/EF2spH + ((Hrs/Day2spL * GPM2spL * 60)/EF2spL))))/1000 * Days
ΔkWh variable speed = (((Hrs/Daybase * GPMbase * 60)/EFbase) - (((Hrs/DayvsH* GPMvsH * 60)/EFvsH + ((Hrs/DayvsL * GPMvsL * 60)/EFvsL))))/1000 * Days
Where:
Hrs/Daybase = run hours of single speed pump
= 11.4
GPMbase = flow of single speed pump (gal/min)
= 64.4
60 = minutes per hour
EFbase = Energy Factor of baseline single speed pump (gal/Wh)
= 2.1
Hrs/Day2spH = run hours of two speed pump at high speed
= 2
GPM2spH = flow of two speed pump at high speed (gal/min)
= 56
EF2spH = Energy Factor of two speed pump at high speed (gal/Wh)
= 2.4
Hrs/Day2spL = run hours of two speed pump at low speed
= 15.7
GPM2spL = flow of two speed pump at low speed (gal/min)
= 31
EF2spL = Energy Factor of two speed pump at high speed (gal/Wh)
= 5.4
Hrs/DayvsH = run hours of variable speed pump at high speed
= 2
GPMvsH = flow of variable speed pump at high speed (gal/min)
= 50
EFvsH = Energy Factor of variable speed pump at high speed (gal/Wh)
= 3.8
Hrs/DayvsL = run hours of variable speed pump at low speed
999 The methodology and all assumptions are sourced from the ENERGY STAR Pool Pump Calculator and assume a nameplate horsepower of 1.5 and a pool size of 22,000 gallons, with 2.0 turnovers per day in the base case and 1.5 turnovers per day in the efficient case.
IL TRM v6.0 Vol. 3_January 25th, 2017_DRAFT Page 294 of 296
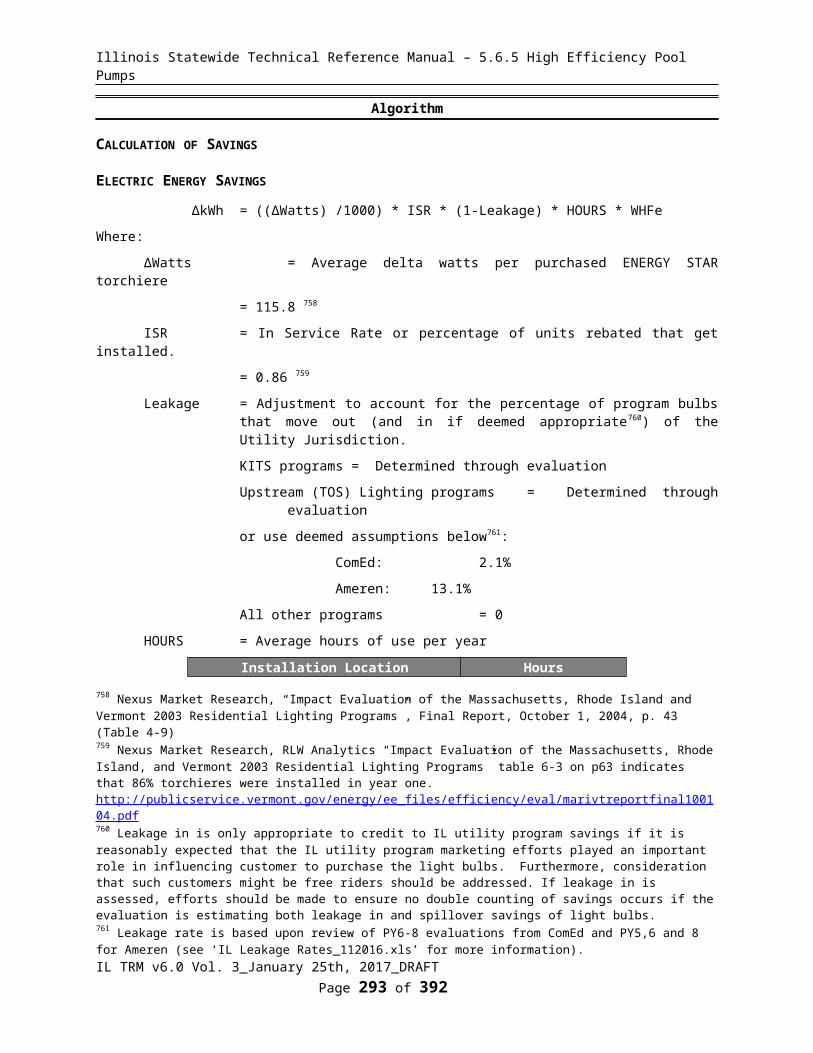
Illinois Statewide Technical Reference Manual – 5.6.5 High Efficiency Pool Pumps
= 16
GPMvsL = flow of variable speed pump at low speed (gal/min)
= 30.6
EFvsL = Energy Factor of variable speed pump at high speed (gal/Wh)
= 7.3
Days = Number of days per year that the swimming pool is operational
= 1251000
ΔkWh two speed = (((11.4 * 64.4 * 60)/2.1) - (((2* 56 * 60)/2.4 + ((15.7 * 31 * 60)/5.4))))/1000 * 125
= 1,596.0 kWh
ΔkWh variable speed = (((11.4 * 64.4 * 60)/2.1) - (((2* 50 * 60)/3.8 + ((16 * 30.6 * 60)/7.3))))/1000 * 125
= 1,921.6 kWh
SUMMER COINCIDENT PEAK DEMAND SAVINGS 1001
ΔkW two speed = ((kWh/daybase)/(Hrs/daybase) – (kWh/day2sp)/(Hr/day2sp)) * CF
ΔkW variable speed = ((kWh/daybase)/(Hrs/daybase) – (kWh/dayvar)/(Hr/dayvar)) * CF
Where:
kWh/daybase = daily energy consumption of baseline pump, as defined above
= 20.98
Hrs/daybase = daily run hours of single speed pump
= 11.4
kWh/day2sp = daily energy consumption of two speed pump, as defined above
= 8.21
Hr/day2sp = run hours of two speed pump
= 17.7
kWh/dayvar = daily energy consumption of variable speed pump, as defined above
= 5.6
Hr/dayvar= run hours of variable speed pump
= 18
CF = Summer Peak Coincidence Factor for measure
= 0.8311002
ΔkW two speed = ((20.98 / 11.4) – (8.21 / 17.7)) * 0.831
1000 Assumes 50% of pools operated from Memorial Day through Labor Day (100 days) and 50% of pools operate for a longer span, typically the 5 month period between May and September (150 days), due to their ability to heat the pool. 1001 The methodology and all assumptions are sourced from the ENERGY STAR Pool Pump Calculator and assume a nameplate horsepower of 1.5 and a pool size of 22,000 gallons, with 2.0 turnovers per day in the base case and 1.5 turnovers per day in the efficient case.1002 Based on assumptions of daily load pattern through pool season. Assumption was developed for Efficiency Vermont but is considered a reasonable estimate for Illinois.
IL TRM v6.0 Vol. 3_January 25th, 2017_DRAFT Page 295 of 296

Illinois Statewide Technical Reference Manual – 5.6.5 High Efficiency Pool Pumps
= 1.144 kW
ΔkW variable speed = ((20.98 / 11.4) – (5.60 / 18)) * 0.831
= 1.271 kW
NATURAL GAS SAVINGS
N/A
WATER IMPACT DESCRIPTIONS AND CALCULATION
N/A
DEEMED O&M COST ADJUSTMENT CALCULATION
N/A
MEASURE CODE: RS-MSC-RPLP-V01-180101
REVIEW DEADLINE: 1/1/2022
IL TRM v6.0 Vol. 3_January 25th, 2017_DRAFT Page 296 of 296