Embed Size (px)
Citation preview

Course Name: Security pricing and portfolio analysis
Course Code: F-407
Portfolio construction based on 10 listed companies of DSE
Prepared For
Ms. Pallabi Siddiqua
Assistant Professor
Department of Finance
and
Md. Sajib Hossain
Lecturer
Assistant Professor
Department of Finance
Prepared By
Md. Sadddad Hossain
Roll:127 Sec:A
BBA(16th Batch)
Department of Finance
Submission Date: 24nd November, 2013
1

23th November, 2013
Ms. Pallabi SiddiquaAssistant Professor Department of FinanceFaculty of Business StudiesUniversity of Dhaka
Sub: Submission of a Report on Efficient Portfolio Construction
Dear Madam,
I am very happy to state that the report on Portfolio construction based on 10 listed companies of
DSE , you had asked me to prepare, is completed and ready for your viewing.
I am glad to submit it as part of completion of the requirements for our Security pricing and portfolio theory (F-407) course with you.
I have tried my best to put up a good report with as much information as I could gather during the short time span allotted for writing this report.
Thank you for your kind support and help throughout the course, I remain.
I hope you will appreciate this sincere effort.
Very sincerely yours,
……………………………………..
Md.Saddad Hossain
Roll-127
Sec: A, 16TH Batch, BBA
Department of Finance
University of Dhaka
2
We were assigned to make a report on portfolio construction. For this purpose we collected data from DSE. We know, portfolio is the combination of securities of an individual. the goals of investment vary with man to man, institutions to institutions based on their financial conditions, economic stability, and risk tolerance, need of income stream, age, and job status. Regardless of the ultimate goal, all face the same set of challenges that extend beyond just the choice of what asset classes to invest in. Here our main objective is to find out optimum portfolio convergence with individual and institutions investment policy objectives. By portfolio approach I mean evaluating individual securities in relation to their contribution to the investment characteristics of the whole portfolio.
Here we have taken 10 companies that are listed in Dhaka stock exchange from different industries. We want to maximize the theta and want to minimize risk. We use solver function through excel worksheet to find out portfolio weight to be complied with given eight situation. These are,
1. Maximizing Theta allowing short sell2. Maximizing Theta by not allowing short sell3. Minimizing Risk (Standard Deviation) by allowing short sell4. Minimizing Risk (Standard Deviation) by not allowing short sell5. Minimizing Risk (Standard Deviation) by allowing short sell for a given return6. Minimizing Risk (Standard Deviation) by not allowing short sell for a given return7. Maximizing Theta by allowing short sell for a given return8. Maximizing Theta by not allowing short sell for a given return
After doing different mathematical and statistical tools and techniques finally I get that portfolio weight for each situation. Here I have seen that if short selling is allowed individual can get highest theta with minimum risk than that of any other combinations.
3

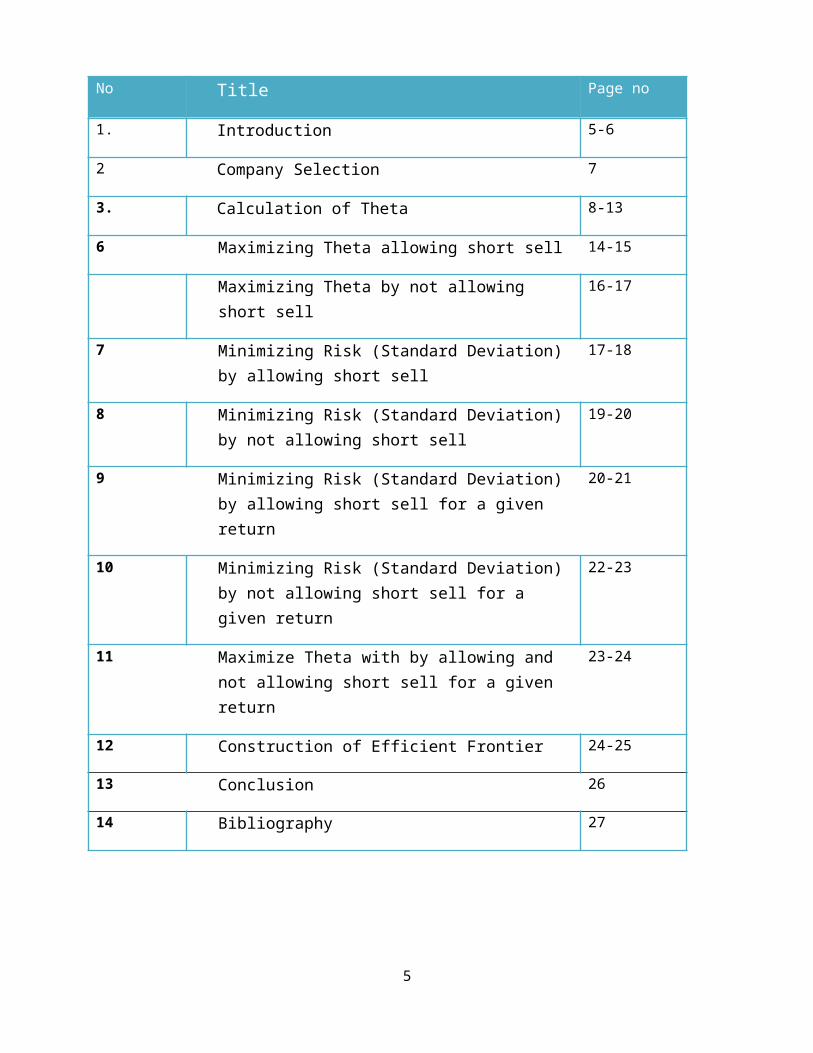
No Title Page no
1. Introduction 5-6
2 Company Selection 7
3. Calculation of Theta 8-13
6 Maximizing Theta allowing short sell 14-15
Maximizing Theta by not allowing short sell 16-17
7 Minimizing Risk (Standard Deviation) by allowing short sell
17-18
8 Minimizing Risk (Standard Deviation) by not allowing short sell
19-20
9 Minimizing Risk (Standard Deviation) by allowing short sell for a given return
20-21
10 Minimizing Risk (Standard Deviation) by not allowing short sell for a given return
22-23
11 Maximize Theta with by allowing and not allowing short sell for a given return
23-24
12 Construction of Efficient Frontier 24-25
13 Conclusion 26
14 Bibliography 27
4
Chapter-1: Introduction
1.1 Origin of the Report
Now a day’s education is not just limited to books and classrooms. In today’s world, education is
the tool to understand the real world and apply knowledge for the betterment of the society as
well as business. From education the theoretical knowledge is obtained from courses of study,
which is only the half way of the subject matter. Practical knowledge has no alternative. The
perfect coordination between theory and practice is of paramount importance in the context of
the modern business world in order to resolve the dichotomy between these two areas. Therefore,
for the B.B.A. program I am assigned to prepare a report on “Portfolio construction based on 10
listed companies of DSE.”
Objective of the Report
Our objectives are………..
To obtain knowledge about construction To increase our experience in data collection & analysis.To know about stock market mechanismTo know about optimizing the portfolio by maximizing theta and minimizing risk with and without short saleTo be able to construct efficient frontier and optimum frontier. Implement the knowledge earned from this course to evaluate the stocks of the company.To increase competence in investment decision.
Scope of the Report
To find out the report requirements we had to know about the features and mechanism of constructing efficient frontier. We also have collected some information from different newspapers and periodicals. We would like to mention that this research was only concentrated. A tough effort had been placed while the information was collected and a careful study of them made this report loaded with information and several recommendations when there is also pointed out decisions made.
5

1.4 Limitations of the Report While preparing this report during data collection I have faced several problems.
Due to limited access of the data, this study may not be perfect to the 100% percent.
Lack of enough experience in analyzing of data.
Due to inadequate information, in-depth analysis could not be done in the report.
Sources and Methodology1.5
This report’s research is based on portfolio construction. The data types are mainly secondary
data. Secondary data types are collected through different publications.
Secondary sources: Records and documents Books, texts and publications. Websites. Annual Report DSE trade information
Chapter-2:Company Selection
6
In selecting the companies within an industry , at first we have to select the industry based on their NAV and P/E ratio. The industry selection also includes subjective judgment regarding future economic conditions and government policy. After selecting the industry, the company are selected based on the NAV and P/E ratio of the company relative to the NAV and P/E ratio of the selected companies.
2.1 General characteristics of the selected companies:
Listed in DSE.
Listed before or on November, 2007.
Only ‘A Category’ companies are considered.
NAV more than 100.
Market Capitalization more than BDT 10,000million.
2.2 Subjective judgment criteria:
Subjective judgment:
Financial sector comprises of Banks, Insurances, NBFIs and many other subsectors or industries, is the backbone of our economy.
Chemical and Pharmaceutical industries in Bangladesh are intensely competitive, export oriented and are dominated by few top market players.
Fuel and Power industry is another industry that is likely to face huge development in the future year
Engineering sector is growing with the growth of the economy.
Non Bank Financial Institutions are holding a major market share among the listed companies in DSE
Foods and Allied Products sector are also competitive, export oriented and are dominated by few top market players.
Chapter-3: Calculation of Theta
7

3.1: Assumption:
To construct optimum portfolio with selected companies, we take several assumption into account to simplify our procedures. Based on these assumptions we call our calculated portfolio as optimum. These assumptions are:
The historical data are used to predict the future. It is assumed that the trend that persists in the past will continue in the future.
Maximum expected utility & diminishing marginal utility of wealth. So, the investors prefer more return to less return.
Risk arises from the variability of expected return. We only define risk as the deviation between actual return and expected return. Other forms of risk are avoided.
Investor selects their investment in the portfolio based on risk and return, The influence of behavioral finance and other factors are avoided.
Investors are risk averse. They generally prefer less risk to more risk and prefer the portfolio that has an equal return but less risk.
3.2 Adjust price:
We take price data for 10 selected companies from January 2008 to December 2012. Then we adjust the price of the shares with cash dividend, stock dividend, right issue and stock split to reflect the true return to the investors. We have used the following formulas to adjust price:
For cash dividend:
Adjusted price=Current market Price +Dividend in TK
For stock dividend:
Adjusted price= Current market Price+ (1+stock dividend in decimal form)
For right issue:
Adjusted price= [Current market Price*(1+Right ratio)]-[Right offer price*Right ratio)
For stock spilt:
Adjusted price= current market price* spilt amount
All adjustments are made to determine Capital Gain as well to determine Total Return.
This is shown in the following figures by accumulated form:
8
Figure1: Adjust price for capital gain
3.2 Calculation of mean return:
After adjusting the price the month wise return for each individual stock is calculated in log form. This is based on the research of Fama(1970) that the stock returns are log normally distributed. So, by using the logarithm we ensure the normality of return distribution which is a prior condition for our further calculation of mean, variance and covariance.
I use the following formula for the calculation of the mean return:
Return= Dividend yield + Capital Gain
The details view of calculating mean return is given in the following page:
9
Figure 5: calculation of individual return\
After that, we calculate the mean return for each individual stock for total data from 2008 to 2012 for each individual company using mean function. The process is shown below:
Figure: Calculation of mean return
3.3 Calculation of risk free rate:
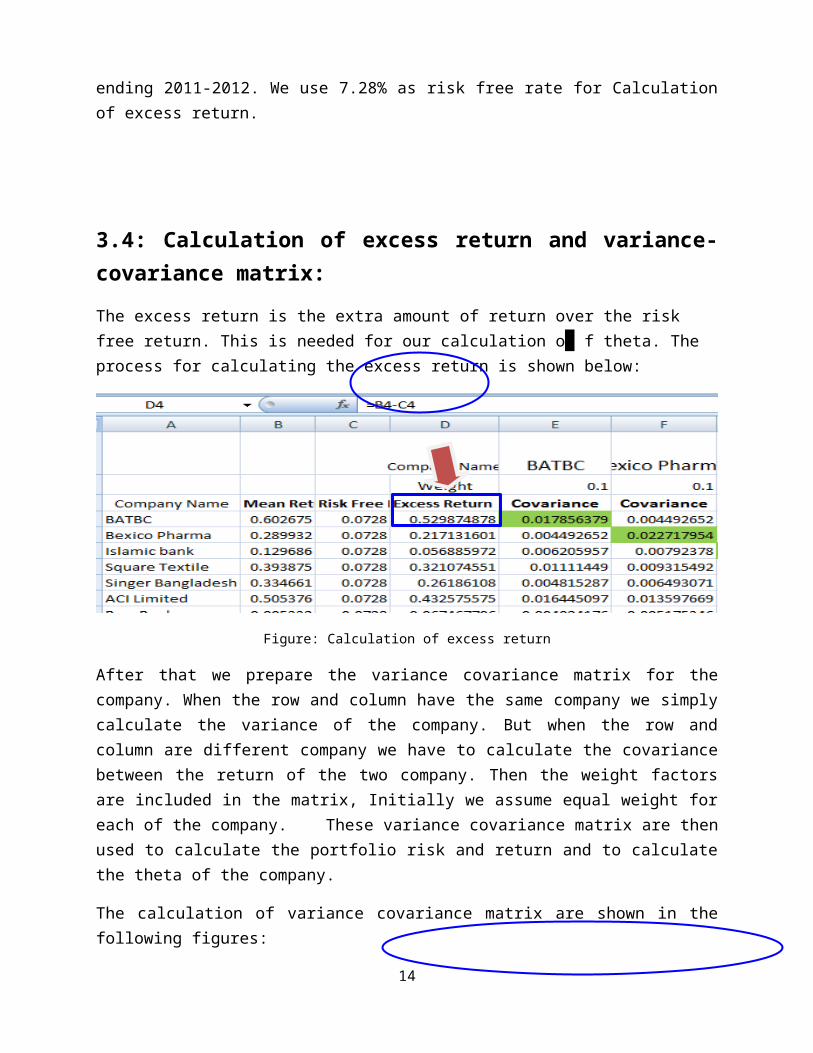
For calculating risk free rate, we take Bangladesh Bank six month treasury bill rate as the risk free rate. The data are taken from Appendix-2 of the annual report of Bangladesh Bank for the year ending 2011-2012. We use 7.28% as risk free rate for Calculation of excess return.
10
3.4: Calculation of excess return and variance-covariance matrix:
The excess return is the extra amount of return over the risk free return. This is needed for our calculation o f theta. The process for calculating the excess return is shown below:
Figure: Calculation of excess return
After that we prepare the variance covariance matrix for the company. When the row and column have the same company we simply calculate the variance of the company. But when the row and column are different company we have to calculate the covariance between the return of the two company. Then the weight factors are included in the matrix, Initially we assume equal weight for each of the company. These variance covariance matrix are then used to calculate the portfolio risk and return and to calculate the theta of the company.
The calculation of variance covariance matrix are shown in the following figures:
Figure: calculation of variance
11
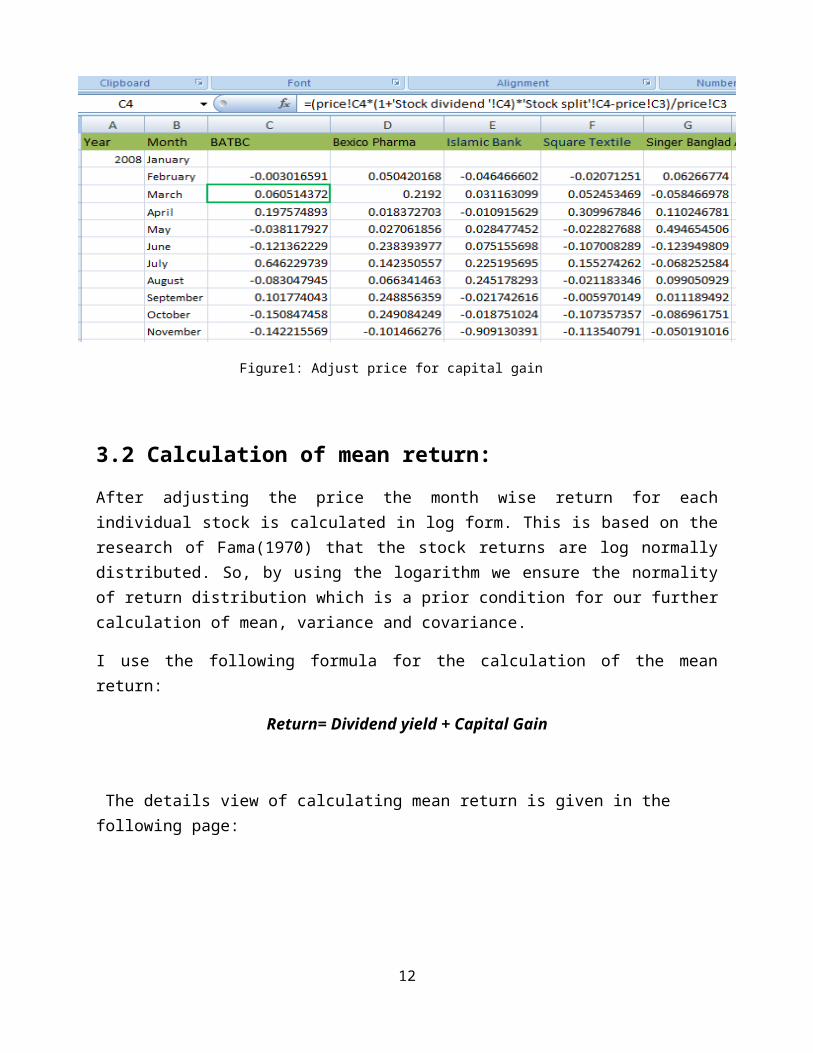
Figure: Calculation of covariance
3.5: Calculation of portfolio return, risk and theta:
I use the MMMULT or array function to calculate the portfolio risk and return. In calculating return, the return of the individual portfolio is multiplied by their respective weight. On the other hand, in calculating risk the al possible covariance are taken into consideration. The theata is calculated simply by dividing the excess return by the risk of the portfolio.
This is shown in the following figures:
12

Figure: Calculation of portfolio return
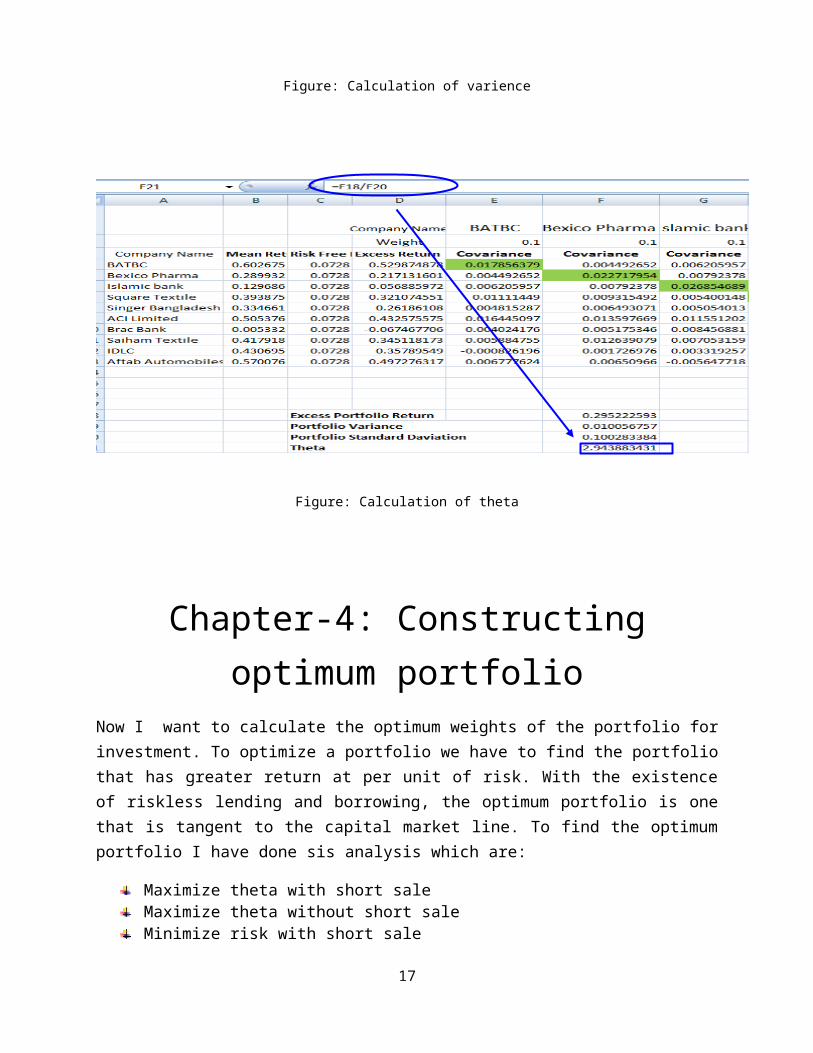
Figure: Calculation of varience
Figure: Calculation of theta
13
Chapter-4: Constructing optimum portfolioNow I want to calculate the optimum weights of the portfolio for investment. To optimize a portfolio we have to find the portfolio that has greater return at per unit of risk. With the existence of riskless lending and borrowing, the optimum portfolio is one that is tangent to the capital market line. To find the optimum portfolio I have done sis analysis which are:
Maximize theta with short saleMaximize theta without short saleMinimize risk with short saleMinimize risk without short saleMinimize risk given return with short sale.Minimize risk given return without short saleMaximize return given risk with short saleMaximize return given risk without short sale
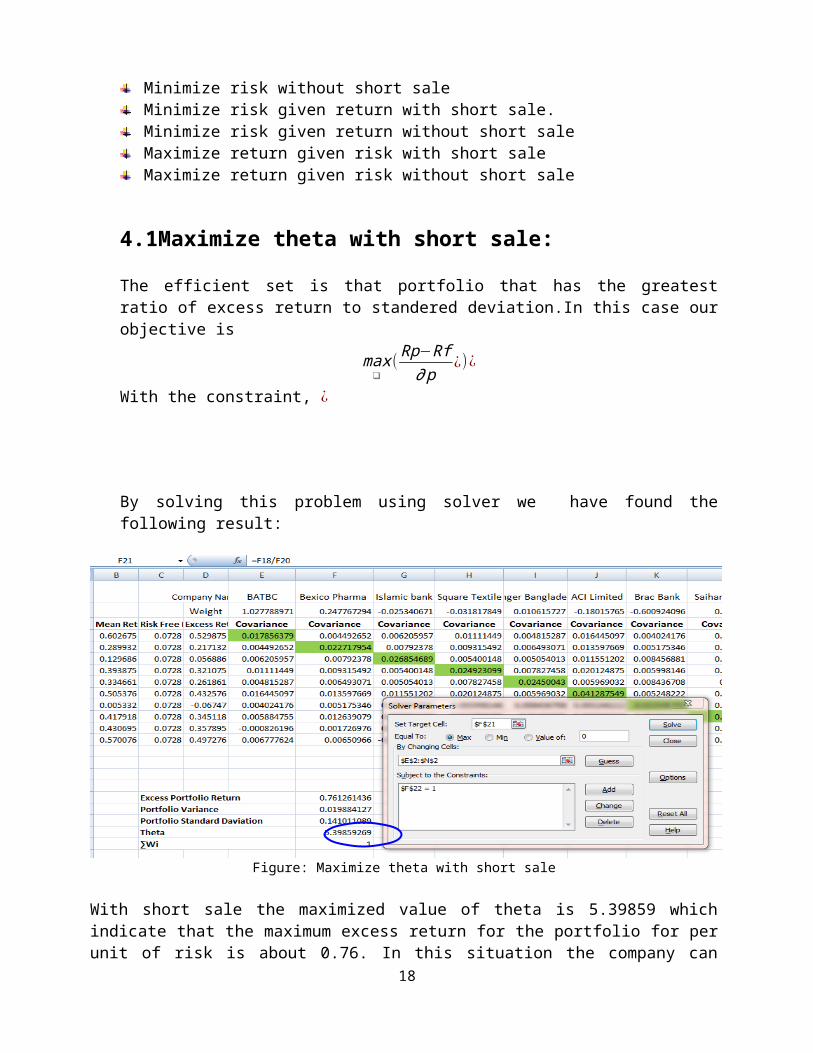
4.1Maximize theta with short sale:
The efficient set is that portfolio that has the greatest ratio of excess return to standered deviation.In this case our objective is
max❑
( Rp−Rf∂ p
¿)¿
With the constraint, ¿
By solving this problem using solver we have found the following result:
14
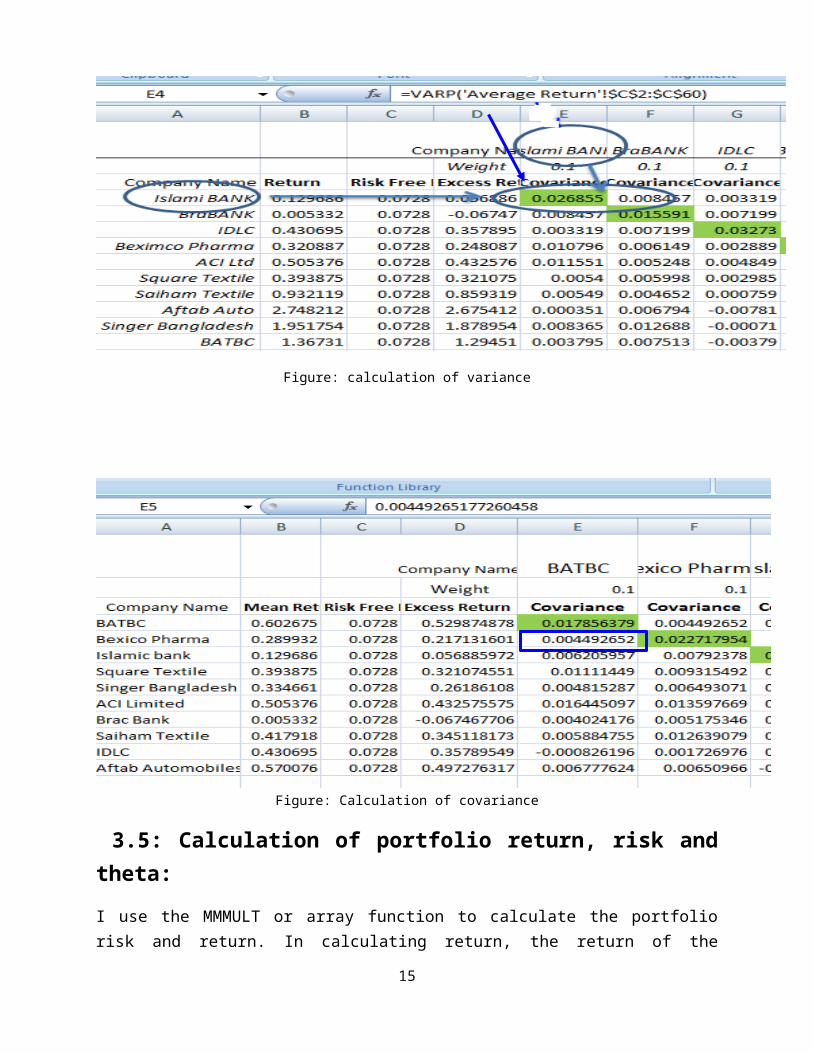
Figure: Maximize theta with short sale
With short sale the maximized value of theta is 5.39859 which indicate that the maximum excess return for the portfolio for per unit of risk is about 0.76. In this situation the company can earn a portfolio excess return of 0.76 per month and the standard deviation of return is about 0.141011. In this situation the weight of the assets in the portfolio are as follows:
Company Weight
BATBC 1.027789
Beximco Pharma 0.247767
Islamic bank -0.02534
Square Textile -0.03182
Singer Bangladesh 0.010616
ACI Limited -0.18016
Brac Bank -0.60092
Saiham Textile 0.005598
IDLC 0.463109
Aftab Automobiles 0.083361
4.2Maximize theta without short sale:
In this case our objective is
max❑
( Rp−Rf∂ p
¿)¿
With the constraint, ¿ Wi ≥ 0
By solving this problem using solver we have found the following result:
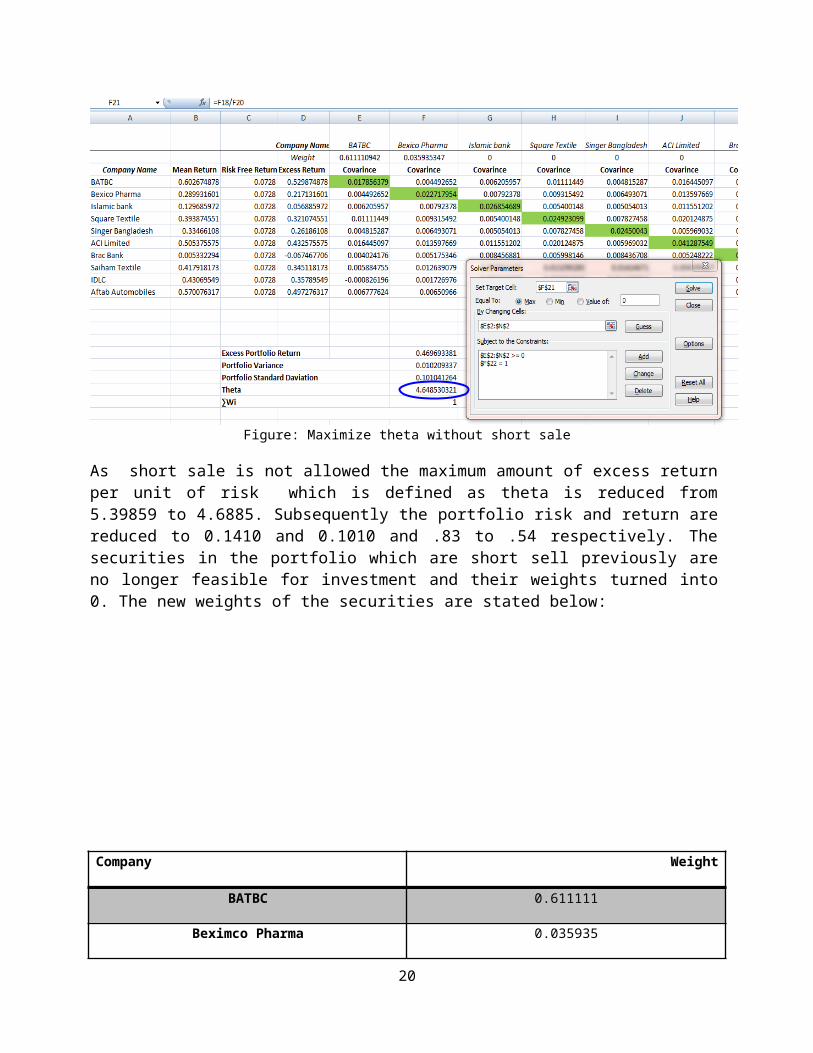
15
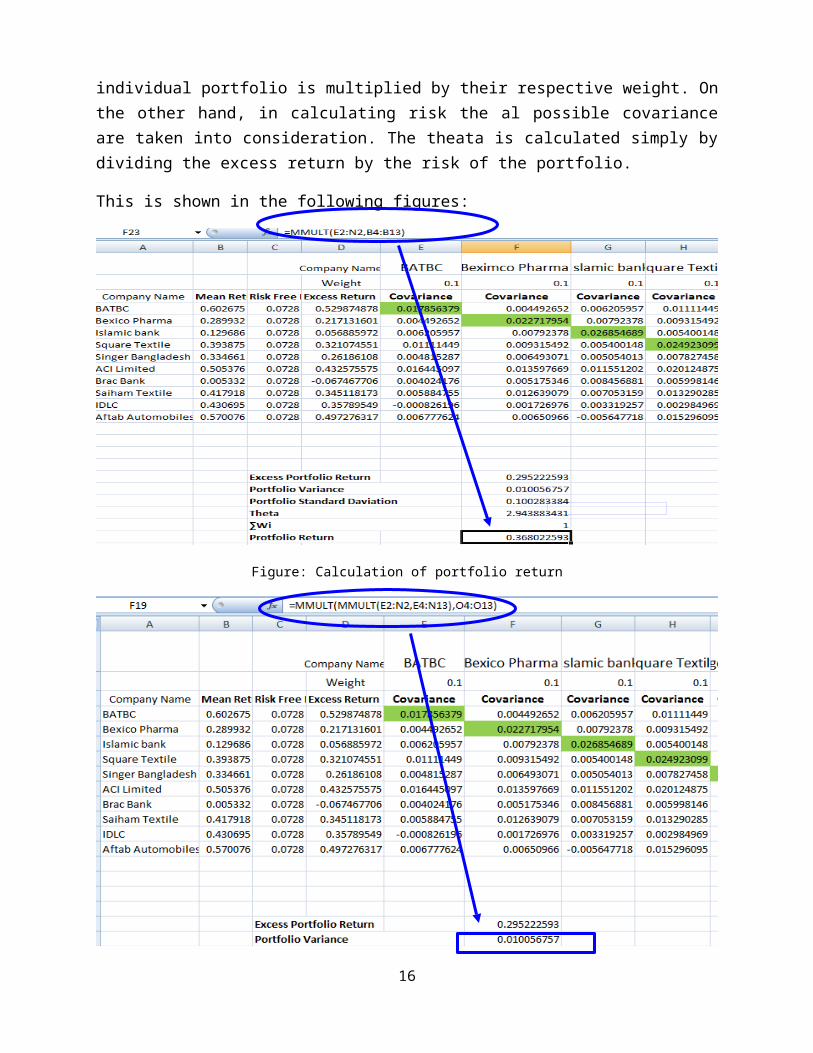
Figure: Maximize theta without short sale
As short sale is not allowed the maximum amount of excess return per unit of risk which is defined as theta is reduced from 5.39859 to 4.6885. Subsequently the portfolio risk and return are reduced to 0.1410 and 0.1010 and .83 to .54 respectively. The securities in the portfolio which are short sell previously are no longer feasible for investment and their weights turned into 0. The new weights of the securities are stated below:
Company Weight
BATBC 0.611111
Beximco Pharma 0.035935
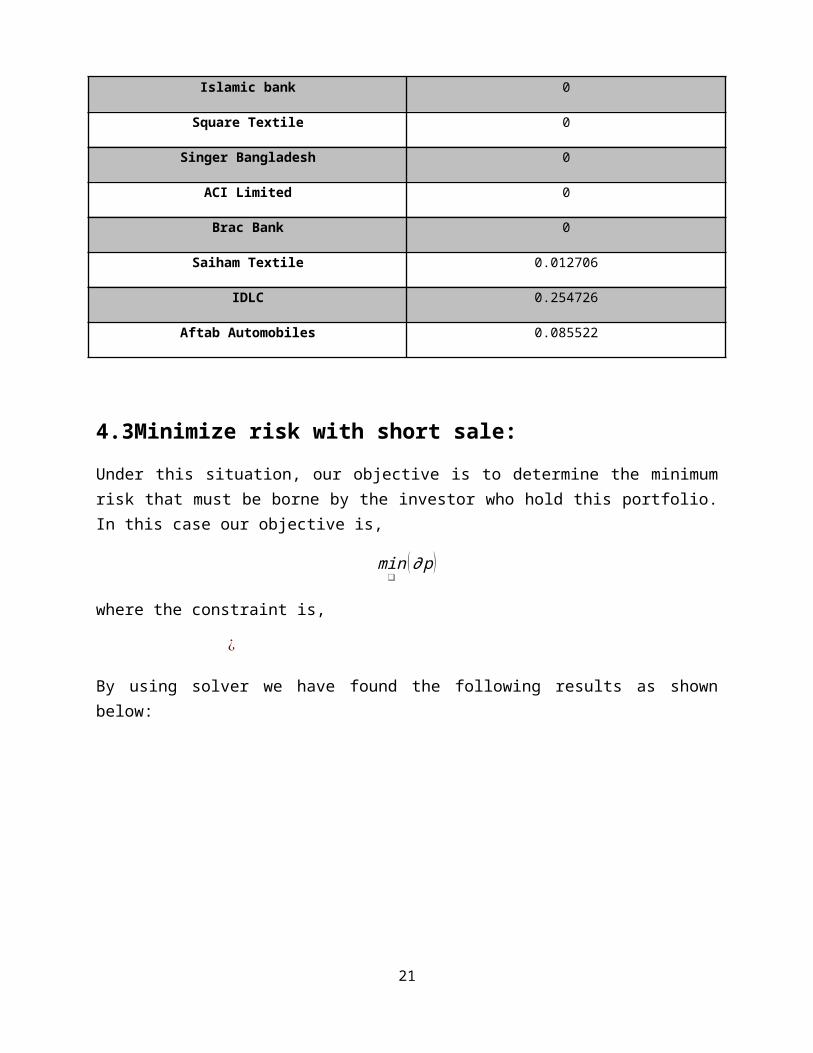
Islamic bank 0
Square Textile 0
Singer Bangladesh 0
ACI Limited 0
16
Brac Bank 0
Saiham Textile 0.012706
IDLC 0.254726
Aftab Automobiles 0.085522
4.3Minimize risk with short sale:
Under this situation, our objective is to determine the minimum risk that must be borne by the investor who hold this portfolio. In this case our objective is,
min❑
(∂ p )
where the constraint is,
¿
By using solver we have found the following results as shown below:
Figure: Minimize risk with short sale
The minimum risk that the holder of the portfolio must bear is about 0.0849. In this situation the excess return per unit of risk is about 0.27. The company has a minimum portfolio return is 0.34. So, the investor who holds this portfolio must bear a portfolio risk about 8%. It cannot be possible to bear risk below this.
17
The weight of the securities under this situation is given below:
Company Weight
BATBC 0.367871
Beximco Pharma 0.210405
Islamic bank 0.107714
Square Textile 0.045
Singer Bangladesh -0.01727
ACI Limited -0.13937
Brac Bank 0.189041
Saiham Textile -0.0125
IDLC 0.192524
Aftab Automobiles 0.056587
4.4Minimize risk without short sale:
Under this situation, our objective is to determine the minimum risk that must be borne by the investor who hold this portfolio if sort sale is not allowed. In this case our objective is,
min❑
(∂ p )
where the constraint is,
¿
Wi ≥ 0
By using solver we have found the following results as shown below:
18
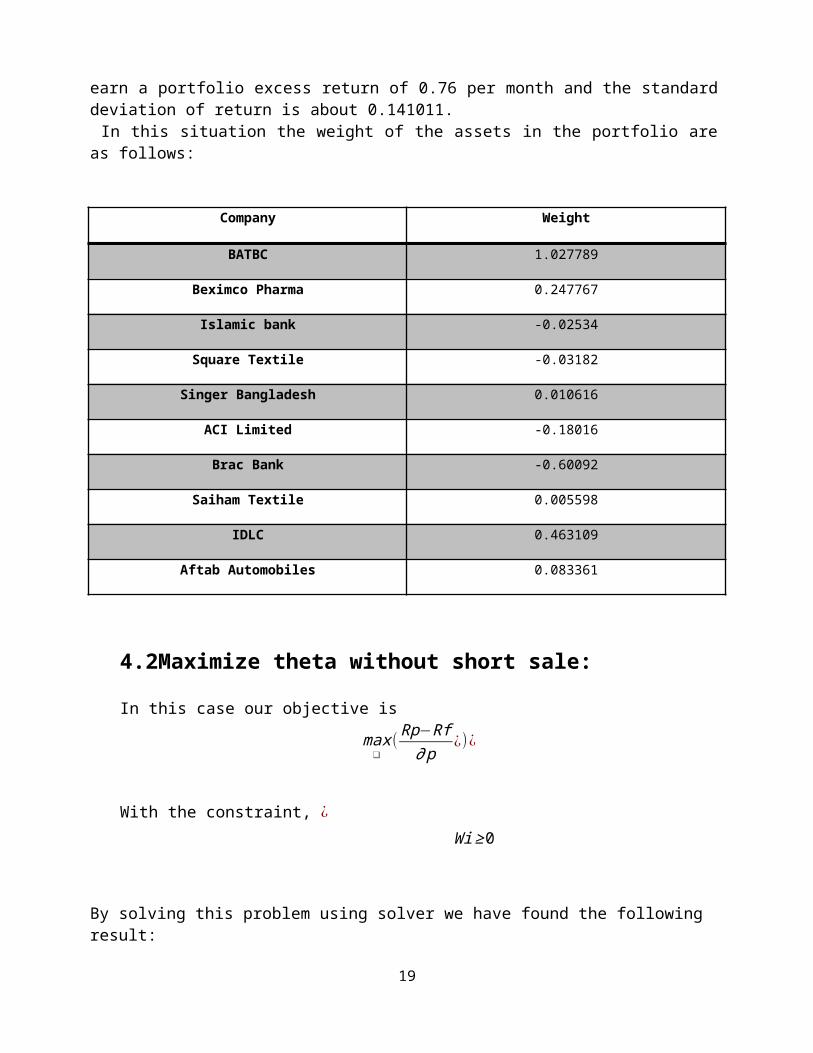
Figure: Minimize risk without short sale
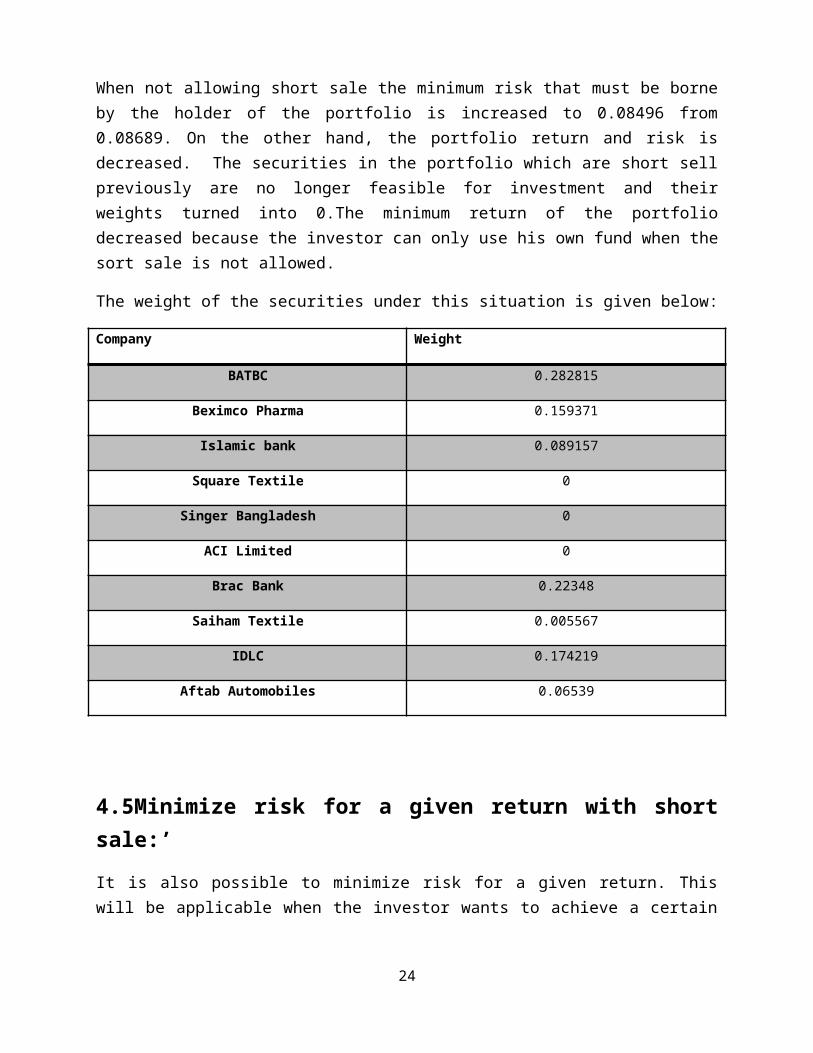
When not allowing short sale the minimum risk that must be borne by the holder of the portfolio is increased to 0.08496 from 0.08689. On the other hand, the portfolio return and risk is decreased. The securities in the portfolio which are short sell previously are no longer feasible for investment and their weights turned into 0.The minimum return of the portfolio decreased because the investor can only use his own fund when the sort sale is not allowed.
The weight of the securities under this situation is given below:
Company Weight
BATBC 0.282815
Beximco Pharma 0.159371
Islamic bank 0.089157
Square Textile 0
Singer Bangladesh 0
ACI Limited 0
Brac Bank 0.22348
Saiham Textile 0.005567
IDLC 0.174219
Aftab Automobiles 0.06539
19
4.5Minimize risk for a given return with short sale:’
It is also possible to minimize risk for a given return. This will be applicable when the investor wants to achieve a certain amount of return through minimum risk. This process is also necessary to contract efficient frontier and optimum portfolio
Here, the objective is,
min❑
(∂ p )
where the constraint is,
¿
Rp=Rp (Given)
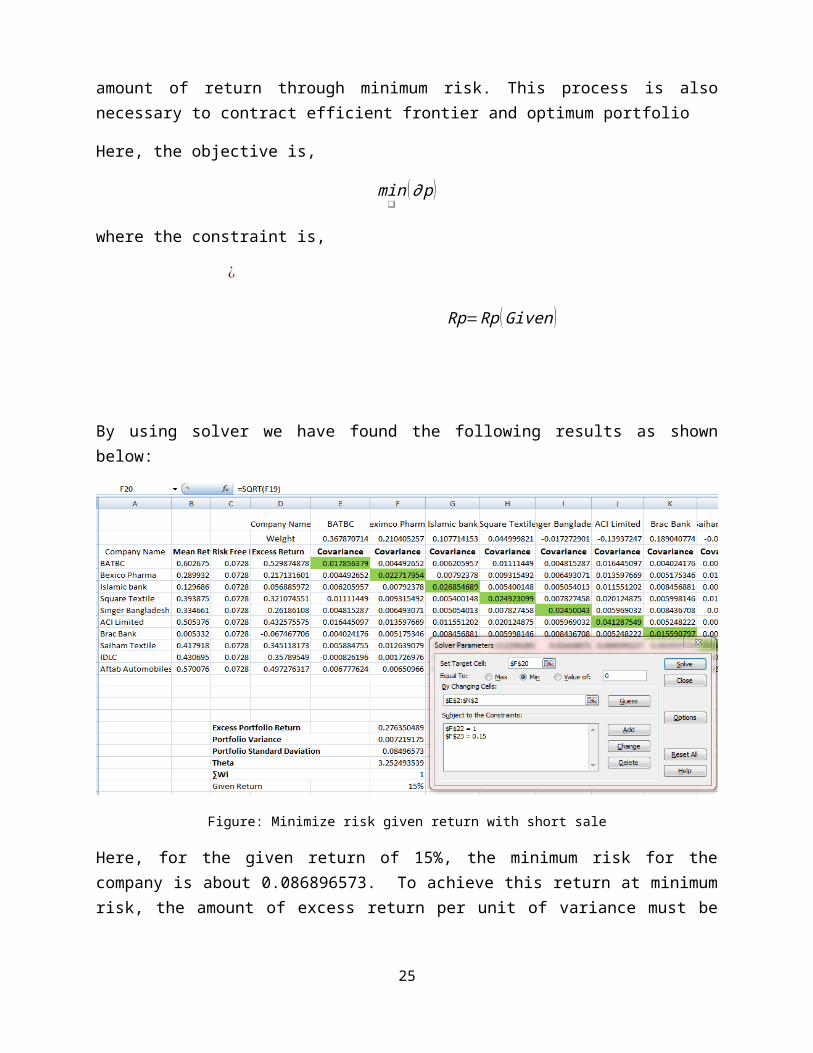
By using solver we have found the following results as shown below:
Figure: Minimize risk given return with short sale
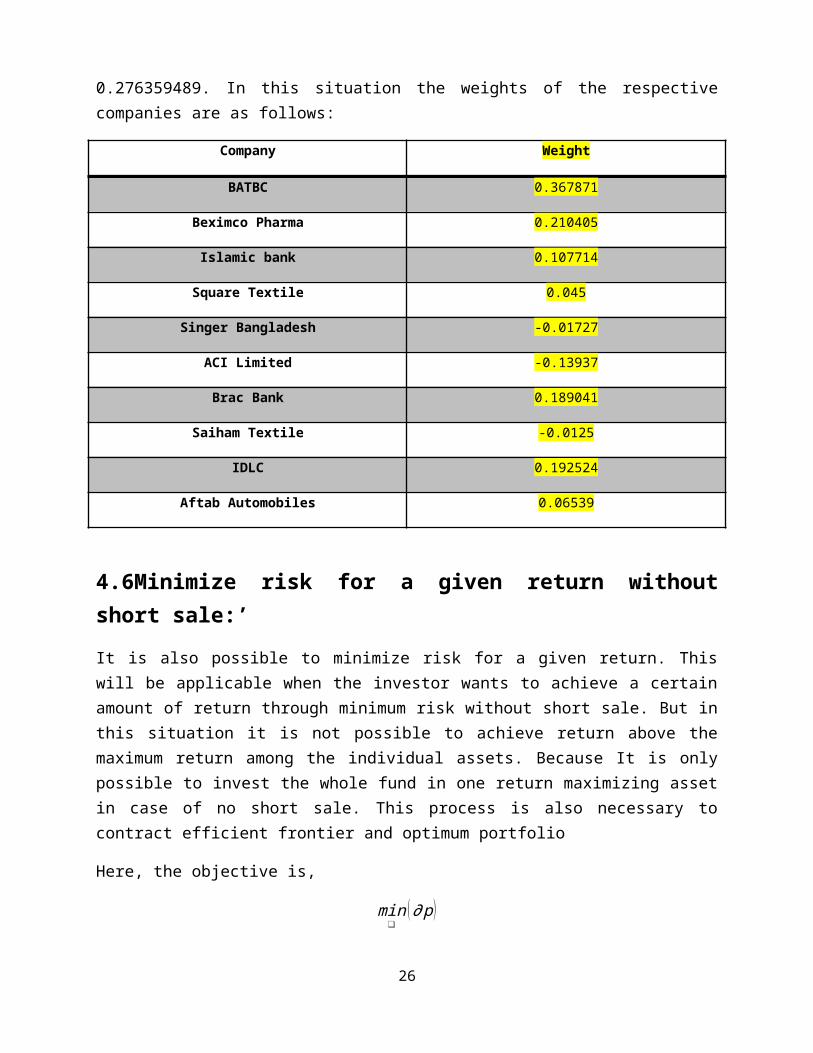
Here, for the given return of 15%, the minimum risk for the company is about 0.086896573. To achieve this return at minimum risk, the amount of excess return per unit of variance must be 0.276359489. In this situation the weights of the respective companies are as follows:
20
Company Weight
BATBC 0.367871
Beximco Pharma 0.210405
Islamic bank 0.107714
Square Textile 0.045
Singer Bangladesh -0.01727
ACI Limited -0.13937
Brac Bank 0.189041
Saiham Textile -0.0125
IDLC 0.192524
Aftab Automobiles 0.06539
4.6Minimize risk for a given return without short sale:’
It is also possible to minimize risk for a given return. This will be applicable when the investor wants to achieve a certain amount of return through minimum risk without short sale. But in this situation it is not possible to achieve return above the maximum return among the individual assets. Because It is only possible to invest the whole fund in one return maximizing asset in case of no short sale. This process is also necessary to contract efficient frontier and optimum portfolio
Here, the objective is,
min❑
(∂ p )
where the constraint is,
¿
Wi ≥ 0
Rp=Rp (Given )
By using solver we have found the following results as shown below:
21
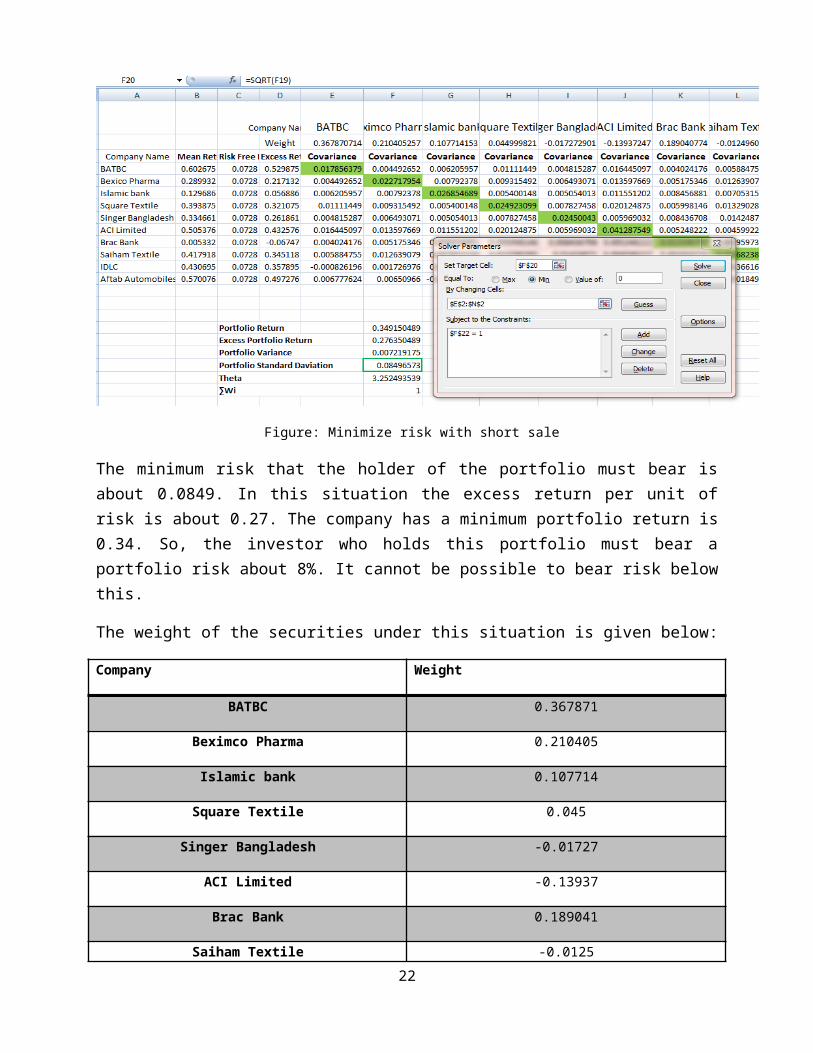
Figure: Minimize risk given return without short sale
Here, without short sale for the given return of 15%, the minimum risk for the company is about 0.086894795. To achieve this return at minimum risk, the amount of excess return per unit of variance must be 0.271245916. In this situation the weights of the respective companies are as follows:
Company Weight
BATBC 0.282815
Beximco Pharma 0.159371
Islamic bank 0.089157
Square Textile 0
Singer Bangladesh 0
ACI Limited 0
Brac Bank 0.22348
Saiham Textile 0.005567
IDLC 0.174219
Aftab Automobiles 0.06539
22

4.7 Maximize Theta given return with short sale and without short sale:
It is also possible to maximize the return of a portfolio with a given risk. The portfolio assets weight for a given risk of 12% is shown below:
Company Weight(With short sales) Weight(Without short sales)
BATBC 1.027789 0.611111
Beximco Pharma 0.247767 0.035935
Islamic bank -0.02534 0
Square Textile -0.03182 0
Singer Bangladesh 0.010616 0
ACI Limited -0.18016 0
Brac Bank -0.60092 0
Saiham Textile 0.005598 0.012706
IDLC 0.463109 0.254726
Aftab Automobiles 0.083361 0.085522
4.8 Construction of efficient frontier
The efficient frontier consists of dominant portfolio. Dominant portfolio is one that dominates other portfolio of assets in terms of risk and return. On the other hand, with the existence of
23
riskless lending and borrowing rate, the optimum portfolio for any investors is the portfolio of assets that is tangent to the capital market line.
With our calculated maximized theta the graph for efficient and optimum frontier is created by using the following steps:
The minimum risk and its respective return is calculated for with and without short sale.The minimum return is increased at a certain percentage each time and the respective minimum risk for given return is calculated using the solver function.The risks are put into the CML function to determine the CML return.The risk, return and CML are put into the scatter graph to find the graph for efficient frontier and optimum frontier,
The graph for optimum frontier with short sale at minimum return is appears as follows:
0.10973 0.0880200000000001
0.0849600000000001
0.0881200000000001
0.09189
Efficient Fron-tier
0.05 0.250000000131931
0.349999991982692
0.450000987758811
0.50000099431382
0.05
0.15
0.25
0.35
0.45
0.55Efficient Frontier
Efficient Frontier
It is appeared from the above graph that Efficient Frontier with short sale is more at risk is 10% where return is 50%. This investors with indicates that when short sales are allowed the investor will get more excess return per unit of risk. The optimum frontier for the minimum risk with short sales is shown in the above graph. All the investors who are allowed to short sale hold
24
Optimum Point
the portfolio A. But their portion of investment in optimum portfolio and riskless asset depends on their personal risk preference.
Chapter-6: ConclusionInvestor select their portfolio based on expected risk and expected return. If the
expectation of the investors change in respect of risk or return can be changed and as a result the structure of the optimum portfolio can change. The calculation of the optimum portfolio is based on the historical data. So, any change in the micro or macro level environment can change the realized return in the future, In that case, the maximum return we expect cannot be maximum or the minimum risk that we have chosen cannot be minimum, For example, if the risk free rate in the economy is increased as a result of fundamental change in the economy, this can shift the CML line in the upward direction and this change the optimum portfolio determined in the past.
In line with the respective weights of each individual security, the investor should also apply his subjective judgment in selecting the portfolio. The efficiency, integrity, reputation and honesty of the issuer company must also be considered in selecting a security for investor. In addition, the company with the strong fundaments should only be considered to include in the portfolio. Otherwise, the investor can be short time gainer but he will be the ultimate loser
.
25
Bibliography:
We have collected data from the following sources to prepare the report :
Books:1. Investment analysis and Portfolio management By- Reilly/ Brown2. Investments By Bodie/Kane/ Marcus3. Modern portfolio theory and investment analysis by Elton, Gruber
Periodicals:1. Annual Report of Bangladesh Bank for 2011-2012
Websites:1. www.en-wikipedia.org
2. www.dsebd.org
3. www.stock-bd.com
26

27