Embed Size (px)
Citation preview

SINTEF Fisheries and Aquaculture SINTEF Fisheries and Aquaculture 2014-07-03
A26219- Unrestricted
Report
Employment in EU Fish Processing Industry based on Norwegian Seafood Export Author(s) Roger Richardsen Kristian Henriksen

PROJECT NO. 6021 338
REPORT NO. A26219
VERSION Final
2 of 18
Document history VERSION DATE VERSION DESCRIPTION
Version No.1 2014-07-03 Final version

PROJECT NO. 6021 338
REPORT NO. A26219
VERSION Final
3 of 18
Table of contents
1 Preface .......................................................................................................................................... 4
2 Methodology ................................................................................................................................. 4 2.1 Data sources ................................................................................................................................... 5
3 The EU Seafood Market ................................................................................................................. 6
4 Norwegian Seafood Export to EU ................................................................................................. 10
5 Employment and Economic Performance of the EU Processing Industry ........................................ 11
6 Employment Effects in EU Seafood Processing Industry ................................................................ 13 6.1 Direct employment effect ............................................................................................................ 14 6.2 Spin-off employment effects ....................................................................................................... 14 6.3 Conclusion .................................................................................................................................... 16
7 References .................................................................................................................................. 18
A Statistics...................................................................................................................................... 18
APPENDICES
Norwegian Seafood Export to EU, 2004 - 2013
PROJECT NO. 6021 338
REPORT NO. A26219
VERSION Final
4 of 18
1 Preface The European Union (EU) is the most important market area for Norwegian seafood export. At the same time Norway is among the most important providers of consistent and sustainable supply of raw materials to EU seafood industry for value adding processing of products to satisfy consumer demands within local market areas. Based on these facts, The Norwegian Seafood Federation has initiated this report to estimate the effect of employment numbers in the EU fish processing industry due to imports of seafood from Norway. This work shall include employment based on both Norwegian farmed salmon export, as well as wild-capture species. The work is elaborated on the basis of best available public statistics and secondary data. The work has been funded by The Norwegian Seafood Research Fund (FHF).
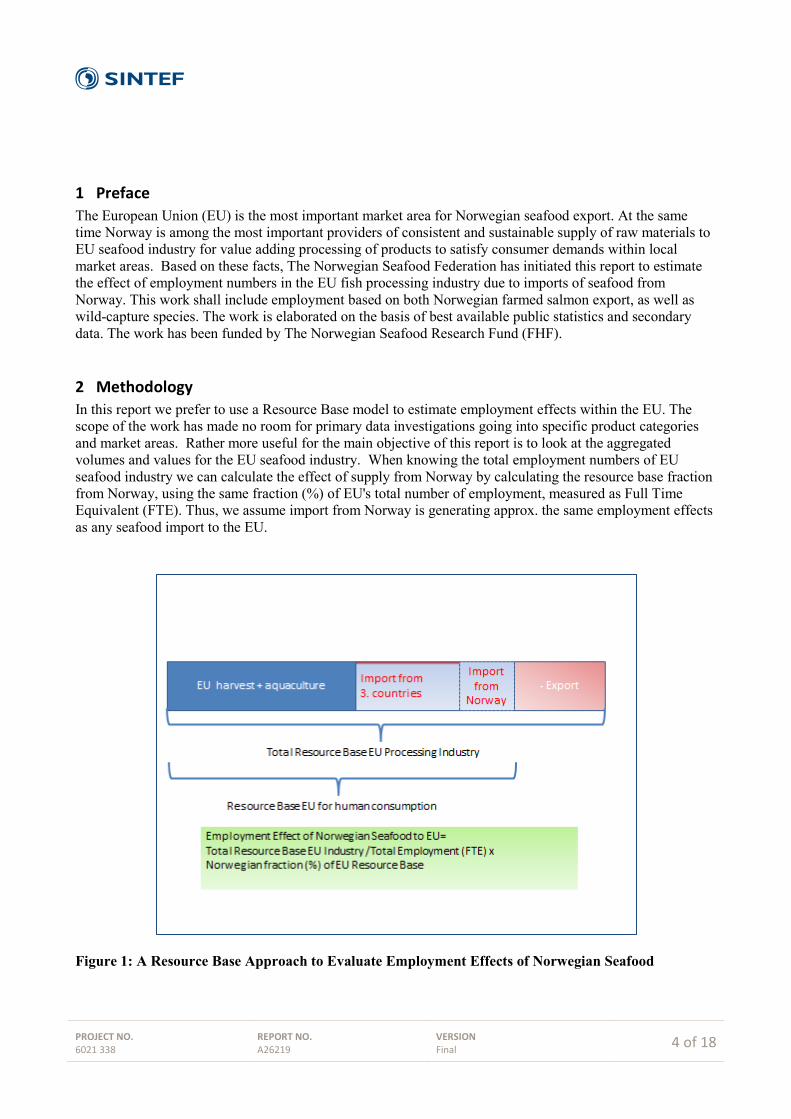
2 Methodology In this report we prefer to use a Resource Base model to estimate employment effects within the EU. The scope of the work has made no room for primary data investigations going into specific product categories and market areas. Rather more useful for the main objective of this report is to look at the aggregated volumes and values for the EU seafood industry. When knowing the total employment numbers of EU seafood industry we can calculate the effect of supply from Norway by calculating the resource base fraction from Norway, using the same fraction (%) of EU's total number of employment, measured as Full Time Equivalent (FTE). Thus, we assume import from Norway is generating approx. the same employment effects as any seafood import to the EU.
Figure 1: A Resource Base Approach to Evaluate Employment Effects of Norwegian Seafood
PROJECT NO. 6021 338
REPORT NO. A26219
VERSION Final
5 of 18
In this report, only direct export from Norway to any EU member state is accounted for. It could be argued that some volumes of raw material go to non EU markets for primary processing,1 ending up in EU for secondary processing (value adding), thus giving additional economic effects in the EU. However, it would be substantial technical and methodical problems associated with estimating valid data for such global trade in seafood. Therefore, such side-effects of global seafood trade via third-countries have not been included here.
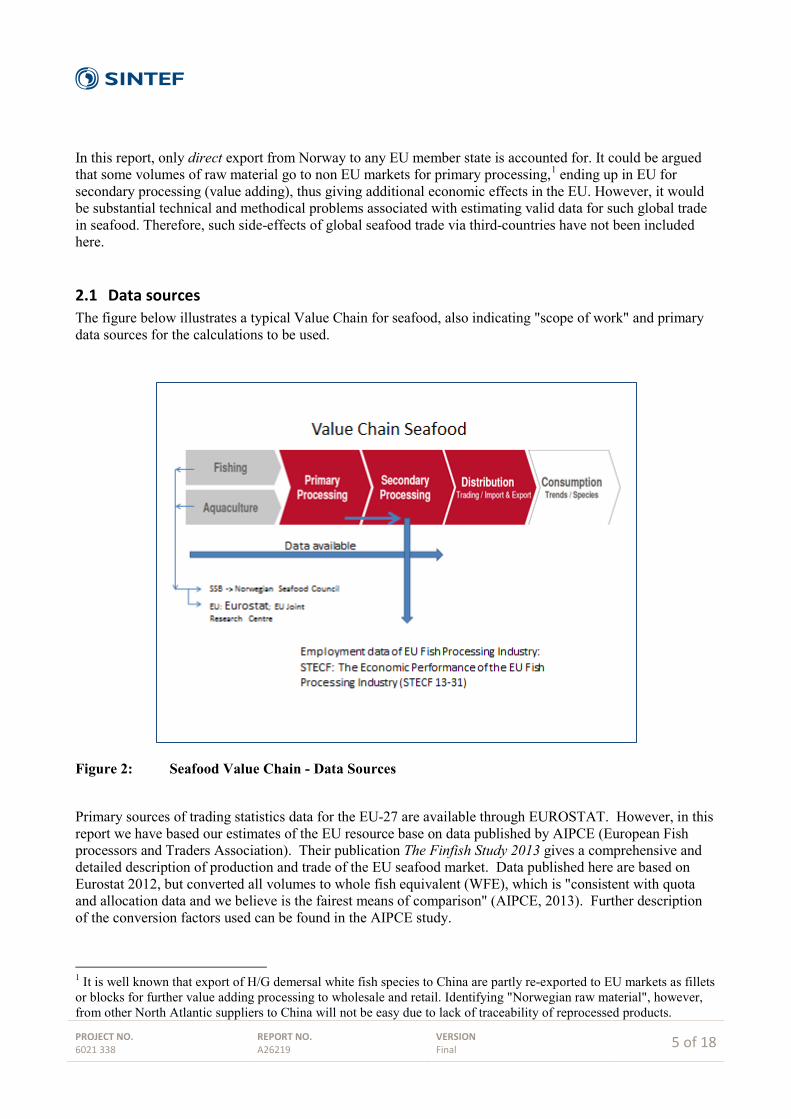
2.1 Data sources The figure below illustrates a typical Value Chain for seafood, also indicating "scope of work" and primary data sources for the calculations to be used.
Figure 2: Seafood Value Chain - Data Sources
Primary sources of trading statistics data for the EU-27 are available through EUROSTAT. However, in this report we have based our estimates of the EU resource base on data published by AIPCE (European Fish processors and Traders Association). Their publication The Finfish Study 2013 gives a comprehensive and detailed description of production and trade of the EU seafood market. Data published here are based on Eurostat 2012, but converted all volumes to whole fish equivalent (WFE), which is "consistent with quota and allocation data and we believe is the fairest means of comparison" (AIPCE, 2013). Further description of the conversion factors used can be found in the AIPCE study.
1 It is well known that export of H/G demersal white fish species to China are partly re-exported to EU markets as fillets or blocks for further value adding processing to wholesale and retail. Identifying "Norwegian raw material", however, from other North Atlantic suppliers to China will not be easy due to lack of traceability of reprocessed products.
PROJECT NO. 6021 338
REPORT NO. A26219
VERSION Final
6 of 18
Data for the economic capacities, including total employment figures for the EU fish processing sector, is based on the latest report from the Scientific, Technical and Economic Committee for Fisheries (STECF). In their report The Economic Performance of the EU Fish Processing Industry, comprehensive data of employment and economic performance of the EU fish processing industry are investigated. The data relate to enterprises whose main activity is defined according to the Eurostat definition under NACE Code 15.20: ‘Processing and preserving of fish and fish products’. 2) This should cover all of the primary and secondary processing units in EU relevant for this study. The analysis of the economic performance of the fish processing sector in the EU is based on national statistics and data for the fish processing industry collected under the Data Collection Framework of the EU. Not all countries of the EU are requested to deliver data under the DCF. These include the five countries that do not have access to coastal waters (Austria, Czech Republic, Hungary, Luxembourg and Slovakia) and Croatia, which was not obliged to deliver data for 2011 as it joined the EU only last year. In the 2013 data call for the processing industry, the remaining 22 countries that are participating in the DCF framework were requested to provide data on enterprises that carry out fish processing as a main activity for 18 variables and for each year of the period 2008-2011. Furthermore, they were asked to provide numbers of enterprises and the turnover attributed to fish processing for enterprises that carry out fish processing but not as a main activity and for the first year of each programming period (i.e. 2008 and 2011). The latest report, (STECF – 13-31) was published by the end of 2013, containing data for the fish processing sector for the years 2008 – 2011. Based on this we use the data for 2011 as a baseline for measuring the employment effect of Norwegian seafood supply to EU. For the years later than that we don't have valid figures for the economic activities in the processing sector, but development trends can be discussed based on trends in the EU resource base of seafood, i.e. own production and import figures.
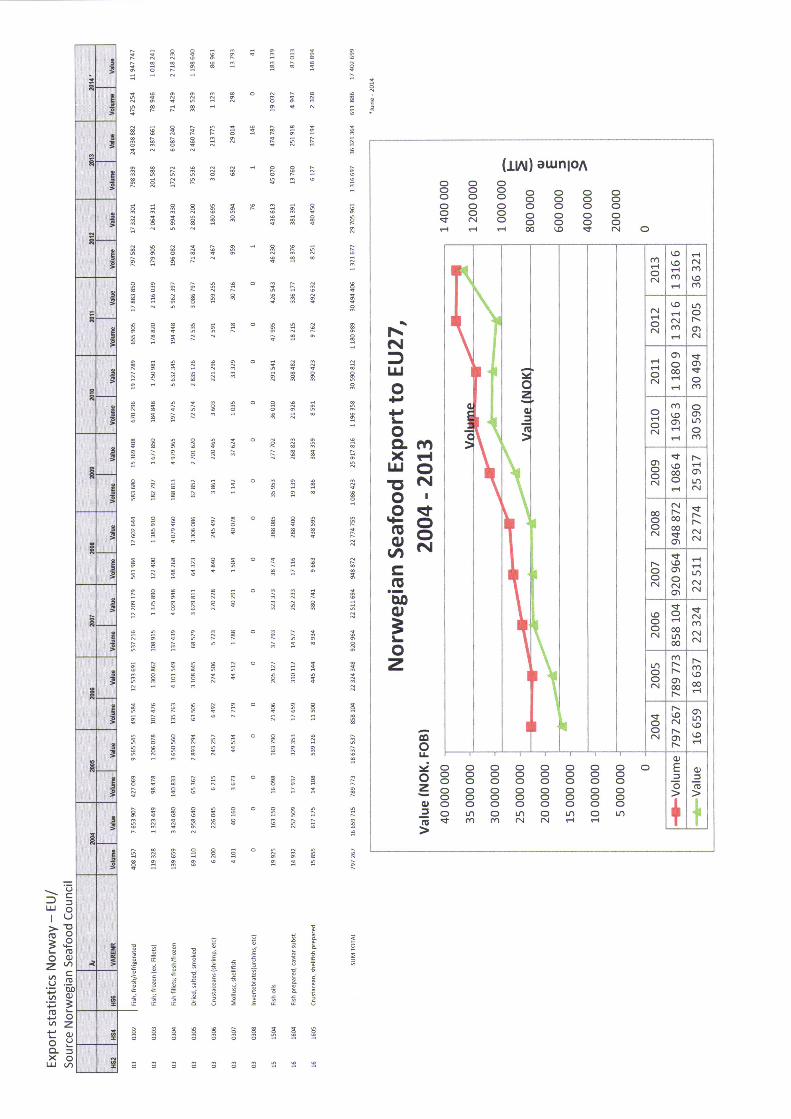
3 The EU Seafood Market The EU is a major consumption market of seafood products in the world with 12.3 million MT, representing EUR 52.2 billion in 2011. It is the biggest importer of seafood products, absorbing some 24 % of total world trade in value terms. EU consumption per capita is 24.5 kg (2011). It decreased by 5% between 2008 and 2010 and remained stable between 2010 and 2011. For 2012 fish consumption in Europe appears to have fallen by nearly 4 % to a level that is the lowest we have seen since the formation of EU25/27 (AIPCE, 2013). This is a change in trend after a robust growth in per capita consumption since 2000. Seafood consumption varies a lot from one Member State to the other. Northern Member States are more focused on processed fish while Southern Member States still favour fresh products and devote a larger part of household expenditures to fish. Central and Eastern European countries are below the EU average but register increase in consumption. Norway and China are the main EU suppliers. Norway has shown significant increases in volumes of seafood products exported to the EU as shown in Appendix 1. From close to 800.000 MT in 2004 to over 1.3 mill. tons in 2012. Norway slipped back slightly in 2013 seeing whitefish volumes shrink by 3 %. Altogether Norway contributes around 17 % of all wild-captured whitefish imports, but the proportion of this
2 The NACE Code 15.20 class includes: Preparation and preservation of fish, crustaceans and mollusks: freezing, deep-freezing, drying, smoking, salting, immersing in brine, canning, etc. Production of fish, crustacean and mollusk products: cooked fish, fish fillets, roes, caviar, caviar substitutes, etc. Production of prepared fish dishes. Production of fish-meal for animal feed

PROJECT NO. 6021 338
REPORT NO. A26219
VERSION Final
7 of 18
that need further processing is increasing. This is due to the changing profile of the Norwegian freezing fleet that has moved away from "frozen at sea" fillet processing to producing H&G (headed and gutted fish) that can be processed elsewhere (Aipce, 2013).
Figure 3: Import from non-member countries – by value (2012) Source: EUMOFA based on elaboration of EUROSTAT data China confirms its leading role as a processing country for white fish. EU imports of fish products from China had a value of EUR 1.55 billion and totalled 486,000 tons in volume in 2012, a decrease of 53,000 tons from 2011. Most of the fish products imported in the EU from China are filleted. Raw material used originated from EU countries, Norway (cod) and the Russian Federation (pollock).

PROJECT NO. 6021 338
REPORT NO. A26219
VERSION Final
8 of 18
Source: EUMOFA based on elaboration of EUROSTAT data The figure above gives an example of the proportion between each factor for the total activities within the EU seafood sector. A key message is the dependence that the EU market has on imported materials for its processing sector. Since the formation of EU-25/27 in 2006 this dependence as share of the market has hardly varied, remaining within the range of 63 % +/- 2 %. For 2012 this share was 64 % (AIPCE, 2013) In total over a long range period (2001 -2013) there has been a steady decline in self-sufficiency rate to the EU member states (EUMOFA, 2014). Almost 62% of total apparent consumption of both captured and farmed products was covered by 13 species, whose calculated consumption is illustrated in Table 1. It can be noted that 4 of the 7 most consumed species within EU are species where Norway has a dominant role as supplier. Table 1: Calculated consumption of most important species (kg, 2011)
|Main Commercial species
Per capita (Kg)
Wild Farmed
Tuna (canned)
2.14
100 %
0 %
Cod 1.96 98 % 2 % Salmon 1.72 2 % 98 % Pollack 1.64 100 % 0 % Herring 1.18 100 % 0 % Mussel 1.16 10 % 90 % Hake 0.94 100 % 0 % Mackerel 0.87 100 % 0 % Pangasius 0.80 0 % 100 %
Source: EUMOFA, European Market Observatory for Fisheries and Aquaculture Products
Figure 4 Supply balance in 2011 (live weight equivalent)
PROJECT NO. 6021 338
REPORT NO. A26219
VERSION Final
9 of 18
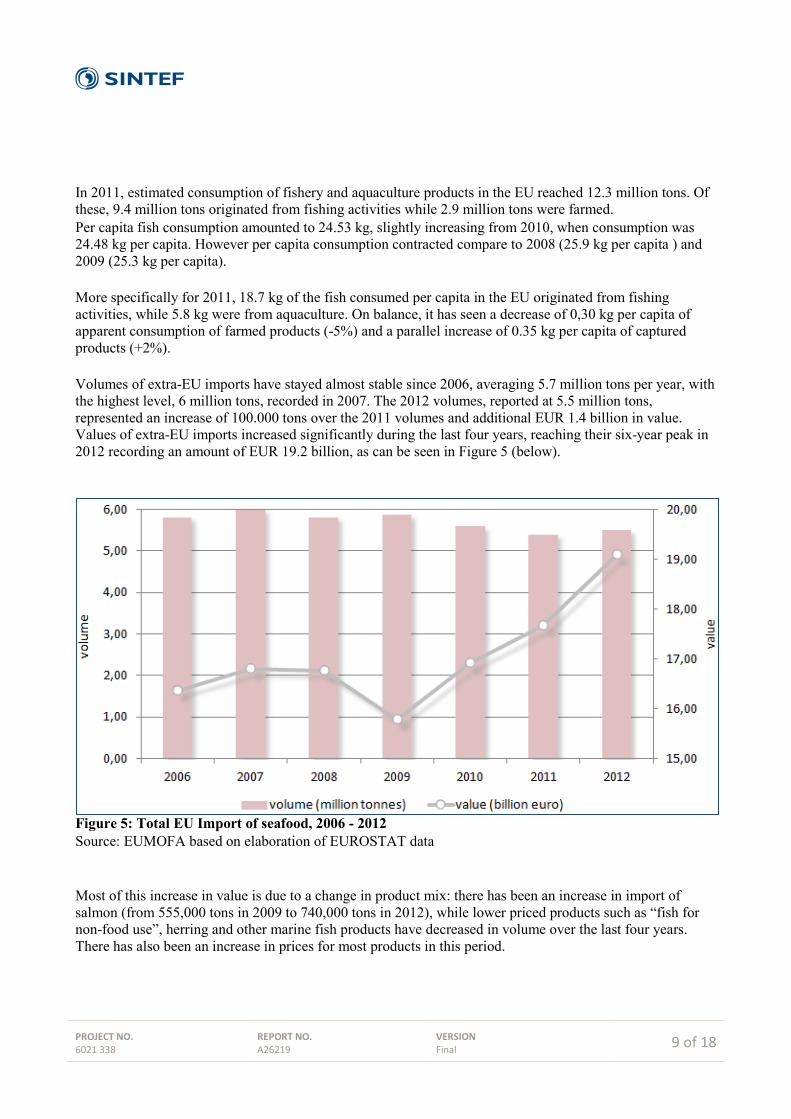
In 2011, estimated consumption of fishery and aquaculture products in the EU reached 12.3 million tons. Of these, 9.4 million tons originated from fishing activities while 2.9 million tons were farmed. Per capita fish consumption amounted to 24.53 kg, slightly increasing from 2010, when consumption was 24.48 kg per capita. However per capita consumption contracted compare to 2008 (25.9 kg per capita ) and 2009 (25.3 kg per capita). More specifically for 2011, 18.7 kg of the fish consumed per capita in the EU originated from fishing activities, while 5.8 kg were from aquaculture. On balance, it has seen a decrease of 0,30 kg per capita of apparent consumption of farmed products (-5%) and a parallel increase of 0.35 kg per capita of captured products (+2%). Volumes of extra-EU imports have stayed almost stable since 2006, averaging 5.7 million tons per year, with the highest level, 6 million tons, recorded in 2007. The 2012 volumes, reported at 5.5 million tons, represented an increase of 100.000 tons over the 2011 volumes and additional EUR 1.4 billion in value. Values of extra-EU imports increased significantly during the last four years, reaching their six-year peak in 2012 recording an amount of EUR 19.2 billion, as can be seen in Figure 5 (below).
Figure 5: Total EU Import of seafood, 2006 - 2012 Source: EUMOFA based on elaboration of EUROSTAT data Most of this increase in value is due to a change in product mix: there has been an increase in import of salmon (from 555,000 tons in 2009 to 740,000 tons in 2012), while lower priced products such as “fish for non-food use”, herring and other marine fish products have decreased in volume over the last four years. There has also been an increase in prices for most products in this period.
PROJECT NO. 6021 338
REPORT NO. A26219
VERSION Final
10 of 18
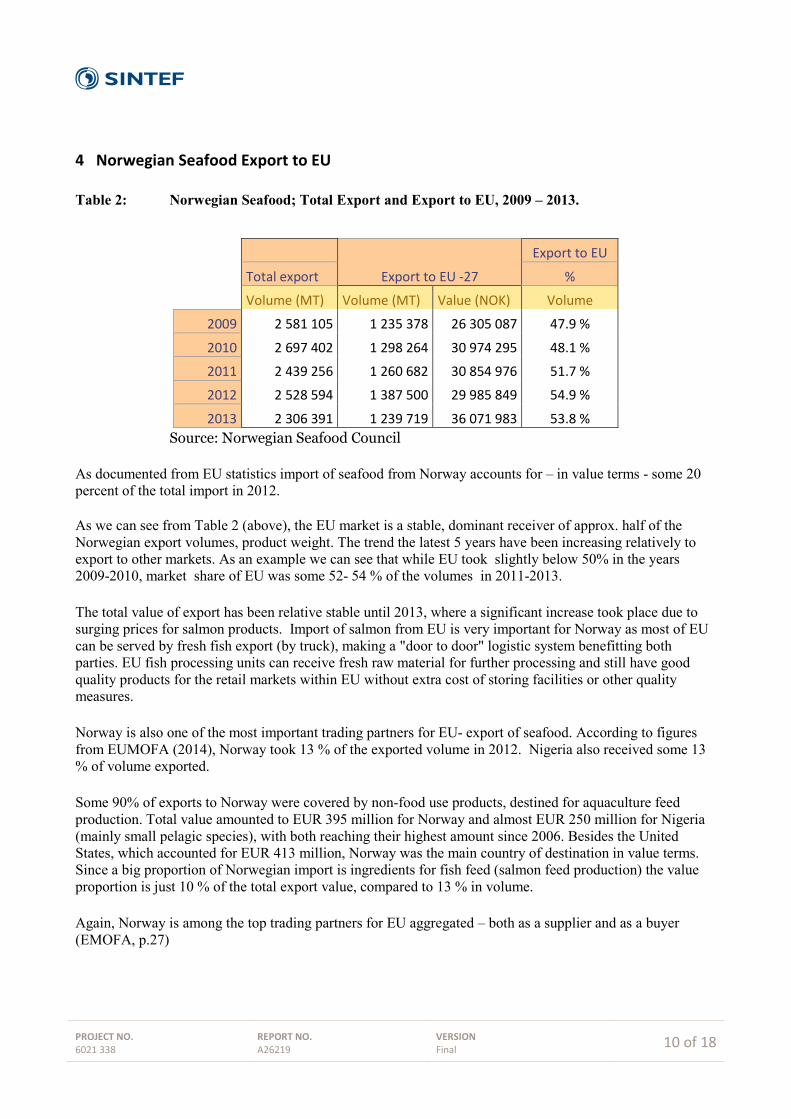
4 Norwegian Seafood Export to EU Table 2: Norwegian Seafood; Total Export and Export to EU, 2009 – 2013.
Export to EU -27
Export to EU
Total export %
Volume (MT) Volume (MT) Value (NOK) Volume
2009 2 581 105 1 235 378 26 305 087 47.9 %
2010 2 697 402 1 298 264 30 974 295 48.1 %
2011 2 439 256 1 260 682 30 854 976 51.7 %
2012 2 528 594 1 387 500 29 985 849 54.9 %
2013 2 306 391 1 239 719 36 071 983 53.8 % Source: Norwegian Seafood Council As documented from EU statistics import of seafood from Norway accounts for – in value terms - some 20 percent of the total import in 2012. As we can see from Table 2 (above), the EU market is a stable, dominant receiver of approx. half of the Norwegian export volumes, product weight. The trend the latest 5 years have been increasing relatively to export to other markets. As an example we can see that while EU took slightly below 50% in the years 2009-2010, market share of EU was some 52- 54 % of the volumes in 2011-2013. The total value of export has been relative stable until 2013, where a significant increase took place due to surging prices for salmon products. Import of salmon from EU is very important for Norway as most of EU can be served by fresh fish export (by truck), making a "door to door" logistic system benefitting both parties. EU fish processing units can receive fresh raw material for further processing and still have good quality products for the retail markets within EU without extra cost of storing facilities or other quality measures. Norway is also one of the most important trading partners for EU- export of seafood. According to figures from EUMOFA (2014), Norway took 13 % of the exported volume in 2012. Nigeria also received some 13 % of volume exported. Some 90% of exports to Norway were covered by non-food use products, destined for aquaculture feed production. Total value amounted to EUR 395 million for Norway and almost EUR 250 million for Nigeria (mainly small pelagic species), with both reaching their highest amount since 2006. Besides the United States, which accounted for EUR 413 million, Norway was the main country of destination in value terms. Since a big proportion of Norwegian import is ingredients for fish feed (salmon feed production) the value proportion is just 10 % of the total export value, compared to 13 % in volume. Again, Norway is among the top trading partners for EU aggregated – both as a supplier and as a buyer (EMOFA, p.27)
PROJECT NO. 6021 338
REPORT NO. A26219
VERSION Final
11 of 18
5 Employment and Economic Performance of the EU Processing Industry Information under this chapter is based on data sampled by fisheries economists from Joint Research Centre (JRC) and specialists under the Scientific, Technical and Economic Committee for Fisheries (STECF). The report, also known as 2013 Annual Economic Report on the EU Fish Processing Industry is the forth report of its kind produced for the sector and provides a comprehensive overview of the latest information available on the structure, social, economical and competitive performance of the fish processing industry at the national and EU level. Overall the countries of the European Union are forming one of the main fish importing and processing regions in the world. The demand for fish products in the EU is much larger than can be provided by the European fishing fleet. The access to the world market is, therefore, of great importance. The economic crisis from 2008 influenced the economic performance of the industry which has become worse during the reporting period and especially from 2010 to 2011. According to Member States DCF data submissions, the total number of enterprises in the European fish processing industry sector in 2011 was around 3.5 thousands, 56% of which have less than 10 employees and another 30% with the number of employees between 11 and 49. Over the reporting period, the total number of enterprises decreased by 2%. However, while the number of larger firms declined, explaining the trend observed at the aggregated level, the enterprises employing less than 10 people increased by 5%. According to the data submitted by EU member states, the number of workers employed in the European fish processing industry in 2011 was approx. 112.000. Trend analyses suggest the total number of people employed in the sector shrank by 3% from 2008 to 2009 and then remained quite stable until 2011. Over the same period, the total FTEs decreased less than the total number of workers in the industry, showing a slight tendency towards an increase in the full time employment (the higher the ratio of FTE to total employed, the higher the full-time employment). As well as number of businesses, workers and FTEs, the average number of FTEs per enterprise declined over the period 2008 and 2011 (by 2%). On the other hand, average wage and labour productivity, respectively measured as cost of labour and gross value added per FTE, show little improvement (+ 2% and +4%). Socio-economic data submitted by Member States also suggest that most workers employed in the sector are women and that the proportion of male/female employees has been rather constant over time. Therefore, as in Norway, seafood processing industry is a vital factor for employment of women, often in rural areas without too many alternatives of this kind.

PROJECT NO. 6021 338
REPORT NO. A26219
VERSION Final
12 of 18
Table 3: European fish processing industry sector overview, 2008 - 2011
Source: STECF- 2013 Annual Economic Report on the EU Fish Processing Industry, p. 26 In 2011 Spain possessed the biggest fish processing industry in terms of number of enterprises and people employed, respectively constituting 15% and 18% of the total EU 25 figures. Italy and United Kingdom followed in terms of number of firms (respectively 18% and 15% of the total), France and Poland in terms of employment (both 16% of the total). All these countries are main trading partners of Norwegian seafood export. Employment in the fish processing industry increased for several countries (e.g. France and Portugal); it decreased for others (e.g. Spain and Poland). In general terms, changes in number of enterprises fluctuated between -71% for Malta and +69% for Romania (-2% at EU level) and in the number of employees between -65% for Bulgaria and +130% for Romania (-3% for the EU total). It is interesting to note that, while the number of enterprises carrying out fish processing as a main activity increased or remained constant in all the East European MS over the reporting period, the fish processing industry of most western countries shrunk, sometimes drastically as in the case of Malta, where the number of firms decreased from 7 in 2011 to only 2 in 2008 and the number of employees almost halved. It can also be seen from the data that the increase in the total number of firms is not always coupled with growth at the employment level. This can be explained by the fact that for some countries the increase is limited to small businesses and is accompanied by a decrease in the number of large companies. This trend, very pronounced in the case of Bulgaria, can be observed also for Latvia, Poland and Estonia.
PROJECT NO. 6021 338
REPORT NO. A26219
VERSION Final
13 of 18
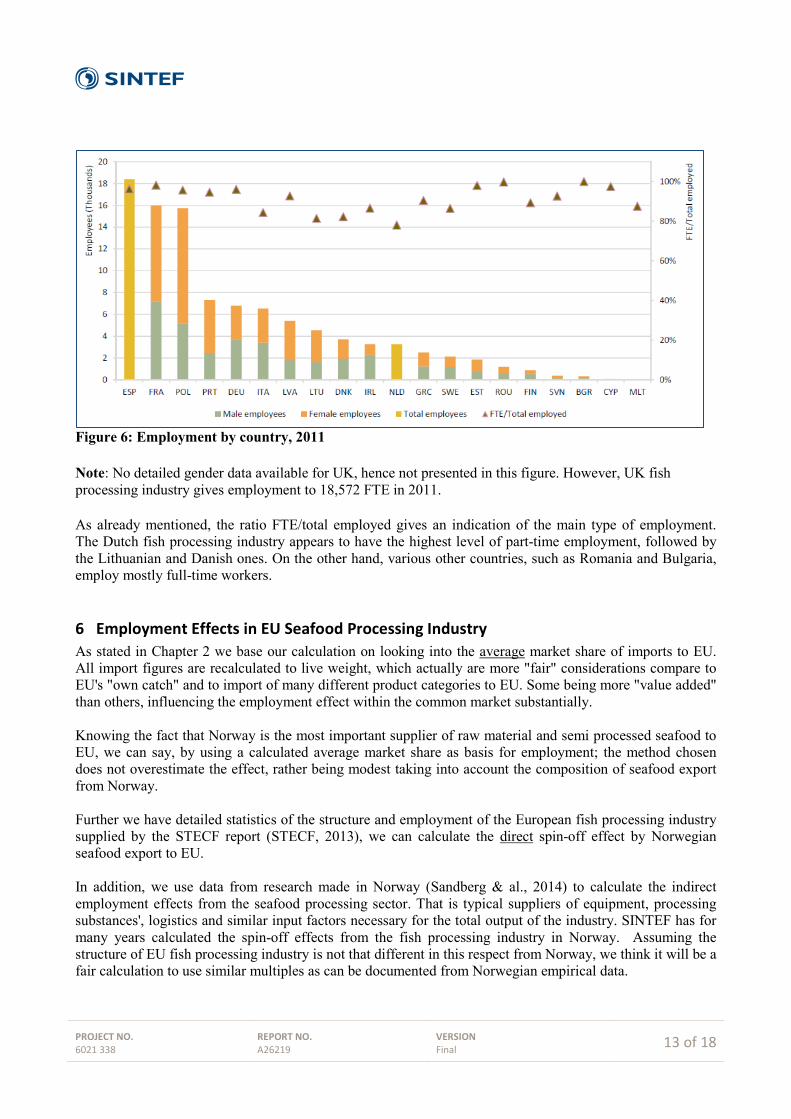
Figure 6: Employment by country, 2011 Note: No detailed gender data available for UK, hence not presented in this figure. However, UK fish processing industry gives employment to 18,572 FTE in 2011. As already mentioned, the ratio FTE/total employed gives an indication of the main type of employment. The Dutch fish processing industry appears to have the highest level of part-time employment, followed by the Lithuanian and Danish ones. On the other hand, various other countries, such as Romania and Bulgaria, employ mostly full-time workers.
6 Employment Effects in EU Seafood Processing Industry As stated in Chapter 2 we base our calculation on looking into the average market share of imports to EU. All import figures are recalculated to live weight, which actually are more "fair" considerations compare to EU's "own catch" and to import of many different product categories to EU. Some being more "value added" than others, influencing the employment effect within the common market substantially. Knowing the fact that Norway is the most important supplier of raw material and semi processed seafood to EU, we can say, by using a calculated average market share as basis for employment; the method chosen does not overestimate the effect, rather being modest taking into account the composition of seafood export from Norway. Further we have detailed statistics of the structure and employment of the European fish processing industry supplied by the STECF report (STECF, 2013), we can calculate the direct spin-off effect by Norwegian seafood export to EU. In addition, we use data from research made in Norway (Sandberg & al., 2014) to calculate the indirect employment effects from the seafood processing sector. That is typical suppliers of equipment, processing substances', logistics and similar input factors necessary for the total output of the industry. SINTEF has for many years calculated the spin-off effects from the fish processing industry in Norway. Assuming the structure of EU fish processing industry is not that different in this respect from Norway, we think it will be a fair calculation to use similar multiples as can be documented from Norwegian empirical data.

PROJECT NO. 6021 338
REPORT NO. A26219
VERSION Final
14 of 18
6.1 Direct employment effect To calculate the direct effect within fish processing of Norwegian export we use the Norwegian proportion of EU's total resource base for the latest years. From Table 5 (below) we can see that Norway's market share of the total import is around 20 %. Further, based on the total resource base 2010 – 2012 including own catch in EU, we can see that Norwegian supply accounts for and average of 10 % in the period. Table 4: Total Import to EU specified to product categories and Norwegian share, 2010 -2012.
(Note: All volumes recalculated to live weight)
Source: SINTEF calculations based on EUROSTAT – Comext Statistics published by AIPCE 2013
This means that of the total of 115,677 Full Time Equivalent employment (FTE) in EU in 2011, some 11,567 FTE was directly related to import of Norwegian raw materials for the industry. It can also be noted that Norway's market share is slightly increasing in 2012, indicating a further growth on the employment effect for similar calculations in 2012. However, data for 2012 of the EU Fish processing industry will not be available until the end of 2014, thus can't be precisely evaluated in this report.
6.2 Spin-off employment effects To calculate the indirect effect of economic activity within the seafood industry we have to use available data from Norway, where SINTEF, funded by The Norwegian Seafood Research Fund, has made a series of reports on spin-off effects from the total activity of the Norwegian seafood industry. Primary data from EU industry have not been possible to establish.
NOR %Import EU Import -Norway Import EU Import -Norway Import EU Import -Norway of Import
(Metric tons)Import of wild captured whitefish (cod, saithe,redfish,haddock,hake,Alask.Pol., hoki 2 452 944 423 309 2 613 173 427 691 2 503 072 416 338 16,6 %Plaice 6 151 1 554 5 555 1 693 5 852 1 421 24,3 %Surimi 253 046 0 277 560 0 260 250 0 0,0 %Freshwater fish (other than tilapia, pangasius and nile perch 118 986 109 821 67 526 0 0,0 %Pangasius 703 961 617 077 492 672 0,0 %Nile Perch 70 238 61 631 65 926 0,0 %Tilapia 42 214 42 093 35 430 0,0 %Salmon spp. 914 387 684 266 944 254 711 612 1 072 136 844 917 78,8 %Tuna spp. 1 145 190 1 202 474 1 148 627 0,0 %Herring spp. 459 537 328 916 401 484 294 496 323 866 250 656 77,4 %Mackerel spp 83 832 24 365 108 505 17 006 126 784 24 468 19,3 %Shrimp spp. 954 966 1 000 946 619 1 000 874 023 3 000 0,3 %Cephalopods spp. 510 646 497 032 464 505
Total import (live weight) 7 716 098 1 463 410 7 827 278 1 453 498 7 440 669 1 540 800 20,7 %Norwegian market share of EU import 19,0 % 18,6 % 21 %
Total EU /Own catch + import 15 533 014 15 903 993 15 329 441Non Food 1 000 000 1 000 000 700 000Total EU resource base for consumption 14 533 014 14 903 993 14 629 441Norwegian market share of total supply 10,1 % 9,8 % 10,5 %
2010 2011 2012
PROJECT NO. 6021 338
REPORT NO. A26219
VERSION Final
15 of 18
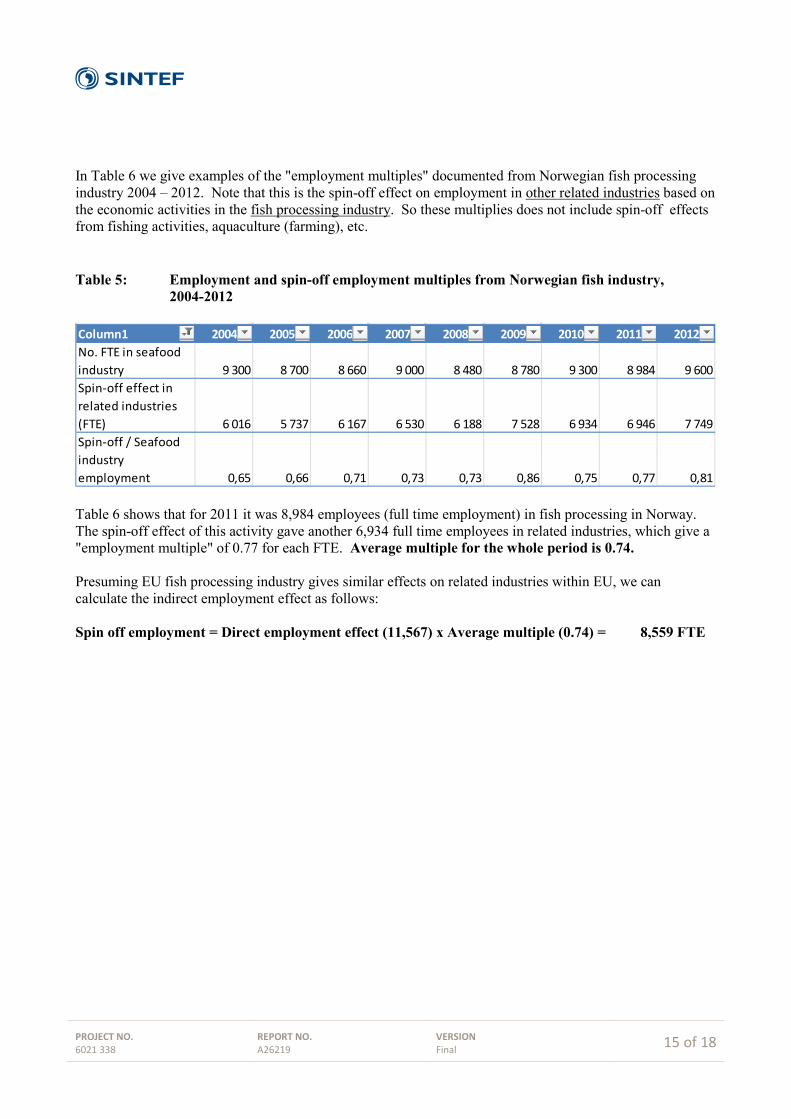
In Table 6 we give examples of the "employment multiples" documented from Norwegian fish processing industry 2004 – 2012. Note that this is the spin-off effect on employment in other related industries based on the economic activities in the fish processing industry. So these multiplies does not include spin-off effects from fishing activities, aquaculture (farming), etc. Table 5 : Employment and spin-off employment multiples from Norwegian fish industry, 2004-2012
Table 6 shows that for 2011 it was 8,984 employees (full time employment) in fish processing in Norway. The spin-off effect of this activity gave another 6,934 full time employees in related industries, which give a "employment multiple" of 0.77 for each FTE. Average multiple for the whole period is 0.74. Presuming EU fish processing industry gives similar effects on related industries within EU, we can calculate the indirect employment effect as follows: Spin off employment = Direct employment effect (11,567) x Average multiple (0.74) = 8,559 FTE
Column1 2004 2005 2006 2007 2008 2009 2010 2011 2012No. FTE in seafood industry 9 300 8 700 8 660 9 000 8 480 8 780 9 300 8 984 9 600Spin-off effect in related industries (FTE) 6 016 5 737 6 167 6 530 6 188 7 528 6 934 6 946 7 749Spin-off / Seafood industry employment 0,65 0,66 0,71 0,73 0,73 0,86 0,75 0,77 0,81

PROJECT NO. 6021 338
REPORT NO. A26219
VERSION Final
16 of 18
6.3 Conclusion Based on calculations on best available data (2011) we can conclude the effect of Norwegian seafood export to EU.
Direct employment effect in fish processing industry: 1͌2,000 FTE
Spin-off effects in related industry: ͌ 9,000 FTE Total effect of Norwegian seafood 21,000 FTE
As a main conclusion it is clear that Norwegian marine resources, including aquaculture creates more jobs in EU than it does inside Norway. While Norwegian direct employment in the fish processing industry roughly fluctuates around 9,000 full time employees, export to EU creates around 12,000 full time jobs there. Using the same spin-off effect as documented from Norway means Norwegian seafood export gives full time employment for some 21,000 persons within the European Union. This might be seen as a paradox, but has several (economic) explanations:
1. Cost of labour Fish processing still is rather labour-intensive. Although a steady tendency towards automation of some of the processes involved, processing seafood raw material still need skilled workers. It is well known that the cost of labour in Norway is much higher than the average EU level. For example, the average wage in the EU processing industry was EUR 28,700 in 2011 (at the same level as in 2009) (STECF, 2013). In Norway the cost for a full time employee would be around EUR 45- 48,000, social costs included. Some costs have been regained by a steady improvement in labour productivity, but as long as there are no significant barriers of entry for technological innovations, Norway can not eliminate a higher production cost easily. Poland is a good example of the effect of lower production cost leading to competitive advantage in industrial processing. The fish processing industry in Poland is strong and still developing. It has the ability to generate profits for the companies and jobs and income for the involved workers. In 2011 the turnover increased to 1.8 billion Euros, an increase of 7% compared to the previous year and 21% compared to 2008. The average number of employees was 15,726, representing a decrease of 3% compared to 2008. Most employees worked full-time and FTE amounted to 15,051. In 2011, as in previous years, a key driver of fish processing sector development was the foreign trade of raw materials and final products. Imports played a dominant role in the supply of raw materials because of a limited ability to harvest fish from the Baltic Sea and the limited production of aquaculture. The share of revenues from direct exports in fish processing companies’ turnover accounted for 55%. Poland has become a competitive seafood processing unit for import from Norway and for re-export to other EU member states.
2. Trading tariffs The nature of trading tariffs between Norway and EU market is such that "the less processed – the less custom duty." Originally, import taxes are used to protect primary producers to foreign (cheaper) competition, but can have a reverse effect on the processing industry established to process value added products for the consumer market when national resources becomes scarce – as it is
PROJECT NO. 6021 338
REPORT NO. A26219
VERSION Final
17 of 18
with seafood. Anyway, differentiation of import duties can explain why many Norwegian companies – in particular related to processing of farmed salmon – have invested heavily in processing facilities within EU, rather than in Norway. Based on an article in the fishing magazine Norsk Fiskerinæring (No 11/12-2013) we can see all the major fish farming companies having several processing units established within vital EU countries, in particular France, Poland, Holland and Sweden. Based on this article we can estimate that at least some 16 companies own processing companies in EU. These companies create at least about 6,000 jobs, fishing and aquaculture excluded.
3. Marketing issues Market competence is a vital issue for success at the highly competitive consumer level. Investing in such competence is costly, and a barrier of entry for many rather small processing companies in Norway. Production of consumer value added products in Norway then need an "extra" competence on top of economic competitive cost of production compared to "native" processing units.
4. Quality issues It is well known that natural skin on products keeps quality parameters better than processed, skin off, bone out products. In particular with fresh fish products, which for many years have been the innovative product category in EU, this gives a prolonged shelf life throughout the value chain. Thus, giving processing units "nearest possible the consumer end" a competitive advantage.
With regard to seafood, there is a strong interdependency between Norway and EU. Norway is the most important country to supply seafood to the consumer markets in Europe. Totally some 1.3 million tons each year accounts for around 20% of total import to EU-27. Most of the EU stocks are at the moment fully exploited (FAO) and it is not expected that raw materials from EU fisheries will/or can increase in the near future. At the same time EU is the biggest market area for seafood from Norway, taking some 50 – 55 % of total export volumes. Norway is even one of top two markets for export of marine products from EU, taking 13 % of exported goods, mostly fish oil and fish meal for aquaculture feed production.
Based on available statistical data we find that Norway accounts for approx. 10% of the total resource base for the EU fish processing sector. This gives a direct employment effect of approx. 12,000 full time equivalents (FTE). Additional the spin-off effects of Norwegian seafood export to related industries within EU summaries to 9,000 FTE. In total we conclude the employment effect of Norwegian seafood to EU to 20,600 FTE based on data for 2011. Trading statistics for 2012-2013 indicate that effects are stable or slightly increasing.

PROJECT NO. 6021 338
REPORT NO. A26219
VERSION Final
18 of 18
7 References AIPCE-CEP. EU Fish Processors and Traders Association: Finfish Study 2013. Brussels, December 2013. Döring, R and Borello, A. (Ed.) Scientific, Technical and Economic Committee for Fisheries (STECF), 2013. The Economic Performance on the EU Fish Processing sector (STECF -13-31). 2013. Publications Office of the European Union, Luxembourg, EUR 26444 EN, JRC 87692, 223 pp. EUMOFA – European Market Observatory for Fisheries and Aquaculture Products: The EU Fish Market. 2014 Edition. http://www.ec.europa.eu/fisheries/market-observatory Directorate-General for Maritime Affairs and Fisheries of the European Commission. European Commission, Fisheries: Facts and figures on the Common Fisheries Policy. Basic statistical data.2014 Edition. Publications Office of the European Union, 2014. ISBN 978-92-79-34192-2 Norsk Fiskerinæring, No 11/12-2013: Norsk sjømatnæring i utlandet: 23 milliarder- 19.500 ansatte Glitnir Seafood Research, 2008: EU Seafood Industry Report. Glitnir Bank, April 2008. Sandberg,M., Henriksen,K.,Aspaas,S.,Bull-Berg,H. og Johansen, U. (2014): Verdiskaping og sysselsetting i norsk sjømatnæring. En ringvirkningsanalyse med fokus på 2012. SINTEF rapport A 26088. ISBN 978-82-14-05720-1. (In Norwegian)
A Statistics Norwegian Seafood Export to EU 27, 2004 – 2013 Source: Norwegian Seafood Council

Technology for a better society www.sintef.no