Embed Size (px)
Citation preview

Arnold Schwarzenegger Governor
ECONOMIC STUDY OF BIOENERGYPRODUCTION FROM DIGESTERS AT
DAIRIES IN CALIFORNIA
Prepared For: California Energy Commission Public Interest Energy Research Program
Prepared By: Princeton Energy Resources International, LLC
PIER
FIN
AL P
ROJE
CT R
EPOR
T
December 2008 CEC 500-xx-xxx

Prepared By: Princeton Energy Resources International, LLC Nicholas Cheremisinoff, Kathryn George, Joseph Cohen Rockville, Maryland 20852 Commission Contract No. 500-06-013 Commission Work Authorization No: 019-P-06
Prepared For:
Public Interest Energy Research (PIER) Program California Energy Commission
Zhiqin Zhang Contract Manager Gerry Braun Program Area Lead PIER Renewables Ken Koyama Office Manager Energy Generation Research Martha Krebs Deputy Director ENERGY RESEARCH & DEVELOPMENT DIVISION Melissa Jones Executive Director
DISCLAIMER
This report was prepared as the result of work sponsored by the California Energy Commission. It does not necessarily represent the views of the Energy Commission, its employees or the State of California. The Energy Commission, the State of California, its employees, contractors and subcontractors make no warrant, express or implied, and assume no legal liability for the information in this report; nor does any party represent that the uses of this information will not infringe upon privately owned rights. This report has not been approved or disapproved by the California Energy Commission nor has the California Energy Commission passed upon the accuracy or adequacy of the information in this report.

Preface
The Public Interest Energy Research (PIER) Program supports public interest energy research and development that will help improve the quality of life in California by bringing environmentally safe, affordable and reliable energy services and products to the market place. The PIER Program, managed by the California Energy Commission (Energy Commission), conducts public interest research, development, and demonstration (RD&D) projects to benefit California. The PIER Program strives to conduct the most promising public interest energy research by partnering with RD&D entities, including individuals, businesses, utilities, and public or private research institutions.
• PIER funding efforts are focused on the following RD&D program areas: • Building End‐Use Energy Efficiency • Energy Innovations Small Grants • Energy‐Related Environmental Research • Energy Systems Integration • Environmentally Preferred Advanced Generation • Industrial/Agricultural/Water End‐Use Energy Efficiency • Renewable Energy Technologies • Transportation
The Economic Study of Bio‐Energy Production from Digesters at Dairies in California is the final report for project work authorization #019‐P‐06 conducted by the Princeton Energy Resources International, LLC. The information from this project contributes to PIER’s Renewable Energy Technologies Program. For more information about the PIER Program, please visit the Energy Commission’s website at www.energy.ca.gov/pier or contact the Energy Commission at 916‐654‐5164.

1
Table of Contents
Acknowledgments.................................................................................................................... 3
Abstract ...................................................................................................................................... 4
Executive Summary ................................................................................................................. 5
1.0. Introduction ................................................................................................................. 9
2.0. Objectives ................................................................................................................... 11
3.0. Methodology.............................................................................................................. 12
4.0. Assumptions, Results, and Discussions................................................................. 17
4.1. Economic Study for Actual Cases ............................................................................. 17
4.2. Economic Study for No‐Subsidy Power Case ......................................................... 21
4.3. Economic Study for No‐Subsidy Pipeline‐Quality Gas Case................................ 24
4.4. Economic Study for Enhanced Environmental Quality Power and Pipeline‐Quality Gas Case ................................................................................................................ 29
4.5. Sensitivity Analysis ..................................................................................................... 35
4.6. Recent Favorable Utility Rate Structures ................................................................. 42
5.0. Conclusions................................................................................................................ 46
6.0. Recommendations..................................................................................................... 49
7.0. References................................................................................................................... 51
APPENDIX A – Assumptions, Inputs, and Results........................................................... 57
Table A‐ 1 Financial and Economic Assumptions ........................................................ 58
Table A‐ 2 Detailed Data Inputs for Nine Dairy Farm Digester Systems.................. 61
Table A‐ 3 Actual On‐Site Power LCOEs....................................................................... 98
Table A‐ 4 No Subsidy Power LCOEs ............................................................................ 99
Table A‐ 5 No Subsidy Pipeline‐Quality Gas LCOEs................................................. 100
Table A‐ 6 No Subsidy, Enhanced Environmental Quality Power LCOEs............. 101
Table A‐ 7 No Subsidy, Enhanced Environmental Quality Pipeline‐Quality Gas LCOEs ................................................................................................................................ 102

2
Table A‐ 8 Carbon Credit and PTC Power LCOEs ..................................................... 103
Table A‐ 9 Carbon Credit Pipeline‐Quality Gas LCOEs ............................................ 104
Table A‐ 10 No Subsidy Carbon Credit, PTC and Bonus Depreciation Power LCOEʹs for three plants.................................................................................................... 105
Table A‐ 11 No Subsidy Carbon Credit and Bonus Depreciation Pipeline Quality Gas LCOEʹs for three plants............................................................................................ 105
APPENDIX B – Two Financial Cash Flow Model Examples ......................................... 106
B.1 - Hilarides Dairy – No-Subsidy Power ................................................................... 107
B.2 - Hilarides Dairy – No-Subsidy Pipeline-Quality Gas ......................................... 117

3
Acknowledgments
Funding for this study was provided by the California Energy Commission. Specifically, the authors would like to thank Dr. Zhiqin Zhang, Project Manager and Mr. Gerry Braun,PIER Renewables Program Lead, California Energy Commission, for supporting the effort to develop and produce this study and for their insights to the analysis. The authors would like to thank Mr. Robin Taylor of Science Applications International Corporation (SAIC).
The authors also would like to thank the following people who have contributed to this study. Mr. Gary Wolff, California State Water Resources Control Board Mr. Bob Languell, California State Water Resources Control Board Mr. John Menke, California State Water Resources Control Board Dr. Valentino Tiangco, California Energy Commission Mr. George Salama, Southern California Edison Mr. George Wiltsee, Southern California Edison Mr. Mark Renson, Pacific Gas & Electric Ms. Molly Hoyt, Pacific Gas & Electric Mr. Ken Brennan, Pacific Gas & Electric Ms. Bonnie Bailey, San Diego Gas & Electric Mr. Dan Frank, San Diego Gas & Electric Ms. Kathi Schiffler, Western United Resource Development Ms. Tiffany LaMendola, Western United Resource Development Mr. Jerry McPherson, Southern California Gas Professor Bryan Jenkins, University of California at Davis Mr. Jeff Pierce, SCS Engineers Mr. Krzysztof S. Jesionek, P.E., Geosyntec Consultants, Inc. Mr. Tom Woodward, Vector Engineering

4
Abstract
This report, Economic Study of Bio‐Energy Production from Digesters at Dairies in California, was prepared by Princeton Energy Resources International (PERI) under subcontract to Science Applications International Corporation (SAIC). The report sets forth cash flow financial analysis for nine dairy biogas digester projects installed under the California Dairy Power Production Program (DPPP), sized under 1 MW and producing electricity on‐site. It projects other possible energy production scenarios, including for production of pipeline‐quality gas, and production of power and pipeline‐quality gas by enhanced environmental quality methods. For pipeline‐quality gas, gas was assumed to be required to meet the quality standards of Pacific Gas & Electric (PG&E). Plant design was based on the existing biogas systems installed for power production, but was modified by removing engines and related equipment and adding biogas clean up equipment and pipelines to deliver gas from farm to nearest utility pipeline. Levelized Cost of Energy (LCOE) calculations, expressed as $/kWh or $/therm, were performed. Sensitivity analysis included benefits from selling carbon credits and utilizing the Section 45 Production Tax Credit for power cases.

5
Executive Summary Economic studies of biogas digester systems installed under the California Dairy Power Production Program (DPPP) are performed for Actual, No Subsidy Power and Pipeline‐Quality Gas, Enhanced Environmental Quality Power and Enhanced Environmental Quality Pipeline‐Quality Gas, and various special sensitivity cases.
The Actual cases refer to economic analyses of dairy biogas power systems installed under the California DPPP when subsidies, such as grants, are included. Nine plants were analyzed for which full cost and operating data were available. Net incremental costs to produce power are identified and a Levelized Cost of Energy (LCOE) is calculated, expressed as $/kWh, in both nominal and constant‐dollar amounts. Constant dollars exclude inflation.
The No Subsidy Power and Pipeline‐Quality Gas cases refer to the economic analysis for dairy biogas power systems installed under the California DPPP when subsidies, such as grants, are excluded and certain standardized, common operating and finance assumptions are added. For the Power scenario, all power was assumed to be sold to the local utility at a rate utilizing a schedule based, not on net metering, but on California’s Market Price Referent (MPR) rates. MPR is an estimate of the long‐term market price of electricity, based on the long‐term levelized price of power from a combined cycle natural gas plant. MPR rates are utilized to evaluate bids from power producers when utilities issue Renewable Portfolio Standard (RPS) solicitations. The Pipeline‐Quality Gas case assumes all gas is sold to the local utility, under a natural gas pricing schedule.
Enhanced Environmental Quality Power and Enhanced Environmental Quality Pipeline‐Quality Gas cases refer to a voluntary enhanced environmental quality practice that would reduce concern over water‐ and air‐related environmental consequences of dairy operations. For this analysis, the No Subsidy Power and Pipeline‐Quality Gas cases were upgraded by adding double liners to lagoons for covered lagoon systems and adding double liners to effluent storage lagoons for plug flow systems. For the plug‐flow systems, the size of the storage lagoon is assumed to be the same size as the plug flow digester tank.
Two primary types of sensitivity analysis were performed. First, a break‐even analysis was run, where the Internal Rate of Return (IRR) was reduced to about zero. Second, using a target IRR of 17%, LCOE was computed assuming the farmer/owner sold carbon credits and utilized the Section 45 Production Tax Credit (PTC) for power cases. Three example analyses including bonus depreciation, an augmented depreciation allowance for the year an asset is placed in service, were also run.
Results of the economic study for actual cases show that the three best returns belong to Hilarides Dairy, with an after‐tax IRR at 22.82%, Castelanelli Bros. at 21.27%, and Blakes

6
Landing at 19.02%. The three next best show more modest returns, with one at break‐even. However, the last three returns are negative, at about ‐13%.
Without a subsidy, the nominal LCOE, in 2007 dollars, may be characterized as high, tending to be above market rates. Results of the economic study for No Subsidy Power found that LCOEs varied from $0.1016 per kWh to $0.3716 per kWh. For the No Subsidy Pipeline‐Quality Gas cases, the LCOE varied from $1.245 per therm to about $4.801 per therm.
Results of the economic study for the Enhanced Environmental Quality Power cases show that nominal LCOE in 2007 dollars varies from $0.1855 per kWh to $0.4486 per kWh. For power production, Enhanced Environmental Quality LCOEs without a subsidy are about 20% to 80% higher than the No Subsidy Power LCOEs for dairies with covered lagoons; they are 5% to 7% higher than the No Subsidy Power LCOEs for diaries with plug‐flow digesters. For the Enhanced Environmental Quality Pipeline‐Quality Gas cases, LCOE varies from $2.096 per therm to $5.819 per therm. One small dairy with a 12‐mile pipeline represent a special case, at $35.128 per therm with the additional pipeline representing about 70% of total cost. In similar fashion as for power, Enhanced Environmental LCOEs without subsidies are about 10% to 70% higher than the No Subsidy Pipeline‐Quality Gas LCOEs for diaries with covered lagoons; they are 3% to 4% higher than the No Subsidy Pipeline‐Quality Gas LCOEs for dairies with plug‐flow digesters.
Sensitivity study results show that for power generation, in general, the break‐even LCOEs are 30% to 45% of those at 17% return. For pipeline‐quality gas, breakeven LCOEs tend to be 30% to 42% of those at 17% return. Sensitivity study further shows that if the farmer sells carbon credits and utilizes the Section 45 Production Tax Credit (PTC) for power, project return improves and the LCOE can be reduced from about 10% to 30%. If the farmer sells carbon credits for pipeline‐quality gas, project return improves and the LCOE can be reduced from about 4% to 15%, except for one special case that is much less. Three cases with 50% bonus depreciation were tested, and its use reduces LCOE from about 4% to 6% further.
This study shows that further research and field operation of anaerobic digestion (AD) biogas systems for dairy farms are needed to reduce capital costs and operating expenses, and to improve efficiency to the point where projects are more economically attractive. Grants or another form of subsidy are still needed to promote plant development to gain field experience.
If plant and equipment capital costs are reduced and if the plant operates efficiently at a high plant capacity factor, then LCOE can be reduced to a competitive range. Sensitivity analysis showed that, for No Subsidy Power, when operations at one dairy farm plant, that emphasized low capital cost by using refurbished equipment and that operated efficiently, were combined with options to sell carbon credits and to utilize the Section

7
45 PTC, this plant achieved an LCOE of $0.0680/kWh (nominal 2007 dollars). With 50% Bonus Depreciation, the LCOE declined to $0.0636/kWh.
Greater collaboration is required among dairy operators, utilities, permitting agencies, and funding and financing authorities to ensure an attractive price is paid that encourages efficient plant operation. This involves resolving existing issues on net metering, such as paying the farmer both for excess energy delivered and setting reasonable demand charges consistent with well operated, high capacity factor systems.
Alternatively, it involves developing attractive power purchase agreements for small power projects to buy excess energy (above the sellerʹs on‐site use) at attractive rates. New feed‐in tariffs provide a mechanism for attractive power purchase, but low off‐peak rates result in average electricity prices that are typically insufficient to justify base‐load operation and the long term contracting requirements with no escalation clause may create uncertainty when weighing choices between feed‐in tariffs and net metering. Feed‐in tariffs may be combined with efforts to run the plant as a peaking operation, probably with some means of gas storage, such that the farmer sells mostly peak and partial‐peak power.
Additional research and analysis is needed to assess the potential benefits, including increased gas production volumes, from codigesting additional feedstocks such as from food or food processing waste with manure. Also, additional revenues from sales of co‐products from the AD process, e.g., fertilizer, livestock bedding material, should be evaluated for their impact on LCOE.
Most current plants are all equity financed, so there may be opportunities for aggregators or other developers to build larger anaerobic digester facilities. Such facilities would allow economies of scale in equipment and might be financed using non‐recourse project finance including debt to improve economics. However, because manure management is integral to operation of the dairy farm, some farmers will want to maintain control and will continue to finance using all equity. A possible hybrid approach could be to aggregate equipment purchases and certain project design development and maintenance services to lower costs through standardization and bulk purchase discounts.
Regarding prices, some critics worry that a 20‐year nominal flat price encouraged by MPR will be greatly under market prices near the end of its term if inflation were to increase. They would argue for a year one bid price that starts lower, but is accompanied by an annual escalator moving with some widely‐accepted economic index (e.g., PPI, the Producer Price Index). At today’s forecast of inflation, the bid price and escalator would be equivalent to MPR. But should inflation rise, the power producer would receive “fair” market prices, and would not receive such low prices that he or she abandons the project or, in the case of a farmer, where the dairy digester is a key component to farming, operates at a very low plant capacity factor. This is equivalent to suggesting the MPR be indexed. It is unlike the old “Standard Offer Number Four” contracts because

8
rates are not fixed for ten years, based upon an old forecast of inflation that becomes outdated. Rates are not fixed for longer than one year, till they change with the index.
Lastly, as farmers seek to build more projects, state and other agencies might conduct outreach through meetings, written materials, and web‐site information. Agencies might explain what materials and information are needed to obtain permits, such that farmers and their engineers could provide them quicker and with less revision.

9
1.0. Introduction
In 2001, the California Energy Commission (Energy Commission) initiated the California Dairy Power Production program in response to Senate Bill 5X (2001). A total of $10 million was earmarked for the development of manure methane power projects on California dairies. The program was designed to provide two types of assistance for qualifying dairy biogas projects: upfront, buy‐down grants or five‐year power production incentive payments. Buydown grants covered a maximum of up to fifty percent of the total capital costs of the biogas system based on designed power production, but not to exceed $2,000 per installed kilowatt (kW), whichever was less. Electricity production incentive payments were based on 5.7 cents per kilowatt‐hour (kWh) of electricity generated by the dairy biogas system to be paid out over a maximum of five years.
From $10 million earmarked, by late 2005, $5.8 million was awarded to fourteen projects, as administered by Western United Resource Development (WURD).1 Of the 14 projects, four decided not to construct digester systems, and ten completed projects. The Dairy Power Production Program Dairy Methane Digester System Program Evaluation Report, prepared for the Energy Commission by WURD and dated August 2006, provided data on construction, performance, and operating expenses for the ten completed projects. The ten dairy digester projects are:
• Hilarides Dairy; Lindsay, Tulare County, CA; 500 kW • Cottonwood (Gallo Cattle); Atwater, Merced County, CA; 300 kW • Blakes Landing Dairy; Marshall, Marin County, CA; 75 kW • Castelanelli Bros. Dairy; Lodi, San Joaquin County, CA; 180 kW • Koetsier Dairy; Visalia, Tulare County, CA; 260 kW • Van Ommering Dairy; Lakeside, San Diego County, CA; 130 kW • Meadowbrook Dairy; El Mirage, San Bernardino, CA; 160 kW • Lourenco Dairy; Tulare, Tulare County, CA; 150 kW but no operational data • Inland Empire Utilities Agency (IEUA); Chino, San Bernardino County, CA; 943
kW • Eden‐Vale Dairy; Lemoorre, Kings County, CA; 180 kW.
1 Of the $10 million earmarked, the Energy Commission allocated $360,000 from the program to cover state administrative costs, leaving total program funds at $9,640,000. Of those program funds, $1,030,250 was allocated to WURD for program administrative costs. Due to the budget crisis, $2,817,380 was returned to the State General fund on March 2, 2005.

10
In late 2006, the remaining funding available from the four projects which decided not to construct digester systems was awarded to eight more dairy digester projects to be completed by 2008.
California is home to 1,950 dairies and 1.87 million milking cows. These cows represent 20% of 9.146million milking cows in the US and correspond to an estimated 166 million pounds of wet manure produced per day.2,3Capture of a portion of these wastes for anaerobic digestion represents a significant potential for greenhouse gas reduction and renewable energy generation.
Anaerobic digestion (AD), where organic material decomposes in the absence of air or oxygen) to produce medium‐BTU digester gas, when coupled with modern manure management technology, has been identified as one of the most promising control technologies for converting dairy manure into renewable energy while reducing air and water pollution. However, research data are limited in both California and the US regarding the economic cost of biogas digesters. Such information is critical for dairy owners, project developers, utilities, engineers and equipment vendors, governmental agencies, and the public to understand current status, determine the next most cost‐effective steps, and develop future renewable energy systems.
2 California Dairy Statistics Annual 2007, California Department of Food and Agriculture, Sacramento CA.
3 J.A. Moore and M.J. Gamroth, Calculating the fertilizer value of manure from livestock operations, Oregon State University Extension Service. EC 1094, Reprinted Number 1993.

11
2.0. Objectives
The objectives of this study were developed as a joint effort among the California Energy Commission, the State Water Resources Control Board of the California Environmental Protection Agency, and Pacific Gas and Electric (PG&E), a major investor‐owned energy utility in northern California serving four of the ten dairy digester power projects. The objectives were to quantify:
1) net incremental costs and levelized financial cost of electricity (in $/kWh) of dairy biogas power systems installed under the California Dairy Power Production program (DPPP)
2) net incremental costs and levelized financial cost of biogas (in $/therm, 1 therm = 100,000 Btu) if the dairy biogas produced from the digesters installed under the DPPP will be used to produce pipeline gas meeting natural gas quality standards (and/or PG&E standards)
3) net incremental costs and levelized financial costs of electricity and pipeline quality gas of adding anaerobic digestion capabilities to California dairies in an environmentally superior way.
For this study, the Levelized Costs of Energy (LCOE) are to be calculated both in nominal‐ and constant‐dollar terms. Constant dollars exclude inflation.

12
3.0. Methodology 3.1. DCF-ROI (Discounted Cash Flow-Return On Investment) Cash Flow Model For source data, this study uses construction, performance, and operating expense data from nine projects reported in the August 2006 report, Dairy Power Production Program (DPPP) Dairy Methane Digester System Program Evaluation Report, prepared by WURD.
PERI analyzed the nine dairy digester projects for which complete data were available (all the projects except Lourenco). Each project is located on a single farm, except for IEUA. Formed in 1950, IEUA is the water utility for an area comprising 242 square miles in western San Bernadino County that includes six dairies; the cities of Chino, Chino Hills, Fontana, Montclair, Ontario and Upland; and surrounding area.
PERI prepared a cash flow model and then performed discounted cash flow return on investment (DCF‐ROI) analysis for each of the nine projects. From key plant data, including plant size, capital cost, performance (e.g., plant capacity factor, heat rate), operating expenses, depreciation and tax factors, contract term, inflation rate, and escalators, the model projects pro forma earnings and pro forma cash flows. For a fixed schedule of revenues, as with the nine “Actual Cases” described below, the model projects the plant’s after‐tax Internal Rate of Return (IRR). IRR is that rate at which the present value of the stream of after‐tax cash flows to the owner equals the present value of his or her equity investment outlay.4 From the fixed schedule of revenues and using a discount rate reflecting cost of capital, the model calculates the plant’s Levelized Cost of Energy (LCOE), in nominal‐ and constant‐dollar terms. LCOE is calculated by figuring the Net Present Value (NPV) of revenues using the nominal‐dollar discount rate and then by levelizing the NPV, using either the nominal‐ or constant‐dollar discount rate.
When revenues are not set in advance, and when it is desired that the project meet a target IRR, then, by trial and error, the model user enters a revenue schedule, checks IRR, and increases or decreases revenues, until the target IRR is reached. The target IRR may be termed a hurdle rate, for at or above it, the project will proceed, and under it, the project will be canceled (or modified until it meets the target). The model yields the plant’s LCOE, in nominal and constant dollars, for the revenue schedule that meets the target IRR.
Detailed model assumptions are set forth in Table A‐ 1, Financial and Economic Assumptions, in the Appendix. In all cases, after‐tax cash flow is calculated with the
4 IRR is the break‐even discount rate that causes the net present value of the project, calculated as upfront equity investment less all the years of discounted after‐tax cash flows, to equal zero.

13
model first figuring project earnings, as revenues less operating expenses, less any interest on debt, less non‐cash expenses (e.g., depreciation, amortization), to obtain before‐tax profits, such that the income tax payment may be calculated. Next, the model figures cash flows, beginning with before‐tax income, adding back non‐cash expenses like depreciation and any other sources of cash (e.g., a reserve fund release), subtracting off non‐deductible payments (e.g., principal on debt, payments to a reserve fund), and subtracting off the income tax payment, to obtain after‐tax cash flow. To calculate IRR, the model seeks the discount rate where the farmer’s equity investment, as a year zero payment, will equal the present value of future cash flows, as the sum of the discounted after‐tax cash flows.
To calculate LCOE, the model begins with the project revenue stream. Employing a discount rate that reflects cost of capital, the model calculates a Net Present Value (NPV) of revenues using the nominal‐dollar discount rate and levelizes that NPV to find one level payment that is the same for all years, using either the nominal‐ or constant‐dollar discount rate. The level payment is divided by annual power production in kWh or annual gas production in therms, to obtain a unit cost. Note that the discount rate is set as the weighted‐average cost of capital for a typical investor‐owned utility. The discount rate is not the cost of capital for each dairy digester plant because they are all different. To compare plants easily, one discount rate is needed for all plants. The utility weighted‐average cost of capital was selected for standardization and because the utility is the back‐up source of power for the dairies. Both IRR and LCOE calculations are shown with the pro forma cash flows in Appendix B.
3.2. Plant Financing and Individual Plant Models. Based on the information provided under the WURD’s August 2006 report describing the nine actual dairy digester plants, there were no equipment loans or project debt. Consequently, for this study, all nine dairies are assumed to be financed on‐balance sheet, with 100% equity or with equity plus a grant. There is no debt.
It is acknowledged that non‐recourse or limited recourse project finance is used successfully by many independent power producers to finance, build, and operate plants employing a range of renewable energies and traditional fuel feedstocks. However, as a percentage of the total, project financing fees (e.g., legal and accounting fees, origination fees) tend to run high for small projects. Further, the debt and equity investors to such a financing are secured only by the project (with no recourse to the developer’s other assets). To reduce their risk, such debt and equity investors will demand that the project obtain a long‐term power purchase agreement or otherwise demonstrate a stable, reliable revenue stream.

14
For this study, the dairy digester power systems are relatively small, at under 1 MW. The power plant is a well‐integrated part of the dairy farmer’s total operation that is not easily separated out to serve as collateral for financing. Therefore, conservative, on‐balance sheet, all‐equity financing, where the farmer retains ownership and control, is assumed.
The target IRR or hurdle rate, which is the farmer’s after‐tax return on equity investment, is estimated as 17%. This rate is high because it is not guaranteed. A high degree of risk is involved, including construction risk and technology risk to get the digester power plant built and operating on‐time and on‐budget; operating risk over its projected 20‐year life; regulatory risk regarding permits; and so forth. A high hurdle rate allows for slippage. Otherwise, an investor opts for risk‐free Treasury bills and notes.
Finally, the existing cost and performance data from the nine AD systems is highly variable. Taking a simple average of cost data is not appropriate given the spread of data and high variability in plant design, plant capacity factors, equipment performance, heat rates, and other factors. Each of the nine plants required its own cash flow model. Analysis then was performed for several sets of cases, including “Actual,” No Subsidy Power, No Subsidy Pipeline‐Quality Gas, Enhanced Environmental Quality Power, Enhanced Environmental Quality Pipeline‐Quality Gas, and various special sensitivity cases. As stated, to obtain LCOEs that are comparable, one standardized discount rate, which is the utility’s weighted average cost of capital, was employed for all nine plants.
3.3. Economic Study for Actual Cases Economic studies for actual cases refer to the dairy biogas power systems installed under California DPPP funding. Grants are included. The costs to produce power, as reported by WURD in their August 2006 report, are identified. Because revenues are specified, IRR is calculated, as are Levelized Costs of Energy (LCOE), expressed as $/kWh, in both nominal‐ and constant‐dollar terms.
Regarding revenues, all nine dairy farmers sold power under net metering contracts. Thereby, farmers first added on‐farm electric load to offset their retail rate, composed of both an energy portion (variable) and a demand/capacity portion (fixed). Because of contract mix‐ups and for other reasons, some farmers received only the energy portion of the retail rate, at least for the study period. This analysis utilized the actual rates that farmers were paid, so it sometimes used low retail rates, reflecting only the energy portion of the payment.
Farmers second sold their surplus power to the utility for net metering credits, under a wholesale rate. Net metering credits are forfeited if the farmer does not use an equivalent amount of power on the farm within 12 months. Some portions of net metering credits were forfeited for five of nine plants. Some farmers flared gas versus producing power for no compensation from the utility. For this analysis, however, no

15
net metering credits were assumed to be forfeited; all surplus power was sold to the utility.
To increase revenues, a few farmers added revenue savings streams from steam or heat use. One dairy, Cottonwood, added carbon credit sales, and IEUA’s plant received a relatively small tipping fee, as payment from neighboring farmers to deposit manure there. As Table 1 shows, because of their grants, added revenue streams, and by operating efficiently, several farmers appeared to realize attractive returns on their AD energy systems.
3.4. Economic Study for No Subsidy Power and No Subsidy Pipeline-Quality Gas Grants were removed to quantify LCOE on a no subsidy basis for the power and pipeline‐quality gas cases. Non‐incremental costs to building an AD system to produce energy were excluded. Because the farmer/owner seeks a target IRR of 17%, revenues to meet that return must be calculated by the model. From these revenues, an LCOE is calculated, in $/kWh, in both nominal‐ and constant‐dollar terms.
For this scenario, all power was assumed to be sold to the local utility at a rate utilizing a schedule based on California’s Market Price Referent (MPR) rates. MPR is an estimate of the long‐term market price of electricity, based on the long‐term levelized price of power from a combined cycle natural gas plant. MPR rates are utilized to evaluate bids from power producers when utilities issue Renewable Portfolio Standard (RPS) solicitations. The current base load MPR, in nominal dollars, under CPUC Resolution E‐4118, effective October 4, 2007, for a project starting in 2008 with a 10‐year contract is $0.09271 per kWh and, for a 20‐year contract, is $0.09572. MPR rates vary by year of start‐up, from about 2008 through 2020, and by whether the contract runs 10, 15, or 20 years. It is one rate that holds flat and does not escalate. Consequently, rates employed for No Subsidy Power and No Subsidy Pipeline‐Quality Gas, as well as for all other cases, were held flat and did not escalate. For No Subsidy Power cases, plant design, cost and performance were assumed to follow fairly closely to the Actual Cases described above.
For No Subsidy Pipeline‐Quality Gas cases, gas was assumed to be required to meet the quality standards of Pacific Gas & Electric (PG&E), California’s large northern utility. Plant design was based on the Actual Power Cases, but was modified for producing gas, and removed engines and related equipment. A pipeline to deliver gas from farm to nearest utility pipeline was added.
To perform meaningful analysis, some degree of standardization and use of common assumptions for operation was required. Assumptions for the No Subsidy cases are described fully in Sections 4.2.1 and 4.3.1.
In addition to excluding the SB5X grants and attributing 100% energy sales to the utility using MPR‐like rates, other key assumptions are as stated later. Non‐incremental costs

16
to building an AD system to produce energy were excluded. A small financing load (e.g., construction financing) was added and annual property taxes and insurance were added. For three plants with low plant capacity factors and low returns as Actual Cases, it was assumed that when attractive utility rates were available, the plants would operate with improved plant capacity factors and better heat rates.
3.5. Economic Study for Enhanced Environmental Quality Power and Pipeline-Quality Gas Cases Enhanced Environmental Quality Power and Enhanced Environmental Quality Pipeline‐Quality Gas cases refer to a voluntary enhanced environmental quality practice that would reduce concern over water‐ and air‐related environmental consequences of dairy operations. For this analysis, the No Subsidy Power and Pipeline‐Quality Gas cases were upgraded by adding double liners to lagoons for covered lagoon systems and adding double liners to effluent storage lagoons for plug flow systems. The size of the storage lagoon is assumed to be the same size as the plug flow digester tank.
3.6. Sensitivity Studies Two primary types of LCOE sensitivity analyses were performed. First, a break‐even analysis was run, where IRR was reduced to about zero. Second, with target IRR at 17%, the analysis looked to reduce LCOE by adding carbon credits and the Section 45 Production Tax Credit (PTC) for power cases. Three examples of Bonus Depreciation were also run.

17
4.0. Assumptions, Results, and Discussions
Assumptions, results, and discussion for Actual, No Subsidy Power, No Subsidy Pipeline‐Quality Gas, Enhanced Environmental Quality Power and Enhanced Environmental Quality Pipeline‐Quality Gas, and the various special sensitivity cases are presented as follows.
Certain basic economic and financial assumptions that are common to all cases (e.g., inflation rate, tax rate if the owner is taxable) inform the analysis. These are described in Table A‐ 1, Financial and Economic Assumptions, in the Appendix. More detailed assumptions can be found in the model spreadsheets for the nine dairy biogas power systems studied.
4.1. Economic Study for Actual Cases 4.1.1. Assumptions Table 1 lists the key cost and performance parameters for each of the nine DPPP plants analyzed in this study. Complete cost and performance inputs for each plant are included in Table A‐ 2, Detailed Data Inputs for Nine Dairy Farm Digester Systems, in the Appendix. These farm‐specific model inputs include:
• Introductory Data, such as farm location, herd size, and year of plant start‐up;
• Plant Capital Costs, such as for manure collection, digester lagoon or tank, engine and gas treatment equipment, general construction, design, permits, and utility interconnection;
• Sources of Funds, composed of equity and grants, that match the upfront capital costs; and
• Technical and performance parameters and annual operating expenses, such as plant size, operating hours, quantity of power produced, fraction used on‐farm (retail) versus sold to the utility (wholesale), any steam/thermal production, unit prices, plant heat rate, fuel heat content, and operating expenses and escalation factors.
4.1.2. Results and Discussion Summary results of the economic study for actual cases are presented in Table 1. Full LCOE results are included in Table A‐ 3, Actual On‐Site Power LCOEs, in the Appendix. Since revenues were given, the model calculated IRR. (For later cases, where a target IRR of 17% is given, the model calculates the LCOE/revenues required to produce that IRR.)
As shown, the three best returns belong to Hilarides, with an after‐tax IRR at 22.82%, Castelanelli at 21.27%, and Blakes Landing at 19.02%. The three next best are

18
Table 1 – LCOE ($/kWh) and IRR Results for “Actual” Dairy Power Plant Cases
Dairy: Digester Type. Special notes.
Size (kW)
Plant Capacity Factor
(%)
Annual Energy (MWh)
Heat Rate (Btu/kWh)
Capital Cost ($/kW
Year $)
Capitalization % (Debt-Grant-Equity)
After- tax IRR
(%)
Retail/Whole-
sale (%/%)
Year 1 Retail2 ($/kWh)
Year 1 Whole-sale2
($/kWh)
Nominal LCOE3 (2007$)
ConstantLCOE3 (2007$)
Hilarides: covered lagoon 500 77.23 3,383 13,132 2,480;
2005 $ 0-40-60 22.82 62/38 .0600; 2006 $
.0400; 2006 $ .0643 .0524
Cottonwood: covered lagoon. Receives $30K/yr for carbon credits.
300 81.17 2,133 12,235 8,993; 2004 $ 0-31-69 8.64 100/0 .0748;
2005 $ .0400;
2005 $ .0940 .0767
Blakes Landing: covered lagoon 75 38.48 253 13,813 4,504;
2004 $ 0-46-54 19.02 60/40 .1200; 2005 $
.1000; 2005 $ .1409 .1149
Castelanelli: covered lagoon 160 81.00 1,135 17,912 6,043;
2004 $ 0-57-43 21.27 50/50 .0724; 2005 $
.0576; 2005 $ .0817 .0666
Koetsier: Plug-flow 260 23.70 540 16,645 5,264;
2005 $ 0-0-1001 -13.25 76/24 .0600; 2006 $
.0300; 2006 $ .0648 .0529
Van Ommering: Plug-flow 130 42.98 489 17,103 6,668;
2005 $ 0-46-54 -0.12 10/90 .0500; 2006 $
.0500; 2006 $ .0613 .0500
Meadowbrook: Plug-flow 160 78.52 1,100 15,673 6,379;
2004 $ 0-45-55 4.76 68/32 .0600; 2005 $
.0400; 2005 $ .0673 .0549
IEUA: modified mix plug-flow. Receives $18.6K/yr tip fee for manure.
943 91.674 7,572 12,0004 13,734; 2005 $ 0-01-991 -13.78 100/0 .0800;
2006 $ .0400;
2006 $ .0981 .0800
Eden-Vale: Plug-flow 180 29.00 457 17,785 4,471;
2005 $ 0-37-63 -13.97 17/83 .0700; 2006 $
.0300; 2006 $ .0449 .0366
1 Koetsier took their subsidy in the form of a 5‐year production payment; IEUA took most of their subsidy as a 5‐year production payment. 2 Year 1 Retail and Year 1 Wholesale prices in $/kWh are the average prices for year 1, and escalate at 2.50% inflation per year. 3 Nominal LCOE and Constant LCOE are levelized total prices that are a weighted average of retail and wholesale and that hold flat for 20 years. 4 Per February 15, 2008 PERI communication with IEUA, lately, digester system operating hours are significantly longer and operating expenses are lower than reported in WURD’s August 2006 report, DPPP Dairy Methane Digester System Program Evaluation Report. Much digester gas is used for space and process heating but, here, all digester gas is assumed to be fed to the engine‐generator and operating hours for the engine‐generator equal those of the digester.

19
Cottonwood at 8.64%, Meadowbrook at 4.76%, and Van Ommering at ‐0.12%, which is about break‐even. However, the last three returns are negative, including Koetsier at ‐13.25%, IEUA at ‐13.78%, and Eden‐Vale at ‐13.97%.
Table 1 further shows that Levelized Cost of Energy for most of the projects, because revenues were assigned by the utilities under existing contracts, is in a competitive range. Specifically, excluding Eden‐Vale, as a special case, and Blakes Landing, Nominal LCOE in 2007 dollars varies from $0.0613 per kWh to $0.0981 per kWh. All cost values in this chapter are expressed in nominal dollars of 2007 unless otherwise noted.
Table 1 and review of the nine Actual Cases suggest that different dairy owners employ different strategies to achieve success. For example, Hilarides Dairy, with an engine‐generator of 500 kW, operating with a plant capacity factor of roughly 77%, generated 3,383 MWh/year, where 62% was used on‐farm and valued at retail and the remaining 38% was sold to the utility for net generation credits and valued at wholesale. Unit prices were $0.0736/kWh retail and $0.0491/kWh wholesale. This structure allowed the plant to earn an IRR of 22.8%. The weighted average LCOE, combining retail and wholesale rates, is $0.0643/kWh. For the actual case, Hilarides received a “buy down” grant for 40% of capital cost. They held initial capital cost low by using refurbished equipment costing $2,480/kW, while other farms spent at least double that figure.
Cottonwood Dairy (Gallo Farms) pursued another strategy. Cottonwood Dairy, with an engine‐generator of 300 kW, operating with a plant capacity factor of 81%, generated 2,133 MWh/year, with 100% of the power taken for on‐farm use valued at the retail price of $0.0748/kWh (nominal levelized 2007$). The after‐tax IRR for Cottonwood was 8.64%. Its capital cost was second highest, at $8,993/kW, but it received two grants that covered 31% of the capital cost. Cottonwood ran with high plant capacity factor and efficiency, its heat rate being the lowest of all dairies at 12,235 Btu/kWh, with exhaust heat recovered to produce steam and to preheat boiler feed water creating a significant thermal savings for the project. In addition, Cottonwood sold an estimated $30,000 per year in carbon credits. First year revenues are 58% power, 31% thermal, and 11% other. Despite higher costs, this dairy achieved an attractive IRR by operating efficiently and maximizing revenue.
Castelanelli Bros. Dairy installed an engine‐generator of 160 kW, operated with a plant capacity factor of 81% and generated 1,135 MWh/year, where about 50% is taken for on‐farm use at the retail price of $0.0910/kWh and the balance is sold under a net metering agreement and valued at wholesale, at a price of $0.0724/kWh (nominal levelized 2007$). Capital cost was fifth highest at $6,043/kW, but this plant received two grants that covered 57% of the plant’s capital cost. Because of the grants, equity investment was reduced and after‐tax IRR was 21.27%. With mid‐level capital costs, by taking advantage of grants to reduce the owner’s equity investment, by operating efficiently at a high plant capacity factor, and by adding load such that 50% of power was valued at retail rates, Castelanelli Bros. Dairy achieved an attractive IRR.

20
As a smaller dairy, Blakes Landing undertook a cherry‐picking strategy. Operating with only a 38.5% plant capacity factor, Blakes Landing Dairy installed an engine‐generator of 75 kW, generated 253 MWh/year, with 60% used on‐farm and valued at retail and the remaining 40% sold to the utility for net generation credits and valued at wholesale. By selling mostly during peak periods, at prices of $0.1509/kWh retail and $0.1257/kWh wholesale (nominal levelized 2007$), the plant earned an IRR of 19.02%. Its capital cost was third lowest, at $4,504/kW, and it received two grants to cover 46% of the capital cost.
The dairy projects showing low returns in Table 1 tend to be special cases. Eden‐Vale Dairy shows a negative return, partly because the plant came on‐line in January 2006, was studied for only six months, and the dairy owner is planning to add more load to the engine‐generator. In the meantime, while excess generation credits are forfeited, the plant runs at a 29% plant capacity factor, because the owner has opted not to run the plant at full capacity.
Likewise, because most net generation credits were forfeited, the Koetsier Dairy farmer does not run a second engine‐generator that is on‐site, underfuels the one in use to operate below design capacity, and flares part of the dairy biogas. The plant runs at a 24% plant capacity factor. The Koetsier project sought to refurbish an existing, non‐operational plug‐flow digester system, and over 70% of capital cost was incurred in 1985. Recently, the owner applied to sell carbon credits, so system performance and returns will improve.
Finally, for IEUA, expected construction costs nearly tripled from the time of application, in 2003, to construction. The complete cost, at $9.3 million, for the initial plug‐flow digester is included, although some of the early equipment was discarded. Although this plant was in its start‐up phase when WURD prepared their August 2006 report and indicated a nearly 18% plant capacity factor, recent contact with IEUA indicated the digester now operates 8,030 hours annually, for a 92% plant capacity factor, and operating expenses are now lower. IEUA also said the plant produces about half thermal energy and half power but, with information on thermal revenues not readily available, for this analysis, it was assumed that all gas is sent to the engine‐generator to produce power. If this plant were built again, capital cost would be lower.
In summary, these nine Dairy Power Production plants are not static. The August 2006 WURD report indicated certain of the dairy plants planned to add on‐site retail load, to expand, and to undertake other modifications towards operating more efficiently. Improved net metering terms and the advent of utility Standard Offer Contracts for small biomass plants may offer further incentive.

21
4.2. Economic Study for No-Subsidy Power Case 4.2.1. Assumptions The No Subsidy Power cases are based very closely on the above‐described Actual Cases. However, subsidies in the form of grants were removed. Standardization and common assumptions for operation were added. For three plants, plant capacity factors and heat rates were improved.
As with the Actual Cases, complete cost and performance inputs for each plant are listed in Table A‐ 2, Detailed Data Inputs for Nine Dairy Farm Digester Systems, in the Appendix. Data inputs for No Subsidy Power are in the second column, next to Data Inputs for Actual Cases, in the first column. These model inputs include Capital Costs, Sources of Funds, and Annual Performance and Operating Expenses.
Key changes include:
• SB5X grants are excluded; therefore financing is 100% equity.
• All power is assumed sold to the local utility. The rate paid is assumed to approximate MPR, so it is held flat and does not escalate. No power and no thermal energy are used on‐site, to be valued at retail rates.
• Non‐incremental costs were excluded. That is, because one goal of this study is to determine the net incremental cost to build an AD system and produce energy, those costs that are deemed part of the normal, basic cost of operating a dairy farm without energy production were removed. For example, the cost to dig a lagoon is not included, because lagoons to hold manure comprise a normal and ordinary component of operating a dairy. However, to produce usable digester gas to feed an energy system, the lagoon must be covered and lined, so the cost of lagoon covers and liners is considered an incremental cost of energy production.
• A small financing load, as a percentage of plant and equipment capital costs, was added. This covers construction financing, tax advice and accounting assistance, and a working capital reserve.
• Property taxes and insurance were estimated and added to annual expenses.
• All subsidies such as carbon credits were removed. (The lone exception is that a small tipping fee that the IEUA plant receives for accepting manure from neighboring farms was included because it was considered non‐incremental.)
• No codigestion with a supplemental feedstock was assumed.
• Three plants with low actual plant capacity factors were assumed to operate better , with longer hours and less flaring of gas, when attractive utility rates were available, so their plant capacity factors were revised upward and their heat rates down. (It is noted that one small dairy farm, Blakes Landing, operates at a low capacity factor of 38.5%, but cherry picks, to match the hours of operation to peak periods, which maximizes the unit rate received and enables a

22
plant IRR of 19% as an actual case. It is not likely that this farm’s owner would be motivated to run much longer hours, for a lower average unit revenue. Further, Blakes Landing operates with the fourth best heat rate and was reported to flare no gas. Consequently, its plant factor and heat rate were not adjusted.)
• All cases were run to achieve a target after‐tax IRR of 17%.
4.2.2. Results and Discussion Summary results for the No‐Subsidy Power Case are presented in Table 2. Full LCOE results are included in Table A‐ 4, No Subsidy Power LCOEs, in the Appendix. One example case showing cash flows is presented with part 1 of Appendix B, Hilarides Dairy – No‐Subsidy Power.
Table 2 shows how model inputs for No Subsidy Power scenario changed versus those for the Actual Cases. Specifically, versus Table 1, for each of the nine dairy plants, power plant size stayed the same. Plant capacity factor, electrical energy generated, and heat rate stayed the same for all except three plants, which were much improved. Capital cost per kW for each of the nine plants changed because non‐incremental costs were excluded, which affected a few plants, and because a financing load was added.
Capitalization, the percentage of debt to grant to equity, became “0 – 0 – 100,” for all nine plants. The after‐tax IRR became 17% for all cases. The division of power sales, as percentage retail to percentage wholesale, became “0 – 100,” for all cases.

23
Table 2 – LCOE ($/kWh) and IRR Results for No Subsidy Dairy Power Plant Cases
Dairy: Digester Type. Special notes.
Size (kW)
Plant Capacity Factor
(%)
Annual Energy (MWh)
Heat Rate (Btu/kWh)
Capital Cost
($/kW) Capitalization %
(Debt-Grant-Equity) After-
tax IRR (%)
Pct Retail/
Pct Whole-
sale
Year 1 Retail2
Year 1 Whole-sale2
Nominal LCOE3 (2007$)
Constant LCOE3 (2007$)
Hilarides: covered lagoon 500 77.23 3,383 13,132 2,643;
2005 $ 0-0-100 17.01 0/100 n/a 0.0991; 2006 $ 0.1016 0.0828
Cottonwood: covered lagoon. 300 81.17 2,133 12,235 8,180;
2004 $ 0-0-100 17.02 0/100 n/a 0.3375; 2005 $ 0.3546 0.2891
Blakes Landing: covered lagoon 75 38.48 253 13,813 4,801;
2004 $ 0-0-100 17.05 0/100 n/a 0.3540; 2005 $ 0.3719 0.3032
Castelanelli: covered lagoon 160 81.00 1,135 17,912 6,070;
2004 $ 0-0-100 17.02 0/100 n/a 0.2160; 2005 $ 0.2269 0.1850
Koetsier: Plug-flow 260 83.451 1,901 13,5001 5,611;
2005 $ 0-0-100 17.03 0/100 n/a 0.1990; 2006 $ 0.2040 0.1663
Van Ommering: Plug-flow 130 83.451 950 13,5001 7,109;
2005 $ 0-0-100 17.07 0/100 n/a 0.2550; 2006 $ 0.2614 0.2131
Meadowbrook: Plug-flow 160 78.52 1,100 15,673 6,466;
2004 $ 0-0-100 17.03 0/100 n/a 0.2630; 2005 $ 0.2763 0.2253
IEUA: modified mix plug-flow. Receives $18.6K/yr tip fee for manure.
943 91.67 7,572 12,000 14,547; 2005 $ 0-0-100 11.03 0/100
n/a 0.3350; 2006 $ 0.3434 0.2799
Eden-Vale: Plug-flow 180 83.451 1,316 13,5001 4,766;
2005 $ 0-0-100 17.04 0/100 n/a 0.1720; 2006 $ 0.1763 0.1437
1 Koetsier, Van Ommering, and Eden‐Vale saw their plant capacity factors adjusted up and their heat rates adjusted down for No Subsidy Power cases 2 Year 1 Retail is moot here, because all power is assumed sold to the utility. Year 1 Wholesale prices in $/kWh reflect MPR schedule and do not escalate. 3 Nominal LCOE and Constant LCOE are levelized total prices that are a weighted average of retail and wholesale and that hold flat for 20 years.

24
Concise Levelized Cost of Energy results, as nominal LCOE and showing components, are shown below, in Table 3. Because a target IRR of 17% was assumed, the model calculated the LCOE/revenues required to produce that IRR.
As shown, nominal LCOE, in 2007 dollars, varies from $0.1016 per kWh for Hilarides to $0.3719 per kWh for Blakes Landing. All cost values in this case are expressed in nominal dollars of 2007 unless otherwise noted. LCOEs for the three projects that received an improvement to plant capacity factor, Eden‐Vale, Koetsier, and Van Ommering, ranged from $0.1763 to $0.2614 per kWh, versus higher without the assumed improvements.
Table 3 - No Subsidy Power LCOE and Components (nominal levelized 2007$) Dairy Name
No Subsidy Power LCOE –
17% IRR (¢/kWh)
After-tax O&M Component1
(¢/kWh)
Capital
Component (¢/kWh)
Hilarides 10.16 0.45 9.71 Eden-Vale2 17.63 1.16 16.47 Koetsier2 20.40 1.15 19.25 Castelanelli Bros. 22.69 0.94 21.75 Van Ommering2 26.14 1.61 24.53 Meadowbrook 27.63 2.71 24.92 IEUA 34.34 10.20 24.14 Cottonwood 35.46 4.34 31.12 Blakes Landing 37.19 1.16 36.03 1 Except for IEUA, after‐tax O&M is O&M multiplied by (1 – 0.4075), where 40.75% is the combined tax rate. IEUA is tax‐free, so no factor is applied to its O&M. 2 For Eden‐Vale, Koetsier, and Van Ommering, adjustments to show more realistic plant operation were employed. These are that plant capacity factor was set to 83.45% and heat rates were reduced to 13,500 Btu/kWh. See Table 1 for previous rates. Note that the after‐tax Operations and Maintenance (O&M) component for most of the plants runs from about 3% to 7% of total LCOE. For Meadowbrook, Cottonwood and IEUA, the O&M component is higher. Cottonwood and IEUA have installed an iron sponge as part of their scrubber systems to remove hydrogen sulfide from biogas. Meadowbrook was researching equipment to scrub gas. The higher operating expense for these three plants may be related to maintaining air pollution control equipment, but further investigation is needed before drawing firm conclusions.
4.3. Economic Study for No-Subsidy Pipeline-Quality Gas Case 4.3.1. Assumptions Another option for the dairy farmer with an anaerobic digester system is not to produce power on‐site at the farm, but to sell gas to a utility so as to take advantage of economies of scale and the increased operating efficiency and air pollution control capacity of central power generation facilities (e.g., NGCC). PERI developed a second cash flow

25
model for pipeline quality gas, where plant processing involves upgrading digester gas to clean, high‐Btu natural gas equivalent or biomethane. Plant size is specified as thousand cubic feet per day (Mcf/day) of biogas at the inlet to the upgrading unit.
Cash flow results from the pipeline quality gas model are expressed in US dollars per therm (1 therm is equivalent to approximately 0.1 Mcf of methane). One Mcf of natural gas equivalent is estimated as 1.02 million Btu (abbreviated as 1.02 MMBtu), although the composition and heating value of natural gas varies by source and extent of blending.
The energy plant design for this option differs from the power‐generating options by the absence of the engine gen‐set, and related components. However, a gas clean‐up and processing step must be added so that contaminant and diluent concentrations in the digester gas do not exceed utility pipeline specifications. Additional distribution pipeline capacity is added to convey upgraded biomethane from the farm to the nearest utility pipeline injection point.
Cost and performance changes to inputs are summarized in Table 4. As with the Actual Cases, complete cost and performance inputs for each plant are listed in Table A‐ 2, Detailed Data Inputs for Nine Dairy Farm Digester Systems, in the Appendix. Data inputs for No Subsidy Pipeline‐Quality Gas are in the third column. Again, these model inputs include Capital Costs, Sources of Funds, and Annual Performance and Operating Expenses.
The pipeline‐quality gas is assumed to meet PG&E quality standards. Costs related to the interconnection tap, controls and metering, unique interconnection facilities, and supervisory control and data acquisition (SCADA) monitoring were estimated, in part, based on ranges developed by PG&E5.
Costs of gas clean‐up were estimated by SCS Engineers (Sacramento, CA), who further estimated a 15% operating loss of biomethane through on‐site use and leakage. Estimates of pipeline distances from farm to nearest utility pipeline were provided by the California Energy Commission. Costs for the distribution pipeline, the elimination of on‐site electricity generating equipment, and other cost and operating data were developed by PERI.
5 Pacific Gas & Electric Company, San Francisco CA, “Biogas White Paper (External Version),” received June 2007.

26
Table 4 – Pipeline Quality Gas Model Inputs: Costs and Expenses to Produce Gas instead of Power plus Revised Performance Effect
Dairy: Digester Type. Special notes.
Plant Capacity Factor
(%)
Actual Biogas/day (Mcf/day)1
Pipeline3 Interconnect,
Controls, Monitoring
Gas Clean-up & Processing
Reductions for Gas vs. Power in
Capital Cost
Total Net Add’l Capital
Cost
Per-formance
Effect
Gas Monitoring Exp ($/yr)4
Hilarides: covered lagoon 90 232.7 50,000 250,000 720,000 (788,434) 231,566 -15% 10,000
Cottonwood: covered lagoon. 90 113.0 48,780 243,902 556,098 (199,064) 649,716 -15% 9,756
Blakes Landing: covered lagoon 90 14.8 2,474,146 243,902 390,244 (92,716) 3,015,577 -15% 9,756
Castelanelli: covered lagoon 90 89.1 1,053,659 243,902 468,293 (329,715) 1,436,139 -15% 9,756
Koetsier: Plug-flow 90 126.22 50,000 250,000 400,000 (65,753) 634,247 -15% 10,000
Van Ommering: Plug-flow 90 52.02 50,000 250,000 400,000 (204,362) 495,638 -15% 10,000
Meadowbrook: Plug-flow 90 80.5 48,780 243,902 448,780 (206,212) 535,251 -15% 9,756
IEUA: modified mix plug-flow. 90 384.2 50,000 250,000 570,000 (72,476) 797,524 -15% 10,000
Eden-Vale: Plug-flow 90 88.22 50,000 250,000 400,000 (190,682) 509,318 -15% 10,000
1 Mcf is thousand cubic feet per day. 2 Actual biogas production before the adjustment in plant capacity factor was 44.19 Mcf/day at Koetsier, 33.94 Mcf/day at Van Ommering, and 40.36 Mcf/day at Eden‐Vale. Such a large increase is possible because the dairy farmers have the cows available and are assumed to increase manure into the digester system and to stop flaring gas, if an economically attractive option exists. 3 Pipeline cost is $50/foot for distances less than 1 mile and $40/foot otherwise. Most pipelines are less than 1,000 feet, but that for Blakes Landing is about 12 miles and that for Castelanelli Bros. is about 5 miles. 4 For annual operating expenses, for Castelanelli, also omit expense to rebuild the engine, and for Meadowbrook, also omit expense to rebuild the engine and change oil frequently.

27
Many further assumptions for No Subsidy Pipeline‐Quality Gas are similar to those for No Subsidy Power. These include that:
• SB5X grants are excluded.
• Financing was assumed to be all‐equity.
• Non‐incremental costs were excluded.
• A small financing load was added to up‐front construction costs.
• Property taxes and insurance were added to annual expenses.
• Additional revenue streams were removed, except for IEUA’s tipping fee.
• No codigestion with a supplemental feedstock was assumed.
• For gas production, all plants were assumed to operate with 90% plant capacity factors.
• All cases were run to achieve a target after‐tax IRR of 17%.
4.3.2. Results and Discussion Summary results for the cash flow analysis of costs and performance for the nine dairy digester projects selling No Subsidy Pipeline‐Quality Gas are presented in Table 5. Full LCOE results are included in Table A‐ 5, No Subsidy Pipeline‐Quality Gas LCOEs, in the Appendix. One example case showing cash flows is presented with part 2 of Appendix B, Hilarides Dairy – No‐Subsidy Pipeline‐Quality Gas.
Because the plant lay‐out changed, summary data in the table changed. Plant size is Digester Size, expressed as thousand cubic feet/day‐inlet (Mcf/day‐inlet). Heat content of manure varies slightly by farm and is expressed as million Btu/Mcf. Annual gas sold is expressed as million Btu/day. Unit capital cost of the plant is expressed as $/million cubic feet per day‐inlet of gas, and includes the 15% loss factor.
For example, the total loaded capital cost for Hilarides is estimated (Table A‐2) as $1,568,589. The biogas production capacity is 232.7 Mcf/day, which translates to gross sustainable gas production after the 15% processing loss of 197.8 Mcf/day. There is assumed to be no in‐plant use, so net sustainable gas production is also 197.8 Mcf/day. To check capital cost, an engineer might calculate net unit capital cost, which is $7,931,025 per million cubic feet per day. (Note that the plant’s unit capital cost is expressed as dollars per million Btu because heat content of the raw material feedstock varies by farm, and a measure of dollars per thousand cubic feet would be constantly changing.)
As with No Subsidy Power, capitalization, the percentage of debt to equity, is 100% equity for all nine plants. The after‐tax IRR is 17% for all cases. All gas is assumed sold to the utility with none used on the farm so the partitioning of percentage retail to percentage wholesale is “0 – 100,” for all cases.
To highlight LCOE, concise results showing nominal LCOE and its components, as $/therm in 2007 dollars, are presented in Table 6. Because a target IRR of 17% was assumed, the model calculated the LCOE/revenues required to produce that IRR.

28
Table 5 – LCOE ($/therm) and IRR Results for No Subsidy Dairy Pipeline-Quality Gas Cases
Dairy: Digester Type. Special notes.
Size (Mcf/ day- inlet)
Plant Capacity
Factor (%)
Annual Gas Sold (MMBtu/
day)
Manure Heat
Content (MMBtu/
Mcf)
Capital Cost ($/million
cf/day-inlet)
Capitalization %
(Debt/Equity)
After- tax IRR
(%)
Pct Retail/
Pct Whole-
sale
Year 1 Retail2
Year 1 Whole-sale2
Nominal LCOE3 (2007$)
Constant LCOE3 (2007$)
Hilarides: covered lagoon 232.7 90.0 93.1 0.523 7,931,025;
2005 $ 0-100 17.01 0/100 n/a 11.91; 2006 $ 1.245 1.015
Cottonwood: covered lagoon. 113.0 90.0 54.7 0.633 32,772,514;
2004 $ 0-100 17.02 0/100 n/a 44.80; 2005 $ 4.801 3.914
Blakes Landing: covered lagoon, ~12 mi. pipeline
14.8 90.0 7.3 0.645 283,532,981; 2004 $ 0-100 17.01 0/100
n/a 321.00; 2005 $ 34.400 28.045
Castelanelli: covered lagoon, ~5 mi. pipeline
89.1 90.0 42.6 0.625 33,021,045; 2004 $ 0-100 17.04 0/100
n/a 39.50; 2005 $ 4.233 3.451
Koetsier: Plug-flow 126.21 90.0 53.8 0.557 19,901,645;
2005 $ 0-100 17.02 0/100 n/a 27.95; 2006 $ 2.922 2.382
Van Ommering: Plug-flow 52.01 90.0 26.9 0.676 32,862,932;
2005 $ 0-100 17.03 0/100 n/a 38.50; 2006 $ 4.025 3.282
Meadowbrook: Plug-flow 80.5 90.0 36.1 0.587 23,459,774;
2004 $ 0-100 17.02 0/100 n/a 30.10; 2005 $ 3.226 2.630
IEUA: modified mix plug-flow. Receives $18.6K/yr tip fee for manure.
384.2 90.0 190.4 0.648 44,611,060; 2005 $ 0-100 11.04 0/100
n/a 38.30;
2006 $ 4.004 3.265
Eden-Vale: Plug-flow 88.21 90.0 37.2 0.552 18,692,810;
2005 $ 0-100 17.03 0/100 n/a 26.90; 2006 $ 2.812 2.293
1 Koetsier, Van Ommering, and Eden‐Vale saw their power plant capacity factors adjusted up and biogas volume is based on that. 2 Year 1 Retail is moot here, because all gas is assumed sold to the utility. Year 1 Wholesale prices in $/MMBtu ($/million Btu) are geared to the MPR schedule, where prices are held flat (because this gas is feedstock to produce power), so they do not escalate. The Year 1 Wholesale price is the lowest price that gives a 17% IRR. 3 Nominal LCOE and Constant LCOE are levelized total prices that hold flat for 20 years.

29
As shown, the LCOE varies from $1.245 per therm for Hilarides to about $4.801 per therm for Cottonwood. Blakes Landing is a special case, because it is located far from any utility pipeline and must pay for and build a 12‐mile pipeline, should it opt to produce pipeline‐quality gas.
Note that the after‐tax Operations and Maintenance (O&M) component for most of the plants runs from about 2% to 6% of total LCOE, excluding Blakes Landing (1%) and Cottonwood and IEUA, where the O&M component is higher. For pipeline‐quality gas production, the annual expense for engine rebuild was dropped for Castelanelli Bros., and the annual expense for engine rebuild and frequent oil changes was dropped for Meadowbrook. Cottonwood and IEUA saw no change in operating expenses, which may be accurate or may reflect only that their operating expenses were broadly grouped and not finely classified.
Table 6 shows all plants incur an LCOE over $1.00/therm, which translates to $10/Mcf. All but one of the plants incur an LCOE over $2.50/therm, which is $25/Mcf. These are high costs.
Table 6 - No Subsidy Pipeline-Quality Gas LCOE and Components (nominal levelized 2007$)
Dairy Name
No Subsidy Gas LCOE, with 17%
IRR ($/therm)1
After-tax O&M Component2
($/therm)
Capital Component
($/therm)
Hilarides 1.245 0.068 1.178 Eden-Vale 2.812 0.169 2.643 Koetsier 2.923 0.151 2.771 Meadowbrook 3.226 0.095 3.131 IEUA 4.004 1.151 2.853 Van Ommering 4.025 0.234 3.791 Castelanelli Bros. (~5 mile pipeline) 4.233 0.103 4.130
Cottonwood 4.801 0.511 4.290 Blakes Landing (~12 mile pipeline) 34.400 0.390 34.010
1 Values may not sum due to rounding. 2 Except for IEUA, after‐tax O&M is O&M multiplied by (1 – 0.4075), where 40.75% is the combined tax rate. IEUA is tax‐free, so no factor is applied to its O&M. 3 To produce pipeline‐quality gas, all plants were assumed to operate with a plant capacity factor of 90.0%.
4.4. Economic Study for Enhanced Environmental Quality Power and Pipeline-Quality Gas Case 4.4.1. Assumptions For comparison with the more conventional No Subsidy Power and No Subsidy Pipeline‐Quality Gas scenarios, analyses were conducted for both power and

30
biomethane generation under Enhanced Environmental Quality practices with greater attention to protecting water quality through the use of multiple liners on lagoons and effluent storage ponds. The promise of such an approach is that voluntary adoption of enhanced construction practices would allow overall design standardization with concomitant cost reduction. As more AD systems are built to standard and field operating experience is gained, plant operating performance should improve, concerns over water‐ and air‐related environmental consequences of dairy operations should be mitigated; siting, regulation, and interconnection should be expedited; and costs should decline.
In the past, each dairy energy facility was considered unique, requiring extensive engineering and design on a dairy‐by‐dairy basis. Historically, permitting a anaerobic digester project at a dairy has required submission of detailed engineering and design information and extensive review by permitting agencies.
An example of the benefit of using an “environmentally superior” design is found in General Waste Discharge Requirements (WDR) Order No. R5‐2007‐035 adopted by the Central Valley Regional Water Quality Control Board (RB5) in May 2007. For ponds that meet the Tier 1 design, the WDR Order states that reviews “will be conducted in less than 30 days of receipt of a complete design plan package submitted to the Board.”
Consequently, for this analysis the No Subsidy Power and Pipeline‐Quality Gas cases were upgraded with a double liner under lagoons and storage ponds. To meet the Tier 1 design, liners are assumed to be made of high performance, advanced material (e.g., high density polyethylene or HDPE), and a leachate monitoring system is installed, to ensure there are no leaks from the lined lagoon. As part of leachate monitoring, a modest annual water sampling and testing expense is charged to all plants. For covered lagoon systems, the double liner is applied to the bottom and side walls of the lagoon. For plug‐flow systems, where anaerobic digestion of manure takes place in a concrete digester tank, the double liner is applied to the effluent storage lagoon located downstream of the digester that is assumed to be of the same working volume as the plug flow digester. Liner material and cost information was obtained by PERI engineers through communication with contract and consulting engineers having field experience in California.
Note, however, that the effluent from both covered lagoon and plug‐flow digesters is typically discharged to storage ponds for storage prior to application to cropland, and that the storage ponds may require lining to ensure that the overall dairy waste management system is protective of groundwater. If installing a digester at a dairy requires construction of a new effluent storage pond, that pond too may need to be lined to ensure rapid processing of the application.
However, the current analysis assumed that covered lagoons were lined and that effluent storage ponds for plug‐flow digester systems were lined. The Enhanced Environmental Quality cost and expense changes are summarized in Table 7. Note that

31
the cost of lagoon excavation is not included, because lagoon excavation is considered a normal part of dairy operation in California. Likewise, the cost of lagoon covers is not included, because they also are considered a normal part of dairy operation in California.
Table 7 – Enhanced Environmental Quality Additional Costs and Performance Effect for Power and Pipeline-Quality Gas
Dairy: Digester Type. Special notes.
Lagoon Size Leachate
Monitoring: one well/farm1
Double Liner (at
$1.85/sq ft) 1
Leachate Monitoring Expense ($/year) 2
Performance Effect3
Hilarides: Covered lagoon
First: 1,100 x 220 x 18 ft;
Second: 1,100 x 220 x 15 ft.
$11,000
$535,612;
$520,960
7,000 Nil
Cottonwood: covered lagoon. 1,213 x 267 x 24 ft. $10,732 $712,766 6,829 Nil
Blakes Landing: covered lagoon 150 x 60 x 12 ft. $10,732 $29,672 6,829 Nil
Castelanelli: covered lagoon 550 x 150 x 28 ft. $10,732 $219,654 6,829 Nil
Koetsier: Plug-flow 30 x 180 x 16 ft. $11,000 $22,422 7,000 Nil
Van Ommering: Plug-flow 30 x 130 x 12 ft. $11,000 $14,319 7,000 Nil
Meadowbrook: Plug-flow 32 x 156 x 14 ft. $10,732 $18,511 6,829 Nil
IEUA: modified mix plug-flow. 195 x 60 x 16 ft. $11,000 $36,741 7,000 Nil
Eden-Vale: Plug-flow 30 x 150 x 14 ft. $11,000 $17,649 7,000 Nil
1 Costs for plants constructed in 2004 are reduced by one year’s inflation, estimated as 2.50%, vs. those constructed in 2005.
2 Plant construction is estimated as one year. Consequently, plant start‐up takes place one year after plant construction. Expenses for plants starting up in 2005 also are reduced by one year’s inflation, at 2.50%, vs. those starting up in 2006.
3 Plants achieve the same power or gas production as before, with No Subsidy cases.
Table 7 does not include costs for enhanced protection of air quality. The San Joaquin Valley Air Pollution Control District (SJVAPCD) has identified the use of anaerobic digesters at dairies as more protective of air quality than open storage. However, because the cost per unit reduction in priority pollutants resulting from use of anaerobic digesters is high, it has not been identified as Best Available Control Technology (BACT). Also, using biogas from an anaerobic digester to run an internal combustion engine to power a generator results in emissions of nitrogen oxides (NOx). Thus, although anaerobic digesters are themselves an enhancement for protection of air quality, it appears necessary to reduce or prevent NOx emissions through further enhancements.

32
NOx emissions can be reduced by not using biogas to generate electricity but instead injecting the biogas into a utility company pipeline as described in Section 4.3. Injecting the biogas leave only occasional operation of a flare as a combustion source of NOx, but gas clean‐up and transport is costly. Another option is to install air pollution control equipment to reduce NOx and hydrogen sulfide (H2S) emissions. One expert has suggested that new dairy digesters “may or will require air permits.”6
For this analysis, assumptions for the Enhanced Environmental Quality cases follow those for No Subsidy Power and No Subsidy Pipeline‐Quality Gas, such as for plant capacity factor. Assumptions include:
• SB5X grants are excluded.
• Financing was assumed to be all‐equity.
• Non‐incremental costs were excluded.
• A small financing load was added to up‐front construction costs.
• Property taxes and insurance were added to annual expenses.
• Additional revenue streams were removed, except for IEUA’s tipping fee.
• All cases were run to achieve a target after‐tax IRR of 17%.
Economic and financial assumptions remain the same as for the No Subsidy cases.
4.4.2. Results and Discussion Two sets of results for the cash flow analysis for the nine dairy digester projects employing voluntarily Enhanced Environmental Quality guidelines were prepared, for Power and for Pipeline‐Quality Gas. Because target IRRs of 17% were assumed, the model calculated the LCOE/revenues required to produce those IRRs.
Cost changes were mostly small in comparison to the No Subsidy Power and No Subsidy Pipeline‐Quality Gas cases. Hilarides is the exception, with an 83% increase in LCOE for electricity. All others are under 27% increase. Unit capital cost increased because of the double liners and leachate monitoring systems. Operating expense increased due to annual monitoring expense, but this is minor.
The summary results for the Enhanced Environmental Quality Power and Pipeline‐Quality Gas Cases showing nominal LCOE and its components as $/kWh and $/therm, in 2007 dollars, are presented in Table 8 and Table 9. Full LCOE results are included in Table A‐ 6 and Table A‐ 7 in the Appendix.
6 Rob Williams, Biological and Agricultural Engineering, California Biomass Collaborative; University of California, Davis; “Biomass Systems for Heat and Power,” presentation for Smart Energy Management in Agriculture conference, through The Ecological Farming Association, Winters CA, November 13, 2007.

33
Table 8 – Enhanced Environmental Quality (EEQ) Power LCOE and Components (nominal levelized 2007$)
Dairy Name
EEQ Power LCOE – 17% IRR (¢/kWh)
EEQ Power After-tax
O&M Component1
(¢/kWh)
EEQ Power Capital
Component (¢/kWh)
No Subsidy Power LCOE –
17% IRR (¢/kWh)
Percentage Increase:
EEQ Power/No Subsidy
Power Hilarides covered lagoon 18.55 0.60 17.95 10.16 83%
Eden-Vale2 plug-flow 18.86 1.55 17.31 17.63 7%
Koetsier2 plug-flow 21.32 1.41 19.91 20.40 5%
Van Ommering2 plug-flow
27.68 2.14 25.54 26.14 6%
Castelanelli Bros. covered lagoon
28.79 1.39 27.40 22.69 27%
Meadowbrook plug-flow 29.10 3.17 25.93 27.63 5%
IEUA modified mix plug-flow
34.54 10.31 24.23 34.34 1%
Blakes Landing covered lagoon 44.65 3.18 41.47 37.19 20%
Cottonwood covered lagoon 44.86 4.58 40.28 35.46 27%
1 For all plants except IEUA, after‐tax O&M is O&M multiplied by (1‐0.4075), reflecting a reduction for the combined tax rate of 40.75%. Since IEUA is tax‐free, no factor is applied for it. 2 Eden‐Vale, Koetsier, and Van Ommering were adjusted to employ a better plant capacity factor of 83.45% and an improved heat rate of 13,500 Btu/kWh. Nominal LCOE for the Enhanced Environmental Quality Power cases in 2007 dollars varies from $0.1855 per kWh for Hilarides to $0.4486 per kWh for Cottonwood. These cases compare very closely to No Subsidy Power except that construction cost is higher and operating expense is slightly higher.
LCOEs for Enhanced Environmental Quality Power are about 20% to 80% higher for dairies with covered lagoons compared to the No Subsidy Power cases. Enhanced Environmental Quality LCOEs are about 5% to 7% higher for dairies with plug‐flow digesters, and only about 1% higher for IEUA with its modified mix plug‐flow system. The primary difference is the size of covered lagoons used as digesters in comparison to the effluent storage ponds used by plug‐flow systems. Table 7 shows many of the covered lagoon digesters are large, occupying a large surface area, with two over 20 feet deep. By contrast, the plug‐flow digesters, which employ a concrete tank, are smaller and their capital cost for the double liner on an effluent storage pond is less.

34
Table 9 - Enhanced Environmental Quality Pipeline-Quality Gas LCOE and Components (nominal levelized 2007$) Dairy Name
EEQ Gas LCOE, with
17% IRR ($/therm)
After-tax O&M
Component1
($/therm)
Capital Component
($/therm)
No Subsidy Gas LCOE,
with 17% IRR ($/therm)
Percentage Increase: EEQ Gas/
No Subsidy Gas
Hilarides covered lagoon 2.096 0.083 2.013 1.245 68%
Eden-Vale plug-flow 2.927 0.207 2.720 2.812 4%
Koetsier plug-flow 3.011 0.178 2.834 2.923 3%
Meadowbrook plug-flow 3.354 0.134 3.220 3.226 4%
IEUA modified mix plug-flow
4.025 1.164 2.861 4.004 1%
Van Ommering plug-flow 4.172 0.287 3.885 4.025 4%
Castelanelli Bros. (~5 mile pipeline) covered lagoon
4.683 0.137 4.546 4.233 11%
Cottonwood covered lagoon 5.819 0.537 5.282 4.801 21%
Blakes Landing (~12 mile pipeline) covered lagoon
35.128 0.584 34.544 34.400 2%
1 For all plants except IEUA, after‐tax O&M is O&M multiplied by (1‐0.4075) reflecting a reduction for the combined tax rate of 40.75%. Since IEUA is tax‐free, no factor is applied for it. 2 To produce pipeline‐quality gas, all plants were assumed to operate with a plant capacity factor of 90.0%.
For the Enhanced Environmental Quality Pipeline‐Quality Gas cases, LCOE varies from $2.096 per therm for Hilarides to $5.819 per therm for Cottonwood. Blakes Landing and its 12‐mile pipeline represent a special case, at $35.128 per therm. Note that acquisition of rights‐of‐way and other off‐site access were not incorporated into the overall pipeline extension cost estimates applied here.
Similar to the case of power, the LCOEs for Enhanced Environmental Quality Pipeline‐Quality Gas are about 10% to 70% higher than those for No Subsidy Pipeline‐Quality Gas for dairies with covered lagoons, excluding Blakes Landing. Enhanced Environmental LCOEs are only about 3% to 4% higher for dairies with plug‐flow digesters, consistent with the smaller sizes of the effluent storage ponds, and about 1% higher for IEUA with its modified system.

35
4.5. Sensitivity Analysis 4.5.1. Break-even Analysis
Assumptions To investigate sensitivity of the Cost of Energy, a break‐even analysis was run with after‐tax Internal Rate of Return set to zero (0% IRR). The purpose was not to set rates so low that the farmer fails to make a return on investment, but rather to examine the variation in LCOE throughout the range of IRR to breakeven. Investors of capital would instead opt for safe, risk‐free Treasury securities if breakeven were their only choice.
Furthermore, returns are high because they are not guaranteed and because the high rate allows for slippage in capital costs, operating expenses, and plant performance. The purpose of the break‐even case is to learn the magnitude of the effect of high return on capital on Levelized Cost of Energy.
Because the dairy power plants are capital‐intensive, with the owner required to invest a large sum of money up‐front to build the plant, and because conservative all‐equity financing is assumed, a high return on capital is expected, which will have a significant effect on LCOE. Break‐even analysis was run for both No Subsidy power and No Subsidy pipeline‐quality gas cases.
Results and Discussion Two sets of results for break‐even cash flow analysis for the nine dairy digester projects were prepared, for Power and for Pipeline‐Quality Gas. Because target IRRs of 0% were requested, the model calculated the LCOE/revenues required to produce those IRRs.
In comparing the breakeven cases with the respective No Subsidy Power or No Subsidy Pipeline‐Quality Gas cases, capital cost, performance, and operating expense were unchanged. Only the investor’s return changed. The breakeven summary results for power and pipeline gas are presented in Table 10 and Table 11. Full LCOE results are included in Tables A‐ 8 and A‐9 in the Appendix.

36
Table 10 – No Subsidy Power LCOE and Components (nominal levelized 2007$) for Breakeven (0%) and 17% Equity Returns
Breakeven 17% IRR Dairy Name
No Subsidy Power
LCOE – (¢/kWh)
After-tax
O&M Portion1
(¢/kWh)
Capital Portion (¢/kWh)
No Subsidy Power
LCOE – (¢/kWh)
After-tax
O&M Portion1
(¢/kWh)
Capital Portion (¢/kWh)
Hilarides 3.49 0.45 3.04 10.16 0.45 9.71 Eden-Vale2 6.46 1.16 5.30 17.63 1.16 16.47 Koetsier2 7.18 1.15 6.03 20.40 1.15 19.25 Castelanelli Bros. 7.56 0.94 6.62 22.69 0.94 21.75 Van Ommering2 9.33 1.61 7.72 26.14 1.61 24.53 Meadowbrook 11.24 2.71 8.53 27.63 2.71 24.92 IEUA 21.22 10.20 11.02 34.34 10.20 24.14 Cottonwood 15.65 4.34 11.31 35.46 4.34 31.12 Blakes Landing 11.77 1.16 10.61 37.19 1.16 36.03 1 After‐tax O&M is multiplied by (1‐0.4075) except for IEUA, which is tax‐free. 2 Eden‐Vale, Koetsier, and Van Ommering were adjusted to employ an improved 83.45% plant capacity factor and 13,500 Btu/kWh heat rate. LCOE with a zero percent return is $0.0718 per kWh for Koetsier Dairy versus $0.2040 per kWh with a 17% return. Generally, the breakeven LCOE’s are 30% to 45% of those at 17% return. The one exception is IEUA, which is tax‐free, so the break‐even LCOE is 62% of the full LCOE at 11% return, where the tax‐free target of 11% IRR is employed instead of 17%.
Table 11 - No Subsidy Pipeline-Quality Gas LCOE and Components (nominal levelized 2007$) for Breakeven (0%) and 17% Equity Returns2
Breakeven 17% IRR Dairy Name
No Subsidy Gas LCOE, ($/therm)
After-tax O&M
Portion1
($/therm)
Capital Portion
($/therm)
No Subsidy Gas LCOE, ($/therm)
After-tax O&M
Portion1
($/therm)
Capital Portion
($/therm)
Hilarides 0.439 0.068 0.371 1.245 0.068 1.178 Eden-Vale 1.004 0.169 0.835 2.812 0.169 2.643 Koetsier 1.014 0.151 0.863 2.923 0.151 2.771 Meadowbrook 1.018 0.095 0.923 3.226 0.095 3.131 IEUA 2.447 1.151 1.295 4.004 1.151 2.853 Van Ommering 1.422 0.234 1.188 4.025 0.234 3.791 Castelanelli Bros. (~5 mile pipeline)
1.297 0.103 1.194 4.233 0.103 4.130
Cottonwood 2.015 0.512 1.503 4.801 0.511 4.290 Blakes Landing (~12 mile pipeline)
9.945 0.390 9.555 34.400 0.390 34.010
1 After‐tax O&M is multiplied by (1‐0.4075) except for IEUA, which is tax‐free. 2 For pipeline‐quality gas, all plants operate with a plant capacity factor of 90.0%.

37
For pipeline‐quality gas, LCOE with a zero percent return is $1.018 per therm for Meadowbrook Dairy, versus $3.226 per therm at 17% return. Similar to power, the breakeven LCOE’s tend to be 30% to 42% of those at 17% return. The two exceptions are Blakes Landing with its hugely expensive 12‐mile pipeline at 29% and tax‐free IEUA at 61%.
In conclusion, one lesson to draw is that much can be achieved by reducing the underlying capital cost of the dairy digester energy plant. This reduces upfront investment from farmers or other investors and is more useful than trying to reduce their return on investment.
4.5.2. Impacts of Carbon Credits, Production Tax Credits, and Bonus Depreciation
Assumptions This section investigates reducing LCOE through tax and other credits of various types. These include selling carbon credits, utilizing federal internal revenue code Section 45 renewable energy production tax credits, and applying bonus depreciation under the federal tax code.
Carbon credits, measured as a price per metric ton of carbon dioxide equivalent, are currently traded at the Chicago Climate Exchange (CCX), which operates a voluntary, legally binding, greenhouse gas reduction and trading system. Credits are available for a variety of projects, such as forestry carbon sequestration (afforestation), landfill methane capture, etc. Credits are available for dairy digester projects for methane reduction and for power production from a renewable energy source.
For this analysis, the carbon credit price was estimated at a conservative value of $3.00 per metric ton of carbon dioxide equivalent. At the CCX, the credit price has ranged from about $1.00 to about $4.00 from 2004 through 2007. Recently, it reached $6.00 per MT CO2 equivalent.
As a point of contrast, projections by the Intergovernmental Panel on Climate Change (IPCC) and the European Union utilize estimates ranging up to $100 per metric ton CO2
equivalent for purposes of stimulating changes to mitigate climate change impacts.7, 8
7 Barker, T., et al., 2007: Technical Summary: In: Climate Change 2007: Mitigation. Contribution of Working Group III to the Fourth Assessment Report of the Intergovernmental Panel on Climate Change, Cambridge University Press, Cambridge, UK, and New York, NY, USA.
8 www.vattenfall.com/climatemap (Climate map prepared by Vattenfall, the Swedish power company, with roots in hydro, which now owns power plants across Europe and promotes renewable energy and carbon reduction.), Stockholm, Sweden).

38
Credits are much higher in Europe, partly because it has a has a mandatory cap and trade system, where governments require industries to reduce carbon emissions.
Figure 1 shows CCX Carbon Credit prices and volume of contracts traded, over the past four years, as of April 18, 2008.
Figure 1 - Carbon Credit Prices at the Chicago Climate Exchange, Oct 2003 - Apr 2008
Reference: graph taken from http://www.chicagoclimatex.com/market/data/summary.jsf; April 20, 2008.
Carbon credit data are summarized in Tables 12 and 13. The methane reduction and renewable energy production used in computing the credit were estimated using CCX Agricultural Methane Gas Project Guidelines9 and with data from the California Climate Action Registry livestock protocols.10
9 CCX Agricultural Methane Gas Project Guidelines, Chicago Climate Exchange, Chicago IL, February 14, 2008, Table B.7 (B.7 is a CCX table with Baseline GHG emissions from anaerobic lagoon manure management, by animal type and by state. See http://www.chicagoclimatex.com/docs/offsets/Agriculture_Methane_Protocol.pdf )
10 Updated Macroeconomic Analysis of Climate Strategies Presented in the March 2006 Climate Action Team Report, prepared by Economics Subgroup, Climate Action Team, Oct 15, 2007. (For CO2 offset from renewable energy, see pages 10‐13 of http://www.climatechange.ca.gov/events/ 2007‐09‐14_workshop/final_report/2007‐10‐15_MACROECONOMIC_ANALYSIS.PDF )

39
Table 12 – Carbon Credits at $3.00/ Metric Ton CO2 for On‐Site Power Generation
Dairy Methane
Reduction (CO2 Metric
Tons)
Renewable
Energy (CO2 Metric Tons)
Total (CO2
Metric Tons)
Credit Price ($/CO2 MT)1
Total Credit Value (start-
year $)
Hilarides 17,237 1,059 18,296 $3.00 $54,900 Cottonwood 10,128 668 10,795 $3.00 $31,765 Blakes Landing 1,355 79 1,434 $3.00 $4,216 Castelanelli 7,892 355 8,247 $3.00 $24,216 Koetsier 9,957 595 10,552 $3.00 $31,700 Van Ommering 4,978 297 5,276 $3.00 $15,800 Meadowbrook 6,693 344 7,038 $3.00 $20,686 IEUA 35,262 2,370 37,632 $3.00 $112,900 Eden-Vale 6,893 412 7,305 $3.00 $21,900
1 The Carbon Credit price is assumed to be $3.00 per Metric Ton of Carbon Dioxide equivalent escalating at inflation less one half percent (2.50% ‐ 0.50%), which is 2.00% here. Credits for plants starting in 2005 were reduced by one yearʹs escalation of 2.00%.
Table 13 – Carbon Credits at $3.00/ Metric Ton CO2 for Pipeline-Quality Gas1 Dairy
Methane Reduction
(CO2 Metric Tons)
Renewable
Energy (CO2 Metric Tons)
Total (CO2 Metric Tons)
Credit Price ($/CO2 MT)1
Total Credit Value (start-
year $) Hilarides 17,237 1,724 18,961 $3.00 $56,900 Cottonwood 10,128 1,013 11,141 $3.00 $32,745 Blakes Landing 1,355 136 1,491 $3.00 $4,412 Castelanelli 7,892 789 8,681 $3.00 $25,490 Koetsier 9,957 996 10,953 $3.00 $32,900 Van Ommering 4,978 498 5,476 $3.00 $16,400 Meadowbrook 6,693 670 7,363 $3.00 $21,667 IEUA 35,262 3,527 38,789 $3.00 $116,400 Eden-Vale 6,893 690 7,583 $3.00 $22,700
1 Gas is assumed to be converted to electricity more efficiently at the utility. The carbon credit is assumed to be passed back to the dairy farmer or the effects of the carbon credit, such that price is lowered.
2 The Carbon Credit price is assumed to be $3.00 per Metric Ton of Carbon Dioxide equivalent, escalating at inflation less one half percent (2.50% ‐ 0.50%), which is 2.00% here. Credits for plants starting in 2005 were reduced by one year’s escalation of 2.00%.
In addition to selling carbon credits, another possible benefit the farmer may employ is utilizing tax credits. Section 45 of the Federal Tax Code provides for a renewable electricity Production Tax Credit (PTC). For plants placed in service after August 8, 2005, the date of enactment of the Energy Policy Act of 2005, those plants accepting agricultural livestock waste nutrients as fuel feedstock, that produce electricity, and that are sized at 150 kW or more, are classed as open‐loop biomass and are eligible to receive the PTC for ten years. All PTCs are inflation‐adjusted and the open‐loop biomass PTC increased to 1.0 cents per kWh in 2007. Interestingly, when introduced in 2004, the credit

40
for biomass was five years, so open‐loop biomass plants placed in service before January 1, 2005, receive only a 5‐year credit. Furthermore, to date (April 2008), possible expiration looms, because the PTC applies only to plants built before January 1, 2009. Proponents are hopeful the credit will otherwise be extended as it has been several times previously.
Finally, for three plants, 50% bonus depreciation was added. Bonus depreciation now permits up to half of the capital cost to be expensed in the first year. Enacted to spur development of projects undertaken from September 2001 through 2004, bonus depreciation expired, as of January 1, 2005, for most categories of equipment. For 2008, 50% Bonus Depreciation was revived as part of the 2008 Economic Stimulus Act, for plant and equipment purchased and placed in service through December 31, 2008.
Because of concerns over loss of tax revenues, several states including California, “decoupled” from the federal government regarding bonus depreciation, so their state depreciation write‐offs are slower and their state taxes are slightly higher. Because it does not allow the state depreciation schedule to be different than that of the federal government, the cash flow model employed here shows the state also allowing 50% bonus depreciation. Therefore, the LCOE calculated here is slightly lower than the actual case.
Otherwise, for this analysis, assumptions closely follow those for the No Subsidy Power and No Subsidy Pipeline‐Quality Gas options and are not repeated here. Economic and financial assumptions remain the same as for those No Subsidy cases.
Results and Discussion Summary LCOE results for the No Subsidy Power projects are shown in Table 14, including without subsidies, with carbon credits only, and with carbon credits and PTC combined. The reduction from carbon credits varies from $0.017 to $0.024 per kWh, and approximately 5 to 18%. When the Section 45 PTC can be taken, it reduces LCOE by another approximately $0.015 per kWh, or about 4 to 15%.

41
Table 14 – No Subsidy Power LCOE (nominal levelized 2007$) with Carbon Credit and PTC Dairy Name
No Subsidy Power
LCOE – 17% IRR (¢/kWh)
LCOE for 17% IRR with carbon credit
(¢/kWh)
Decrease in COE from
Carbon Credit
LCOE for 17% IRR
with carbon credit and
PTC (¢/kWh)
Additional Decrease in COE from
PTC
Hilarides 10.16 8.32 18% 6.80 15% Eden-Vale1 17.63 15.79 10% 14.25 9% Koetsier1 20.40 18.55 9% 17.02 8% Castelanelli Bros. 22.69 20.28 11% 18.70 7% Van Ommering1 26.14 24.19 7% n/a2 Meadowbrook 27.63 25.43 8% 23.95 5% IEUA 34.34 32.60 5% n/a3 Cottonwood 35.46 33.73 5% 32.25 4% Blakes Landing 37.19 35.20 5% n/a2 1 Eden‐Vale, Koetsier, and Van Ommering were adjusted to employ an improved 83.45% plant capacity factor and a heat rate reduced to 13,500 Btu/kWh. 2 Engines must be sized at 150 kW or greater to be eligible for Section 45 PTC. 3 IEUA is tax‐exempt and cannot take the Section 45 PTC. It might be eligible for the Renewable Energy Production Incentive payment, but would need to apply. Table 15 shows the effects of carbon credits on LCOEs for the pipeline‐quality gas projects. Plants producing pipeline‐quality gas cannot take the PTC because it is available only to renewable electricity producers. The reduction in LCOE varies from $0.188 to $0.204 per therm (about 4% to 15%), with less for Blakes Landing because of the expensive pipeline required to deliver gas to the utility.
Table 15 - No Subsidy Pipeline-Quality Gas LCOE (nominal levelized 2007$) with Carbon Credit1, 2
Dairy Name
No Subsidy Gas LCOE,
with 17% IRR ($/therm)
COE for 17% IRR with
carbon credit ($/therm)
Decrease in
COE (percent)
Hilarides 1.245 1.056 15% Eden-Vale 2.812 2.624 7% Koetsier 2.923 2.729 7% Meadowbrook 3.226 3.033 6% IEUA 4.004 3.806 5% Van Ommering 4.025 3.827 5% Castelanelli Bros. (~5 mile pipeline) 4.233 4.029 5% Cottonwood 4.801 4.608 4% Blakes Landing (~12 mile pipeline) 34.400 34.239 0%
1 For pipeline‐quality gas, all plants operate with a plant capacity factor of 90.0%. 2 Plant must produce electricity to be eligible for Section 45 PTC. One additional sensitivity was analyzed, specifically use of an accelerated 50% Bonus Depreciation schedule (whereby 50% of the project value is expensed in the first year).

42
This analysis was completed for three dairy digester projects, reflecting a high‐low range, both for Power and for Pipeline‐Quality Gas. Summary results are shown in Tables 16 and 17 for power and pipeline‐quality gas, respectively. The tables list the No Subsidy values for reference.
In Table 16, Hilarides bounds the lower end of the LCOE range and also experiences the largest impact from carbon credits, PTC, and Bonus Depreciation with a at 37% decrease. Even if the state tax schedule were decoupled and only federal depreciation and taxes reflected 50% bonus depreciation, the LCOE would be competitive with market rates. The other projects in the table are not competitive, with or without subsidies.
Table 16 – No Subsidy Power LCOE (nominal levelized 2007$) with Carbon Credit, PTC, and 50% Bonus Depreciation
Dairy Name
No Subsidy Power LCOE
– 17% IRR (¢/kWh)
LCOE for 17% IRR
with carbon credit
(¢/kWh)
LCOE for 17% IRR with
carbon credit and PTC (¢/kWh)
LCOE for 17% IRR with carbon credit, PTC, and
50% Bonus Deprec (¢/kWh)
Total Decrease in LCOE From
All Subsidies (%)
Hilarides 10.16 8.32 6.80 6.36 37% Cottonwood 35.46 33.73 32.25 30.79 13% Meadowbrook 27.63 25.43 23.95 22.80 17%
Table 17 ‐ No Subsidy Pipeline‐Quality Gas LCOE (nominal levelized 2007$) with Carbon Credit and 50% Bonus Depreciation1, 2
Dairy Name
No Subsidy Gas LCOE, with 17%
IRR ($/therm)
LCOE for 17% IRR
with carbon credit
($/therm)
LCOE for 17% IRR with
carbon credit and 50% Bonus
Deprec ($/therm)
Total Decrease in LCOE (%)
Hilarides 1.245 1.056 0.995 20% Cottonwood 4.801 4.608 4.415 8% Meadowbrook 3.226 3.033 2.883 11%
1 For pipeline‐quality gas, all plants operate with a plant capacity factor of 90.0%. 2 Plant must produce electricity to be eligible for Section 45 PTC.
Table 17 shows that the total decrease in LCOE from the combination of carbon credits and 50% bonus depreciation ranges from 8% to 20%.
4.6. Recent Favorable Utility Rate Structures
Standard Offer Contracts Dairy digester power and pipeline‐quality gas plants may be characterized as a high capital cost, low operating expense technology. That is, the fixed or capital component of

43
LCOE tends to be high, while the variable or operating expense component is much lower. To improve its levelized costs of energy, which means to reduce the power price charged to customers, the dairy digester plants need to operate long hours, making for a high plant capacity factor, so as to spread their high fixed costs over a larger amount of energy sales. As discussed with Actual Cases, under Section 3.3 and Section 4.1, because net metering credits sometimes were forfeited and because prices were low, some farmers flared biogas, deliberately turned down their engine‐generators and operated at capacity factors as low as 20% to 45%. If higher power purchase rates were available, farmers could be expected to operate at higher plant capacity factors and to stop flaring gas, improving the overall heat rate.
During the WURD study period of June 2004 through July 2006, options for selling power were principally that the farmer connected on‐farm electric loads and displaced purchases at a retail rate and exhanged power under a net metering agreement with the utility for a wholesale rate. As discussed, despite meeting on‐farm load with the dairy power plant, several farmers continued to pay demand charges, so they saved only the energy portion of the retail rate. Net metering credits were forfeited if the farmer did not use enough power within 12 months to off‐set excess energy delivery to the utility.
Beginning in 2007, the utilities are offering dairy farmers more favorable terms. Since May 2007, Southern California Edison (SCE) has offered a Biomass Standard Contract for plants under 1 MW, so they may sell energy and as‐delivered capacity for one all‐in rate, now over 9 cents/kWh, that holds flat for the years of the contract. The rate varies depending on plant start‐up date and whether the contract is for 10, 15, or 20 years. This schedule matches the California Market Price Referent (MPR) rate, representing the long‐term levelized price in nominal dollars of a combined cycle natural gas plant. When utilities sign power purchase contracts, especially after issuing an RPS solicitation, prices at or below the MPR are considered reasonable by the California PUC. SCE offered these contracts through December 31, 2007, which was extended to be through December 31, 2008, or until 250 MW is signed, whichever comes first. Projects must come on line within 5 years of the deadline. One attractive feature is that because SCE’s contract is for as‐delivered capacity and not firm capacity, there is no penalty for modest plant outages.
Pacific Gas and Electric (PG&E) offers a similar contract. For PG&E, which announced its program in early September 2007, plants may be sized to 1.5 MW, contracts are available until 104 MW from renewables and 104 MW from Water Agencies are signed, and projects have 18 months to be built and start‐up (not 5 years). One attractive feature is that PG&E allows the project owner to sell all output from the plant (full buy/sell) or to sell only excess power, after on‐site use by the seller (excess sale).
The adopted 2007 Market Price Referents, passed by the CPUC with Resolution E‐4118 and effective October 4, 2007, are as shown in Table 18. This MPR schedule is cited in Standard Contracts by both SCE and PG&E, except SCE’s contract lists years only

44
through 2016. The MPR rate indicated holds flat for the term of the contract and does not escalate.
Table 18 – Adopted 2007 Market Price Referents (nominal dollars per kWh)
Resource Type 10-year 15-year 20-year
2008 Baseload MPR 0.09271 0.09383 0.09572 2009 Baseload MPR 0.09302 0.09475 0.09696 2010 Baseload MPR 0.09357 0.09591 0.09840 2011 Baseload MPR 0.09412 0.09696 0.09969 2012 Baseload MPR 0.09518 0.09844 0.10139 2013 Baseload MPR 0.09605 0.09965 0.10275 2014 Baseload MPR 0.09722 0.10107 0.10430 2015 Baseload MPR 0.09872 0.10274 0.10606 2016 Baseload MPR 0.10053 0.10466 0.10804 2017 Baseload MPR 0.10269 0.10685 0.11143 2018 Baseload MPR 0.10478 0.11016 0.11489 2019 Baseload MPR 0.10818 0.11370 0.11720 2020 Baseload MPR 0.11172 0.11603 0.11954
As an overlay to the MPR schedule, both PG&E and SCE offer a time‐of‐delivery (TOD) option where, if the dairy installs time‐of‐day metering, it may opt to sell time‐of‐delivery power, to receive a higher‐than‐average rate during peak periods and lower‐than‐average during off‐peak periods. During the best pricing periods during summer peak demand hours (e.g., noon through 6:00 pm on weekdays from June through September except holidays), the utilities pay 2 to 3 times the average rate. To take maximum advantage, obviously, the generator sells as much power as possible during peak periods and schedules plant shut‐down and repairs for night and other off‐peak periods. It is noted that PG&E’s time of delivery periods, classification categories, and payments vary slightly from those of SCE. Utility tariffs and contract conditions should be carefully reviewed by legal counsel before entering into contracts.
San Diego Gas and Electric (SDG&E) is California’s southern utility. Because it is smaller, and there are fewer dairy farms in its territory, SDG&E does not offer a specific Standard Contract for projects sized under 1 MW. Minimum project size is 1.5 MW for certain projects and 5 MW for others. However, a representative of SDG&E, interviewed for this report in April 2008, said that dairy farmers with digester power plants should come to talk to SDG&E to try to work out mutually agreeable terms, on a custom basis.
Feed-In Tariffs In other recent developments, on February 20, 2008, in implementing California Assembly Bill 1969 (2006) to increase renewable energy use and reduce greenhouse gas emissions, the CPUC formalized its approval of the Standard Offer Contracts described above. Furthermore, the CPUC established a standard tariff, also termed a Feed‐in Tariff

45
(FIT), to be paid by utilities purchasing power from customers. The FIT is determined by the Market Price Referent and TOD schedules.
For SCE, PG&E, and SDG&E, as well as for PacifiCorp, Sierra Pacific Power, Bear Valley Electric Service, and Mountain Utilities, the FIT applies to public water and wastewater facilities selling power from renewable energy plants, but for SCE and PG&E, it applies also to retail customers selling power from small systems up to 1.5 MW (utilizing renewable energy or fossil fuel), who do not utilize other state incentive programs. The CPUC published sample rates as reproduced in Table 19.
Table 19 – Sample Time Dependent Prices, under a 15-year Contract starting in 2008
Summer Week-day ($/kWh) Winter Week-day ($/kWh)
Utility Peak Shoulder Off-Peak Peak Shoulder Off-Peak PG&E 0.18 0.08 0.06 0.14 0.10 0.07 SCE 0.31 0.12 0.06 0.10 0.08 0.06 SDG&E 0.15 0.10 0.08 0.11 0.10 0.07 CPUC Resolution E‐4137, February 14, 2008.

46
5.0. Conclusions
Actual Cases: Analysis of the Actual Cases showed that LCOEs tended to be low, but IRRs varied widely. All but one of nine actual projects installed under the California Energy Commission’s Dairy Power Production Program (DPPP) and receiving grants or production payment incentives had a levelized cost of energy (LCOE) under $0.10/kWh (in nominal 2007 dollars) using the cost and performance data from the 2006 WURD report. However, the farmers signed net metering agreements with the local utility, took the rates that were offered, and only five of those plants showed attractive returns, ranging from 4% to 23%, as measured by after‐tax IRR.
Three of the nine had LCOE below $0.07/kWh, but they showed IRRs at break‐even, for one plant, and at about ‐13% to ‐14%, for two others. One plant had LCOE of $0.098/kWh, but its IRR was about ‐14%. Farmers who received too low a power purchase price did not run their plants in optimal fashion, but flared gas and deliberately turned down their engines to operate below rated capacity.
Results of this portion of the economic study show that with grant assistance, the three best returns belong to Hilarides, with an after‐tax IRR at 22.82%, Castelanelli at 21.27%, and Blakes Landing at 19.02%. The three next best are Cottonwood at 8.64%, Meadowbrook at 4.76%, and Van Ommering at ‐0.12%, which is about break‐even. However, the remaining three returns are negative, including Koetsier at ‐13.25%, IEUA at ‐13.78%, and Eden‐Vale at ‐13.97%.
Large variations in IRR are due to the different amount of grants received; prices paid for electricity sold to utilities (with some dairies not receiving capacity payments and/or still required to pay utility demand charges); capital cost of plant and equipment, operating efficiency, and O&M costs. For example, Hilarides received a “buy‐down” grant for 40% of capital cost. They held initial capital cost low at $2,480/kW by using refurbished equipment, while other farms spent at least double that figure. As another example, Blakes Landing operated with only a 38.48% plant capacity factor and realized a capital cost of $4,504/kW, but they sold most of their electricity during peak periods, at attractive prices of $0.1509/kWh retail and $0.1257/kWh wholesale (nominal levelized 2007$), which offset their higher costs.
No Subsidy Power: All of the DPPP projects were subsidized with grants or production payment incentives. If grants and subsidies are removed, the LCOEs are higher, and are no longer near the competitive range for AD power or gas projects.
However, it is critical to note that for the “No Subsidy” power cases, the AD digester system and the engine‐generator were assumed to operate under the same estimates of capital cost, performance, and operating expense as for the “Actual” cases. The

47
exception was that three plants with low plant capacity factors were adjusted upward, which reduced their LCOEs, but not sufficiently to reach market rates, as measured by the market price referent (MPR), without peaking adjustments.
Consequently, beyond the farmer’s running the existing plant longer, which manifests in an improved plant capacity factor, the broad conclusion is the need to improve plant design, reduce plant and equipment capital costs, and improve performance.
Specifically, to lower capital costs, increase plant performance, and reduce operating and maintenance expenses, both equipment and overall plant design could be standardized to a larger degree, and then optimized for each application. This holds for manure handling systems and other feedstock logistics, digesters , effluent handling, liquid storage, gas processing and cleaning, emission controls, and the engine‐generator system. Heat recovery equipment can further improve efficiency.
In league with design, field testing and operational experience are important to improving the cost and performance of the technology. For example, improved gas clean‐up equipment should be installed to reduce the need to frequently rebuild engines and replace lubricating oil. With more performance and operation data available, financial projections will be more accurate, aiding the farmer/owner and any investors.
No Subsidy Pipeline‐Quality Gas: The pipeline‐quality gas systems were generally costly, due to the cost of gas clean‐up and upgrading. Without grants or other subsidy, production of pipeline‐quality gas is not economically feasible due to the small volume of biogas produced (less then 500 Mcf/day). When the farm is far from a utility pipeline, cost increases significantly because of the cost to build a connecting pipeline.
Enhanced Environmental Quality: For enhanced environmental quality cases producing power, levelized costs of energy would be increased over those for no subsidy power by about 5% to 25% for most of the DPPP plants, with one exception at 83% and another at 1%. For enhanced environmental quality cases producing pipeline‐quality gas, levelized costs of energy are increased by slightly smaller percentages, but the base prices for no subsidy pipeline‐quality gas are sufficiently high that the smaller increase is still problematic.
As discussed above, before or concurrent with development of the enhanced environmental quality systems, greater standardization of design is encouraged. Otherwise, No Subsidy Power LCOEʹs are high and those for Enhanced Environmental Quality Power are higher yet. No Subsidy Pipeline‐Quality Gas LCOEʹs mostly are not economically feasible against current natural gas tariffs, nor are the Enhanced Environmental Quality Pipeline‐Quality Gas systems under these projections.

48
Summary: For the near term, it would appear that, while equipment becomes more standardized and further field experience is gained, grants or other subsidy mechanisms are still needed for most systems to encourage future development, that is, to give the farmer/owner a sufficiently attractive return to undertake the project. There is an obvious need to reduce capital costs on average, and the wide range in costs clearly demonstrates the potential for improvement in this category.
The two obvious ways for AD projects to maximize the rate paid for their electrical energy are to use a large fraction of power on site, because retail rates are higher than wholesale, and to maximize sales during peak periods, the latter assuming the process is in place to meter and bill under time‐of‐delivery. In addition to maximizing the rate paid for sales of power, there are other potential sources of additional revenues and subsidies outside of participation in the DPPP that can improve project economics including carbon credits, Section 45 production tax credits (PTC), and possible sale of byproducts.
The sensitivity analysis conducted in this report showed that under special circumstances where initial capital cost is reduced below current market price levels, a biogas power system can be economically feasible
Specifically, without grant assistance, the No Subsidy Hilarides dairy power project achieved a levelized cost of energy of 6.80 cents/kWh (in nominal 2007 dollars), with the following set of conditions:
• Plant size of 500 kW;
• capital cost of $2,643/kW, partly achieved by using refurbished equipment;
• plant capacity factor of 77%;
• carbon credit at $3/MT CO2 equivalent; and
• Section 45 PTC of $0.01/kWh.
With 50% Bonus Depreciation, the LCOE declines further to 6.36 cents/kWh.

49
6.0. Recommendations
Results of this study show that further research and field operating experience with AD biogas systems at dairy farms is needed to reduce capital costs and operating expenses, and to improve efficiency to the point where projects are more economically attractive. Research and greater operating experience are needed regarding:
• feedstock logistics, to reduce costs of handling;
• the digester system, to optimize gas production;
• the engine‐generator, to increase operating time, net power production, and reduce emissions;
• the pollution control system to meet air and water quality standards;
• the gas clean‐up equipment to extend equipment life and provide greater flexibility in engine exhaust after‐treatment, to reduce air emissions from power generation, and to improve gas upgrading for pipeline injection; and
• heat recovery equipment to further improve overall project efficiency.
The economics of above‐ground reactors should be examined. Grants or other subsidies are still needed to promote development to gain field experience and benefit waste management.
Greater collaboration is required among dairy operators, utilities, permitting agencies, and funding and financing authorities to ensure an attractive price is paid that encourages efficient plant operation. This involves resolving existing issues on net metering, such as paying the farmer both energy and demand charges for excess energy delivered, setting reasonable stand‐by demand charges consistent with well operated, high capacity factor systems, and reducing or eliminating forfeiture of net metering credits.
Alternatively, it involves developing attractive power purchase agreements for small power projects to buy all output or excess energy (above the sellerʹs on‐site use) at attractive long‐term rates. One attractive feature of SCE’s Small Biomass Standard Contract, for example, is that the utility will buy “as‐delivered capacity” and not “firm capacity,” so there is no penalty for modest plant outages.
The new feed‐in tariffs offer a means to buy power that may prove attractive. But there is concern that low off‐peak rates result in average electricity prices that are typically insufficient to justify base‐load operation. The long term contracting requirements create uncertainty for some when weighing choices between feed‐in tariffs and net metering.
50
Additional research and analysis should be conducted to assess the potential benefits from codigesting additional feedstocks with manure. For example, additional volume to the plant may be achieved by augmenting with another waste stream, such as food or food processing waste, e.g. from a nearby cheese plant. A significant boost to revenues might be achieved. Further, additional revenues from sales of co‐products from the AD process, e.g., fertilizer, livestock bedding material, should be evaluated for their impact on LCOE.
Most current plants are all equity financed, so there may be opportunities for aggregators or other developers to build larger anaerobic digester facilities. Such facilities would include economies of scale in equipment purchase, installation, and operation and might be financed using non‐recourse project finance including debt, which would improve economics. However, because manure management is integral to operation of the dairy farm, some farmers will want to maintain control and will continue to finance using all equity. A possible hybrid approach could be to aggregate equipment purchases and certain project design development and maintenance services to lower costs through standardization and bulk purchase discounts.
Regarding prices, some critics worry that a 20‐year nominal flat price encouraged by MPR will be greatly under market prices near the end of its term if inflation were to increase. They would argue for a year one bid price that starts lower, but is accompanied by an annual escalator moving with some widely‐accepted economic index (e.g., PPI, the Producer Price Index). This is unlike the approach adopted with Standard Offer Number Four (SO4) contracts in the past because the first ten years of the contract would not be fixed in advance based on today’s estimate of inflation. Rather, rates would “float” with the index, changing every year. At today’s forecast of inflation, the bid price and escalator would be equivalent to MPR. But should inflation rise, the power producer would receive “fair” market prices, and would not receive such low prices that he or she abandons the project or, in the case of a farmer, where the dairy digester is a key component to farming, operates at a very low plant capacity factor. This is equivalent to suggesting the MPR be indexed.
At the same time, Feed‐in tariffs may be combined with efforts to run the plant as a peaking operation. Some means of gas storage must be developed, perhaps in combination with over‐sizing the plant, by connecting several modular units that provide back‐up or by employing one or two larger units that are more cost‐effective. The farmer runs the plant to sell mostly peak and partial‐peak power.
Lastly, as farmers seek to build more projects, state environmental and other agencies might conduct outreach through meetings, written materials, and web‐site information. Agencies might explain what materials and information are needed to obtain permits, such that farmers and their engineers could provide them quicker and with less revision.

51
7.0. References
1 Dairy Power Production Program (DPPP) Dairy Methane Digester System Program Evaluation Report, prepared for ENERGY COMMISSION by Western United Resource Development; Modesto CA; August 2006. (Note that this report tends to cover 12‐month periods of dairy power plant operation, which vary from June 2004 though July 2006.)
2 California Energy Commission. Dairy Power Production Program. Dairy Methane Digester System 90‐Day Evaluation Report Blakes Landing Dairy (Straus). CEC‐500‐2005‐114.
3 California Energy Commission. Dairy Power Production Program. Dairy Methane Digester System 90‐Day Evaluation Report Castelanelli Bros. CEC‐500‐2005‐115.
4 California Energy Commission. Dairy Power Production Program. Dairy Methane Digester System 90‐Day Evaluation Report Cottonwood Dairy (Joseph Gallo Farms). CEC‐500‐2005‐116.
5 California Energy Commission. Dairy Power Production Program. Dairy Methane Digester System 90‐Day Evaluation Report Meadowbrook Dairy. CEC‐500‐2005‐117.
6 California Energy Commission. Dairy Power Production Program. Dairy Methane Digester System 90‐Day Evaluation Report ‐ Hilarides Dairy. CEC‐500‐2006‐086.
7 California Energy Commission. Dairy Power Production Program. Dairy Methane Digester System 90‐Day Evaluation Report ‐ Inland Empire Utilities Agency RP‐5 Solids Handling Facility. CEC‐500‐2006‐099.
8 California Energy Commission. Dairy Power Production Program. Dairy Methane Digester System 90‐Day Evaluation Report ‐ Koetsier Dairy. CEC‐500‐2006‐085.
9 California Energy Commission. Dairy Power Production Program. Dairy Methane Digester System Initial Evaluation Report Lourenco Dairy. CEC ‐500‐2006‐100.
10 California Energy Commission. Dairy Power Production Program. Dairy Methane Digester System 90‐Day Evaluation Report – Eden‐Vale Dairy. CEC‐500‐2006‐083.
11 California Energy Commission. Dairy Power Production Program. Dairy Methane Digester System 90‐Day Evaluation Report ‐ Van Ommering Dairy. CEC‐500‐2006‐084.
12 Pacific Gas & Electric Company, San Francisco CA, “Biogas White Paper (External Version),” as a short summary paper with cost estimates for pipeline‐quality gas interconnection, received June 2007 from PG&E.
13 California Public Utilities Commission, “Resolution E‐4118 (to formally adopt 2007 Market Price Referent Values for 2007 Renewable Portfolio Standard solicitations),” dated October 4, 2007, San Francisco CA.
52
14 California Public Utilities Commission, “Resolution E‐4049 (to formally adopt 2006 Market Price Referent Values for 2006 Renewable Portfolio Standard solicitations),” dated December 14, 2006, San Francisco CA.
15 California Public Utilities Commission, “Discussion on Market Price Referents [MPR], MPR Methodologies To Determine the Long‐Term Market Price of Electricity for Use in California Renewables Portfolio Standard (RPS) Power Solicitations,” dated March 22, 2004, San Francisco CA.
16 California Public Utilities Commission, “Resolution E‐3980 (to formally adopt 2005 Market Price Referent Values for 2005 Renewable Portfolio Standard solicitations),” dated April 13, 2006, San Francisco CA.
17 Telephone communication re: MPR: PERI (Rockville MD) and Ken Brennan of Pacific Gas & Electric (San Francisco CA); July 2007.
18 Email correspondence: PERI (Rockville MD) and Professor Bryan Jenkins, Dept of Biological and Agricultural Engineering, University of California – Davis (Davis CA); August 2007, re: their revenue requirements version of a biomass cost calculator.
19 Telephone communication and email correspondence: PERI (Rockville MD) and Kathi Schiffler and Tiffany LaMendola of Western United Resource Development (Modesto CA); August 2007 and October 2007.
20 Telephone communication re: power prices and contracts: PERI (Rockville MD) and Southern California Edison (Rosemead CA) with George Salama, August 2007, and with George Wiltsee, April 2008.
21 Southern California Edison, Rosemead CA, “Biomass Standard Contract (less than 1 MW),” approx 100 pages, downloaded August 2007. Updated version with October 2007 Market Price Referents, downloaded April 2008.
22 Southern California Edison, Rosemead CA, “Biomass Program,” 5 pages, downloaded August 2007 from www.sce.com/energy procurement under Biomass Standard Contracts information package.
23 Telephone communication re: power prices and contracts: PERI (Rockville MD) and Pacific Gas & Electric (San Francisco CA) with Mark Renson, August 2007, and with Molly Hoyt, April 2008.
24 Pacific Gas & Electric Company, San Francisco CA, “Schedule NEMBIO‐Net Energy Metering Service for BioGas Customer‐Generators,” Advice Letter No. 2888‐E‐A, filed February 28, 2007.
25 Pacific Gas & Electric Company, San Francisco CA, “Schedule E‐SRG Small Renewable Generator PPA,” Advice Letter No. 3098‐E‐A, filed February 20, 2008.
26 Pacific Gas & Electric Company, San Francisco CA, “Energy Prices for Qualifying Facilities, Effective April 1‐30, 2008.” 2‐page listing.

53
27 Pacific Gas & Electric Company, San Francisco CA, “2008 As‐Delivered Capacity Prices for Qualifying Facilities, Effective January 1, 2008.” 1‐page listing.
28 Telephone communication re: power prices and contracts: PERI (Rockville MD) and San Diego Gas & Electric (San Diego CA) with Bonnie Bailey (working with Ken Clay), August 2007, and with Dan Frank, April 2008.
29 San Diego Gas & Electric Company, San Diego CA, “Schedule NEM‐BIO, Net Energy Metering Service for BioGas Customer‐Generators,” Advice Letter No. 1741‐E, filed November 14, 2005.
30 Telephone communication: PERI and Carl Morris of Cottonwood Dairy (Joseph Gallo Farms, Atwater CA), August 2007, to confirm the dairy’s electric utility is PG&E, not Merced Irrigation District. Also, he stated no updated cost and performance data for his dairy has been formally prepared.
31 Telephone communication re: gas cleanup: PERI and Gilbert Ching of Southern California Gas (Los Angeles CA); August 2007.
32 Telephone communication re: pipeline locations, etc.: PERI and Jerry McPherson of Southern California Gas (Los Angeles CA); August 2007.
33 Email communication re: pipeline distances and location: PERI and Dr. Zhiqin Zhang of the California Energy Commission (Sacramento, CA), including one‐page Excel file, ʺ10 dairies pipeline gas,ʺ sent October 08, 2007.
34 “CAFO opponents outline legislative goals for 2008,” Peggy Vlerebome, Madison Courier (newspaper), Madison Indiana, August 13, 2007.
35 Email and telephone communication re: water resources: PERI and Bob Languell of State Water Resources Control Board – Office of Research, Planning, and Performance, California Environmental Protection Agency (Sacramento CA), August through December 2007.
36 Email and telephone communication re: Lagoon Liners and Water Monitoring: PERI and Krzysztof Jesionek, P.E. of Geosyntec Consultants (Oakland CA), September‐October 2007.
37 Email and telephone communication re: Lagoon Liners and Water Monitoring: PERI and Tom Woodward of Vector Engineering (Grass Valley CA), September‐October 2007.
38 “A Guideline for Co‐Digestion of Food Wastes in Farm‐based Anaerobic Digesters,” Fact Sheet FW‐2, Manure Management Program, Cornell University, Ithaca NY, downloaded September 2007.
39 “Benefits, Costs, and Operating Experience at Seven New Agricultural Anaerobic Digesters,” M. A. Moser et al., presented at BioEnergy98, Expanding BioEnergy Partnerships, Madison WI, October 4‐8, 1998.

54
40 California Energy Commission. Anaerobic Digester Implementation Issues Phase 1 ‐ A Survey of U.S. Farmers (Farm Bill Section 9006), Resource Strategies, Inc. ENERGY COMMISSION ‐500‐2006‐115A, December 2006.
41 California Energy Commission. Anaerobic Digester Implementation Issues Phase 2 ‐ A Survey of California Farmers (Dairy Power Production Program), Resource Strategies, Inc. ENERGY COMMISSION ‐500‐2006‐115B, December 2006.
42 California Energy Commission. “’Lessons Learned’ on California Dairy Digesters,” Zhiqin Zhang, Ph.D. of ENERGY COMMISSION ; viewgraphs for Power‐Gen Renewable Energy and Fuels Conference, Las Vegas NV, March 6‐8, 2007.
43 Sacramento Municipal Utility District (SMUD), “Barriers and Solutions to Developing Bioenergy in California,” Ruth MacDougall; presented to Bioenergy Interagency Working Group, Sacramento CA, June 11, 2007.
44 California Energy Commission. (April 2002, Report 500‐02‐020F), Economic and Financial Aspects of Landfill Gas to Energy Project Development in California, SCS Engineers.
45 U.S. Environmental Protection Agency (September 1996, EPA 430‐B‐96‐0004), Turning a Liability into an Asset: A Landfill Gas‐to‐Energy Project Development Handbook, including Appendices; Washington DC.
46 SCS Engineers, “CNG, LNG, and Other Fuels from Landfill Gas – Prospects for Future Development,” Patrick Sullivan, presented to California Biomass Collaborative, 4th Annual Forum, Sacramento CA, March 28, 2007.
47 Email correspondence re: gas cleanup: PERI (Rockville MD) and Jeff Pierce of SCS Engineers (Sacramento CA); October 2007.
48 Bloomberg.com, Quotes for Energy Prices, Interest Rates, etc., Bloomberg L.P., New York, periodic checks from August 2007 through April 2008.
49 California Energy Commission. Comparative Costs of California Central Station Electricity Generation Technologies, Final Staff Report [describing ENERGY COMMISSION ’s Cost of Generation model], ENERGY COMMISSION ‐200‐2007‐011‐SF, December 2007.
50 Telephone and email communication: PERI and R. Welborn of Inland Empire Utilities Agency (IEUA, Chino CA), February – March 2008, re: updated operating hours per year and operating expenses.
51 CCX Agricultural Methane Gas Project Guidelines, Chicago Climate Exchange, Chicago IL, February 14, 2008, Table B.7 (B.7 is a CCX table with Baseline GHG emissions from anaerobic lagoon manure management, by animal type and by state. See http://www.chicagoclimatex.com/docs/offsets/Agriculture_Methane_Protocol.pdf )

55
52 Updated Macroeconomic Analysis of Climate Strategies Presented in the March 2006 Climate Action Team Report, prepared by Economics Subgroup, Climate Action Team, Oct 15, 2007. (For CO2 offset from renewable energy, see pages 10‐13 of http://www.climatechange.ca.gov/events/2007‐09‐14_workshop/final_report/2007‐10‐15_MACROECONOMIC_ANALYSIS.PDF )
53 “Analysis of Ag and Forestry Offset Market,” Climate Change Business Journal, San Diego CA; vol 1, no. 1/2; Jan‐Feb 2008, pp. 28‐31.
54 Internal Revenue Bulletin 2007‐21; May 21, 2007; Notice 2007‐40; “Credit for Renewable Electricity Production, Refined Coal Production, and Indian Coal Production, and Publication of Inflation Adjustment Factors and Reference Prices for Calendar Year 2007” [re: Section 45 Production Tax Credit]; Washington DC.
55 H.R.5140, Economic Stimulus Act of 2008 [which enacted 50% Bonus Depreciation, among other things]; Summary and Text for Section 103; Library of Congress web‐site (Thomas);
56 “New Federal Law Could Worsen State Budget Problems, States can Protect Revenues by Decoupling,” Nicholas Johnson, Center on Budget and Policy Priorities, Washington DC, revised February 28, 2008.
57 California Public Utilities Commission, “Energy Division Resolution E‐4137 (re: Feed‐In Tariffs),” dated February 14, 2008, San Francisco CA.
58 California Public Utilities Commission, “Summary of Feed‐In Tariffs,” 2‐page note, last modified February 27, 2008, San Francisco CA.
59 “CPUC Adopts Small Renewable Feed‐In Tariff,” California Energy Circuit, internet magazine, Berkeley CA, February 22, 2008.
60. Barker, T., et al., 2007: Technical Summary: In: Climate Change 2007: Mitigation. Contribution of Working Group III to the Fourth Assessment Report of the Intergovernmental Panel on Climate Change, Cambridge University Press, Cambridge, UK, and New York, NY, USA.
61. www.vattenfall.com/climatemap (Climate map prepared by Vattenfall, the Swedish power company, with roots in hydro, which now owns power plants across Europe and promotes renewable energy and carbon reduction.), Stockholm, Sweden).
62. San Joaquin Valley Dairy Manure Technology Feasibility Assessment Panel, An Assessment of Technologies for Management and Treatment of Dairy Manure in California’s San Joaquin Valley, December 2005.
63. Rob Williams, Biological and Agricultural Engineering, California Biomass Collaborative; University of California, Davis; “Biomass Systems for Heat and Power,” Smart Energy Management in Agriculture conference, through The Ecological Farming Association, Winters CA, November 13, 2007.

56
64. California Department of Food and Agriculture, California Dairy Statistics Annual 2007, Sacramento CA, 2008.
65. James A. Moore, Extension agricultural engineer, and Michael J. Gamroth, Extension dairy specialist, Oregon State University, revision prepared from a version written by Moore and the late Ted L. Willrich, professor emeritus of agricultural engineering, Oregon State University, ʺCalculating the fertilizer value of manure from livestock operations,ʺ Oregon State University Extension Service. EC 1094, Reprinted Number 1993; Corvallis, OR; available at http://extension.oregonstate.edu/catalog/html/ec/ec1094/ .

57
APPENDIX A – Assumptions, Inputs, and Results

58
Table A‐ 1 Financial and Economic Assumptions
Feature Actual Dairy Power No Subsidy Dairy Power
1 Lifetime 20 years Same
2 Inflation 2.50% Same
3 Start Year and year 1 fraction
Varies by Dairy, as first full year after startup. Year 1 fraction is 100%.
Same
4 Construction Period (years)
1 year, with capital costs expressed in “year before start-year” dollars.
Same
5 Basic Structure of Plant
All equity, on-balance sheet financing. There is no debt. Same
6 Basic Structure of Power Sales Options
NemBio, Net Energy Metering for BioGas Customer-Generators, available from California utilities.
100% sales to the utility, at one flat rate that does not escalate, which is similar to MPR.
7 Capitalization 0% Debt. Some fraction Grant (from DPPP, US EPA, or other). Remaining balance fraction Equity.
0% Debt to 0% Grant to 100% Equity. No incentive payments are assumed.
8 Debt Rate Moot here. Same
9 Debt Term Might be 10 to 15 years for a 20-year project. However, debt is moot here.
Same
10 Debt Rating n/a n/a
11 Project Development Load
For the actual cases, no costs, expenses, or reserves were reported, so zero.
Typical development expenses were assumed, as: Construction financing at 8.0% of plant cost by 1 year by 50% for level draw; Financing fees at 1.50% of debt (moot here with no debt) and 1.50% of equity (for tax advice, legal & accounting fees, misc.); and Working Capital reserve at 1.0% of plant cost. Assume construction financing is a loan, so capitalized interest is depreciable, and that financing fees are amortized.
12 Property Tax and Insurance
For the actual cases, property tax and insurance were not reported, so they are treated as zero. Probably, property tax and insurance for the dairy digester systems were included with property tax and insurance for the farm operation as a whole.
Assume property tax is 1.0% of depreciable base, with assessment escalating at 2.0% per year in California, and with wear-and-tear on equipment estimated as 4.0% per year till it hits a limit of 30% and falls no further. Assume insurance is 0.6% of depreciable base, escalating by 2.50% inflation, to obtain replacement value.

59
Feature Actual Dairy Power No Subsidy Dairy Power
13 After-tax Leveraged Equity Return
Varies by dairy power plant. Assumed 17% minimum taxable return was required by the farmer in order to undertake the project or 11% for tax-free entities. Since projects were financed 100% equity (see #7), this makes for a 17% or 11% return on capital.
14 Tax Rate 40.75% combined. Calculated as (0.35 + 0.0884 * 0.65 = 0.4075), assuming maximum California corporate rate. For tax-free entities like IEUA, the income tax rate is zero.
Same, as 40.75% taxable and 0.00% for tax-free IEUA.
15 Debt Coverage: operating income over debt payment (interest + principal)
Here, debt coverage is moot. Same
16 Revenues: Fraction from various products or class of purchaser
The nine dairy power plants took varying fractions of power to meet on-farm retail power loads, and sold the balance to the utility wholesale for net metering credits. Note that for this analysis, no net metering credits were assumed to be forfeited, but were all sold to the utility. (This is a more favorable assumption than really existed.) For actual cases, the fraction of energy employed for steam or heat savings was estimated. Any byproduct sales of carbon credits or other were estimated.
For “No subsidy” power cases, assume zero retail sales to the farm and 100% wholesale sales to the utility. In real life, the farmer probably would expand his plant to 500 kW, say, would keep 200 kW for his own use probably avoiding standby demand payments, and would sell 300 kW. However, for this analysis, since one does not know expansion capabilities, assume 100% sales to the utility.
17 Electricity Revenues and Revenue Escalation Rate.
Under NemBio, there are two rates, on-farm offset and utility net metering sales, where an energy price is paid. These rates vary by dairy. Regarding escalation, assume both on-farm offset and utility net metering energy prices escalate with 2.50% inflation. Assume demand prices escalate 1%, but since there are no demand payments reported for the actual cases, this is moot.
For “No Subsidy” power cases, assume one flat all-in rate that does not change. Therefore, assume one starting point and that escalation is 0%.
18 Section 45 Production Tax Credit
Not reported by any of the dairy power plants. Only power sold to the utility, from plants sized over 150 kW, is eligible. For PTC sensitivity cases, assume $0.01/kWh in 2007 (adjusted downward for proper starting year), escalating by inflation, for 10 years.
19 IOU Cost of Capital Discount Rate by which to calculate COE
Rate is 8.50% nominal, as an estimate of a taxable utility’s before-tax cost of capital. Assume 50% debt @ 6.50, 5% preferred stock @ 6.30, and 45% common stock at 11 = 8.52%. Rate is 5.854% constant (1.085 / 1.025 inflation -1).
Same
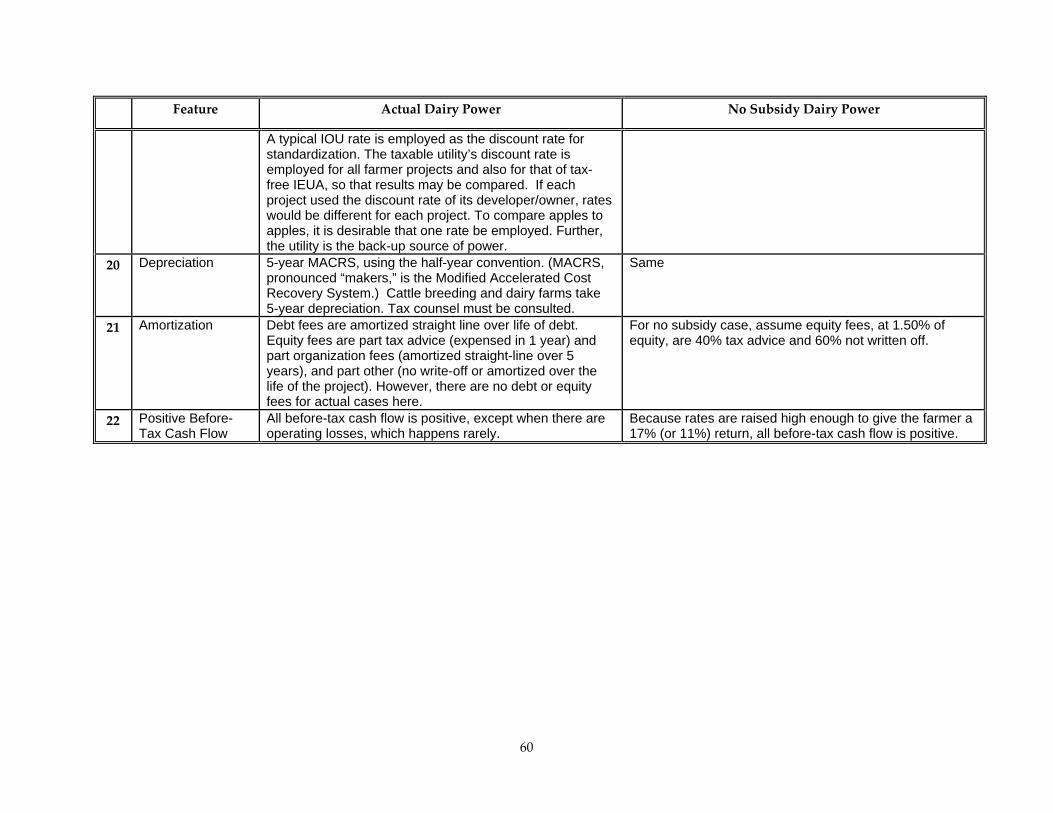
60
Feature Actual Dairy Power No Subsidy Dairy Power
A typical IOU rate is employed as the discount rate for standardization. The taxable utility’s discount rate is employed for all farmer projects and also for that of tax-free IEUA, so that results may be compared. If each project used the discount rate of its developer/owner, rates would be different for each project. To compare apples to apples, it is desirable that one rate be employed. Further, the utility is the back-up source of power.
20 Depreciation 5-year MACRS, using the half-year convention. (MACRS, pronounced “makers,” is the Modified Accelerated Cost Recovery System.) Cattle breeding and dairy farms take 5-year depreciation. Tax counsel must be consulted.
Same
21 Amortization Debt fees are amortized straight line over life of debt. Equity fees are part tax advice (expensed in 1 year) and part organization fees (amortized straight-line over 5 years), and part other (no write-off or amortized over the life of the project). However, there are no debt or equity fees for actual cases here.
For no subsidy case, assume equity fees, at 1.50% of equity, are 40% tax advice and 60% not written off.
22 Positive Before-Tax Cash Flow
All before-tax cash flow is positive, except when there are operating losses, which happens rarely.
Because rates are raised high enough to give the farmer a 17% (or 11%) return, all before-tax cash flow is positive.

61
Table A‐ 2 Detailed Data Inputs for Nine Dairy Farm Digester Systems
Blakes Landing Farms
Blakes Landing Farms Blakes Landing Farms Blakes Landing Farmsactual ($) no subsidy power ($) no subsidy pipeline-quality
gas ($)
Digester System Type Covered Lagoon Covered Lagoon Covered Lagoon
Generator Nameplate Capacity (kW) 75 kW 75 kW -- First Full Start Year 2005 2005 2005Total Lactating Cows 245 245 245Total Herd 447 447 447Farm Size (acres) 660 660 660Location Marshall, Marin County, CA Marshall, Marin County, CA Marshall, Marin County, CA
Utility PG&E PG&E PG&EDigester and Generator System Design Williams Engineering
AssociatesWilliams Engineering
AssociatesWilliams Engineering
Associates1
A Lagoon 0 0 0B Lagoon Liner 0 0 0C Manure Collection 0 0 0D Vacuum Trailer 0 0 0E Solids Separator/ Grit Removal 0 0 0F Collection Mix Tank 0 0 0
Subtotal 0 0 02
A Digester/Digester Tank 0 0 0B Lagoon Cover 0 0 0C Digester Heating System 7,605 7,605 7,605D Bacterial Treatment 0 0 0
Subtotal 7,605 7,605 7,6053
A Engine/generator (1 Waukesha 817G at 75 kW, that was used and refurbished, was purchased)
54,554 54,554 0
B Overhaul, repair, and additional components 4,109 4,109 0C Engine/generator room or building 1,496 1,496 0D Gas Transport 16,530 16,530 16,530E Flare (flare was constructed, not purchased) 1,240 1,240 1,240F Gas Treatment (scrubber, cleaning system) 0 0 0G Controls, panels, meters and instrumentation 17,222 17,222 0H Heat recovery (hot water or other) 18,589 18,589 18,589
Subtotal 113,740 113,740 36,3594
A Excavation, trenching, and grading 0 0 0B Concrete work and materials 0 0 0C Electrical work and materials 0 0 0D Other contractor/subcontractor 0 0 0E Dairy labor used for construction and installation 0 0 0F Transportation, Fuel and Heavy Equipment Rental 0 0 0G Other Equipment and Materials 0 0 0
Subtotal 0 0 05
A System Design/Engineering 23,000 23,000 23,000B Other
Subtotal 23,000 23,000 23,0006
A Permits – air 0 0 0B Permits – building 0 0 0C Permits – water 0 0 0D Other 0 0
Subtotal 0 0 07
A Interconnect Permit and Inspection 800 800 0B Interconnect Equipment req’d by utility 14,535 14,535 0
Subtotal 15,335 15,335 0
General Construction
System Design/Engineering
Permits
Utility Interconnect
Data Inputs for Blakes Landing Farms
Manure Collection and Pretreatment
Digester and Gas Production Enhancements
Energy Conversion and Gas Handling
Introduction and Capital Costs
IntroductionComponent

62
Blakes Landing Farms 8
A Initial Costs incurred prior to refurbishment - floating cover for lagoon in year 2000, to convert lagoon to an anaerobic digester
175,000 175,000 175,000
B Other Construction Costs after System Completion 3,100 3,100 3,100C Tap, Controls, Unique Faclities 156,098D Gas Clean-up and Processing 390,244E SCADA Monitoring 87,805F Pipeline from farm to gas pipeline - 12 miles for Blakes
Landing2,474,146
Subtotal 178,100 178,100 3,286,3939
A Construction Financing (e.g., 12 mos by total hard cost by 8% interest by 50% if level draw)
0 13,500 134,100
B Construction InsuranceC Other Overhead/Admin 0D Land 0
Subtotal 0 13,500 134,10010
A Debt Financing Fees – for lender’s legal and accounting costs; possibly loan commitment fee.
0 0 0
B Equity Financing Fees – e.g., 1.50% for organizational fees, tax advice, other legal and accounting for owner/equity investors.
0 5,400 53,600
Subtotal 0 5,400 53,60011
A Debt Service Reserve – assume 6 months for private power using project finance (where lenders are secured only by the one project). If Project owner uses balance sheet finance (so lenders are secured by other assets), probably no DSR.
0 0 0
B Working Capital Reserve (estimate) 0 3,400 33,500C Equipment Repair Reserve Initial Payment 0D Other
Subtotal 0 3,400 33,500
12 Total Loaded Cost 337,780 360,080 3,574,557
Component
Blake Landing Farms Actual Case
Blake Landing Farms power case with no subsidies
Blake Landing Farms pipeline-quality gas case
with no subsidies1 Senior Debt $0 $0 $02 Junior Debt 0 0 03 Grant 67,900 0 04 Second Grant 87,361 0 05 Equity 182,519 360,080 3,574,557
Total $337,780 $360,080 $3,574,557
Component
Blakes Landing Farms Actual Case
Blakes Landing Farms power case with no
subsidies
Blake Landing Farms pipeline-quality gas case
with no subsidies1 Contract Term (years) 20 20 202 Inflation Rate (%) 2.50% 2.50% 2.50%
Power or Gas Production: Gross Rated Capacity (kW for Power; 75 75 14.832 Mcf/day for Gas - inlet)
Gas Processing Losses (%) 0.00% 0.00% 15.00% In-Plant Use (%) 0.00% 0.00% 0.00% Net Rated Capacity (kW or Mcf/day) 75 75 12.607Capacity Wholesale to Utility (kW or Mcf/day) 0 75 12.607Capacity Retail to Steam Host (kW or Mcf/day) 75 0 0Actual Hours/Year 8,760.00 8,760.00 8,760.00Forced Outage Hours 973.00 973.00 276.00Planned Outage Hours 4,416.50 4,416.50 600.00Hours of Operation after Outages 3,370.50 3,370.50 7,884.00Capacity Factor (%) after Outages 38.48% 38.48% 90.00%
6 Any Curtailment by Power Purchaser on top of outages? (%) 0.00% 0.00% 0.00%
Sources of Funds
Permanent Take-out Financing
Reserves
Associated Construction Costs
Other Construction Costs after System Completion and Pipeline-Quality Gas Equipment. This plant starts up in 2005 so assume construction is 2004 . Deescalate by one year's inflation per year if startup is before 2006.
3
Performance and Annual Operating Expenses
4
5

63
Blakes Landing Farms
Net Power or Gas Produced for Sale 252.788 252.788 2,671.245(thou kWh/yr or mm Btu/yr)Percent Sold Retail 60.25% 0.00% 0.00%Percent Sold Wholesale to Utility 39.75% 100.00% 100.00%Steam Produced for Sale: Unfired capacity rate (mlb/hr) 0.059 0.000 0.000Full load operating hours/yr 3,370.5 3,370.5 7,884.0Unfired Capacity (mlb/yr) 197.216 0.000 0.000
10 Auxiliary Firing: - Auxfired Capacity (mlb/yr) 0 0 011 Boiler Steam: - Boiler Capacity (mlb/yr) 0 0 0
Retail Electricity Prices:Energy (cents/kWh) 12.00 n/a n/a escalating by (%/year) 2.50% 2.50% 2.50%Demand ($/kW-capacity/month) $0.00 n/a n/a escalating by (%/year) 1.50% 1.50% 1.50%Utility Electricity or Gas Prices:Energy (cents/kWh or $/mm Btu) 10.00 35.40 321.00 escalating by (%/year) 2.50% 0.00% 0.00%Demand ($/kW-capacity/month) $0.00 n/a n/a escalating by (%/year) 1.50% 0.00% 0.00%
Retail Steam Prices #1:Variable ($/mlb) $18.25 $0.00 $0.00 escalating by (%/year) 2.50% 2.50% 2.50%Fixed ($mlb or other) $0.00 $0.00 $0.00 escalating by (%/year) 1.50% 1.50% 1.50%Retail Steam Prices #2:Variable ($/mlb) escalating by (%/year) 2.50% 2.50% 2.50%Fixed ($mlb or other) escalating by (%/year) 1.50% 1.50% 1.50%
16 Byproduct Sales – Other 0 0 0 escalating by (%/year) 2.50% 2.50% 2.50%Fuel Consumed:Plant Heat Rate (Btu/net kWh sold, power; 13,813 13,813 1.30719 Btu in/Btu sold, gas)Fuel Needed (mm Btu/yr) 3,491.75 3,491.75 3,491.82Adjustments and Conversion Factors:Fuel #1 Dairy Manure Dairy Manure Dairy ManureMM Btu/Mcf 0.645 0.645 0.645Fuel #2 Natural Gas Natural Gas Natural GasMM Btu/Mcf 1.020 1.020 1.020(Fuel #2 is not used, so moot.)
19 Annual Heat Rate IncreaseFuel #1 0.00% 0.10% 0.00%Fuel #2 0.00% 0.10% 0.00%Fuel #1 Percentage 100.00% 100.00% 100.00%Fuel #1 Consumption (mm Btu/hr) 1.0360 1.0360 0.4429Fuel #2 Consumption (mm Btu/hr) 0.0000 0.0000 0.0000Hours/year 3,370.50 3,370.50 7,884.00Total Consumption (mm Btu/yr) 3,491.75 3,491.75 3,491.82Auxiliary Fired Fuel: from Fuel #1, #2 0 0 0Total Consumption (mm Btu/yr)Boiler Fuel 0 0 0
22 Fuel Limit based upon Total HerdBiogas Potential at 90 cf per animal in total herd/dy (cf/day) 40,230 40,230 40,230
Biogas Potential (mm Btu/yr) 9,471.15 9,471.15 9,471.15 -- -- --
8
9
12
20
14
15
7
13
17
18
21

64
Blakes Landing Farms 23 Fuel #1 Unit Price ($/mm Btu) $0.00 $0.00 $0.0024 Fuel #2 Unit Price ($/mm Btu) $0.00 $0.00 $0.0025 Host Standby Demand Payment to Utility: 0
Annual Expenses, that escalate with inflation unless otherwise indicated
26 Service27 Operations and Maintenance ($/year) $3,948.00 $3,948.00 $3,948.0028 Consumables29 Operator30 Admin/Compliance31 Royalty (% of revenues)
Property Tax (% of depreciable base). 0.00% 1.00% 1.00% escalating by (%/year), Proposition 13 2.00% 2.00% 2.00% where base declines by (%/year) 4.00% 4.00% till hits a remainder of (%). 30.00% 30.00%Insurance (% of depreciable base, escalating with inflation to achieve replacement value)
0.00% 0.60% 0.60%
escalating by (%/year) 2.50% 2.50% 2.50%34 Major Maintenance Repair and Overhaul Fund. Assume
some percentage of depreciable base as overhaul every 5, 7, or 10 years. The overhaul amount is escalated by inflation to find the sum needed by the end of year 5, 7, or 10. If 7, one seventh of that amount is saved each year and deposited to a reserve fund and, after performing the overhaul, repair depreciation is taken, straight-line, over the next seven years.
0 0 0
35 Other36 Other 0 0 037 Gas Monitoring ($/year) 0 0 9,75638 Final Note: Important Facts that may help to optimize
project.
33
For Blakes Landing, no gas is flared. Added about 20 cows. Looking to upgrade with quieter, more efficient engine or with turbine. Plans to connect more dairy load to main meter. Will repair cover leaks that allow extra air into digester and reduce power output. Wants to recover more heat. Manure solids are run through two mechanical separators and creamery wastewater is also fed to digester. This system has lowest hydrogen sulfide production, which is good.
32

65
Castelanelli Bros. Dairy
Castelanelli Bros. Dairy Castelanelli Bros. Dairy Castelanelli Bros. Dairyactual ($) no subsidy power ($) no subsidy pipeline-quality
gas ($)
Digester System Type Covered Lagoon Covered Lagoon Covered Lagoon
Generator Nameplate Capacity (kW) 160 kW 160 kW -- First Full Start Year 2005 2005 2005Total Lactating Cows 1,601 1,601 1,601Total Herd 3,601 3,601 3,601Farm Size (acres) n/a n/a n/aLocation Lodi, San Joaquin County, CA Lodi, San Joaquin County, CA Lodi, San Joaquin County, CA
Utility PG&E PG&E PG&EDigester and Generator System Design RCM Digesters RCM Digesters RCM Digesters
1A Lagoon 55,734 0 0B Lagoon LinerC Manure Collection 41,024 41,024 41,024D Vacuum TrailerE Solids Separator/ Grit Removal 63,518 63,518 63,518F Collection Mix Tank 0 0 0
Subtotal 160,276 104,542 104,5422
A Digester/Digester Tank 0 0 0B Lagoon Cover 204,768 204,768 204,768C Digester Heating System 0 0 0D Bacterial Treatment 0 0 0
Subtotal 204,768 204,768 204,7683
A Engine/generator (1 CAT G3406T engine-generator at 160 kW was purchased new)
124,460 124,460 0
B Overhaul, repair, and additional components 9,274 9,274 0C Engine/generator room or building 23,668 23,668 0D Gas Transport 37,524 37,524 37,524E Flare (flare was constructed, not purchased) 1,799 1,799 1,799F Gas Treatment (scrubber, cleaning system) 0 0 0G Controls, panels, meters and instrumentation 8,415 8,415 0H Heat recovery (hot water or other) 0 0 0
Subtotal 205,140 205,140 39,3234
A Excavation, trenching, and grading 0 0 0B Concrete work and materials 0 0 0C Electrical work and materials 23,210 23,210 0D Other contractor/subcontractor 0 0 0E Dairy labor used for construction and installation 156,568 156,568 156,568F Transportation, Fuel and Heavy Equipment Rental 0 0 0G Other Equipment and Materials 14,417 14,417 14,417
Subtotal 194,195 194,195 170,9855
A System Design/Engineering 61,595 61,595 61,595B Other
Subtotal 61,595 61,595 61,5956
A Permits – air 0 0 0B Permits – building 200 200 200C Permits – water 0 0 0D Other
Subtotal 200 200 2007
A Interconnect Permit and Inspection 46,524 46,524 0B Interconnect Equipment req’d by utility 7,867 7,867 0
Subtotal 54,391 54,391 0
System Design/Engineering
Permits
Utility Interconnect
Manure Collection and Pretreatment
Digester and Gas Production Enhancements
Energy Conversion and Gas Handling
General Construction
Introduction
Data Inputs for Castelanelli Bros. Dairy
Component
Introduction and Capital Costs

66
Castelanelli Bros. Dairy 8
A Other Construction Costs after System Completion - 2006 cost to rewire and add milk barn, 3 lagoon pumps, well & separator to engine-generator to use on-site power
84,727 84,727 0
B Other - RCM Digesters' tax/freight 1,570 1,570 0C Tap, Controls, Unique Faclities 156,098D Gas Clean-up and Processing 468,293E SCADA Monitoring 87,805F Pipeline from farm to gas pipeline - about 5 miles for
Castelanelli Bros.1,053,659
Subtotal 86,297 86,297 1,765,8559
A Construction Financing (e.g., 12 mos by total hard cost by 8% interest by 50% if level draw)
0 36,400 93,900
B Construction InsuranceC Other Overhead/Admin 0D Land 0
Subtotal 0 36,400 93,90010
A Debt Financing Fees – for lender’s legal and accounting costs; possibly loan commitment fee.
0 0 0
B Equity Financing Fees – for organizational fees, tax advice, other legal and accounting for owner/equity investors.
0 14,600 37,500
Subtotal 0 14,600 37,50011
A Debt Service Reserve – assume 6 months for private power using project finance (where lenders are secured only by the one project). If Project owner uses balance sheet finance (so lenders are secured by other assets), probably no DSR.
0 0 0
B Working Capital Reserve (estimate) 0 9,100 23,500C Equipment Repair Reserve Initial Payment 0D Other
Subtotal 0 9,100 23,500
12 Total Loaded Cost $966,862 971,228 2,502,168
Component
Castelanelli Bros. Dairy Actual Case
Castelanelli Bros. Dairy power case with no
subsidies
Castelanelli Bros. Dairy pipeline-quality gas case
with no subsidies1 Senior Debt $0 $0 $02 Junior Debt 0 0 03 Grant 320,000 0 04 Second Grant 227,396 0 05 Equity 419,466 971,228 2,502,168
Total $966,862 $971,228 $2,502,168
Component
Castelanelli Bros. Dairy Actual Case
Castelanelli Bros. Dairy power case with no
subsidies
Castelanelli Bros. Dairy pipeline-quality gas case
with no subsidies1 Contract Term (years) 20 20 202 Inflation Rate (%) 2.50% 2.50% 2.50%
Power Production: Gross Rated Capacity (kW for Power; 160 160 89.147 Mcf/day for Gas - inlet)
Gas Processing Losses (%) 0.00% 0.00% 15.00% In-Plant Use (%) 0.00% 0.00% 0.00% Net Rated Capacity (kW or Mcf/day) 160 160 75.775Capacity Wholesale to Utility (kW or Mcf/day) 85 160 75.775Capacity Retail to Steam Host (kW or Mcf/day) 75 0 (0.000)
Associated Construction Costs
Permanent Take-out Financing
Reserves
3
Performance and Annual Operating Expenses
4
Other Construction Costs after System Completion and Pipeline-Quality Gas Equipment. This plant starts up in 2005 so assume construction is 2004 . Deescalate by one year's inflation per year if startup is before 2006.
Sources of Funds

67
Castelanelli Bros. Dairy
Actual Hours/Year 8,760.00 8,760.00 8,760.00Forced Outage Hours 204.00 204.00 276.00Planned Outage Hours 1,460.00 1,460.00 600.00Hours of Operation after Outages 7,096.00 7,096.00 7,884.00Capacity Factor (%) after Outages 81.00% 81.00% 90.00%
6 Any Curtailment by Power Purchaser on top of outages? (%)
0 0
Net Power or Gas Produced for Sale 1,135.360 1,135.360 15,557.544(thou kWh/yr or mm Btu/yr)Percent Sold Retail 49.96% 0.00% 0.00%Percent Sold Wholesale to Utility 50.04% 100.00% 100.00%Steam Produced for Sale: Unfired capacity rate (mlb/hr) 0.000 0.000 0.000Full load operating hours 7,096.0 7,096.0 7,884.0Unfired Capacity (mlb/yr) 0.000 0.000 0.000
10 Auxiliary Firing: - Auxfired Capacity (mlb/yr) 0 0 011 Boiler Steam: - Boiler Capacity (mlb/yr) 0 0 0
Retail Electricity Prices:Energy (cents/kWh) 7.240 n/a n/a escalating by (%/year) 2.50% 2.50% 2.50%Demand ($/kW-capacity/month) $0.00 n/a n/a escalating by (%/year) 1.50% 1.50% 1.50%Utility Electricity or Gas Prices:Energy (cents/kWh or $/mm Btu) 5.76 21.60 39.50 escalating by (%/year) 2.50% 0.00% 0.00%Demand ($/kW-capacity/month) $0.00 n/a n/a escalating by (%/year) 1.50% 0.00% 0.00%Retail Steam Prices #1:Variable ($/mlb) escalating by (%/year) 2.50% 2.50% 2.50%Fixed ($mlb or other) escalating by (%/year) 1.50% 1.50% 1.50%Retail Steam Prices #2:Variable ($/mlb) escalating by (%/year) 2.50% 2.50% 2.50%Fixed ($mlb or other) escalating by (%/year) 1.50% 1.50% 1.50%
16 Byproduct Sales – Other 0 0 0 escalating by (%/year) 2.50% 2.50% 2.50%Fuel Consumed:Plant Heat Rate (Btu/net kWh sold, power; 17,912 17,912 1.30719 Btu in/Btu sold, gas)Fuel Needed (mm Btu/yr) 20,336.57 20,336.57 20,336.67 Adjustments and Conversion Factors:Fuel #1 Dairy Manure Dairy Manure Dairy ManureMM Btu/Mcf 0.625 0.625 0.625Fuel #2 Natural Gas Natural Gas Natural GasMM Btu/Mcf 1.020 1.020 1.020(Fuel #2 is not used, so moot.)
19 Annual Heat Rate IncreaseFuel #1 0.00% 0.10% 0.00%Fuel #2 0.00% 0.10% 0.00%Fuel #1 Percentage 100.00% 100.00% 100.00%Fuel #1 Consumption (mm Btu/hr) 2.866 2.866 2.579 Fuel #2 Consumption (mm Btu/hr) 0.000 0.000 0.000 Hours/year 7,096.00 7,096.00 7,884.00 Total Consumption (mm Btu/yr) 20,336.57 20,336.57 20,336.67Auxiliary Fired Fuel: from Fuel #1, #2 0 0 0Total Consumption (mm Btu/yr)Boiler Fuel 0 0 0
22 Fuel Limit based upon Total HerdBiogas Potential at 90 cf per animal in total herd/dy (cf/day)
324,090 324,090 324,090
Biogas Potential (mm Btu/yr) 73,933.03 73,933.03 73,933.03 -- -- --
20
8
21
13
14
15
17
18
9
12
5
7

68
Castelanelli Bros. Dairy
23 Fuel #1 Unit Price ($/mm Btu) $0.00 $0.00 $0.0024 Fuel #2 Unit Price ($/mm Btu) $0.00 $0.00 $0.0025 Host Standby Demand Payment to Utility: 0 0 0
Annual Expenses, that escalate with inflation unless otherwise indicated
26 Service27 Operations and Maintenance $11,400.00 $11,400.00 $11,400.0028 Consumables29 Operator30 Admin/Compliance31 Royalty (% of revenues)
Property Tax (% of depreciable base). 0.00% 1.00% 1.00% escalating by (%/year), Proposition 13 2.00% 2.00% 2.00% where base declines by (%/year) 4.00% 4.00% till hits a remainder of (%). 30.00% 30.00%Insurance (% of depreciable base, escalating with inflation to achieve replacement value)
0.00% 0.60% 0.60%
escalating by (%/year) 2.50% 2.50% 2.50%34 Major Maintenance Repair and Overhaul Fund. Assume
some percentage of depreciable base as overhaul every 5, 7, or 10 years. The overhaul amount is escalated by inflation to find the sum needed by the end of year 5, 7, or 10. If 7, one seventh of that amount is saved each year and deposited to a reserve fund and, after performing the overhaul, repair depreciation is taken, straight-line, over the next seven years.
0
35 Other36 Other Costs - Engine Rebuild at 6,500 hrs. Assume this
is annual expense, that escalates with inflation.$3,000 $3,000 $0
37 Gas Monitoring ($/year) 0 0 9,75638 Final Note: Important Facts that may help to optimize
project. Castelanelli Bros. Dairy flares about 40% to 50% of gas. Plant was not run at capacity because no place to sell power. In 2006 (after 12-mo study period of Oct 2004-Sept 2005), the farmer rewired more dairy load to utilize more of the engine-generator's power. Added milk barn, 3 lagoon pumps, well and separator at cost of $84,727, as cited above. Data on savings? It was assumed this reduced generation credits that were forfeited and that rates increased to 7.242 and 5.76 cents/kWh, for on-farm off-set and net generation respectively. Will plant run more? Will this dairy expand further? Experimental biological scrubber seemed to test well here (to remove hydrogen sulfide).
32
33

69
Cottonwood Dairy
Cottonwood Dairy Cottonwood Dairy Cottonwood Dairyactual ($) no subsidy power ($) no subsidy pipeline-quality
gas ($)
Digester System Type Covered Lagoon Covered Lagoon Covered Lagoon
Generator Nameplate Capacity (kW) 300 kW 300 kW -- First Full Start Year 2005 2005 2005Total Lactating Cows 4,971 4,971 4,971Total Herd 5,616 5,616 5,616Farm Size (acres) n/a n/a n/aLocation Atwater, Merced County, CA Atwater, Merced County, CA Atwater, Merced County, CA
Utility PG&E PG&E PG&EDigester and Generator System Design Williams Engineering Assoc. Williams Engineering Assoc. Williams Engineering Assoc.
1A Lagoon 349,659 0 0B Lagoon LinerC Manure Collection 19,227 19,227 19,227D Vacuum TrailerE Solids Separator/ Grit Removal 177,445 177,445 177,445F Collection Mix Tank 0 0 0
Subtotal 546,331 196,672 196,6722
A Digester/Digester Tank 0 0 0B Lagoon Cover 341,250 341,250 341,250C Digester Heating System 0 0 0D Bacterial Treatment 0 0 0
Subtotal 341,250 341,250 341,2503
A Engine/generator (1 CAT G3412 TS engine-generator at 300 KW was purchased new)
90,115 90,115 0
B Overhaul, repair, and additional components 3,535 3,535 0C Engine/generator room or building 0 0 0D Gas Transport 211,540 211,540 211,540E Flare (flare was constructed, not purchased) 0 0 0F Gas Treatment (scrubber, cleaning system) 0 0 0G Controls, panels, meters and instrumentation 0 0 0H Heat recovery (hot water or other) 0 0 0
Subtotal 305,190 305,190 211,5404
A Excavation, trenching, and grading 0 0 0B Concrete work and materials 91,730 91,730 91,730C Electrical work and materials 33,978 33,978 0D Other contractor/subcontractor 316,674 316,674 316,674E Dairy labor used for construction and installation 180,237 180,237 180,237F Transportation, Fuel and Heavy Equipment Rental 176,167 176,167 176,167G Other Equipment and Materials 240,447 240,447 240,447
Subtotal 1,039,233 1,039,233 1,005,2555
A System Design/Engineering 147,252 147,252 147,252B Other
Subtotal 147,252 147,252 147,2526
A Permits – air 1,080 1,080 1,080B Permits – building 0 0 0C Permits – water 0 0 0D Other 0 0 0
Subtotal 1,080 1,080 1,0807
A Interconnect Permit and Inspection 10,735 10,735 0B Interconnect Equipment req’d by utility 60,701 60,701 0
Subtotal 71,436 71,436 0
Introduction
General Construction
System Design/Engineering
Permits
Utility Interconnect
Data Inputs for Cottonwood Dairy
Component
Introduction and Capital Costs
Manure Collection and Pretreatment
Digester and Gas Production Enhancements
Energy Conversion and Gas Handling

70
Cottonwood Dairy
8
A Other Construction Costs after System Completion - replaced H2S Scrubber (~$10,000), gas supply improvements, and electrical work
200,000 200,000 200,000
B OtherC Tap, Controls, Unique Faclities 156,098D Gas Clean-up and Processing 556,098E SCADA Monitoring 87,805F Pipeline from farm to gas pipeline - 1,000 feet 48,780
Subtotal 200,000 200,000 1,048,781 9
A Construction Financing: For Cottonwood, actual was given; for "no subsidy," calculate a value (e.g., 12 mos by total hard cost by 8% interest by 50% for level draw)
46,266 92,100 118,100
B Construction Insurance 0 0 0C Other Overhead/Admin 0 0 0D Land 0 0 0
Subtotal 46,266 92,100 118,100 10
A Debt Financing Fees – for lender’s legal and accounting costs; possibly loan commitment fee.
0 0 0
B Equity Financing Fees – for organizational fees, tax advice, other legal and accounting for owner/equity investors.
0 36,800 47,200
Subtotal 0 36,800 47,200 11
A Debt Service Reserve – assume 6 months for private power using project finance (where lenders are secured only by the one project). If Project owner uses balance sheet finance (so lenders are secured by other assets), probably no DSR.
0 0 0
B Working Capital Reserve (estimate) 0 23,000 29,500C Equipment Repair Reserve Initial Payment 0 D Other
Subtotal 0 23,000 29,500
12 Total Loaded Cost $2,698,038 $2,454,013 $3,146,630
Component
Cottonwood Dairy Actual Case
Cottonwood Dairy power case with no subsidies
Cottonwood Dairy pipeline-quality gas case with no
subsidies1 Senior Debt $0 $0 $02 Junior Debt 0 0 03 Grant 600,000 0 04 Second Grant 240,000 0 05 Equity 1,858,038 2,454,013 3,146,630
Total $2,698,038 $2,454,013 $3,146,630
Component
Cottonwood Dairy Actual Case
Cottonwood Dairy power case with no subsidies
Cottonwood Dairy pipeline-quality gas case with no
subsidies1 Contract Term (years) 20 20 202 Inflation Rate (%) 2.50% 2.50% 2.50%
Power Production: Gross Rated Capacity (kW for Power; 300 300 112.958 Mcf/day for Gas - inlet)
Gas Processing Losses (%) 0.00% 0.00% 15.00% In-Plant Use (%) 0.00% 0.00% 0.00% Net Rated Capacity (kW or Mcf/day) 300 300 96.014Capacity Wholesale to Utility (kW or Mcf/day) 0 300 96.014Capacity Retail to Steam Host (kW or Mcf/day) 300 0 0
4
Associated Construction Costs
Permanent Take-out Financing
Other Construction Costs after System Completion and Pipeline-Quality Gas Equipment. This plant starts up in 2005 so assume construction is 2004 . Deescalate by one year's inflation per year if startup is before 2006.
Reserves
3
Performance and Annual Operating Expenses
Sources of Funds

71
Cottonwood Dairy
Actual Hours/Year 8,760.0 8,760.0 8,760.0Forced Outage Hours 189.7 189.7 276.0Planned Outage Hours 1,460.0 1,460.0 600.0Hours of Operation after Outages 7,110.3 7,110.3 7,884.0Capacity Factor (%) after Outages 81.17% 81.17% 90.00%
6 Any Curtailment by Power Purchaser on top of outages? (%)
0.00% 0.00% 0.00%
Net Power or Gas Produced for Sale 2,133.09 2,133.09 19,965.26(thou kWh/yr or mm Btu/yr)Percent Sold Retail; 100.00% 0.00% 0.00%Percent Sold Wholesale to Utility 0.00% 100.00% 100.00%Steam Produced for Sale: Unfired capacity rate (mlb/hr) 0.896 0.000 0.000Full load operating hours 7,110.3 7,110.3 7,884.0Unfired Capacity (mlb/yr) 6,370.8 0.0 0.0
10 Auxiliary Firing: - Auxfired Capacity (mlb/yr) 0 0 011 Boiler Steam: - Boiler Capacity (mlb/yr) 0 0 0
Retail Electricity Prices:Energy (cents/kWh) 7.480 n/a n/a escalating by (%/year) 2.50% 2.50% 2.50%Demand ($/kW-capacity/month) $0.00 n/a n/a escalating by (%/year) 1.50% 1.50% 1.50%Utility Electricity or Gas Prices:Energy (cents/kWh or $/mm Btu) 4.000 33.75 44.80 escalating by (%/year) 2.50% 0.00% 0.00%Demand ($/kW-capacity/month) $0.00 n/a n/a
escalating by (%/year) 1.50% 0.00% 0.00%
Retail Steam Prices #1:Variable ($/mlb) $13.12 n/a n/a escalating by (%/year) 2.50% 2.50% 2.50%Fixed ($mlb or other) 0 0 0 escalating by (%/year) 1.50% 1.50% 1.50%Retail Steam Prices #2:Variable ($/mlb) escalating by (%/year) 2.50% 2.50% 2.50%Fixed ($mlb or other) escalating by (%/year) 1.50% 1.50% 1.50%
16 Byproduct Sales – Carbon Credits ($/yr) $30,000 $0 $0 escalating by (%/year) 2.00% 2.00% 2.00%Fuel Consumed:Plant Heat Rate (Btu/net kWh sold, power; 12,235 12,235 1.30719 Btu in/Btu sold, gas)Fuel Needed (mm Btu/yr) 26,098.36 26,098.36 26,098.39Adjustments and Conversion Factors:Fuel #1 Dairy manure Dairy manure Dairy manureMM Btu/Mcf 0.633 0.633 0.633Fuel #2 Natural Gas Natural Gas Natural GasMM Btu/Mcf 1.020 1.020 1.020(Fuel #2 is not used, so moot.)
19 Annual Heat Rate IncreaseFuel #1 0.00% 0.10% 0.00%Fuel #2 0.00% 0.10% 0.00%Fuel #1 Percentage 100.00% 100.00% 100.00%Fuel #1 Consumption (mm Btu/hr) 3.6705 3.6705 3.3103
Fuel #2 Consumption (mm Btu/hr) 0.0000 0.0000 0.0000
Hours/year 7,110.3 7,110.3 7,884.0Total Consumption (mm Btu/yr) 26,098.36 26,098.36 26,098.39Auxiliary Fired Fuel: from Fuel #1, #2 0 0 0Total Consumption (mm Btu/yr)Boiler Fuel 0 0 0
22 Fuel Limit based upon Total HerdBiogas Potential at 90 cf per animal in total herd/dy (cf/day)
505,440 505,440 505,440
Biogas Potential (mm Btu/yr) 116,779.38 116,779.38 116,779.38 -- -- --
5
7
14
15
8
9
12
13
17
18
20
21

72
Cottonwood Dairy
23 Fuel #1 Unit Price ($/mm Btu) $0.00 $0.00 $0.0024 Fuel #2 Unit Price ($/mm Btu) $0.00 $0.00 $0.0025 Host Standby Demand Payment to Utility: 0 0 0
Annual Expenses, that escalate with inflation unless otherwise indicated
26 Service 0 0 027 Operations and Maintenance ($/year) $74,400 $74,400 $74,40028 Consumables 0 0 029 Operator 0 0 030 Admin/Compliance 0 0 031 Royalty (% of revenues) 0 0 0
Property Tax (% of depreciable base). 0.00% 1.00% 1.00% escalating by (%/year), Proposition 13 2.00% 2.00% 2.00% where base declines by (%/year) 4.00% 4.00% till hits a remainder of (%). 30.00% 30.00%Insurance (% of depreciable base, escalating with inflation to achieve replacement value)
0.00% 0.60% 0.60%
escalating by (%/year) 2.50% 2.50% 2.50%34 Major Maintenance Repair and Overhaul Fund. Assume
some percentage of depreciable base as overhaul every 5, 7, or 10 years. The overhaul amount is escalated by inflation to find the sum needed by the end of year 5, 7, or 10. If 7, one seventh of that amount is saved each year and deposited to a reserve fund and, after performing the overhaul, repair depreciation is taken, straight-line, over the next seven years.
0 0 0
35 Other36 Iron Sponge Media for H2S Scrubber changed every 6-8
wk, at $5,000 – 8,000 each. Assume $7,000 at 7 times/yr. DO INCLUDE THIS, as it is an air pollution control cost, per Jan. 24 2008 communication with the farm. Scrubber with different technology will be installed at Columbard Dairy nearby.
50,000 50,000 50,000
37 Gas Monitoring ($/year) 0 0 9,75638 Final Note: Important Facts that may help to optimize
project.
32
33
For Cottonwood, about 50% of gas is flared. Power is used only at the cheese plant so far, but might be expanded to reach more of the farm. Second generator purchased at $500K, but not running well. What are its op exp, fuel consumption, and output? When digester is added at nearby Columbard Dairy, this will alter costs and performance - any estimates of addl cows, costs, and output? This farm has lowest NOx emissions.

73
Hilarides Dairy
Hilarides Dairy Hilarides Dairy Hilarides Dairyactual ($) no subsidy power ($) no subsidy pipeline-quality
gas ($)
Digester System Type Covered Lagoon Covered Lagoon Covered Lagoon
Generator Nameplate Capacity (kW) 500 kW 500 kW -- First Full Start Year 2006 2006 2006Total Lactating Cows - For Hilarides 6,000 Heifers provide Biogas; 9,900 more cows, calves, bulls are not used
6,000 6,000 6,000
Total Herd 6,000 6,000 6,000Farm Size (acres) 2,400 2,400 2,400Location Lindsay, Tulare County, CA Lindsay, Tulare County, CA Lindsay, Tulare County, CA
Utility SCE SCE SCEDigester and Generator System Design Sharp Energy (Roy Sharp) Sharp Energy (Roy Sharp) Sharp Energy (Roy Sharp)
1A Lagoon 0 0 0B Lagoon Liner 0 0 0C Manure Collection 0 0 0D Vacuum Trailer 0 0 0E Solids Separator/ Grit Removal 0 0 0F Collection Mix Tank 0 0 0
Subtotal 0 0 02
A Digester/Digester Tank 0 0 0B Lagoon Cover 366,286 366,286 366,286C Digester Heating System 0 0 0D Bacterial Treatment 0 0 0
Subtotal 366,286 366,286 366,2863
A Engine/generator (500 kW, as 4 Caterpillar G342 engine-generator sets at 125 kW each, purchased used and then refurbished)
20,000 20,000 0
B Overhaul, repair, and additional components 158,613 158,613 0C Engine/generator room or building 9,047 9,047 0D Gas Transport 66,659 66,659 66,659E Flare (flare was constructed, not purchased) 0 0 0F Gas Treatment (scrubber, cleaning system) 0 0 0G Controls, panels, meters and instrumentation 346,207 346,207 0H Heat recovery (hot water or other) 0 0 0
Subtotal 600,526 600,526 66,6594
A Excavation, trenching, and grading 0 0 0B Concrete work and materials 0 0 0C Electrical work and materials 233,226 233,226 0D Other contractor/subcontractor 0 0 0E Dairy labor used for construction and installation 0 0 0F Transportation, Fuel and Heavy Equipment Rental 0 0 0G Other Equipment and Materials 0 0 0
Subtotal 233,226 233,226 05
A System Design/Engineering 18,304 18,304 18,304B Other
Subtotal 18,304 18,304 18,3046
A Permits – air 240 240 240B Permits – building 0 0 0C Permits – water 0 0 0D Other 0 0 0
Subtotal 240 240 2407
A Interconnect Permit and Inspection 1,319 1,319 0B Interconnect Equipment req’d by utility 20,022 20,022 0
Subtotal 21,341 21,341 0
Introduction
System Design/Engineering
Permits
Utility Interconnect
Manure Collection and Pretreatment
Digester and Gas Production Enhancements
Energy Conversion and Gas Handling
General Construction
Data Inputs for Hilarides Dairy
Component
Introduction and Capital Costs

74
Hilarides Dairy
8
A Other Construction Costs after System Completion 0 0 0B OtherC Tap, Controls, Unique Faclities 160,000D Gas Clean-up and Processing 720,000E SCADA Monitoring 90,000F Pipeline from farm to gas pipeline - 1,000 feet 50,000
Subtotal 0 0 1,020,0009
A Construction Financing (e.g., 12 mos by total hard cost by 8% interest by 50% if level draw)
0 49,600 58,900
B Construction Insurance 0 0 0C Other Overhead/Admin 0 0 0D Land 0 0 0
Subtotal 0 49,600 58,90010
A Debt Financing Fees – for lender’s legal and accounting costs; possibly loan commitment fee.
0 0 0
B Equity Financing Fees – for organizational fees, tax advice, other legal and accounting for owner/equity investors.
0 19,800 23,500
Subtotal 0 19,800 23,50011
A Debt Service Reserve – assume 6 months for private power using project finance (where lenders are secured only by the one project). If Project owner uses balance sheet finance (so lenders are secured by other assets), probably no DSR.
0 0 0
B Working Capital Reserve (estimate) 0 12,400 14,700C Equipment Repair Reserve Initial Payment 0D Other
Subtotal 0 12,400 14,700
12 Total Loaded Cost $1,239,923 $1,321,723 $1,568,589
Component
Hilarides Dairy Actual Case Hilarides Dairy power case with no subsidies
Hilarides Dairy pipeline-quality gas case with no
subsidies1 Senior Debt $0 $0 $02 Junior Debt 0 0 03 Grant 500,000 0 04 Second Grant 0 0 05 Equity 739,923 1,321,723 1,568,589
Total $1,239,923 $1,321,723 $1,568,589
Component
Hilarides Dairy Actual Case Hilarides Dairy power case with no subsidies
Hilarides Dairy pipeline-quality gas case with no
subsidies1 Contract Term (years) 20 20 202 Inflation Rate (%) 2.50% 2.50% 2.50%
Power Production: Gross Rated Capacity (kW for Power; 500 500 232.681 Mcf/day for Gas - inlet)
Gas Processing Losses (%) 0.00% 0.00% 15.00% In-Plant Use (%) 0.00% 0.00% 0.00% Net Rated Capacity (kW or Mcf/day) 500 500 197.779Capacity Wholesale to Utility (kW or Mcf/day) 125 500 197.779Capacity Retail to Steam Host (kW or Mcf/day) 375 0 (0)
4
Associated Construction Costs
Permanent Take-out Financing
Reserves
3
Performance and Annual Operating Expenses
Sources of Funds
Other Construction Costs after System Completion and Pipeline-Quality Gas Equipment. This plant starts up in 2006 so assume construction is 2005 . Deescalate by one year's inflation per year if startup is before 2006.

75
Hilarides Dairy
Actual Hours/Year 8,760.0 8,760.0 8,760.0Forced Outage Hours 168.0 168.0 276.0Planned Outage Hours 1,827.0 1,827.0 600.0Hours of Operation after Outages 6,765.0 6,765.0 7,884.0Capacity Factor (%) after Outages 77.23% 77.23% 90.00%
6 Any Curtailment by Power Purchaser on top of outages? (%)
0.00% 0.00% 0.00%
Net Power or Gas Produced for Sale 3,382.50 3,382.50 33,979.49(thou kWh/yr or mm Btu/yr)Percent Sold Retail; 61.95% 0.00% 0.00%Percent Sold Wholesale to Utility 38.05% 100.00% 100.00%Steam Produced for Sale: Unfired capacity rate (mlb/hr) 0 0 0Full load operating hours 6,765 6,765 7,884Unfired Capacity (mlb/yr) 0 0 0
10 Auxiliary Firing: - Auxfired Capacity (mlb/yr) 0 0 011 Boiler Steam: - Boiler Capacity (mlb/yr) 0 0 0
Retail Electricity Prices:Energy (cents/kWh) 6.00 n/a n/a escalating by (%/year) 2.50% 2.50% 2.50%Demand ($/kW-capacity/month) $0.00 n/a n/a escalating by (%/year) 1.50% 1.50% 1.50%Utility Electricity or Gas Prices:Energy (cents/kWh or $/mm Btu) 4.00 9.91 11.91 escalating by (%/year) 2.50% 0.00% 0.00%Demand ($/kW-capacity/month) $0.00 n/a n/a
escalating by (%/year) 1.50% 0.00% 0.00%
Retail Steam Prices #1:Variable ($/mlb) 0 0 0 escalating by (%/year) 2.50% 2.50% 2.50%Fixed ($mlb or other) escalating by (%/year) 1.50% 1.50% 1.50%Retail Steam Prices #2:Variable ($/mlb) escalating by (%/year) 2.50% 2.50% 2.50%Fixed ($mlb or other) escalating by (%/year) 1.50% 1.50% 1.50%
16 Byproduct Sales – Carbon Credits 0 0 0 escalating by (%/year) 2.00% 2.00% 2.00%Fuel Consumed:Plant Heat Rate (Btu/net kWh sold, power; 13,132 13,132 1.30719 Btu in/Btu sold, gas)Fuel Needed (mm Btu/yr) 44,418.99 44,418.99 44,417.66Adjustments and Conversion Factors:Fuel #1 Dairy Manure Dairy Manure Dairy ManureMM Btu/Mcf 0.523 0.523 0.523Fuel #2 Natural Gas Natural Gas Natural GasMM Btu/Mcf 1.020 1.020 1.020(Fuel #2 is not used, so moot.)
19 Annual Heat Rate IncreaseFuel #1 0.00% 0.10% 0.00%Fuel #2 0.00% 0.10% 0.00%Fuel #1 Percentage 100.00% 100.00% 100.00%Fuel #1 Consumption (mm Btu/hr) 6.566 6.566 5.634Fuel #2 Consumption (mm Btu/hr) 0.000 0.000 0.000Hours/year 6,765 6,765 7,884Total Consumption (mm Btu/yr) 44,418.99 44,418.99 44,417.66Auxiliary Fired Fuel: from Fuel #1, #2 0 0 0Total Consumption (mm Btu/yr)Boiler Fuel 0 0 0
22 Fuel Limit based upon Total HerdBiogas Potential at 90 cf per animal in total herd/dy (cf/day)
540,000 540,000 540,000
Biogas Potential (mm Btu/yr) 103,083.30 103,083.30 103,083.30 -- -- --
17
18
20
21
14
15
13
5
7
8
9
12

76
Hilarides Dairy
23 Fuel #1 Unit Price ($/mm Btu) $0.00 $0.00 $0.0024 Fuel #2 Unit Price ($/mm Btu) $0.00 $0.00 $0.0025 Host Standby Demand Payment to Utility: 0 0 0
Annual Expenses, that escalate with inflation unless otherwise indicated
26 Service 0 0 027 Operations and Maintenance ($/year) $21,000 $21,000 $21,00028 Consumables 0 0 029 Operator 0 0 030 Admin/Compliance 0 0 031 Royalty (% of revenues) 0.00% 0.00% 0.00%
Property Tax (% of depreciable base). 0.00% 1.00% 1.00% escalating by (%/year), Proposition 13 2.00% 2.00% 2.00% where base declines by (%/year) 4.00% 4.00% till hits a remainder of (%). 30.00% 30.00%Insurance (% of depreciable base, escalating with inflation to achieve replacement value)
0.00% 0.60% 0.60%
escalating by (%/year) 2.50% 2.50% 2.50%34 Major Maintenance Repair and Overhaul Fund. Assume
some percentage of depreciable base as overhaul every 5, 7, or 10 years. The overhaul amount is escalated by inflation to find the sum needed by the end of year 5, 7, or 10. If 7, one seventh of that amount is saved each year and deposited to a reserve fund and, after performing the overhaul, repair depreciation is taken, straight-line, over the next seven years.
0 0 0
35 Other36 Other 0 0 037 Gas Monitoring ($/year) 0 0 10,00038 Final Note: Important Facts that may help to optimize
project.
33
For Hilarides, about 20% to 40% of gas is flared. There are about 9,000 additional cows and livestock whose manure is not used. Will additional engine-generator be purchased, as considered in late 2006? System of redundant smaller engines seems to work well.
32

77
Eden‐Vale Dairy
Eden-Vale Dairy Eden-Vale Dairy Eden-Vale Dairyactual ($) improved plant factor, no
subsidy power ($)improved plant factor, no
subsidy pipeline-quality gas ($)
Digester System Type Plug Flow (new system) Plug Flow (new system) Plug Flow (new system)
Generator Nameplate Capacity (kW) 180 kW 180 kW -- First Full Start Year 2006 2006 2006Total Lactating Cows 800 800 800Total Herd 1,100 1,100 1,100Farm Size (acres) 145 145 145Location Lemoorre, Kings County, CA Lemoorre, Kings County, CA Lemoorre, Kings County, CA
Utility PG&E PG&E PG&EDigester and Generator System Design RCM Digesters RCM Digesters RCM Digesters
1A Lagoon 0 0 0B Lagoon Liner 0 0 0C Manure Collection 0 0 0D Vacuum Trailer 0 0 0E Solids Separator/ Grit Removal 63,500 63,500 63,500F Collection Mix Tank 0 0 0
Subtotal 63,500 63,500 63,5002
A Digester/Digester Tank 311,214 311,214 311,214B Lagoon Cover 0 0 0C Digester Heating System 63,720 63,720 63,720D Bacterial Treatment 0 0 0
Subtotal 374,934 374,934 374,9343
A Engine/generator (1 CAT 3406 engine-generator at 180 kW was purchased new)
104,196 104,196 0
B Overhaul, repair, and additional components 6,700 6,700 0C Engine/generator room or building 27,516 27,516 0D Gas Transport 46,740 46,740 46,740E Flare (flare was constructed, not purchased) 0 0 0F Gas Treatment (scrubber, cleaning system) 0 0 0G Controls, panels, meters and instrumentation 0 0 0H Heat recovery (hot water or other) 0 0 0
Subtotal 185,152 185,152 46,7404
A Excavation, trenching, and grading 156 156 156B Concrete work and materials 0 0 0C Electrical work and materials 0 0 0D Other contractor/subcontractor 55,604 55,604 55,604E Dairy labor used for construction and installation 0 0 0F Transportation, Fuel and Heavy Equipment Rental 2,520 2,520 2,520G Other Equipment and Materials 0 0 0
Subtotal 58,280 58,280 58,2805
A System Design/Engineering 65,385 65,385 65,385B Other
Subtotal 65,385 65,385 65,3856
A Permits – air 0 0 0B Permits – building 3,289 3,289 3,289C Permits – water 0 0 0D Other
Subtotal 3,289 3,289 3,2897
A Interconnect Permit and Inspection 43,535 43,535 0B Interconnect Equipment req’d by utility 8,735 8,735 0
Subtotal 52,270 52,270 0
Data Inputs for Eden-Vale Dairy
Component
Introduction and Capital Costs
Manure Collection and Pretreatment
Digester and Gas Production Enhancements
Energy Conversion and Gas Handling
General Construction
System Design/Engineering
Permits
Utility Interconnect
Introduction

78
Eden‐Vale Dairy 8
A Initial Costs incurred prior to refurbishment 0 0 0B Other Construction Costs after System Completion -
engine and control repairs (during 2006)2,000 2,000 2,000
C Tap, Controls, Unique Faclities 160,000D Gas Clean-up and Processing 400,000E SCADA Monitoring 90,000F Pipeline from farm to gas pipeline - 1,000 feet 50,000
Subtotal 2,000 2,000 702,0009
A Construction Financing (e.g., 12 mos by total hard cost by 8% interest by 50% if level draw)
0 32,200 52,600
B Construction InsuranceC Other Overhead/Admin 0D Land 0
Subtotal 0 32,200 52,60010
A Debt Financing Fees – for lender’s legal and accounting costs; possibly loan commitment fee.
0 0 0
B Equity Financing Fees – for organizational fees, tax advice, other legal and accounting for owner/equity investors.
0 12,900 21,000
Subtotal 0 12,900 21,00011
A Debt Service Reserve – assume 6 months for private power using project finance (where lenders are secured only by the one project). If Project owner uses balance sheet finance (so lenders are secured by other assets), probably no DSR.
0 0 0
B Working Capital Reserve (estimate) 0 8,000 13,100C Equipment Repair Reserve Initial Payment 0D Other
Subtotal 0 8,000 13,100
12 Total Loaded Cost $804,810 $857,910 $1,400,828
Component
Eden-Vale Dairy Actual Case
Eden-Vale Dairy improved plant factor power case
with no subsidies
Eden-Vale Dairy improved plant factor pipeline-gas
case w/ no subsidies
1 Senior Debt 0 0 02 Junior Debt 0 0 03 Grant 300,000 0 04 Second Grant 0 0 05 Equity 504,810 857,910 1,400,828
Total $804,810 $857,910 $1,400,828
Component
Eden-Vale Dairy Actual Case
Eden-Vale Dairy improved plant factor power case
with no subsidies
Eden-Vale Dairy improved plant factor pipeline-gas
case w/ no subsidies
1 Contract Term (years) 20 20 202 Inflation Rate (%) 2.50% 2.50% 2.50%
Power Production: Gross Rated Capacity (kW for Power; 180 180 88.164 Mcf/day for Gas - inlet)
Gas Processing Losses (%) 0.00% 0.00% 15.00% In-Plant Use (%) 0.00% 0.00% 0.00% Net Rated Capacity (kW or Mcf/day) 180 180 74.939Capacity Wholesale to Utility (kW or Mcf/day) 150 180 74.939Capacity Retail to Steam Host (kW or Mcf/day) 30 0 0.000
Other Construction Costs after System Completion and Pipeline-Quality Gas Equipment. This plant starts up in 2006 so assume construction is 2005 . Deescalate by one year's inflation per year if startup is before 2006.
Associated Construction Costs
Permanent Take-out Financing
Reserves
3
Sources of Funds
Performance and Annual Operating Expenses
4

79
Eden‐Vale Dairy
Actual Hours/Year 8,760.00 8,760.00 8,760.00 Forced Outage Hours 4,030.00 720.00 276.00 Planned Outage Hours 2,190.00 730.00 600.00 Hours of Operation after Outages 2,540.00 7,310.00 7,884.00Capacity Factor (%) after Outages 29.00% 83.45% 90.00%
6 Any Curtailment by Power Purchaser on top of outages? (%)
0.00% 0.00% 0.00%
Net Power or Gas Produced for Sale 457.20 1,315.80 13,588.91(thou kWh/yr or mm Btu/yr)Percent Sold Retail; 16.50% 0.00% 0.00%Percent Sold Wholesale to Utility 83.50% 100.00% 100.00%Steam Produced for Sale: Unfired capacity rate (mlb/hr) 0.0360 0.0000 0.0000Full load operating hours 2,540.00 7,310.00 7,884.00Unfired Capacity (mlb/yr) 91.4 0.0 0.0
10 Auxiliary Firing: - Auxfired Capacity (mlb/yr) 0 0 011 Boiler Steam: - Boiler Capacity (mlb/yr) 0 0 0
Retail Electricity Prices:Energy (cents/kWh) 7.00 n/a n/a escalating by (%/year) 2.50% 2.50% 2.50%Demand ($/kW-capacity/month) $0.00 n/a n/a escalating by (%/year) 1.50% 1.50% 1.50%Utility Electricity or Gas Prices:Energy (cents/kWh or $/mm Btu) 3.00 17.20 26.90 escalating by (%/year) 2.50% 0.00% 0.00%Demand ($/kW-capacity/month) $0.00 n/a n/a escalating by (%/year) 1.50% 0.00% 0.00%
Retail Steam Prices #1:Variable ($/mlb) $13.12 n/a n/a escalating by (%/year) 2.50% 2.50% 2.50%Fixed ($mlb or other) $0.00 $0.00 $0.00 escalating by (%/year) 1.50% 1.50% 1.50%Retail Steam Prices #2:Variable ($/mlb) escalating by (%/year) 2.50% 2.50% 2.50%Fixed ($mlb or other) escalating by (%/year) 1.50% 1.50% 1.50%
16 Byproduct Sales – Carbon Credits 0 0 0 escalating by (%/year) 2.00% 2.00% 2.00%Fuel Consumed:Plant Heat Rate (Btu/net kWh sold, power; 17,785 13,500 1.30719 Btu in/Btu sold, gas)Fuel Needed (mm Btu/yr) 8,131.30 17,763.30 17,763.29Adjustments and Conversion Factors:Fuel #1 Dairy Manure Dairy Manure Dairy ManureMM Btu/Mcf 0.552 0.552 0.552Fuel #2 Natural Gas Natural Gas Natural GasMM Btu/Mcf 1.020 1.020 1.020(Fuel #2 is not used, so moot.)
19 Annual Heat Rate IncreaseFuel #1 0.00% 0.10% 0.00%Fuel #2 0.00% 0.10% 0.00%Fuel #1 Percentage 100.00% 100.00% 100.00%Fuel #1 Consumption (mm Btu/hr) 3.201 2.430 2.253Fuel #2 Consumption (mm Btu/hr) 0.0000 0.0000 0.0000Hours/year 2,540 7,310 7,884Total Consumption (mm Btu/yr) 8,131.30 17,763.30 17,763.29Auxiliary Fired Fuel: from Fuel #1, #2Total Consumption (mm Btu/yr) 0.00 0.00 0.00Boiler Fuel 0.00 0.00 0.00
22 Fuel Limit based upon Total HerdBiogas Potential at 90 cf per animal in total herd/dy (cf/day)
99,000 99,000 99,000
Biogas Potential (mm Btu/yr) 19,946.52 19,946.52 19,946.52 -- -- --
21
8
9
17
18
20
5
7
12
13
14
15

80
Eden‐Vale Dairy
23 Fuel #1 Unit Price $0.00 $0.00 $0.0024 Fuel #2 Unit Price $0.00 $0.00 $0.0025 Host Standby Demand Payment to Utility: 0 0 0
Annual Expenses, that escalate with inflation unless otherwise indicated
26 Service27 Operations and Maintenance $18,000 $18,000 $18,00028 Consumables29 Operator - Addtl Expense re: adjusted longer hours 3,000 3,00030 Admin/Compliance31 Royalty (% of revenues) 0.00% 0.00% 0.00%
Property Tax (% of depreciable base). 0.00% 1.00% 1.00% escalating by (%/year), Proposition 13 2.00% 2.00% 2.00% where base declines by (%/year) 4.00% 4.00% till hits a remainder of (%). 30.00% 30.00%Insurance (% of depreciable base, escalating with inflation to achieve replacement value)
0.00% 0.60% 0.60%
escalating by (%/year) 2.50% 2.50% 2.50%34 Major Maintenance Repair and Overhaul Fund. Assume
some percentage of depreciable base as overhaul every 5, 7, or 10 years. The overhaul amount is escalated by inflation to find the sum needed by the end of year 5, 7, or 10. If 7, one seventh of that amount is saved each year and deposited to a reserve fund and, after performing the overhaul, repair depreciation is taken, straight-line, over the next seven years.
35 Other36 Other Costs 0 0 037 Gas Monitoring ($/year) 0 0 10,00038 Final Note: Important Facts that may help to optimize
project. This Eden-Vale plant is run much below capacity because there is no market for power. The farmer has more manure that does not enter digester and some biogas is flared and does not feed the generator. He runs the system below capacity because operating expenses are higher than anticipated and revenues are lower than expected. There is little payment for excess power. He will connect more dairy load to the generator - beyond one meter now that connects a well, freestall lights, a pump, and generator load. On-farm main dairy acounts average about 37,000 kWh/month (or $2,600 at $0.070/kWh). Farmer also is considering recovered heat for dairy hot water.
33
32

81
Koetsier Dairy
Koetsier Dairy Koetsier Dairy Koetsier Dairyactual ($) improved plant factor, no
subsidy power ($)improved plant factor, no subsidy pipeline-qual gas
($)
Digester System Type Plug Flow (System Refurbishment)
Plug Flow (System Refurbishment)
Plug Flow (System Refurbishment)
Generator Nameplate Capacity (kW) 260 kW 260 kW -- First Full Start Year 2006 2006 2006Total Lactating Cows 1,266 1,266 1,266Total Herd 2,285 2,285 2,285Farm Size (acres) 180 owned and 310 rented 180 owned and 310 rented 180 owned and 310 rentedLocation Visalia, Tulare County, CA Visalia, Tulare County, CA Visalia, Tulare County, CA
Utility SCE SCE SCEDigester and Generator System Design RCM Digesters RCM Digesters RCM Digesters
1A Lagoon 0 0 0B Lagoon Liner 0 0 0C Manure Collection 5,622 5,622 5,622D Vacuum Trailer 117,588 117,588 117,588E Solids Separator/ Grit Removal 63,168 63,168 63,168F Collection Mix Tank 0 0 0
Subtotal 186,378 186,378 186,3782
A Digester/Digester Tank 84,853 84,853 84,853B Lagoon Cover 0 0 0C Digester Heating System 0 0 0D Bacterial Treatment 0 0 0
Subtotal 84,853 84,853 84,8533
A Engine/generator - 1 used Caterpillar G342 genset at 135 kW was purchased and 1 Cat G342 genset at 135 kW was existing; both were refurbished.
10,000 10,000 0
B Overhaul, repair, and additional components 22,769 22,769 0C Engine/generator room or building 14,576 14,576 0D Gas Transport 13,250 13,250 13,250E Flare (flare was constructed, not purchased) 2,750 2,750 2,750F Gas Treatment (scrubber, cleaning system) 0 0 0G Controls, panels, meters and instrumentation 11,995 11,995 0H Heat recovery (hot water or other) 0 0 0
Subtotal 75,340 75,340 16,0004
A Excavation, trenching, and grading 0 0 0B Concrete work and materials 0 0 0C Electrical work and materials 0 0 0D Other contractor/subcontractor 0 0 0E Dairy labor used for construction and installation 0 0 0F Transportation, Fuel and Heavy Equipment Rental 0 0 0G Other Equipment and Materials 0 0 0
Subtotal 0 0 05
A System Design/Engineering 9,963 9,963 9,963B Other 0 0
Subtotal 9,963 9,963 9,9636
A Permits – air 120 120 120B Permits – building 20 20 20C Permits – water 0 0 0D Other
Subtotal 140 140 1407
A Interconnect Permit and Inspection 1,285 1,285 0B Interconnect Equipment req’d by utility 5,128 5,128 0
Subtotal 6,413 6,413 0
Data Inputs for Koetsier Dairy
Component
Introduction and Capital Costs
Manure Collection and Pretreatment
Digester and Gas Production Enhancements
Energy Conversion and Gas Handling
General Construction
System Design/Engineering
Permits
Utility Interconnect
Introduction

82
Koetsier Dairy 8
A Initial Costs incurred prior to refurbishment - turnkey 1985 digester system installed, that was non-operational by 2001
998,000 998,000 998,000
B Other Construction Costs after System Completion - remodelled input system
7,500 7,500 7,500
C Tap, Controls, Unique Faclities 160,000D Gas Clean-up and Processing 400,000E SCADA Monitoring 90,000F Pipeline from farm to gas pipeline - 1,000 feet 50,000
Subtotal 1,005,500 1,005,500 1,705,5009
A Construction Financing (e.g., 12 mos by total hard cost by 8% interest by 50% if level draw)
0 54,700 80,100
B Construction InsuranceC Other Overhead/Admin 0D Land 0
Subtotal 0 54,700 80,10010
A Debt Financing Fees – for lender’s legal and accounting costs; possibly loan commitment fee.
0 0 0
B Equity Financing Fees – for organizational fees, tax advice, other legal and accounting for owner/equity investors.
0 21,900 32,000
Subtotal 0 21,900 32,00011
A Debt Service Reserve – assume 6 months for private power using project finance (where lenders are secured only by the one project). If Project owner uses balance sheet finance (so lenders are secured by other assets), probably no DSR.
0 0 0
B Working Capital Reserve (estimate) 0 13,700 20,000C Equipment Repair Reserve Initial Payment 0D Other
Subtotal 0 13,700 20,000
12 Total Loaded Cost $1,368,587 1,458,887 2,134,934
Component
Koetsier Dairy Actual Case Koetsier Dairy improved plant factor power case
with no subsidies
Koetsier Dairy improved plant factor pipeline gas
case w/ no subsidies
1 Senior Debt $0 $0 $02 Junior Debt 0 0 03 Grant - $190,925 credits at $0.057/kWh for 5 years 0 0 04 Second Grant 0 0 05 Equity 1,368,587 1,458,887 2,134,934
Total $1,368,587 $1,458,887 $2,134,934
Component
Koetsier Dairy Actual Case Koetsier Dairy improved plant factor pipeline gas
case w/ no subsidies
Koetsier Dairy improved plant factor pipeline gas
case w/ no subsidies
1 Contract Term (years) 20 20 202 Inflation Rate (%) 2.50% 2.50% 2.50%
Power Production: Gross Rated Capacity (kW for Power; 260 260 126.205 Mcf/day for Gas - inlet)
Gas Processing Losses (%) 0.00% 0.00% 15.00% In-Plant Use (%) 0.00% 0.00% 0.00% Net Rated Capacity (kW or Mcf/day) 260 260 107.274Capacity Wholesale to Utility (kW or Mcf/day) 130 260 107.274Capacity Retail to Steam Host (kW or Mcf/day) 130 0 0.000
Other Construction Costs after System Completion and Pipeline-Quality Gas Equipment. This plant starts up in 2006 so assume construction is 2005 . Deescalate by one year's inflation per year if startup is before 2006.
Associated Construction Costs
Permanent Take-out Financing
Reserves
3
Sources of Funds
Performance and Annual Operating Expenses
4

83
Koetsier Dairy
Actual Hours/Year 8,760.00 8,760.00 8,760.00Forced Outage Hours 5,954.00 720.00 276.00Planned Outage Hours 730.00 730.00 600.00Hours of Operation after Outages 2,076.00 7,310.00 7,884.00Capacity Factor (%) after Outages 23.70% 83.45% 90.00%
6 Any Curtailment by Power Purchaser on top of outages? (%)
0 0 0
Net Power or Gas Produced for Sale 539.76 1,900.60 19,628.45(thou kWh/yr or mm Btu/yr)Percent Sold Retail; 76.20% 0.00% 0.00%Percent Sold Wholesale to Utility 23.80% 100.00% 100.00%Steam Produced for Sale: Unfired capacity rate (mlb/hr) 0.044 0.000 0.000Full load operating hours/yr 2,076.00 7,310.00 7,884.00Unfired Capacity (mlb/yr) 91.3 0.0 0.0
10 Auxiliary Firing: - Auxfired Capacity (mlb/yr) 0 0 011 Boiler Steam: - Boiler Capacity (mlb/yr) 0 0 0
Retail Electricity Prices:Energy (cents/kWh) 6.00 n/a n/a escalating by (%/year) 2.50% 2.50% 2.50%Demand ($/kW-capacity/month) $0.00 n/a n/a escalating by (%/year) 1.50% 1.50% 1.50%Utility Electricity or Gas Prices:Energy (cents/kWh or $/mm Btu) 3.00 19.90 27.95 escalating by (%/year) 2.50% 0.00% 0.00%Demand ($/kW-capacity/month) $0.00 n/a n/a escalating by (%/year) 1.50% 0.00% 0.00%
Retail Steam Prices #1:Variable ($/mlb) $13.12 $0.00 $0.00 escalating by (%/year) 2.50% 2.50% 2.50%Fixed ($mlb or other) $0.00 $0.00 $0.00 escalating by (%/year) 1.50% 1.50% 1.50%Retail Steam Prices #2:Variable ($/mlb) escalating by (%/year) 2.50% 2.50% 2.50%Fixed ($mlb or other) escalating by (%/year) 1.50% 1.50% 1.50%
16 Byproduct Sales – Carbon Credits 0 0 0 escalating by (%/year) 2.00% 2.00% 2.00%Fuel Consumed:Plant Heat Rate (Btu/net kWh sold, power; 16,645 13,500 1.30719 Btu in/Btu sold, gas)Fuel Needed (mm Btu/yr) 8,984.31 25,658.10 25,658.12Adjustments and Conversion Factors:Fuel #1 Dairy Manure Dairy Manure Dairy ManureMM Btu/Mcf 0.557 0.557 0.557Fuel #2 Natural Gas Natural Gas Natural GasMM Btu/Mcf 1.020 1.020 1.020(Fuel #2 is not used, so moot.)
19 Annual Heat Rate IncreaseFuel #1 0.00% 0.10% 0.00%Fuel #2 0.00% 0.10% 0.00%Fuel #1 Percentage 100.00% 100.00% 100.00%Fuel #1 Consumption (mm Btu/hr) 4.328 3.510 3.254Fuel #2 Consumption (mm Btu/hr) 0.000 0.000 0.000Hours/year 2,076 7,310 7,884Total Consumption (mm Btu/yr) 8,984.31 25,658.10 25,658.12Auxiliary Fired Fuel: from Fuel #1, #2 0 0 0Total Consumption (mm Btu/yr)Boiler Fuel 0 0 0
22 Fuel Limit based upon Total HerdBiogas Potential at 90 cf per animal in total herd/dy (cf/day)
205,650 205,650 205,650
Biogas Potential (mm Btu/yr) 41,809.67 41,809.67 41,809.67 -- -- --
5
9
7
8
21
17
18
20
14
15
12
13

84
Koetsier Dairy
23 Fuel #1 Unit Price ($/mm Btu) $0.00 $0.00 $0.0024 Fuel #2 Unit Price ($/mm Btu) $0.00 $0.00 $0.0025 Host Standby Demand Payment to Utility: 0 0 0
Annual Expenses, that escalate with inflation unless otherwise indicated
26 Service27 Operations and Maintenance $27,000 $27,000 $27,00028 Consumables29 Operator - Addtl Expense re: adjusted longer hours 0 3,000 3,00030 Admin/Compliance31 Royalty (% of revenues) 0.00% 0.00% 0.00%
Property Tax (% of depreciable base). 0.00% 1.00% 1.00% escalating by (%/year), Proposition 13 2.00% 2.00% 2.00% where base declines by (%/year) 4.00% 4.00% till hits a remainder of (%). 30.00% 30.00%Insurance (% of depreciable base, escalating with inflation to achieve replacement value)
0.00% 0.60% 0.60%
escalating by (%/year) 2.50% 2.50% 2.50%34 Major Maintenance Repair and Overhaul Fund. Assume
some percentage of depreciable base as overhaul every 5, 7, or 10 years. The overhaul amount is escalated by inflation to find the sum needed by the end of year 5, 7, or 10. If 7, one seventh of that amount is saved each year and deposited to a reserve fund and, after performing the overhaul, repair depreciation is taken, straight-line, over the next seven years.
35 Other36 Other Costs $0.00 $0.00 $0.0037 Gas Monitoring ($/year) 0 0 10,00038 Final Note: Important Facts that may help to optimize
project. Because most net generation credits were forfeited, the Koetsier Dairy farmer does not run second engine-generator, underfeeds the one in use and flares 15% to 40% of dairy biogas. He retired part of dairy herd in 2003 by 270 cows to 1,233 cows. From a flush system that used too much water and reduced biogas production, this dairy converted to a scrape system, that scrapes manure twice per day and where a vacuum unit sends it to digester. Might measure how much recovered heat is used to heat digester. This project sought to refurbish existing, non-operational plug-flow digester system, and much of the Capital Cost (75%) was incurred in 1985. Farmer recently applied (2006?) to sell greenhouse gas credits on Chicago Climate Exchange (CCX), so system performance will improve. Separated solids are composted and used for bedding for cows in barns.
32
33

85
Meadowbrook Dairy
Meadowbrook Dairy Meadowbrook Dairy Meadowbrook Dairyactual ($) no subsidy power ($) no subsidy pipeline-quality
gas ($)
Digester System Type Plug Flow (new system) Plug Flow (new system) Plug Flow (new system)
Generator Nameplate Capacity (kW) 160 kW 160 kW -- First Full Start Year 2005 2005 2005Total Lactating Cows 2,093 2,093 2,093Total Herd 3,194 3,194 3,194Farm Size (acres) 480 acres + 1,100 acres
nearby480 acres + 1,100 acres
nearby480 acres + 1,100 acres
nearbyLocation El Mirage, San Bernardino,
CAEl Mirage, San Bernardino,
CAEl Mirage, San Bernardino,
CA
Utility SCE SCE SCEDigester and Generator System Design RCM Digesters RCM Digesters RCM Digesters
1A Lagoon 0B Lagoon Liner 0C Manure Collection 0D Vacuum Trailer 0E Solids Separator/ Grit Removal 36,807 36,807 36,807F Collection Mix Tank 7,995 7,995 7,995
Subtotal 44,802 44,802 44,8022
A Digester/Digester Tank 290,873 290,873 290,873B Lagoon Cover 0 0 0C Digester Heating System 35,326 35,326 35,326D Bacterial Treatment 19,160 19,160 19,160
Subtotal 345,359 345,359 345,3593
A Engine/generator - One CAT 3406TA genset at 160 kW was purchased new.
135,562 135,562 0
B Overhaul, repair, and additional components 3,885 3,885 0C Engine/generator room or building 23,393 23,393 0D Gas Transport 50,921 50,921 50,921E Flare (flare was constructed, not purchased) 2,420 2,420 2,420F Gas Treatment (scrubber, cleaning system) 0 0 0G Controls, panels, meters and instrumentation 0 0 0H Heat recovery (hot water or other) 0 0 0
Subtotal 216,181 216,181 53,3414
A Excavation, trenching, and grading 580 580 580B Concrete work and materials 0 0 0C Electrical work and materials 32,119 32,119 0D Other contractor/subcontractor 0 0 0E Dairy labor used for construction and installation 0 0 0F Transportation, Fuel and Heavy Equipment Rental 0 0 0G Other Equipment and Materials 2,143 2,143 2,143
Subtotal 34,842 34,842 2,7235
A System Design/Engineering 60,321 60,321 60,321B Other
Subtotal 60,321 60,321 60,3216
A Permits – air 0 0 0B Permits – building 7,846 7,846 7,846C Permits – water 0 0 0D Other 0 0 0
Subtotal 7,846 7,846 7,8467
A Interconnect Permit and Inspection 0 0 0B Interconnect Equipment req’d by utility 11,253 11,253 0
Subtotal 11,253 11,253 0
Manure Collection and Pretreatment
Digester and Gas Production Enhancements
Energy Conversion and Gas Handling
Data Inputs for Meadowbrook Dairy
Component
Introduction and Capital Costs
Introduction
General Construction
System Design/Engineering
Permits
Utility Interconnect

86
Meadowbrook Dairy 8
A Initial Costs incurred prior to refurbishment - Water/Liquids Management System including lagoon, pumps, mixing chamber, and electrical components. Assume $50,000 is lagoon, which is removed for no subsidy cases.
300,000 250,000 250,000
B Other Construction Costs after System Completion 0 0 0C Tap, Controls, Unique Faclities 156,098D Gas Clean-up and Processing 448,780E SCADA Monitoring 87,805F Pipeline from farm to gas pipeline - 1,000 feet 48,780
Subtotal 300,000 250,000 991,4639
A Construction Financing (e.g., 12 mos by total hard cost by 8% interest by 50% if level draw)
0 38,800 60,200
B Construction InsuranceC Other Overhead/Admin 0D Land 0
Subtotal 0 38,800 60,20010
A Debt Financing Fees – for lender’s legal and accounting costs; possibly loan commitment fee.
0 0 0
B Equity Financing Fees – for organizational fees, tax advice, other legal and accounting for owner/equity investors.
0 15,500 24,100
Subtotal 0 15,500 24,10011
A Debt Service Reserve – assume 6 months for private power using project finance (where lenders are secured only by the one project). If Project owner uses balance sheet finance (so lenders are secured by other assets), probably no DSR.
0 0 0
B Working Capital Reserve (estimate) 0 9,700 15,100C Equipment Repair Reserve Initial Payment 0D Other
Subtotal 0 9,700 15,100
12 Total Loaded Cost 1,020,604 1,034,604 1,605,255
Component
Meadowbrook Dairy Actual Case
Meadowbrook Dairy power case with no subsidies
Meadowbrook Dairy pipeline-quality gas case
with no subsidies1 Senior Debt $0 $0 $02 Junior Debt 0 0 03 Grant 262,449 0 04 Second Grant 200,000 0 05 Equity 558,155 1,034,604 1,605,255
Total $1,020,604 $1,034,604 $1,605,255
Component
Meadowbrook Dairy Actual Case
Meadowbrook Dairy power case with no subsidies
Meadowbrook Dairy pipeline-quality gas case
with no subsidies
1 Contract Term (years) 20 20 202 Inflation Rate (%) 2.50% 2.50% 2.50%
Power Production: Gross Rated Capacity (kW for Power; 160 160 80.501 Mcf/day for Gas - inlet)
Gas Processing Losses (%) 0.00% 0.00% 15.00% In-Plant Use (%) 0.00% 0.00% 0.00% Net Rated Capacity (kW or Mcf/day) 160 160 68.426Capacity Wholesale to Utility (kW or Mcf/day) 50 160 68.426Capacity Retail to Steam Host (kW or Mcf/day) 110 0 (0)
Other Construction Costs after System Completion and Pipeline-Quality Gas Equipment. This plant starts up in 2005 so assume construction is 2004 . Deescalate by one year's inflation per year if startup is before 2006.
Associated Construction Costs
Permanent Take-out Financing
Reserves
3
Sources of Funds
Performance and Annual Operating Expenses
4

87
Meadowbrook Dairy
Actual Hours/Year 8,760.00 8,760.00 8,760.00Forced Outage Hours 1,517.03 1,517.03 276.00Planned Outage Hours 365.00 365.00 600.00Hours of Operation after Outages 6,878.0 6,878.0 7,884.0Capacity Factor (%) after Outages 78.52% 78.52% 90.00%
6 Any Curtailment by Power Purchaser on top of outages? (%)
0.00% 0.00% 0.00%
Net Power or Gas Produced for Sale 1,100.48 1,100.48 13,194.52(thou kWh/yr or mm Btu/yr)Percent Sold Retail; 67.70% 0.00% 0.00%Percent Sold Wholesale to Utility 32.30% 100.00% 100.00%Steam Produced for Sale: Unfired capacity rate (mlb/hr) 0.0200 0.0000 0.0000Full load operating hours 6,877.97 6,877.97 7,884.00Unfired Capacity (mlb/yr) 137.6 0.0 0.0
10 Auxiliary Firing: - Auxfired Capacity (mlb/yr) 011 Boiler Steam: - Boiler Capacity (mlb/yr) 0
Retail Electricity Prices:Energy (cents/kWh) 6.00 n/a n/a escalating by (%/year) 2.50% 2.50% 2.50%Demand ($/kW-capacity/month) $0.00 n/a n/a escalating by (%/year) 1.50% 1.50% 1.50%Utility Electricity or Gas Prices:Energy (cents/kWh or $/mm Btu) 4.00 26.30 30.10 escalating by (%/year) 2.50% 0.00% 0.00%Demand ($/kW-capacity/month) $0.00 n/a n/a escalating by (%/year) 1.50% 0.00% 0.00%
Retail Steam Prices #1:Variable ($/mlb) 13.12 n/a n/a escalating by (%/year) 2.50% 2.50% 2.50%Fixed ($mlb or other) $0.00 $0.00 $0.00 escalating by (%/year) 1.50% 1.50% 1.50%Retail Steam Prices #2:Variable ($/mlb) escalating by (%/year) 2.50% 2.50% 2.50%Fixed ($mlb or other) escalating by (%/year) 1.50% 1.50% 1.50%
16 Byproduct Sales – Carbon Credits 0 0 0 escalating by (%/year) 2.00% 2.00% 2.00%Fuel Consumed:Plant Heat Rate (Btu/net kWh sold, power; 15,673 15,673 1.30719 Btu in/Btu sold, gas)Fuel Needed (mm Btu/yr) 17,247.75 17,247.75 17,247.75Adjustments and Conversion Factors:Fuel #1 Dairy Manure Dairy Manure Dairy ManureMM Btu/Mcf 0.587 0.587 0.587Fuel #2 Natural Gas Natural Gas Natural GasMM Btu/Mcf 1.020 1.020 1.020(Fuel #2 is not used, so moot.)
19 Annual Heat Rate IncreaseFuel #1 0.00% 0.10% 0.00%Fuel #2 0.00% 0.10% 0.00%Fuel #1 Percentage 100.00% 100.00% 100.00%Fuel #1 Consumption (mm Btu/hr) 2.508 2.508 2.188Fuel #2 Consumption (mm Btu/hr) 0.0000 0.0000 0.0000Hours/year 6,878 6,878 7,884Total Consumption (mm Btu/yr) 17,247.75 17,247.75 17,247.75Auxiliary Fired Fuel: from Fuel #1, #2 0 0 0Total Consumption (mm Btu/yr)Boiler Fuel 0 0 0
22 Fuel Limit based upon Total HerdBiogas Potential at 90 cf per animal in total herd/dy (cf/day)
287,460 287,460 287,460
Biogas Potential (mm Btu/yr) 61,589.74 61,589.74 61,589.74 -- -- --
7
5
8
9
17
18
12
14
15
13
21
20

88
Meadowbrook Dairy
23 Fuel #1 Unit Price $0.00 $0.00 $0.0024 Fuel #2 Unit Price $0.00 $0.00 $0.0025 Host Standby Demand Payment to Utility: 0 0 0
Annual Expenses, that escalate with inflation unless otherwise indicated
26 Service - Engine Rebuild annually at $20,000 each. Omit for gas case.
20,000 20,000 0
27 Operations and Maintenance 6,720 6,720 6,72028 Consumables - Oil Change at $255/week, as no H2S
removal equipment to start. ($255/wk * 52 = $13,260.) Omit for gas case.
13,260 13,260 0
29 Operator30 Admin/Compliance31 Royalty (% of revenues) 0.00% 0.00% 0.00%
Property Tax (% of depreciable base). 0.00% 1.00% 1.00% escalating by (%/year), Proposition 13 2.00% 2.00% 2.00% where base declines by (%/year) 4.00% 4.00% till hits a remainder of (%). 30.00% 30.00%Insurance (% of depreciable base, escalating with inflation to achieve replacement value)
0.00% 0.60% 0.60%
escalating by (%/year) 2.50% 2.50% 2.50%34 Major Maintenance Repair and Overhaul Fund. Assume
some percentage of depreciable base as overhaul every 5, 7, or 10 years. The overhaul amount is escalated by inflation to find the sum needed by the end of year 5, 7, or 10. If 7, one seventh of that amount is saved each year and deposited to a reserve fund and, after performing the overhaul, repair depreciation is taken, straight-line, over the next seven years.
35 Other36 Other Costs - Rebuilt engine at 6,000 hours. Changing
oil once a week. See above - #26 and #28.0 0 0
37 Gas Monitoring ($/year) 0 0 9,75638 Final Note: Important Facts that may help to optimize
project. For Meadowbrook Dairy, operating expenses are high as oil change at $13,260/year and engine rebuild at $30,000/year are included. The Dairy may have installed H2S removal equipment later, but keep these operating expenses for now. Might measure how much recovered heat is used to heat digester. For retail on-farm offset, demand charges were not reduced, so full retail price is not recovered. The farmer is expanding dairy operations and load with calf flush facilities (i.e., 3 pumps, separator, compressor) and will add a second generator. Separated solids are composted and shipped to off-site farm, digested solids may be sold for potting soil, liquid effluent is employed for crop irrigation.
33
32

89
Van Ommering Dairy
Van Ommering Dairy Van Ommering Dairy Van Ommering Dairyactual ($) improved plant factor, no
subsidy power ($)improved plant factor, no subsidy pipeline-qual gas
($)
Digester System Type Plug Flow (new system) Plug Flow (new system) Plug Flow (new system)
Generator Nameplate Capacity (kW) 130 kW 130 kW -- First Full Start Year 2006 2006 2006Total Lactating Cows 480 480 480Total Herd 717 717 717Farm Size (acres) 200 200 200Location Lakeside, San Diego County,
CALakeside, San Diego County,
CALakeside, San Diego County,
CA
Utility SDG&E SDG&E SDG&EDigester and Generator System Design RCM Digesters RCM Digesters RCM Digesters
1A Lagoon 0 0 0B Lagoon Liner 0 0 0C Manure Collection 47,686 47,686 47,686D Vacuum Trailer 38,884 38,884 38,884E Solids Separator/ Grit Removal 29,045 29,045 29,045F Collection Mix Tank 0 0 0
Subtotal 115,615 115,615 115,6152
A Digester/Digester Tank 318,145 318,145 318,145B Lagoon Cover 0 0 0C Digester Heating System 52,248 52,248 52,248D Bacterial Treatment 0 0 0
Subtotal 370,393 370,393 370,3933
A Engine/generator - One CAT 3406 genset at 130 kW was purchased new.
113,584 113,584 0
B Overhaul, repair, and additional components - generator piping
8,551 8,551 0
C Engine/generator room or building 9,521 9,521 0D Gas Transport 64,444 64,444 64,444E Flare (flare was constructed, not purchased) 0 0 0F Gas Treatment (scrubber, cleaning system) 0 0 0G Controls, panels, meters and instrumentation 0 0 0H Heat recovery (hot water or other) 0 0 0
Subtotal 196,100 196,100 64,4444
A Excavation, trenching, and grading 28,660 28,660 28,660B Concrete work and materials 0 0 0C Electrical work and materials 35,271 35,271 0D Other contractor/subcontractor 922 922 922E Dairy labor used for construction and installation 0 0 0F Transportation, Fuel and Heavy Equipment Rental 0 0 0G Other Equipment and Materials 0 0 0
Subtotal 64,853 64,853 29,5825
A System Design/Engineering 48,440 48,440 48,440B Other 0 0
Subtotal 48,440 48,440 48,4406
A Permits – air 0 0 0B Permits – building 2,000 2,000 2,000C Permits – water 0 0 0D Other (Env. Impact Report) 2,000 2,000 2,000
Subtotal 4,000 4,000 4,0007
A Interconnect Permit and Inspection 37,435 37,435 0B Interconnect Equipment req’d by utility 0 0 0
Subtotal 37,435 37,435 0
Data Inputs for Van Ommering Dairy
Component
Introduction and Capital Costs
Introduction
Manure Collection and Pretreatment
Digester and Gas Production Enhancements
Energy Conversion and Gas Handling
General Construction
System Design/Engineering
Permits
Utility Interconnect

90
Van Ommering Dairy 8
A Initial Costs incurred prior to refurbishment 0 0 0B Other Construction Costs after System Completion - for
additional receiving tank30,000 30,000 30,000
C Tap, Controls, Unique Faclities 160,000D Gas Clean-up and Processing 400,000E SCADA Monitoring 90,000F Pipeline from farm to gas pipeline - 1,000 feet 50,000
Subtotal 30,000 30,000 730,0009
A Construction Financing (e.g., 12 mos by total hard cost by 8% interest by 50% if level draw)
0 34,700 54,500
B Construction InsuranceC Other Overhead/Admin 0D Land 0
Subtotal 0 34,700 54,50010
A Debt Financing Fees – for lender’s legal and accounting costs; possibly loan commitment fee.
0 0 0
B Equity Financing Fees – for organizational fees, tax advice, other legal and accounting for owner/equity investors.
0 13,900 21,800
Subtotal 0 13,900 21,80011
A Debt Service Reserve – assume 6 months for private power using project finance (where lenders are secured only by the one project). If Project owner uses balance sheet finance (so lenders are secured by other assets), probably no DSR.
0 0 0
B Working Capital Reserve (estimate) 0 8,700 13,600C Equipment Repair Reserve Initial Payment 0D Other
Subtotal 0 8,700 13,600
12 Total Loaded Cost $866,836 924,136 1,452,374
Component
Van Ommering Dairy Actual Case
Van Ommering Dairy improved plant factor power case with no
subsidies
Van Ommering Dairy improved plant factor
pipeline gas case w/ no subsidies
1 Senior Debt $0 $0 $02 Junior Debt 0 0 03 Grant 244,642 0 04 Second Grant 150,000 0 05 Equity 472,194 924,136 1,452,374
Total $866,836 $924,136 $1,452,374
Component
Van Ommering Dairy Actual Case
Van Ommering Dairy improved plant factor power case with no
subsidies
Van Ommering Dairy improved plant factor
pipeline gas case w/ no subsidies
1 Contract Term (years) 20 20 202 Inflation Rate (%) 2.50% 2.50% 2.50%
Power Production: Gross Rated Capacity (kW for Power; 130 130 51.994 Mcf/day for Gas - inlet)
Gas Processing Losses (%) 0.00% 0.00% 15.00% In-Plant Use (%) 0.00% 0.00% 0.00% Net Rated Capacity (kW or Mcf/day) 130 130 44.195Capacity Wholesale to Utility (kW or Mcf/day) 130 130 44.195Capacity Retail to Steam Host (kW or Mcf/day) 0 0 0
4
Associated Construction Costs
Permanent Take-out Financing
Reserves
3
Sources of Funds
Performance and Annual Operating Expenses
Other Construction Costs after System Completion and Pipeline-Quality Gas Equipment. This plant starts up in 2006 so assume construction is 2005 . Deescalate by one year's inflation per year if startup is before 2006.

91
Van Ommering Dairy
Actual Hours/Year 8,760.00 8,760.00 8,760.00Forced Outage Hours 3,170.00 720.00 276.00Planned Outage Hours 1,825.00 730.00 600.00Hours of Operation after Outages 3,765.00 7,310.00 7,884.00Capacity Factor (%) after Outages 42.98% 83.45% 90.00%
6 Any Curtailment by Power Purchaser on top of outages? (%)
0.00% 0.00% 0.00%
Net Power or Gas Produced for Sale 489.45 950.30 9,814.18(thou kWh/yr or mm Btu/yr)Percent Sold Retail; 9.68% 0.00% 0.00%Percent Sold Wholesale to Utility 90.32% 100.00% 100.00%Steam Produced for Sale: Unfired capacity rate (mlb/hr) 0.0243 0.0000 0.0000Full load operating hours/yr 3,765.00 7,310.00 7,884.00Unfired Capacity (mlb/yr) 91.5 0.0 0.0
10 Auxiliary Firing: - Auxfired Capacity (mlb/yr) 0 0 011 Boiler Steam: - Boiler Capacity (mlb/yr) 0 0 0
Retail Electricity Prices:Energy (cents/kWh) 5.00 n/a n/a escalating by (%/year) 2.50% 2.50% 2.50%Demand ($/kW-capacity/month) $0.00 n/a n/a escalating by (%/year) 1.50% 1.50% 1.50%Utility Electricity or Gas Prices:Energy (cents/kWh or $/mm Btu) 5.00 25.50 38.50 escalating by (%/year) 2.50% 0.00% 0.00%Demand ($/kW-capacity/month) $0.00 n/a n/a escalating by (%/year) 1.50% 0.00% 0.00%
Retail Steam Prices #1:Variable ($/mlb) $13.12 n/a n/a escalating by (%/year) 2.50% 2.50% 2.50%Fixed ($mlb or other) $0.00 $0.00 $0.00 escalating by (%/year) 1.50% 1.50% 1.50%Retail Steam Prices #2:Variable ($/mlb) escalating by (%/year) 2.50% 2.50% 2.50%Fixed ($mlb or other) escalating by (%/year) 1.50% 1.50% 1.50%
16 Byproduct Sales – Carbon Credits 0 0 0 escalating by (%/year) 2.00% 2.00% 2.00%Fuel Consumed:Plant Heat Rate (Btu/net kWh sold, power; 17,103 13,500 1.30719 Btu in/Btu sold, gas)Fuel Needed (mm Btu/yr) 8,371.06 12,829.05 12,829.00Adjustments and Conversion Factors:Fuel #1 Dairy Manure Dairy Manure Dairy ManureMM Btu/Mcf 0.676 0.676 0.676Fuel #2 Natural Gas Natural Gas Natural GasMM Btu/Mcf 1.020 1.020 1.020(Fuel #2 is not used, so moot.)
19 Annual Heat Rate IncreaseFuel #1 0.00% 0.10% 0.00%Fuel #2 0.00% 0.10% 0.00%Fuel #1 Percentage 100.00% 100.00% 100.00%Fuel #1 Consumption (mm Btu/hr) 2.2234 1.7550 1.6272 Fuel #2 Consumption (mm Btu/hr) 0.0000 0.0000 0.0000Hours/year 3,765 7,310 7,884Total Consumption (mm Btu/yr) 8,371.06 12,829.05 12,829.00Auxiliary Fired Fuel: from Fuel #1, #2 0 0 0Total Consumption (mm Btu/yr)Boiler Fuel 0 0 0
22 Fuel Limit based upon Total HerdBiogas Potential at 90 cf per animal in total herd/dy (cf/day)
64,530 64,530 64,530
Biogas Potential (mm Btu/yr) 15,922.13 15,922.13 15,922.13 -- -- --
21
17
18
20
5
7
15
13
14
8
9
12

92
Van Ommering Dairy
23 Fuel #1 Unit Price $0.00 $0.00 $0.0024 Fuel #2 Unit Price $0.00 $0.00 $0.0025 Host Standby Demand Payment to Utility: 0 0 0
Annual Expenses, that escalate with inflation unless otherwise indicated
26 Service27 Operations and Maintenance 18,000 18,000 18,00028 Consumables29 Operator - Addtl Expense re: adjusted longer hours 3,000 3,00030 Admin/Compliance31 Royalty (% of revenues) 0.00% 0.00% 0.00%
Property Tax (% of depreciable base). 0.00% 1.00% 1.00% escalating by (%/year), Proposition 13 2.00% 2.00% 2.00% where base declines by (%/year) 4.00% 4.00% till hits a remainder of (%). 30.00% 30.00%Insurance (% of depreciable base, escalating with inflation to achieve replacement value)
0.00% 0.60% 0.60%
escalating by (%/year) 2.50% 2.50% 2.50%34 Major Maintenance Repair and Overhaul Fund. Assume
some percentage of depreciable base as overhaul every 5, 7, or 10 years. The overhaul amount is escalated by inflation to find the sum needed by the end of year 5, 7, or 10. If 7, one seventh of that amount is saved each year and deposited to a reserve fund and, after performing the overhaul, repair depreciation is taken, straight-line, over the next seven years.
35 Other36 Other Cost - 0 0 037 Gas Monitoring ($/year) 0 0 10,00038 Final Note: Important Facts that may help to optimize
project.
33
32
Because some net generation credits were forfeited and there was no payment for surplus power, farmer does not run generator at capacity. He flares 40% to 50% of dairy biogas. After study period of June 2005 to May 2006, farmer built three barns to increse digester inflow by 8,000 gal/day and scraping to 3 times/week. Dairy electric load from 2 wells, 1 shop and 1 house were added to engine-generator output, plus lighting and fans for 3 new barns. Van Ommering system thus will beome more efficient.

93
IEUA Dairy
Inland Empire Utilities Agency Inland Empire Utilities Agency
Inland Empire Utilities Agency
actual ($) if engine operating hours matched digester hours
no subsidy power ($) no subsidy pipeline-quality gas ($)
Digester System Type Modified Mix Plug Flow Modified Mix Plug Flow Modified Mix Plug Flow
Generator Nameplate Capacity (kW) 943 kW. Note that this is a theoretical case assuming all digester gas is sent to the engine-generator to produce electricity and that digester operating hours are equal to engine operating hours . Lately, the digester gas is partly used for space and process heating - to run an absorption chiller for air conditioning, to heat water for radiant floor heating, to heat the digester, etc. The engine operating hours are about half those of the digester. Lately, approximately 3,892.7 MWh/year of power are produced.
943 kW --
First Full Start Year 2006 2006 2006Total Lactating Cows 7,931 7,931 7,931Total Herd 9,843 9,843 9,843Farm Size (acres) Formed in 1950, IEUA is the water
utility for 242 square miles in western San Bernadino County, including 6 dairies; cities of Chino, Chino Hills, Fontana, Montclair, Ontario and Upland; and surrounding area.
See left. See left.
Location Chino, San Bernardino County, CA Chino, San Bernardino County, CA
Chino, San Bernardino County, CA
Utility SCE SCE SCEDigester and Generator System Design Inland Empire Utilities Agency Inland Empire Utilities Agency Inland Empire Utilities Agency
1A Lagoon 0 0 0B Lagoon Liner 0 0 0C Manure Collection 17,248 17,248 17,248D Vacuum Trailer 438,097 438,097 438,097E Solids Separator/ Grit Removal 731,835 731,835 731,835F Collection Mix Tank 259,944 259,944 259,944
Subtotal 1,447,124 1,447,124 1,447,1242
A Digester/Digester Tank 1,449,938 1,449,938 1,449,938B Lagoon Cover 0 0 0C Digester Heating System 0 0 0D Bacterial Treatment 0 0 0
Subtotal 1,449,938 1,449,938 1,449,9383
A Engine/generator - One Waukesha 7042 at 1,000 kW and One Waukesha 5790 at 850 kW. Both gensets in place prior to this grant, so cost not included.
0 0 0
B Overhaul, repair, and additional components 0 0 0C Engine/generator room or building 0 0 0D Gas Transport 22,611 22,611 22,611E Flare (flare was constructed, not purchased) 0 0 0F Gas Treatment (scrubber, cleaning system) 0 0 0G Controls, panels, meters and instrumentation 69,983 69,983 0H Heat recovery (hot water or other) 0 0 0
Subtotal 92,594 92,594 22,611
Data Inputs for Inland Empire Utilities Agency (IEUA)
Component
Introduction and Capital Costs
Introduction
Manure Collection and Pretreatment
Digester and Gas Production Enhancements
Energy Conversion and Gas Handling

94
IEUA Dairy
4A Excavation, trenching, and grading 200,875 200,875 200,875B Concrete work and materials 34,473 34,473 34,473C Electrical work and materials 0 0 0D Other contractor/subcontractor 23,418 23,418 23,418E Dairy labor used for construction and installation 97,531 97,531 97,531F Transportation, Fuel and Heavy Equipment Rental 13,131 13,131 13,131G Other Equipment and Materials 4,891 4,891 4,891
Subtotal 374,319 374,319 374,3195
A System Design/Engineering 127,763 127,763 127,763B Other
Subtotal 127,763 127,763 127,7636
A Permits – air 0 0 0B Permits – building 1,426 1,426 1,426C Permits – water 0 0 0D Other (Env. Impact Report) 0 0 0
Subtotal 1,426 1,426 1,4267
A Interconnect Permit and Inspection 0 0 0B Interconnect Equipment req’d by utility 2,493 2,493 0
Subtotal 2,493 2,493 08
A Initial Costs incurred prior to refurbishment - for Construction of initial plug-flow digester system at Regional Plant No. 5. Costs include piping, pumps, SARI capacity for flow/discharge; costs do not include design or generators. For No Subsidy case, remove $80,000 for lagoon excavation and construction, as part of normal dairy operation.
9,400,000 9,320,000 9,320,000
B Other Construction Costs after System Completion 0 0 0
C Tap, Controls, Unique Faclities 160,000D Gas Clean-up and Processing 570,000E SCADA Monitoring 90,000F Pipeline from farm to gas pipeline - 1,000 feet 50,000
Subtotal 9,400,000 9,320,000 10,190,0009
A Construction Financing (e.g., 12 mos by total hard cost by 8% interest by 50% if level draw)
0 512,600 544,500
B Construction Insurance 0 0 0C Other Overhead/Admin 55,791 55,791 55,791D Land 0 0 0
Subtotal 55,791 568,391 600,29110
A Debt Financing Fees – for lender’s legal and accounting costs; possibly loan commitment fee.
0 0 0
B Equity Financing Fees – for organizational fees, tax advice, other legal and accounting for owner/equity investors. This is 1.50% of cost.
0 205,800 218,500
Subtotal 0 205,800 218,50011
A Debt Service Reserve – assume 6 months for private power using project finance (where lenders are secured only by the one project). If Project owner uses balance sheet finance (so lenders are secured by other assets), probably no DSR.
0 0 0
B Working Capital Reserve (estimate) 0 128,200 136,100C Equipment Repair Reserve Initial Payment 0D Other
Subtotal 0 128,200 136,100
12 Total Loaded Cost 12,951,448 13,718,048 14,568,072
Associated Construction Costs
Permanent Take-out Financing
Reserves
General Construction
System Design/Engineering
Permits
Utility Interconnect
Other Construction Costs after System Completion and Pipeline-Quality Gas Equipment. This plant starts up in 2006 so assume construction is 2005 . Deescalate by one year's inflation per year if startup is before 2006.

95
IEUA Dairy
Component
Inland Empire Utilities Agency Actual Case
Inland Empire Utilities Agency power case with no
subsidies
Inland Empire Utilities Agency pipeline-quality gas
case w/ no subsidies
1 Senior Debt $0 $0 $02 Junior Debt 0 0 03 Grant - $773,175 credits at $0.057/kWh for output over
2,829,480 kWh (from 380 kW-capacity existing) for 5 years
0 0 0
4 Second Grant - from CEC 175,000 0 05 Equity 12,776,448 13,718,048 14,568,072
Total $12,951,448 $13,718,048 $14,568,072
Component
Inland Empire Utilities Agency Actual Case
Inland Empire Utilities Agency power case with no
subsidies
Inland Empire Utilities Agency pipeline-quality gas
case w/ no subsidies
1 Contract Term (years) 20 20 202 Inflation Rate (%) 2.50% 2.50% 2.50%
Power Production: Gross Rated Capacity (kW for Power; 943 943 384.185185 Mcf/day for Gas - inlet)
Gas Processing Losses (%) 0.00% 0.00% 15.00% In-Plant Use (%) 0.00% 0.00% 0.00% Net Rated Capacity (kW or Mcf/day) 943 943 326.557Capacity Wholesale to Utility (kW or Mcf/day) 0 943 326.557Capacity Retail to Steam Host (kW or Mcf/day) 943 0 0Actual Hours/Year 8,760.00 8,760.00 8,760.00Forced Outage Hours 547.50 547.50 276.00Planned Outage Hours 182.50 182.50 600.00Hours of Operation after Outages - IEUA states that opeating hours refer to the digester.
8,030.00 8,030.00 7,884.00
Capacity Factor (%) after Outages 91.67% 91.67% 90.00%
6 Any Curtailment by Power Purchaser on top of outages? (%)
0.00% 0.00% 0.00%
Net Power or Gas Produced for Sale 7,572.29 7,572.29 69,513.62(thou kWh/yr or mm Btu/yr)Percent Sold Retail; 100.00% 0.00% 0.00%Percent Sold Wholesale to Utility 0.00% 100.00% 100.00%Steam Produced for Sale: This thermal production per year is
the quantity reported in Wurdco's August 2006 report, which refers to start-up. Lately, thermal production is greater and power production is less than that shown here.
Unfired capacity rate (mlb/hr) 0.5828221 0.0000 0.0000Full load operating hours/yr 8,030.00 8,030.00 7,884.00Unfired Capacity (mlb/yr) 4,680.1 0.0 0.0
10 Auxiliary Firing: - Auxfired Capacity (mlb/yr) 0 0 011 Boiler Steam: - Boiler Capacity (mlb/yr) 0 0 0
Retail Electricity Prices:Energy (cents/kWh) 8.00 n/a n/a escalating by (%/year) 2.50% 2.50% 2.50%Demand ($/kW-capacity/month) $0.00 n/a n/a escalating by (%/year) 1.50% 1.50% 1.50%Utility Electricity or Gas Prices:Energy (cents/kWh or $/mm Btu) 4.00 33.50 38.30 escalating by (%/year) 2.50% 0.00% 0.00%Demand ($/kW-capacity/month) $0.00 n/a n/a escalating by (%/year) 1.50% 0.00% 0.00%
9
12
13
4
5
7
8
3
Sources of Funds
Performance and Annual Operating Expenses

96
IEUA Dairy
Retail Steam Prices #1:Variable ($/mlb) $13.12 n/a n/a escalating by (%/year) 2.50% 2.50% 2.50%Fixed ($mlb or other) $0.00 $0.00 $0.00 escalating by (%/year) 1.50% 1.50% 1.50%Retail Steam Prices #2:Variable ($/mlb) escalating by (%/year) 2.50% 2.50% 2.50%Fixed ($mlb or other) escalating by (%/year) 1.50% 1.50% 1.50%
16 Byproduct Sales – Tipping Fee per year for manure $18,600 $18,600 $18,600 escalating by (%/year) 2.50% 2.50% 2.50%Fuel Consumed:Plant Heat Rate (Btu/net kWh sold, power; 12,000 12,000 1.307190 Btu in/Btu sold, gas). For power, 12,000 is PERI/IEUA initial ballpark estimate. Fuel Needed (mm Btu/yr) 90,867.48 90,867.48 90,867.51Adjustments and Conversion Factors:Fuel #1 Dairy Manure Dairy Manure Dairy ManureMM Btu/Mcf 0.648 0.648 0.648Fuel #2 Natural Gas Natural Gas Natural GasMM Btu/Mcf 1.020 1.020 1.020(Fuel #2 is not used, so moot.)
19 Annual Heat Rate IncreaseFuel #1 0.00% 0.10% 0.00%Fuel #2 0.00% 0.10% 0.00%Fuel #1 Percentage 100.00% 100.00% 100.00%Fuel #1 Consumption (mm Btu/hr) 11.3160 11.3160 11.5256Fuel #2 Consumption (mm Btu/hr) 0.0000 0.0000 0.0000Hours/year 8,030 8,030 7,884Total Consumption (mm Btu/yr) 90,867.48 90,867.48 90,867.51Auxiliary Fired Fuel: from Fuel #1, #2Total Consumption (mm Btu/yr) 0 0 0Boiler Fuel 0 0 0
22 Fuel Limit based upon Total HerdBiogas Potential at 90 cf per animal in total herd/dy (cf/day)
885,870 885,870 885,870
Biogas Potential (mm Btu/yr) 209,525.97 209,525.97 209,525.97 -- -- --
23 Fuel #1 Unit Price $0.00 $0.00 $0.0024 Fuel #2 Unit Price $0.00 $0.00 $0.0025 Host Standby Demand Payment to Utility: 0 0 0
Annual Expenses, that escalate with inflation unless otherwise indicated
26 Service27 Operations and Maintenance $629,666.00 $629,666.00 $629,666.0028 Consumables29 Operator30 Admin/Compliance31 Royalty (% of revenues) 0.00% 0.00% 0.00%
15
17
18
20
21
14

97
IEUA Dairy
Property Tax (% of depreciable base). IEUA is a tax-exempt public agency.
0.00% 0.00% 0.00%
escalating by (%/year), Proposition 13 2.00% 2.00% 2.00% where base declines by (%/year) 4.00% 4.00% till hits a remainder of (%). 30.00% 30.00%Insurance (% of depreciable base, escalating with inflation to achieve replacement value)
0.00% 0.60% 0.60%
escalating by (%/year) 2.50% 2.50% 2.50%34 Major Maintenance Repair and Overhaul Fund. Assume
some percentage of depreciable base as overhaul every 5, 7, or 10 years. The overhaul amount is escalated by inflation to find the sum needed by the end of year 5, 7, or 10. If 7, one seventh of that amount is saved each year and deposited to a reserve fund and, after performing the overhaul, repair depreciation is taken, straight-line, over the next seven years.
35 Other36 Other37 Gas Monitoring ($/year) 0 0 10,00038 Final Note: Important Facts that may help to optimize
project. The two engine-generators are sized at 1,850 kW, but Regional Plant No. 5 (RP-5) digester/biogas capacity is 943 kW. (It was 380 initially, with expansion work under this grant at 563 kW.) Expected construction costs nearly tripled from time of application (~2003) to construction. Further, all $9.3 million cost for the initial plug-flow digester is included, although some of the early equipment was discarded. Wurdco's Aug 2006 report showed the plant in start-up with a 17% capacity factor. In 2006, Wurdco said power production was so low, the plant did not pass the limit where it would earn an incentive payment (if production is over 2,829,480 kWh/yr or 380 kW). Unclear if the plant has now received this payment. In addition, Wurdco describes an iron sponge as part of H2S scrubber, where media is changed periodically, adding to op. expense.
32
33
Discussion with IEUA in early 2008 said operating hours are now over 90%. That is, annual operating hours for the digester are 8,030. The case presented here assumes all gas is sent to the engine-generator, so operating hours for the engine-generator match those of the digester. In reality, IEUA uses much of the digester gas for thermal applications (e.g., to run an absorption chiller for air conditioning, to heat water for radiant floor heating, to heat the digester). In reality, operating hours for the engine-generator are about half those of the digester and 3,892.725 MWh/year of electricity is produced. The case presented here is somwhat theoretical.

98
Table A‐ 3 Actual On‐Site Power LCOEs
Engineering Assumptions and Cash Flow Results for Actual electric power cases.
Dairy Name Size (kW)
Plant Capacity
Factor (%)
Nominal Levelized
Power Revenues ($/kWh in
2007$)
Nominal Levelized after-tax O&M** Cost
($/kWh in 2007$)
Nominal Levelized
Capital Cost of manure to electricity ($/kWh in
2007$)
Constant Levelized Revenues ($/kWh in
2007$)
Constant Levelized after-tax O&M** Cost
($/kWh in 2007$)
Constant Levelized
Capital Cost of manure to electricity ($/kWh in
2007$)1 Hilarides Dairy 500.0 77.23%
covered lagoontotal 0.0643 0.0045 0.0598 0.0524 0.0037 0.0487 retail 0.0736 0.0600
wholesale 0.0491 0.0400 2 Cottonwood (Gallo Cattle) 300.0 81.17%
covered lagoontotal 0.0940 0.0434 0.0506 0.0767 0.0354 0.0413 retail 0.0940 0.0767
wholesale 0.0000 0.0000 3 Blakes Landing Dairy 75.0 38.48%
covered lagoontotal 0.1409 0.0116 0.1293 0.1149 0.0095 0.1054 retail 0.1509 0.1230
wholesale 0.1257 0.1025 4 Castelanelli Bros. Dairy 160.0 81.00% O&M + Engine rebuild O&M + Engine rebuild
covered lagoontotal 0.0817 0.0094 0.0723 0.0666 0.0077 0.0589 retail 0.0910 0.0742
wholesale 0.0724 0.0590 5 Koetsier Dairy 260.0 23.70%
plug flowtotal 0.0648 0.0364 0.0284 0.0529 0.0296 0.0233 retail 0.0736 0.0600
wholesale 0.0368 0.0300 6 Van Ommering Dairy 130.0 42.98%
plug flowtotal 0.0613 0.0267 0.0346 0.0500 0.0218 0.0282 retail 0.0613 0.0500
wholesale 0.0613 0.0500
7 Meadowbrook Dairy 160.0 78.52%O&M, oil change +
Engine rebuildO&M, oil change +
Engine rebuildplug flow
total 0.0673 0.0271 0.0402 0.0549 0.0221 0.0328 retail 0.0754 0.0615
wholesale 0.0503 0.0410 8 Lourenco Dairy No operational data No operating data.
9 IEUA 943.0 91.67%modified mix plug flow - Assume output is mostly power, that engine-generator hours equal digester operating hours.
total 0.0981 0.1020 (0.0039) 0.0800 0.0832 (0.0032)retail 0.0981 0.0800
wholesale 0.0000 0.0000 10 Eden-Vale Dairy 180.0 29.00%
plug flowtotal 0.0449 0.0286 0.0163 0.0366 0.0233 0.0133 retail 0.0859 0.0700
wholesale 0.0368 0.0300 * For all tables, heat rate does not matter to cost results, because the fuel is free. Fuel consumed is reported for information's sake with earnings. With a low heat rate, less gas is flared and/or the engine-generator is more efficient.** after-tax O&M is O&M multiplied by (1 - 40.75% combined tax rate) for all cases except IEUA, which is tax-free.*** Dairy Methane Digester System Program Evaluation Report, Dairy Power Production Program; prepared by WURD, August 2006.

99
Table A‐ 4 No Subsidy Power LCOEs
Engineering Assumptions and Cash Flow Results for "No Subsidy" electric power.
Dairy Name Size (kW)
Plant Capacity
Factor (%)
Nominal Levelized
Power Revenues ($/kWh in
2007$)
Nominal Levelized after-tax O&M* Cost
($/kWh in 2007$)
Nominal Levelized
Capital Cost of manure to electricity ($/kWh in
2007$)
Constant Levelized Revenues ($/kWh in
2007$)
Constant Levelized after-tax O&M* Cost
($/kWh in 2007$)
Constant Levelized
Capital Cost of manure to electricity ($/kWh in
2007$)1 Hilarides Dairy 500.0 77.23%
covered lagoontotal 0.1016 0.0045 0.0971 0.0828 0.0037 0.0791
1a Hilarides Dairy 500.0 77.23%total 0.0349 0.0045 0.0304 0.0284 0.0037 0.0247
2 Cottonwood (Gallo Cattle) 300.0 81.17%covered lagoon
total 0.3546 0.0434 0.3112 0.2891 0.0354 0.2537 2a Cottonwood (Gallo Cattle) 300.0 81.17%
total 0.1565 0.0434 0.1131 0.1276 0.0354 0.0922 3 Blakes Landing Dairy 75.0 38.48%
covered lagoontotal 0.3719 0.0116 0.3603 0.3032 0.0095 0.2937
3a Blakes Landing Dairy 75.0 38.48%total 0.1177 0.0116 0.1061 0.0959 0.0095 0.0864
4 Castelanelli Bros. Dairy 160.0 81.00%covered lagoon
total 0.2269 0.0094 0.2175 0.1850 0.0077 0.1773 4a Castelanelli Bros. Dairy 160.0 81.00%
total 0.0756 0.0094 0.0662 0.0617 0.0077 0.0540 5 Koetsier Dairy 260.0 83.45%
plug flow adjustedtotal from 23.7% 0.2040 0.0115 0.1925 0.1663 0.0094 0.1569
5a Koetsier Dairy 260.0 83.45%total 0.0718 0.0115 0.0603 0.0585 0.0094 0.0491
6 Van Ommering Dairy 130.0 83.45%plug flow adjusted
total from 43.0% 0.2614 0.0161 0.2453 0.2131 0.0131 0.2000 6a Van Ommering Dairy 130.0 83.45%
total 0.0933 0.0161 0.0772 0.0760 0.0131 0.0629 7 Meadowbrook Dairy 160.0 78.52%
plug flowtotal 0.2763 0.0271 0.2492 0.2253 0.0221 0.2032
7a Meadowbrook Dairy 160.0 78.52%total 0.1124 0.0271 0.0853 0.0917 0.0221 0.0696
8 Lourenco Dairy No operational data No operating data.
9 IEUA 943.0 91.67%modified mix plug flow
total 0.3434 0.1020 0.2414 0.2799 0.0832 0.1967 9a IEUA 943.0 91.67%
total 0.2122 0.1020 0.1102 0.1730 0.0832 0.0898 10 Eden-Vale Dairy 180.0 83.45%
plug flow adjustedtotal from 29.0% 0.1763 0.0116 0.1647 0.1437 0.0095 0.1342
10a Eden-Vale Dairy 180.0 83.45%total 0.0646 0.0116 0.0530 0.0526 0.0095 0.0431
* after-tax O&M is O&M multiplied by (1 - 40.75% combined tax rate) for all cases except IEUA, which is tax-free.

100
Table A‐ 5 No Subsidy Pipeline‐Quality Gas LCOEs
Engineering Assumptions and Cash Flow Results for specific objective 2 - "No Subsidy" pipeline quality gas.
Dairy Name
Digester Size;
Net Gas Prod'n
(Mcf/day - inlet)
Plant Capacity
Factor (%)
Nominal Levelized Gas
Revenues ($/therm in
2007$)
Nominal Levelized after-tax O&M* Cost ($/therm in 2007$)
Nominal Levelized
Capital Cost of manure to gas
($/therm in 2007$)
Constant Levelized Revenues ($/therm in
2007$)
Constant Levelized after-tax O&M* Cost ($/therm in 2007$)
Constant Levelized
Capital Cost of manure to gas
($/therm in 2007$)
1 Hilarides Dairy 232.7 90.00%covered lagoon 197.8
total or wholesale 1.2452 0.0676 1.1776 1.0152 0.0551 0.9601 1a Hilarides Dairy 232.7 90.00%
total or wholesale 197.8 0.4391 0.0676 0.3715 0.3580 0.0551 0.3029 2 Cottonwood (Gallo Cattle) 113.0 90.00%
covered lagoon 96.0 total or wholesale 4.8009 0.5106 4.2903 3.9141 0.4163 3.4978
2a Cottonwood (Gallo Cattle) 113.0 90.00%total or wholesale 96.0 2.0147 0.5106 1.5041 1.6425 0.4163 1.2262
3 Blakes Landing Dairy 14.8 90.00%covered lagoon 12.6
total or wholesale 34.3996 0.3898 34.0098 28.0453 0.3178 27.7275 3a Blakes Landing Dairy 14.8 90.00%
total or wholesale 12.6 9.9448 0.3898 9.5550 8.1078 0.3178 7.7900 4 Castelanelli Bros. Dairy 89.1 90.00%
covered lagoon 75.8 total or wholesale 4.2330 0.1033 4.1297 3.4511 0.0842 3.3669
4a Castelanelli Bros. Dairy 89.1 90.00%total or wholesale 75.8 1.2967 0.1033 1.1934 1.0572 0.0842 0.9730
5 Koetsier Dairy 126.2 90.00%plug flow 107.3
total or wholesale 2.9222 0.1511 2.7711 2.3824 0.1232 2.2592 5a Koetsier Dairy 126.2 90.00%
total or wholesale 107.3 1.0141 0.1511 0.8630 0.8268 0.1232 0.7036 6 Van Ommering Dairy 52.0 90.00%
plug flow 44.2 total or wholesale 4.0252 0.2342 3.7910 3.2817 0.1909 3.0908
6a Van Ommering Dairy 52.0 90.00%total or wholesale 44.2 1.4219 0.2342 1.1877 1.1592 0.1909 0.9683
7 Meadowbrook 80.5 90.00%plug flow 68.4
total or wholesale 3.2256 0.0949 3.1307 2.6298 0.0774 2.5524 7a Meadowbrook 80.5 90.00%
total or wholesale 68.4 1.0181 0.0949 0.9232 0.8300 0.0774 0.7526
8 Lourenco Dairy No operational data No operating data.
9 IEUA 384.2 90.00%modified mix plug flow 326.6
total or wholesale 4.0043 1.1513 2.8530 3.2646 0.9386 2.3260 9a IEUA 384.2 90.00%
total or wholesale 326.6 2.4465 1.1513 1.2952 1.9946 0.9386 1.0560 10 Eden-Vale Dairy 88.2 90.00%
plug flow 74.9 total or wholesale 2.8124 0.1691 2.6433 2.2929 0.1379 2.1550
10a Eden-Vale Dairy 88.2 90.00%total or wholesale 74.9 1.0037 0.1691 0.8346 0.8183 0.1379 0.6804
* after-tax O&M is O&M multiplied by (1 - 40.75% combined tax rate) for all cases except IEUA, which is tax-free.

101
Table A‐ 6 No Subsidy, Enhanced Environmental Quality Power LCOEs
Engineering Assumptions and Cash Flow Results for "No Subsidy" electric power, produced in an Environmentally Superior Way.
Dairy Name Size (kW)
Plant Capacity
Factor (%)
Nominal Levelized
Power Revenues ($/kWh in
2007$)
Nominal Levelized after-tax O&M* Cost
($/kWh in 2007$)
Nominal Levelized
Capital Cost of manure to electricity ($/kWh in
2007$)
Constant Levelized Revenues ($/kWh in
2007$)
Constant Levelized after-tax O&M* Cost
($/kWh in 2007$)
Constant Levelized
Capital Cost of manure to electricity ($/kWh in
2007$)1 Hilarides Dairy 500.0 77.23%
covered lagoontotal 0.1855 0.0060 0.1795 0.1513 0.0049 0.1464
2 Cottonwood (Gallo Cattle) 300.0 81.17%covered lagoon
total 0.4486 0.0458 0.4028 0.3657 0.0374 0.3283 3 Blakes Landing Dairy 75.0 38.48%
covered lagoontotal 0.4465 0.0318 0.4147 0.3640 0.0259 0.3381
4 Castelanelli Bros. Dairy 160.0 81.00%covered lagoon
total 0.2879 0.0139 0.2740 0.2347 0.0114 0.2233 5 Koetsier Dairy 260.0 83.45%
plug flow adjustedtotal from 23.7% 0.2132 0.0141 0.1991 0.1738 0.0115 0.1623
6 Van Ommering Dairy 130.0 83.45%plug flow adjusted
total from 43.0% 0.2768 0.0214 0.2554 0.2256 0.0175 0.2081 7 Meadowbrook Dairy 160.0 78.52%
plug flowtotal 0.2910 0.0317 0.2593 0.2373 0.0258 0.2115
8 Lourenco Dairy No operational data No operating data.
9 IEUA 943.0 91.67%modified mix plug flow
total 0.3454 0.1031 0.2423 0.2816 0.0841 0.1975 10 Eden-Vale Dairy 180.0 83.45%
plug flow adjustedtotal from 29.0% 0.1886 0.0155 0.1731 0.1538 0.0126 0.1412
* after-tax O&M is O&M multiplied by (1 - 40.75% combined tax rate) for all cases except IEUA, which is tax-free.

102
Table A‐ 7 No Subsidy, Enhanced Environmental Quality Pipeline‐Quality Gas LCOEs
Engineering Assumptions and Cash Flow Results for "No Subsidy" pipeline quality gas, produced in an environmentally superior way.
Dairy Name
Digester Size;
Net Gas Prod'n
(Mcf/day - inlet)
Plant Capacity
Factor (%)
Nominal Levelized Gas
Revenues ($/therm in
2007$)
Nominal Levelized after-tax O&M* Cost ($/therm in 2007$)
Nominal Levelized
Capital Cost of manure to gas
($/therm in 2007$)
Constant Levelized Revenues ($/therm in
2007$)
Constant Levelized after-tax O&M* Cost ($/therm in 2007$)
Constant Levelized
Capital Cost of manure to gas
($/therm in 2007$)
1 Hilarides Dairy 232.7 90.00%covered lagoon 197.8
total or wholesale 2.0962 0.0829 2.0133 1.7090 0.0676 1.6414 2 Cottonwood (Gallo Cattle) 113.0 90.00%
covered lagoon 96.0 total or wholesale 5.8190 0.5366 5.2824 4.7441 0.4375 4.3066
3 Blakes Landing Dairy 14.8 90.00%covered lagoon 12.6
total or wholesale 35.1283 0.5841 34.5442 28.6395 0.4762 28.1633 4 Castelanelli Bros. Dairy 89.1 90.00%
covered lagoon 75.8 total or wholesale 4.6831 0.1367 4.5464 3.8180 0.1114 3.7066
5 Koetsier Dairy 126.2 90.00%plug flow 107.3
total or wholesale 3.0110 0.1775 2.8335 2.4548 0.1447 2.3101 6 Van Ommering Dairy 52.0 90.00%
plug flow 44.2 total or wholesale 4.1715 0.2870 3.8845 3.4010 0.2340 3.1670
7 Meadowbrook 80.5 90.00%plug flow 68.4
total or wholesale 3.3542 0.1342 3.2200 2.7346 0.1094 2.6252 8 Lourenco Dairy No operational data No operating data.
9 IEUA 384.2 90.00%modified mix plug flow 326.6
total or wholesale 4.0252 1.1639 2.8613 3.2817 0.9489 2.3328 10 Eden-Vale Dairy 88.2 90.00%
plug flow 74.9 total or wholesale 2.9274 0.2073 2.7201 2.3867 0.1690 2.2177
* after-tax O&M is O&M multiplied by (1 - 40.75% combined tax rate) for all cases except IEUA, which is tax-free.

103
Table A‐ 8 Carbon Credit and PTC Power LCOEs
Engineering Assumptions and Cash Flow Results for carbon credit and carbon credit and Section 45 PTC sensitivity cases for "No Subsidy" electric power.
Dairy Name Size (kW)
Plant Capacity
Factor (%)
Nominal Levelized
Power Revenues ($/kWh in
2007$)
Nominal Levelized after-tax O&M* Cost
($/kWh in 2007$)
Nominal Levelized
Capital Cost of manure to electricity ($/kWh in
2007$)
Constant Levelized Revenues ($/kWh in
2007$)
Constant Levelized after-tax O&M* Cost
($/kWh in 2007$)
Constant Levelized
Capital Cost of manure to electricity ($/kWh in
2007$)1 Hilarides Dairy 500.0 77.23%
covered lagoontotal w/ carbon credit 0.0832 0.0045 0.0787 0.0679 0.0037 0.0642
1a Hilarides Dairy 500.0 77.23%total w/ carbon credit & PTC 0.0680 0.0045 0.0635 0.0554 0.0037 0.0517
2 Cottonwood (Gallo Cattle) 300.0 81.17%covered lagoon
total w/ carbon credit 0.3373 0.0434 0.2939 0.2750 0.0354 0.2396 2a Cottonwood (Gallo Cattle) 300.0 81.17%
total w/ carbon credit & PTC 0.3225 0.0434 0.2791 0.2630 0.0354 0.2276 3 Blakes Landing Dairy 75.0 38.48%
covered lagoontotal w/ carbon credit 0.3520 0.0116 0.3404 0.2869 0.0095 0.2774
3a Blakes Landing Dairy 75.0 total w/ carbon credit & PTC
4 Castelanelli Bros. Dairy 160.0 81.00%covered lagoon
total w/ carbon credit 0.2028 0.0094 0.1934 0.1653 0.0077 0.1576 4a Castelanelli Bros. Dairy 160.0 81.00%
total w/ carbon credit & PTC 0.1870 0.0094 0.1776 0.1525 0.0077 0.1448 5 Koetsier Dairy 260.0 83.45%
plug flow adjustedtotal w/ carbon credit from 23.7% 0.1855 0.0115 0.1740 0.1513 0.0094 0.1419
5a Koetsier Dairy 260.0 83.45%total w/ carbon credit & PTC 0.1702 0.0115 0.1587 0.1387 0.0094 0.1293
6 Van Ommering Dairy 130.0 83.45%plug flow adjusted
total w/ carbon credit from 43.0% 0.2419 0.0161 0.2258 0.1972 0.0131 0.1841 6a Van Ommering Dairy 130.0
total w/ carbon credit & PTC7 Meadowbrook Dairy 160.0 78.52%
plug flowtotal w/ carbon credit 0.2543 0.0271 0.2272 0.2073 0.0221 0.1852
7a Meadowbrook Dairy 160.0 78.52%total w/ carbon credit & PTC 0.2395 0.0271 0.2124 0.1953 0.0221 0.1732
8 Lourenco Dairy No operational data No operating data.
9 IEUA 943.0 91.67%modified mix plug flow
total w/ carbon credit 0.3260 0.1020 0.2240 0.2657 0.0832 0.1825 9a IEUA 943.0
total w/ carbon credit & PTC10 Eden-Vale Dairy 180.0 83.45%
plug flow adjustedtotal w/ carbon credit from 29.0% 0.1579 0.0116 0.1463 0.1287 0.0095 0.1192
10a Eden-Vale Dairy 180.0 83.45%total w/ carbon credit & PTC 0.1425 0.0116 0.1309 0.1162 0.0095 0.1067
* after-tax O&M is O&M multiplied by (1 - 40.75% combined tax rate) for all cases except IEUA, which is tax-free.

104
Table A‐ 9 Carbon Credit Pipeline‐Quality Gas LCOEs
Engineering Assumptions and Cash Flow Results for carbon credit sensitivity cases for "No Subsidy" pipeline quality gas.
Dairy Name
Digester Size;
Net Gas Prod'n
(Mcf/day - inlet)
Plant Capacity
Factor (%)
Nominal Levelized Gas
Revenues ($/therm in
2007$)
Nominal Levelized after-tax O&M* Cost ($/therm in 2007$)
Nominal Levelized
Capital Cost of manure to gas
($/therm in 2007$)
Constant Levelized Revenues ($/therm in
2007$)
Constant Levelized after-tax O&M* Cost ($/therm in 2007$)
Constant Levelized
Capital Cost of manure to gas
($/therm in 2007$)
1 Hilarides Dairy 232.7 90.00%covered lagoon 197.8
total w/ carbon credit 1.0560 0.0676 0.9884 0.8609 0.0551 0.8058 2 Cottonwood (Gallo Cattle) 113.0 90.00%
covered lagoon 96.0 total w/ carbon credit 4.6080 0.5106 4.0974 3.7569 0.4163 3.3406
3 Blakes Landing Dairy 14.8 90.00%covered lagoon 12.6
total w/ carbon credit 34.2388 0.3898 33.8490 27.9143 0.3178 27.5965 4 Castelanelli Bros. Dairy 89.1 90.00%
covered lagoon 75.8 total w/ carbon credit 4.0294 0.1033 3.9261 3.2851 0.0842 3.2009
5 Koetsier Dairy 126.2 90.00%plug flow 107.3
total w/ carbon credit 2.7288 0.1511 2.5777 2.2247 0.1232 2.1015 6 Van Ommering Dairy 52.0 90.00%
plug flow 44.2 total w/ carbon credit 3.8265 0.2342 3.5923 3.1197 0.1909 2.9288
7 Meadowbrook 80.5 90.00%plug flow 68.4
total w/ carbon credit 3.0327 0.0949 2.9378 2.4725 0.0774 2.3951 8 Lourenco Dairy No operational data No operating data.
9 IEUA 384.2 90.00%modified mix plug flow 326.6
total w/ carbon credit 3.8056 1.1513 2.6543 3.1027 0.9386 2.1641 10 Eden-Vale Dairy 88.2 90.00%
plug flow 74.9 total w/ carbon credit 2.6242 0.1691 2.4551 2.1395 0.1379 2.0016
* after-tax O&M is O&M multiplied by (1 - 40.75% combined tax rate) for all cases except IEUA, which is tax-free.

105
Table A‐ 10 No Subsidy Carbon Credit, PTC and Bonus Depreciation Power LCOEʹs for three plants
Engineering Assumptions and Cash Flow Results for carbon credit, Section 45 PTC, and 50% Bonus Depreciation sensitivity cases for "No Subsidy" electric power.
Dairy Name Size (kW)
Plant Capacity
Factor (%)
Nominal Levelized
Power Revenues ($/kWh in
2007$)
Nominal Levelized after-tax O&M* Cost
($/kWh in 2007$)
Nominal Levelized
Capital Cost of manure to electricity ($/kWh in
2007$)
Constant Levelized Revenues ($/kWh in
2007$)
Constant Levelized after-tax O&M* Cost
($/kWh in 2007$)
Constant Levelized
Capital Cost of manure to electricity ($/kWh in
2007$)1 Hilarides Dairy 500.0 77.23%
covered lagoontotal 0.0636 0.0045 0.0591 0.0518 0.0037 0.0481
2 Cottonwood (Gallo Cattle) 300.0 81.17%covered lagoon
total 0.3079 0.0434 0.2645 0.2511 0.0354 0.2157 3 Meadowbrook Dairy 160.0 78.52%
plug flowtotal 0.2280 0.0271 0.2009 0.1859 0.0221 0.1638
* after-tax O&M is O&M multiplied by (1 - 40.75% combined tax rate) for all cases except IEUA, which is tax-free.
Table A‐ 11 No Subsidy Carbon Credit and Bonus Depreciation Pipeline Quality Gas LCOEʹs for three plants
Engineering Assumptions and Cash Flow Results for carbon credit and 50% Bonus Depreciation sensitivity cases for "No Subsidy" pipeline quality gas.
Dairy Name
Digester Size;
Net Gas Prod'n
(Mcf/day - inlet)
Plant Capacity
Factor (%)
Nominal Levelized Gas
Revenues ($/therm in
2007$)
Nominal Levelized after-tax O&M* Cost ($/therm in 2007$)
Nominal Levelized
Capital Cost of manure to gas
($/therm in 2007$)
Constant Levelized Revenues ($/therm in
2007$)
Constant Levelized after-tax O&M* Cost ($/therm in 2007$)
Constant Levelized
Capital Cost of manure to gas
($/therm in 2007$)
1 Hilarides Dairy 232.7 90.00%covered lagoon 197.8
total 0.9953 0.0676 0.9277 0.8115 0.0551 0.7564 2 Cottonwood (Gallo Cattle) 113.0 90.00%
covered lagoon 96.0 total 4.4151 0.5106 3.9045 3.5996 0.4163 3.1833
3 Meadowbrook 80.5 90.00%plug flow 68.4
total 2.8827 0.0949 2.7878 2.3502 0.0774 2.2728 * after-tax O&M is O&M multiplied by (1 - 40.75% combined tax rate) for all cases except IEUA, which is tax-free.

106
APPENDIX B – Two Financial Cash Flow Model Examples

107
B.1 - Hilarides Dairy – No-Subsidy Power

108
SUMMARY PAGE 0.5 MW Hilarides Dairy -- no subsidy 01/29/08 7:04 PM
Project Assumptions and Operating Results File: CA_3n3Dairy_Biogas_d.xlsCost Figures are in US dollars
Summary Capital Cost per $2,643 = 1,321,723 / 500Start Date 2006 netkW Installed capacityProject Description Hilarides Dairy -- no subsidy Cost per annual kWh $0.391 = 1,321,723 / 3,382,500
Lindsay CA, preliminary cash flow - may change.Finance --
Debt 0 at 7.00% for 12 years; Returns --Secondary Debt 0 at 8.50% for 10 years;Grants 0 1 Pretax Unleveraged IRR 21.63% , over 20 yearsEquity 1,321,723 Net Present Value 1,418,380 , using 8.00% discount rate
--------------- Payback 5 yearsTotal 1,321,723
2 Aftertax Leveraged IRR target 17% 17.01% , over 20 yearsOperations Net Present Value 319,256 , using 12.00% discount rate
Herd employed 6,000 cows on 2,400 acres Payback 5 yearsGross Rated Capacity 500 KWIn-Plant Use 0.00%Net Rated Capacity 500 KW for sale Cost of Energy in currency of 2006 in currency of 2007Capacity Wholesale to Utility 500 KW Power - Retail HostCapacity Retail to Steam Host 0 KW First year $0.0000 /kWh $0.0000 /kWh Contract Term 20 years Nominal levelized $0.0000 /kWh $0.0000 /kWh Inflation Rate 2.50% Constant$ levelized $0.0000 /kWh $0.0000 /kWh
Power - Wholesale UtilityActual Hours/Year 8,760 hours/year First year $0.0991 /kWh $0.1016 /kWh Outages Forced 168.0 hours/year = 7.00 days/yr Nominal levelized $0.0991 /kWh $0.1016 /kWh
Planned 1,827.0 hours/year = 76.13 days/yr Constant$ levelized $0.0808 /kWh $0.0828 /kWh Hours of Operation, after Outages 6,765 hours/year Power - TotalCapacity Factor, after Outages 77.23% First year $0.0991 /kWh $0.1016 /kWh Curtailment by Purchaser, on top 0.00% Nominal levelized $0.0991 /kWh $0.1016 /kWh
Constant$ levelized $0.0808 /kWh $0.0828 /kWh Total Net Plant Annual Electricity sold 3,382.500 thou kWh/year Operating ExpenseTotal Net Plant Annual Electricity sold 9.2671 thou kWh/day 365 days/yr First year $0.0037 /kWh $0.0038 /kWh Percentage Retail 0.00% = 0.0 thou kWh/year 0.000 thou kWh/mo Nominal levelized $0.0044 /kWh $0.0045 /kWh Percentage Wholesale to Utility 100.00% = 3,382.5 thou kWh/year 281.875 thou kWh/mo Constant$ levelized $0.0036 /kWh $0.0037 /kWh
281.875 thou kWh/mo Steam - Retail HostUnfired Capacity Rate (mlb/hr) 0.00 mlb/hr First year $0.00 $/mlb $0.00 $/mlbFull Load Operating Hours 6,765 hours/year Nominal levelized $0.00 $/mlb $0.00 $/mlb
Constant$ levelized $0.00 $/mlb $0.00 $/mlbUnfired Capacity 0 mlb/yr = 0 gal/yr Propane Discount rate employed 8.500% nominal
5.854% constant (with no inflation)Auxiliary Fired Capacity Rate (mlb/hr) 0.0 mlb/hrAuxiliary Fired Hours Factor 100.00%Full Load Operating Hours 1,827 hours/yearAuxiliary Fired Capacity 0 mlb/yr Debt Coverage Ratio (operating income over debt payment)Boiler Capacity Rate (mlb/hr) 0.0 mlb/hr Senior Debt Coverage Ratio 0.000 minimum target 1.20 times for balance sheetFull Load Operating Hours 0 hours/year 0.000 average target 1.40 timesBoiler Capacity 0 mlb/yr
Secondary Debt Coverage Ratio 0.000 minimum Electric Utility SCE select PG&E, SCE, SDG&E, other 0.000 average
----- --- -- - -- ----- --- -- -- --- -- -- --- -- -- -- -- --- -- -- --- -- -- -- -- --- -- -- --- -- ---- --- -- -- --- -- -- --- -- -- --- -- -- --- -- -- --- -- -- --- -- -- --- -- -- --- -- --- --- --- -- -- --- -- -- --- -- -- -- -- --- -- -- --- -- ---- --- -- -- --- -- -- --- -- -- --- -- -- --- -- -- --- -- -- --- -- -- --- -- -- --- --
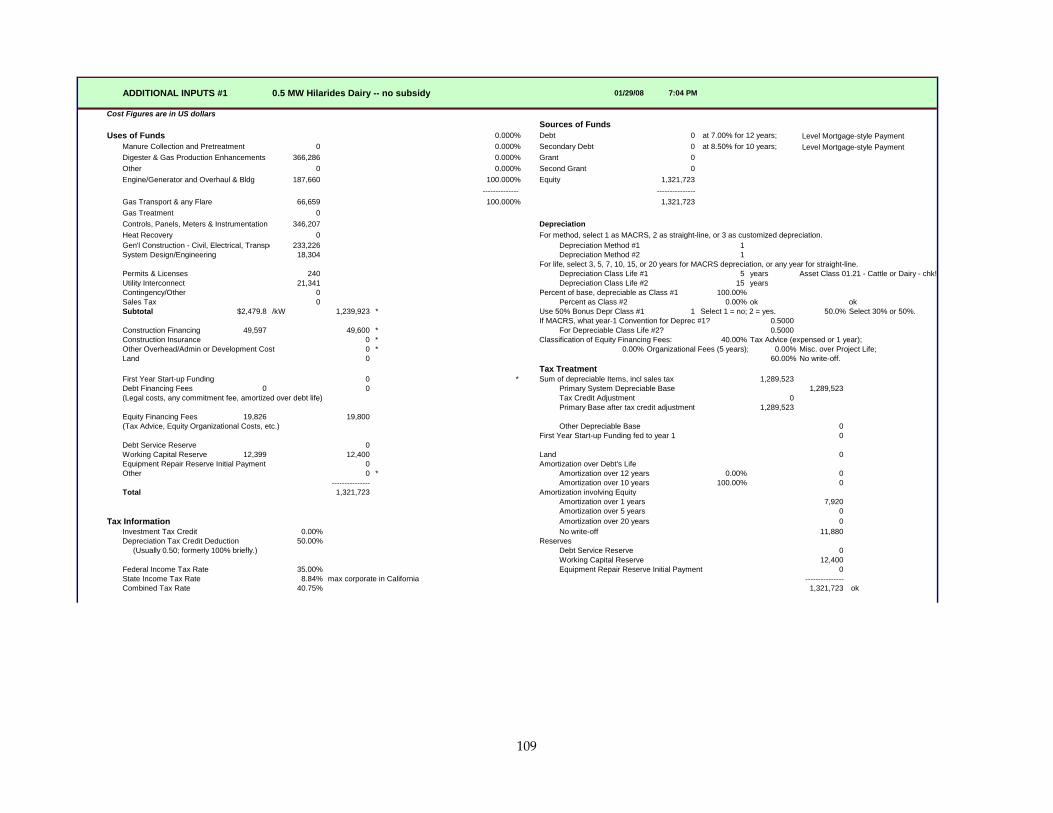
109
ADDITIONAL INPUTS #1 0.5 MW Hilarides Dairy -- no subsidy 01/29/08 7:04 PM
Cost Figures are in US dollarsSources of Funds
Uses of Funds 0.000% Debt 0 at 7.00% for 12 years; Level Mortgage-style PaymentManure Collection and Pretreatment 0 0.000% Secondary Debt 0 at 8.50% for 10 years; Level Mortgage-style PaymentDigester & Gas Production Enhancements 366,286 0.000% Grant 0Other 0 0.000% Second Grant 0Engine/Generator and Overhaul & Bldg 187,660 100.000% Equity 1,321,723
-------------- --------------- Gas Transport & any Flare 66,659 100.000% 1,321,723Gas Treatment 0Controls, Panels, Meters & Instrumentation 346,207 DepreciationHeat Recovery 0 For method, select 1 as MACRS, 2 as straight-line, or 3 as customized depreciation.Gen'l Construction - Civil, Electrical, Transpo 233,226 Depreciation Method #1 1System Design/Engineering 18,304 Depreciation Method #2 1
For life, select 3, 5, 7, 10, 15, or 20 years for MACRS depreciation, or any year for straight-line.Permits & Licenses 240 Depreciation Class Life #1 5 years Asset Class 01.21 - Cattle or Dairy - chk!Utility Interconnect 21,341 Depreciation Class Life #2 15 yearsContingency/Other 0 Percent of base, depreciable as Class #1 100.00%Sales Tax 0 Percent as Class #2 0.00% ok okSubtotal $2,479.8 /kW 1,239,923 * Use 50% Bonus Depr Class #1? 1 Select 1 = no; 2 = yes. 50.0% Select 30% or 50%.
If MACRS, what year-1 Convention for Deprec #1? 0.5000Construction Financing 49,597 49,600 * For Depreciable Class Life #2? 0.5000Construction Insurance 0 * Classification of Equity Financing Fees: 40.00% Tax Advice (expensed or 1 year); Other Overhead/Admin or Development Cost 0 * 0.00% Organizational Fees (5 years); 0.00% Misc. over Project Life; Land 0 60.00% No write-off.
Tax TreatmentFirst Year Start-up Funding 0 * Sum of depreciable Items, incl sales tax 1,289,523Debt Financing Fees 0 0 Primary System Depreciable Base 1,289,523(Legal costs, any commitment fee, amortized over debt life) Tax Credit Adjustment 0
Primary Base after tax credit adjustment 1,289,523Equity Financing Fees 19,826 19,800(Tax Advice, Equity Organizational Costs, etc.) Other Depreciable Base 0
First Year Start-up Funding fed to year 1 0Debt Service Reserve 0Working Capital Reserve 12,399 12,400 Land 0Equipment Repair Reserve Initial Payment 0 Amortization over Debt's LifeOther 0 * Amortization over 12 years 0.00% 0
--------------- Amortization over 10 years 100.00% 0Total 1,321,723 Amortization involving Equity
Amortization over 1 years 7,920Amortization over 5 years 0
Tax Information Amortization over 20 years 0Investment Tax Credit 0.00% No write-off 11,880Depreciation Tax Credit Deduction 50.00% Reserves (Usually 0.50; formerly 100% briefly.) Debt Service Reserve 0
Working Capital Reserve 12,400Federal Income Tax Rate 35.00% Equipment Repair Reserve Initial Payment 0State Income Tax Rate 8.84% max corporate in California --------------- Combined Tax Rate 40.75% 1,321,723 ok

110
ADDITIONAL INPUTS #2 0.5 MW Hilarides Dairy -- no subsidy 01/29/08 7:04 PM
Cost Figures are in US dollars
Revenues and FuelElectric Revenues Adjustments and Conversion Factors
Host Retail Energy Rate 6.0000 cents/kWh Annual Heat Rate Increase 0.10% escalating at 2.50% Fuel #1 Moisure factor 0.00% degrading at 0.10% Fuel #2 Moisure factor 10.00%Host Demand Payment 0.0000 $/kW-capac/mo = $ 0.00/yr escalating at 1.50% MM Btu / Mcf fuel #1 dairy manure 0.523000Host Demand 0 thous kWh/yr MM Btu / Mcf fuel #2 natural gas 1.020000Host Peak Demand 0 kW
Start Year 2006Utility Wholesale Energy Rate 9.9100 cents/kWh Heat Content propane 91,500 Btu/gal escalating at 0.00% Heat Content steam 1,000 Btu/lb degrading at 0.10%Utility Capacity Payment 0.0000 $/kW-capac/mo = $ 0.00/yr escalating at 1.50% Other Expense Assumptions
Other 0.000 $/yearThermal & Other Revenues escalating at 2.00%
Unfired Steam Price (var) 10.000 $/mlb = -- $/gal Standby Demand Payment 0.000 $/kW-capac/mo escalating at 2.50% escalating at 2.50%Unfired Steam Price (fixed) 0 $ = about 0.000 $/mlb Standby Energy Payment 0.000 cents/kWh escalating at 0.00% escalating at 2.50%Auxiliary Fired Steam Price 10.000 $/mlb Host Standby Usage ok 0 kW-capac escalating at 2.50% for 0 months/yearBoiler Steam Price 8.000 $/mlb escalating at 2.50% Other 0.000 $/kW-capac/moOther - Carbon Credits 0 $/year escalating at 2.50% escalating at 2.00%
Fuel Expense Assumptions Service Cost 0.000 cents/kWhFuel #1 Rate 0.000 $/mmBtu = 0.000 $/Mcf escalating at 2.50% escalating at 2.50% assuming 100% availability and 100% run-timeFuel #2 Rate 4.000 $/mmBtu Operations & Maintenance 21,000 $/year = $1,750/mo * 12. escalating at 2.50% escalating at 2.50%
Operator 0 $/yearUnfired Fuel 6,765 hours/year escalating at 2.50%
Total Consumption per year 44,418.990 mmBtu/yr = 84,931.147 Mcf/yrper day @ 365 dy/yr 121.696 mmBtu/dy = 232.688 Mcf/dy Administration/Compliance 0 $/year
Fuel #1 Utilization Rate 100.00% escalating at 2.50%Fuel #1 Consumption 6.5660 mmBtu/hr = 6.57 / (1 - 0.00) Royalty 0.00% % of revenues degrading at 0.10%Plant Heat Rate 13,132 Btu/net kWh sold Adjustment Factor for prop tax, insur 100.00%Fuel #2 Consumption 0.000 mmBtu/hr = 0.00 / (1 - 0.10) Insurance 0.600% % of adj. depreciable base degrading at 0.10% escalating at 2.50%
Property Tax 1.000% % of adj. depreciable baseDairy Cow Statistics escalating at 2.00%
Herd 6,000 cows where base depreciates 4.00% /year, till hits 30.00%Unit Fuel 0.0203 mmBtu/cw/dy 0.0388 Mcf/cow/day
Deposit: Equipment Repair Reserve 0Auxiliary Fired Fuel 1,827 hours/year escalating at 2.50%
Total Consumption 0 mmBtu/yrFuel #1 Utilization Rate 100.00% Interest Earned on Reserves 3.00%Fuel #1 Consumption 0.000 mmBtu/hr = 0.00 / (1 - 0.00) Interest Earned on Working Capital Reserve 0.50%Fuel #2 Consumption 0.000 mmBtu/hr = 0.00 / (1 - 0.10) Year 1 Calendar Fraction 100.00% usually 100%
Factor with 2 debt payments per year 100.00%Boiler Fuel 0 hours/year
Total Consumption 0 mmBtu/yrFuel #1 Utilization Rate 100.00%Fuel #1 Consumption 0.000 mmBtu/hr = 0.0 / (1 - 0.00)Fuel #2 Consumption 0.000 mmBtu/hr = 0.0 / (1 - 0.10)
^^^ ^^^^^^ ^^^ ^^^ ^^^ ^^^ ^^^ ^^ ^^^ ^^^ ^^^ ^^^ ^^^ ^^^ ^^^ ^^̂ ^^ ^^^ ^^^ ^̂ ^^ ^^^ ^^^ ^̂ ^^ ^^^ ^^^ ^̂ ^^ ^^^ ^^^ ^^^ ^^^ ^^^^ ^^^ ^^^ ^^^ ^^^ ^^ ^^^ ^^^ ^^^ ^^̂ ^^ ^^^ ^^^ ^̂ ^^ ^^^ ^^^ ^̂ ^^ ^^^ ^^^ ^̂ ^^ ^^^ ^^^ ^^^ ^^^ ^^ ̂

111
EARNINGS 0.5 MW Hilarides Dairy -- no subsidy 01/29/08 7:04 PM
Cost Figures are in US dollars
project year 0 1 2 3 4 5 6 7 8 9 10year 2005 2006 2007 2008 2009 2010 2011 2012 2013 2014 2015
power sold wholesale (MWh/year) 3,382.50 3,382.50 3,382.50 3,382.50 3,382.50 3,382.50 3,382.50 3,382.50 3,382.50 3,382.50power sold retail (MWh/year) 0.00 0.00 0.00 0.00 0.00 0.00 0.00 0.00 0.00 0.00Unfired Steam (mlb/year) 0.00 0.00 0.00 0.00 0.00 0.00 0.00 0.00 0.00 0.00Auxfired Steam (mlb/year) 0.00 0.00 0.00 0.00 0.00 0.00 0.00 0.00 0.00 0.00Boiler Steam (mlb/year) 0.00 0.00 0.00 0.00 0.00 0.00 0.00 0.00 0.00 0.00Fuel #1 Consumed (mmBtu/yr) 44,419 44,463 44,508 44,552 44,597 44,642 44,686 44,731 44,776 44,820Fuel #2 Consumed (mm Btu/yr) 0 0 0 0 0 0 0 0 0 0
RevenuesEnergy - wholesale 335,206 335,206 335,206 335,206 335,206 335,206 335,206 335,206 335,206 335,206Capacity - wholesale 0 0 0 0 0 0 0 0 0 0Energy - retail 0 0 0 0 0 0 0 0 0 0Capacity - retail 0 0 0 0 0 0 0 0 0 0
Unfired Steam - variable 0 0 0 0 0 0 0 0 0 0Unfired Steam - fixed 0 0 0 0 0 0 0 0 0 0Auxfired Steam 0 0 0 0 0 0 0 0 0 0Boiler Steam 0 0 0 0 0 0 0 0 0 0Other - Carbon Credits 0 0 0 0 0 0 0 0 0 0
Total Revenues 335,206 335,206 335,206 335,206 335,206 335,206 335,206 335,206 335,206 335,206
Operating CostsFuel #1 Costs 0 0 0 0 0 0 0 0 0 0Fuel #2 Costs 0 0 0 0 0 0 0 0 0 0Other 0 0 0 0 0 0 0 0 0 0Standby Demand Payment 0 0 0 0 0 0 0 0 0 0Standby Energy Payment 0 0 0 0 0 0 0 0 0 0Other 0 0 0 0 0 0 0 0 0 0Service Cost 0 0 0 0 0 0 0 0 0 0
Operations & Maintenance 21,000 21,525 22,063 22,615 23,180 23,760 24,354 24,962 25,586 26,226Operator 0 0 0 0 0 0 0 0 0 0Administration/Compliance 0 0 0 0 0 0 0 0 0 0Royalty 0 0 0 0 0 0 0 0 0 0Insurance 7,737 7,931 8,129 8,332 8,540 8,754 8,973 9,197 9,427 9,663Property Tax 12,895 12,627 12,343 12,042 11,725 11,390 11,037 10,665 10,274 9,863
Total Operating Expenses 41,632 42,083 42,535 42,989 43,445 43,903 44,363 44,824 45,287 45,752
Operating Income 293,573 293,123 292,671 292,217 291,760 291,302 290,843 290,381 289,918 289,454
Interest Earned on Reserves 62 62 62 62 62 62 62 62 62 62Interest - Loan #1 0 0 0 0 0 0 0 0 0 0Interest - Loan #2 0 0 0 0 0 0 0 0 0 0
Income before Amortization/Depreciation 293,635 293,185 292,733 292,279 291,822 291,364 290,905 290,443 289,980 289,516
Amortization 7,920 0 0 0 0 0 0 0 0 0Depreciation - Primary System 257,905 412,647 247,588 148,553 148,553 74,277 0 0 0 0Depreciation - Secondary System 0 0 0 0 0 0 0 0 0 0Repair Depreciation 0 0 0 0 0 0 0 0 0 0
Before-Tax Income 27,811 (119,462) 45,144 143,726 143,269 217,088 290,905 290,443 289,980 289,51640.746% less: Income Tax Paid (Benefit Received) 11,332 (48,676) 18,395 58,562 58,377 88,455 118,532 118,344 118,155 117,966
Investment Tax Credit received 0 0 0Production Tax Credit received 0 0 0 0 0 0 0 0 0 0
After-Tax Income 16,479 (70,786) 26,750 85,163 84,893 128,633 172,373 172,099 171,825 171,550

112
EARNINGS 0.5 MW Hilarides Dairy -- no subsidy 01/29/08 7:04 PM
Cost Figures are in US dollars
project year 11 12 13 14 15 16 17 18 19 20 21 22year 2016 2017 2018 2019 2020 2021 2022 2023 2024 2025 2026 2027
power sold wholesale (MWh/year) 3,382.50 3,382.50 3,382.50 3,382.50 3,382.50 3,382.50 3,382.50 3,382.50 3,382.50 3,382.50 0.00 0.00power sold retail (MWh/year) 0.00 0.00 0.00 0.00 0.00 0.00 0.00 0.00 0.00 0.00 0.00 0.00Unfired Steam (mlb/year) 0.00 0.00 0.00 0.00 0.00 0.00 0.00 0.00 0.00 0.00 0.00 0.00Auxfired Steam (mlb/year) 0.00 0.00 0.00 0.00 0.00 0.00 0.00 0.00 0.00 0.00 0.00 0.00Boiler Steam (mlb/year) 0.00 0.00 0.00 0.00 0.00 0.00 0.00 0.00 0.00 0.00 0.00 0.00Fuel #1 Consumed (mmBtu/yr) 44,865 44,910 44,955 45,000 45,045 45,090 45,135 45,180 45,225 45,271 0 0Fuel #2 Consumed (mm Btu/yr) 0 0 0 0 0 0 0 0 0 0 0 0
RevenuesEnergy - wholesale 335,206 335,206 335,206 335,206 335,206 335,206 335,206 335,206 335,206 335,206 0 0Capacity - wholesale 0 0 0 0 0 0 0 0 0 0 0 0Energy - retail 0 0 0 0 0 0 0 0 0 0 0 0Capacity - retail 0 0 0 0 0 0 0 0 0 0 0 0
Unfired Steam - variable 0 0 0 0 0 0 0 0 0 0 0 0Unfired Steam - fixed 0 0 0 0 0 0 0 0 0 0 0 0Auxfired Steam 0 0 0 0 0 0 0 0 0 0 0 0Boiler Steam 0 0 0 0 0 0 0 0 0 0 0 0Other - Carbon Credits 0 0 0 0 0 0 0 0 0 0 0 0
Total Revenues 335,206 335,206 335,206 335,206 335,206 335,206 335,206 335,206 335,206 335,206 0 0
Operating CostsFuel #1 Costs 0 0 0 0 0 0 0 0 0 0 0 0Fuel #2 Costs 0 0 0 0 0 0 0 0 0 0 0 0Other 0 0 0 0 0 0 0 0 0 0 0 0Standby Demand Payment 0 0 0 0 0 0 0 0 0 0 0 0Standby Energy Payment 0 0 0 0 0 0 0 0 0 0 0 0Other 0 0 0 0 0 0 0 0 0 0 0 0Service Cost 0 0 0 0 0 0 0 0 0 0 0 0
Operations & Maintenance 26,882 27,554 28,243 28,949 29,672 30,414 31,175 31,954 32,753 33,572 0 0Operator 0 0 0 0 0 0 0 0 0 0 0 0Administration/Compliance 0 0 0 0 0 0 0 0 0 0 0 0Royalty 0 0 0 0 0 0 0 0 0 0 0 0Insurance 9,904 10,152 10,406 10,666 10,932 11,206 11,486 11,773 12,067 12,369 0 0Property Tax 9,432 8,979 8,504 8,007 7,487 6,942 6,373 5,778 5,525 5,636 0 0
Total Operating Expenses 46,217 46,684 47,152 47,622 48,091 48,562 49,033 49,505 50,345 51,576 0 0
Operating Income 288,988 288,521 288,053 287,584 287,114 286,644 286,172 285,701 284,860 283,629 0 0
Interest Earned on Reserves 62 62 62 62 62 62 62 62 62 62 0 0Interest - Loan #1 0 0 0 0 0 0 0 0 0 0 0 0Interest - Loan #2 0 0 0 0 0 0 0 0 0 0 0 0
Income before Amortization/Depreciation 289,050 288,583 288,115 287,646 287,176 286,706 286,234 285,763 284,922 283,691 0 0
Amortization 0 0 0 0 0 0 0 0 0 0 0 0Depreciation - Primary System 0 0 0 0 0 0 0 0 0 0 0 0Depreciation - Secondary System 0 0 0 0 0 0 0 0 0 0 0 0Repair Depreciation 0 0 0 0 0 0 0 0 0 0 0 0
Before-Tax Income 289,050 288,583 288,115 287,646 287,176 286,706 286,234 285,763 284,922 283,691 0 040.746% less: Income Tax Paid (Benefit Received) 117,776 117,586 117,395 117,204 117,013 116,821 116,629 116,437 116,094 115,593 0 0
Investment Tax Credit receivedProduction Tax Credit received 0 0 0 0 0 0 0 0 0 0 0 0
After-Tax Income 171,274 170,997 170,720 170,442 170,163 169,885 169,605 169,326 168,828 168,098 0 0

113
CASH FLOWS 0.5 MW Hilarides Dairy -- no subsidy 01/29/08 7:04 PM
Cost Figures are in US dollars
project year 0 1 2 3 4 5 6 7 8 9 10year 2005 2006 2007 2008 2009 2010 2011 2012 2013 2014 2015
Before-Tax Income 27,811 (119,462) 45,144 143,726 143,269 217,088 290,905 290,443 289,980 289,516
Add Back:First-year Start-up Funding 0 0 0 0 0Amortization 7,920 0 0 0 0 0 0 0 0 0Depreciation 257,905 412,647 247,588 148,553 148,553 74,277 0 0 0 0Repair Depreciation 0 0 0 0 0 0 0 0 0 0Released from Reserves 0 0 0 0 0 0 0 0 0 0Released from Major Maintenance Reserve 0 0 0 0 0 0 0 0 0 0Other 0 0
Total Additions 265,825 412,647 247,588 148,553 148,553 74,277 0 0 0 0
Subtract:Loan #1 Principal 0 0 0 0 0 0 0 0 0 0Loan #2 Principal 0 0 0 0 0 0 0 0 0 0Deposit to Reserve 0 0 0 0 0 0 0 0 0 0Charge for Capitalized Overhaul 0 0 0 0 0 0 0 0 0 0Other 0 0
Total Subtractions 0 0 0 0 0 0 0 0 0 0
Before-Tax Cash 293,635 293,185 292,733 292,279 291,822 291,364 290,905 290,443 289,980 289,516
Income Tax Paid (Benefit Received) 11,332 (48,676) 18,395 58,562 58,377 88,455 118,532 118,344 118,155 117,966Investment Tax Credit Received 0 0 0Production Tax Credit Received 0 0 0 0 0 0 0 0 0 0
After-Tax Cash (1,321,723) 282,304 341,861 274,338 233,716 233,446 202,910 172,373 172,099 171,825 171,550
After-tax IRR 17.01% , using starting estimate of 10.00%
Net Present Value 319,256 , using discount rate of 12.00% for developerPayback 5
1 1 1 1 1 0 0 0 0 0
GrantTotal 0 grant that need not be paid back.

114
CASH FLOWS 0.5 MW Hilarides Dairy -- no subsidy 01/29/08 7:04 PM
Cost Figures are in US dollars
project year 11 12 13 14 15 16 17 18 19 20 21 22year 2016 2017 2018 2019 2020 2021 2022 2023 2024 2025 2026 2027
Before-Tax Income 289,050 288,583 288,115 287,646 287,176 286,706 286,234 285,763 284,922 283,691 0 0
Add Back:First-year Start-up FundingAmortization 0 0 0 0 0 0 0 0 0 0 0 0Depreciation 0 0 0 0 0 0 0 0 0 0 0 0Repair Depreciation 0 0 0 0 0 0 0 0 0 0 0 0Released from Reserves 0 0 0 0 0 0 0 0 0 12,400 0 0Released from Major Maintenance Reserve 0 0 0 0 0 0 0 0 0 0 0 0Other
Total Additions 0 0 0 0 0 0 0 0 0 12,400 0 0
Subtract:Loan #1 Principal 0 0 0 0 0 0 0 0 0 0 0 0Loan #2 Principal 0 0 0 0 0 0 0 0 0 0 0 0Deposit to Reserve 0 0 0 0 0 0 0 0 0 0 0 0Charge for Capitalized Overhaul 0 0 0 0 0 0 0 0 0 0 0 0Other
Total Subtractions 0 0 0 0 0 0 0 0 0 0 0 0
Before-Tax Cash 289,050 288,583 288,115 287,646 287,176 286,706 286,234 285,763 284,922 296,091 0 0
Income Tax Paid (Benefit Received) 117,776 117,586 117,395 117,204 117,013 116,821 116,629 116,437 116,094 115,593 0 0Investment Tax Credit ReceivedProduction Tax Credit Received 0 0 0 0 0 0 0 0 0 0 0 0
After-Tax Cash (1,321,723) 171,274 170,997 170,720 170,442 170,163 169,885 169,605 169,326 168,828 180,498 0 0
0 0 0 0 0 0 0 0 0 0 0 0
GrantTotal

115
COST OF ENERGY 0.5 MW Hilarides Dairy -- no subsidy 01/29/08 7:04 PM
Cost Figures are in US dollars 0 1 2 3 4 5 6 7 8 9 10Total Electric
Total 335,206 335,206 335,206 335,206 335,206 335,206 335,206 335,206 335,206 335,206
3,382,500 kWh/yearNet Present Value 3,172,165 , using 8.500% <--- SET THIS! Might try before-tax rate, from utility's cost of capital, forCurrent $ Levelized 335,206 as Rate * NPV/(1-(1+Rate)^(-n)) standardization across all cases and because utility is
back-up source of powerlev COE/kWh $0.0991 in nominal terms of 2006lev COE/kWh $0.1016 in nominal terms of 2007
1st-yr Cost $0.0991 in nominal terms of 20061st-yr Cost $0.1016 in nominal terms of 2007Constant $ NPV 3,172,165 , as nominalConstant $ Levelized 273,287 , using 5.854%lev COE/kWh $0.0808 in constant terms of 2006lev COE/kWh $0.0828 in constant terms of 2007
Operating Expenses total O&M excl prop tax, insur 21,000 21,525 22,063 22,615 23,180 23,760 24,354 24,962 25,586 26,226
tax effect = O&M * (1-t) adjusted total O&M 12,443 12,754 13,073 13,400 13,735 14,078 14,430 14,791 15,161 15,540
Total 12,443 12,754 13,073 13,400 13,735 14,078 14,430 14,791 15,161 15,540
3,382,500 kWh/yearNet Present Value 140,912 , using 8.500% Fixed Capital CostCurrent $ Levelized 14,890 as Rate * NPV/(1-(1+Rate)^(-n)) Calculated as Total less Op Exp.
lev COE/kWh $0.0044 in nominal terms of 2006 $0.0947 in nominal terms of 2006lev COE/kWh $0.0045 in nominal terms of 2007 $0.0971 in nominal terms of 2007
1st-yr Cost $0.0037 in nominal terms of 2006 $0.0954 in nominal terms of 20061st-yr Cost $0.0038 in nominal terms of 2007 $0.0978 in nominal terms of 2007Constant $ NPV 140,912 , as nominalConstant $ Levelized 12,140 , using 5.854%lev COE/kWh $0.0036 in constant terms of 2006 $0.0772 in constant terms of 2006lev COE/kWh $0.0037 in constant terms of 2007 $0.0791 in constant terms of 2007
^^^ ^^^ ^ ^^^ ^^^ ^^^ ^^^ ^^^ ^^^ ^^^ ^^^ ^ ^^^ ^^^ ^^^ ^^̂ ^^ ^^^ ^^^ ^^̂ ^^ ^^^ ^^^ ^^̂ ^^ ^^^ ^^^ ^^̂ ^^ ^^^ ^^^ ^^̂ ^^ ^^^ ^^^ ^^̂ ^^ ^^^ ^^^ ^^̂ ^^ ^^^ ^^^ ^^̂ ^^ ^^^ ^^^ ^^̂ ^^ ^^^ ^^^ ^^̂ ^^ ^^^ ^^^ ^^̂ ^^ ^^^ ^^^ ^^

116
COST OF ENERGY 0.5 MW Hilarides Dairy -- no subsidy 01/29/08 7:04 PM
Cost Figures are in US dollars 11 12 13 14 15 16 17 18 19 20 21 22Total Electric
Total 335,206 335,206 335,206 335,206 335,206 335,206 335,206 335,206 335,206 335,206 0 0
3,382,500 kWh/year*To figure Discount rate: Utility tax rate 40.00%
Utility debt 50.00% 6.50%preferred 5.00% 6.30%common 45.00% 11.00%
8.52% before-tax weighted average cost of capital
Utility debt 50.00% 60.00% 6.50% 'by (1 - utility combined tax rate)preferred 5.00% 6.30%common 45.00% 11.00%
7.22% after-tax weighted average cost of capital
Operating Expenses total O&M excl 26,882 27,554 28,243 28,949 29,672 30,414 31,175 31,954 32,753 33,572 0 0
tax effect = O&M * (1-t) adjusted total O 15,929 16,327 16,735 17,153 17,582 18,022 18,472 18,934 19,407 19,893 0 0
Total 15,929 16,327 16,735 17,153 17,582 18,022 18,472 18,934 19,407 19,893 0 0
3,382,500 kWh/year
^^^ ^^^ ^ ^^^ ^^^ ^^^ ^^^ ^^^ ^^^ ^^^ ^^^ ^ ^^^ ^^^ ^^^ ^^̂ ^^ ^^^ ^^^ ^^̂ ^^ ^^^ ^^^ ^^̂ ^^ ^^^ ^^^ ^^̂ ^^ ^^^ ^^^ ^^̂ ^^ ^^^ ^^^ ^^̂ ^^ ^^^ ^^^ ^^̂ ^^ ^^^ ^^^ ^^̂ ^^ ^^^ ^^^ ^^̂ ^^ ^^^ ^^^ ^^̂ ^^ ^^^ ^^^ ^^̂ ^^ ^^^ ^^^ ^^̂ ^^ ^^^ ^^^ ^^̂ ^^ ^^^

117
B.2 - Hilarides Dairy – No-Subsidy Pipeline-Quality Gas

118
SUMMARY PAGE 198 Mcf/dy Hilarides Dairy - Pipeline-Quality Gas -- no subsidy 02/22/08 6:44 PM
Project Assumptions and Operating Results File: CA_3n4_gas_Dairy_Biogas_dd.xlsCost Figures are in US dollars
Summary Capital Cost per $7,931,025 = 1,568,589 / 0.198Start Date 2006 mm cubic ft/day (inlet)Project Description Hilarides Dairy - Pipeline-Quality Gas -- no subsidy Cost per annual Mcf (outlet) $47.09 = 1,568,589 / 33,313
Lindsay CA, preliminary cash flow - may change.Finance --
Debt 0 at 7.00% for 12 years; Returns --Secondary Debt 0 at 8.50% for 10 years;Grants 0 1 Pretax Unleveraged IRR 21.64% , over 20 yearsEquity 1,568,589 Net Present Value 1,679,507 , using 8.00% discount rate
--------------- Payback 5 yearsTotal 1,568,589
2 Aftertax Leveraged IRR target 17% 17.01% , over 20 yearsOperations Net Present Value 377,984 , using 12.00% discount rate
Herd employed 6,000 cows on 2,400 acres Payback 5 yearsLactating Cows employed 6,000 cows Digester Gas Production 232.681 Mcf/day (inlet)Processing Losses -15.00% Cost of Energy in currency of 2006 in currency of 2007Gross Sustainable Gas Production 197.779 Mcf/day (inlet)In-Plant Use 0.00% Gas - Wholesale UtilityNet Sustainable Gas Production 197.779 Mcf/day for sale (inlet) First year $1.2148 /therm $1.2452 /thermNet Fuel Output (MM Btu) 103.438 mm Btu/day for sale Nominal levelized $1.2148 /therm $1.2452 /thermCapacity Wholesale to Utility 103.438 mm Btu/day Constant$ levelized $0.9904 /therm $1.0152 /thermContract Term 20 yearsInflation Rate 2.50% Operating Expense
First year $0.0551 /therm $0.0565 /thermActual Hours/Year 8,760 hours/year Nominal levelized $0.0660 /therm $0.0676 /thermOutages Forced 276.0 hours/year = 11.50 days/yr Constant$ levelized $0.0538 /therm $0.0551 /therm
Planned 600.0 hours/year = 25.00 days/yrHours of Operation, after Outages 7,884 hours/year Discount rate employed 8.500% nominalCapacity Factor, after Outages 90.00% 5.854% constant (with no inflation)Curtailment by Purchaser, on top 0.00%
Total Net Plant Annual Gas sold 33,979.5 mm Btu/yearTotal Net Plant Annual Gas sold 93.1 mm Btu/day 365 days/yr Debt Coverage Ratio (operating income over debt payment)
Senior Debt Coverage Ratio 0.000 minimum target 1.20 times for balance sheetMM Btu / Mcf fuel #1 dairy manure 0.5230 0.000 average target 1.40 timesMM Btu / Mcf fuel #2 natural gas 1.0200Total Net Plant Annual Gas sold 33,313.2 Mcf/year (outlet) Secondary Debt Coverage Ratio 0.000 minimum Total Net Plant Annual Gas sold 91.3 Mcf/day (outlet) 0.000 average
---Electric Utility SCE select PG&E, SCE, SDG&E, other
-- --- -- - -- ----- --- -- -- --- -- -- --- -- -- -- -- --- -- -- --- -- -- -- -- --- -- -- --- -- ---- --- -- -- --- -- -- --- -- -- --- -- -- --- -- -- --- -- -- --- -- -- --- -- -- --- -- ----- --- -- -- --- -- -- --- -- -- -- -- --- -- -- --- -- ---- --- -- -- --- -- -- --- -- -- --- -- -- --- -- -- --- -- -- --- -- -- --- -- -- --- --

119
ADDITIONAL INPUTS #1 198 Mcf/dy Hilarides Dairy - Pipeline-Quality Gas -- no subsidy 02/22/08 6:44 PM
Cost Figures are in US dollarsSources of Funds
Uses of Funds 0.000% Debt 0 at 7.00% for 12 years; Level Mortgage-style PaymentManure Collection and Pretreatment 0 0.000% Secondary Debt 0 at 8.50% for 10 years; Level Mortgage-style PaymentDigester & Gas Production Enhancements 366,286 0.000% Grant 0Other 0 0.000% Second Grant 0Engine/Generator and Overhaul & Bldg 0 delete for gas 100.000% Equity 1,568,589
-------------- --------------- Gas Transport & any Flare 66,659 100.000% 1,568,589Gas Treatment 0Controls, Panels, Meters & Instrumentation 0 delete for gasHeat Recovery 0Gen'l Construction - Civil, Electrical, Transpo 0 delete for gasSystem Design/Engineering 18,304 Depreciation
For method, select 1 as MACRS, 2 as straight-line, or 3 as customized depreciation.Permits & Licenses 240 Depreciation Method #1 1Electric Utility Interconnect 0 delete for gas Depreciation Method #2 1Land, for pipeline interconnect 0 For life, select 3, 5, 7, 10, 15, or 20 years for MACRS depreciation, or any year for straight-line.Pipeline, Tap, Controls, Unique Facilities 160,000 Depreciation Class Life #1 5 years Asset Class 01.21 - Cattle or Dairy - chk!Gas Cleanup & Processing 720,000 Depreciation Class Life #2 15 yearsSCADA monitoring 90,000
Percent of base, depreciable as Class #1 100.00%Leachate Monitoring System 0 Percent as Class #2 0.00% ok okDouble Lagoon Liner & Lagoon Cover 0 Use 50% Bonus Depr Class # 1 Select 1 = no; 2 = yes. 50.0% Select 30% or 50%.Contingency/Other 0 If MACRS, what year-1 Convention for Deprec #1? 0.5000Pipeline 50,000 For Depreciable Class Life #2? 0.5000Subtotal $7,440,073 mm cf/day (inle 1,471,489 * Classification of Equity Financing Fees: 40.00% Tax Advice (expensed or 1 year);
0.00% Organizational Fees (5 years); 0.00% Misc. over Project Life; Construction Financing 58,860 58,900 * 60.00% No write-off.Construction Insurance 0 *Other Overhead/Admin or Development Cost 0 *Land 0 Tax Treatment
Sum of depreciable Items, incl sales tax 1,530,389First Year Start-up Funding 0 * Primary System Depreciable Base 1,530,389Debt Financing Fees 0 0 Tax Credit Adjustment 0(Legal costs, any commitment fee, amortized over debt life) Primary Base after tax credit adjustment 1,530,389
Equity Financing Fees 23,529 23,500 Other Depreciable Base 0(Tax Advice, Equity Organizational Costs, etc.) First Year Start-up Funding fed to year 1 0
Debt Service Reserve 0 Land 0Working Capital Reserve 14,715 14,700 Amortization over Debt's LifeEquipment Repair Reserve Initial Payment 0 Amortization over 12 years 0.00% 0Other 0 * Amortization over 10 years 100.00% 0
--------------- Amortization involving Equity Total 1,568,589 Amortization over 1 years 9,400
Amortization over 5 years 0Amortization over 20 years 0
Tax Information No write-off 14,100Investment Tax Credit 0.00%Depreciation Tax Credit Deduction 50.00% Reserves (Usually 0.50; formerly 100% briefly.) Debt Service Reserve 0
Working Capital Reserve 14,700Federal Income Tax Rate 35.00% Equipment Repair Reserve Initial Payment 0State Income Tax Rate 8.84% max corporate in California --------------- Combined Tax Rate 40.75% 1,568,589 ok

120
ADDITIONAL INPUTS #2 198 Mcf/dy Hilarides Dairy - Pipeline-Quality Gas -- no subsidy 02/22/08 6:44 PM
Cost Figures are in US dollars
Revenues and Fuel Adjustments and Conversion FactorsGas Revenues Annual Heat Rate Increase 0.00% note: 0.0% for gas; 0.10% for power.
Utility Wholesale Energy Rate 11.9100 $/mmBtu Fuel #1 Moisure factor 0.00% escalating at 0.00% Fuel #2 Moisure factor 10.00% degrading at 0.00%Utility Capacity Payment 0.0000 $/mmBtu MM Btu / Mcf fuel #1 dairy manure 0.523000 escalating at 1.50% MM Btu / Mcf fuel #2 natural gas 1.020000
Start Year 2006Other Revenues Heat Content propane 91,500 Btu/gal
Other - Byproduct 0 $/year Heat Content steam 1,000 Btu/lb escalating at 2.50%Other - Carbon Credits 0 $/year escalating at 2.00% Other Expense Assumptions
Gas Monitoring 10,000 $/year escalating at 2.50%Standby Demand Payment 0.000 $/kW-capac/mo
Fuel Expense Assumptions escalating at 2.50%Fuel #1 Rate 0.000 $/mmBtu = 0.000 $/Mcf Standby Energy Payment 0.000 cents/kWh escalating at 2.50% escalating at 2.50%Fuel #2 Rate 4.000 $/mmBtu Host Standby Usage ok 0 kW-capac escalating at 2.50% for 0 months/year
Other 0.000 $/kW-capac/mo escalating at 2.50%
Unfired Fuel 7,884 hours/yearTotal Consumption per year 44,417.6 mmBtu/yr = 84,928.6 Mcf/yr (inlet)
per day @ 365 dy/yr 121.7 mmBtu/dy = 232.7 Mcf/dy (inlet) Service Cost 0.000 cents/kWhFuel #1 Utilization Rate 100.00% escalating at 2.50%Fuel #1 Consumption 5.6339 mmBtu/hr = 5.63 / (1 - 0.00) assuming 100% availability and 100% run-time degrading at 0.00% Operations & Maintenance 21,000 $/year = $1,750/mo * 12.Plant Heat Rate 1.30719 Btu in /Btu sold escalating at 2.50%Fuel #2 Consumption 0.000 mmBtu/hr = 0.00 / (1 - 0.10) Operator 0 $/year degrading at 0.00% escalating at 2.50%Processing Loss -15.00% percentage gas lost in upgrading and cleaning
Leachate Monitoring 0 $/year escalating at 2.50%
Dairy Cow Statistics Royalty 0.00% % of revenuesHerd 6,000 cowsLactating Cows 6,000 cows Adjustment Factor for prop tax, insur 100.00%Unit Fuel 0.0203 mmBtu/lac-cw 0.0388 Mcf/lac-cow/day Insurance 0.600% % of adj. depreciable base
escalating at 2.50%Property Tax 1.000% % of adj. depreciable base escalating at 2.00% where base depreciates 4.00% /year, till hits 30.00%
Deposit: Equipment Repair Reserve 0 escalating at 2.50%
Interest Earned on Reserves 3.00%Interest Earned on Working Capital Reserve 0.50%Year 1 Calendar Fraction 100.00% usually 100%Factor with 2 debt payments per year 100.00%
^^^ ^^^^^^ ^^^ ^^^ ^^^ ^^^ ^^^ ^^ ^^^ ^^^ ^^^ ^^^ ^^^ ^^^ ^^^ ^^̂ ^^ ^^^ ^^^ ^̂ ^^ ^^^ ^^^ ^̂ ^^ ^^^ ^^^ ^̂ ^^ ^^^ ^^^ ^^^ ^^^ ^^^ ^^^ ^^^ ^^^ ^^^ ^^ ^^^ ^^^ ^^^ ^^̂ ^^ ^^^ ^^^ ^̂ ^^ ^^^ ^^^ ^̂ ^^ ^^^ ^^^ ^̂ ^^ ^^^ ^^^ ^^^ ^^^ ^^^

121
EARNINGS 198 Mcf/dy Hilarides Dairy - Pipeline-Quality Gas -- no subsidy 02/22/08 6:44 PM
Cost Figures are in US dollars
project year 0 1 2 3 4 5 6 7 8 9 10year 2005 2006 2007 2008 2009 2010 2011 2012 2013 2014 2015
gas sold wholesale (mm Btu/year) 33,979.5 33,979.5 33,979.5 33,979.5 33,979.5 33,979.5 33,979.5 33,979.5 33,979.5 33,979.5
Fuel #1 Consumed (mmBtu/yr) 44,417.6 44,417.6 44,417.6 44,417.6 44,417.6 44,417.6 44,417.6 44,417.6 44,417.6 44,417.6Fuel #2 Consumed (mm Btu/yr) 0.0 0.0 0.0 0.0 0.0 0.0 0.0 0.0 0.0 0.0
RevenuesEnergy - wholesale 404,696 404,696 404,696 404,696 404,696 404,696 404,696 404,696 404,696 404,696Capacity - wholesale 0 0 0 0 0 0 0 0 0 0
Other Byproduct 0 0 0 0 0 0 0 0 0 0Other - Carbon Credits 0 0 0 0 0 0 0 0 0 0
Total Revenues 404,696 404,696 404,696 404,696 404,696 404,696 404,696 404,696 404,696 404,696
Operating CostsFuel #1 Costs 0 0 0 0 0 0 0 0 0 0Fuel #2 Costs 0 0 0 0 0 0 0 0 0 0Gas Monitoring 10,000 10,250 10,506 10,769 11,038 11,314 11,597 11,887 12,184 12,489Standby Demand Payment 0 0 0 0 0 0 0 0 0 0Standby Energy Payment 0 0 0 0 0 0 0 0 0 0Other 0 0 0 0 0 0 0 0 0 0Service Cost 0 0 0 0 0 0 0 0 0 0
Operations & Maintenance 21,000 21,525 22,063 22,615 23,180 23,760 24,354 24,962 25,586 26,226Operator 0 0 0 0 0 0 0 0 0 0Leachate Monitoring 0 0 0 0 0 0 0 0 0 0Royalty 0 0 0 0 0 0 0 0 0 0Insurance 9,182 9,412 9,647 9,888 10,136 10,389 10,649 10,915 11,188 11,467Property Tax 15,304 14,986 14,648 14,292 13,915 13,517 13,098 12,657 12,193 11,705
Total Operating Expenses 55,486 56,172 56,865 57,564 58,269 58,980 59,698 60,421 61,151 61,888
Operating Income 349,210 348,523 347,831 347,132 346,427 345,716 344,998 344,274 343,544 342,808
Interest Earned on Reserves 74 74 74 74 74 74 74 74 74 74Interest - Loan #1 0 0 0 0 0 0 0 0 0 0Interest - Loan #2 0 0 0 0 0 0 0 0 0 0
Income before Amortization/Depreciation 349,283 348,597 347,904 347,206 346,501 345,789 345,072 344,348 343,618 342,882
Amortization 9,400 0 0 0 0 0 0 0 0 0Depreciation - Primary System 306,078 489,724 293,835 176,301 176,301 88,150 0 0 0 0Depreciation - Secondary System 0 0 0 0 0 0 0 0 0 0Repair Depreciation 0 0 0 0 0 0 0 0 0 0
Before-Tax Income 33,805 (141,128) 54,070 170,905 170,200 257,639 345,072 344,348 343,618 342,88240.746% less: Income Tax Paid (Benefit Received) 13,774 (57,504) 22,031 69,637 69,350 104,978 140,603 140,308 140,011 139,711
Investment Tax Credit received 0 0 0Production Tax Credit received 0 0 0 0 0 0 0 0 0 0
After-Tax Income 20,031 (83,624) 32,038 101,268 100,850 152,661 204,469 204,040 203,607 203,171

122
EARNINGS 198 Mcf/dy Hilarides Dairy - Pipeline-Quality Gas -- no subsidy 02/22/08 6:44 PM
Cost Figures are in US dollars
project year 11 12 13 14 15 16 17 18 19 20 21 22year 2016 2017 2018 2019 2020 2021 2022 2023 2024 2025 2026 2027
gas sold wholesale (mm Btu/year) 33,979.5 33,979.5 33,979.5 33,979.5 33,979.5 33,979.5 33,979.5 33,979.5 33,979.5 33,979.5 0.0 0.0
Fuel #1 Consumed (mmBtu/yr) 44,417.6 44,417.6 44,417.6 44,417.6 44,417.6 44,417.6 44,417.6 44,417.6 44,417.6 44,417.6 0.0 0.0Fuel #2 Consumed (mm Btu/yr) 0.0 0.0 0.0 0.0 0.0 0.0 0.0 0.0 0.0 0.0 0.0 0.0
RevenuesEnergy - wholesale 404,696 404,696 404,696 404,696 404,696 404,696 404,696 404,696 404,696 404,696 0 0Capacity - wholesale 0 0 0 0 0 0 0 0 0 0 0 0
Other Byproduct 0 0 0 0 0 0 0 0 0 0 0 0Other - Carbon Credits 0 0 0 0 0 0 0 0 0 0 0 0
Total Revenues 404,696 404,696 404,696 404,696 404,696 404,696 404,696 404,696 404,696 404,696 0 0
Operating CostsFuel #1 Costs 0 0 0 0 0 0 0 0 0 0 0 0Fuel #2 Costs 0 0 0 0 0 0 0 0 0 0 0 0Gas Monitoring 12,801 13,121 13,449 13,785 14,130 14,483 14,845 15,216 15,597 15,987 0 0Standby Demand Payment 0 0 0 0 0 0 0 0 0 0 0 0Standby Energy Payment 0 0 0 0 0 0 0 0 0 0 0 0Other 0 0 0 0 0 0 0 0 0 0 0 0Service Cost 0 0 0 0 0 0 0 0 0 0 0 0
Operations & Maintenance 26,882 27,554 28,243 28,949 29,672 30,414 31,175 31,954 32,753 33,572 0 0Operator 0 0 0 0 0 0 0 0 0 0 0 0Leachate Monitoring 0 0 0 0 0 0 0 0 0 0 0 0Royalty 0 0 0 0 0 0 0 0 0 0 0 0Insurance 11,754 12,048 12,349 12,658 12,974 13,299 13,631 13,972 14,321 14,679 0 0Property Tax 11,193 10,656 10,093 9,503 8,885 8,239 7,563 6,857 6,557 6,688 0 0
Total Operating Expenses 62,630 63,379 64,133 64,894 65,662 66,435 67,214 67,999 69,228 70,926 0 0
Operating Income 342,066 341,317 340,562 339,801 339,034 338,261 337,482 336,696 335,468 333,770 0 0
Interest Earned on Reserves 74 74 74 74 74 74 74 74 74 74 0 0Interest - Loan #1 0 0 0 0 0 0 0 0 0 0 0 0Interest - Loan #2 0 0 0 0 0 0 0 0 0 0 0 0
Income before Amortization/Depreciation 342,139 341,391 340,636 339,875 339,108 338,334 337,555 336,770 335,541 333,843 0 0
Amortization 0 0 0 0 0 0 0 0 0 0 0 0Depreciation - Primary System 0 0 0 0 0 0 0 0 0 0 0 0Depreciation - Secondary System 0 0 0 0 0 0 0 0 0 0 0 0Repair Depreciation 0 0 0 0 0 0 0 0 0 0 0 0
Before-Tax Income 342,139 341,391 340,636 339,875 339,108 338,334 337,555 336,770 335,541 333,843 0 040.746% less: Income Tax Paid (Benefit Received) 139,408 139,103 138,795 138,485 138,173 137,858 137,540 137,220 136,720 136,028 0 0
Investment Tax Credit receivedProduction Tax Credit received 0 0 0 0 0 0 0 0 0 0 0 0
After-Tax Income 202,731 202,288 201,840 201,389 200,935 200,477 200,015 199,550 198,822 197,816 0 0

123
CASH FLOWS 198 Mcf/dy Hilarides Dairy - Pipeline-Quality Gas -- no subsidy 02/22/08 6:44 PM
Cost Figures are in US dollars
project year 0 1 2 3 4 5 6 7 8 9 10year 2005 2006 2007 2008 2009 2010 2011 2012 2013 2014 2015
Before-Tax Income 33,805 (141,128) 54,070 170,905 170,200 257,639 345,072 344,348 343,618 342,882
Add Back:First-year Start-up Funding 0 0 0 0 0Amortization 9,400 0 0 0 0 0 0 0 0 0Depreciation 306,078 489,724 293,835 176,301 176,301 88,150 0 0 0 0Repair Depreciation 0 0 0 0 0 0 0 0 0 0Released from Reserves 0 0 0 0 0 0 0 0 0 0Released from Major Maintenance Reserve 0 0 0 0 0 0 0 0 0 0Other 0 0
Total Additions 315,478 489,724 293,835 176,301 176,301 88,150 0 0 0 0
Subtract:Loan #1 Principal 0 0 0 0 0 0 0 0 0 0Loan #2 Principal 0 0 0 0 0 0 0 0 0 0Deposit to Reserve 0 0 0 0 0 0 0 0 0 0Charge for Capitalized Overhaul 0 0 0 0 0 0 0 0 0 0Other 0 0
Total Subtractions 0 0 0 0 0 0 0 0 0 0
Before-Tax Cash 349,283 348,597 347,904 347,206 346,501 345,789 345,072 344,348 343,618 342,882
Income Tax Paid (Benefit Received) 13,774 (57,504) 22,031 69,637 69,350 104,978 140,603 140,308 140,011 139,711Investment Tax Credit Received 0 0 0Production Tax Credit Received 0 0 0 0 0 0 0 0 0 0
After-Tax Cash (1,568,589) 335,509 406,101 325,873 277,569 277,151 240,812 204,469 204,040 203,607 203,171
After-tax IRR 17.01% , using starting estimate of 10.00%
Net Present Value 377,984 , using discount rate of 12.00% for developerPayback 5
1 1 1 1 1 0 0 0 0 0
GrantTotal 0 grant that need not be paid back. For Hilarides, California DPPP providded a grant of $500,000.
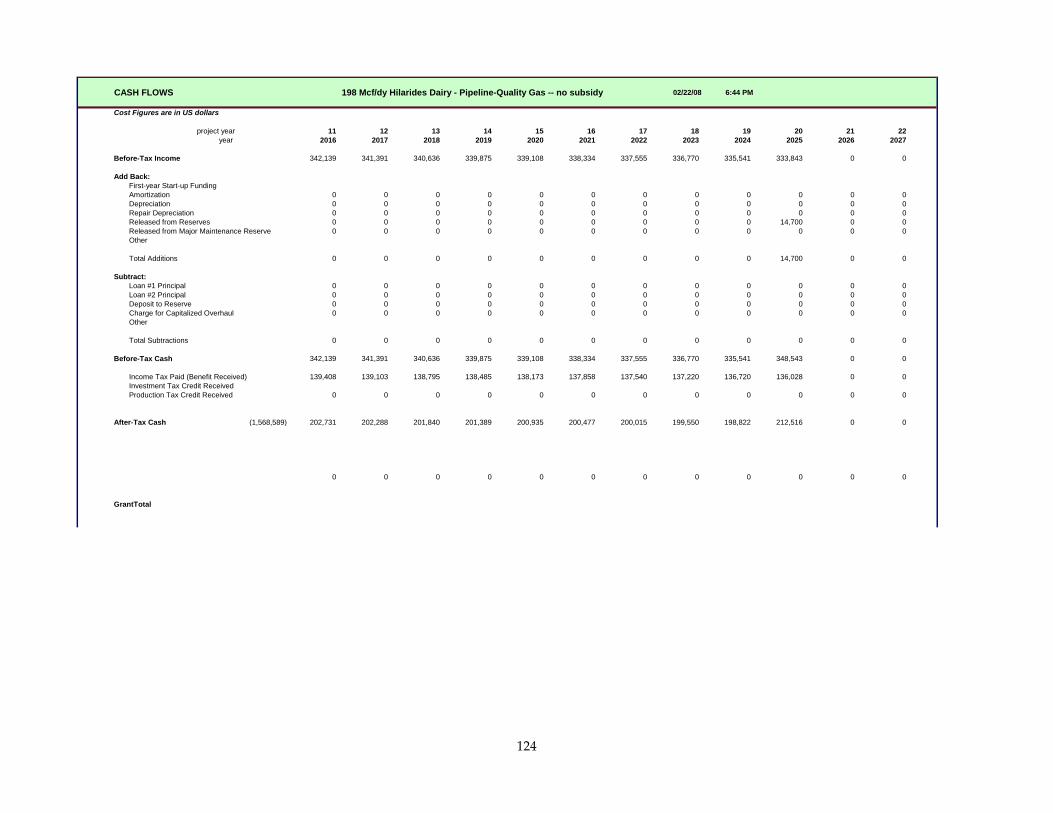
124
CASH FLOWS 198 Mcf/dy Hilarides Dairy - Pipeline-Quality Gas -- no subsidy 02/22/08 6:44 PM
Cost Figures are in US dollars
project year 11 12 13 14 15 16 17 18 19 20 21 22year 2016 2017 2018 2019 2020 2021 2022 2023 2024 2025 2026 2027
Before-Tax Income 342,139 341,391 340,636 339,875 339,108 338,334 337,555 336,770 335,541 333,843 0 0
Add Back:First-year Start-up FundingAmortization 0 0 0 0 0 0 0 0 0 0 0 0Depreciation 0 0 0 0 0 0 0 0 0 0 0 0Repair Depreciation 0 0 0 0 0 0 0 0 0 0 0 0Released from Reserves 0 0 0 0 0 0 0 0 0 14,700 0 0Released from Major Maintenance Reserve 0 0 0 0 0 0 0 0 0 0 0 0Other
Total Additions 0 0 0 0 0 0 0 0 0 14,700 0 0
Subtract:Loan #1 Principal 0 0 0 0 0 0 0 0 0 0 0 0Loan #2 Principal 0 0 0 0 0 0 0 0 0 0 0 0Deposit to Reserve 0 0 0 0 0 0 0 0 0 0 0 0Charge for Capitalized Overhaul 0 0 0 0 0 0 0 0 0 0 0 0Other
Total Subtractions 0 0 0 0 0 0 0 0 0 0 0 0
Before-Tax Cash 342,139 341,391 340,636 339,875 339,108 338,334 337,555 336,770 335,541 348,543 0 0
Income Tax Paid (Benefit Received) 139,408 139,103 138,795 138,485 138,173 137,858 137,540 137,220 136,720 136,028 0 0Investment Tax Credit ReceivedProduction Tax Credit Received 0 0 0 0 0 0 0 0 0 0 0 0
After-Tax Cash (1,568,589) 202,731 202,288 201,840 201,389 200,935 200,477 200,015 199,550 198,822 212,516 0 0
0 0 0 0 0 0 0 0 0 0 0 0
GrantTotal

125
COST OF ENERGY 198 Mcf/dy Hilarides Dairy - Pipeline-Quality Gas -- no subsidy 02/22/08 6:44 PM
Cost Figures are in US dollars
project year 0 1 2 3 4 5 6 7 8 9 10year 2005 2006 2007 2008 2009 2010 2011 2012 2013 2014 2015
Wholesale Utility Electric Cal fraction 1.000 1.000 1.000 1.000 1.000 1.000 1.000 1.000 1.000 1.000Energy 404,696 404,696 404,696 404,696 404,696 404,696 404,696 404,696 404,696 404,696
Capacity 0 0 0 0 0 0 0 0 0 0
Total 404,696 404,696 404,696 404,696 404,696 404,696 404,696 404,696 404,696 404,696
33,979.5 mm Btu/year1.020 MM Btu / Mcf fuNet Present Value 3,829,772 , using 8.500% <--- SET THIS! Might try before-tax rate, from utility's cost of capital
33,313.2 Mcf/year Current $ Levelized 404,696 as Rate * NPV/(1-(1+Rate)^(-n))333,132.3 therms/year
lev COE/therm $1.2148 in nominal terms of 2006 07/11/2007 note: NPV boosts year 1 to 100% and lev COE/therm $1.2452 in nominal terms of 2007 cuts any N+1 last year to zero.
1st-yr Cost $1.2148 in nominal terms of 20061st-yr Cost $1.2452 in nominal terms of 2007Constant $ NPV 3,829,772 , as nominalConstant $ Levelized 329,941 , using 5.854% =(1+ 0.085)/(1+ 0.025) - 1lev COE/therm $0.9904 in constant terms of 2006lev COE/therm $1.0152 in constant terms of 2007
Operating Expenses total O&M excl prop tax, insur 31,000 31,775 32,569 33,384 34,218 35,074 35,950 36,849 37,770 38,715
tax effect = O&M * (1-t) adjusted total O&M 18,369 18,828 19,299 19,781 20,276 20,783 21,302 21,835 22,381 22,940
Total 18,369 18,828 19,299 19,781 20,276 20,783 21,302 21,835 22,381 22,940
33,979.5 mm Btu/yearNet Present Value 208,014 , using 8.500% Fixed Capital Cost
333,132.3 therms/year Current $ Levelized 21,981 as Rate * NPV/(1-(1+Rate)^(-n)) Calculated as Total less Op Exp.
lev COE/therm $0.0660 in nominal terms of 2006 $1.1488 in nominal terms of 2006lev COE/therm $0.0676 in nominal terms of 2007 $1.1776 in nominal terms of 2007
1st-yr Cost $0.0551 in nominal terms of 2006 $1.1597 in nominal terms of 20061st-yr Cost $0.0565 in nominal terms of 2007 $1.1887 in nominal terms of 2007Constant $ NPV 208,014 , as nominalConstant $ Levelized 17,921 , using 5.854%lev COE/therm $0.0538 in constant terms of 2006 $0.9366 in constant terms of 2006lev COE/therm $0.0551 in constant terms of 2007 $0.9600 in constant terms of 2007
^^^ ^^^ ^ ^^^ ^^^ ^^^ ^^^ ^^^ ^^^ ^^^ ^^^ ^ ^^^ ^^^ ^^^ ^^̂ ^^ ^^^ ^^^ ^^̂ ^^ ^^^ ^^^ ^^̂ ^^ ^^^ ^^^ ^^̂ ^^ ^^^ ^^^ ^^̂ ^^ ^^^ ^^^ ^^̂ ^^ ^^^ ^^^ ^^̂ ^^ ^^^ ^^^ ^^̂ ^^ ^^^ ^^^ ^^̂ ^^ ^^^ ^^^ ^^̂ ^^ ^^^ ^^^ ^^̂ ^^ ^^^ ^^^ ^^

126
COST OF ENERGY 198 Mcf/dy Hilarides Dairy - Pipeline-Quality Gas -- no subsidy 02/22/08 6:44 PM
Cost Figures are in US dollars
project year 11 12 13 14 15 16 17 18 19 20 21 22year 2016 2017 2018 2019 2020 2021 2022 2023 2024 2025 2026 2027
Wholesale Utility Electric Cal fraction 1.000 1.000 1.000 1.000 1.000 1.000 1.000 1.000 1.000 1.000 0.000 0.000Energy 404,696 404,696 404,696 404,696 404,696 404,696 404,696 404,696 404,696 404,696 0 0
Capacity 0 0 0 0 0 0 0 0 0 0 0 0
Total 404,696 404,696 404,696 404,696 404,696 404,696 404,696 404,696 404,696 404,696 0 0
33,979.5 mm Btu/year1.020 MM Btu / Mcf fuel #2 *To figure Discount rate: Utility tax rate 40.00%
33,313.2 Mcf/year333,132.3 therms/year Utility debt 50.00% 6.50%
preferred 5.00% 6.30%common 45.00% 11.00%
8.52% before-tax weighted average cost of capital
Utility debt 50.00% 60.00% 6.50% 'by (1 - utility combined tax rate)preferred 5.00% 6.30%common 45.00% 11.00%
7.22% after-tax weighted average cost of capital
Operating Expenses total O&M excl 39,683 40,675 41,692 42,734 43,802 44,897 46,020 47,170 48,349 49,558 0 0
tax effect = O&M * (1-t) adjusted total O 23,514 24,101 24,704 25,322 25,955 26,603 27,268 27,950 28,649 29,365 0 0
Total 23,514 24,101 24,704 25,322 25,955 26,603 27,268 27,950 28,649 29,365 0 0
33,979.5 mm Btu/year
333,132.3 therms/year
^^^ ^^^ ^ ^^^ ^^^ ^^^ ^^^ ^^^ ^^^ ^^^ ^^^ ^ ^^^ ^^^ ^^^ ^^̂ ^^ ^^^ ^^^ ^^̂ ^^ ^^^ ^^^ ^^̂ ^^ ^^^ ^^^ ^^̂ ^^ ^^^ ^^^ ^^̂ ^^ ^^^ ^^^ ^^̂ ^^ ^^^ ^^^ ^^̂ ^^ ^^^ ^^^ ^^̂ ^^ ^^^ ^^^ ^^̂ ^^ ^^^ ^^^ ^^̂ ^^ ^^^ ^^^ ^^̂ ^^ ^^^ ^^^ ^^̂ ^^ ^^^ ^^^ ^^̂ ^^ ^^ ̂

127
This page intentionally left blank.