Embed Size (px)
Citation preview
CONFIDENTIAL
eThekwini Municipality
Internal Audit and Performance ManagementReport on the Organisational Performance Scorecard
for the period ended 30th June 2006
CONTENTS PAGE
Contents 1
Introduction 2
Executive Summary 2
Annexure A – Ethekwini Scorecard 5
Annexure B – List of Outstanding Performance Plans – 2006/7
1
CONFIDENTIALIntroduction
The Municipal Systems Act, 2000 (Section 45) requires that the results of performance measurements, be audited as part of the Municipality’s Internal Auditing processes. In Terms of Regulation 14 (1) of the Municipal Planning and Performance Management Regulations, 2001, of the Systems Act, it is the Municipality’s responsibility to develop and implement mechanisms, systems and processes for auditing the results of the performance measurements, as part of its internal audit processes.In addition, the Municipal Finance and Management Act No 56 of 2003, section 165 (2) (b) (v) requires that the Internal Audit Unit of a Municipality, report to the Audit Committee on matters relating to Performance Management.
Therefore in order to ensure alignment to the legislative requirements and to the Integrated Development Plan, a review of Performance Management has been undertaken in the eThekwini Municipality, for the period 01st July 2005 to 30th June 2006.
The objective and scope of the review includes• Whether service delivery performance of the entire Municipality has been achieved as per the set
targets.• An assessment of the appropriateness of targets and baselines set and whether the targets are
Specific, Measurable, Achievable, Realistic and Time Related. (SMART)
Executive Summary of Performance Audits Undertaken
Organisational Performance for future years is currently under construction in accordance with the Municipality’s eight point plan, strategic focus areas, programmes and projects. Hence it has been accepted that existing measures in the 2005/6 scorecard may not be the best. The new Electronic Performance Management system, which is currently being rolled out throughout the Municipality will provide information on the new key performance areas/Indicators.
A pilot of the new Electronic system was rolled out at Treasury and the Treasury information for this report was obtained from the system. The status of the KPI’s was determined as follows: A red light on the system has been indicated with an unhappy face on the scorecard, a yellow light with a straight line face and a green light with a smiley face.
Unhappy faces were allocated to KPI’s where the baseline’s and targets have not been re-defined since July 2005 or and where no information was available to substantiate the position. This was most prevalent in the Health, Safety and Social Services cluster.
Where targets have not been met, but baselines have been improved upon, a straight line face has been awarded. If there has been deterioration in the baseline an unhappy face will prevail.
2
CONFIDENTIAL
Entities
The new Electronic Performance Management system was also piloted at both the Entities, viz. International Convention Centre and Ushaka Marine world.
During the period under review, the International Convention Centre (ICC) had outdated computer hardware, which has subsequently been updated. Therefore there was ineffective use of the Electronic Performance Management system for the June quarter.
For Ushaka Marine World, inaccurate information was being transferred to the Performance Management System due to connectivity problems.
Conclusion
Integral to the success of performance management is the availability of useful, relevant, accurate and timeous information. Consideration should therefore be given to developing and implementing appropriate processes and systems to facilitate the gathering, recording and maintenance of information. This will not only assist in the management monitoring process but also provide a basis for the measurement of performance.
With the implementation of the new electronic Performance Management system in the Municipality as well as at both entities, viz. Ushaka Marine World and the International Convention Centre, an improved measurement system in alignment with the IDP should prevail in the future years.
The legend for the faces allocated to each KPI is indicated below. Where the target is annual, not applicable (NA) is indicated. In addition, where the targets have been met previously, a dash and NA is indicated.
Status Legend: - Target Achieved or Improved on - Baseline Maintained or Improved on, but target not achieved - Backward movement on Baseline/ Deterioration in Baseline/ No Auditable Information/ Baseline and Targets not defined.
In order to determine organizational performance based on the available information, the total number of smiley faces, plus half of the straight line faces, expressed as a percentage of all faces will be the organizations assessed performance percentage.
Annexure A provides an overall summary in Organisational Format of the results of the audit as at the 30 June 2006.
Individual performance plans, assessments and Individual Performance Management Policy are available for scrutiny on the eThekwini website under Municipality, Performance Management.
3
CONFIDENTIALSummary:
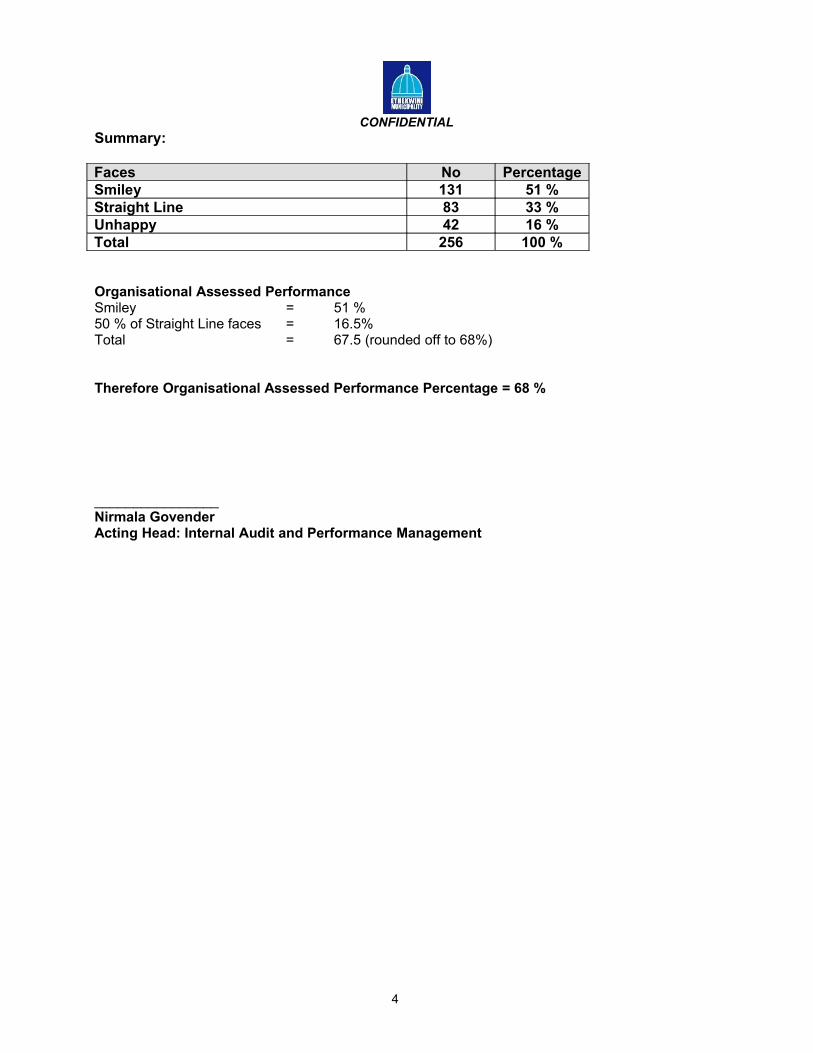
Faces No PercentageSmiley 131 51 %Straight Line 83 33 %Unhappy 42 16 %Total 256 100 %
Organisational Assessed PerformanceSmiley = 51 %50 % of Straight Line faces = 16.5%Total = 67.5 (rounded off to 68%)
Therefore Organisational Assessed Performance Percentage = 68 %
________________Nirmala GovenderActing Head: Internal Audit and Performance Management
4

OVERALL SUMMARY – ORGANISATIONAL SCORECARD ANNEXURE A
Key Performance Area (KPA)
Key Performance Indicators (KPIs)
Baselineat 30/06/2005
Target at 30/06/2006
Position at 30/06/2006 5 Yr Targets Means of Verification(MOV) / Responsibility
Freq Status Audit Comment Management Comment
DEVELOPMENT PLANNING AND MANAGEMENTOUTCOMES
A safe, healthy, development responsive and sustainable total living environment
1. 1 Number of rezoning applications received in [Net gain or loss of land in] main land use categories, viz.:Residential CommercialIndustrialSocial facilitiesEnvironmental
1.1.1 Rezoning applications received and approved in each main land use categoryResidential: 13Commercial: 7Industrial: 5Social facilities: 7Environmental: 0
Total 32
1.1.2 9 Unit initiated Land Use System (LUS) reviews / amendment
System in place to record and account for:1.1.1 All rezoning applications in each main land use category dealt with annually in terms of strategic plans Spatial Development framework (SDF), Spatial development Plan (SDP), Local Area plan (LAP):ResidentialCommercialIndustrialSocial facilitiesEnvironmental
1.1.2 Dept .to initiate land use scheme reviews / amendments4 (annual)
1.1.1 Applications received and approved:
Residential : 9(Sept)+13(Dec)+3(Mar)+ 4 (June) =29Commercial : 6(Sept)+7(Dec)+0(Mar) + 2 (June)=15Industrial:1(Sept)+0(Dec)+0(Mar) + 1 (June)=2Social facilities: 3(Sept)+2(Dec)+1(Mar) + 0 (June)=6Environmental: 0(Sept)+0(Dec)+0(Mar) + 0 (June)=0Total :19(Sept)+22(Dec)+4(Mar) + 7 (June)=52 (Rezoning)
1.1.2 Dept. initiated 3 LUS reviews / amendments
1) South SDP2) North SDP
Outer West SDP
Departmental records
As above
Q
A manual system has been put in place to record data. However at this point in time there is no assurance that all data is recorded.
Scorecard stats were checked to supporting documentation e.g registers correspondence etc. but there is no assurance that the information was complete. Certain errors were also pick up in the review.
Three Land Use System reviews done
Agreed.
Manual information is monitored. Computer system not operational.
Agreed
1.2 Overlap between conflicting zoning and eThekwini Environmental Services Management Plan ( EESMP)
1.2 Baseline being established Central : 11%
South : 9%
North : 7%
Outer West : 2%
Inner West : 58%
1.2.1
1% decrease in overlap overall per year.
Can not be effectively measured
Departmental Records
Q No information supplied.
Agreed
2.1 Level of public acceptance of changes in land or building use
2.1.1 Complaints (previously recorded) Land use : 101Building : 1271Total = 1372
System in place to record number of complaints receivedAll complaints received dealt with on
Manual systems put in place to record:2.1.1 Complaints: Land use 223(Sept)+209(Dec)+24(Mar)+ 19 (June)=475Building plans :1645(Sept)+1490(Dec)+1426(Mar)
Written complaints, appeal report, general appeals
Q
Examples of written complaints, appeal reports and general appeals were presented to audit which was reviewed.
There is still a completeness
Agreed.
5
OVERALL SUMMARY – ORGANISATIONAL SCORECARD ANNEXURE A
Key Performance Area (KPA)
Key Performance Indicators (KPIs)
Baselineat 30/06/2005
Target at 30/06/2006
Position at 30/06/2006 5 Yr Targets Means of Verification(MOV) / Responsibility
Freq Status Audit Comment Management Comment
DEVELOPMENT PLANNING AND MANAGEMENT2.1 Level of public acceptance of changes in land or building use
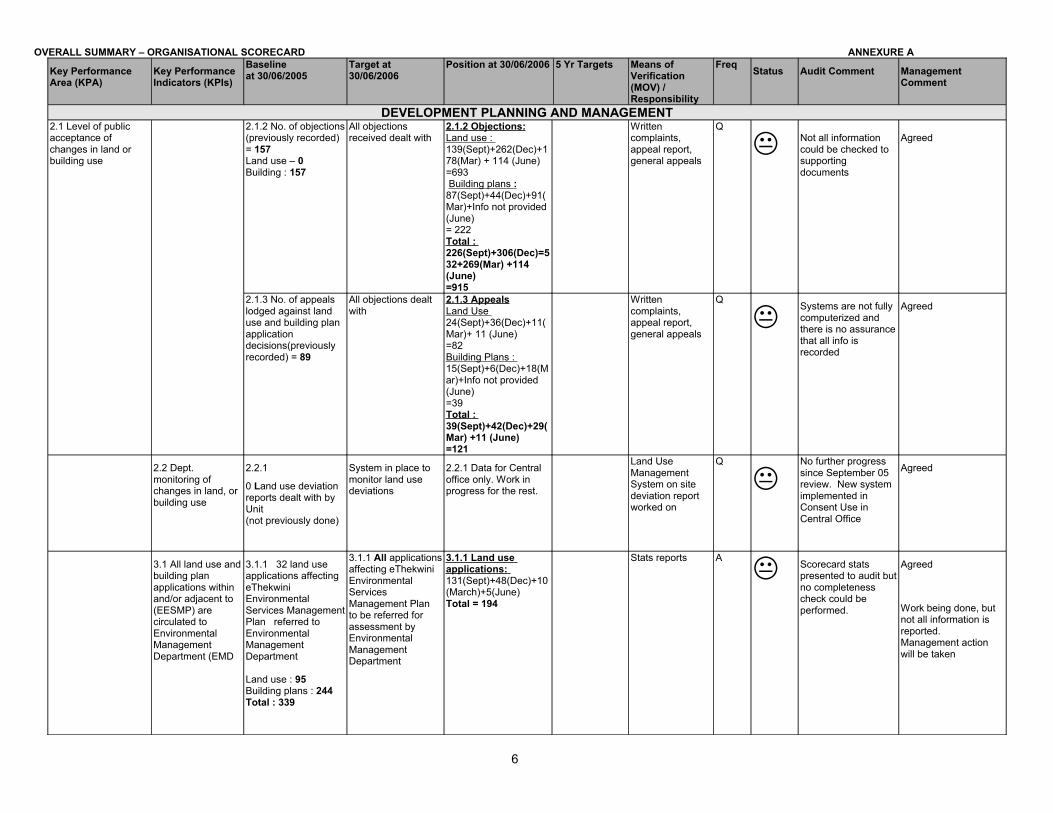
2.1.2 No. of objections (previously recorded) = 157Land use – 0Building : 157
All objections received dealt with
2.1.2 Objections:Land use : 139(Sept)+262(Dec)+178(Mar) + 114 (June)=693 Building plans : 87(Sept)+44(Dec)+91(Mar)+Info not provided (June)= 222Total : 226(Sept)+306(Dec)=532+269(Mar) +114 (June)=915
Written complaints, appeal report, general appeals
Q
Not all information could be checked to supporting documents
Agreed
2.1.3 No. of appeals lodged against land use and building plan application decisions(previously recorded) = 89
All objections dealt with
2.1.3 AppealsLand Use 24(Sept)+36(Dec)+11(Mar)+ 11 (June)=82Building Plans : 15(Sept)+6(Dec)+18(Mar)+Info not provided (June)=39Total : 39(Sept)+42(Dec)+29(Mar) +11 (June)=121
Written complaints, appeal report, general appeals
Q
Systems are not fully computerized and there is no assurance that all info is recorded
Agreed
2.2 Dept. monitoring of changes in land, or building use
2.2.1
0 Land use deviation reports dealt with by Unit(not previously done)
System in place to monitor land use deviations
2.2.1 Data for Central office only. Work in progress for the rest.
Land Use Management System on site deviation report worked on
Q
No further progress since September 05 review. New system implemented in Consent Use in Central Office
Agreed
3.1 All land use and building plan applications within and/or adjacent to (EESMP) are circulated to Environmental Management Department (EMD
3.1.1 32 land use applications affecting eThekwini Environmental Services Management Plan referred to Environmental Management Department
Land use : 95Building plans : 244Total : 339
3.1.1 All applications affecting eThekwini Environmental Services Management Plan to be referred for assessment by Environmental Management Department
3.1.1 Land use applications: 131(Sept)+48(Dec)+10(March)+5(June)Total = 194
Stats reports A
Scorecard stats presented to audit but no completeness check could be performed.
Agreed
Work being done, but not all information is reported. Management action will be taken
6
OVERALL SUMMARY – ORGANISATIONAL SCORECARD ANNEXURE A
Key Performance Area (KPA)
Key Performance Indicators (KPIs)
Baselineat 30/06/2005
Target at 30/06/2006
Position at 30/06/2006 5 Yr Targets Means of Verification(MOV) / Responsibility
Freq Status Audit Comment Management Comment
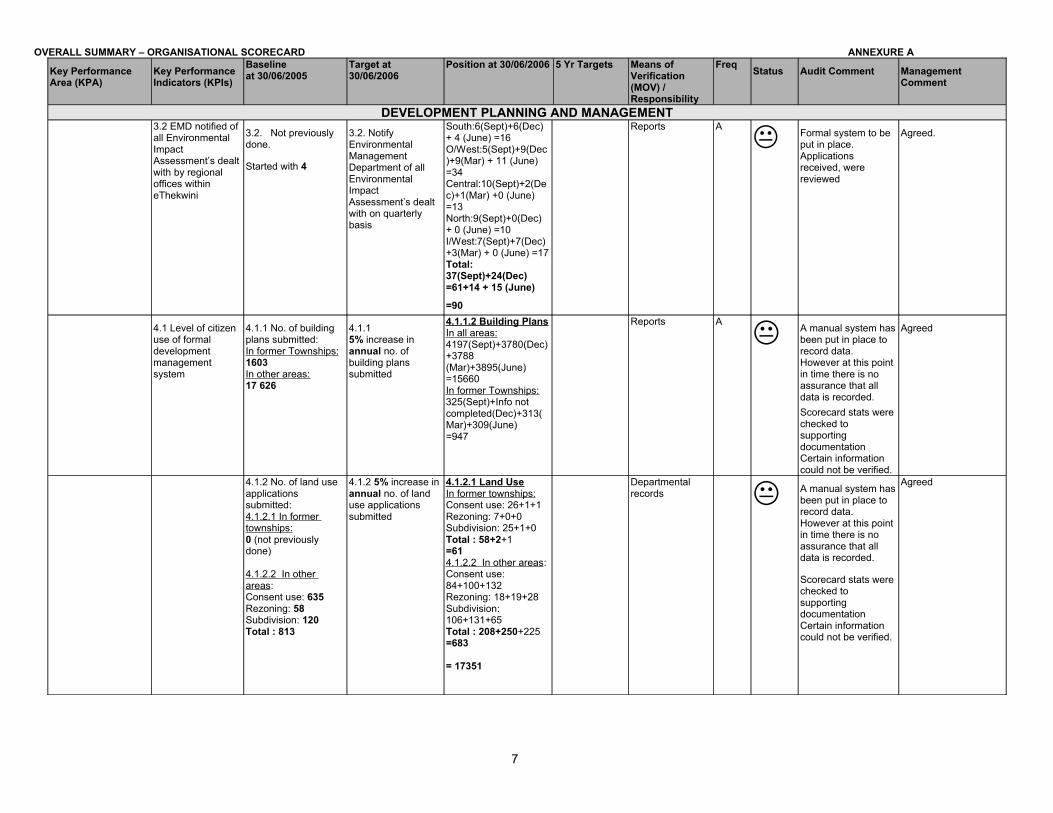
DEVELOPMENT PLANNING AND MANAGEMENT3.2 EMD notified of all Environmental Impact Assessment’s dealt with by regional offices within eThekwini
3.2. Not previously done.
Started with 4
3.2. Notify Environmental Management Department of all Environmental Impact Assessment’s dealt with on quarterly basis
South:6(Sept)+6(Dec) + 4 (June) =16O/West:5(Sept)+9(Dec)+9(Mar) + 11 (June)=34Central:10(Sept)+2(Dec)+1(Mar) +0 (June) =13North:9(Sept)+0(Dec) + 0 (June) =10I/West:7(Sept)+7(Dec)+3(Mar) + 0 (June) =17Total: 37(Sept)+24(Dec) =61+14 + 15 (June)
=90
Reports A
Formal system to be put in place. Applications received, were reviewed
Agreed.
4.1 Level of citizen use of formal development management system
4.1.1 No. of building plans submitted:In former Townships:1603 In other areas:17 626
4.1.1 5% increase in annual no. of building plans submitted
4.1.1.2 Building PlansIn all areas:4197(Sept)+3780(Dec)+3788(Mar)+3895(June)=15660In former Townships:325(Sept)+Info not completed(Dec)+313(Mar)+309(June)=947
Reports A
A manual system has been put in place to record data. However at this point in time there is no assurance that all data is recorded.Scorecard stats were checked to supporting documentation Certain information could not be verified.
Agreed
4.1.2 No. of land use applications submitted:4.1.2.1 In former townships:0 (not previously done)
4.1.2.2 In other areas:Consent use: 635Rezoning: 58Subdivision: 120Total : 813
4.1.2 5% increase in annual no. of land use applications submitted
4.1.2.1 Land UseIn former townships:Consent use: 26+1+1Rezoning: 7+0+0Subdivision: 25+1+0Total : 58+2+1=614.1.2.2 In other areas:Consent use: 84+100+132Rezoning: 18+19+28Subdivision: 106+131+65Total : 208+250+225=683
= 17351
Departmental records A manual system has
been put in place to record data. However at this point in time there is no assurance that all data is recorded.
Scorecard stats were checked to supporting documentation Certain information could not be verified.
Agreed
7

OVERALL SUMMARY – ORGANISATIONAL SCORECARD ANNEXURE A
Key Performance Area (KPA)
Key Performance Indicators (KPIs)
Baselineat 30/06/2005
Target at 30/06/2006
Position at 30/06/2006 5 Yr Targets Means of Verification(MOV) / Responsibility
Freq Status Audit Comment Management Comment
DEVELOPMENT PLANNING AND MANAGEMENT
4.2 No. of land use and building plan applications approved within specified timelines
4.2.1 Minor building works (MBW) without circulation : Target - 1 weekActual - 2 weeks10% of target achievedMBW with circulation:Target - 2 weeksActual – 5 to 8 weeks10% of target achieved
Dwelling without circulation :Target – 3 weeksActual – 5 to 8 weeks30% of target achieved
Dwelling with circulation :Target – 5 weeksActual – 5 to 8 weeks40% of target achieved
Industrial/Commercial: Target – 7 weeksActual – 7 to 10 weeks40% of target achieved
4.2.1 Computer system to be put in place to monitor approvals within timeframes
4.2.1.1 Building Plans ApprovalsTotal approved : 3004(Sept)+2924(Dec)+2705(Mar) +2819 (June)=11452Approved within former t/ships : 157(Sep)+Info not completed(Dec) +144(Mar) +141(June)=442
4.2.1.2 Building Plans TimelinesMinor building works without circulation Target - 4 weeksActual-8 weeks(Sep)+this ¼ not measured(Dec) +this ¼ not measured(June)10%of target achieved(Sept)Dwelling without circ :Target – 6 weeksActual–12 weeks(Sept)+this ¼ not measured(Dec) +this ¼ not measured(June)30%of target achieved(Sept)Minor Building Works / Dwelling with circulation:Target - 10 weeksActual–16 weeks+this ¼ not measured(Dec) + this ¼ not measured(June)10%of target achieved(Sept)Industrial/Commercial: Target – 12 weeksActual–20 weeks(Sep)+this ¼ not measured(Dec) +this ¼ not measured(June)40%of target achieved(Sept)
Reports Q
No information to check for Land Use Management for June quarter.
Agreed.
8
OVERALL SUMMARY – ORGANISATIONAL SCORECARD ANNEXURE A
Key Performance Area (KPA)
Key Performance Indicators (KPIs)
Baselineat 30/06/2005
Target at 30/06/2006
Position at 30/06/2006 5 Yr Targets Means of Verification(MOV) / Responsibility
Freq Status Audit Comment Management Comment
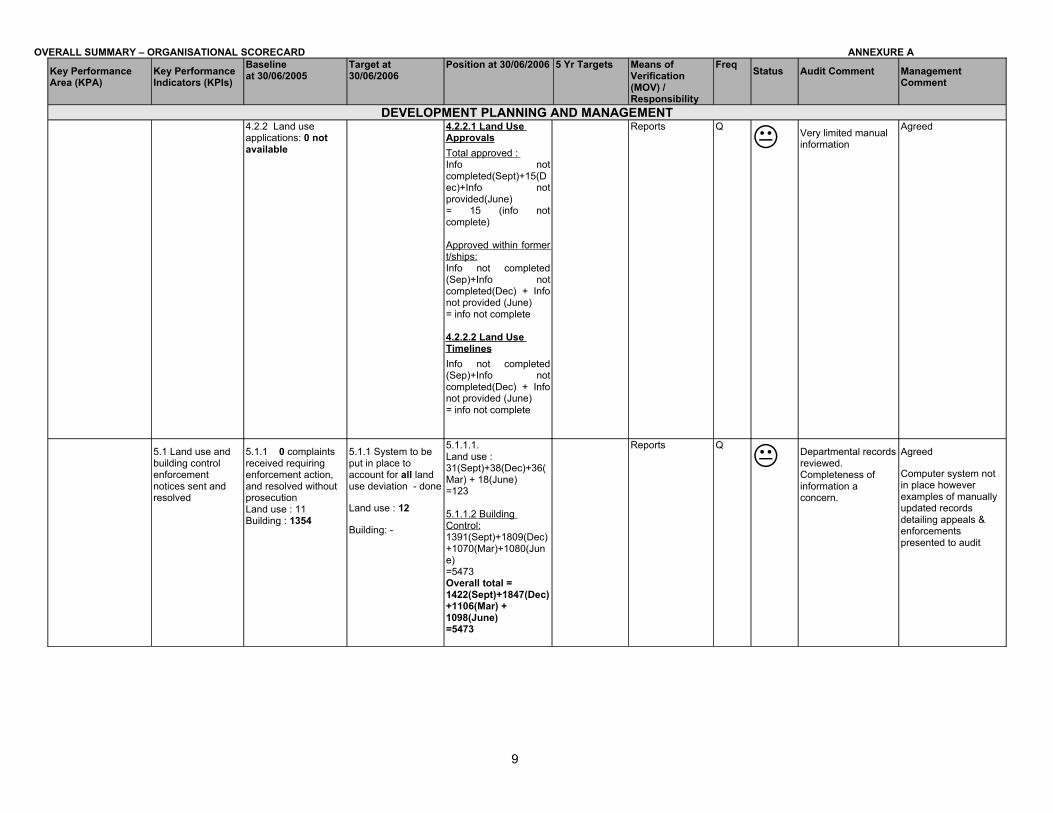
DEVELOPMENT PLANNING AND MANAGEMENT4.2.2 Land use applications: 0 not available
4.2.2.1 Land Use ApprovalsTotal approved : Info not completed(Sept)+15(Dec)+Info not provided(June)= 15 (info not complete)
Approved within former t/ships:Info not completed (Sep)+Info not completed(Dec) + Info not provided (June)= info not complete
4.2.2.2 Land Use TimelinesInfo not completed (Sep)+Info not completed(Dec) + Info not provided (June)= info not complete
Reports Q
Very limited manual information
Agreed
5.1 Land use and building control enforcement notices sent and resolved
5.1.1 0 complaints received requiring enforcement action, and resolved without prosecution Land use : 11Building : 1354
5.1.1 System to be put in place to account for all land use deviation - done
Land use : 12
Building: -
5.1.1.1. Land use :31(Sept)+38(Dec)+36(Mar) + 18(June)=123
5.1.1.2 Building Control:1391(Sept)+1809(Dec)+1070(Mar)+1080(June)=5473Overall total = 1422(Sept)+1847(Dec)+1106(Mar) + 1098(June)=5473
Reports Q
Departmental records reviewed. Completeness of information a concern.
Agreed
Computer system not in place however examples of manually updated records detailing appeals & enforcements presented to audit
9
OVERALL SUMMARY – ORGANISATIONAL SCORECARD ANNEXURE A
Key Performance Area (KPA)
Key Performance Indicators (KPIs)
Baselineat 30/06/2005
Target at 30/06/2006
Position at 30/06/2006 5 Yr Targets Means of Verification(MOV) / Responsibility
Freq Status Audit Comment Management Comment
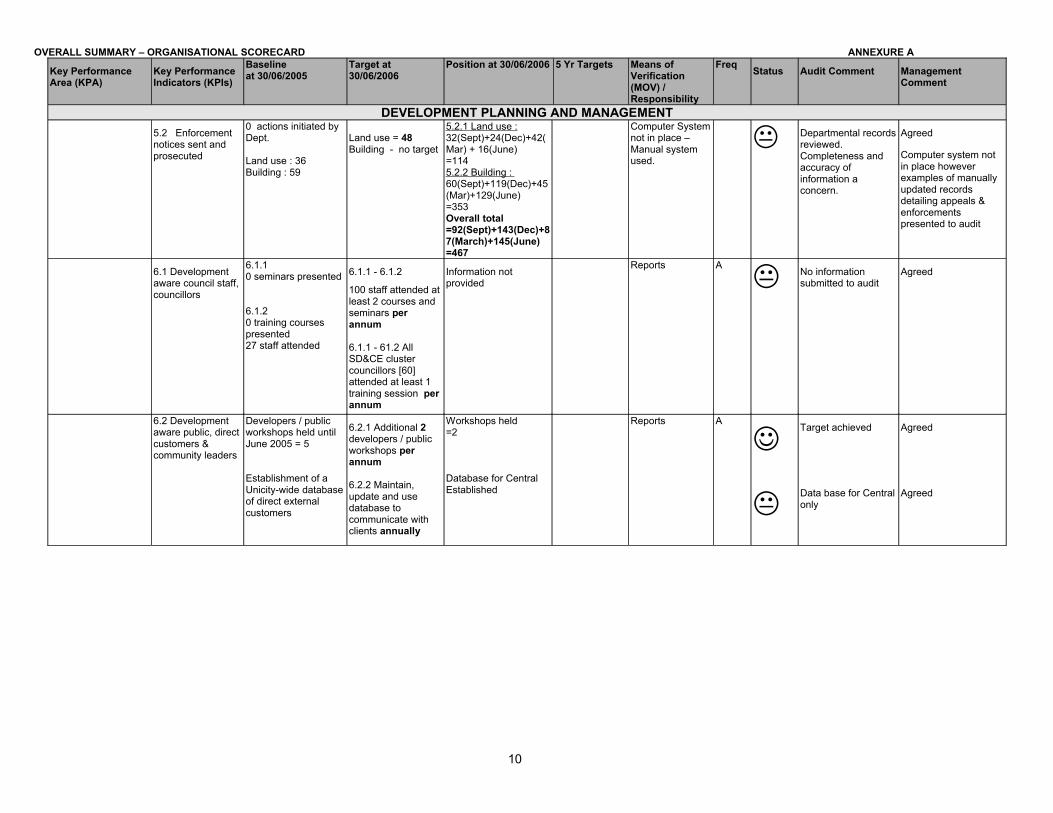
DEVELOPMENT PLANNING AND MANAGEMENT5.2 Enforcement notices sent and prosecuted
0 actions initiated by Dept.
Land use : 36Building : 59
Land use = 48Building - no target
5.2.1 Land use :32(Sept)+24(Dec)+42(Mar) + 16(June)=1145.2.2 Building : 60(Sept)+119(Dec)+45(Mar)+129(June) =353Overall total =92(Sept)+143(Dec)+87(March)+145(June)=467
Computer System not in place – Manual system used.
Departmental records reviewed. Completeness and accuracy of information a concern.
Agreed
Computer system not in place however examples of manually updated records detailing appeals & enforcements presented to audit
6.1 Development aware council staff, councillors
6.1.10 seminars presented
6.1.20 training courses presented 27 staff attended
6.1.1 - 6.1.2
100 staff attended at least 2 courses and seminars per annum
6.1.1 - 61.2 All SD&CE cluster councillors [60] attended at least 1 training session per annum
Information not provided
Reports A
No information submitted to audit
Agreed
6.2 Development aware public, direct customers & community leaders
Developers / public workshops held until June 2005 = 5
Establishment of a Unicity-wide database of direct external customers
6.2.1 Additional 2 developers / public workshops per annum
6.2.2 Maintain, update and use database to communicate with clients annually
Workshops held=2
Database for Central Established
Reports A
Target achieved
Data base for Central only
Agreed
Agreed
10

OVERALL SUMMARY – ORGANISATIONAL SCORECARD ANNEXURE A
Key Performance Area (KPA)
Key Performance Indicators (KPIs)
Baselineat 30/06/2005
Target at 30/06/2006
Position at 30/06/2006 5 Yr Targets Means of Verification(MOV) / Responsibility
Freq Status Audit Comment Management Comment
DEVELOPMENT PLANNING AND MANAGEMENT7.1.Institutional mechanisms for engaging key stakeholders in all EMS related projects
7.1. Internal Biodiversity Forum established and meeting regularly.
Internal Energy Working Group established.
7.1.External and internal multilateral environmental forums established and meeting regularly.(Annual target)
7.1* Internal Biodiversity Forum meeting regularly – latest meeting 7 February 2006* External Biodiversity Forum meetings took place on 13/10/2005 & 26/01/2006* External Biodiversity Forum: Energy Working Sub Group established and convened 24/11/05* Regular report back to Energy Working Groups (internal and external) re: progress of State of Energy Report e-mails 23/02/06 and 14/03/06* Regular meetings held with Deputy Head: Parks, Leisure and Cemeteries.* Regular coordination meetings with Department of Agriculture and Environmental Affairs* Ongoing interactions with ABMs around relevant environmental issues/projects
Forums and Meetings
A
Progress reviewed:
Evidence presented to confirm internal & external Biodiversity Forum meetings took place.
DH(Env) & DH(PLC) regular meetings
DAEA: EMD MeetingsEvidence of ongoing meetings with PLC
Agreed.
11

OVERALL SUMMARY – ORGANISATIONAL SCORECARD ANNEXURE A
Key Performance Area (KPA)
Key Performance Indicators (KPIs)
Baselineat 30/06/2005
Target at 30/06/2006
Position at 30/06/2006 5 Yr Targets Means of Verification(MOV) / Responsibility
Freq Status Audit Comment Management Comment
DEVELOPMENT PLANNING AND MANAGEMENT7.2. Develop and implement an Environmental Internship Programme
7.2. 3 interns trained in 2004/2005
7.2 Two interns to be trained. (annual target) for 2005/06.
7.2. * CSIR appointed to conduct 2005/06 internship* Two interns selected to take up positions on 1/11/2005.* Training of two interns completed but unable to secure services as candidates could only be offered posts in development assessment – not suitable for more specialist biodiversity function, which was their preference.* Internship to be suspended in current form and negotiations to be undertaken with the University of KwaZulu-Natal re: a new approach to internship in 2006/07.
Minutes A
Env Man Capacity Dev program reports presented.
Phase 2 Jan-April 06
Agreed.
New Approach to internship in 2006/07 to be discussed
12
OVERALL SUMMARY – ORGANISATIONAL SCORECARD ANNEXURE A
Key Performance Area (KPA)
Key Performance Indicators (KPIs)
Baselineat 30/06/2005
Target at 30/06/2006
Position at 30/06/2006 5 Yr Targets Means of Verification(MOV) / Responsibility
Freq Status Audit Comment Management Comment
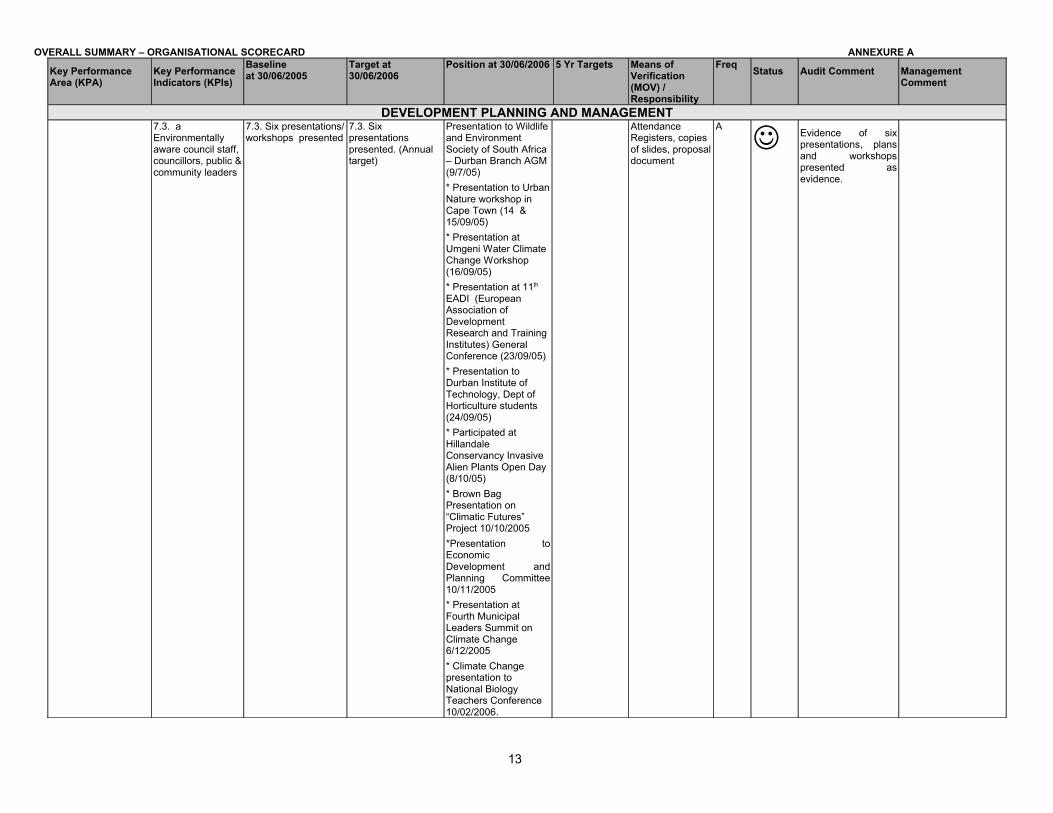
DEVELOPMENT PLANNING AND MANAGEMENT7.3. a Environmentally aware council staff, councillors, public & community leaders
7.3. Six presentations/ workshops presented
7.3. Six presentations presented. (Annual target)
Presentation to Wildlife and Environment Society of South Africa – Durban Branch AGM (9/7/05)* Presentation to Urban Nature workshop in Cape Town (14 & 15/09/05)* Presentation at Umgeni Water Climate Change Workshop (16/09/05) * Presentation at 11th
EADI (European Association of Development Research and Training Institutes) General Conference (23/09/05)* Presentation to Durban Institute of Technology, Dept of Horticulture students (24/09/05) * Participated at Hillandale Conservancy Invasive Alien Plants Open Day (8/10/05)* Brown Bag Presentation on “Climatic Futures” Project 10/10/2005*Presentation to Economic Development and Planning Committee 10/11/2005* Presentation at Fourth Municipal Leaders Summit on Climate Change 6/12/2005* Climate Change presentation to National Biology Teachers Conference 10/02/2006.
Attendance Registers, copies of slides, proposal document
A
Evidence of six presentations, plans and workshops presented as evidence.
13
OVERALL SUMMARY – ORGANISATIONAL SCORECARD ANNEXURE A
Key Performance Area (KPA)
Key Performance Indicators (KPIs)
Baselineat 30/06/2005
Target at 30/06/2006
Position at 30/06/2006 5 Yr Targets Means of Verification(MOV) / Responsibility
Freq Status Audit Comment Management Comment
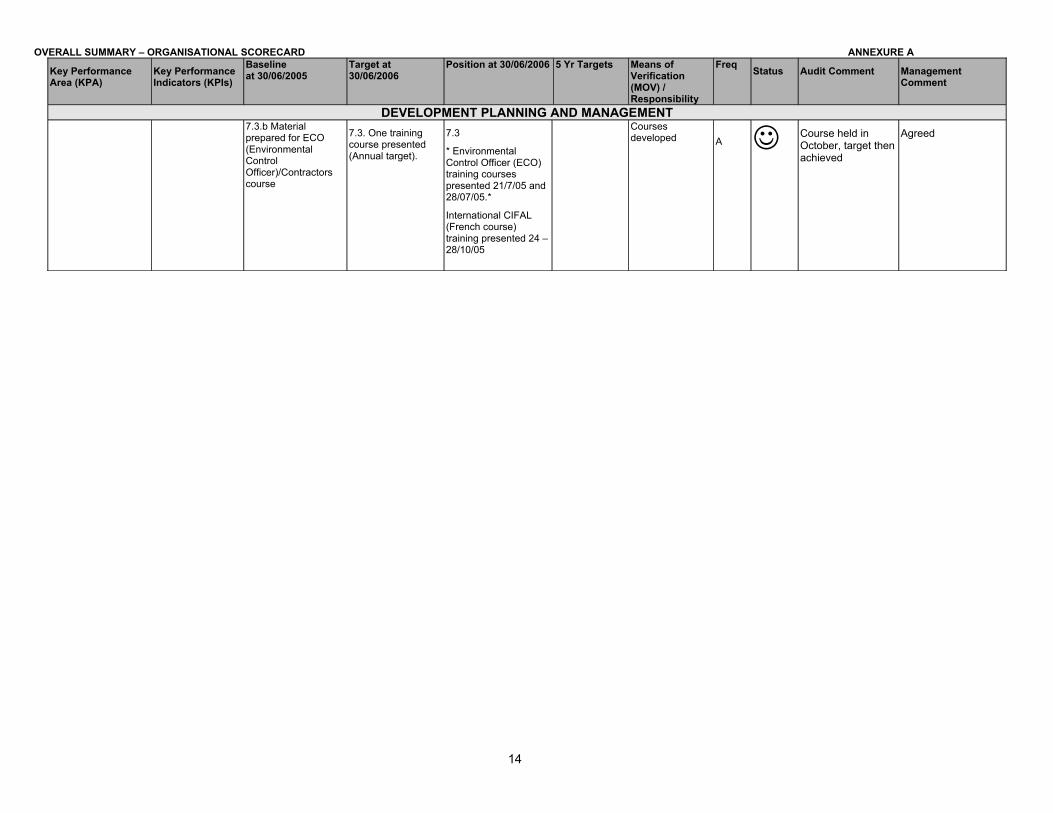
DEVELOPMENT PLANNING AND MANAGEMENT7.3.b Material prepared for ECO (Environmental Control Officer)/Contractors course
7.3. One training course presented (Annual target).
7.3
* Environmental Control Officer (ECO) training courses presented 21/7/05 and 28/07/05.*
International CIFAL (French course) training presented 24 – 28/10/05
Courses developed A Course held in
October, target then achieved
Agreed
14

OVERALL SUMMARY – ORGANISATIONAL SCORECARD ANNEXURE A
Key Performance Area (KPA)
Key Performance Indicators (KPIs)
Baselineat 30/06/2005
Target at 30/06/2006
Position at 30/06/2006 5 Yr Targets Means of Verification(MOV) / Responsibility
Freq Status Audit Comment Management Comment
DEVELOPMENT PLANNING AND MANAGEMENT7.3.c. All Environmental Management System (EMS)projects (2004/2005) with outreach component.
7.3. All Environmental Management System related projects include an environmental outreach and capacity building component.
(Annual target)
7.3. * Article written with the Coastal Projects Executive for the African Wildlife magazine. This was published in Vol. 59 No. 3
* Energy Audit Training for city officials 23-25/08/05.
* Climatic Futures DVD/CD/Video produced.* Amakhosi Ethekwini Environmental Services Management Plan Workshops 5/10/2005 and 14/10/2005Climatic Futures Public Panel Discussion 12/10/2005* Article written for Metro Ezasegagasini on COP11/MOP1 27/01/2006.* 6000 Information letters sent to all landowners affected by the eThekwini Environmental Services Management Plan June 2006.* Pilot Building Energy Efficiency awareness programme at City Engineers is ongoing (see evidence at 9.3.a).
Presentations Held
A
Listed evidence. Vidoeo’s, CD’s, Articles etc presented to proof that All Env.Man. System related projects include an environmental outreach and capacity building component.
Agreed
15

OVERALL SUMMARY – ORGANISATIONAL SCORECARD ANNEXURE A
Key Performance Area (KPA)
Key Performance Indicators (KPIs)
Baselineat 30/06/2005
Target at 30/06/2006
Position at 30/06/2006 5 Yr Targets Means of Verification(MOV) / Responsibility
Freq Status Audit Comment Management Comment
DEVELOPMENT PLANNING AND MANAGEMENT8.1 Establish a tracking and database system of all applications received by Environmental Management Department
8.1. System established
8.1. Establish and maintain trial system (annual target).
8.1. System in place and enhanced as needed
Database info and unit records
A
Trail system established and targets set.
Agreed. System will be enhanced in the new year.
8.2 Timeous response to applications and queries received.
8.2.Average times achieved (July04 – June05)* Building plans – 8.1 Days* Planning applications – 17 Days
* EIAs (Environmental Impact Assessment) – 18.6 Days
*Queries – 8.4 Days
Comment on:
Building plans within 2 weeks
Planning applications within 3 weeks
EIA’s (Environmental Impact Assessment) within 4 weeks
Queries within 14 days.(Annual targets)
8.2
Building Plans : 11 Days
Planning : 17 Days
EIA (Environmental Impact Assessment): 23 Days
Queries: 14 Days
Means of verification:Correspondence/ attendance records, presentations
A
Data sets revealed that targets were achieved
Agreed
8.3 Establish a system to review CAPMON (Capital Budget) projects for Environmental Impact Assessment implications
8.3 Zero All 2005/2006 CAPMON (Capital Budget) projects reviewed for Environmental Impact Assessment implications
Held series of work sessions with each line function department in order to assess their capital projects for 2005/06 budget in terms of legal requirements 3-5 August 2005. Ongoing monthly monitoring of approval process with Department of Agriculture and Environmental Affairs.
Planning application/Rezoning data
A
Progress Reviewed Correspondence/attendance records3day workshop with Capital line functions
Agreed
16

OVERALL SUMMARY – ORGANISATIONAL SCORECARD ANNEXURE A
Key Performance Area (KPA)
Key Performance Indicators (KPIs)
Baselineat 30/06/2005
Target at 30/06/2006
Position at 30/06/2006 5 Yr Targets Means of Verification(MOV) / Responsibility
Freq Status Audit Comment Management Comment
DEVELOPMENT PLANNING AND MANAGEMENT9.1. Revision and implementation of the eThekwini Municipality Environmental Management Policy (EMEMP)
9.1a. Ethekwini Municipality Environmental Management Policy amended
9.1.a. Ethekwini Municipality Environmental Management Policy to be revised every 5 years. (5 Year target)
9.1.a
* N/A. Amended 2004/05. Next revision due 2009/10.
* Amended Ethekwini Municipality Environmental Management Policy (EMEMP) submitted to Policy Committee (STRATMAN) 12/12/2005*Presentation made to Stratman Exco 06/02/06 on amended eThekwini Municipality Environmental Management Policy. Agreement to develop pop doc in 2006/2007. Amended policy to be referred to the planning committee and then submitted to the Executive Committee
Reports Available on the Internet
5 year target
NA EMEP revised (5year)Amended policy submittedEvidence of presentation on policy to various committees.
Agreed
17

OVERALL SUMMARY – ORGANISATIONAL SCORECARD ANNEXURE A
Key Performance Area (KPA)
Key Performance Indicators (KPIs)
Baselineat 30/06/2005
Target at 30/06/2006
Position at 30/06/2006 5 Yr Targets Means of Verification(MOV) / Responsibility
Freq Status Audit Comment Management Comment
DEVELOPMENT PLANNING AND MANAGEMENT9.1.b. Background report for Energy Strategy prepared
9.1.b. Development of sectoral environmental policy based on eThekwini Municipality Environmental Management Policy (Annual target).
9.1.b
* Proposal for State of Rivers Report and River Health Monitoring prepared 09/2005
* Consultant appointed to undertake River Health Monitoring 20/10/2005
* Proposal for State of Energy Report prepared 2/11/2005
* Consultant appointed to prepare State of Energy Report 16/11/2005
*River Health Monitoring proceeding see progress reports, meetings and timeline 27/01/06, 22/03/06, 31/03/06
*State of Energy Report proceeding see progress meeting 10/03/06* State of Energy Report complete
Reports 5 year target River health
Monitoring report.
State of Energy report
Agreed. Progress reports prepared, meetings held etc
9.2. Production of a State of Environment (SOE) Report
9. 2a. * 2003/2004 SOE Report completed
9.2.a. Updated SOE report produced every 5 years.
9.2.a. N/A . Next report is 2008/09 to be produced in 2009/10 financial year.
Reports 5 year target
NA - 5 yr target SOE Indicators –
Meetings & e-mails
Best Practice report completed
Agreed
18

OVERALL SUMMARY – ORGANISATIONAL SCORECARD ANNEXURE A
Key Performance Area (KPA)
Key Performance Indicators (KPIs)
Baselineat 30/06/2005
Target at 30/06/2006
Position at 30/06/2006 5 Yr Targets Means of Verification(MOV) / Responsibility
Freq Status Audit Comment Management Comment
DEVELOPMENT PLANNING AND MANAGEMENT9.2b.2004/2005 Best Practice Portfolio
9.2.b. Annual Headline Indicator and Best Practice reports (Annual target)
9.2.b
* Sectoral meetings held for Headline Indicator Report.
* Sectors contacted to submit data for Headline Indicator report 05/12/12
* Best Practice Portfolio completed
5 year target Headline Indicators
Report (2004/05) complete
Best Practice Directory (2005/06) complete
9.3. Development of a Climate Protection Programme
9.3. a & b Municipal Greenhouse Gas Emissions Inventory(2003/2004)
9.3.a. Implementation of 1 climate protection measure based on Green House Gas Inventory (Annual target) 9.3.b Revision of Green House Gas inventory every 3 years
9.3.a. Roll out of Buildings Energy Efficiency Programme audits completed
*Final Buildings Energy Efficiency Roll-Out Programme document completed
*Buildings Energy Efficiency Awareness Campaign City Engineers initiated 22/02/06 completion due 30/09/06
9.3.b N/A. Next inventory due 2006/07
Reports 5 year target Implemented 1
climate protection measure based on Green House Gas Inventory
Only end of 2007
9.3c Climate Futures Report: Phase 1
9.3 c Development of a climate Protection Action Plan (5 year target)
9.3c
*Clean Development Mechanism(C D M) Scoping Study completed
* CSIR appointed to undertake Phase 2 of the “Climatic Futures” Project.
* Sectoral meetings held for Climatic Futures – Phase 2” and interviews transcribed.* Climatic Futures Phase 2 – draft Headline Climate Change Adaptation Strategy completed.
Report and Unit Records on file
A
Although a five year plan. Climatic Futures Phase 2 draft has been completed
Agreed
19
OVERALL SUMMARY – ORGANISATIONAL SCORECARD ANNEXURE A
Key Performance Area (KPA)
Key Performance Indicators (KPIs)
Baselineat 30/06/2005
Target at 30/06/2006
Position at 30/06/2006 5 Yr Targets Means of Verification(MOV) / Responsibility
Freq Status Audit Comment Management Comment
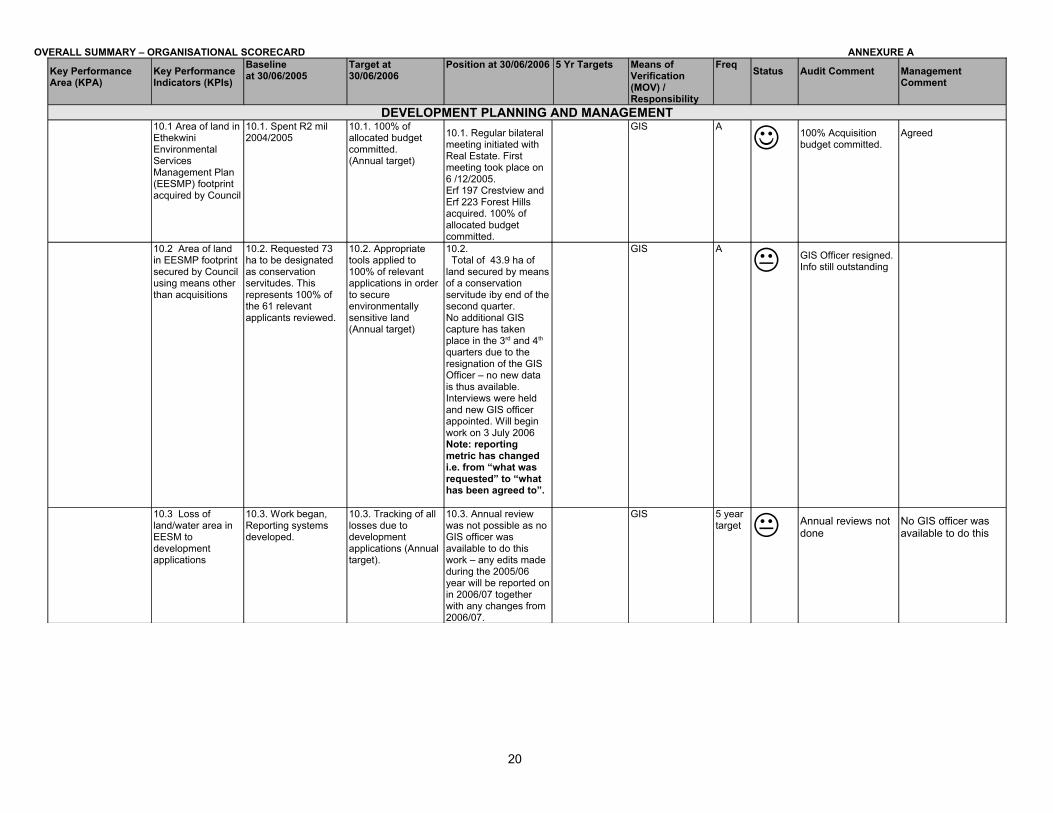
DEVELOPMENT PLANNING AND MANAGEMENT10.1 Area of land in Ethekwini Environmental Services Management Plan (EESMP) footprint acquired by Council
10.1. Spent R2 mil 2004/2005
10.1. 100% of allocated budget committed.(Annual target)
10.1. Regular bilateral meeting initiated with Real Estate. First meeting took place on 6 /12/2005.Erf 197 Crestview and Erf 223 Forest Hills acquired. 100% of allocated budget committed.
GIS A
100% Acquisition budget committed.
Agreed
10.2 Area of land in EESMP footprint secured by Council using means other than acquisitions
10.2. Requested 73 ha to be designated as conservation servitudes. This represents 100% of the 61 relevant applicants reviewed.
10.2. Appropriate tools applied to 100% of relevant applications in order to secure environmentally sensitive land (Annual target)
10.2. Total of 43.9 ha of land secured by means of a conservation servitude iby end of the second quarter. No additional GIS capture has taken place in the 3rd and 4th
quarters due to the resignation of the GIS Officer – no new data is thus available. Interviews were held and new GIS officer appointed. Will begin work on 3 July 2006Note: reporting metric has changed i.e. from “what was requested” to “what has been agreed to”.
GIS A
GIS Officer resigned. Info still outstanding
10.3 Loss of land/water area in EESM to development applications
10.3. Work began, Reporting systems developed.
10.3. Tracking of all losses due to development applications (Annual target).
10.3. Annual review was not possible as no GIS officer was available to do this work – any edits made during the 2005/06 year will be reported on in 2006/07 together with any changes from 2006/07.
GIS 5 year target Annual reviews not
doneNo GIS officer was available to do this
20

OVERALL SUMMARY – ORGANISATIONAL SCORECARD ANNEXURE A
Key Performance Area (KPA)
Key Performance Indicators (KPIs)
Baselineat 30/06/2005
Target at 30/06/2006
Position at 30/06/2006 5 Yr Targets Means of Verification(MOV) / Responsibility
Freq Status Audit Comment Management Comment
DEVELOPMENT PLANNING AND MANAGEMENT10.4 Incorporation of EESMP into all new development plans/ relevant policies
10.4. IDP Spatial Development Framework; North and Outer West Spatial Development Plans; proposed Rural Agricultural Policy; Integrated Transport plan; Giba Precinct Planning project; South Basin SDF included the Ethekwini Environmental Services Management Plan.
10.4. Ethekwini Environmental Services Management Plan incorporated in all City development plans and relevant policies produced during the 5 year period (5 year target).
10.4. . The draft South Spatial Development Plan has been reviewed and comments made on the need to include the eThekwini Environmental Services Management Plan in the base plan.
Giba precinct plan is under preparation. eThekwini Environmental Services Management Plan has been refined and has been incorporated in this draft spatial plan.
Specialist Biodiversity Assessment was done for the Harrison Flats, Cato Ridge Precinct plan currently being prepared.
GIS 5 year target
N/A (5yr) target
Progress:
Reviewed correspondence on;
South plan
Giba Gearge Precinct plan
Agreed.
10.5 Alignment of EESMP worth provincial biodiversity conservation plans
10.5. Adequate alignment (2003/2004)
10.5. Ethekwini Environmental Services Management Plan effectively responds to future changes in provincial conservation planning within the EMA (5 year target)
10.5. Baseline status unchanged
GIS 5 year target Frequency of
measure 5 yearlyAgreed
10.6 Development of targeted implementation tools/action
Zero Development of one tool/action. (annual target)
10.6 . Environmental servitude document produced for internal use and for developers/landowners. Workshop with senior town planners and new conditions of establishment adopted by town planning staff.
Production of one security document. Also increased compliance monitoring and enforcement
21
OVERALL SUMMARY – ORGANISATIONAL SCORECARD ANNEXURE A
Key Performance Area (KPA)
Key Performance Indicators (KPIs)
Baselineat 30/06/2005
Target at 30/06/2006
Position at 30/06/2006 5 Yr Targets Means of Verification(MOV) / Responsibility
Freq Status Audit Comment Management Comment
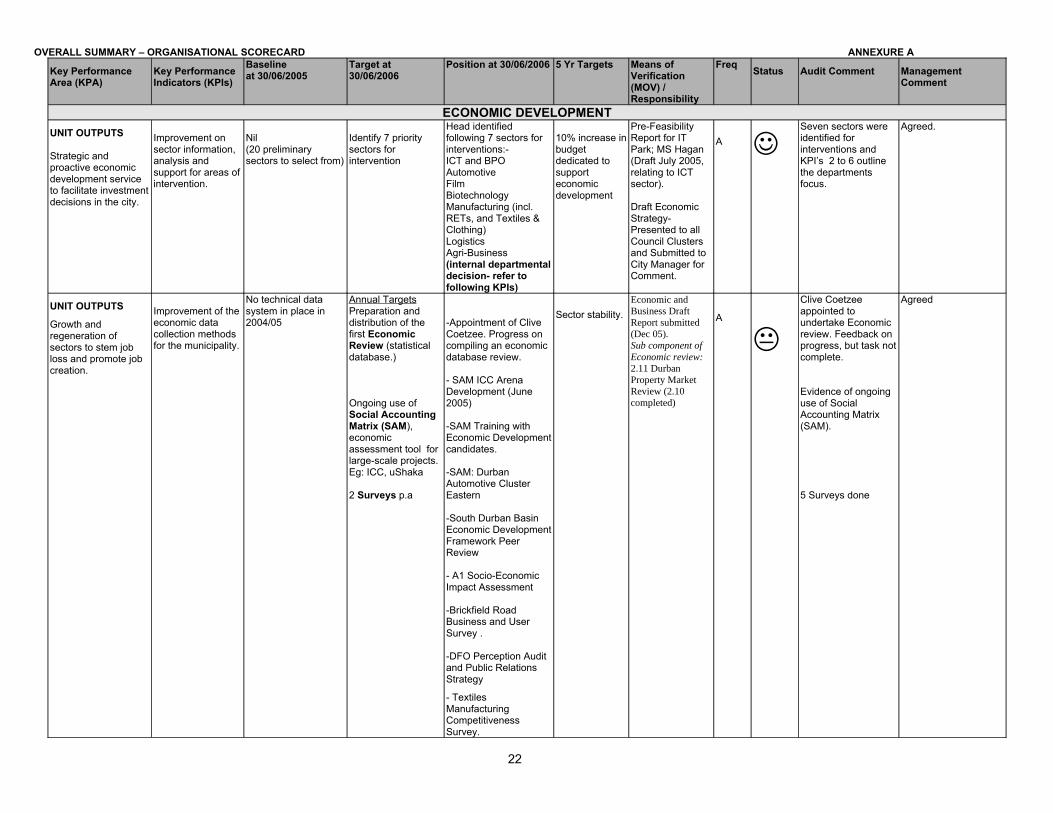
ECONOMIC DEVELOPMENTUNIT OUTPUTS
Strategic and proactive economic development service to facilitate investment decisions in the city.
Improvement on sector information, analysis and support for areas of intervention.
Nil (20 preliminary sectors to select from)
Identify 7 priority sectors for intervention
Head identified following 7 sectors for interventions:-ICT and BPOAutomotiveFilm BiotechnologyManufacturing (incl. RETs, and Textiles & Clothing) LogisticsAgri-Business(internal departmental decision- refer to following KPIs)
10% increase in budget dedicated to support economic development
Pre-Feasibility Report for IT Park; MS Hagan (Draft July 2005, relating to ICT sector).
Draft Economic Strategy- Presented to all Council Clusters and Submitted to City Manager for Comment.
A Seven sectors were identified for interventions and KPI’s 2 to 6 outline the departments focus.
Agreed.
UNIT OUTPUTS
Growth and regeneration of sectors to stem job loss and promote job creation.
Improvement of the economic data collection methods for the municipality.
No technical data system in place in 2004/05
Annual TargetsPreparation and distribution of the first Economic Review (statistical database.)
Ongoing use of Social Accounting Matrix (SAM), economic assessment tool for large-scale projects. Eg: ICC, uShaka
2 Surveys p.a
-Appointment of Clive Coetzee. Progress on compiling an economic database review.
- SAM ICC Arena Development (June 2005)
-SAM Training with Economic Development candidates.
-SAM: Durban Automotive Cluster Eastern
-South Durban Basin Economic Development Framework Peer Review
- A1 Socio-Economic Impact Assessment
-Brickfield Road Business and User Survey .
-DFO Perception Audit and Public Relations Strategy
- Textiles Manufacturing Competitiveness Survey.
Sector stability.Economic and Business Draft Report submitted (Dec 05).Sub component of Economic review:2.11 Durban Property Market Review (2.10 completed)
A
Clive Coetzee appointed to undertake Economic review. Feedback on progress, but task not complete.
Evidence of ongoing use of Social Accounting Matrix (SAM).
5 Surveys done
Agreed
22
OVERALL SUMMARY – ORGANISATIONAL SCORECARD ANNEXURE A
Key Performance Area (KPA)
Key Performance Indicators (KPIs)
Baselineat 30/06/2005
Target at 30/06/2006
Position at 30/06/2006 5 Yr Targets Means of Verification(MOV) / Responsibility
Freq Status Audit Comment Management Comment
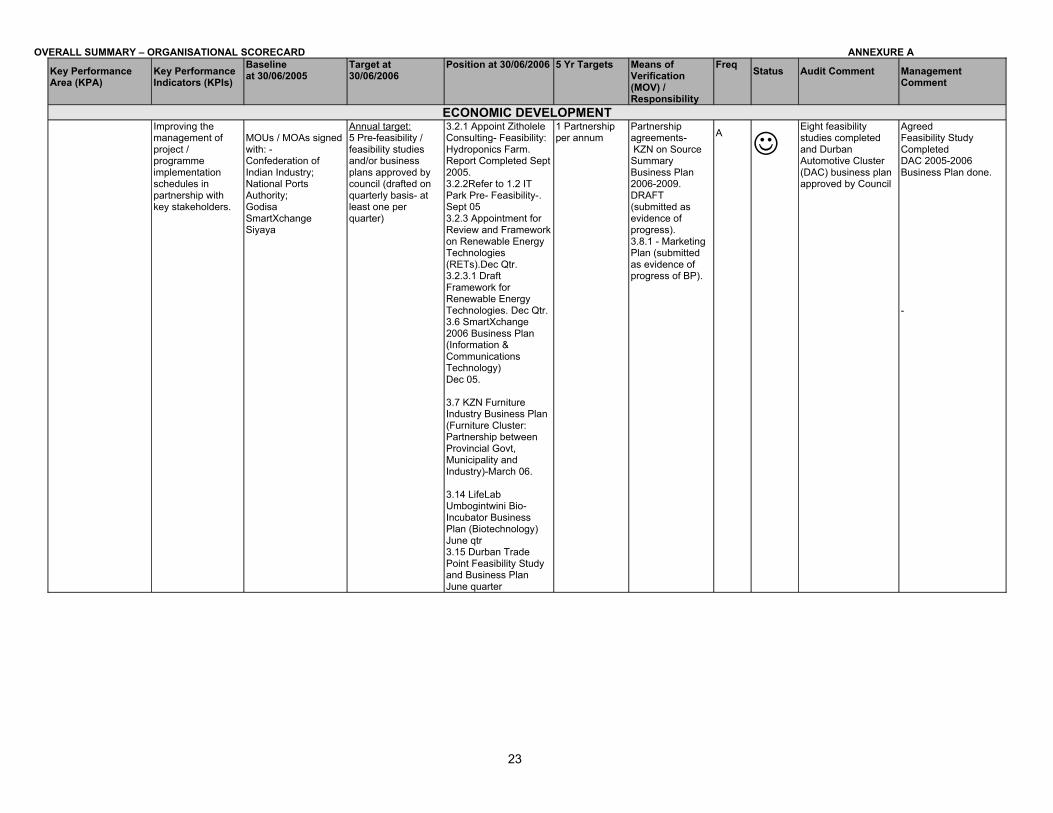
ECONOMIC DEVELOPMENTImproving the management of project / programme implementation schedules in partnership with key stakeholders.
MOUs / MOAs signed with: -Confederation of Indian Industry;National Ports Authority;GodisaSmartXchangeSiyaya
Annual target:5 Pre-feasibility / feasibility studies and/or business plans approved by council (drafted on quarterly basis- at least one per quarter)
3.2.1 Appoint Zitholele Consulting- Feasibility: Hydroponics Farm. Report Completed Sept 2005.3.2.2Refer to 1.2 IT Park Pre- Feasibility-.Sept 053.2.3 Appointment for Review and Framework on Renewable Energy Technologies (RETs).Dec Qtr. 3.2.3.1 Draft Framework for Renewable Energy Technologies. Dec Qtr.3.6 SmartXchange 2006 Business Plan (Information & Communications Technology)Dec 05.
3.7 KZN Furniture Industry Business Plan (Furniture Cluster: Partnership between Provincial Govt, Municipality and Industry)-March 06.
3.14 LifeLab Umbogintwini Bio-Incubator Business Plan (Biotechnology) June qtr3.15 Durban Trade Point Feasibility Study and Business Plan June quarter
1 Partnership per annum
Partnership agreements- KZN on Source Summary Business Plan 2006-2009. DRAFT (submitted as evidence of progress).3.8.1 - Marketing Plan (submitted as evidence of progress of BP).
A
Eight feasibility studies completed and Durban Automotive Cluster (DAC) business plan approved by Council
AgreedFeasibility Study CompletedDAC 2005-2006 Business Plan done.
-
23

OVERALL SUMMARY – ORGANISATIONAL SCORECARD ANNEXURE A
Key Performance Area (KPA)
Key Performance Indicators (KPIs)
Baselineat 30/06/2005
Target at 30/06/2006
Position at 30/06/2006 5 Yr Targets Means of Verification(MOV) / Responsibility
Freq Status Audit Comment Management Comment
ECONOMIC DEVELOPMENTAnnual target:2 new sector partnerships/ clusters (signed MOU/MOA) p.a
3.3. MOA with LifeLab
3.4. 1Port/City Interface Zones Conceptual Development Framework Plan (progress of MOU with NPA / Transnet) June 05
3.5 Agreement of Understanding: Durban Trade Point. (Dec 05)
3.9 MOA: KZN Dept Economic Development; eThekwini Municipality and SB Productions (Film Sector).March 06.
3.10 MOU: SACCCOM, Calling the Cape; Contacting Gauteng; Coega and KZNonSource (BPO Industry Partnership)-.March 06
3.11 Agreement of Undertaking: Textiles Footwear and Clothing-June qtr3.12 MOA: SEDA-June qtr3.13 MOA: TradePoint (Logistics Sector)-June qtr
MOU/MOA with SEDA, Trade Point, SACCOM, Lib Lab.
At least 2 new sector partnerships signed MOU/MOA’s.
Agreed
24
OVERALL SUMMARY – ORGANISATIONAL SCORECARD ANNEXURE A
Key Performance Area (KPA)
Key Performance Indicators (KPIs)
Baselineat 30/06/2005
Target at 30/06/2006
Position at 30/06/2006 5 Yr Targets Means of Verification(MOV) / Responsibility
Freq Status Audit Comment Management Comment
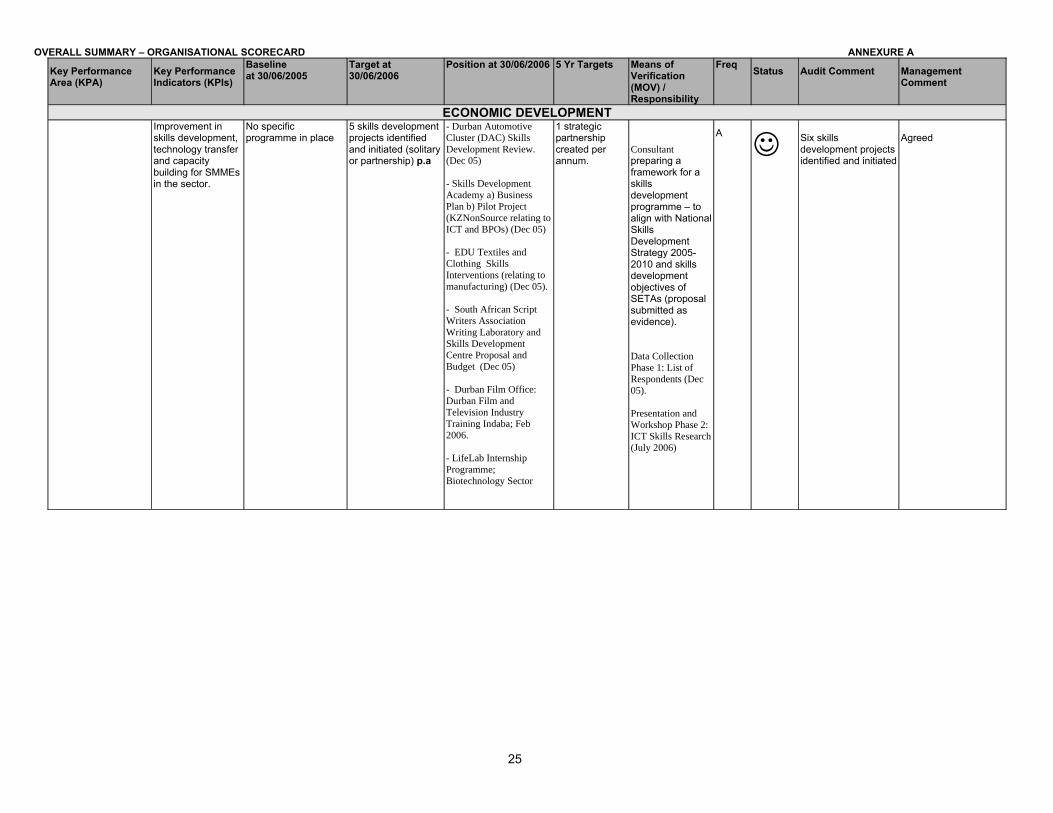
ECONOMIC DEVELOPMENTImprovement in skills development, technology transfer and capacity building for SMMEs in the sector.
No specific programme in place
5 skills development projects identified and initiated (solitary or partnership) p.a
- Durban Automotive Cluster (DAC) Skills Development Review. (Dec 05)
- Skills Development Academy a) Business Plan b) Pilot Project(KZNonSource relating to ICT and BPOs) (Dec 05)
- EDU Textiles and Clothing Skills Interventions (relating to manufacturing) (Dec 05).
- South African Script Writers Association Writing Laboratory and Skills Development Centre Proposal and Budget (Dec 05)
- Durban Film Office: Durban Film and Television Industry Training Indaba; Feb 2006.
- LifeLab Internship Programme; Biotechnology Sector
1 strategic partnership created per annum.
Consultant preparing a framework for a skills development programme – to align with National Skills Development Strategy 2005-2010 and skills development objectives of SETAs (proposal submitted as evidence).
Data Collection Phase 1: List of Respondents (Dec 05).
Presentation and Workshop Phase 2: ICT Skills Research (July 2006)
A
Six skills development projects identified and initiated
Agreed
25

OVERALL SUMMARY – ORGANISATIONAL SCORECARD ANNEXURE A
Key Performance Area (KPA)
Key Performance Indicators (KPIs)
Baselineat 30/06/2005
Target at 30/06/2006
Position at 30/06/2006 5 Yr Targets Means of Verification(MOV) / Responsibility
Freq Status Audit Comment Management Comment
ECONOMIC DEVELOPMENTImproving market access through product development and marketing support for SMMEs in the sector.
Nil 5 projects identified and implemented to increase the participation of BEEs and SMMEs p.a
-Furniture SMME Incubator (Dec 05)
-Furniture BEE Support Programme (Dec 05)
-First Draft of Textiles and Clothing Retrenchee Database (SMME support and development)
-National Productivity Contract to assist SMME in Textiles, Footwear and Clothing Industry.
-Public Private Processing Facility for 6 Indigenous Medicine Farms
-Financial Support for the KwaMashu African Documentary Film Festival Workshops.
-Tour of eThekwni Izimpande Programme: Medicinal Plant Farms and nurseries; Feb 2006 (Agri-Business Sector Event)
-SmartCity Workshop Summary; Feb 2006 (ICT Event)
-LifeLab Stakeholders Forum; March 2006 (Biotechnology Event)
-Furniture Cluster Website
A
Evidence reviewed of at least 5 projects identified and implemented to support participation of BEE’s and SMME’s.
Agreed
26

OVERALL SUMMARY – ORGANISATIONAL SCORECARD ANNEXURE A
Key Performance Area (KPA)
Key Performance Indicators (KPIs)
Baselineat 30/06/2005
Target at 30/06/2006
Position at 30/06/2006 5 Yr Targets Means of Verification(MOV) / Responsibility
Freq Status Audit Comment Management Comment
ECONOMIC DEVELOPMENT5 information sharing campaigns (events, newsletters, industry websites) p.a
-SmartXchange Newsletter “Smart News and Views from Durban’s ICT Hub” Vol 2 Number 3; March 2006 (ICT).
-Utility Cost Research Report and Workshop (Textiles, Footwear & Clothing).
- LifeLab (Biotechnology) Newsletter (September Vol: Issue 3).
-Indigenous Medicine Newsletter “Izimpande” Vol 1 Issue1 (relating to Agri-Business) (Dec 05)
-“Izimpande” Vol. 1 Issue 2 (AgriBusiness)
-Izimpande (Vol 1, Issue 3; Winter Issue)
-SmartXchange (Vol 1, No. 5; May 2006)
-KZNonSource (Vol 1, No. 2; June 2006)5.16 Durban Film Office Locations Database
Evidence of nine information sharing campaigns e.g. newsletters, events etc presented to audit
Agreed
27
OVERALL SUMMARY – ORGANISATIONAL SCORECARD ANNEXURE A
Key Performance Area (KPA)
Key Performance Indicators (KPIs)
Baselineat 30/06/2005
Target at 30/06/2006
Position at 30/06/2006 5 Yr Targets Means of Verification(MOV) / Responsibility
Freq Status Audit Comment Management Comment
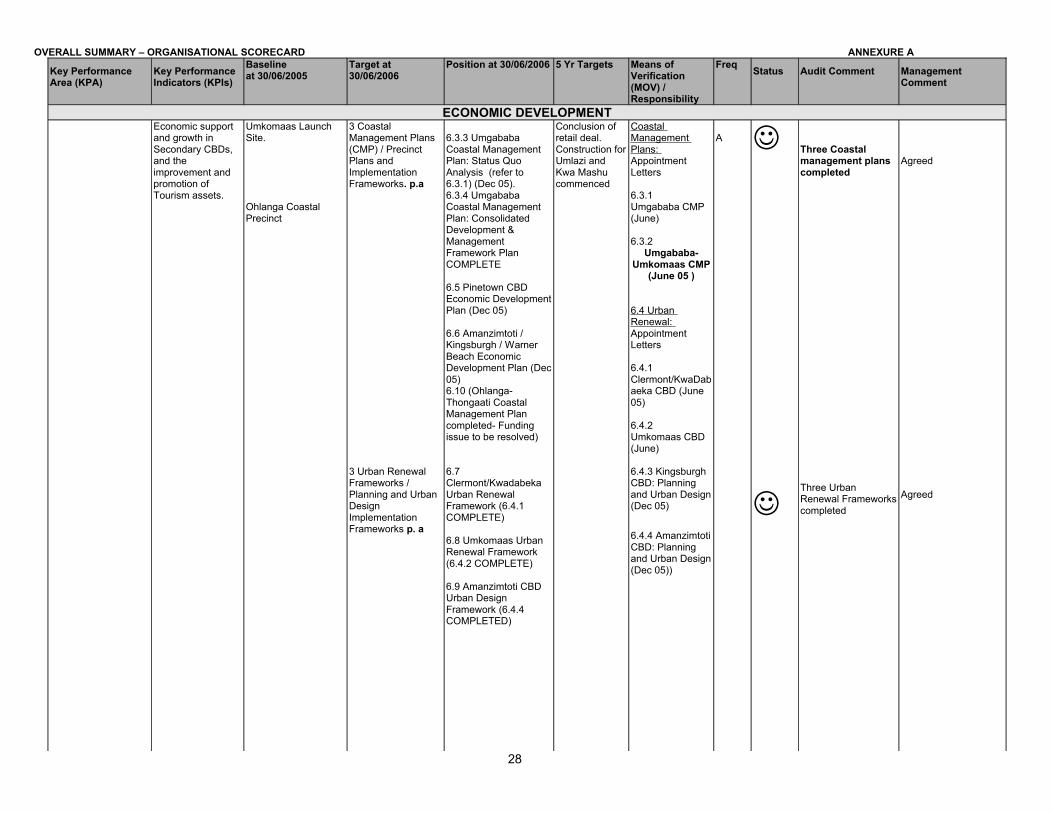
ECONOMIC DEVELOPMENTEconomic support and growth in Secondary CBDs, and the improvement and promotion of Tourism assets.
Umkomaas Launch Site.
Ohlanga Coastal Precinct
3 Coastal Management Plans (CMP) / Precinct Plans and Implementation Frameworks. p.a
3 Urban Renewal Frameworks / Planning and Urban Design Implementation Frameworks p. a
6.3.3 Umgababa Coastal Management Plan: Status Quo Analysis (refer to 6.3.1) (Dec 05).6.3.4 Umgababa Coastal Management Plan: Consolidated Development & Management Framework Plan COMPLETE
6.5 Pinetown CBD Economic Development Plan (Dec 05)
6.6 Amanzimtoti / Kingsburgh / Warner Beach Economic Development Plan (Dec 05)6.10 (Ohlanga-Thongaati Coastal Management Plan completed- Funding issue to be resolved)
6.7 Clermont/Kwadabeka Urban Renewal Framework (6.4.1 COMPLETE)
6.8 Umkomaas Urban Renewal Framework (6.4.2 COMPLETE)
6.9 Amanzimtoti CBD Urban Design Framework (6.4.4 COMPLETED)
Conclusion of retail deal. Construction for Umlazi and Kwa Mashu commenced
Coastal Management Plans: Appointment Letters
6.3.1 Umgababa CMP (June)
6.3.2Umgababa-
Umkomaas CMP (June 05 )
6.4 Urban Renewal: Appointment Letters
6.4.1Clermont/KwaDabaeka CBD (June 05)
6.4.2Umkomaas CBD (June)
6.4.3 Kingsburgh CBD: Planning and Urban Design (Dec 05)
6.4.4 Amanzimtoti CBD: Planning and Urban Design (Dec 05))
A
Three Coastal management plans completed
Three Urban Renewal Frameworks completed
Agreed
Agreed
28

OVERALL SUMMARY – ORGANISATIONAL SCORECARD ANNEXURE A
Key Performance Area (KPA)
Key Performance Indicators (KPIs)
Baselineat 30/06/2005
Target at 30/06/2006
Position at 30/06/2006 5 Yr Targets Means of Verification(MOV) / Responsibility
Freq Status Audit Comment Management Comment
BUSINESS SUPPORTUNIT OUTPUTS
(BUSINESS SUPPORT)
Provision of an integrated business support service to existing and potential businesses to enable them to participate in income generating activities resulting in increased income and job creation.
Construction Incubator
Architect appointed, Report presented to Bid Specification for renovations to Thuthukani Building.
Functional Incubator for 40 emerging sme’s by June 2006
Trust registered with Registrar of Companies, Incubator CEO appointed & launch scheduled for 28 September 2006. The admin & physical infrastructure is ready for the CEO to implement 40 functional sme’s.
Report being prepared for Tender Adjudication Committee
Documentation to form the Trust has been submitted to the Registrar of Companies.
A
Progress made but target not met. Functional Incubator for 40 emerging sme’s not operational
With the appointment of the CEO, eThekwini Municipality can now play an oversight role with regards the Incubator.
Regenerating R293 townships
Business nodes requiring attention identified
Secure R7m in the 2006/ 2007 capital budget.
R7m in the 2006/2007 capital budget was secured, the assumption was that Economic Development & Business Support would be merged & institutional arrangements finalised. Presently then R1m has been allocated in the BSU capital budget & the balance is at Economic Development.
3 year Draft capital budget for Economic R7m in the 2006/2007 capital budget secured. Umlazi: V-section, D Development section, J section, BB section & Umlazi Z/U section.
Claremont Top Rank, Kwa-Mashu Town Centre, Ward 98 & Inanda Tourism Trail identified.. Business Plan for the identified nodes.
A R7m secured in 2006/2007 capital budget
Agreed.
International Convention Centre: Finance & Mentorship support program
Ithala/ eThekwini MOU for finance & mentorship signed. Priority Business Enterprise targets set.
Finance & mentorship support for Priority Business Enterprise to the value of R80 million
R47,092,052.76 value of business for Priority Business Enterprises on the selected sub-contracts has been awarded.
Ithala Appoinment letter signed by Business Support, Architecture & Deputy City Manager.Work plan as well as joint venture document re Glazed Curtain Walling tender
A
R47m awarded to selected sub conytactors
The ICC is scheduled to be completed in April 2007. Once completed the Priority Business Enterprise contract value awarded for selected sub-contracts & principal building contracts will be consolidated.
29
OVERALL SUMMARY – ORGANISATIONAL SCORECARD ANNEXURE A
Key Performance Area (KPA)
Key Performance Indicators (KPIs)
Baselineat 30/06/2005
Target at 30/06/2006
Position at 30/06/2006 5 Yr Targets Means of Verification(MOV) / Responsibility
Freq Status Audit Comment Management Comment
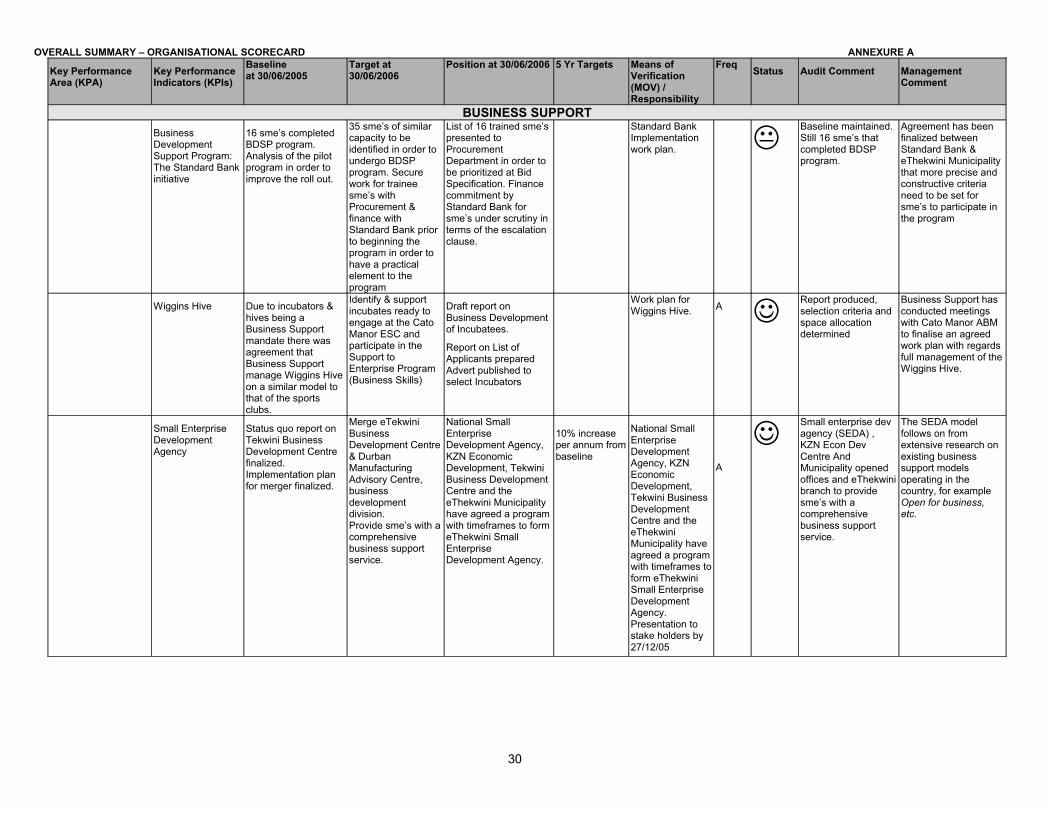
BUSINESS SUPPORTBusiness Development Support Program: The Standard Bank initiative
16 sme’s completed BDSP program. Analysis of the pilot program in order to improve the roll out.
35 sme’s of similar capacity to be identified in order to undergo BDSP program. Secure work for trainee sme’s with Procurement & finance with Standard Bank prior to beginning the program in order to have a practical element to the program
List of 16 trained sme’s presented to Procurement Department in order to be prioritized at Bid Specification. Finance commitment by Standard Bank for sme’s under scrutiny in terms of the escalation clause.
Standard Bank Implementation work plan.
Baseline maintained. Still 16 sme’s that completed BDSP program.
Agreement has been finalized between Standard Bank & eThekwini Municipality that more precise and constructive criteria need to be set for sme’s to participate in the program
Wiggins Hive Due to incubators & hives being a Business Support mandate there was agreement that Business Support manage Wiggins Hive on a similar model to that of the sports clubs.
Identify & support incubates ready to engage at the Cato Manor ESC and participate in the Support to Enterprise Program (Business Skills)
Draft report on Business Development of Incubatees.
Report on List of Applicants preparedAdvert published to select Incubators
Work plan for Wiggins Hive. A
Report produced, selection criteria and space allocation determined
Business Support has conducted meetings with Cato Manor ABM to finalise an agreed work plan with regards full management of the Wiggins Hive.
Small Enterprise Development Agency
Status quo report on Tekwini Business Development Centre finalized. Implementation plan for merger finalized.
Merge eTekwini Business Development Centre & Durban Manufacturing Advisory Centre, business development division.Provide sme’s with a comprehensive business support service.
National Small Enterprise Development Agency, KZN Economic Development, Tekwini Business Development Centre and the eThekwini Municipality have agreed a program with timeframes to form eThekwini Small Enterprise Development Agency.
10% increase per annum from baseline
National Small Enterprise Development Agency, KZN Economic Development, Tekwini Business Development Centre and the eThekwini Municipality have agreed a program with timeframes to form eThekwini Small Enterprise Development Agency. Presentation to stake holders by 27/12/05
A
Small enterprise dev agency (SEDA) , KZN Econ Dev Centre And Municipality opened offices and eThekwini branch to provide sme’s with a comprehensive business support service.
The SEDA model follows on from extensive research on existing business support models operating in the country, for example Open for business, etc.
30
OVERALL SUMMARY – ORGANISATIONAL SCORECARD ANNEXURE A
Key Performance Area (KPA)
Key Performance Indicators (KPIs)
Baselineat 30/06/2005
Target at 30/06/2006
Position at 30/06/2006 5 Yr Targets Means of Verification(MOV) / Responsibility
Freq Status Audit Comment Management Comment
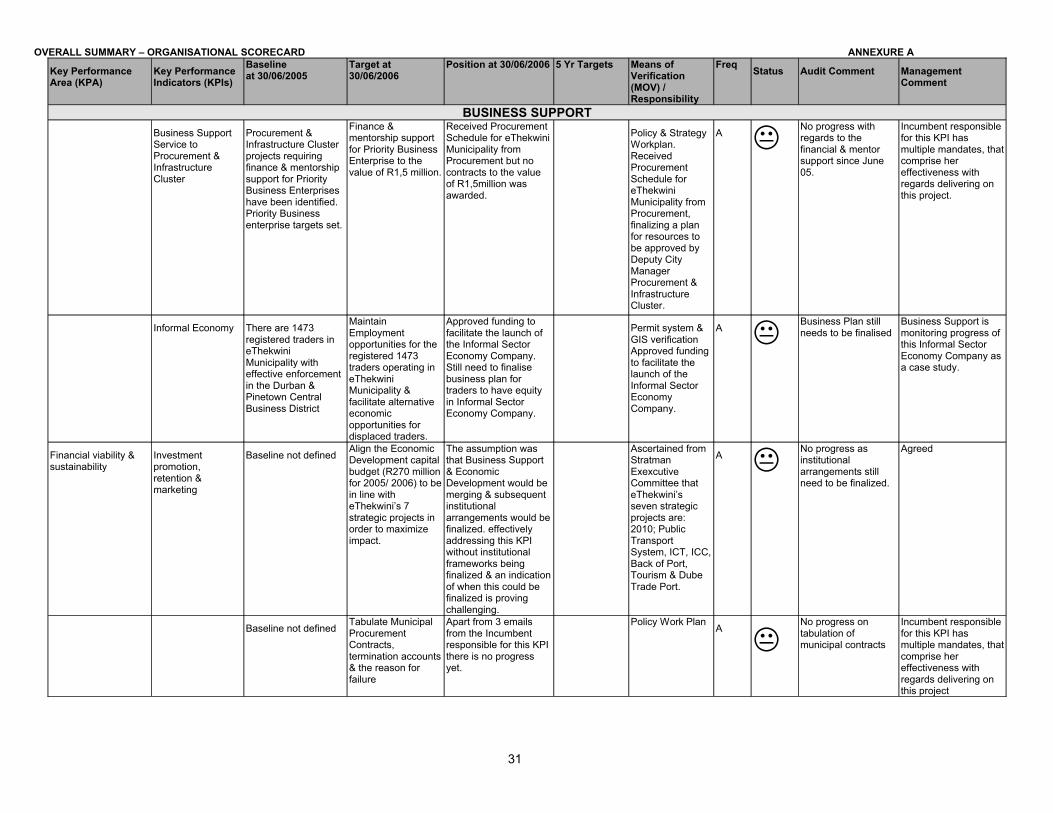
BUSINESS SUPPORTBusiness Support Service to Procurement & Infrastructure Cluster
Procurement & Infrastructure Cluster projects requiring finance & mentorship support for Priority Business Enterprises have been identified. Priority Business enterprise targets set.
Finance & mentorship support for Priority Business Enterprise to the value of R1,5 million.
Received Procurement Schedule for eThekwini Municipality from Procurement but no contracts to the value of R1,5million was awarded.
Policy & Strategy Workplan.Received Procurement Schedule for eThekwini Municipality from Procurement, finalizing a plan for resources to be approved by Deputy City Manager Procurement & Infrastructure Cluster.
A No progress with regards to the financial & mentor support since June 05.
Incumbent responsible for this KPI has multiple mandates, that comprise her effectiveness with regards delivering on this project.
Informal Economy There are 1473 registered traders in eThekwini Municipality with effective enforcement in the Durban & Pinetown Central Business District
Maintain Employment opportunities for the registered 1473 traders operating in eThekwini Municipality & facilitate alternative economic opportunities for displaced traders.
Approved funding to facilitate the launch of the Informal Sector Economy Company. Still need to finalise business plan for traders to have equity in Informal Sector Economy Company.
Permit system & GIS verificationApproved funding to facilitate the launch of the Informal Sector Economy Company.
A Business Plan still needs to be finalised
Business Support is monitoring progress of this Informal Sector Economy Company as a case study.
Financial viability & sustainability
Investment promotion, retention & marketing
Baseline not definedAlign the Economic Development capital budget (R270 million for 2005/ 2006) to be in line with eThekwini’s 7 strategic projects in order to maximize impact.
The assumption was that Business Support & Economic Development would be merging & subsequent institutional arrangements would be finalized. effectively addressing this KPI without institutional frameworks being finalized & an indication of when this could be finalized is proving challenging.
Ascertained from Stratman Exexcutive Committee that eThekwini’s seven strategic projects are: 2010; Public Transport System, ICT, ICC, Back of Port, Tourism & Dube Trade Port.
A No progress as institutional arrangements still need to be finalized.
Agreed
Baseline not definedTabulate Municipal Procurement Contracts, termination accounts & the reason for failure
Apart from 3 emails from the Incumbent responsible for this KPI there is no progress yet.
Policy Work PlanA
No progress on tabulation of municipal contracts
Incumbent responsible for this KPI has multiple mandates, that comprise her effectiveness with regards delivering on this project
31
OVERALL SUMMARY – ORGANISATIONAL SCORECARD ANNEXURE A
Key Performance Area (KPA)
Key Performance Indicators (KPIs)
Baselineat 30/06/2005
Target at 30/06/2006
Position at 30/06/2006 5 Yr Targets Means of Verification(MOV) / Responsibility
Freq Status Audit Comment Management Comment
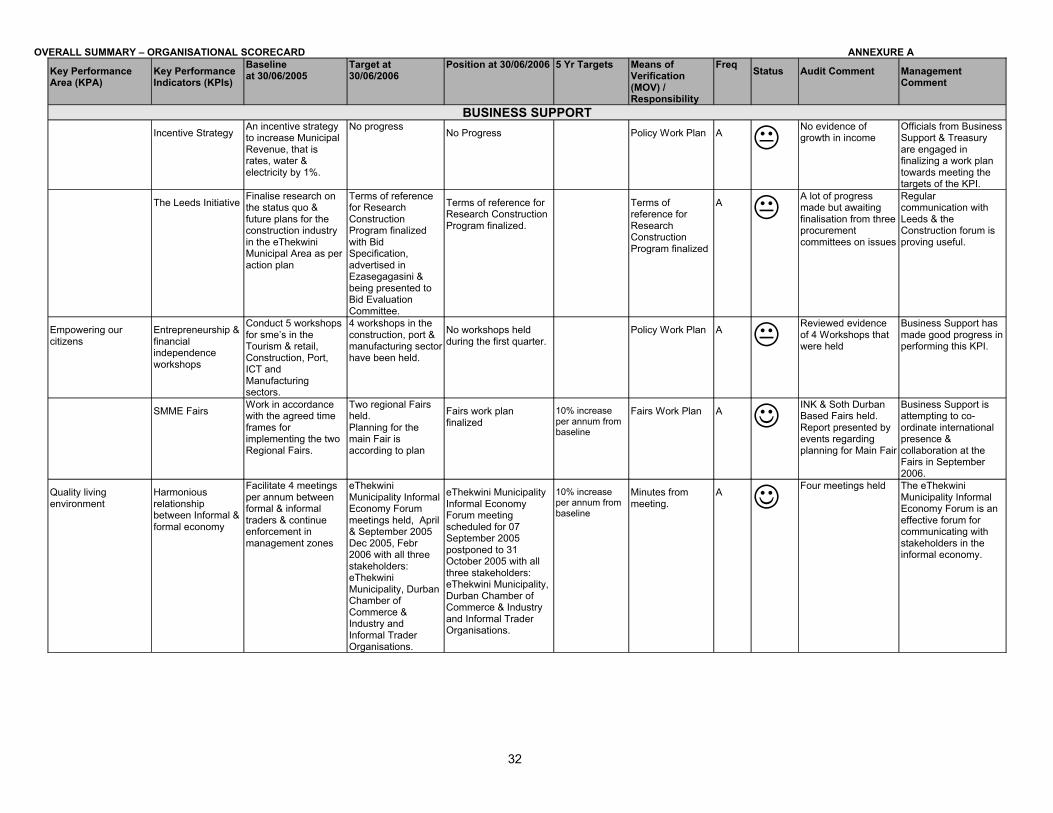
BUSINESS SUPPORTIncentive Strategy
An incentive strategy to increase Municipal Revenue, that is rates, water & electricity by 1%.
No progressNo Progress Policy Work Plan A
No evidence of growth in income
Officials from Business Support & Treasury are engaged in finalizing a work plan towards meeting the targets of the KPI.
The Leeds InitiativeFinalise research on the status quo & future plans for the construction industry in the eThekwini Municipal Area as per action plan
Terms of reference for Research Construction Program finalized with Bid Specification, advertised in Ezasegagasini & being presented to Bid Evaluation Committee.
Terms of reference for Research Construction Program finalized.
Terms of reference for Research Construction Program finalized
A A lot of progress made but awaiting finalisation from three procurement committees on issues
Regular communication with Leeds & the Construction forum is proving useful.
Empowering our citizens
Entrepreneurship & financial independence workshops
Conduct 5 workshops for sme’s in the Tourism & retail, Construction, Port, ICT and Manufacturing sectors.
4 workshops in the construction, port & manufacturing sector have been held.
No workshops held during the first quarter.
Policy Work Plan A Reviewed evidence of 4 Workshops that were held
Business Support has made good progress in performing this KPI.
SMME FairsWork in accordance with the agreed time frames for implementing the two Regional Fairs.
Two regional Fairs held.Planning for the main Fair is according to plan
Fairs work plan finalized
10% increase per annum from baseline
Fairs Work Plan A INK & Soth Durban Based Fairs held. Report presented by events regarding planning for Main Fair
Business Support is attempting to co-ordinate international presence & collaboration at the Fairs in September 2006.
Quality living environment
Harmonious relationship between Informal & formal economy
Facilitate 4 meetings per annum between formal & informal traders & continue enforcement in management zones
eThekwini Municipality Informal Economy Forum meetings held, April & September 2005 Dec 2005, Febr 2006 with all three stakeholders: eThekwini Municipality, Durban Chamber of Commerce & Industry and Informal Trader Organisations.
eThekwini Municipality Informal Economy Forum meeting scheduled for 07 September 2005 postponed to 31 October 2005 with all three stakeholders: eThekwini Municipality, Durban Chamber of Commerce & Industry and Informal Trader Organisations.
10% increase per annum from baseline
Minutes from meeting.
A Four meetings held The eThekwini
Municipality Informal Economy Forum is an effective forum for communicating with stakeholders in the informal economy.
32
OVERALL SUMMARY – ORGANISATIONAL SCORECARD ANNEXURE A
Key Performance Area (KPA)
Key Performance Indicators (KPIs)
Baselineat 30/06/2005
Target at 30/06/2006
Position at 30/06/2006 5 Yr Targets Means of Verification(MOV) / Responsibility
Freq Status Audit Comment Management Comment
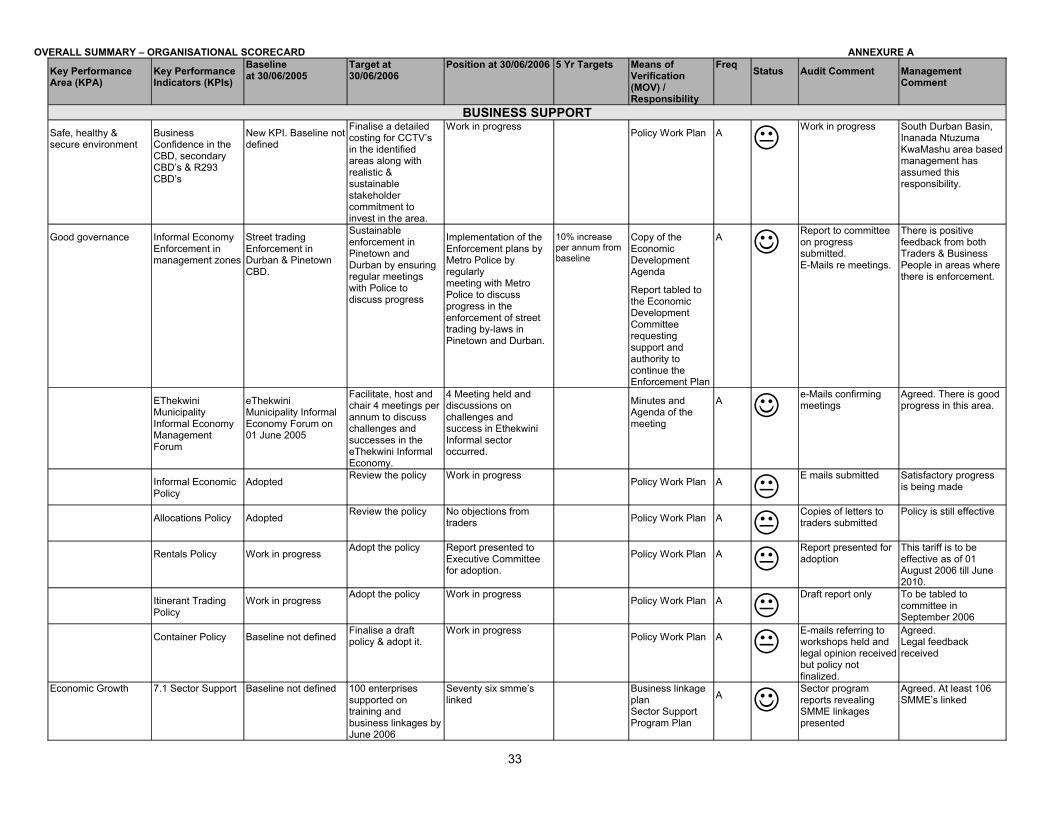
BUSINESS SUPPORTSafe, healthy & secure environment
Business Confidence in the CBD, secondary CBD’s & R293 CBD’s
New KPI. Baseline not defined
Finalise a detailed costing for CCTV’s in the identified areas along with realistic & sustainable stakeholder commitment to invest in the area.
Work in progressPolicy Work Plan A
Work in progress South Durban Basin, Inanada Ntuzuma KwaMashu area based management has assumed this responsibility.
Good governance Informal Economy Enforcement in management zones
Street trading Enforcement in Durban & Pinetown CBD.
Sustainable enforcement in Pinetown and Durban by ensuring regular meetings with Police to discuss progress
Implementation of the Enforcement plans by Metro Police by regularly meeting with Metro Police to discuss progress in the enforcement of street trading by-laws in Pinetown and Durban.
10% increase per annum from baseline
Copy of the Economic Development Agenda
Report tabled to the Economic Development Committee requesting support and authority to continue the Enforcement Plan
A Report to committee on progress submitted.E-Mails re meetings.
There is positive feedback from both Traders & Business People in areas where there is enforcement.
EThekwini Municipality Informal Economy Management Forum
eThekwini Municipality Informal Economy Forum on 01 June 2005
Facilitate, host and chair 4 meetings per annum to discuss challenges and successes in the eThekwini Informal Economy.
4 Meeting held and discussions on challenges and success in Ethekwini Informal sector occurred.
Minutes and Agenda of the meeting
A e-Mails confirming meetings
Agreed. There is good progress in this area.
Informal Economic Policy
AdoptedReview the policy Work in progress
Policy Work Plan A E mails submitted Satisfactory progress
is being made
Allocations Policy AdoptedReview the policy No objections from
traders Policy Work Plan A Copies of letters to traders submitted
Policy is still effective
Rentals Policy Work in progressAdopt the policy Report presented to
Executive Committee for adoption.
Policy Work Plan A Report presented for adoption
This tariff is to be effective as of 01 August 2006 till June 2010.
Itinerant Trading Policy
Work in progressAdopt the policy Work in progress
Policy Work Plan A Draft report only To be tabled to
committee in September 2006
Container Policy Baseline not definedFinalise a draft policy & adopt it.
Work in progressPolicy Work Plan A
E-mails referring to workshops held and legal opinion received but policy not finalized.
Agreed. Legal feedback received
Economic Growth 7.1 Sector Support Baseline not defined 100 enterprises supported on training and business linkages by June 2006
Seventy six smme’s linked
Business linkage planSector Support Program Plan
A Sector program reports revealing SMME linkages presented
Agreed. At least 106 SMME’s linked
33
OVERALL SUMMARY – ORGANISATIONAL SCORECARD ANNEXURE A
Key Performance Area (KPA)
Key Performance Indicators (KPIs)
Baselineat 30/06/2005
Target at 30/06/2006
Position at 30/06/2006 5 Yr Targets Means of Verification(MOV) / Responsibility
Freq Status Audit Comment Management Comment
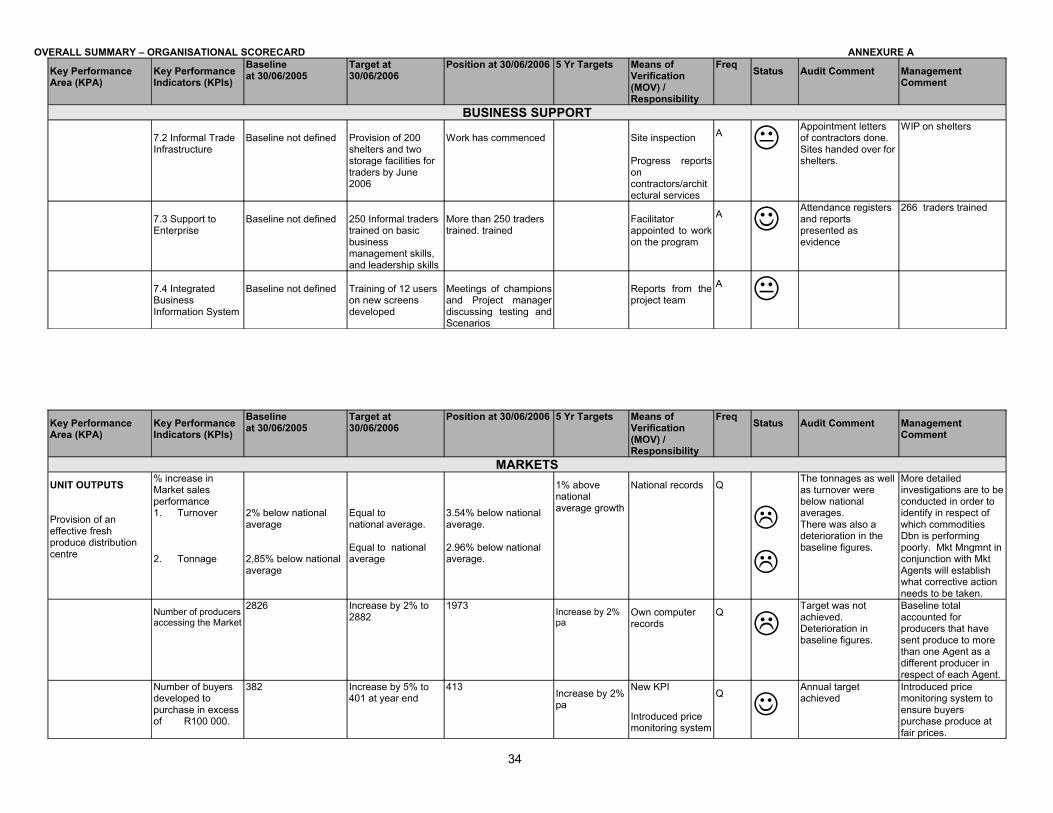
BUSINESS SUPPORT
7.2 Informal Trade Infrastructure
Baseline not defined Provision of 200 shelters and two storage facilities for traders by June 2006
Work has commenced Site inspection
Progress reports on contractors/architectural services
A Appointment letters of contractors done. Sites handed over for shelters.
WIP on shelters
7.3 Support to Enterprise
Baseline not defined 250 Informal traders trained on basic business management skills, and leadership skills
More than 250 traders trained. trained
Facilitator appointed to work on the program
A Attendance registers and reports presented as evidence
266 traders trained
7.4 Integrated Business Information System
Baseline not defined Training of 12 users on new screens developed
Meetings of champions and Project manager discussing testing and Scenarios
Reports from the project team
A
Key Performance Area (KPA)
Key Performance Indicators (KPIs)
Baselineat 30/06/2005
Target at 30/06/2006
Position at 30/06/2006 5 Yr Targets Means of Verification(MOV) / Responsibility
Freq Status Audit Comment Management Comment
MARKETSUNIT OUTPUTS
Provision of an effective fresh produce distribution centre
% increase in Market sales performance1. Turnover
2. Tonnage
2% below national average
2,85% below national average
Equal tonational average.
Equal to national average
3.54% below national average.
2.96% below national average.
1% above national average growth
National records Q
The tonnages as well as turnover were below national averages.There was also a deterioration in the baseline figures.
More detailed investigations are to be conducted in order to identify in respect of which commodities Dbn is performing poorly. Mkt Mngmnt in conjunction with Mkt Agents will establish what corrective action needs to be taken.
Number of producers accessing the Market
2826 Increase by 2% to 2882
1973 Increase by 2% pa
Own computer records
Q
Target was not achieved.Deterioration in baseline figures.
Baseline total accounted for producers that have sent produce to more than one Agent as a different producer in respect of each Agent.
Number of buyers developed to purchase in excess of R100 000.
382 Increase by 5% to 401 at year end
413Increase by 2% pa
New KPI
Introduced price monitoring system
Q
Annual target achieved
Introduced price monitoring system to ensure buyers purchase produce at fair prices.
34
OVERALL SUMMARY – ORGANISATIONAL SCORECARD ANNEXURE A
Key Performance Area (KPA)
Key Performance Indicators (KPIs)
Baselineat 30/06/2005
Target at 30/06/2006
Position at 30/06/2006 5 Yr Targets Means of Verification(MOV) / Responsibility
Freq Status Audit Comment Management Comment
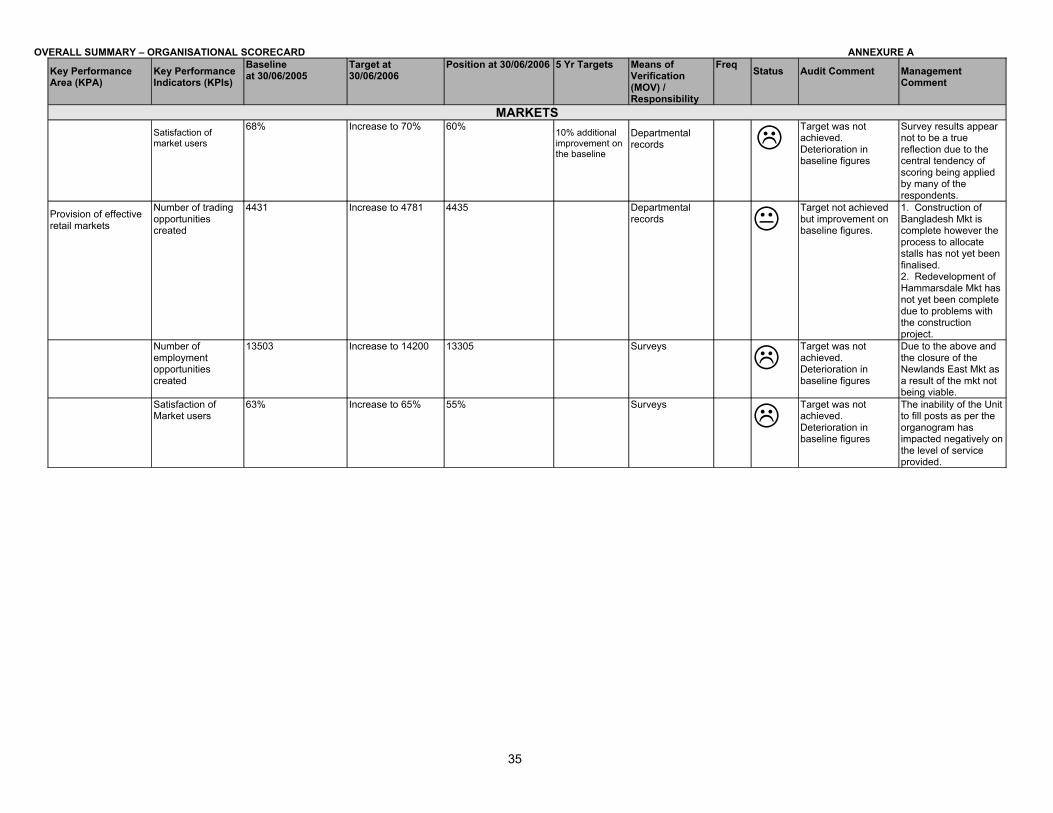
MARKETSSatisfaction of market users
68% Increase to 70% 60% 10% additional improvement on the baseline
Departmental records
Target was not achieved.Deterioration in baseline figures
Survey results appear not to be a true reflection due to the central tendency of scoring being applied by many of the respondents.
Provision of effective retail markets
Number of trading opportunities created
4431 Increase to 4781 4435 Departmental records
Target not achieved but improvement on baseline figures.
1. Construction of Bangladesh Mkt is complete however the process to allocate stalls has not yet been finalised. 2. Redevelopment of Hammarsdale Mkt has not yet been complete due to problems with the construction project.
Number of employment opportunities created
13503 Increase to 14200 13305 Surveys
Target was not achieved.Deterioration in baseline figures
Due to the above and the closure of the Newlands East Mkt as a result of the mkt not being viable.
Satisfaction of Market users
63% Increase to 65% 55% Surveys
Target was not achieved.Deterioration in baseline figures
The inability of the Unit to fill posts as per the organogram has impacted negatively on the level of service provided.
35

OVERALL SUMMARY – ORGANISATIONAL SCORECARD ANNEXURE A
SERVICE DELIVERY SCORECARD
36
Key Performance Area (KPA)
Key Performance
Indicators (KPIs)
Baselineat 30/06/2005
Target at 30/06/2006
Position at
30/06/2006
5 Yr Targets Means of Verification
(MOV) / Responsibility
Freq Status
Audit Comment
Management Comment

OVERALL SUMMARY – ORGANISATIONAL SCORECARD ANNEXURE A2 stock items for
37
Unit Outputs(Procurement
Cost effective Procurement Service to Cluster and Units
Integrated Procurement and monitoring system
Integrated Supplier directory installed
FP Lite and Capmon operational
Capmon and FP Lite fully operational. Also work has begun on the module for Bid Administration – anticipated completion date 31 December 2006.
Implementation Complete
Progress Reports
A
Target not achieved.Desktop capture of Service Providers in the Supplier Directory has not been fully evaluated
Disagreed. Per Deputy Head : Policy and Support : The current practice is to fully accredit ServiceProviders that have reached the Bid threshold. i.e. Are tending through the Bid Committee route.
% of compliance with Service Level Agreements
Draft Service Charter
Draft Service Level Agreementin place by 30.06.05
Draft agreement completed and Unit monitoring implementation to assess impact.
90% Compliance Service Records / Logbook
A
Target not achieved, however improvement in baseline.
Agreed.
Optimum utilisation of economies of scale to reduce costs
Identify stock items for cost saving for the period ended 30 /06/06
No stock items identifiedOptimisation in terms of most responsiveness and Policy 10 % cost reduction to at least 5 items identified
Financial Records
A
No change from previous quarter
Agreed.
Key Performance Area (KPA)
Key Performance Indicators (KPIs)
Baselineat 30/06/2005
Target at 30/06/2006
Position at
30/06/2006
5 Yr Targets Means of Verification
(MOV) / Responsibilit
y
Freq Status
Audit Comment
Management Comment
Effective utilisation of Procurement Policy to achieve Black Economic Empowerment
Increased % of contracts / business value awarded to Targeted Businesses
53.69 % 38.5 % 48.65 % 50% Tenders and Contracts Register
A
Targets Achieved. Target is much less than the baseline as last year was an over achievement which may not be met for this year.
Agreed
Increased participation of Woman Business Enterprises
7.25 % Increase of 3.50 % 13.59 % 5% Tenders and Contracts Register
A
Targets Achieved Agreed
Priority Business Enterprises
13.59 % Increase of 2 % 26.58 % 25% Tenders and Contracts Register
A
Targets Achieved Agreed
Local Businesses 40.25 % Increase of 13 % 70.96 % 25% Tenders and Contracts Register
A
Targets Achieved Agreed
UNIT OUTPUTSReduction of Council’s stock holding to release funds for delivery projects
Stock Holding is R68.20m
Dead / Obsolete Stock 5.7 % 7.95 % 5.39 % of stock 50% Reduction Financial Records
A
Targets Achieved
Agreed.
Excess/Slow Moving Stock
8.43 % 5.37 % 10.87 % of stock 50% Reduction Financial Records
A
Target not achieved
Agreed. Measures wil be taken to attempt achieving target for the next financial yearKey Performance
Area (KPA)Key Performance Indicators (KPIs)
Baselineat 30/06/2005
Target at 30/06/2006
Position at
30/06/2006
5 Yr Targets
Means of Verification
(MOV) / Responsibility
Freq Status Audit Comment
Management Comment
UNIT OUTPUTS
Extend water and sanitation infrastructure to unserved families
Number of households not supplied with water services
55 432 41 750 47 127 Nil GIS Report A Baseline Improved on but Target not achieved
The target was set to meet the Cabinet target of access to all by 2008. Insufficient funding has been provided to make achievement of the target possible.
Sanitation services(Backlog) 140 193 172 375 129 588 178 750 GIS Report A
Target Achieved
Agreed
Water Loss 29.1 % 27,59 % 31,8 % By 60% of baseline
Billing A
Backward movement on Baseline
1600 km of bursting water mains need to be replaced and illegal connections are proving difficult to eradicate.
Time to repair faults < 24 hrs
> 24 hrs < 48 hrs
> 48 hours
83,99%
6,72 %
9,278 %
88,99 %
6,36 %
4,65 %
90,27 %
4,27 %
5,46 %
100%
0%
0%
Call Centre
A
Baseline Improved on but Target not achieved
Backward movement on Baseline
Baseline Improved on but Target not achieved
Agreed
Agreed
Agreed
Time to install new connections
< 14 days
> 14 days
32.157 %
67.84 %
58,57 %
41,43 %
56,38 %
43,62 %
100%
0%
JD Edwards
A
Baseline Improved on but Target not achieved
Baseline Improved on but Target not achieved
Systems now in place to ensure that this target is met in future months.
Systems now in place to ensure that this target is met in future months.
Key Performance Area (KPA)
Key Performance
Indicators (KPIs)
Baselineat 30/06/2005
Target at 30/06/2006
Position at
30/06/2006
5 Yr Targets Means of Verification
(MOV) / Responsibility
Freq Status Audit Comment Management Comment
Key Performance Area (KPA)
Key Performance Indicators (KPIs)
Baselineat 30/06/2005
Target at 30/06/2006
Position at
30/06/2006
5 Yr Targets Means of Verification
(MOV) / Responsibility
Freq Status Audit Comment
Management Comment
UNIT OUTPUTS(ENGINEERING)
Provide and maintain affordable, quality, equitable and efficient engineering infrastructure
Roads Visual Condition Index
76 % To maintain average VCI at 70% or higher.
80,7 %5% improvement in rating
Pavement Management System
A
Target achieved.
Agreed.
Gravel to surfaced road upgrade
Completed 57 km = 28.8 % of the 5 year target
Surface 26 kms of gravel road per annum.
Completed 41,6 kms. Surface 130
km of gravel road over 5 years
Pavement Management System
A
Target achieved.
Agreed.
Reduce the number of premises subject to flooding through the implementation of identified network deficiency improvement projects
Completed 58 projects undertaken
58 projects per annum.
Completed 59 projects. Reduce by 5% Floodlines A
Target achieved.We need to relook at this KPI for the future years as the target is directly dependant on budget allocation. Our budgets have been reduced and this will impact on the KPI. Also the new EIA regulations which came into effect on 3 July 2006 will further delay our projects.
Improved storm water maintenance
7550 complaints were received.
8550 complaints for the year ending 30 June 2006.
4663 complaints Reduce by 10% Complaints register/call centre
A
Target achieved.
Key Performance Area (KPA)
Key Performance Indicators (KPIs)
Baselineat 30/06/2005
Target at 30/06/2006
Position at
30/06/2006
5 Yr Targets Means of Verification
(MOV) / Responsibility
Freq Status Audit Comment
Management Comment
UNIT OUTPUTS(ENGINEERING)
Provide and maintain affordable, quality, equitable and efficient engineering infrastructure
Number of days beach width is acceptable for recreational purposes
251 615 m3 267 000 m3 for the year ending 30 June 2006.
269 300 m3 95% of peak period
Beach Survey data
A
Target achieved. Agreed.
Sites for housing development with engineering services designed, tenders advertised and adjudicated, and ready for award by Housing Unit.
28 199 sites were ready for award =
14 936 sites for the year ending 30 June 2006.
15 588 sites are ready for award.
90 % of sites funded need to be awarded for every financial year
Status Reports A
Target achieved. Achievement of
the target is misleading as this KPI does not reflect the output from the Engineering Unit (due to the approach being adopted for housing delivery).
A new KPI will need to be adopted to reflect Development Engineering Dept’s contribution to the Unit’s Performance during 2006/2007.
% of Council covered by pro-active maintenance plan
22.8 % 30 % of Council buildings ( value ) need to be covered by a pro-active maintenance plan.
36 % 90% Building Management System
A
Target achieved. Agreed.
Match client department delivery programmes (% budget spent)
82 % The year target is to match 90 % of departmental project delivery programmes.
99 % To be determined
Financial Records A
Target achieved. Agreed.
Education and waste minimisation
(KDBA)
Clean Streets 0.6 % 0.5 % 0.6 % 0.5 % Photometric Audit
BI-A
Target achieved Head: Solid Waste
Agreed
Community Projects (Gardening, Recycling, Buy Back Centres)
48 30 71 30 Projects Register M
Targets achieved Agreed
School Programmes 1380 1483 1453 1690 Schools & Tours
RegisterM
Baseline Improved on but Target not achieved
Based on the school calendar, and the exam schedule, target not achieved. However, improvement on baseline.
Adopt A Spot 758 839 804 1000 Register M
Baseline Improved on but Target not achieved
Target not achieved, related to time delays involved in setting up, and community support towards these projects. However, improved on baseline.
Adopt A Verge 189 195 278 207 Register M
Target achieved Agreed
Increased number of households- Formal
- Informal
710 500
306 800
807 000
260 000
762 550
328 582
1 000 000
340 000
Department Records
A
Baseline improved on but target not achieved.
Target achieved
Target for services to formal household not achieved, as services can only be introduced once houses are completed and occupied. However, improved on baseline.
Agreed
Education and waste minimisation
(KDBA)
Increased utilisation of service and facilities. (Landfill site incl. Cash & account customers
18 254 19 003 19 522 20 500 Department Records
A Target achieved Agreed
Timeous response to complaints lodged
Response to complaints within 3 days
Response to complaints within 3 days
Response to complaints within 3 days
Response to complaints within 3 days
Department Records M
Targets achieved Agreed
Expansion of waste disposal facilitiesGarden refuse site:
Transfer station:
Landfill:
10
6
3
10
6
3
10
6
3
10
6
3
Department Records A
Targets Achieved
Agreed
Increased number of businesses utilising services.(Trade and Industry customers)
20 940 21 960 21 737 24000 Department Records
Q
Baseline improved on but target not achieved
Target not achieved, due to direct competition with the private waste management service providers. However, improvement on baseline.
UNIT OUTPUTS(HOUSING)
A well managed housing programme
Increased number of purchasers and tenants taking transfer
5 806 Selling UnitsTransferred 483 units.
9890 Rental UnitsTransferred 304 units
400 units
600 units
563 unitstransferred
114 units transferred
-Transfer 2000 Selling units over 5 years
-Transfer 3000 Rental units over 5 years
Status report on Transfers
Housing Stock Report
A
Achieved above the Target.
Target not achieved but improvement on baseline. There is insufficient Audit information available to verify the change in the baseline figure from 9758 units to 9890 units.
Agreed.
The delay was due to the finalising of the Sales Agreement. 1096 tenants have since signed the purchase and sale Agreements and are currently awaiting transfer. Baseline figure – This matter will be pursued with the IT Department.
Well administered, maintained and affordable rented units
Not auditable
Not auditable
Deficit as at 30/06/05 R28 766 208
Emergency repairs Within 24hrs - 75%Within 48hrs - 10%Within 72hrs - 10%Within 72hrs - 5%Jobs Outstanding
Routine repairs Within 30days – 50%Within 90days – 20%Within 150days – 20%Above 150days – 10%Jobs Outstanding
Improve on deficit by 5%
91.52%
5.56%1.02%1.79%0.13%
9.98%1.31%0.50%0.55%
87.67%
R68 360 632
Emergency Repairs – within 24 hours
Routine Repairs within 30 days
Reduce baseline Deficit by 5% per year
Financial Statements
Complaints Register
A
Achieved above the target.
Target not achieved.
Target not achieved.
Agreed.
Due to financial constraints only emergency repairs are undertaken and the balance will be dealt within the the Rehabilitation Program.
Increase in deficit due to :Provision for doubtful debts - R30 881 162Upgrading of Flats R33 158 295 (Council authority to fund from HDF)
Improved living conditions
Not auditable
Not Auditable
HostelsKwa Mashu - 775 BedsDalton - 288 BedsSJ Smith - 750 BedsJacobs - 680 BedsUmlazi Glebelands Hostels - 750 Beds
Emergency repairs within 24hrs – 75%Within 48hrs – 10%Within 72hrs – 10%Above 72hrs – 5%
1680149 307781
552
90.61%8.16%1.10%
0
Complete Upgrades for all Hostels as per approved Business Plan
Emergency Repairs – within 24hrsRoutine repairs within 30 days
Status Report on Upgrades
Complaints Register
A
Target not achieved.
Achieved above the Target.
Insufficient funding. Funding that was earmarked from HOD was delayed. Problems were experienced with the contractors in respect of productivity and workmanship.
Agreed.
Provision of Housing Engineering Services to reduce Housing Backlog
14 151 sites 10 000 sites 15 680 sites 10 000 for first 4 years and 16000 for the fifth year (2008).
Status Reports A
Achieved above the Target.
Agreed.
Reduced housing backlogs
15 110 units 10 000 units 11 552 units Develop 16 000 Housing Units per year over 5 years
Status Reports
A
Achieved above the Target.
Agreed.
UNITS OUTPUTS(ELECTRICITY)
The provision of an integrated and well maintained electrical infrastructure to provide electricity and public lighting services that is affordable and appropriate
New delivery connections : Credit
Meet Customer Requirements 88 %
88 % 96 % 95% of applications received completed within standard time.
Application Records plus MIMS
Q Target Achieved
Head: Electricity
Exceeded target by 9 %
New Delivery Connections: EFA
Meet Customer Requirements – 65 %
30.2 % 75 % 50% of applications received completed within standard time
Q
Target Achieved
Exceeded target by 149 %
New Delivery Housing
Electrify houses for which Housing have made applications and paid costs 92 %
86 % 82 % 95% of applications received completed within standard time
Records Q
Target Not Achieved
Missed target by only 4.6 % due to:
1.Shortage of skills, contractors de-listed due to fraud.2. Delays in installation of electrical infrastructure due to Housing construction not being phased to suit availability of electrical infrastructure.3. Ellipse upgrade rendered progress reports unavailable.
Quality of supply
Restoration (NRS 047)
33.6% within 1.5hrs 65.9% within 3.5hrs
80.3% within 7.5hrs
89.1% within 24hrs
30 %
60 %
79
87
32.5 %
60.2 %
92.9%
99%
Restoration :30% within 1.5hrs
60% within 3.5hrs
85% within 7.5hrs
90% within 24hrs
Fault Records Q
Target Achieved
Exceeded target by 8.3 %
Exceeded target by 0.3 %
Exceeded target by 23 %
Exceeded target by 13.8 %

OVERALL SUMMARY – ORGANISATIONAL SCORECARD ANNEXURE A cost saving for the year ended 30 /06/05.
38