Embed Size (px)
Citation preview

RepoRt of the SecRetaRy-GeneRal’S
hiGh-level adviSoRy GRoup on climate chanGe financinG
5 November 2010

1
CONTENTSForeword by the Secretary-General ...........................................................................................................2
Foreword by the Co-Chairs of the Advisory Group ......................................................................................3
Members of the Advisory Group .................................................................................................................4
Executive summary ....................................................................................................................................5
I. Introduction ............................................................................................................................................7
II. Conclusions from the analysis................................................................................................................10
A. The overall challenge ........................................................................................................................10
B. Sources and instruments .................................................................................................................10
C. Combining instruments ....................................................................................................................11
D. Time horizons ...................................................................................................................................13
E. Spending wisely ................................................................................................................................13
III. Concepts and methods ..........................................................................................................................14
A. Sources ............................................................................................................................................14
B. Criteria ............................................................................................................................................17
IV. Assessment of sources ..........................................................................................................................22
A. Revenue estimates and analysis ......................................................................................................22
B. Sources and instruments over time .................................................................................................28
C. Spending wisely ...............................................................................................................................28
V. Combining instruments ...........................................................................................................................31
A. Sources and end use ........................................................................................................................31
B. Combining public instruments ..........................................................................................................32
C. Leveraging gross flows ....................................................................................................................32
D. Creating coherent combinations ....................................................................................................33
Annexes
I: Terms of reference of the High-level Advisory Group on Climate Change Financing .................................34
II: Detailed methodology ............................................................................................................................36
III: Examples of spending wisely .................................................................................................................53

2 3
FOREwORD By THE SECRETARy-GENERALClimate financing is one of the most important aspects of the world’s efforts to address the climate change challenge. It is critical to catalysing efforts in developing countries to strengthen climate resilience, curb greenhouse gas emissions and support sustainable development. Timely climate financing can also strengthen trust among countries and generate progress in the negotiations taking place within the context of the United Nations Framework Convention on Climate Change (UNFCCC).
Last December, at the United Nations Climate Change Conference in Copenhagen, industrialized countries set a goal of mobilizing $100 billion per year by 2020 to support mitigation and adaptation activities in developing countries. Such resources represent a sound investment in a safer, cleaner, healthier future for us all. But they need to be mobilized. Especially at a time when many Governments are experiencing fiscal and budgetary constraints, we need to make extra efforts to identify new, innovative and additional sources for the long-term financing that can make a difference. That is why, earlier this year, I established a High-level Advisory Group on Climate Change Financing.
With this report, the work of the Advisory Group has formally concluded. I commend its findings to a wide globalaudience, but in particular to United Nations Member States for use in the UNFCCC negotiations and other relevant intergovernmental processes.
I thank the members of the Group, who generously contributed their time, insights and expertise. In particular, I am grateful to the Co-Chairs, His Excellency Mr. Meles Zenawi, Prime Minister of the Federal Democratic Republic of Ethiopia, and His Excellency Mr. Jens Stoltenberg, Prime Minister of Norway, for their leadership in raising the profile of climate change financing.
I hope Governments respond positively to the Advisory Group’s findings, and I encourage other key stakeholders, including civil society and the business community, to give this report full consideration.
BAN Ki-moon Secretary-General of the United Nations

2 3
FOREwORD By THE CO-CHAIRS OF THE SECRETARy-GENERAL’S HIGH-LEVEL ADVISORy GROup ON CLIMATE CHANGE FINANCINGThe Secretary–General of the United Nations asked us to co-chair the High-level Advisory Group on Climate Change Financing, which was established to study potential sources of revenue for financing mitigation and adaptation activities in developing countries.
The Advisory Group has drawn on expertise from a truly multi-stakeholder partnership. This has been vital for the achievements of the Advisory Group. As Co-Chairs, we deeply appreciate the innovative way of thinking and valuable contributions of all of its members, and we are grateful for the insight and hard work of experts involved in the technical analysis. We would also like to thank the secretariat of the Advisory Group for its dedication as a facilitator.
The Advisory Group concludes that it is challenging but feasible to reach the goal of mobilising US$100 billion annually for climate actions in developing countries by 2020. Reaching the goal will likely require a mix of sources, both existing and new public sources as well as increased private flows.
We are pleased to submit the report of the Advisory Group to the Secretary-General, and trust that the work of the group will be valuable for the Parties to the United Nations Framework Convention on Climate Change as well as for other decision-makers. We have been inspired by the many possibilities there are for promoting positive change when combining commitment, knowledge and innovative thinking. We are grateful for the opportunity to illustrate that climate change financing is achievable by collective action.
Meles Zenawi Prime Minister Federal Democratic Republic of Ethiopia
Jens Stoltenberg Prime Minister
Norway

4 5
MEMBERS OF THE SECRETARy-GENERAL’S HIGH-LEVEL ADVISORy GROup ON CLIMATE CHANGE FINANCINGMeles Zenawi, Prime Minister of the Federal Democratic Republic of Ethiopia (Co-Chair)
Jens Stoltenberg, Prime Minister of Norway (Co-Chair)
Bharrat Jagdeo, President of the Republic of Guyana
Pedro Luiz Carneiro de Mendonça, Under-Secretary General for Economic and Technological Affairs, Ministry of External Relations, Federal Republic of Brazil
Ernesto Cordero Arroyo, Minister of Finance, Mexico
Chris Huhne, Secretary of State for Energy and Climate Change, United Kingdom
Sri Mulyani Indrawati, Managing Director, World Bank
Donald Kaberuka, President, African Development Bank
Caio Koch-Weser, Vice-Chairman, Deutsche Bank Group
Christine Lagarde, Minister of the Economy, Industry and Employment, France
Trevor Manuel, Minister in the Presidency for National Planning, Republic of South Africa
Bob McMullan, Member of Parliament and Parliamentary Secretary for International Development Assistance, Australia
Mutsuyoshi Nishimura, Special Advisor to the Cabinet Office, Japan
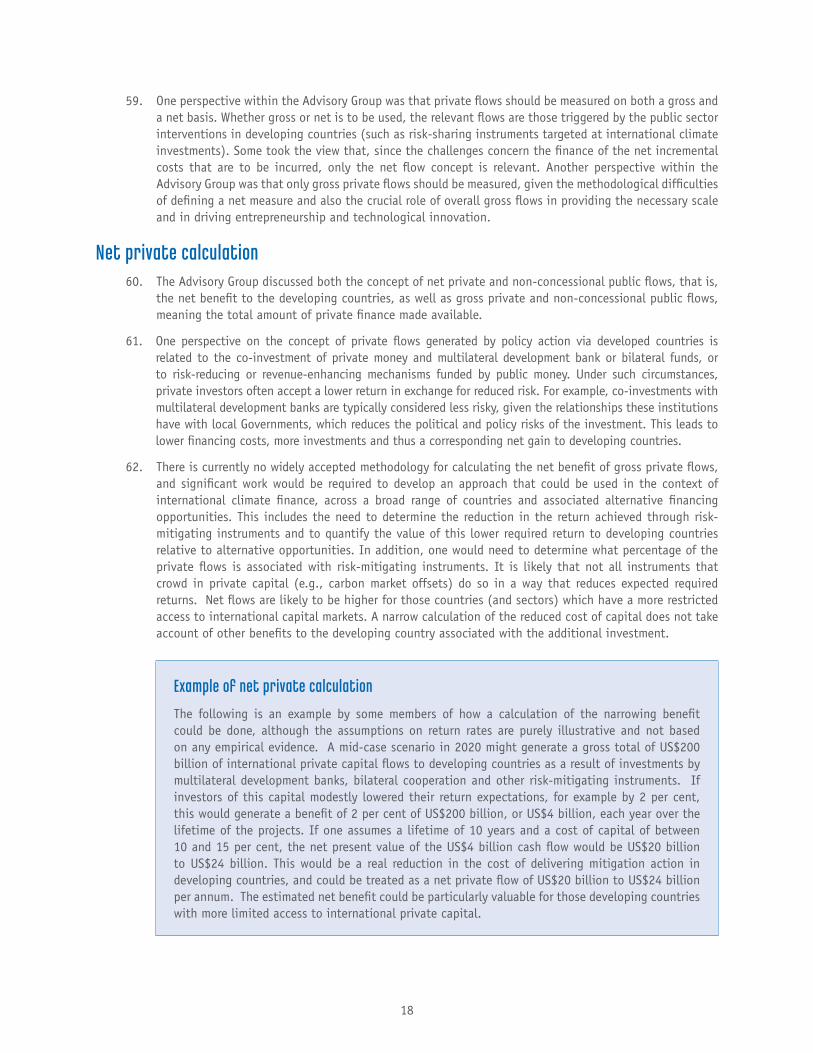
Supachai Panitchpakdi, Secretary-General of the United Nations Conference on Trade and Development (UNCTAD)
Tharman Shanmugaratnam, Minister for Finance, Republic of Singapore
Lawrence H. Summers, Director of the National Economic Council and Assistant to the President for Economic Policy, United States of America
Montek Singh Ahluwalia, Deputy Chairman, Planning Commission, Republic of India
George Soros, Chairman, Soros Fund Management
Nicholas Stern, Professor of Economics and Government, London School of Economics
Zhu Guangyao, Vice-Minister, Ministry of Finance, People’s Republic of China
www.un.org/climatechange/agf

4 5
ExECuTIVE SuMMARy
The challenge and the responseAs concentrations of greenhouse gases in the atmosphere continue to grow to ever more worrying levels, and adaptation becomes more and more challenging, action on climate change is urgent. Climate finance is key to that action, but will make a fundamental difference only if linked to a wider programme of measures agreed among nations. These measures are the foundation for the transformation of our economies and for a climate-resilient future.
At the United Nations Climate Change Conference in Copenhagen in 2009, political leaders emphasized their strong political will to urgently combat climate change in accordance with the principle of common but differentiated responsibilities and respective capabilities. Scaled-up, new and additional, predictable and adequate funding, as well as improved access, shall be provided to developing countries, in accordance with the relevant provisions of the United Nations Framework Convention on Climate Change. In the context of meaningful mitigation actions and transparency on implementation, developed countries committed themselves to a goal of jointly mobilizing US$100 billion a year by 2020 to address the needs of developing countries.
The Secretary-General of the United Nations established the High-level Advisory Group on Climate Change Financing in February 2010. Following its terms of reference, the Advisory Group worked around the goal of mobilizing US$100 billion per year by 2020.
The Advisory Group concluded that it is challenging but feasible to meet that goal. Funding will need to come from a wide variety of sources, public and private, bilateral and multilateral, including alternative sources of finance, the scaling up of existing sources and increased private flows. Grants and highly concessional loans are crucial for adaptation in the most vulnerable developing countries, such as the least developed countries, small island developing States and Africa.
Strong commitments to domestic mitigation and the introduction of new public instruments based on carbon pricing are important for mobilizing climate financing, both public and private. Instruments based on carbon pricing are particularly attractive because they both raise revenue and provide incentives for mitigation actions.
Naturally, given the complexity of the analysis and the diverse group of members involved, there were differences in perspectives, such as whether and how to measure revenues in terms of gross and net metrics. These are reflected in the report.
potential sourcesThe Advisory Group identified potential sources of finance and analysed these based on the criteria defined in the terms of reference. The Advisory Group also examined issues involved in combining instruments, including overlaps and interactions. Revenue potentials cannot necessarily be added together, for instance, because of spillover effects and potentially diminishing political appetite for mobilizing multiple sources.
The Advisory Group recognized that key elements of financial flows would be mutually reinforcing. Careful and wise use of public funds in combination with private funds can generate truly transformational investments.
The Advisory Group emphasized the importance of a carbon price in the range of US$20-US$25 per ton of CO2 equivalent in 2020 as a key element of reaching the US$100 billion per year. The higher the carbon price, the steeper the rise in available revenues and the stronger the mutual reinforcement of abatement potentials and different measures.
Actual estimates of 2020 revenue potential for new public instruments are sensitive to many assumptions, particularly the carbon price and the share allocated to international climate finance. Based on a carbon price of US$20-US$25 per ton of CO2 equivalent, auctions of emission allowances and domestic carbon taxes in developed countries with up to 10 per cent of total revenues allocated for international climate action could potentially mobilize around US$30

6 7
billion annually. Without underestimating the difficulties to be resolved, particularly in terms of national sovereignty and incidence on developing countries, approximately US$10 billion annually could be raised from carbon pricing international transportation, assuming no net incidence on developing countries and earmarking between 25 and 50 per cent of total revenues. Up to US$10 billion could be mobilized from other instruments, such as the redeployment of fossil fuel subsidies in developed countries or some form of financial transaction tax, though diverging views will make it difficult to implement this universally.
International private investment flows are essential for the transition to a low-carbon and climate-resilient future. A carbon price of US$20-US$25 could generate around US$100 billion to US$200 billion of gross private capital flows. Based on methodologies suggested by some members and explained in the report, such gross flows could lead to private net flows in the range of US$10 billion to US$20 billion. US$30 billion to US$50 billion annually could be generated in increased carbon market flows. Based on methodologies suggested by some members, carbon market flows of this magnitude could deliver around US$10 billion of net transfers.
The multilateral development banks, in close collaboration with the United Nations system, can play a significant multiplier role and leverage additional green investments. For every US$10 billion in additional resources, multilateral development banks could deliver US$30 billion to US$40 billion in gross capital flows and significantly more by fostering private flows. Based on methodologies suggested by some members, the net flows from multilateral development banks would be US$11 billion. The capacity of these banks should be strengthened through additional resources in the course of the next decade.
Direct budget contributions based on existing public finance sources, such as domestic revenues, could continue to play an important role, as Governments may prefer to increase direct budget contributions before they implement new instruments. The political acceptability of such sources will depend on national circumstances and on the domestic fiscal environment, which has currently put many developed countries under extreme pressure. Nevertheless, the Advisory Group expects that direct budget contributions will play a key role in the long term.
Several of the sources examined could be operational relatively quickly, in particular domestic public sources. As for private finance, flows of investments will depend on a mix of Government policies and on the availability of risk-sharing instruments. Confidence in policies and instruments could be built fairly quickly, but others may require more time to be implemented.
Spending wiselyThe credibility of both developed and developing countries in raising and using resources will be greatly increased if over the next decade there is confidence that these resources will be spent wisely, be quickly accessed and produce results. Funding for adaptation should be prioritized for the most vulnerable developing countries, such as the least developed countries, small island developing States and Africa. Arresting and reversing the destruction of rainforests is urgent, and a cost-effective abatement solution. The regional development banks, the World Bank, the United Nations system, other multilateral institutions and coordinated bilateral programmes will be crucial in scaling up appropriate national climate actions, for example, via regional and thematic windows in the context of the Copenhagen Green Climate Fund, such as a possible Africa Green Fund.
ConclusionsThe present report is submitted to the United Nations Secretary-General, who established the Advisory Group. It is for decision makers around the world to use the analysis in support of climate action. The Advisory Group found that raising US$100 billion per year is challenging but feasible. Now is the time to take decisions.

6 7
I. INTRODuCTION1. Climate change is one of the greatest challenges of our time. In Copenhagen, political leaders emphasized
their strong political will to urgently combat climate change in accordance with the principle of common but differentiated responsibilities and respective capabilities; and that scaled-up, new and additional, predictable and adequate funding, as well as improved access shall be provided to developing countries, in accordance with the relevant provisions of the United Nations Framework Convention on Climate Change (UNFCCC).
2. In the context of meaningful mitigation actions and transparency on implementation, developed countries committed themselves to a goal of jointly mobilizing US$100 billion a year by 2020 to address the needs of developing countries. This funding will come from a wide variety of sources, public and private, bilateral and multilateral, including alternative sources of finance.
3. On 12 February 2010, the Secretary-General of the United Nations established the High-level Advisory Group on Climate Change Financing. The Advisory Group consisted of Heads of State and Government, as well as ministers of finance, high-level office holders and experts on public finance, development and related issues, from both developed and developing countries. The members served in their expert capacities without prejudice to national or institutional positions in the climate negotiations.
4. Following its terms of reference, the Advisory Group had as its focus the identification of practical proposals on how to significantly scale up long-term financing for mitigation and adaptation strategies in developing countries from various public and private sources, and how best to deliver it. In undertaking this task, the Group emphasized its advisory role. It was neither a negotiating nor a decision-making body.
5. Following its terms of reference, the Advisory Group worked around the goal of mobilizing US$100 billion per year by 2020. The Advisory Group did not assess total needs for climate financing in developing countries; however, the analysis provided is intended to be helpful for any envisaged scale of resource mobilization.
6. The Advisory Group did not consider short-term finance covering the period 2010-2012. It did, however, look into how potential sources could be mobilized across different time horizons. The Advisory Group acknowledged the collective commitment made by developed countries to provide resources approaching US$30 billion in “fast start” climate finance during the period 2010‐2012 to help meet the adaptation and mitigation needs of developing countries. Time scales for medium-term resource generation depend, inter alia, on whether the resources would be generated primarily at the national and regional levels or would require more coordinated international action.
7. The Advisory Group identified potential sources of finance, which can be summarized in four groups: public sources for grants and highly concessional loans (including carbon taxation and auctioning of emission allowances, removal of fossil fuel subsidies, other new taxes such as a financial transaction tax, and general public revenues through direct budget contributions), development bank-type instruments, carbon market finance and private capital. The sources were analysed based on the criteria defined in the terms of reference: revenues, efficiency, incidence, equity, practicality, acceptability, additionality and reliability.
8. The Advisory Group did not seek consensus on all issues and concepts. Rather, it took the view that its analysis can be useful to parties and decision makers by reflecting different perspectives.
9. The work of the Advisory Group was based on the recognition that there is a need for enhanced flows of both public and private capital to developing countries in order to combat climate change, and that meeting the goal of US$100 billion per year by 2020 will require a combination of both. The Advisory Group also recognized the systemic nature of sources and instruments and therefore took a comprehensive approach in the analysis.

8 9
10. There were different perspectives within the Advisory Group on the role of public and private capital flows in meeting the goal of US$100 billion per year. Some members focused on public financing as the primary source, covering incremental costs and complemented by private flows. Others emphasized that private financing would be the primary source, inter alia, because of the important role that private investments already play in climate-relevant sectors in scaling up technology deployment and catalysing entrepreneurship, and because of its predictability and scalability.
11. The Advisory Group did not seek an agreed formula on which financing flows should count and which should not count towards the US$100 billion per year. There were different perspectives within the Advisory Group as to whether and how to measure revenues in terms of gross and net metrics, particularly regarding private and non-concessional flows. While the importance of private and non-concessional flows should be acknowledged, including especially their transformative role, some members felt that only the grant equivalent of private and non-concessional public flows would be relevant if contributions were to be consistent with the provisions of the UNFCCC. Another perspective was that counting gross private and non-concessional public flows towards the $100 billion goal would be fully consistent with the relevant provisions of the UNFCCC. Under either approach, the size of such flows is likely to be greater the better the investment climate in the developing countries.
12. Gross flows would be measured at face value and would include, inter alia, private capital flows, offset finance and non-concessional lending mobilized through the multilateral development banks.
13. Net metrics of concessional public flows would adjust the gross values to take account of servicing obligations and alternative financing opportunities. The Advisory Group reports the grant equivalent transfers consistent with the methodologies used by the Development Assistance Committee (DAC) of the Organization for Economic Cooperation and Development (OECD).
14. In the case of private and public non-concessional financial flows, while conceptually the net benefit of these flows to a country could be calculated, in practice it is significantly more difficult to do than for concessional public flows, as there is no internationally agreed or empirical basis on which to do such calculation. There were varying views within the Advisory Group about how robust any estimate would be with regard to any net private or public non-concessional flows, given the practical difficulties. The report explains methodologies proposed by some members and gives examples of how one might calculate net private and public non-concessional flows.
15. One perspective within the Advisory Group was that carbon offsets should not count towards the US$100 billion goal, since these are mechanisms that are designed to reduce the cost of mitigation in developed countries. Another perspective was that financial flows from offsets should count towards the US$100 billion goal because these payments are a clear example of policy-driven financial transfers to developing countries, and because existing offset systems have demonstrated success in predictably and efficiently leveraging additional investment in developing countries. A third perspective was that only the net value of carbon offset flows should count towards the US$100 billion goal, paralleling the proposed net approach to private capital flows.
16. Spending resources wisely is critical to building the mutual confidence needed to mobilize climate finance. The report therefore includes some illustrative examples of climate change financing, without prejudice to the UNFCCC negotiations. The full texts of the examples are found in annex III.
17. The Advisory Group worked in close collaboration; all members participated in drafting technical background papers from which the present report is derived, as well as in distilling and condensing those papers into the final report. The Advisory Group met several times, at the principal and deputy levels, with working sessions held in several countries.
18. Outreach was an important element of the work of the Advisory Group, which consulted widely among numerous stakeholders. Consultations were held with representatives of United Nations Member States, civil society and the private sector. Briefings were held for the parties at UNFCCC sessions. In addition,

8 9
individual members of the Advisory Group had interactions with a wide array of stakeholders, including civil society and the private sector.
19. When announcing the launch of the Advisory Group, the Secretary-General expressed his expectation that the work of the Advisory Group would help to inform negotiations on climate change financing as an essential part of a comprehensive climate change agreement. The Advisory Group hopes that this expectation will be met through the process that has led to the present report, and that the report itself will contribute to the discussions on financing within the ongoing UNFCCC negotiations.
20. Section II of the present report presents the conclusions from the analysis of the Advisory Group. Section III describes the concepts and methods used in carrying out the analysis at the base of the present report, focusing on the sources and assessment criteria considered (supplemented by annex II). Section IV describes the assessment of the sources against the criteria, and draws the broad conclusions from this analysis. Section V examines the issues involved in combining the different individual sources.

10 11
II. CONCLuSIONS FROM THE ANALySIS
A. The overall challenge21. The current range and potential of instruments available to meet the goal of US$100 billion per year by
2020 point to the conclusion that it is challenging but feasible to achieve this goal.
22. Reaching the goal will likely require taking a systemic approach to the financing of climate action. This involves carbon pricing as well as implementing a wide variety of sources, public and private, bilateral and multilateral, including alternative sources of finance; a scaling up of existing public sources; and increased private flows. There were different perspectives within the Advisory Group on the appropriate composition of sources for reaching the goal.
23. A combination of sources will also be required to effectively address different types of climate actions. Given the purpose of the resources, which is to support both adaptation and mitigation in developing countries, both public and private sources, and both grants and loans, would be necessary. Grants and highly concessional loans are crucial for adaptation in the most vulnerable developing countries, such as the least developed countries, small island developing States and Africa.
B. Sources and instruments24. New public sources examined by the Advisory Group have the potential to generate flows of tens of
billions of dollars annually, a significant step towards raising the US$100 billion per year.
25. Strong commitments to domestic mitigation and the introduction of carbon-based instruments in developed countries are key for mobilizing climate financing, both public and private. New public instruments based on carbon pricing in particular are attractive because they both raise revenue and provide incentives for mitigation actions.
26. Higher carbon prices feed through into multiple public sector instruments (such as revenues from the auctioning of emissions allowances, domestic carbon taxes, international levies and emissions trading schemes), into carbon offset markets and into the effective prices for carbon abatement that influence investment patterns in developing countries. The higher or lower the carbon price, the larger or smaller the revenue and the stronger or weaker the price signal to reduce emissions. While the Advisory Group emphasized the importance of pricing carbon, it did not take a firm view on the choice of instruments to achieve carbon pricing, for example, on whether this should be achieved via taxes or carbon markets.
27. Direct budget contributions, based on existing public finance sources, could continue to play an important role. Direct revenues draw from a domestic revenue base, including domestic taxes. To address potential difficulties in the timely implementation of new instruments, Governments may prefer to increase budget contributions. The political acceptability of this source over the longer term will depend on national circumstances and on the size of the contribution. The global fiscal environment has placed public finances in many developed countries under extreme pressure. The Advisory Group also recognized that some Governments would be constrained from increasing the existing tax bases, whether through existing or new sources, owing to the operation of domestic budgetary rules. Nevertheless, the Advisory Group expects that direct budget contributions will play a key role in the long term.
28. International private investment flows are essential for the transition to a low-carbon, climate-resilient future. These investments can be stimulated through the targeted application of concessional and non-concessional public financing. Careful and wise use of public funds in combination with private funds can generate truly transformational investments. Further work is recommended on finding the most effective use of grant funding for climate actions.

10 11
29. Carbon markets offer important opportunities for supporting new technologies and leveraging private investment in developing countries. The Advisory Group therefore recommends that the carbon markets be further strengthened and developed, while ensuring environmental integrity.
30. Domestically based instruments have advantages in terms of political acceptability in developed countries, allowing flexibility and tailoring to the particular circumstances of these countries.
31. Carbon-related instruments coordinated internationally, for example on international transportation, could potentially mobilize significant public resources for climate action in developing countries. These instruments may present difficulties, however, in terms of political acceptability and incidence on developing countries. Some members were of the view that political acceptability and incidence on developing countries should be addressed by the parties to the UNFCCC and the Kyoto Protocol. These members believed that further discussion on the design and implementation should depend on the decision by those parties. Other members were of the view that universal application of instruments on international transportation was necessary, inter alia, in order to avoid significant competitiveness issues. These members were of the view that incidence issues, particularly on developing countries, could be addressed by mechanisms other than selective application, for example through the appropriate collection and distribution of revenue. Any mechanism should not blunt abatement incentives or distort competitiveness. Further work on such instruments should be taken forward in the International Maritime Organization and the International Civil Aviation Organization.
32. The multilateral development banks (regional development banks and the World Bank) and the United Nations system are likely to play a key role both in fostering low-carbon growth and in meeting the adaptation needs of developing countries. The United Nations system can play a complementary role both in preparing the demand of developing countries for new significant climate finance and in the implementation phase of specific mitigation and adaptation programmes. The multilateral development banks, in close collaboration with the United Nations system, can play a multiplier role, leveraging significant additional green investment in a way that integrates climate action into overall development programmes. Their capacity to do so should be strengthened through additional resources in the course of the next decade.
33. A global financial transaction tax, as currently debated, would be a new and additional source. The share of the revenues to be allocated to climate action would be a policy issue. Strong international coordination, allowing for international implementation, would increase the efficiency of such a source, limiting its distorting effects. The lack of political acceptability and unresolved issues of incidence on developing countries make it difficult to implement universally, however. In this context, one perspective within the Advisory Group was that further work would be needed to overcome cooperative issues. A different perspective was that a financial transaction tax is only feasible among interested countries at the national or regional level.
34. Some of the potential instruments examined by the Advisory Group, such as a carbon export optimization tax or a climate fund based on globally coordinated special drawing rights appear to be unlikely instruments for meeting the 2020 goal of US$100 billion; the issues of incidence on developing countries and of political acceptability are particularly difficult.
C. Combining instruments35. In line with the systemic approach taken in the analysis of sources, the Advisory Group examined issues
involved in combining instruments, including overlaps and interactions. Public sources, for example, should be combined in ways that avoid double counting of likely revenue and inefficient double taxation. Sound design of public instruments, such as development bank instruments, can increase private flows as well as leverage paid-in capital. Equally, the United Nations system has considerable experience in helping developing countries to apply for and establish an enabling policy environment to receive new climate finance. Revenue potentials cannot necessarily be added together, for instance, because of spillover effects and potentially diminishing political appetite for mobilizing multiple sources. Combining different

12 13
sources, both public and private, and examining their appropriate role and scale should be subject to further international and national analysis and discussions. National circumstances will be taken into account in evaluating the menu of options.
36. The Advisory Group recognized that some key elements of the flows would be mutually reinforcing. In particular, carbon prices, flows from multilateral development banks and private sector flows support each other in terms of both revenues and incentives.
37. How sources might be combined in overall revenue mobilization depends on some key variables. These include carbon prices, the percentage of fiscal revenues that is allocated for international climate action, the use of international coordinated sources, the willingness to channel funds through multilateral development banks and the size of carbon market finance. The Advisory Group addressed only potential incidence on developing countries and did not address incidence on developed countries.
38. The Advisory Group emphasized the importance of new carbon-based public instruments and a carbon price in the range of US$20-US$25 dollars per ton of CO2 equivalent in 2020 as key elements in reaching the goal of US$100 billion per year.
39. Revenue estimates have been adjusted to reflect that some of these instruments encompass incidence on developing countries, and that a substantial share of the revenue is likely to remain in developed countries to support domestic priorities.
40. Of the new public instruments examined, the greatest revenue contribution potential is likely to come from auctions of emission allowances and new carbon taxes in developed countries. Given a carbon price of US$20-US$25 per ton of CO2 and assuming allocation of up to 10 per cent of total revenues raised going to international climate action, such sources have the potential to generate around US$30 billion annually. These sources have strong carbon efficiency attributes, and will not have any direct incidence on developing countries.
41. The Advisory Group also pointed to the revenue potential of up to US$10 billion from other instruments, such as redeployment of fossil fuel subsidies in developed countries or some form of financial transaction tax that reflects the various perspectives of the Advisory Group.
42. Without underestimating the difficulties that will have to be solved, particularly in terms of national sovereignty and incidence on developing countries, the Advisory Group pointed to carbon pricing of international transport as an important potential source for climate financing (and mitigation) that could contribute substantially towards mobilizing US$100 billion. Given a carbon price in the range of US$20-US$25 per ton of CO2, a 25 to 50 per cent earmarking of such revenues to international climate action and no net incidence on developing countries, these sources have the potential of mobilizing approximately US$10 billion or more of public finance annually.
43. From the perspective of some members that most of the revenue towards the goal should be public, there is a need to scale up existing public instruments channelled through direct budget contributions for climate action in order to complement the revenue from new public sources.
44. The Advisory Group estimates that, for every US$10 billion in paid-in capital, multilateral development banks could deliver US$30 billion to US$40 billion in gross flows. There is no analytical or empirically agreed basis on which to calculate net multilateral development bank flows; however, based on methodologies suggested by some members and explained in the report, the net multilateral development bank flows would be US$11 billion.
45. Enhanced private flows will be essential to economic transformation towards low-carbon growth. Ultimately, these will need to be mobilized at a scale of hundreds of billions of dollars. Multilateral development banks, the United Nations system and bilateral agencies, other international institutions, public-private risk-sharing instruments and more developed carbon markets can all play key roles in multiplying potential private flows for climate investment.

12 13
46. The analysis indicates that a carbon price of US$20 to US$25 could generate around US$100 billion to US$200 billion of gross private capital flows for climate action in developing countries. There is no analytically or empirically agreed basis on which to do net private calculations; however, based on some methodologies suggested by some members and explained in the report, such gross flows could lead to private net flows in the range of US$10 billion to US$20 billion.
47. A carbon price in the range of US$20-US$25 could generate increased carbon market flows of between US$30 billion and US$50 billion annually. One perspective within the Advisory Group was that such flows should count towards the US$100 billion goal, while another perspective was that such flows should not count towards that goal. From yet another perspective, only net carbon market flows should count. Carbon market flows of this magnitude could deliver up to US$10 billion of net transfers, based on methodologies explained in the report. There is, however, no analytically or empirically agreed basis on how to do such calculations of carbon market finance flows.
D. Time horizons48. Several of the sources examined by the Advisory Group could be operational relatively quickly. In particular,
public sources implemented domestically could be implemented more quickly. On the private finance side, flows of investments will depend on a mix of Government policies and on the availability of risk-sharing instruments. In some cases, confidence in policies and instruments could be built fairly quickly, but others may require more time to implement.
E. Spending wisely49. The Advisory Group examined cases covering key areas related to enhanced action on mitigation,
including substantial finance to reduce emissions from deforestation and forest degradation, adaptation, technology development and transfer, and capacity-building. There should be a balanced allocation between adaptation and mitigation during the period 2010-2012. The Advisory Group presumes that the same will apply in the future. In accordance with political commitments made at the United Nations Climate Change Conference in Copenhagen in 2009, funding for adaptation will be prioritized for the most vulnerable developing countries, such as the least developed countries, small island developing States and Africa. The illustrative cases are the African Water Facility, the South Africa Wind Energy Programme, Guyana’s low-carbon growth strategy, the Caribbean Catastrophe Risk Insurance Facility and Indonesia’s Geothermal Power Development Programme. The regional development banks, the World Bank, the United Nations system, other multilateral institutions and the Reducing Emissions from Deforestation and Forest Degradation plus (REDD+) partnership will be crucial in scaling up national appropriate climate actions, for example via regional and thematic windows in the context of the Copenhagen Green Climate Fund, such as a possible Africa Green Fund.

14 15
III. CONCEpTS AND METHODS1
50. The Advisory Group focused on sources and instruments, examining their individual characteristics against a set of agreed criteria and exploring how they could potentially be combined.2 The Advisory Group also tried to assess the different sources and instruments with analytical rigour, finding common ground when possible and acknowledging differences when not. The Advisory Group did not examine formulae for allocating revenue targets across developed countries.
A. Sources51. The work of the Advisory Group on potential sources was based on suggestions that have been made in
the relevant literature,3 public discussions and ideas within the Advisory Group itself. Following the terms of reference of the Advisory Group, the focus was on the potential sources of revenues for the scaling up of new and additional resources from developed countries. Having identified and discussed potential sources of finance, the Advisory Group grouped them into four categories (see chart below): (a) public sources; (b) development bank instruments; (c) carbon market finance; and (d) private capital.
52. Each of these four types of finance could potentially play a different but complementary role in meeting the potential set of mitigation and adaptation end uses. In many cases, such as that illustrated in Guyana’s low-carbon growth strategy, these different sources need to be combined into an overall package of funding.
1 For more details on the methodology, see annex II on concepts and methods.2 Such sources and instruments are often used interchangeably, but, when a distinction is made, the former term is more generic, refer-
ring to an area or broad base, and the latter more specific, for a particular type of measure.3 A survey was conducted early in the work of the Advisory Group and is available on its website at www.un.org/climatechange/agf.
Carbon-market offsets
Public/private leverage
Public sources
Multilateral development bank
contributions
Public carbon-market revenues
Carbon-related revenues
Financial transaction taxes
Direct budget contributions
International transport
Carbon markets
Private capital
Development bank
instruments

14 15
CASE STuDy
Guyana’s low-carbon growth strategy: aligning global and national low-carbon priorities through innovative financing
Background
The programme is based on payments for climate services that come through the Guyana REDD+ Investment Fund. Funds are then channeled into nationally determined low-carbon investments. The programme has defined financial, social and environmental safeguards, with annual assessment and verification carried out by third parties.
This national programme is designed to eventually transition towards funding from international carbon markets, reducing Guyana’s dependence on international public financing.
It is estimated that Guyana will provide US$350 million of climate services during the period 2010-2015.
Key messagesThe case shows how various sources of financing could be combined into an overall package of funding to support a transition from public sources to carbon markets. In the case of Guyana’s low-carbon growth strategy, the source/use matching includes :
• Reduction of current emissions, addressed with bilateral and multilateral transfers from public sources;
• Decarbonizing future growth, achieved through a mix of different measures, including targeted development lending and carbon market finance leveraging further private investment;
• Funding adaptation projects and programmes, which is best achieved through multiple foreign and domestic sources.
53. The Advisory Group formed eight work streams on different sources (six public and two private). Each work stream carried out detailed analysis of the different sources, assessing them against the criteria laid out in the terms of reference. Each of the sources was considered and analysed carefully:
(a) Public sources: these could be grants4 or loans (via multilateral development banks or elsewhere) but are, in principle, available to be used directly for grants:
i. Revenues from the international auctioning of emission allowances (such as assigned amount units (AAU) under the Kyoto Protocol): this would involve retaining some allowances from developed countries and then auctioning them to raise revenues;
ii. Revenues from the auctioning of emission allowances in domestic emissions trading schemes: this would involve the auctioning of domestic credits (as in the European Union Emission Trading Scheme phase III) and allocating some part of associated revenues;
iii. Revenues from offset levies: this would involve withholding a share of offset revenues as a global source, as currently done in the Clean Development Mechanism (CDM);
iv. Revenues generated from taxes on international aviation and shipping: this would either involve some levy on maritime bunker/aviation jet fuels for international voyages or a separate emissions trading scheme for these activities, or a levy on passenger tickets of international flights;
4 Grants relate to sources that require no servicing and therefore constitute “pure” transfers from developed countries to developing countries.

16 17
v. Revenues from a wires charge: this involves a small charge on electricity generation, either on kWh produced or linked to carbon emissions per kWh produced;
vi. Revenues generated by removing fossil energy subsidies in developed countries: this comprises budget commitments freed by the removal of fossil energy subsidies, which can be diverted towards climate finance;
vii. Revenues from fossil fuel extraction royalties/licences: these could be allocated in part to international climate finance;
viii. Revenues from carbon taxes: this is based on a tax on carbon emissions in developed countries raised on a per-ton-emitted basis;
ix. Revenues from a financial transaction tax: this builds on existing proposals on a global financial transaction tax (with a focus on foreign exchange transactions);
x. Direct budget contributions: this involves revenues provided through national budgetary decisions;
(b) Development bank instruments:
i. Resources generated via multilateral development banks using current balance sheet headroom.5 These revenues are not included in the estimates for the source;
ii. Resources created via potential further replenishments and paid-in capital contributions by countries to multilateral development banks (i.e., generating new cash resources for multilateral development banks). This includes both highly concessional IDA-type loans and non-concessional loans;
iii. Potential contribution to a fund dedicated to climate-related investment financed on the back of commitment of existing or new special drawing rights;
(c) Carbon market finance refers to transfers of resources related to purchases of offsets in developing countries. Carbon markets offer important opportunities for directly financing new technologies in developing countries, and for leveraging private investment. Presently, the majority of resources are generated via private entities and Governments in developed countries purchasing project-based offsets from private entities in developing countries through the CDM. Additional flows could be generated when and if carbon markets are further developed and deepened, taking into consideration environmental integrity. The potential scale of resources is dependent on the stringency of the emissions reduction commitments of developed countries, on carbon market design and on the availability of eligible emissions reductions in developing countries.
(d) Private capital refers to flows of international private finance resulting from specific interventions by developed countries. This includes the use of risk mitigation or revenue-enhancing instruments that compensate private investors for otherwise lower than risk-related required rates of return (also referred to as “crowding in”) as well as capacity-building for adaptation and implementation of climate policies in developing countries. Such instruments are illustrated in the case of the South Africa Wind Energy Programme, described below. The magnitude of flows would likely be higher, the better the investment climate in the developing country. Such flows cannot be committed ex ante, since they depend on private choices; however, developed country policy actions, as well as the multilateral development banks, the United Nations and the investments and instruments of bilateral agencies, can catalyse and foster additional private sector flows.
5 This is the amount of money the multilateral development bank can raise on the capital markets given the assets on its balance sheet.

16 17
CASE STuDy
The South Africa wind Energy programme: meeting the rising demand for energy sustainability by leveraging private finance
BackgroundThe South Africa Wind Energy programme is an example of a multi-year technical assistance project implemented by the United Nations Development Programme (UNDP) and co-financed by the Global Environment Facility (GEF) with US$2.3 million in grant funding.
The project promotes the large-scale commercialization of wind energy projects and the development of the domestic sector. Three fully operational wind farms are currently generating 10 MW, with an excess of 3 GW in advanced-stage wind farm grid connection applications. It is estimated that approximately 5 GW could be commissioned by 2015 if other issues are addressed.
Key messages The programme provides an example of how public investments in risk mitigation can crowd in private capital:
• Technical assistance can be used to assist the Governments of developing countries in overcoming barriers – policy, institutional, capacity – and creating enabling environments for private sector investment;
• Leverage ratios of such technical assistance can be high, aiding in the development of private sector activity across industrial sectors.
B. Criteria54. The Advisory Group assessed the different sources against the set of criteria set out in its terms of
reference: revenue, efficiency, equity, incidence, practicality, reliability, additionality and acceptability.
55. Revenue: Where possible, revenue potential was examined on a comparable basis across sources. Such comparability, however, is not necessarily easily achieved, given key distinctions, for example, between loans and grants and public and private sources.
56. Generally, revenue estimates from the different sources cannot necessarily be added together, since the revenues estimated are a mix of net and gross flows, as well as a mix of grants, loans, offset payments and equity investments. In addition, it may not be possible to combine certain sources, such as taxes that place a duplicative burden on the same tax base. Finally, revenue potentials cannot necessarily be added together, for instance because of spillover effects and potentially diminishing political appetite for mobilizing multiple sources.
57. There were different perspectives within the Advisory Group on the role of public and private capital flows in meeting the goal of US$100 billion per year. Some members focused on public financing as the primary source, covering incremental costs and complemented by private flows. Others emphasized that private financing would be the primary source, inter alia, because of the important role that private investments already play in climate-relevant sectors in scaling up technology deployment and catalysing entrepreneurship, and because of its predictability and scalability.
58. A net approach would include only the grant-equivalent transfers from developed countries for concessional public flows and the net benefit to the developing countries for non-concessional public and private flows, while gross flows would include private capital flows, offset finance and non-concessional lending mobilized through the multilateral development banks. The size of these gross flows is likely to be greater the better the investment climate in the developing countries is.
18 19
59. One perspective within the Advisory Group was that private flows should be measured on both a gross and a net basis. Whether gross or net is to be used, the relevant flows are those triggered by the public sector interventions in developing countries (such as risk-sharing instruments targeted at international climate investments). Some took the view that, since the challenges concern the finance of the net incremental costs that are to be incurred, only the net flow concept is relevant. Another perspective within the Advisory Group was that only gross private flows should be measured, given the methodological difficulties of defining a net measure and also the crucial role of overall gross flows in providing the necessary scale and in driving entrepreneurship and technological innovation.
Net private calculation60. The Advisory Group discussed both the concept of net private and non-concessional public flows, that is,
the net benefit to the developing countries, as well as gross private and non-concessional public flows, meaning the total amount of private finance made available.
61. One perspective on the concept of private flows generated by policy action via developed countries is related to the co-investment of private money and multilateral development bank or bilateral funds, or to risk-reducing or revenue-enhancing mechanisms funded by public money. Under such circumstances, private investors often accept a lower return in exchange for reduced risk. For example, co-investments with multilateral development banks are typically considered less risky, given the relationships these institutions have with local Governments, which reduces the political and policy risks of the investment. This leads to lower financing costs, more investments and thus a corresponding net gain to developing countries.
62. There is currently no widely accepted methodology for calculating the net benefit of gross private flows, and significant work would be required to develop an approach that could be used in the context of international climate finance, across a broad range of countries and associated alternative financing opportunities. This includes the need to determine the reduction in the return achieved through risk-mitigating instruments and to quantify the value of this lower required return to developing countries relative to alternative opportunities. In addition, one would need to determine what percentage of the private flows is associated with risk-mitigating instruments. It is likely that not all instruments that crowd in private capital (e.g., carbon market offsets) do so in a way that reduces expected required returns. Net flows are likely to be higher for those countries (and sectors) which have a more restricted access to international capital markets. A narrow calculation of the reduced cost of capital does not take account of other benefits to the developing country associated with the additional investment.
Example of net private calculation
The following is an example by some members of how a calculation of the narrowing benefit could be done, although the assumptions on return rates are purely illustrative and not based on any empirical evidence. A mid-case scenario in 2020 might generate a gross total of US$200 billion of international private capital flows to developing countries as a result of investments by multilateral development banks, bilateral cooperation and other risk-mitigating instruments. If investors of this capital modestly lowered their return expectations, for example by 2 per cent, this would generate a benefit of 2 per cent of US$200 billion, or US$4 billion, each year over the lifetime of the projects. If one assumes a lifetime of 10 years and a cost of capital of between 10 and 15 per cent, the net present value of the US$4 billion cash flow would be US$20 billion to US$24 billion. This would be a real reduction in the cost of delivering mitigation action in developing countries, and could be treated as a net private flow of US$20 billion to US$24 billion per annum. The estimated net benefit could be particularly valuable for those developing countries with more limited access to international private capital.

18 19
Net calculation for carbon markets63. The Advisory Group also discussed the concept of net flows for carbon markets. These were defined as the
inframarginal rents of carbon market flows.
64. Inframarginal rents are the difference between the average cost of a given mitigation measure or project compared with the market price (in a competitive market, the market price equals the marginal supplier’s cost). If positive, this difference constitutes a rent available to the owners of the asset or project that can reduce emissions at less than the market price.
65. While in theory this concept is easy to define, both estimating the magnitude of inframarginal rents and establishing who captures them is not a trivial matter.
66. Measuring rents is challenging. Estimates of both the average cost of abatements of different technologies and carbon prices are necessary in order to establish the magnitudes of the rents. While assumptions on carbon price levels can be used, estimates of cost across technologies in different countries require extensive analysis of the projected cost structures of technologies across geographical areas; such information, which is strategic to companies operating in this field, is not easily accessible. In addition, inframarginal rents could be captured by a range of players across the value chain.6
Example for calculating inframarginal rents
There is currently no widely accepted concept or methodology for calculating inframarginal rents; however, using the McKinsey marginal abatement cost curves, the average cost of mitigation measures for cost-positive measures under a carbon price of US$25 per ton of CO2 equivalents was estimated at US$15 per ton. This suggests an inframarginal rent of US$10 per ton (the difference between carbon price and average cost). Assuming that a US$3 transactional cost is extracted, rents are reduced to US$7 per ton. The Advisory Group assumed a strong offset demand and a volume of 1.5-2 Gt, with resulting inframarginal rents (i.e., the net flows associated with carbon offset finance) of US$10 billion to US$14 billion, compared with US$38 billion to US$50 billion in gross flows. If, however, transaction costs were higher, at US$5, the rents would be reduced further, to US$5 per ton, and the total net would be only US$8 billion to US$10 billion.
67. Given this range of perspectives and the need at this stage to base the work on well-defined metrics covering the full range of flows, the revenues from the four types of sources were estimated as follows:
(a) All public sources were estimated at face value. Estimates exclude any likely primary incidence on developing countries and reflect only the revenues that are generated by contributions from developed countries, that is, only net resource transfers to developing countries. In addition, estimates reflect the fact that only a share of revenues raised with a source will be used for international financing purposes, with a portion remaining in the developed countries;
6 A concrete example of a wind farm in a developing country helps to illustrate. Developers will need to buy land, which they are likely to bid up to a price level at which their projects barely break even. In this case, the landowner will make the bulk of the profits and hence capture any available inframarginal rents. From an outside point of view, it would be very difficult to identify whether the price of the land has indeed been higher than an alternative price and whether the landowner captured inframarginal rents. Therefore, depending on the market structure across the value chain, inframarginal rents could be captured by a range of players. Depending on the owners of the assets across the value chain, rents could be captured by foreign companies or publicly owned companies. Governments of developing countries could capture these rents, through ownership or taxation, but this will depend on domestic market structure and policies. It is impossible to determine a priori that such rents would be extracted by developing countries and would hence constitute a net flow. The reverse is also true: some projects might only be viable because of support from the developing country Government, e.g., if such Governments pay feed-in tariffs for wind generation. These projects might be highly profitable as a result, and it might appear that inframarginal rents exist. In that case, however, all of the inframarginal rent would have been paid for by the developing country and should clearly not qualify to be counted as a net flow.

20 21
(b) Multilateral development bank sources were estimated on both a gross and a net basis. Gross revenue estimates were based on the 2020 potential for expanded lending arising from paid-in capital, split between concessional and non-concessional lending (for example, towards adaptation and mitigation investments, where the former is assumed to require greater concessional finance). Net transfers were then estimated, based on the OECD DAC methodology to define the grant equivalent element of these flows based on methodologies proposed by some members of the Advisory Group when applied to non-concessional flows;
(c) Carbon market offset flows were measured on a gross basis (i.e., total flows). Net carbon market flows were also indicated;
(d) Private sector financial flows were measured as gross international flows (i.e., excluding capital mobilized domestically in developing countries). Net private flows, as proposed by some members of the Advisory Group, were also indicated.
68. The 2020 carbon price was a key driver of revenue estimates across multiple sources. This is relevant both for sources directly related to carbon prices (such as AAU/ETS auction revenues) and for those indirectly related to carbon prices (e.g., bunker fuel taxes). Scenarios were therefore created around three carbon prices for these sources: a low carbon price (US$15 per ton of CO2); a medium carbon price (US$25 per ton of CO2); and a higher-price scenario (US$50 per ton of CO2). The scenarios were built around a simple set of illustrative quantities and related prices, informed by the literature review of a broad range of models.7 Estimates in section IV are based on these three carbon price scenarios, while revenue potentials referred to in section II reflect a price range of US$20-US$25.
69. Efficiency: Efficiency has two parts: carbon-related efficiency is defined as how well or poorly a given source contributes to creating a “price” to correct for the carbon externality; overall efficiency is interpreted from a broad, dynamic perspective, taking into account the potential impact on growth and the risk of the proposed measures.8 For example, instruments that impose significant deadweight costs or that significantly distort trade flows would therefore score negatively on the efficiency criteria.
70. Equity: Considerations of equity in terms of the distributional impact of different measures were addressed under the incidence criteria.
71. Incidence: Incidence refers to “who really pays” for revenue for any given source among countries. Given the focus of the Advisory Group on revenue raised by developed countries for developing countries, the Advisory Group sought to address the issue of whether direct burden is imposed on developing countries for any given source. Some members emphasized that this notion of direct burden referred only to implied payments by developing countries towards the overall goal of mobilizing US$100 billion. Revenue for each source was therefore estimated on a basis that sought to: (a) recognise potential primary incidence on developing countries, and (b) exclude any revenue arising from developing country contributions so as to include only net flows from developed to developing countries. Some members were interested in secondary “economic” incidence, but absent good information on, for example, supply- and demand-side elasticity data in relevant markets, did not believe reliable estimates of this measure could be generated.
72. Practicality: Practicality is considered in terms of the feasibility of implementation, for example, in the required institutional design and in relation to rules and laws in different countries. The assessment of practicality includes an initial assessment of how rapidly different sources could ramp up by 2020.
73. Reliability: This criterion is taken to mean the extent to which the source of finance is likely to lead to a predictable revenue stream.
7 See annex II for a more detailed account of the review. 8 Given the limited time available for the Advisory Group to test the different sources against this criterion, only qualitative assessment
was carried out by the Advisory Group. Further work will be required to assess more formally, including through suitable models, the quantitative impact on growth of the different proposals.

20 21
74. Additionality: Additionality refers to the extent to which new resources add to the existing level of resources (instead of replacing any of them) and result in a greater aggregate level of resources. Operationalization of additionality, including through defining a reference case against which “greater” can be determined, is politically and analytically very difficult. Given likely pressures on existing sources and the difficulty of specifying a 2020 reference case against which additionality could be measured, a potential perspective is to treat the newness of a source as a useful, if partial, proxy for additionality. There are also other interpretations, however, such as taking the view that the US$100 billion target should be measured in a way that would be additional to a 2020 official development assistance (ODA) reference case.
75. Acceptability: Acceptability refers to the extent to which a given source is politically acceptable to both developed and developing countries. Since a source may be more controversial in one country and less so in another, this criterion also illustrates the importance of having a variety of instruments available.

22 23
IV. ASSESSMENT OF SOuRCES76. The present section provides an overall assessment of the different sources against the agreed criteria. Carbon
prices indirectly affect several sources of climate finance; estimates of potential revenues have been provided against various carbon price scenarios. The section separately addresses how sources can be described in terms of potential ramp-up speed across different time horizons and how the funds might be spent wisely.
A. Revenue estimates and analysis International auctioning of emissions allowances and auctioning of allowances in domestic emissions trading schemes (AAu/ETS)
Low carbon price Medium carbon price High carbon price
2020 estimates for AAU/ETS auctions
US$2-US$8 billion US$8-US$38 billion US$14-US$70 billion
Overview of assumptions (with calculation for a medium carbon price)
• Total market size approximated by forecast developed country emissions of 15 Gt by 2020;
• Assumption that between 2 and 10 per cent of total market size would be auctioned and al-located for international climate finance;
• Carbon price in medium scenario of US$25/t equates to market size of US$375 billion; 2-10 per cent auctioning provides a total of US$8-US$38 billion in revenues.
77. Both international auctioning of emissions allowances and auctioning of allowances in domestic emissions trading schemes would clearly be sources of revenue for new and additional resources. They would have strong carbon efficiency attributes, and would not have any direct incidence on developing countries. The revenue potential of this source depends on the volume of the carbon market, the carbon price and the percentage of emission allowances auctioned and the resulting revenues set aside for international climate finance. The governance of international auctioning would need to be resolved. In the case of revenues from domestic auctioning, a mechanism to allocate these revenues for international purposes would be needed in order for them to become a reliable source. This would be particularly important for developed countries that do not participate in the international auctioning of emissions allowances. It seems unlikely that countries would introduce auctioning at both the international and domestic levels in such a way that it could result in double taxation of carbon emissions.
Offset levies
Low carbon price Medium carbon price High carbon price
2020 estimates for offset levies
US$0-US$1 billion US$1-US$5 billion US$3-US$15 billion
Overview of assumptions (with calculation for a medium carbon price)
• Assumes a levy of between 2 and 10 per cent on offset market transactions;
• Offset market size assumed at 1.5-2 Gt in medium scenario, or US$37.5-US$50 billion at an estimated carbon price of US$25/t;
• Total levy amounts to between 2 and 10 per cent of US$37.5 billion-US$50 billion, or US$1billion-US$5 billion.

22 23
78. This source is potentially reliable, but the magnitude of the revenues that would be generated would depend on the volumes of the carbon market, the levy applied to offsets and the carbon price. While the measure is directly linked to carbon markets, concerns exist about the incentives it creates by de facto taxing action to reduce emissions. Also, depending on the elasticity, the instruments may have some incidence in developing countries. The offset levy already exists in the CDM and therefore could be operationally scaled up in the short or medium term.
Revenues from international transportation
Low carbon price Medium carbon price High carbon price
2020 estimates for maritime US$2-US$6 billion US$4-US$9 billion US$8-US$19 billion
2020 estimates for aviation USS$1-US$2 billion US$2-US$3 billion US$3-US$6 billion
Overview of assumptions (with calculation for a medium carbon price)
Maritime
• Assumes 0.9-1 Gt of emissions, priced at US$25/t of carbon (captured through auctions or levies), equivalent to between US$22.5 billion and US$25 billion;
• Subtracting incidence on developing countries, estimated at 30 per cent, and estimating that of the remainder between 25 and 50 per cent could be used for international climate finance leads to a total estimate of between US$4 billion and US$9 billion.
Aviation
• Assumes total passenger and freight emissions in 2020 of 800 Mt, of which 250 Mt are considered for the revenue estimates in the different price scenarios (due to the exclusion of flights within the European Union and the incidence on developing countries);
• Total revenue pool at a carbon price of US$25/t on 250 Mt equates to US$6 billion;
• Assuming that between 25 and 50 per cent of these revenues can be earmarked for climate finance delivers an estimate of between US$2 billion and US$3 billion.
79. Carbon-related instruments coordinated internationally, for example on international transportation, could potentially mobilize significant public resources for climate action in developing countries. The variation in the level of revenues depends on the different options to create such funds: a fuel levy/emissions trading system for maritime bunker fuels, and either a fuel levy/emissions trading system or a passenger ticket tax for the aviation sector. Both would promote environmental efficiency by taxing carbon emissions, but it could result in a cost impost on global world trade in the order of 0.25 per cent. These instruments may present difficulties, however, in terms of political acceptability and incidence on developing countries. Some members were of the view that political acceptability and incidence on developing countries should be addressed by the Parties to the UNFCCC and the Kyoto Protocol. These members believed that further discussion on the design and implementation should depend on the decision by these Parties. Other members were of the view that universal application of instruments on international transportation was necessary, inter alia, in order to avoid significant competitiveness issues. These members were of the view that incidence issues, particularly on developing countries, could be addressed by mechanisms other than selective application, for example through the appropriate collection and distribution of revenue. Any mechanism should not blunt abatement incentives or distort competitiveness. Further work on such instruments should be taken forward in the International Maritime Organization and the International Civil Aviation Organization.

24 25
Carbon-related revenues (other than auctions of assigned amount units and emissions trading schemes)
2020 estimates for:
Carbon tax Approximately US$10 billion from a carbon tax of US$1/t of CO2 equivalent
Wires charge US$5 billion for a charge of US$0.0004/kWh or US$1/t of CO2 equivalent
Removal of fossil subsidies US$3-8 billion
Redirection of fossil royalties Approximately US$10 billion
Overview of assumptions
Carbon Tax
• Calculates that US$1 of tax on 11-13 Gt of energy-related emissions translates roughly into US$10 billion of revenues; assumes 100 per cent is used for international climate finance.
Wires charge
• Calculates potential revenue from power-generated emissions in OECD countries (4.7Gt in 2020) based on a tax rate of US$1/t of CO2 equivalent, resulting in a total of US$5 billion. It is assumed that 100 per cent of revenue is used for climate finance;
• Equivalent to wires charge of US$0.0004/kWh on ~12,000 TWh of power generated in OECD countries in 2020.
Removal of fossil fuel subsidies
• Fossil fuel subsidies estimated at up to US$8 billion in Annex 2 countries within Group of Twenty (G-20) nations; assumes 100 per cent is used for climate finance.
Redirection of fossil fuel royalties
• Estimated at billions to tens of billions of United States dollars based on survey of self-reported receipts of five key oil-producing developed countries.
80. This category covers a number of measures (a carbon tax, a wires charge, the removal of fossil fuel subsidies in developed countries coupled with the redirection of revenues to climate9 and the redirection of a portion of fossil fuel royalties) that are domestic in nature and all effectively taxing carbon emissions. The Advisory Group noted that the redirection of existing fossil fuel royalties is not a new source that has the capacity to support climate financing. While redirecting fossil fuel subsidies is budget neutral, redirecting existing royalties would worsen a country’s budget position. Revenue estimates are based on a slightly different methodology, in which the overall potential estimates are calculated for a US$1 per ton marginal tax in the case of the carbon tax, a US$0.0004/kWh charge for the wires tax and a qualitative/quantitative assessment of potential revenues from the other sources. There is a high level of uncertainty in these estimates. Furthermore, there are significant potential issues of double counting in any combination of these sources, as many of these measures are built on the same premise, namely charging for the externality. That said, some of these instruments have some important positive characteristics: low levies over a wide basis make for efficient taxes (in the case of the wire tax), they are reliable and relatively practical to collect, and they are domestic in nature and hence allow different countries to choose different solutions without reducing
9 The Advisory Group did not address the potential to remove or redirect agriculture subsidies in developed countries, given the difficul-ties in measuring their direct and indirect emissions effects.

24 25
the efficiency of the measure. In terms of political acceptability, these sources could be implemented in a phased programme over the short and medium term, potentially acting as short-term proxies bridging through to the introduction of more complex instruments.
Financial transaction taxes
81. The level of estimated revenues from the financial transaction tax (Tobin tax) is driven by three determinants: (a) the base the tax is applied to; (b) the tax rate; and (c) the elasticity of the volume of respective transactions to the tax rate. Revenue potential from financial transaction taxes was estimated to be between US$2 billion and US$27 billion in 2020, based on the following assumptions:
• Assumes US$3,000 billion of trading per day through the continuous link settlement times 255 trading days, resulting in a total trading volume of ~$756 trillion.
• Assumes a tax rate of between 0.001 per cent and 0.01 per cent and a reduction in volume of between 3 and 6 per cent for a 0.001 per cent tax rate, and between 21 and 37 per cent for a 0.01 per cent tax rate, which translates into revenues of between US$7 billion and US$60 billion.
• Assumes 8.5 per cent compensation for incidence on developing countries based on share of transactions and use of between 25 and 50 per cent of total revenues for climate change, which translates into between US$2 billion and US$27 billion.
A global financial transaction tax, as currently debated, would be a new and additional source. The share of the revenues to be allocated to climate action would be a policy issue. Strong international coordination, allowing for international implementation, would increase the efficiency of such a source, limiting its distorting effects. The lack of political acceptability and unresolved issues of incidence on developing countries make it difficult to implement universally, however. In this context, one perspective within the Advisory Group was that further work would be needed to overcome cooperative issues. A different perspective was that a financial transaction tax was feasible only among interested countries at the national or regional level.
Direct budget contributions
82. Direct budget contributions, based on existing public finance sources, could substitute in part for new sources. Governments may do this because they prefer existing sources to new options. Over the period 2010-2012, for example, developed countries have committed to provide resources approaching US$30 billion, most of which will probably be direct budget contributions. Some members made reference to a proposal in the UNFCCC negotiations to dedicate between 0.5 per cent and 1 per cent of the gross domestic product (GDP) of developed countries to long-term climate financing, which would correspond to between US$200 billion and US$400 billion. Others believed that direct budget contributions would continue to play a role as they had in the past and as determined by national circumstances.
83. As a public finance source, direct budget contributions are qualitatively different from the other sources, as they do not refer to any particular instruments. There were different perspectives within the Advisory Group as to how best to treat direct budget contributions and regarding potential revenue estimates. For example, they could serve as a proxy to an overall target to which new and additional (public) sources would contribute, potentially generating a funding gap that would need to be filled from existing sources.
84. Direct budget contributions, based on existing public finance sources, could continue to play an important role. Direct revenues draw from a domestic revenue base, including domestic taxes. To address potential difficulties in the timely implementation of new instruments, Governments may prefer to increase budget contributions. The political acceptability of this source over the longer term will depend on national circumstances and on the size of the contribution. The global fiscal environment has placed public finances in many developed countries under extreme pressure. The Advisory Group also recognized that some Governments would be constrained from increasing the existing tax bases, whether through existing

26 27
or new sources, owing to the operation of domestic budgetary rules. Nevertheless, the Advisory Group expects that direct budget contributions will play a key role in the long term.
Development bank instruments
85. The multilateral development banks can be an important channel of climate finance to developing countries. They have a track record in providing instruments to share risk with domestic and international investors. They provide technical assistance to countries and implementation support to projects. They back the participation of developing countries in carbon market offset programmes. For all of these reasons, the multilateral development banks can leverage substantial private finance in climate-related projects. In close collaboration with the United Nations system, they can play a significant multiplier role, leveraging large additional investment in a way that integrates climate action into development programmes.
86. The Advisory Group examined the potential of revenues for climate change financing of additional resources channelled through multilateral development banks, for example through capital replenishments, other appropriate mechanisms or existing headroom. These resources were assumed to be split among IDA-type highly concessional lending, non-concessional lending or other blended arrangements, as appropriate, depending on the specific circumstances of the country/project; the total demand for grants versus loans based on external circumstances such as the carbon price10 and the use of the financing (e.g., adaptation versus mitigation). The Advisory Group estimated that, for every US$10 billion of additional resources, the multilateral development banks could deliver between US$30 billion and US$40 billion in grants and loans, depending on the mix between concessional and non-concessional loans11. There is no analytically or empirically agreed basis on which to do net multilateral development bank flow calculations for non-concessional finance; however, based on a methodology suggested by some Advisory Group members, the total net multilateral development bank flows would be US$11 billion. The figures above are based on the following assumptions (with calculation for a medium carbon price):
• Flows being counted arise from developed country resources;
• For gross flows, there is a leverage factor of between US$3 and US$4 of lending per US$1 of paid-in resources;
• For net flows, the leverage factor is 1.1 per US$1 of paid-in resources, based on grant equivalence calculated using OECD DAC methodology for concessional finance and a methodology suggested by some Advisory Group members for non-concessional finance.
87. One perspective within the Advisory Group was that these resources would need to come from new capital increases in order to be new and additional. Another perspective was that this could be achieved by some or all of these resources coming from the enhanced use of existing paid-in capital. If between US$7 billion and US$9 billion annually were used as additional resources for the multilateral development banks (based, for instance, on a series of regular resource additions), they could deliver a further US$25 billion to US$35 billion annually of gross flows (through a mix of concessional and non-concessional loans or other blended arrangements). This would mean a 10 to 15 per cent increase in total multilateral development bank lending compared with 2009 levels12.
88. One perspective within the Advisory Group was an assumption that paid-in capital would come from developed countries only, assuming a multilateral development bank “climate change facility” structured in a way that would require no net capital provision from developing countries, and hence no incidence
10 A higher carbon price will tend to reduce the need for grants, as higher revenues can be generated from mitigation projects (through offsets).
11 In the long term, reflows from loans could be used give additional loans, so the net present value (NPV) of the loans over a longer period of time could be higher.
12 Total multilateral development bank lending in 2009 was approximately US$200 billion.

26 27
on them. Another perspective was that, while only multilateral development bank flows for climate purposes arising from developed country contributions could be counted towards the US$100 billion target, this could arise from a variety of new or existing structures, and some developing countries might contribute as well. The crowding in of private capital would increase the political acceptability of this source of revenues.
89. The Advisory Group also examined the proposal for a climate fund based on globally coordinated special drawing rights, but political acceptability was found to be limited, owing to a lack of consensus on the appropriate role of special drawing rights in the international monetary system. That said, some countries may find this option attractive depending on how such instruments might be treated in their national accounting systems. It bears noting that any use of SDRs would likely require support from the broader International Monetary Fund (IMF) membership and could have implications for the IMF and its membership that would need to be considered.
90. It is worth noting that the international financial institutions could play a particularly important role in terms of financial innovation for climate investment, as they evolve their approach to take account of the new requirements of climate finance (e.g., enabling payment for emissions reductions and ecosystem services). The capacity of the multilateral development banks to leverage their balance sheets, to blend public and private instruments, to provide guarantees against policy risk and to hedge carbon price risk makes them potent multipliers of both public and private finance.
Carbon market offsets
Low carbon price Medium carbon price High carbon price
2020 estimates for carbon market offsets
US$8-US$12 billion Gross US$38-US$50 billion, net US$8-US$14 billion, depending on transaction costs
US$150 billion
Overview of assumptions (with calculation for a medium carbon price)
• Assumes offset price of US$25/t on 1.5-2 Gt of offset flows. This would require a high level of mitigation ambition in developed countries, with correspondingly tight caps;
• A net estimate of carbon market offset flows (medium carbon price) would be in the range of US$8-US$14 billion per year, depending on transaction costs.
91. Revenues raised through this source depend on the demand for and supply of emissions reductions commitments, and on carbon market mechanisms. It is uncertain which actors will capture the rents associated with the transfers. Nonetheless, this source is consistent with the carbon efficiency criterion.
92. Carbon markets offer important opportunities for directly financing new technologies in developing countries, and for leveraging private investment.
private finance
93. Revenue potential from private finance was estimated to be up to US$500 billion in 2020, generated with a leverage factor of between 2 and 4 on public flows and carbon market offsets. A medium carbon price (US$25) might result in approximately US$200 billion gross flows and an estimated US$20 billion to US$24 billion in net flows based on the methodology used in the present report. The potentially large scale of private flows could be essential for the transition to a low-carbon world; therefore, they could become crucial to the dynamics of change and thus to the broader, more dynamic notion of efficiency.

28 29
The central role of private flows is most obvious in mitigation investments, but it is also critical for many investment decisions in adaptation. It is important to note, however, that many low-carbon technologies still present higher costs than the high-carbon alternatives. For technologies such as these, private capital will be mobilized only with sufficient public finance, carbon pricing or domestic policies that make these technologies economically viable. Furthermore, improved investment climates in developing countries will enhance the mobilization of private capital, as it is not possible to commit private finance flows ex ante, given that they are driven by investor demand, which is itself a function of available investment opportunities, capital availability and the quality of the policy environment.
B. Sources and instruments over time94. Given the scale of the challenge of mobilizing US$100 billion per year by 2020 and the requirements for
administrative practicality, many of the sources identified by the Advisory Group will need to be built in advance of 2020 in order to allow for sufficient time to develop both the capacity to deliver and the capacity to use wisely the flow of funds made available. The Advisory Group acknowledges the collective commitment made by developed countries to provide resources approaching US$30 billion in “fast start” climate finance during the period 2010‐2012 to help meet the adaptation and mitigation needs of developing countries.
95. Several of the sources examined by the Advisory Group could be operational relatively quickly. In particular, direct budget contributions and other public sources which build on existing domestic revenue-generating instruments could be triggered earlier, depending on political will. The scale-up speed of these instruments would naturally depend on the extent to which Governments would dedicate resources collected through these mechanisms to international finance and on the time pathway of carbon reduction commitments. Similarly, the multilateral development banks and the regional development banks, together with the United Nations system and bilateral agencies, could respond relatively quickly to a substantial increase in demand for climate-related finance. The United Nations system, for instance, has the relevant experience, presence and mandate to assist countries in developing their own national capacities to remove market development barriers (information, regulatory, financial and administrative) and to access climate finance. On the private finance side, flows of investment in mitigation and adaptation activities will depend on a mix of Government policies, including regulation, standards, support for new technologies, implicit and/or explicit carbon pricing, improved investment climate and the availability of risk-sharing instruments. In some cases, confidence and instruments could be built rapidly, but in other cases more time for implementation may be required.
96. Time scales also depend, inter alia, on whether the resources would be generated primarily at the national and/or regional levels or would require more coordinated international action. Instruments which are purely domestic, such as the removal or redirection of fossil fuel subsidies, could potentially scale up more rapidly than those which require significant international coordination. Among instruments that could potentially deliver resources in the short to medium term are carbon-related revenues, such as public revenues from domestic carbon markets, carbon taxes, carbon market offsets, wire charges and the removal or redeployment of fossil fuel subsidies; contributions from multilateral development banks; direct budget contributions; and public finance that is used to leverage private investments. Among instruments that might deliver only in the medium to long term are public revenues from international carbon markets, aviation and maritime policy measures, financial transaction taxes and special drawing rights.
C. Spending wisely 97. The focus of the work of the Advisory Group has been on revenue-raising and examining the key criteria
for assessing the different sources; however, spending resources wisely is critical to building the mutual confidence needed to mobilize long-term finance. Getting early financing right and then establishing credible plans for long-term financing are critical to starting this confidence-building process in a way that accelerates practical learning and strengthens the trust and delivery capacity of all parties.

28 29
98. It is clear that there are important links between resource mobilization efforts and how such money is spent. On the one hand, developing countries need predictability in resource commitments before they can commit to systematic transformation in key sectors of their economies. On the other hand, developed countries can only be expected to scale up climate finance if they are confident that these monies will be spent wisely. New climate finance instruments – with clear, simple links between payments and performance (for instance, ecosystem services) or between risk transfer mechanisms and better planning controls – can reinforce this dynamic. Some principles of spending wisely include:
• Ownership on behalf of developing countries will be crucial. Action should be consistent with country priorities, guided by national or regional adaptation and mitigation strategies;
• Reliable and predictable long-term funding commitments are necessary to enable the development and implementation of long-term, consistent adaptation and mitigation strategies in developing countries;
• Accountability and transparency with regard to both spending in developing countries and financial flows from developed countries will enable reciprocal trust to improve over time;
• Programmes need to be responsive to the challenge of climate change.
99. The present report therefore includes some cases of climate change financing, without prejudice to the UNFCCC negotiations, such as on monitoring, reporting and verification regimes and institutions. The cases cover key areas related to enhanced action on mitigation, including finance to reduce emissions from deforestation and forest degradation, adaptation, technology development and transfer, and capacity-building. The regional development banks, the World Bank, the United Nations system, other multilateral institutions and the REDD+ partnership will be crucial in scaling up national appropriate climate actions, for example via regional and thematic windows in the context of the Copenhagen Green Climate Fund, such as a possible Africa Green Fund.
Illustrative example
Scaling up investment in Africa: providing the means to scale up public and private support for adaptation and mitigation efforts, and towards a high-growth path in Africa on a low-carbon basis
BackgroundWithin the global strategy, make adequate provision for Africa by providing additional resources targeted at adaptation, climate-resilient infrastructure, clean energy and climate action in general, enhancing delivery through African regional, institutional and innovative instruments.
Key messageThe delivery of finance for adaptation and mitigation needs to be scaled up through regional institutions, given their strong regional ownership.
100. The cases are Guyana’s low-carbon growth strategy, the South Africa Wind Energy Programme, the African Water Facility, the Caribbean Catastrophe Risk Insurance Facility and Indonesia’s Geothermal Power Development Programme, which are described in boxes throughout the report as well as covered in more detail in annex III.

30 31
CASE STuDy
The Caribbean Catastrophe Risk Insurance Facility: managing adaptation needs with efficient use of funds
BackgroundThe Caribbean Catastrophe Risk Insurance Facility is a multi-country risk pool that provides insurance solutions against natural catastrophes such as hurricanes and earthquakes. In addition to providing traditional insurance products, the Facility strengthens the fact base for decision makers regarding the magnitude of future risks while reducing uncertainty and providing guidance on how to prioritize activities among adaptation projects, insurance and risk-bearing.
This effort followed the “economics of climate adaptation” approach, which is structured around five questions, each driving a different set of analyses:
(a) Where and from what are we at risk?
(b) What is the magnitude of the expected loss?
(c) How could we respond?
(d) How do we execute a response?
(e) What are the outcomes and lessons of implementation?
The first three steps have already been carried out in selected Caribbean States and form the basis for later execution and evaluation.
Key messagesThe project shows how public resources can be spent in innovative and efficient ways to reduce reliance on ODA spending by:
• Considering specific country circumstances, as it was determined that there are considerable differences in terms of future expected losses and optimal adaptation strategies, even among small island developing States in the same geographic region;
• Applying rational economic choice to prioritize measures (not a one-size-fits-all solution);
Using different approaches based on efficiency and cost (e.g., insurance versus building sea walls).

30 31
V. COMBINING INSTRuMENTS101. The assessment of potential sources provides a disaggregated picture of what each individual source
might provide on its own. Based on the assessment, there is clearly a range of promising sources, each with different strengths and weaknesses. There are, however, no individual sources that can simultaneously deliver the US$100 billion target and meet the full range of end-use requirements. There are also significant substitutabilities and complementarities among different sources. Finally, there are some key variables, notably the carbon price and the willingness to weight policy towards more international approaches, which may have correlated effects across multiple sources.
A. Sources and end-use102. A combination of sources will be required to address effectively different types of climate actions. For
example, climate activities that generate direct revenues might be suitable for some mix of loan finance and carbon market finance (e.g., low-carbon electricity). Other climate activities, (e.g., coastal flood defences) may require long-term grant elements or, as in the case of REDD, may need to evolve from an upfront public finance model to predictable financing based on payments for ecosystem services. Yet others may need combinations of different models of public-private partnership. Private flows are likely to play a key role in entrepreneurial and technology transfer activities and in the risk-sharing needed to finance new low-carbon business models and investments. Indonesia’s geothermal power programme provides a case showing how these different sources can be combined.
CASE STuDy
Indonesia’s Geothermal power Development programme: utilizing bilateral, multilateral and private financing for mitigation benefits
BackgroundThe programme is a package of multiple financial instruments designed to help finance immediate scale-up needs in Indonesia for geothermal power. The package is a mix of financing from multilateral development banks and other assistance, including:
• Concessional loans of US$300 million from the Clean Technology Fund;
• US$500 million in loans from the Asian Development Bank and the World Bank;
• US$4 million in grants from GEF;
• Bilateral assistance from Germany, the Netherlands, Japan, the United States of America, France and Australia;
• An additional US$2 billion expected to be mobilized from a range of other sources.
The programme is expected to deliver greenhouse reductions of about 3.2 MtCO2 equivalent per year, resulting in cumulative emissions savings of 63 million tons over the typical 20-year plant life.
Key messagesThe project shows how multilateral development banks can play an integral role in attracting sufficient investment volume through the ability to leverage the invested public money and crowd in further private investment by reducing upfront financial and technological risks. The scale of bilateral, multilateral and private financing will emerge to meet project-by-project needs, rather than being determined ex ante.

32 33
B. Combining public instruments103. Instruments to generate net public funds cannot simply be added together, but need to take into
account positive and negative spillover effects.
104. The link between domestic carbon regimes and international transportation levies is an example of a positive spillover effect. Domestic carbon regimes which have broad coverage make it easier to extend that coverage to the international transport sectors. Extending coverage beyond domestic sectors would be both fiscally efficient and consistent and more politically acceptable. Increasing the capacity of multilateral development banks to provide additional resources is a second example of a positive spillover effect, since for each dollar of new resources, multilateral development banks are potentially able to increase international lending for climate investments by between US$3 and US$4, equivalent to US$1.10 in net flows based on methodologies proposed by some members.
105. At the other end of the spectrum, the overlap between AAU and ETS auction revenues is the most obvious example of substitutability. Showing both instruments would amount to the double counting of likely revenue. There are also many other instances of potential double counting of likely revenue. For example, many of the instruments that would tax carbon emissions (e.g., wire charges or a direct carbon tax) would amount to double counting if combined with a carbon-market-based auction revenue regime. On the other hand, instruments which simply remove existing distortions (e.g.., elimination of fossil fuel subsidies) or are based on underlying public ownership rights (e.g., reallocation of energy sector royalties) could potentially be combined with instruments that tax carbon emissions.
106. Finally, there is a question of dynamic efficiency. Even if it were possible to tax a range of different (non-carbon) sources and/or to mobilize additional funds through direct budget contributions, there is a broader macro consideration about the potential impact such an approach might have on developed country growth.
107. The overall magnitude of public flows is influenced by: (a) the selection of domestic instruments; (b) the extension of these instruments to cover international sectors; (c) the degree of revenue allocation to international climate finance; (d) for the majority of instruments considered, the carbon price; and (e) the political appetite to mobilize multiple sources. There are many possible combinations of new, potentially acceptable sources, which could result in mobilizing several tens of billions of dollars of public finance.
C. Leveraging gross flows108. While different perspectives can be taken on how to count gross flows towards the US$100 billion
target, and in particular on the role of private finance and offset flows, there is broad agreement that fostering gross flows is a key enabler of green growth. There are three main multipliers in fostering gross flows: the multilateral development banks, bilateral risk-mitigating instruments and carbon offsets.
109. First, the multilateral development banks play a significant multiplier role. As described above, they have the capacity to translate one dollar of public capital into up to four dollars of gross lending. In addition, each dollar of lending is estimated to generate three dollars of private capital co-investment, of which approximately 50 per cent is mobilized from international sources. Finally, the participation of multilateral development banks in the carbon markets means that they are potentially able to help pilot and scale up innovative offset schemes.
110. Second, the use of public instruments to help mitigate policy-related risks associated with the transition to low-carbon economies acts as a further multiplier of gross resource flows. Each public dollar invested in such risk-mitigation instruments is estimated to generate three dollars of gross international resource flows.
111. Third, carbon market offsets also generate significant gross flows. In the Advisory Group mid-case scenario of a US$25 carbon price, offset volumes are estimated to be approximately 2 billion tons,

32 33
provided that caps are consistent with the Copenhagen Accord commitments. This generates up to US$50 billion in gross flows, crowding in up to US$75 billion in additional international private capital investment. If prices were lower or offsets were restricted, it is possible that offsets of this volume would lead to lower private sector flows (i.e., closer to US$10 per ton), resulting in only US$5 billion to US$8 billion of gross flows, crowding in an additional US$8 billion to US$12 billion of private capital.
112. While each multiplier works independently, they are all, to a greater or lesser degree, affected by carbon prices. Lower carbon prices potentially reduce the net public resources that could be used to support sector transformation programmes in developing countries. They potentially constrain the expansion of multilateral development banks (and bilateral) risk-sharing capacity. In addition, for a given offset capacity in the carbon markets, lower carbon prices reduce the implicit carbon price in developing countries, potentially reducing the low-carbon investment flow.
113. If available public funds, multilateral development bank lending and carbon market offsets are used effectively to crowd in investment, private capital has the potential to deliver substantial gross flows.
CASE STuDy
The African water Facility: long-term solutions for improved water resources management and use delivers multiple benefits
BackgroundThe project is a portfolio of 65 projects targeting water resources management. It includes activities covering the following topics: national and transboundary water resources management; water resources information management; water supply and sanitation; and water for agriculture. The overall portfolio is valued at US$110 million, with approximately US$370 million leveraged in investment funds.
Key messagesThe project is an example of how the right investments and policies in the agriculture sector can deliver multiple benefits simultaneously. In this case, the benefits include:
• Agricultural and income benefits through more efficient water use and better planning;
• Climate change mitigation and adaptation benefits through more climate-resilient water supply and sanitation.
D. Creating coherent combinations114. How different sources might be combined depends on some key variables which impact the revenues
available. The Advisory Group identified the following such key variables: (a) carbon prices (values considered were US$15, US$25 and US$50 per ton); (b) the percentage of fiscal revenues that are allocated for international climate action; (c) the use of sources that are more international in nature, such as coordination on international transportation levies; (d) the willingness to channel funds through the multilateral development banks; (e) the expansion and degree of openness of carbon markets; and (d) the political appetite to mobilize multiple sources.

34 35
ANNEx I TERMS OF REFERENCE OF THE HIGH-LEVEL ADVISORy GROup ON CLIMATE CHANGE FINANCING
Financing for Climate Change1. Based on the need identified in the Copenhagen Accord to study the potential sources of revenue for
financing mitigation and adaptation activities in developing countries, and to make progress on this key issue in the course of 2010, the UN Secretary-General has established a High-level Advisory Group on Climate Change Financing.
2. The Group will conduct a study on potential sources of revenue for the scaling up of new and additional resources from developed countries for financing actions in developing countries, in the spirit of the political commitments contained in the Copenhagen Accord, with a view to contributing to an appropriate decision of the UNFCCC Conference of the Parties at its 16th session in Mexico.
3. Initial outputs from the Group by the May/June meetings of the UNFCCC will provide timely information to Parties for their feedback. This will help to increase the transparency of the work of the Advisory Group, allow for comments and suggestions by governments as well as guidance for further work that the Group may need to undertake. The final report will be submitted to the UN Secretary-General and to the current (Denmark) and next (Mexico) president of the UNFCCC Conference of the Parties by November 2010.
Scope of the work of the Advisory Group4. As part of its work, the Group will develop practical proposals on how to significantly scale-up long-term
financing for mitigation and adaptation strategies in developing countries from various public as well as private sources, and how best to deliver it. Besides considering how existing mechanisms can be scaled up, the Group will also examine the need for new and innovative long-term sources of finance, in order to fill the gap in international climate financing.
5. The Group will provide views and suggestions, based on the best possible analysis, that are in support of development. The criteria for assessing combinations of sources will include: revenue; efficiency; incidence; equity; practicality; acceptability; additionality; and reliability. Funding would help fund adaptation, mitigation, technological development and transfer, and capacity building for action on climate change in developing countries. The Group will in particular address the needs for funding for adaptation of the most vulnerable.
6. The Group will be expected to consult widely.
High-Level Group Members7. The High-level Advisory Group will be co-chaired by H.E. Mr. Meles Zenawi, Prime Minister of the Federal
Democratic Republic of Ethiopia, and H.E. Mr. Gordon Brown, Prime Minister of the United Kingdom of Great Britain and Northern Ireland.
8. The other members of the Advisory Group, serving in their expert capacities, include other Heads of State and Government, as well as ministers of finance, high office holders and experts on public finance, development and related issues of the highest quality and standing. The composition of the Group ensures for equal representation of developed and developing countries.
9. The members of the High-level Advisory Group were designated by the Secretary-General, and are formally accountable to and report to the Secretary-General. The Secretary-General will ensure that the results

34 35
of work of the Group are communicated to the UNFCCC process, and that feedback and any guidance is received and channeled back. The Secretary-General, the Co-Chairs and the Members of the Advisory Group will be actively engaged in outreach activities to UN member states and the media to enhance transparency of the deliberations and findings of the Group.
Secretariat of the Group10. The Secretary-General has set up a secretariat in New York for a period of 12 months, which is linked
to the existing Secretary-General’s Climate Change Support Team. The secretariat will be responsible for facilitating substantive inputs to the Group, preparing the documentation, and for organizing its meetings.

36 37
ANNEx II DETAILED METHODOLOGyThe present annex describes the basic concepts and methods developed for the report of the Secretary-General’s High-level Advisory Group on Climate Change Financing. The annex is organized into seven sections, described below:
I. Carbon price scenarios: describes the three carbon price scenarios used and how they relate to other pub-lished results. Also explains the key drivers of carbon prices;
II. Criteria of the Advisory Group and evaluation of sources against criteria: describes the process for evalu-ating sources and the outcome of the evaluation. Additional details on revenue calculations are given in papers produced in eight work streams and published on the web;
III. Calculating net public flows: describes the concept of grant equivalence for concessional public sector loans, as the basis of the calculation of net concessional public flows, and the methodology used to quan-tify the flows. This section also discusses views on net measures of non-concessional (e.g., non-Official Development Assistance (ODA)) public sector loans, as well as methodologies suggested by some members;
IV. Methodology for the multilateral development bank multiplier; explains the methodology for calculating the contributions from multilateral development banks. In particular, this section describes how multilat-eral development banks translate an amount of flows into a larger amount of lending owing to their ability to leverage funds through the capital markets;
V. Private flows: describes the methodology for calculating the potential amount of private flows leveraged by public contributions and carbon market flows. It also describes the share of international versus do-mestic flows, where only the share of international flows is being counted;
VI. Allocation of revenues for international climate action: describes the methodology used to determine what portion of revenues raised by a given source is allocated for climate change financing versus other uses;
VII. Summary of the revenue calculations by source: explains the estimates presented in the report.

36 37
I. Carbon price scenarios To ensure the consistency of the revenue estimates for the different carbon-related sources, the Advisory Group defined simple scenarios based on different carbon prices. The objective was to ensure through these simple scenarios that estimates calculated by the different work streams would be comparable and built on a consistent methodology, rather than to develop fully fledged scenarios.
The Advisory Group defined three potential scenarios for the carbon markets – low (US$10-US$15 per ton of CO2 equivalent), medium (US$$20-US$25 per ton of CO2 equivalent) and an additional illustrative high-price scenario (US$50 per ton of CO2 equivalent)13. The low and medium scenarios are broadly consistent with the Copenhagen Accord pledges that followed the fifteenth Conference of the Parties to the United Nations Framework Convention on Climate Change. This was supported by a broad literature review that included a wide set of models using different assumptions and varying interpretations of Copenhagen Accord pledges, and with different business-as-usual emission baselines. Given the uncertainties inherent in a 10-year price forecast, the Advisory Group further checked the numbers by running models made available by some members. The high-price scenario uses a US$50 price per ton of CO2 equivalent. It is meant to be an illustrative scenario to test the revenue flows of different sources in a high carbon price context. This price level could be seen as consistent with stronger emission reductions, in line with a trajectory consistent with the outcome of a 2-degree rise in global temperatures. Of course, there are many assumptions required to link a carbon price with a climate outcome, given that carbon markets are only one of many variables that matter. Therefore, the focus of the high price scenarios was primarily on illustrating the impact of a higher price on revenue sources rather than on developing a fully fledged scenario linked to a specific climate outcome or suggesting the appropriateness of this scenario.
The following prices and volumes were assumed for the three scenarios:
Offset prices and volumes under different scenarios
Scenario Offset volume (in metric tons of CO2 equivalent) Offset price (per ton of CO2 equivalent in US$)
Low 500-800 10-15
Medium 1,500-2,000 20-25
High 3,000 50
For simplicity, it was assumed that prices in the markets for assigned amount units (AAUs) under the Kyoto Protocol were the same as offset prices.
The models used as a basis to develop these scenarios utilized updated baseline data taking into account the impact of the economic recession on global emissions, for example:
• The Framework to Assess International Regimes for differentiation of commitments (FAIR) model of the Netherlands Environmental Assessment Agency suggests a carbon price of US$12/tCO2 equivalent in a world in which the low end of the Copenhagen Accord pledges is reached, and a range of US$17-US$24/tCO2 equivalent if the high end of pledges is reached. This model includes the impact of the recession in its business as usual modelling;
• The European Commission used the Prospective Outlook on Long-term Energy Systems (POLES) model and was based on an updated baseline that takes into account the impact of the recession. It suggests an offset price of US$18/tCO2 equivalent, assuming the low end of Copenhagen Accord pledges is reached and US$32/tCO2 equivalent if the high end is reached;
13 To simplify the calculations, in the main report, only the top end of the ranges is used to calculate the revenue potential of different sources.

38 39
• The results were further sense-checked by internal modelling exercises by a couple of members of the Advisory Group, using similar updated baseline data and targets (low and high end of Copenhagen Accord pledges) as the published models.
Additional sources that did not include an update to the baseline data were also reviewed:
• The Environment Protection Agency (EPA) of the United States of America suggests US$16/tCO2 equivalent based on the implementation of the Waxman-Markey bill in the United States and the Group of Eight (G-8) agreement to lower emissions by 50 per cent in other Annex-I countries by 2050, with non-Annex-I countries not taking action before 2025;
• Using assumptions similar to those used by the US EPA the United States Energy Information Administration’s National Energy Modelling System (NEMS) suggests a carbon price of US$32;
• The regionally integrated model of climate and the economy based on World Energy Outlook 2009 data assumes a US$8 carbon price based on Copenhagen Accord pledges but with no developing country action before 2020;
• World Energy Outlook 2009 suggests a price range of US$26-US$37/ tCO2 equivalent under the assumption of a long-term stabilization at 450 ppm and a cap-and-trade scheme in the Organization for Economic Cooperation and Development (OECD) and European Union countries in the power and industry sectors, with a reduction target of 4 per cent below 1990 and offset limits of 0.5 Gt to 1.7 Gt per year.
Overview of models of scenarios (in United States dollars)
Low price Medium price
FAIR 12 17-24
POLES 18 32
Additional estimates
United States EPA 16a
NEMS 12-25
RICE 8
WEO 2009 26-37
a Based on the assessment of American Clean Energy and Security Act of 2009 (“Waxman-Markey bill”) and specific international assumptions that are not based on Copenhagen Accord pledges.
There are a range of uncertainties that could substantially impact any of the carbon market forecasts; some of these uncertainties also explain differences between the different models:
• AAU overhang: There is a large overhang of AAUs from the first compliance period, estimated at up to 8 Gt, which if brought into future compliance periods could flood the AAU markets and eliminate any demand from Government buyers and therefore reduce AAU auction revenues to close to zero. The overhang could potentially also affect demand from emissions trading scheme (ETS) markets if Governments were to adjust ETS targets as Government targets are easily met. The figures shown assume that this overhang would not be used to meet the caps;
38 39
• The scope of domestic ETSs: At this point in time, several developed countries are considering ETSs, but the outcome is still unclear. This means that the precise scope (share of total emissions of developed countries) of ETSs and the related demand for offsets is still unknown;
• Design of ETSs: Offset demand and related prices will be driven mostly by the scale and design of domestic ETS markets. There are many features in the design of ETSs that will have an effect on prices and offset volumes. Among the more important ones are:
- The amount and type of international offsets allowed into the market: The more offsets are allowed, the larger the international flows but also the higher the financing need in developing countries. This is a result of the larger share of the global abatement needed in developing countries. Additionally, there are different views on what types of offsets should be allowed, in particular whether Reducing Emissions from Deforestation and Forest Degradation (REDD) credits and hydrofluorocarbon credits should be allowed, or continue to be allowed, in the markets. Expanding the scope for offsets would increase the supply and hence reduce prices for offsets;
- Floor or ceiling prices: Domestic ETSs may have a price floor or price ceiling, which would affect overall carbon prices;
- Banking and borrowing: These mechanisms can be used to manage supply and demand imbalances over time and hence can affect prices in a given year, but have limited impact on the average price and volumes over time. However, banking will tend to encourage reductions below near-term targets, and correspondingly higher prices, when long-term targets are ambitious.
• Carbon market structure and reform of the Clean Development Mechanism (CDM): Currently, CDM is the primary source for offsets to developed countries. A number of reforms, including sectoral crediting or crediting for nationally appropriate mitigation actions, are under discussion. These could significantly increase the potential supply of credits and hence reduce prices. One perspective within the Advisory Group was that the current CDM process constrains the supply of offset credits with average processing times for CDM of up to two years and significant uncertainty regarding the approval of projects. This led to different views on whether the CDM reform is necessary and what direction it should take.
II. Criteria of the Advisory Group and evaluation of sources against criteriaThe Advisory Group completed a detailed analysis on each source assessing it against the criteria as defined by the terms of reference. These included the following: revenue, efficiency and equity, incidence, practicality, reliability, additionality and acceptability. The criteria are described in detail in the main text of the report. The assessments of the different sources against these criteria were carried out by eight work streams and are summarized in the executive summaries of the eight working papers. The working paper summaries were based on both the outcome of the analysis of the individual work streams and on the discussions held at the different meetings of the Advisory Group. Regarding the first criterion, revenue, a more detailed quantitative assessment was carried out, and is described in more details in the main report and in section VII of this annex.
The assessment against the criteria constituted the core of the material used to generate the broader, qualitative assessment of sources described in the main report. It is important to stress that, where possible, the assessment was based on a quantitative analysis (for instance in the case of revenues), but for several criteria the assessment was qualitative, owing to the nature of the criteria. Also, different perspectives on sources led to different assessments against the criteria.
III. Calculating net public flowsThe calculation of the grant element of the concessional public finance loans is based on the of the OECD Development Assistance Committee grant element calculator (http://www.oecd.org/dataoecd/34/6/15344611.xls). Conceptually, in the narrow definition of concessional public sector loans, only the grant equivalent of the concessional element of the loan is included. This accounts for the fact that a portion of the loan must be repaid.

40 41
The OECD Development Assistance Committee does not apply its grant-element calculations to non-concessional loans.14 Views differed among members of the Advisory Group about whether and how to do such a calculation. Some members suggested adapting the OECD Development Assistance Committee procedure in the following way:
In the context of a loan, the concessionality of the interest rate charged (R1) is calculated by comparing it with a discount rate (R2). The discount rate used depends on which perspective is taken on the loan. To the receiver, R2 is the interest that would have been due had a sovereign loan of the same size been taken out in the international money markets. From the donor’s perspective, the grant equivalence is the opportunity cost of the return that the lender could have expected from the next most profitable means of investing the capital at similar risk; hence, R2 is defined as the return of such an investment. Following the OECD methodology, a standard discount rate of 10 per cent for R2 was adopted.
The grant equivalence is the value of this difference in the interest rates, which is approximately equal to the principal multiplied by the difference between R2 and R1 [principal x (R2-R1)]. Since the benefits of reduced interest rates from public sector lending will almost always occur over time, grant equivalence should be discounted in order to generate its net present value. In addition, the terms of repayment (such as grace periods and long maturities) increase the grant element.
Based on this methodology suggested by some members, both the concessional loans (International Development Assistance (IDA)-like) and non-concessional loans (International Bank for Reconstruction and Development (IBRD)-like) that a multilateral development bank (MDB) or bilateral institution15 can issue16 were considered in calculating a net multilateral development bank flow. While IDA-type lending has a grant element between 80 and 82 per cent17, non-concessional lending, made up of both IBRD-type (with low degree of concessionality) and commercial, International Finance Corporation (IFC)-type loans, has a weighted average grant equivalence of ~20 per cent18. The net element of non-concessional multilateral development bank lending was therefore calculated only on IBRD-type loans and not on commercial loans (IFC-type). This grant equivalence range is applied to loans described as development bank-type loans in the main report. Further details on the calculation are described in section IV below.
IV. Methodology for the multilateral development bank multiplierMultilateral development banks and bilateral institutions are treated as an instrument to channel primary sources in order to generate additional flows19. As a secondary source, a portion of the public funds raised (or additional
14 See definition of “grant element” at http://www.oecd.org/glossary/: “The grant element concept is not applied to the market-based lending operations of the multilateral development banks.”
15 Capital could be paid-in also to increase the capital base of a bilateral institution (e.g., KfW in Germany or CDC in England) which can act like the multilateral development bank in issuing bonds to raise additional capital for loans. For simplicity only the multilateral development banks are referenced in the text.
16 In the context of multilateral development banks, non-concessional loans are IBRD-type loans with limited concessionality, while concessional loans are IDA-type loans with higher concessionality.
17 Methodology of the Organization for Economic Cooperation and Development. Includes both grants and loans at the regular credit/grants/blends split for International Development Association fiscal years 2003 to 2011 (IDA13-IDA15). See “A review of IDA’s long-term financial capacity and financial instruments”, available from http://siteresources.worldbank.org/IDA/Resources/Seminar%20PDFs/73449-1271341193277/IDA16-Long_Term_Financing.pdf.
18 Methodology of the Organization for Economic Cooperation and Development. For the International Bank for Reconstruction and Development (IBRD), assumes an average concessional rate for IBRD of historic London Interbank Offered Rate (LIBOR) plus 40 to 60 basis points, maturity of between 10 and 20 years and a three-year grace period, corresponding to between 27 and 40 per cent. For the International Finance Corporation (IFC), assumes 0 per cent grant equivalent (commercial terms). A split between IBRD/IFC lending of 67 per cent/33 per cent based on World Bank Group split is assumed.
19 Some might also consider the resources that could be generated via multilateral development banks using current balance sheet headroom to raise additional money in the capital markets. These revenues were not included in the estimates for the sources at this stage. For this source to be considered, there would need to be political will to access the headroom, and flows generated through this source would require careful quantification. In addition, there would need to be careful determination of what could count towards the US$100 billion, given that callable capital has already been allocated to the multilateral development banks and therefore could not be classified as a “new and additional” source. The impact on the contingent liability of shareholders may be considered “new and additional”, depending on the additional risk multilateral development banks would take on their balance sheets.

40 41
direct budget contributions) can be allocated to multilateral development banks directly. It may also be possible to use existing multilateral development bank headroom. The ability of these institutions to issue bonds on the back of paid-in and callable capital allows them to generate additional flows above the value of the public funds paid in.
For non-concessional lending, the multiplier is calculated by considering the total loans multilateral development banks can make on the back of one additional dollar in paid-in capital. As described above, the multilateral development banks issue bonds on the back of the paid-in and callable capital. The money raised with these bonds can be used to issue loans. The value of bonds that can be issued can be approximated by the current average value of the equity/loan ratio across multilateral development banks, which is approximately 5.20 For each US$1 of paid-in capital and related callable capital, the institution can issue in that year US$5 of loans.
For concessional lending, the multiplier is calculated by considering the total loans multilateral development banks can make on the back of one additional dollar in replenishment. For IDA-type concessional lending, this is approximately US$1.20 for each US$1 of replenishment. The small amount of leverage generated for IDA-type loans results from the fact that a portion of the money for IDA loans comes from flows from borrower repayments and a portion from net income from concessional lending. Unlike in the case of concessional lending, however, multilateral development banks do not borrow to fund IDA; rather, the largest contribution comes from direct donor grants.
These multipliers are applied to the sources channelled through the multilateral development banks to calculate the total gross lending from multilateral development banks. To determine the overall flows that multilateral development banks could generate for climate finance on the back of a given amount of paid-in capital, it was necessary to make an assumption about the proportion of concessional and non-concessional lending issued by the multilateral development banks. It is assumed that the proportion depends on the carbon price. This is the outcome of the analysis carried out by workstream 4, and is based on the observation that the higher the carbon price, the less need for concessionality. It is assumed that the split for paid-in capital varies from 50/50 for non-concessional/concessional in the low carbon price scenario to 60/40 in the medium carbon price scenario and 75/25 in the high carbon price scenario. Because of the larger multiplier for non-concessional lending, this translates into a percentage split for lending, i.e., the amount of finance provided to developing countries, to a non-concessional/concessional split of 81/19 in the low carbon price scenario, 86/14 in the medium carbon price scenario and 93/7 in the high carbon price scenario.
In the medium carbon price scenario, this split and the multipliers for the two types of lending lead to an overall multiplier of 3.5, i.e., each US$1 in flows to a multilateral development bank is translated into US$3.50 in concessional and non-concessional loans. This calculation is detailed in the box below:
Calculation of non-concessional/concessional lending split and multiplier(Medium carbon price scenario)
Assumption is that for each US$1 flowing into the multilateral development banks, US$0.60 is used to increase the paid-in capital for non-concessional lending and US$0.40 is used as replenishment for concessional lending
Resulting lending is calculated by applying the multiplier described above:
• Concessional lending = US$0.40 paid in x 1.2 multiplier = US$0.48 in total loans
• Non-concessional lending = US$0.60 paid in x 5 multiplier = US$3 in total loans
• Total lending = US$0.48 + US$3 = US$3.48
• Overall multiplier = US$3.48 loans/US$1 paid in = ~3.5
• Concessional lending = US$0.48/$3.48 = 14 per cent of the total
• Non-concessional lending = US$3/$3.48 = 86 per cent of the total
20 This multiplier of 5 was based on the current average value of the equity/loan ratio across multilateral development banks. Actual values of this multiplier will vary for different multilateral development banks. Excludes cost of callable capital in national budgets, which is assumed to be small.

42 43
Using the approach suggested by some members, an additional step can be performed to calculate the narrow public flows, as the multiplier generates gross public flows from the multilateral development bank. As described in section III, the non-concessional loans are assumed to be a mix of IBRD- and IFC-type non-concessional loans, and the concessional loans are assumed to be IDA-type loans. In the medium carbon price scenario, using the narrow public methodology explained above, one finds the grant equivalence of the gross flows to be US$1.10 in narrow public flows (see figure below for an outline of the calculation steps). That means that, for each US$1 flowing to a multilateral development bank, the multilateral development bank can issue loans with a total grant equivalence of US$1.10. This corresponds to an additional US$0.10 generated by the multilateral development bank alongside the US$1 of initial public flows purely on the back of their ability to leverage their strong balance sheet.
Intuitively, this figure may seem low, but it is important to note the different roles and meanings of gross and narrow flows here. Multilateral development banks are valuable for their ability to leverage flows to create large gross flows: US$1 in revenue allocated to a multilateral development bank leads to the equivalent of US$3.50 in loans, i.e. US$3.50 in investment in developing countries, and this does not take into account the private capital that is likely to co-invest with the multilateral development banks. The grant equivalent flows are generated by interest rate differentials between borrowing and lending, which are financed by the additional risk taken on by the shareholders of multilateral development banks.
1% in public funds
Total loans of $3.5
Total $1.1 in net public flows (of which $0.1 is additional)
$0.6 paid into IBRD/
IFC$3 loans
$0.5 grants/loans
$0.4 paid into IDA
Calculating multilateral development bank multiplier, including net multiplier as proposed by some members of the Advisory Group
Lending split 86% non concessional / 14% consessional
40%1
60%1
x3.5
x1.1
Grant equivalence
$1 in paid in public
funds
Grant equivalence
1 Values for medium carbon price
x1.2
x5 $0.7 net public
$0.4 net public
$1.1 net public

42 43
V. private flowsAs outlined in the report, private flows, i.e., investment capital for mitigation and adaptation projects provided by private investors, are key to support climate action in developing countries. The magnitude of total private flows depends on a number of assumptions, including overall estimates of private sector potential based on negative and positive cost opportunities, the total amount of public flows available and the portion used in instruments to leverage private investment, the amount of carbon market finance available and the leverage factors for both public instruments and carbon market finance.
In the estimates given in the report, the private flows are calculated with the following methodology:
International private capital going towards positive cost activities is calculated by applying a leverage factor to both public sources and carbon market offset flows. One can consider three different types of flows that are leveraged:
(a) Public flows: These are the public flows raised from sources such as the international transport levy and carbon-related sources. These include flows that will be used for mitigation as well as adaptation. Some flows will leverage private capital while others will be used in ways that do not leverage private capital (see work stream 7);
(b) Public flows from multilateral development banks: These are the public flows that come from additional multilateral development bank resources. As is described in work stream 4, most of these flows will leverage private capital;
(c) Carbon market offset flows: As is described in work stream 8, virtually all of these flows will leverage private capital;
In all three cases, the total private capital is determined by applying an average leverage factor of 3 x (as defined in work stream 7). A further adjustment is needed to account for the portion of this private capital that will come from domestic investors in developing countries. This portion was assumed to be up to 50 per cent, so 50 per cent of total private capital is excluded from the leveraged flows to determine the international private capital.
VI. Allocation of revenues for international climate actionIt is likely that part of the revenues collected by Governments through the measures examined by the Advisory Group will be retained for domestic use, and that only a portion of them will be dedicated to international climate action. To be able to estimate the revenues available for international climate action, the Advisory Group discussed and agreed on a set of simple assumptions for each source, as follows:
• In terms of the money raised through auctions related to carbon markets (ETSs and AAUs21), the assumption was made that between 2 and 10 per cent of such revenues would be dedicated to international climate action;
• It was assumed that a larger percentage of revenues linked to taxing international transport would be dedicated to international climate action owing to the international nature of the tax. It was assumed that between 25 and 50 per cent would be channelled to developing countries;
• For carbon-related revenues (e.g., carbon taxes, wire taxes and removal of subsidies) the assumption used was that only between 2 and 10 per cent 22 of the revenues would be dedicated to international action owing to the domestic nature of the measures. This was implemented implicitly in the estimations by using a lower carbon price rather than by applying the scenario-related carbon prices.
• For the financial transaction tax, the assumption was made that between 25 and 50 per cent of revenues would be used for international climate action.
• For multilateral development bank lending and direct budget contributions, the assumption was made that these funds would be dedicated entirely to climate action.
21 These are only relevant for Kyoto parties.22 Where percentage earmarked varies with the carbon price.

44 45
VII. Summary of revenue calculations by sourceA. International auctioning of emissions allowances and auction of allowances in domestic emissions
trading schemes
Description of sourceThe revenues would come from countries contributing a share of the revenues from auctioning AAU or ETS credits.23 It is assumed that they would not use both sources for international climate finance at the same time.24
The calculation is therefore based on an analysis of the available credits, the carbon price and the share of revenues earmarked for international climate finance.
Revenue estimates by 2020(in billions of United States dollars)
Low carbon price Medium carbon price High carbon price
2-8 8-38 14-70
Assumptions and referencesThe key input variables for the calculation are as follows:
• Carbon prices: US$15, US$25 and US$50, which correspond to the low, medium and high price scenarios from the Advisory Group general assumptions;
• Available carbon credits: 5.4 Gt, 15.2 Gt and 14 Gt based on developed country emissions under the low to high range of commitments made under the Copenhagen Accord. In the low carbon price scenario, the total number of carbon credits is lower, as it is assumed that there is only partial coverage, i.e., no AAU and only some countries implement an ETS. In the medium and high carbon price scenarios, there is full coverage via AAU/ETS; total emissions are lower in the high scenario owing to additional abatement;
• Share of carbon credit revenues set aside for international climate finance: between 2 and 10 per cent of the total emission credits available. For AAUs, this would in fact be between 2 and 10 per cent of available credits. In the case of an ETS, only a share of the total country emissions might be covered by the ETS, e.g., between 40 and 50 per cent, as is the case for the European Union. In that case, it can be assumed that the share of credits set aside would be proportionally higher than the range of 2-10 per cent assumed for AAU auctions.25
There is a simplifying assumption made that the two sources would substitute at the same magnitude, so only the total covered emissions need to be considered, and the split between AAUs and ETSs does not impact the revenue estimates.
Calculation stepsRevenues for each carbon price scenario are calculated as follows (numbers in parentheses are for a medium carbon price scenario):
• Multiply the carbon price by the emissions allowances to determine total market size (US$25/ton x 15.2 Gt = US$380 billion);
23 Auctions of assigned amount units are relevant only for Parties to the Kyoto Protocol.24 They might use auction revenues from emissions trading schemes to pay for auction revenues from assigned amount units.25 In addition, there may be a share of credits that is given directly to emitters as opposed to auctioned, so the earmarking would refer
to the percentage of total credits, not the percentage of auction revenues (which would be smaller).

44 45
• Multiply market size by the percentage of allowances auctioned and earmarked for international climate finance to determine total revenues from source (between 2 and 10 per cent of US$380 billion = between US$8 billion and US$38 billion).
B. Offset levies
Description of sourceThe revenues would come from withholding a share of offset revenues as a global source, as currently done in the CDM.
The calculation is therefore based on an analysis of the total offsets, the carbon price and an assumption regarding the share of revenues earmarked for international climate finance.
Revenue estimates by 2020(in billions of United States dollars)
Low carbon price Medium carbon price High carbon price
0-1 1-5 3-15
Assumptions and referencesThe key input variables for the calculation are as follows:
• Carbon prices: US$15, US$25 and US$50, which correspond to the low, medium and high price scenarios from the Advisory Group general assumptions;
• Offsets: 500-800 Mt, 1,500-2,000 Mt and 3,000 Mt in the low, medium and high carbon price scenarios from the Advisory Group general assumptions;
• Size of the offset levy: between 2 and 10 per cent of the total offset value, compared with 2 per cent currently.
Calculation stepsRevenues under each carbon price scenario are calculated as follows (numbers in parentheses are for a medium carbon price scenario):
• Multiply the carbon price by the total offsets to determine offset revenues (US$25/ton x 1,500-2,000 Mt = US$38 billion to US$50 billion);
• Multiply market size by the percentage of allowances auctioned and earmarked for international climate finance to determine total revenues from source (between 2 and 10 per cent of between US$38 billion and US$50 billion = US$1 billion to US$5 billion).
C. Revenues generated from taxes on international aviation
Description of sourceThe revenues for this source would be generated by a tax on international aviation. It could be in the form of a levy on aviation jet fuels for international voyages, a separate Emission Trading Schemes for these activities or a levy on passenger tickets of international flights. The revenue estimates used in the report of the Advisory Group refer to a fuel levy.26
26 An emissions trading scheme would generate similar revenues if 100 per cent of the emissions credits are auctioned. A ticket tax as currently calculated would generate slightly lower revenues because it does not tax freight (it would change the ranges for revenue estimates to US$1 billion to US$3 billion for the medium carbon price scenario and US$2 billion to US$6 billion for the high carbon price scenario). Detailed estimates of a ticket tax are available in this annex.

46 47
Revenue estimates by 2020(in billions of United States dollars)
Low carbon price Medium carbon price High carbon price
1-2 2-3 3-6
Assumptions and referencesThe key input variables for the calculation are as follows:
• Carbon prices: US$15, US$25 and US$50, which correspond to the low, medium and high price scenarios from the Advisory Group general assumptions;
• Total emissions from aviation activities in 2020 of 800 Mt per year, including emissions resulting from carrying both passengers and freight.27 The total comes from applying a growth factor for traffic and an increase in efficiency to the actual emissions in 2009. The assumptions come from the International Air Transport Association; the Official Airline Guide; the Department for Environment, Food and Rural Affairs of the United Kingdom of Great Britain and Northern Ireland; Airports Council International; and Boeing;
• Emissions excluded because of their incidence on developing countries or because they relate to domestic flights: 550 Mt/year. All flights between developing countries and one half of flights between developed and developing countries are not taken into consideration in order to ensure no incidence of the tax on developing countries. In addition, all domestic and intra-European Union flights are excluded;
• Share of revenues raised used for international climate finance: between 25 and 50 per cent of total revenues.
It is assumed that a fuel levy would cover the cost of emissions at the carbon price, so the total revenues raised would be the same as in the case of an ETS with auctioning of 100 per cent of available credits. A ticket tax could be implemented in different ways (e.g., a flat fee, a flat fee linked to average carbon content or different fees for categories of flights linked to average carbon content). The assumption is made that the ticket tax should cover the cost of the emissions from passenger traffic, and that three different types of ticket taxes will be charged for short-, medium- and long-haul flights.28
Calculation stepsRevenues from a fuel levy or ETS under each carbon price scenario are calculated as follows (numbers in parentheses are for a medium carbon price scenario):
• Subtract the excluded domestic and developing country incidence from total emissions (800 Mt – 550 Mt = 250 Mt in scope);
• Multiply the carbon price by the total relevant emissions to determine revenues (US$25/ton x 250 Mt = US$6 billion);
• Multiply market size by the percentage of revenues earmarked for international climate finance to determine total revenues from source (between 25 and 50 per cent of US$6 billion = US$2 billion to US$3 billion).
D. Revenues generated from taxes on international maritime emissions
Description of sourceThe revenues for this source are generated by a tax on emissions from international maritime activities. It could be in the form of either a levy on maritime fuels for international voyages or a separate Emission Trading Schemes for these activities.
27 Excludes charter flights.28 Flights are defined as short-haul if they are less than 500 km, medium-haul if they are between 500 and 1,600 km and long-haul if
they are more than 1,600 km.

46 47
Revenue estimates by 2020(in billions of United States dollars)
Low carbon price Medium carbon price High carbon price
2-6 4-9 8-19
Assumptions and referencesThe key input variables for the calculation are as follows:
• Carbon prices: US$15, US$25 and US$50, which correspond to the low, medium and high price scenarios from the Advisory Group general assumptions;
• Total emissions from international maritime activities: between 925 Mt and 1,058 Mt in 2020 (from the International Maritime Organization, based on the Intergovernmental Panel on Climate Change Special Report on Emissions Scenarios);
• Share of revenues excluded due to incidence on developing countries: 30 per cent of total based on value share of worldwide imports;
• Share of revenues raised used for international climate finance: between 25 and 50 per cent of total revenues.
Calculation stepsRevenues from this source under each carbon price scenario are calculated as follows (numbers in parentheses are for a medium carbon price scenario):
• Subtract the excluded developing country incidence from total emissions (925 Mt to 1,058 Mt – 30 per cent = 648 Mt to 741 Mt in scope);
• Multiply the carbon price by the total relevant emissions to determine revenues (US$25/ton x 648 Mt-741 Mt = US$16 billion to US$19 billion);
• Multiply market size by the percentage of revenues earmarked for international climate finance to determine total revenues from source (between 25 and 50 per cent of US$16 billion to US$19 billion = US$4 billion to US$9 billion).
E. wires charge
Description of sourceThe revenues from this source would be generated by introducing a small charge on electricity generation, either per kWh produced (independent of carbon emissions) or on a kWh proportional to the generator’s carbon emissions. Unlike the other sources, revenue estimates are expressed as a function of the size of the charge.
Revenue estimates by 2020(in billions of United States dollars)
For every US$0.0004 per kWh (equivalent to US$1 per ton of CO2 in developed countries on average), US$5 billion in estimated revenue.
Assumptions and referencesThe key input variables for the calculation are as follows:
• Total OECD power emissions in 2020: 4.7 Gt (from World Energy Outlook 2009);
• Total power generated in OECD countries in 2020: 11,994 TWh (from World Energy Outlook 2009);

48 49
• Tax on carbon that could be used for international climate change financing: US$1/ton, with all revenues assumed to be destined for international climate action (100 per cent earmarking). This assumption is equivalent, for example, to a carbon price of US$25/ton with 4 per cent earmarking.
Calculation stepsRevenues for this source are calculated as follows:
Multiply the carbon price by the total relevant emissions to determine revenues (US$1/ton x 4.7 Gt = US$5 billion);
Divide the total revenues by the power generated to determine the corresponding per kWh charge (US$5 billion ÷ 11,994 TWh = US$0.0004/kWh).
F. Carbon tax
Description of sourceThe revenues from this source would be generated by a small charge on carbon emissions in developed countries. Unlike the other sources, revenue estimates are expressed as a function of the size of the charge.
Revenue estimates by 2020(in billions of United States dollars)
For every US$1 per ton of CO2 charge, US$10 billion in estimated revenue.
Assumptions and referencesThe key input variables for the calculation are as follows:
• Total OECD emissions in 2020: 10.9 Gt (from World Energy Outlook 2009);
• Tax on carbon that could be used for international climate change financing: US$1/ton. This assumption is equivalent, for example, to a carbon price of US$25/ton with 4 per cent earmarking for international climate action.
Calculation stepsRevenues from this source are calculated as follows:
• Multiply the carbon price by the total relevant emissions to determine revenues (US$1/ton x 10.9 Gt ~ US$10 billion)
G. Removal of fossil fuel subsidies
Description of sourceThe revenues from this source are assumed to be generated by the gradual removal of fossil fuel production subsidies in developed countries. The total estimates that were proposed for phase-out in nine countries in a recent Group of Twenty (G-20) report were approximately US$8 billion in 2009 in Annex 2 countries.29 Other estimates of the scale of subsidies are on the range of US$60 billion per year.30 Estimating the scale of potential fossil fuel subsidies in 2020 among Annex 2 countries is not possible given numerous uncertainties, particularly concerning the policy choices of future Governments regarding financial, tax and other incentives for fossil fuel production and consumption. Therefore, existing estimates of the scale of the proposed phase-out of current subsidies are used as the basis for
29 Australia, Canada, France, Germany, Italy, Japan, Spain, the United Kingdom and the United States, according to the June 2010 Group of Twenty (G-20) report entitled “Report to leaders on the G-20 commitment to rationalize and phase out inefficient fossil fuel subsidies”. This report is available from www.g20.org/exp_04.aspx. (Note: some of these countries did not propose any fossil fuel production subsidies for phase-out.)
30 See United Nations Development Programme, United Nations Department of Economic Affairs and World Energy Council, “World energy assessment overview: 2004 update”.

48 49
the 2020 estimate. One hundred per cent of the removed subsidies are assumed to be rechanneled to international climate action.
H. Redirection of fossil fuel royalties
Description of sourceThe revenues from this source are assumed to be generated by the redirection of a portion of the receipts from fossil fuel production in developed countries. The scenario considered is diverting existing receipts, not increasing the level of existing receipts.
The qualitative range reflects a survey of recent self-reported receipts from five key oil-producing developed countries. The recent federal annual receipts for each of these countries range from a few billion United States dollars (Australia and Canada) to tens of billions of United States dollars (Norway, the United Kingdom and the United States).
No point estimates were produced, reflecting the complexity of forecasting federal receipts, questions regarding the appropriate scope of jurisdictions (e.g., federal only versus also provincial) and revenue instruments to be considered, and questions about how to treat different types of existing revenue commitments in determining the share of revenue that would be available for climate finance. Therefore, existing estimates of the receipts are used as the basis for the 2020 estimate.
I. Development bank-type loans
Description of sourceMultilateral development banks are treated as a secondary source/channel for generating additional flows, rather than as a separate source in their own right. The methodology of the Advisory Group looks at what leverage could be achieved through the multilateral development banks channeling a portion of finance as mobilized by the other sources examined.
There are a series of assumptions and calculations made to determine the revenues available when treating the multilateral development banks as a channel:
• The appropriate percentage split in different carbon price scenarios between lending windows (concessional/non-concessional) was estimated at 50/50 (low case), 40/60 (medium case) and 25/75 (high case);
• The leverage that could be achieved in terms of multilateral development bank lending is estimated at 1:1.2 (concessional) and 1:5 (non-concessional), based on a review of the existing balance sheets of multilateral development banks and regional development banks. Based on the split between lending types, this corresponds to an overall leverage factor of 3 to 4;
• The grant equivalence of that lending is calculated with the OECD/DAC methodology for concessional lending (i.e., IDA-type) to determine the grant element of the lending, as described in this annex. Some Advisory Group members proposed applying the same methodology to non-concessional lending.
These assumptions can be summarized as follows: If US$10 billion of additional finance were to be channeled through the multilateral development banks, and allocated at a 40/60 split of concessional/non concessional lending (medium case), then total flows could be in the range of US$30 billion to US$40 billion over the funding period. This would be equivalent to US$11 billion in net flows.
J. Financial transaction tax
Description of sourceThe revenues from this source would be generated by a small tax levied on financial transactions. Two options were taken into consideration by the Advisory Group: a tax on foreign exchange transactions through CLS (settlement system) and a tax on transactions of all financial instruments, settled by a securities settlement system. The revenue estimates used by the Advisory Group are based on the former. Revenue estimates for this source are not linked to the carbon price.
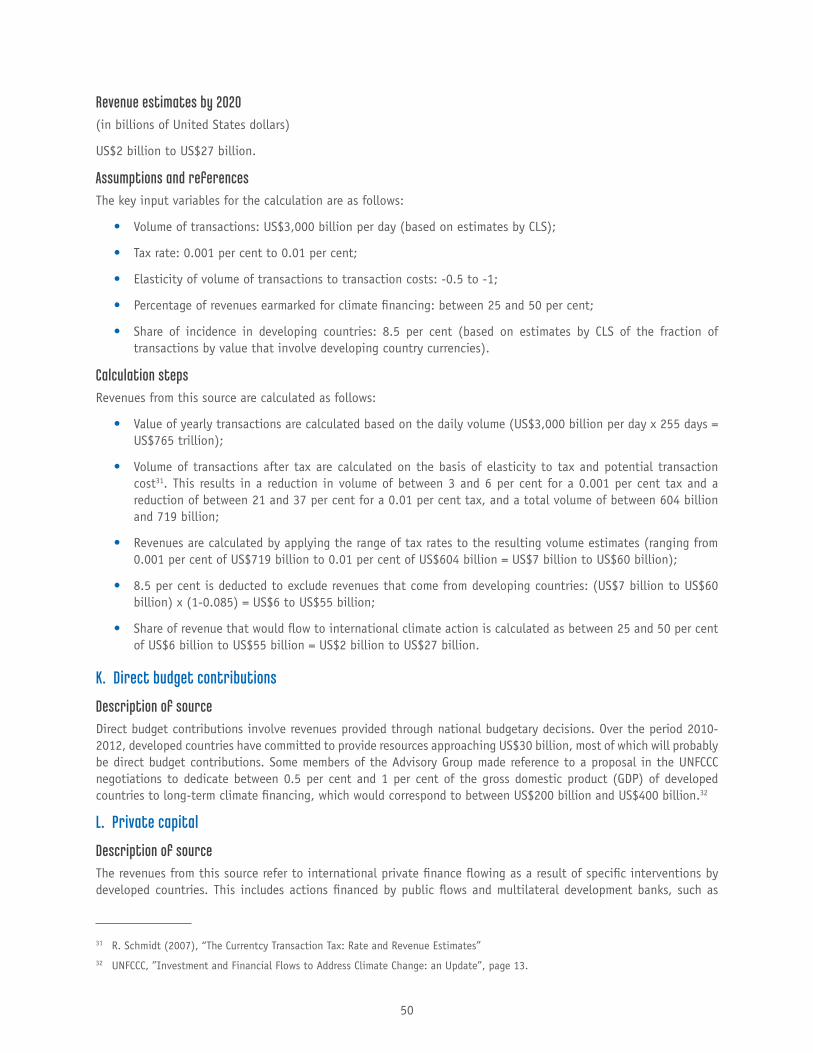
50 51
Revenue estimates by 2020(in billions of United States dollars)
US$2 billion to US$27 billion.
Assumptions and referencesThe key input variables for the calculation are as follows:
• Volume of transactions: US$3,000 billion per day (based on estimates by CLS);
• Tax rate: 0.001 per cent to 0.01 per cent;
• Elasticity of volume of transactions to transaction costs: -0.5 to -1;
• Percentage of revenues earmarked for climate financing: between 25 and 50 per cent;
• Share of incidence in developing countries: 8.5 per cent (based on estimates by CLS of the fraction of transactions by value that involve developing country currencies).
Calculation stepsRevenues from this source are calculated as follows:
• Value of yearly transactions are calculated based on the daily volume (US$3,000 billion per day x 255 days = US$765 trillion);
• Volume of transactions after tax are calculated on the basis of elasticity to tax and potential transaction cost31. This results in a reduction in volume of between 3 and 6 per cent for a 0.001 per cent tax and a reduction of between 21 and 37 per cent for a 0.01 per cent tax, and a total volume of between 604 billion and 719 billion;
• Revenues are calculated by applying the range of tax rates to the resulting volume estimates (ranging from 0.001 per cent of US$719 billion to 0.01 per cent of US$604 billion = US$7 billion to US$60 billion);
• 8.5 per cent is deducted to exclude revenues that come from developing countries: (US$7 billion to US$60 billion) x (1-0.085) = US$6 to US$55 billion;
• Share of revenue that would flow to international climate action is calculated as between 25 and 50 per cent of US$6 billion to US$55 billion = US$2 billion to US$27 billion.
K. Direct budget contributions
Description of sourceDirect budget contributions involve revenues provided through national budgetary decisions. Over the period 2010-2012, developed countries have committed to provide resources approaching US$30 billion, most of which will probably be direct budget contributions. Some members of the Advisory Group made reference to a proposal in the UNFCCC negotiations to dedicate between 0.5 per cent and 1 per cent of the gross domestic product (GDP) of developed countries to long-term climate financing, which would correspond to between US$200 billion and US$400 billion.32
L. private capital
Description of sourceThe revenues from this source refer to international private finance flowing as a result of specific interventions by developed countries. This includes actions financed by public flows and multilateral development banks, such as
31 R. Schmidt (2007), “The Currentcy Transaction Tax: Rate and Revenue Estimates”32 UNFCCC, ”Investment and Financial Flows to Address Climate Change: an Update”, page 13.

50 51
risk-mitigation instruments that compensate for potential lower rates of return required by the private investor (also referred to as “crowding in”), and by capacity-building to create and implement climate policies in developing countries, as well as carbon market offsets.
The total potential for private investment was estimated using a marginal abatement cost (MAC) curve. For opportunities with a positive marginal cost, a leverage factor is estimated by considering the amount of private flows generated for each dollar input into the average project, based on the McKinsey & Company MAC curve, as well as Clean Technology Fund and World Bank projects, as detailed by work stream 7. The resulting leverage factor for such projects was estimated to be in the range of 2x to 4x, or an average of 3x.
To apply this average leverage factor, an estimate of the amount of public flows, including multilateral development bank loans, and carbon market offsets available to leverage private investment is required, recognizing that not all such flows will leverage private finance. Carbon offset flows are estimated at between US$30 billion and US$50 billion in the medium carbon price scenario, as described in subsection M below. These are assumed to be fully available to leverage private investment.
In addition, it is assumed that a combination of multilateral development bank or other public finance provides between US$35 billion and US$60 billion that is fully available to leverage private climate-related investment. Importantly, this is not the total amount of multilateral development bank or other public finance for climate change, which would necessarily be larger. In fact, it is reasonable to assume that a significant fraction of total public flows will be used in ways that do not leverage private finance. Most multilateral development bank finance, however, is likely to leverage private finance. The between US$35 billion and US$60 billion of public resources to leverage private climate-related investment might therefore derive from either the total pool of public sources or from the smaller volume of additional multilateral development bank resources, as described in subsection I above, or from some combination of the two.
After applying the leverage factor to the volume of resources to be leveraged, this approach of estimating total private flows would include those from domestic sources and flows that originated in other developing countries. It was assumed that domestic investment could constitute up to 50 per cent of total private flows. These flows were excluded in the consideration of flows from developed countries.
Calculation stepsEstimated revenues from this source are then calculated as follows:
• Between US$30 billion and US$50 billion in financial flows through carbon market offsets (of which 100 per cent crowds in private investment);
• An additional US$35 billion to US$60 billion in multilateral development bank or other public finance, fully available to leverage private investment;
• Total leveraging funds available = between US$65 billion and US$110 billion;
• Using the average 3x leverage factor, this multiplies into between US$195 billion and US$330 billion;
• At the top end of the range, it would also be possible to include up to US$70 billion of private financing, potentially available to support negative-cost actions if driven by capacity-building supported by developed countries;
• From this total estimate of roughly US$200 billion to US$400 billion in leveraged private investment, up to 50 percent arising from domestic private sources within developing countries is excluded, leading to between US$100 billion and US$200 billion from developed countries.
There is no analytical or empirically agreed basis on which to do calculations of net private flows. Some members of the Advisory Group suggested a potential methodology based on the idea that private flows leveraged by public investment/instruments and carbon markets may have lowered their return expectations. An illustrative example can be based on a mid-case scenario that might generate a gross total of US$200 billion of international private capital

52 53
flows to developing countries by 2020. If investors of this capital modestly lowered their return expectations, for example by 2 per cent, because of the involvement of multilateral development banks or bilateral institutions in the investment, this would generate a benefit of 2 per cent of US$200 billion, or US$4 billion, each year over the lifetime of the projects. If one assumes a lifetime of 10 years and a cost of capital of between 10 and 15 per cent, the net present value of the US$4 billion cash flow would be between US$20 billion and US$24 billion. This would be a real reduction in the cost of delivering mitigation action in developing countries, and could be treated as a net private flow of between US$20 billion and US$24 billion per annum. The estimated net benefit could be particularly valuable for those developing countries with more limited access to international private capital.
M. Carbon market offsets
Description of sourceThe revenues for this source are related to the purchases of offsets in developing countries. The potential scale of resources is dependent on the emissions reduction commitments of developed countries and on carbon-market de-sign. The calculation described here represents the gross, or total, flows. Additional details on the net concept for carbon-market offsets are given in the main report.
Revenue estimates by 2020(in billions of United States dollars)
Low carbon price Medium carbon price High carbon price
8-12 38-50 150
Assumptions and referencesThe key input variables for the calculation are as follows:
• Carbon prices: US$15, US$25 and US$50, which correspond to the low, medium and high price scenarios from Advisory Group general assumptions;
• Total offsets: 0.5-0.8 Gt, 1.5-2 Gt and 3 Gt, which correspond to the low, medium and high price scenarios from Advisory Group general assumptions.
Calculation stepsRevenues from this source under each carbon price scenario are calculated as follows (numbers for medium carbon price scenario are given as an example):
• Multiply the carbon price by the total offsets to determine revenues: US$25/ton x 1.5 Gt to 2 Gt = US$38 billion to US$50 billion.

52 53
ANNEx III ExAMpLES OF SpENDING wISELy
Guyana’s low-carbon growth strategy: aligning global and national prioritiesGuyana’s low-carbon development strategy aims to “make national development and combating climate change complementary, not competing, objectives”. It does this by creating a national-scale, replicable model that addresses the 17 per cent of global greenhouse gas emissions that result from deforestation and forest degradation, while at the same time reorienting the Guyanese economy onto a “long-term, low deforestation, low-carbon climate resilient trajectory”. Guyana’s approach provides a useful model for how market-based climate finance could reduce emissions from deforestation and degradation in other developing countries.
I. Background
Recognizing the potential incompatibility between protecting Guyana’s forests and pursuing economically rational development opportunities, in late 2007 the President of Guyana laid out three challenges to create low carbon prosperity in forest countries:
(a) How to make forests worth more alive than dead: Guyana has about 16 million hectares of forest, cover-ing over 80 per cent of its territory. An “economically rational” development trajectory could see deforesta-tion in Guyana causing 1.5 Gt in cumulative emissions by 2020;
(b) How to decarbonize predicted future growth: As well as increasing deforestation pressures, a “business-as-usual” development trajectory would lead to carbon-intensive economic development in the non-forestry sectors of the economy;
(c) How to protect against climate change: Guyana’s coastal region and capital lie below sea level, and about 40 per cent of Guyana’s population lives in regions exposed to significant flooding risk. In 2005, floods caused damage equivalent to 60 per cent of gross domestic product (GDP), and the annual loss resulting from flooding is projected to be 10 per cent of current GDP by 2030.
II. Implementation
Guyana’s low-carbon development strategy seeks to address these challenges by interlinking national development, mitigation and adaptation:
Making forests worth more alive than dead: At the heart of the strategy is a climate finance mechanism, the Guyana REDD+ Investment Fund, which is structured as payment for forest climate services. Guyana sells “avoided deforestation credits” at US$5 per ton of CO2. Payments are then used as public finance in, or to catalyse private finance for, low-carbon investments. Although payments are results-based, it is estimated that Guyana will provide US$350 million of climate services during the period 2010-2015. The Government of Norway has stated its intention to pay for US$250 million worth of these services, based on an independent assessment of results achieved. Once the final US$100 million is committed, the Government of Guyana will be able to create the world’s first national-scale forest climate services scheme.
The Guyana-Norway partnership is designed to jointly identify and solve challenging issues that are internationally relevant, e.g. balancing national sovereignty with international safeguards. Funds from the the Guyana REDD+ Investment Fund are channelled into nationally determined low-carbon investments, in accordance with the financial, social and environmental safeguards of reputable international organizations. Annual assessment and verification is carried out by a third party. The system is designed to eventually transition towards funding from international carbon markets, reducing Guyana’s dependence on international public financing. It also incorporates a shrinking baseline for deforestation credits, thereby reducing carbon market supply over time. The methodology used

54 55
is compatible with the recommendations of the informal working group on interim financing for Reducing Emissions from Deforestation and Forest Degradation (REDD+), implying that its replication internationally could support global additionality and achieve reductions in global deforestation rates of 25 per cent by 2015 (estimated as 7 Gt in cumulative emissions abatement).
Decarbonizing future growth: During 2010-2015, payments for forest climate services are being channelled through the Guyana REDD+ Investment Fund to the first wave of public and private investments to support the transition towards a low-carbon economy. Investments in 2010 and 2011 will support low-carbon development for small businesses; expand Guyana’s digital infrastructure, including a fibre-optic link with Brazil; effect public interventions to catalyse private investments to access US$1 billion in identified export opportunities in six low carbon economic sectors; strengthen forest governance and capabilities to monitor, report and verify forest carbon abatement; and support social and economic development for indigenous peoples, forest-dependent communities and vulnerable groups.
The biggest investment of the Guyana REDD+ Investment Fund in 2010 and 2011 will see between US$40 million and US$60 million of payments being used as Government equity in a roughly US$750 million, private sector-led hydropower project. Government support will enable satisfactory returns for private investors, while ensuring a competitively priced electricity supply in Guyana. This will enable Guyana to switch from nearly 100 per cent dependence on fossil fuel-based electricity generation to nearly 100 per cent clean, renewable energy supplies. Sithe Global (an 80 per cent subsidiary of The Blackstone Group of the United States) and the China Development Bank are partnering with each other to provide private equity and debt financing.
Protecting against climate change: While Guyana’s total adaptation costs are projected to exceed US$1 billion, a portfolio of urgent, near-term investments has been identified. Priority projects will require about US$288 million of investment, including reinforcement of ocean sea walls, expansion of the early warning and emergency response system and improvement of sanitation and water resilience. Some Investment Fund money will be allocated to adaptation priorities, with other financing being secured through domestic and international channels.
III. Lessons for spending wisely
International support should be flexible enough to meet the national circumstances of a country, especially its desired path to low-carbon development. When the low-carbon development strategy was first promoted to Guyana’s development partners, few were able to provide substantial support on the basis that it did not “fit” with existing donor-funded programmes. Philanthropy was needed to make initial progress.
Predictable, results-based incentives for forest climate services are essential for forest countries. Action on avoiding deforestation and forest degradation competes with other urgent national development priorities. It also requires leaders to deploy significant political capital. If this action is to be prioritized by developing countries (with the consequent leadership and public sector reform demands), predictable, accessible and positive incentives are essential.
Robust monitoring, reporting and verification systems are required to make the forest payment system work. Although monitoring, reporting and verification is an issue that continues to be discussed within the REDD+ negotiations under the United Nations Framework Convention on Climate Change (UNFCCC), Guyana and Norway have identified a road map to progressively put in place monitoring, reporting and verification systems that are compliant with the Intergovernmental Panel on Climate Change (IPCC). In the early stages, payments for forest climate services are based on proxies for the eventual capabilities needed for IPCC-compliant monitoring, reporting and verification. In effect, these “discount” the payments that Guyana receives until a full monitoring, reporting and verification system is in place.
Transparency and adherence to internationally determined safeguards are essential for international partnership to work. A key challenge in designing the Guyana REDD+ Investment Fund, as with REDD+ internationally, has been ensuring that respect for national sovereignty over development decisions is balanced with adherence to international financial, social and environmental safeguards, for example to protect the rights of indigenous peoples. Absent UNFCCC guidance, the countries have designed the Investment Fund so that the safeguards of any of a jointly approved list of institutions are deemed acceptable.

54 55
Existing official development assistance (ODA) financial intermediation mechanisms will need reform if they are to be used for climate financing. Considerable time was spent by Guyana and Norway exploring whether particular ODA mechanisms could be used for the Investment Fund. Several (e.g., multi-donor trust funds) were not fit for purpose for a payment-for-services concept. The Investment Fund has been designed utilizing ODA components, but greater efficiencies will be achieved when modernized modalities are available.
Action on forestry can lead to development, adaptation and mitigation multipliers. Guyana’s low-carbon growth plan envisages using all of the payments for reduced deforestation to support additional development, mitigation and adaptation projects, effectively leveraging the international financing provided for avoided deforestation to broaden potential impact. Preliminary analysis suggests that this could reduce the cost per ton of CO2 abated by at least one third.
Forestry payments enable private sector leverage. Guyana is using some of the REDD+ payments to invest in early-stage critical infrastructure projects, with the aim of reducing the risks that would normally deter private investment (e.g., policy risk) before selling the projects to private investors.

56 57
The South Africa wind Energy programme: meeting the rising demand for energy sustainability by leveraging private finance
I. Background
The South African Wind Energy Programme is a multi-year technical assistance project, implemented by the United Nations Development Programme (UNDP) and co-financed by the Global Environment Facility (GEF), which is supporting the Government of South Africa in promoting the large-scale commercialization of wind energy. The South African Wind Energy Programme has been formulated in close collaboration with the Government’s Department of Energy. The project has received US$2.3 million in GEF grant funding.
South Africa has for many years experienced overcapacity in energy, fueled by plentiful coal reserves; however, in recent years the country has faced rapidly rising energy demand. At the time of the Wind Energy Programme’s design, South Africa had 36 GW in national installed capacity, which was both struggling to reach peak demand and due for replacement within 20 years. In this context, the Government began exploring the promotion of renewable energies, including wind energy. While wind energy held good potential, key barriers to its establishment included the following: (a) a lack of a policy framework for renewable energies; (b) uncertainty from the ongoing restructuring of the power market; (c) very low coal-based energy prices; and (d) a lack of awareness and appropriate skills in local developers and investors.
II. Implementation
The first phase of the Wind Energy Programme assistance included initial market and pre-feasibility studies to support Government officials on a range of issues related to wind energy. Studies included:
• Policy options on incremental cost mechanisms (e.g., green power market, tariffs and the Clean Development Mechanism (CDM));
• Commercial requirements for grid connection (e.g., licensing and power purchase agreements);
• Availability and accessibility of investment capital;
• Financial intermediation for independent power producers;
• Pipeline development of future wind energy projects.
In a second phase, the Programme then supported the successful implementation, in 2008, of a first-of-its-kind independent power producer demonstration project, the 5.2 MW Darling wind farm. This demonstration project used a premium pricing model and entered into a 20-year power purchase agreement with the City of Cape Town, for which a UNDP-established, GEF-funded US$1.4 million Green Power Guarantee Fund was instrumental.
In its current phase, assistance from the Programme is focused on national scale-up. The Programme has been a key contributor to South Africa’s national REFIT (Renewable Energy Feed-In Tariffs) framework announced in 2009. It is now contributing to the forthcoming national integrated resource plan, which will establish the allocation and financing of REFIT and other incentives, over a necessary investment horizon of 2010-2030. In anticipation of this private sector investment, the Programme’s activities include detailed wind mapping, capacity credit studies and local training in operations and maintenance.
III. Estimates of cost effectiveness
The Programme’s leverage factor may be viewed by two measures:
• Public flows (international and national): The Darling wind farm received US$10 million in co-financing from Denmark (DANCED and DANIDA), the Central Energy Fund and the Development Bank of Southern Africa. In addition, Cape Town’s power purchase agreement with Darling will generate 4.8 million rand in annual income (inflation-adjusted) over 20 years;

56 57
• Private flows: Eskom, the State-owned utility coordinating independent power producer interactions, has currently received in excess of 3 GW in advanced-stage wind farm grid connection applications. The South African Wind Energy Association estimates that approximately 5 GW could be commissioned by 2015. In indicative dollar terms, every 1 GW of newly installed wind energy typically amounts to between US$1.5 billion and US$2 billion in capital investments.
IV. Lessons for spending wisely
South Africa is now approaching a tipping point, where renewable energies will account for an increasingly significant portion of the nation’s energy supply. The South Africa Wind Energy Programme is an example of the importance of upstream technical assistance to put in place an optimum mix of policy and financial mechanisms which are tailored to each country’s unique market status and macroeconomic conditions. The result is a risk-reward profile that attracts developers and investors at scale. Key to this scaling up is a shift from project-based to sector-wide approaches, such as the national REFIT. The next step in this shift is to identify new sources of financing, national or international, for example nationally appropriate mitigation actions or green bonds, which can provide transitional or long-term funding for such sector-wide incentives.

58 59
The Caribbean Catastrophe Risk Insurance Facility: managing adaptation needs with efficient use of funds
I. Background
Many small island developing States are especially vulnerable to hazardous weather events such as coastal flooding and storm surges, inland flooding and storms. The Heads of Government of the Caribbean Community (CARICOM), whose countries have experienced massive damage from hurricanes in the past, recognized the need for catastrophe risk insurance in the region and, with the support of the international community, established the Caribbean Catastrophe Risk Insurance Facility, the world’s first multi-country risk pool that provides insurance solutions against natural catastrophes such as hurricanes and earthquakes to its 16 contributing member countries.
II. Implementation experience
The Caribbean Catastrophe Risk Insurance Facility contributed to enhancing the fact base on climate change adaptation in selected Caribbean States and territories33 by launching the “Economics of climate adaptation” (ECA) effort. The effort addressed three core questions: (a) Where and from what are we at risk?; (b) What is the magnitude of the expected loss?; and (c) How could we respond? In the following example, Anguilla is used to illustrate the preliminary results of the “Economics of climate adaptation” effort.34 It should be noted that the findings for other Caribbean islands differ significantly, as they are driven, for example, by country-specific differences in location, topography or the economic significance of particularly vulnerable sectors.
In Anguilla, as for most of the Caribbean, the biggest damage potential stems from hurricanes and related damage. By far the most important economic sector is tourism; correspondingly, people and assets are concentrated along the coasts. The magnitude of the expected loss from wind, inland flooding and coastal flooding is estimated for today’s climate and for three climate scenarios projected to 2030 using as main inputs data on hazard frequency and severity, asset values and vulnerabilities. Depending on the climate scenario, average annual losses for Anguilla from wind, inland flooding and coastal flooding are expected to increase by up to 125 per cent, from US$15 million in 2009 to between US$24 million and US$34 million in 2030, which represents up to 4 per cent of GDP in 2030. While 40 per cent of the increase is the result of climate change, the remaining 60 per cent is driven by economic growth. The ECA team assessed the specific costs and benefits of a list of about 20 relevant adaptation levers per country, i.e., the amount of expected economic loss each lever could avert. For Anguilla, 11 measures were shown to be “cost-effective” in the sense that they averted more losses than they cost to implement and maintain.35 Examples of cost-effective measures are coastal zoning, reef revival and wind-adapted buildings. By implementing those 11 measures, Anguilla could reduce its annual expected loss in the 2030 high-climate-change scenario by about 64 per cent. It is important to note that the percentage of avertable expected loss varies considerably among countries.
The main drivers are, for example, the importance of coastal flooding in the risk profile of a country and the value of its assets. As coastal flooding can be mitigated more cost-effectively than wind, a low-lying island such as Anguilla can increase its resilience in a more economically effective manner than a mountainous island, such as Dominica. Similarly, the considerably higher value of houses on the Cayman Islands compared with other islands allows for higher, but still cost-effective, investments to increase their resilience. These analyses are based on similar assumptions regarding the extent and complexity of adaptation measures for all countries. Measures could be further customized on a country-by-country basis to increase their benefits. For example, one could limit the windproofing of buildings to the most effective actions (e.g., reinforcing the roof), effectively applying a “design-to-cost” approach.
33 Anguilla, Antigua and Barbuda, Barbados, Bermuda, the Cayman Islands, Dominica, Jamaica and Saint Lucia.34 The preliminary results were generated from the input of regional stakeholders and experts as well as several country representatives.
The Caribbean Catastrophe Risk Insurance Facility would welcome the opportunity to further engage with countries in order to obtain feedback on the initial results and to determine the potential of an ongoing application of the approach throughout the Caribbean.
35 The threshold for cost-effective measures was set at 1.5 for all eight countries and territories and assumes a given level of risk aversion.

58 59
In many situations, risk-averse decision makers may wish to achieve a higher level of protection than a cost-benefit approach would imply and base their decision not only on expected costs and benefits, but also on the outcome of worst-case situations, which the methodology can provide by calculating the expected losses for events of different return periods (i.e., from 10- to 1,000-year events). In a risk-averse context, risk-transfer solutions may be the most economically effective way to address the financial impact of low-frequency and high-severity risks. Together, the results of the study illustrate the importance of a balanced portfolio of measures in each country. It is important to underline that the findings discussed above are based purely on economic considerations; however, decision makers have to consider further important elements, such as safeguarding life and the human cost of misery. As a consequence, the preliminary results do not imply that risk mitigation should not be pursued in all countries; rather, the findings suggest that the focus of an adaptation strategy in countries where only a small share of the damage can be averted cost-effectively should rely on the following two principles: (a) using suitable risk-mitigation initiatives to protect human lives, and (b) building on risk-transfer solutions to protect economic assets.
The preliminary results described above enable the government of Anguilla to develop a fact-based adaptation strategy that can be incorporated into national development plans in order to increase resilience against climate hazards. Based on the analysis and an assessment of its priorities (taking into account both monetary and non-monetary parameters), the government can decide what share of the expected losses to avert through adaptation measures, what share to transfer to insurance and what share to accept. Potential next steps are then to develop an adaptation business case and investment plan, to prioritize measures by setting out a road map and to use these plans in the search for funding.
III. Estimates of cost effectiveness
The financial resources that small island developing States need to adapt to climate change are beyond the means of some of the countries and have to come at least partially in the form of international aid. Governments of small island developing States would like to take full responsibility for how best to spend the funding for adaptation, and to that aim the ECA approach can provide meaningful insights in two ways. First, it establishes an objective set of data for decision makers. The idea of understanding the risk profile first is key for success, because too often decision makers jump directly to a discussion on adaptation levers and their costs without actually having understood the risk in detail beforehand. Second, by developing a specific adaptation cost curve for each country, the ECA study also provides a reasonable estimate of how much funding is actually needed to reach a certain level of risk adaptation. In the example, the government of Anguilla can use the results of the analysis to develop a detailed strategy on which measures to implement when and how much investment is needed over time, reducing the uncertainty for political decision makers both in Anguilla and in the international community (notwithstanding the uncertainties regarding actual climate change and its impact on hazards).
IV. Lessons for spending wisely
One important lesson from the ECA approach for the Caribbean is that providing a fact base for decision makers on the magnitude of future risk can greatly reduce uncertainty and provide guidance on how to prioritize activities. The ECA approach makes it possible to decide rationally which hazards to prioritize in terms of adaptation and to derive a customized adaptation portfolio for a country. Building on this, a small island nation can develop an investment plan and a strategy to acquire funding for adaptation. Another lesson is that optimal adaptation strategies can differ dramatically, even among small island developing States from the same region, owing to differences in terms of geography or asset value. It is critical that the ECA approach be tailored to each individual country before a portfolio of measures is selected and funding decisions are taken. Looking ahead, the ECA approach can help small island developing States to integrate their strategies for climate adaptation with wider economic development strategies, i.e., to prioritize those adaptation levers that have the highest impact on the overall economic development of a country, thus promoting both goals simultaneously.

60 61
Indonesia’s Geothermal power Development programme: utilizing bilateral, multilateral and private financing for mitigation benefits
I. Background
Indonesia’s greenhouse gas emissions are globally significant. Land-use change from peat and deforestation is the single largest contributor to greenhouse gases. The energy sector is the second largest source of CO2 emissions in Indonesia. If Indonesia continues on a business-as-usual path, its emissions will nearly triple by 2025. The Government of Indonesia has pledged under the Copenhagen Accord that it intends to reduce greenhouse emissions by 26 per cent relative to business as usual by 2020, and to make a further reduction of up to 41 per cent with international support. Geothermal development is a strategic priority for the Government of Indonesia that meets both its energy and climate change needs. Despite its prospects, geothermal development in Indonesia has been slow; it is capital-intensive and requires high upfront capital investment. Furthermore, the nature of geothermal resources also presents geological and technical risks and high costs in the early stage of development. The Government of Indonesia is now at a crossroads where an opportunity exists for a transformational shift towards large-scale development of geothermal power to meet a significant part of its growing power demand needs. If successfully implemented, the proposed geothermal expansion programme will help alter the business-as-usual trajectory for emissions from the power sector. If this expansion were to fall short, then Indonesia would be compelled to seek alternative energy sources to supply its base-load generation needs, most likely by reverting to an equivalent expansion of coal-based capacity, in line with the business-as-usual scenario.
II. proposed interventions
The Government of Indonesia is already undertaking considerable reforms to scale up the development of geothermal resources. In parallel, a package of multiple financial instruments is being designed and proposed by the Government of Indonesia to help finance the immediate scale-up needs. These proposed instruments include:
• A concessional loan from the Clean Technology Fund: funds of US$300 million have been allocated to co-finance large-scale geothermal plants with the Asian Development Bank (ADB), the International Bank for Reconstruction and Development (IBRD) and the International Finance Corporation (IFC);
• Lending from multilateral development banks: Both ADB and the World Bank are now preparing an investment of up to US$500 million in the form of a loan to increase the Government of Indonesia’s geothermal capacity. The loan will be complemented by the proposed investment from the Clean Technology Fund;
• Grant from GEF for sector reform: Through the GEF-funded Geothermal Power General Development Project, the World Bank is assisting the Government of Indonesia in improving the investment climate for geothermal development in order to ensure programme sustainability;
• Carbon finance: The IBRD is designing a framework for carbon financing for geothermal projects that will facilitate the programmatic application of the Clean Development Mechanism to generate additional revenues to further improve the financial viability of geothermal projects in Indonesia;
• Leveraging private investment: There has been little investment in geothermal development in Indonesia. It is expected that, once a small number of geothermal fields are successfully awarded to developers, this can serve as a demonstration for potential business models for progressively increasing private participation in the sector over the longer term. To this end, IFC is providing advisory services to the Government to prepare several competitive tenders to be offered either for sole private development or as a part of a public-private partnership.
In addition to the financial sources channeled through international financial institutions, the Government of Indonesia is receiving financial resources from a number of bilateral channels, including Germany (through KfW), the Netherlands, Japan, the United States of America, France and Australia. The Government of Indonesia has also established its own climate change trust fund, with contributions from Governments and international donors, to support mitigation and adaptation activities.

60 61
III. Estimates of cost effectiveness
The proposed new capacity financed by the Clean Technology Fund, ADB and IBRD could generate as much as 3,950 GWh of base-load power per year, directly offsetting coal-fired generation. Greenhouse gas reductions were estimated at about 3.2 Mt of CO2 equivalent per year, which would result in a cumulative emissions savings of 63 million tons over a 20-year plant life. It is expected that the total Clean Technology Fund financing would be slated to mobilize an additional more than US$2 billion from a range of other sources. In addition, the scale of the investment programme would establish operational and cost benchmarks that will inform the policy and regulatory reform process that is already under way and is necessary for sustained expansion of the sector. It would also create the conditions for replication by building capacity in key public and private sector entities for investments at scale. The programme would also, over time, reduce costs through institutional learning, generating economies of scale and encouraging local manufacture.
IV. Lessons for spending wisely
The early insights of Indonesia’s geothermal programme show that: (a) intervention must be of sufficient scale to serve as a flagship and have a demonstrative effect in the sector. A combination of multiple sources – grants, loans, carbon finance and private investment – through multilateral and bilateral channels needs to be mobilized to support sector transformation; (b) public financing from the Clean Technology Fund, blended with multilateral financing, plays a key role in reducing upfront financial and technical risks, leveraging private investment and developing domestic technical and managerial capacity for expansion; and (c) the programme must achieve significant development goals besides mitigation. The development of an indigenous energy source will enhance energy security, stabilize the cost of power generation and provide greater availability of power supplies to poor people.

62 63
The African water Facility: Long-term solutions for improved water resources management and use deliver multiple benefits
I. Background
The African Water Facility is an initiative of the African Ministers’ Council on Water. It is hosted and managed by the African Development Bank (AfDB). The Facility began its operations in 2006, and currently has a portfolio of 65 projects valued at €77 million. A primary objective of the projects supported by the Facility is to help put in place long-term solutions for improved water resources management and use. As such, many Facility projects have significant climate adaptation and mitigation impacts. These include the development and implementation of integrated water resources management plans and support to sector institutions such as river basin authorities; the introduction of innovative technologies and approaches for water supply-sanitation-drainage-solid waste-reuse; the improved management of water resources for agriculture; and better information on national and transboundary surface water and groundwater resources.
II. Implementation experience
National water resources management: The integrated water resources management projects and activities of the Facility enable countries to understand the impact of climate change and variability on water resources management. The Facility supports the development of strategies to achieve water security, as well as action plans to mitigate and adapt to negative impacts. Nine such national integrated water resources management projects are ongoing or completed (Burkina Faso, Burundi, the Central African Republic, Gambia, Liberia, Mauritania, Namibia, the Niger and Senegal). Other ongoing integrated water resources management projects involve undertaking concrete actions to improve adaptation to climate change, such as ecosystem-based adaptation (Kenya) and the recharge of natural aquifers (Morocco).
Transboundary water resources management: Regional cooperation provides the greatest opportunity for analysing and understanding the problems of, and designing strategies for coping with, the impact of climate change and variability. Achieving water security to cope with impacts requires significant investments in infrastructure. African Water Facility transboundary water resources management and related project preparation interventions are addressing these climate change and water security issues, with six regional transboundary water resources management projects (the Congo, Volta and Kayanga-Geba river basins; Lake Chad; the Bugesera area of Burundi and Rwanda; and the Economic Community of Central African States region), and four regional programme preparation projects (African Union Commission pan-African, Lake Victoria, Malawi/Republic of Tanzania, the Southern African Development Community region).
Water resources information management: Data, information and knowledge are necessary for understanding climate change impacts, as well as for the planning and designing of adaptation measures. Providing support to the development of information management systems to be used for the elaboration of national and regional plans, programmes and project designs, and for generating data for M&E activities for decision-making, is a significant focus of the Facility, with six regional projects (the Congo, Nile and Volta river basins; the North-Western Sahara, Lullimenden and Taoudeni aquifer systems; and the Intergovernmental Authority on Development subregion) and four national projects (Ethiopia, Mali, Togo and Tunisia).
Water supply and sanitation: Building resilience of water supply and sanitation to climate change impacts requires more resilient infrastructure as well as climate-responsive planning, management and governance of supply options. Many Facility projects address these issues through pilot investments aimed at promoting mitigation and adaptation technologies such as the use of renewable energies for water pumping (Ethiopia), the recovery and reuse of methane emissions from sewerage treatment plants (Ghana) and the adoption of water conservation and efficiency measures (Seychelles), as well as the strengthening of local capacities to widely adopt and scale up these types of interventions. In addition, projects aimed at preparing long-term programmes and master plans include activities aimed at planning for adaptation to climate change impacts.

62 63
Water for agriculture: Improving agricultural and land management practices in order to strengthen both productivity and resilience to climate change are issues which many Facility projects address. Activities of ongoing projects include improving the control and management of on-farm water resources (Botswana), watershed protection (Kenya) and the piloting of more productive agriculture water technologies, such as the use of rainwater harvesting for multi-purpose uses (Djibouti and Rwanda). Many projects are also aimed at helping small-scale farmers adapt to climate change and ensure sustained agriculture-based livelihoods (Zambia and South Africa).
III. Estimates of cost effectiveness
The cost effectiveness of Facility projects can best be described by qualitatively examining the expected impacts based on three broad categories of interventions:
(a) Facilitative projects to improve the enabling environment, which promotes a better management of Africa’s water resources, more efficient and effective use of water and better water governance. Since a well-managed sector will create the confidence needed to attract additional resources, the potential impact of a small Facility project can be very significant;
(b) Pilot investment projects aimed at promoting new technologies or approaches that are designed to be replicated and scaled up on a large scale. Many pilot projects have direct climate mitigation impacts, such as the use of renewable energies for water pumping. The impact of a small investment by the Facility, which is normally on the order of US$1.4 million to US$2.8 million, can be significant if the technology or approach is widely adopted;
(c) Programme and project preparation aimed at attracting large amounts of resources for implementation. Many Facility preparation projects have significant potential mitigation and adaptation impacts, e.g., programmes for water infrastructure development in Africa or the management of transboundary water resources, projects aimed at improved urban water and solid waste management, and the provision of water infrastructure for agricultural and multi-purpose uses. To date, the Facility has leveraged approximately US$361 million in investment funds as a result of its project and programme preparation activities.
IV. Lessons for spending wisely
The experience of the African Water Facility points to the need for proper planning for both adaptation and mitigation in Africa. Water management, in particular, includes both adaptation and mitigation, and is deeply connected to issues of development. As a result, it provides a useful illustration of the type of challenges that African countries and other countries around the world will face in the coming decades. Such challenges will require thorough planning and coordination among programmes and across countries, as the Facility example makes clear. These cannot be treated as stand-alone challenges, but rather need to be tackled in a coordinated manner. Ownership on behalf of developing countries will be crucial. Action should be consistent with country priorities, guided by national or regional adaptation and mitigation strategies, and will need to be accompanied by accountability and transparency with regard to spending. For such planning efforts to be successful, predictable and accountable flows of funds will be required, and will give confidence to developing countries that support for these activities is reliable.
Given this context, it could be useful to consider two green funds for Africa that could deliver roughly US$20 billion per annum, one on green infrastructure and one on adaptation. Funds of roughly this magnitude could be broadly consistent with finance flows on the scale envisaged by the Copenhagen Accord and could demonstrate how placing some priority on Africa and other vulnerable regions could be embodied in action (see paragraph 5 of the terms of reference of the Advisory Group in annex I above and paragraph 8 of the Copenhagen Accord). A potential location of such funds could be a separate “third” concessional window for lending through AfDB, or similarly through other regional development banks. There are a number of options in terms of the construction of such a facility; the first choice is between a single facility and separate trust funds for adaptation, mitigation and REDD. In either case, AfDB would manage the resources but not necessarily implement all activities itself. Implementing agencies would include other multilateral development banks and suitably qualified regional institutions. A range of suitable instruments

64 65
should be made available through such a facility that are innovative and flexible in application and able to facilitate investments on a regional, multi-country and national basis. Action must encompass the public and private sector, as well as small-, medium- and large-scale enterprises. Appropriate financing terms are needed, from grants to concessional to non-concessional resources, as is equity participation; terms should be determined by the nature of the climate investment, not simply country-level creditworthiness. Importantly, arrangements should promote coherence and coordination among sources of financing. The proliferation of small, separate funding channels that bring high transaction costs for recipients, particularly those with limited capacity, should be avoided.

Printed at the United Nations, New York
10-63081—November 2010—2,500