Embed Size (px)
Citation preview

Report of theDiagnostic Review Team
forDayton Independent
200 Clay StDayton
KY 41074US
Date: January 31, 2016 - February 3, 2016
Document Generated On March 2, 2016

Copyright (c) 2016 by Advance Education, Inc. AdvancED™ grants to the Institution, which is the subject of the Diagnostic Review Team Report, and its
designees and stakeholders a non-exclusive, perpetual, irrevocable, royalty-free license and release to reproduce, reprint, and distribute this report in
accordance with and as protected by the Copyright Laws of the United States of America and all foreign countries. All other rights not expressly
conveyed are reserved by AdvancED™.
Document Generated On March 2, 2016
Kentucky Department of Education Dayton Independent
© 2016 Advance Education, Inc. All rights reserved unless otherwise granted by written agreement. Page 2

Table of Contents Introduction 4
Results 8
Teaching and Learning Impact 8
Standard 3 - Teaching and Assessing for Learning 9
Standard 5 - Using Results for Continuous Improvement 10
Effective Learning Environments Observation Tool (eleot™) 11
eleot™ Data Summary 14
Findings 17
Leadership Capacity 23
Standard 1 - Purpose and Direction 24
Standard 2 - Governance and Leadership 24
Resource Utilization 25
Standard 4 - Resources and Support Systems 25
Conclusion 27
Addenda 30
Team Roster 30
About AdvancED 32
References 33
Attachments 34
Document Generated On March 2, 2016
Kentucky Department of Education Dayton Independent
© 2016 Advance Education, Inc. All rights reserved unless otherwise granted by written agreement. Page 3
Kentucky Department of Education Dayton Independent
© 2016 Advance Education, Inc. All rights reserved unless otherwise granted by written agreement. Page 3

-
-
IntroductionThe Diagnostic Review is carried out by a team of highly qualified evaluators who examine the institution's
adherence and commitment to the research-aligned AdvancED Standards. The Diagnostic Review Process is
designed to energize and equip the leadership and stakeholders of an institution to achieve higher levels of
performance and address those areas that may be hindering efforts to reach desired performance levels. The
Diagnostic Review is a rigorous process that includes examination of evidence and relevant performance data,
interviews with stakeholders, and observations of instruction, learning and operations.
The Diagnostic Review Team used the AdvancED Standards and related criteria to guide its evaluation,
looking not only for adherence to standards, but also for how the institution functioned as a whole and
embodied the practices and characteristics of quality. Using the evidence at their disposal, the Diagnostic
Review Team arrived at a set of findings contained in this report.
Standards help to delineate what matters. They provide a common language through which an education
community can engage in conversations about educational improvement, institution effectiveness, and
achievement. They serve as a foundation for planning and implementing improvement strategies and activities
and for measuring success. AdvancED Standards were developed by a committee comprised of talented
educators and leaders from the fields of practice, research and policy who applied professional wisdom, deep
knowledge of effective practice, and the best available research to craft a set of robust standards that define
institutional quality and guide continuous improvement. Prior to implementation, an internationally recognized
panel of experts in testing and measurement, teacher quality and education research reviewed the standards
and provided feedback, guidance and endorsement.
The AdvancED Diagnostic Review Team uses AdvancED Standards, associated Indicators and criteria related
to student performance and stakeholder engagement to guide its evaluation. The Standards, Indicators and
related criteria are evaluated using Indicator-specific performance levels. The Team rates each Indicator and
criterion on a scale of 1 to 4. The final scores assigned to the Indicators and criteria represent the average of
the Diagnostic Review Team members' individual ratings.
Use of Diagnostic ToolsA key to examining the institution is the design and use of diagnostic tools that reveal the effectiveness with
which an institution creates conditions and implements processes and practices that impact student
performance and success. In preparation for the Diagnostic Review, the institution conducted a Self
Assessment using the AdvancED Standards and provided evidence to support its conclusions vis a vis
organizational effectiveness in ensuring acceptable and improving levels of student performance.
An indicator-based tool that connects the specific elements of the criteria to evidence gathered by the
team;
a student performance analytic that examines the quality of assessment instruments used by the
institution, the integrity of the administration of the assessment to students, the quality of the learning
Document Generated On March 2, 2016
Kentucky Department of Education Dayton Independent
© 2016 Advance Education, Inc. All rights reserved unless otherwise granted by written agreement. Page 4
Kentucky Department of Education Dayton Independent
© 2016 Advance Education, Inc. All rights reserved unless otherwise granted by written agreement. Page 4
Kentucky Department of Education Dayton Independent
© 2016 Advance Education, Inc. All rights reserved unless otherwise granted by written agreement. Page 4

-
-
results including the impact of instruction on student learning at all levels of performance, and the
equity of learning that examines the results of student learning across all demographics;
a stakeholder engagement instrument that examines the fidelity of administration and results of
perception surveys seeking the perspective of students, parents, and teachers;
a state-of-the-art, learner-centric observation instrument, the Effective Learning Environments
Observation Tool (eleot™) that quantifies students' engagement, attitudes and dispositions organized
in 7 environments: Equitable Learning, High Expectations, Supportive Learning, Active Learning,
Progress Monitoring and Feedback, Well-Managed Learning, and Digital Learning. All evaluators must
be trained, reach acceptable levels of inter-rater reliability, and certified to use this research-based and
validated instrument.
The Diagnostic Review Team's findings and critical observations are shared in this report through the Indicator
ratings, identification of Powerful Practices and Improvement Priorities.
Powerful PracticesA key to continuous improvement is the institution's knowledge of its most effective and impactful practices.
Such practices, yielding a performance level of 4, serve as critical leverage points necessary to guide, support
and ensure continuous improvement. The Diagnostic Review process is committed to identifying conditions,
processes and practices that are having the most significant impact on student performance and institutional
effectiveness. The Diagnostic Review Team has captured and defined Powerful Practices that it identified as
essential to the institution's effort to continue its journey of improvement.
Improvement PrioritiesThe Diagnostic Review Team reviewed, analyzed and deliberated over significant bodies of evidence provided
by the institution and gathered by the team during the process. For those instances in which this analysis
yielded a Level 1 Indicator rating, an Improvement Priority has been identified by the team to guide
improvement efforts. Improvement Priorities are supported by extensive explanation and rationale to give
school leaders and stakeholders a clear understanding of the conditions, practices, policies, etc., revealed
through the Diagnostic Review process. Improvement Priorities are intended to be incorporated into the
institution's improvement plan.
The ReviewDayton Independent Schools hosted a Diagnostic Review from January 31 through February 3, 2016. The
four-day on-site review involved a six member team who provided their knowledge, skills and expertise for
carrying out the Diagnostic Review process and developing this written report of their findings.
The Diagnostic Review Team expresses its appreciation to the staff and stakeholders of Dayton Independent
Schools for their hospitality and welcome throughout the visit. The leadership team is commended for their
prompt response to the Team's varied requests and commitment to the process of continuous improvement.
Document Generated On March 2, 2016
Kentucky Department of Education Dayton Independent
© 2016 Advance Education, Inc. All rights reserved unless otherwise granted by written agreement. Page 5
Kentucky Department of Education Dayton Independent
© 2016 Advance Education, Inc. All rights reserved unless otherwise granted by written agreement. Page 5
Kentucky Department of Education Dayton Independent
© 2016 Advance Education, Inc. All rights reserved unless otherwise granted by written agreement. Page 5

Prior to the start of the Diagnostic Review, the Team engaged in conference calls and various communications
to complete the initial intensive study, review and analysis of various documents provided by the district. In
addition, the Team conversed electronically to determine team member assignments and discuss logistics for
the on-site review. The Lead Evaluator communicated and collaborated with district officials on numerous
occasions prior to the visit to ensure a positive, productive on-site review.
Team members arrived in Dayton, Kentucky on January 31, 2016, and convened for a work session to discuss
the preliminary review of data and information, consider points of inquiry, review team member individual
schedules and prepare for upcoming interviews. As part of the initial work session, the principal presented an
overview of Dayton High School's progress toward each of the Improvement Priorities identified during the
previous Diagnostic Review and briefed the Team about key initiatives that have been implemented under his
leadership.
The Diagnostic Review Team worked on-site from February 1 through 3, 2016. As part of the on-site work,
Team members conducted interviews with district leadership, personnel, community members, business
partners, board members, parents and instructional and support staff members. Throughout the Diagnostic
Review process, the Team examined artifacts and evidence provided by Dayton Independent Schools. In
addition, the Team met on the evenings of February 1, 2016, and February 2, 2016, to review interview data,
discuss additional evidence, rate each of the indicators and identify Improvement Priorities.
A total of 29 stakeholders were interviewed, and 17 classrooms were observed during the Diagnostic Review.
Throughout the Diagnostic Review, school leaders, faculty and staff were open and honest in discussing their
continuous improvement efforts at Dayton Independent Schools.
Stakeholders were interviewed by members of the Diagnostic Review Team to gain their perspectives on
topics relevant to the institution's effectiveness and student performance. The feedback gained through the
stakeholder interviews was considered with other evidences and data to support the findings of the Diagnostic
Review. The following chart depicts the numbers of persons interviewed representative of various stakeholder
groups.
Using the evidence at their disposal, the AdvancED Diagnostic Review Team arrived at a set of findings
Stakeholder Interviewed Number
Board Members 5
Administrators 5
Instructional Staff 3
Support Staff 6
Parents/Community/Business Leaders 10
Total 29
Document Generated On March 2, 2016
Kentucky Department of Education Dayton Independent
© 2016 Advance Education, Inc. All rights reserved unless otherwise granted by written agreement. Page 6
Kentucky Department of Education Dayton Independent
© 2016 Advance Education, Inc. All rights reserved unless otherwise granted by written agreement. Page 6
Kentucky Department of Education Dayton Independent
© 2016 Advance Education, Inc. All rights reserved unless otherwise granted by written agreement. Page 6

contained in this report. The report is presented in three sections: Results, Conclusion and Addenda.
Document Generated On March 2, 2016
Kentucky Department of Education Dayton Independent
© 2016 Advance Education, Inc. All rights reserved unless otherwise granted by written agreement. Page 7
Kentucky Department of Education Dayton Independent
© 2016 Advance Education, Inc. All rights reserved unless otherwise granted by written agreement. Page 7
Kentucky Department of Education Dayton Independent
© 2016 Advance Education, Inc. All rights reserved unless otherwise granted by written agreement. Page 7

ResultsTeaching and Learning ImpactThe impact of teaching and learning on student achievement is the primary expectation of every institution.
The relationship between teacher and learner must be productive and effective for student success. The
impact of teaching and learning includes an analysis of student performance results, instructional quality,
learner and family engagement, support services for student learning, curriculum quality and efficacy, and
college and career readiness data. These are all key indicators of an institution's impact on teaching and
learning.
A high-quality and effective educational system has services, practices, and curriculum that ensure teacher
effectiveness. Research has shown that an effective teacher is a key factor for learners to achieve their highest
potential and be prepared for a successful future. The positive influence an effective educator has on learning
is a combination of "student motivation, parental involvement" and the "quality of leadership" (Ding & Sherman,
2006). Research also suggests that quality educators must have a variety of quantifiable and intangible
characteristics that include strong communication skills, knowledge of content, and knowledge of how to teach
the content. The institution's curriculum and instructional program should develop learners' skills that lead them
to think about the world in complex ways (Conley, 2007) and prepare them to have knowledge that extends
beyond the academic areas. In order to achieve these goals, teachers must have pedagogical skills as well as
content knowledge (Baumert, J., Kunter, M., Blum, W., Brunner, M., Voxx, T., Jordan, A., Klusmann, U.,
Krauss, S., Nuebrand, M., & Tsai, Y., 2010). The acquisition and refinement of teachers' pedagogical skills
occur most effectively through collaboration and professional development. These are a "necessary approach
to improving teacher quality" (Colbert, J., Brown, R., Choi, S., & Thomas, S., 2008). According to Marks, Louis,
and Printy (2002), staff members who engage in "active organizational learning also have higher achieving
students in contrast to those that do not." Likewise, a study conducted by Horng, Klasik, and Loeb (2010),
concluded that leadership in effective institutions "supports teachers by creating collaborative work
environments." Institutional leaders have a responsibility to provide experiences, resources, and time for
educators to engage in meaningful professional learning that promotes student learning and educator quality.
AdvancED has found that a successful institution implements a curriculum based on clear and measurable
expectations for student learning. The curriculum provides opportunities for all students to acquire requisite
knowledge, skills, and attitudes. Teachers use proven instructional practices that actively engage students in
the learning process. Teachers provide opportunities for students to apply their knowledge and skills to real
world situations. Teachers give students feedback to improve their performance.
Institutions with strong improvement processes move beyond anxiety about the current reality and focus on
priorities and initiatives for the future. Using results, i.e., data and other information, to guide continuous
improvement is key to an institution's success. A study conducted by Datnow, Park, and Wohlstetter (2007)
from the Center on Educational Governance at the University of Southern California indicated that data can
shed light on existing areas of strength and weakness and also guide improvement strategies in a systematic
and strategic manner (Dembosky, J., Pane, J., Barney, H., & Christina, R., 2005). The study also identified six
Document Generated On March 2, 2016
Kentucky Department of Education Dayton Independent
© 2016 Advance Education, Inc. All rights reserved unless otherwise granted by written agreement. Page 8
Kentucky Department of Education Dayton Independent
© 2016 Advance Education, Inc. All rights reserved unless otherwise granted by written agreement. Page 8
Kentucky Department of Education Dayton Independent
© 2016 Advance Education, Inc. All rights reserved unless otherwise granted by written agreement. Page 8
Kentucky Department of Education Dayton Independent
© 2016 Advance Education, Inc. All rights reserved unless otherwise granted by written agreement. Page 8

key strategies that performance-driven systems use: (1) building a foundation for data-driven decision making,
(2) establishing a culture of data use and continuous improvement, (3) investing in an information management
system, (4) selecting the right data, (5) building institutional capacity for data-driven decision making, and (6)
analyzing and acting on data to improve performance. Other research studies, though largely without
comparison groups, suggested that data-driven decision-making has the potential to increase student
performance (Alwin, 2002; Doyle, 2003; Lafee, 2002; McIntire, 2002).
Through ongoing evaluation of educational institutions, AdvancED has found that a successful institution uses
a comprehensive assessment system based on clearly defined performance measures. The system is used to
assess student performance on expectations for student learning, evaluate the effectiveness of curriculum and
instruction, and determine strategies to improve student performance. The institution implements a
collaborative and ongoing process for improvement that aligns the functions of the school with the expectations
for student learning. Improvement efforts are sustained, and the institution demonstrates progress in improving
student performance and institution effectiveness.
Standard 3 - Teaching and Assessing for LearningThe system's curriculum, instructional design, and assessment practices guide and ensure teacher
effectiveness and student learning across all grades and courses.
Indicator Description Review TeamScore
3.1 The system's curriculum provides equitable and challenging learningexperiences that ensure all students have sufficient opportunities to developlearning, thinking, and life skills that lead to success at the next level.
1.50
3.2 Curriculum, instruction, and assessment throughout the system are monitoredand adjusted systematically in response to data from multiple assessments ofstudent learning and an examination of professional practice.
1.83
3.3 Teachers throughout the district engage students in their learning throughinstructional strategies that ensure achievement of learning expectations.
2.00
3.4 System and school leaders monitor and support the improvement of instructionalpractices of teachers to ensure student success.
1.50
3.5 The system operates as a collaborative learning organization through structuresthat support improved instruction and student learning at all levels.
2.00
3.6 Teachers implement the system's instructional process in support of studentlearning.
1.00
3.7 Mentoring, coaching, and induction programs support instructional improvementconsistent with the system's values and beliefs about teaching and learning.
2.00
3.8 The system and all of its schools engage families in meaningful ways in theirchildren's education and keep them informed of their children's learningprogress.
2.00
3.9 The system designs and evaluates structures in all schools whereby eachstudent is well known by at least one adult advocate in the student's school whosupports that student's educational experience.
2.00
Document Generated On March 2, 2016
Kentucky Department of Education Dayton Independent
© 2016 Advance Education, Inc. All rights reserved unless otherwise granted by written agreement. Page 9
Kentucky Department of Education Dayton Independent
© 2016 Advance Education, Inc. All rights reserved unless otherwise granted by written agreement. Page 9
Kentucky Department of Education Dayton Independent
© 2016 Advance Education, Inc. All rights reserved unless otherwise granted by written agreement. Page 9
Kentucky Department of Education Dayton Independent
© 2016 Advance Education, Inc. All rights reserved unless otherwise granted by written agreement. Page 9
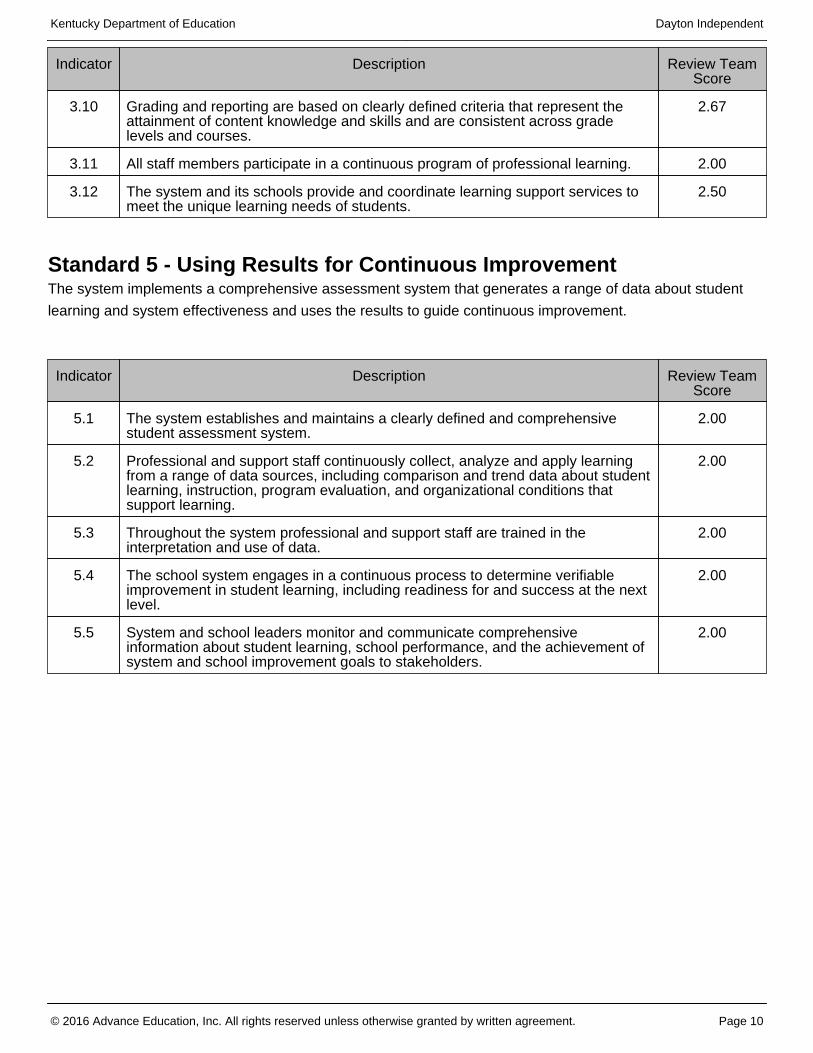
Standard 5 - Using Results for Continuous ImprovementThe system implements a comprehensive assessment system that generates a range of data about student
learning and system effectiveness and uses the results to guide continuous improvement.
Indicator Description Review TeamScore
3.10 Grading and reporting are based on clearly defined criteria that represent theattainment of content knowledge and skills and are consistent across gradelevels and courses.
2.67
3.11 All staff members participate in a continuous program of professional learning. 2.00
3.12 The system and its schools provide and coordinate learning support services tomeet the unique learning needs of students.
2.50
Indicator Description Review TeamScore
5.1 The system establishes and maintains a clearly defined and comprehensivestudent assessment system.
2.00
5.2 Professional and support staff continuously collect, analyze and apply learningfrom a range of data sources, including comparison and trend data about studentlearning, instruction, program evaluation, and organizational conditions thatsupport learning.
2.00
5.3 Throughout the system professional and support staff are trained in theinterpretation and use of data.
2.00
5.4 The school system engages in a continuous process to determine verifiableimprovement in student learning, including readiness for and success at the nextlevel.
2.00
5.5 System and school leaders monitor and communicate comprehensiveinformation about student learning, school performance, and the achievement ofsystem and school improvement goals to stakeholders.
2.00
Document Generated On March 2, 2016
Kentucky Department of Education Dayton Independent
© 2016 Advance Education, Inc. All rights reserved unless otherwise granted by written agreement. Page 10
Kentucky Department of Education Dayton Independent
© 2016 Advance Education, Inc. All rights reserved unless otherwise granted by written agreement. Page 10
Kentucky Department of Education Dayton Independent
© 2016 Advance Education, Inc. All rights reserved unless otherwise granted by written agreement. Page 10
Kentucky Department of Education Dayton Independent
© 2016 Advance Education, Inc. All rights reserved unless otherwise granted by written agreement. Page 10

Effective Learning Environments Observation Tool (eleot™)Every learner should have access to an effective learning environment in which she/he has multiple
opportunities to be successful. The Effective Learning Environments Observation Tool (eleot™) measures the
extent to which learners are in an environment that is equitable, supportive, and well-managed. An
environment where high expectations are the norm and active learning takes place. It measures whether
learners' progress is monitored and feedback is provided and the extent to which technology is leveraged for
learning.
Observations of classrooms or other learning venues are conducted for a minimum of 20 minutes per
observation. Every member of the Diagnostic Review Team is required to be trained and pass a certification
exam that establishes inter-rater reliability. Team members conduct multiple observations during the review
process and provide ratings on 30 items based on a four-point scale (4=very evident; 3=evident; 2=somewhat
evident; and 1=not observed). The following provides the aggregate average score across multiple
observations for each of the seven learning environments included in eleot™.
The Diagnostic Review Team conducted 17 classroom observations using the eleot™ classroom observation
tool. All core classrooms were observed.
Observation data suggest widely varying levels of effectiveness across the school for all Learning
Environments. Of concern to the Team were the following learning conditions, which the Team detected
infrequently or inconsistently: 1) differentiated instruction that met the needs of all students, 2) an over reliance
eleot™ Results
Review
A. E
quita
ble
Lear
ning
B. H
igh
Expe
ctat
ions
C. S
uppo
rtive
Lea
rnin
g
D. A
ctiv
e Le
arni
ng
E. P
rogr
ess
Mon
itorin
g an
d
Feed
back
F. W
ell-M
anag
ed L
earn
ing
G. D
igita
l Lea
rnin
g
0.0
0.5
1.0
1.5
2.0
2.5
3.0
3.5
4.0
Per
form
ance
Lev
els
2.12 2.16 2.19 2.16 2.052.26
1.75
Document Generated On March 2, 2016
Kentucky Department of Education Dayton Independent
© 2016 Advance Education, Inc. All rights reserved unless otherwise granted by written agreement. Page 11
Kentucky Department of Education Dayton Independent
© 2016 Advance Education, Inc. All rights reserved unless otherwise granted by written agreement. Page 11
Kentucky Department of Education Dayton Independent
© 2016 Advance Education, Inc. All rights reserved unless otherwise granted by written agreement. Page 11
Kentucky Department of Education Dayton Independent
© 2016 Advance Education, Inc. All rights reserved unless otherwise granted by written agreement. Page 11

on formative assessment questions to promote academic rigor and higher order thinking, 3) authentic student
engagement, 4) well-managed environments through consistently enforced, school-wide positive behavioral
supports and 5) the limited use/understanding of exemplars and available technologies as instructional tools.
The Equitable Learning Environment received an overall rating of 2.12 on a 4 point scale. A relative strength
within this learning environment was "equal access to classroom activities, resources, technology and support"
(A2), which received a rating of 2.53 and was evident in 53 percent of classrooms observed. Another relative
strength was "knows that rules and consequences are fair, clear, and consistently applied" (A3), which
received a rating of 2.41 and was evident in 53 percent of classrooms observed. Generally, teachers did not
provide students with access to "differentiated learning opportunities and activities that meet his/her needs"
(A1), which received a rating of 2.00 and was evident only in 35 percent of classrooms observed. Direct
instruction was the primary form of classroom instruction observed by the Diagnostic Review Team, and
students were largely observed listening, taking notes and completing seat work.
The High Expectations Learning Environment received an overall rating of 2.16 on a 4 point scale. During
classroom observations, "activities and learning that are challenging but attainable" (B2) were evident in 47
percent of classrooms observed and received a rating of 2.35. A concern of the Team was the lack of evidence
to suggest students were "provided exemplars of high quality work" (B3). Despite a school-wide emphasis on
the use of exemplars as an instructional practice, instances of exemplars being used were evident in 23
percent of classrooms observed and received the lowest rating of this Learning Environment at 1.59. During
classroom observations, team members noted that classroom teachers lack a shared understanding of how to
use exemplars effectively. When exemplars were used in classrooms, they were not accompanied by
descriptive criteria or sufficient discussion to assist student understanding of "high quality work." Team
members found that "questions that require higher order thinking" (B5) were evident in 35 percent of
classrooms observed. While there were school-wide efforts to integrate higher order thinking questions into bell
ringer activities and 10 X 10 formative assessments, classroom instruction rarely went beyond direct instruction
or asked students to think critically as a routine part of instruction in each classroom.
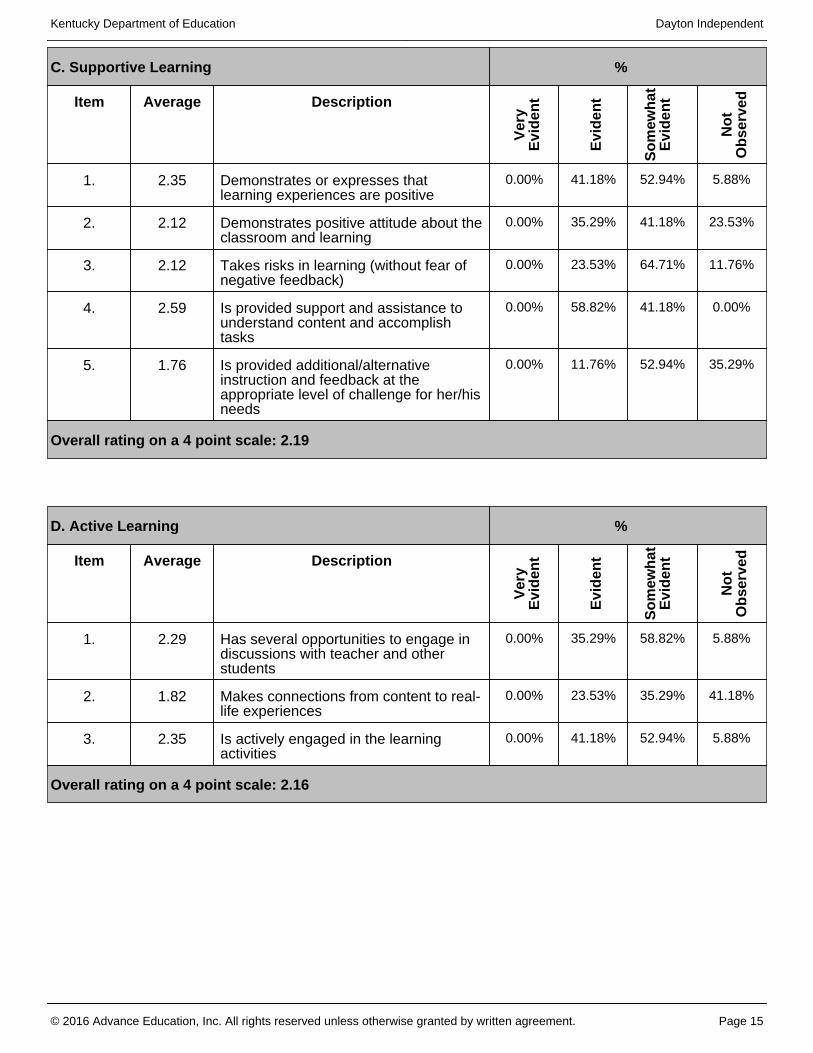
The Supportive Learning Environment received an overall rating of 2.19 on a 4 point scale. A strength in this
Learning Environment was the "support and assistance to understand content and accomplish tasks" (C4),
which received the highest rating at 2.59 and was evident in 59 percent of classrooms observed. While support
and assistance was evident in a majority of classrooms, "additional/alternative instruction and feedback at the
appropriate level of challenge for his/her needs" was only evident in 12 percent of classrooms and received the
lowest rating in this Learning Environment at 1.76. Observers noted the lack of re-teaching and progress
monitoring that occurred for individual students.
The Active Learning Environment received an overall rating of 2.16 on a 4 point scale. It was evident in 41
percent of classrooms observed that students were "actively engaged in the learning activities" (D3) and was
rated at 2.35. It was somewhat evident in 59 percent of classrooms observed that students had "several
opportunities to engage in discussions with teachers and other students" (D1). These results suggest that
student engagement and active learning (e.g., peer coaching, mentoring) would be an area to leverage for
significant improvement in student achievement.
Document Generated On March 2, 2016
Kentucky Department of Education Dayton Independent
© 2016 Advance Education, Inc. All rights reserved unless otherwise granted by written agreement. Page 12
Kentucky Department of Education Dayton Independent
© 2016 Advance Education, Inc. All rights reserved unless otherwise granted by written agreement. Page 12
Kentucky Department of Education Dayton Independent
© 2016 Advance Education, Inc. All rights reserved unless otherwise granted by written agreement. Page 12
Kentucky Department of Education Dayton Independent
© 2016 Advance Education, Inc. All rights reserved unless otherwise granted by written agreement. Page 12
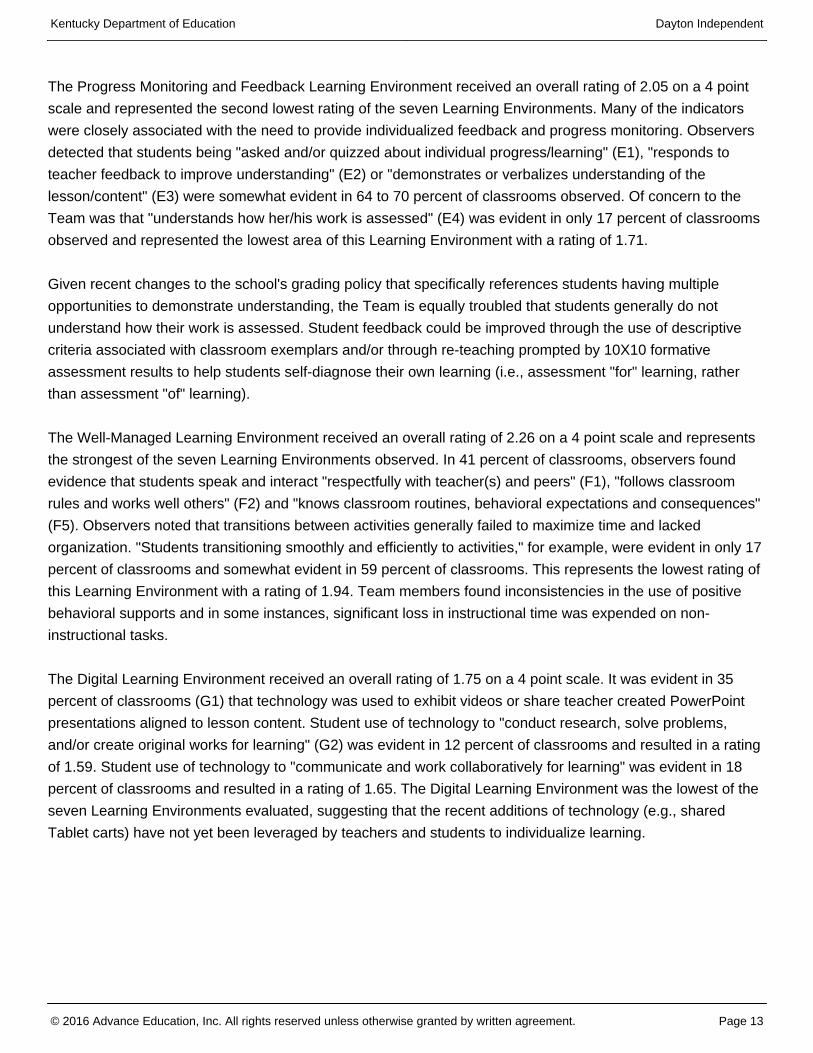
The Progress Monitoring and Feedback Learning Environment received an overall rating of 2.05 on a 4 point
scale and represented the second lowest rating of the seven Learning Environments. Many of the indicators
were closely associated with the need to provide individualized feedback and progress monitoring. Observers
detected that students being "asked and/or quizzed about individual progress/learning" (E1), "responds to
teacher feedback to improve understanding" (E2) or "demonstrates or verbalizes understanding of the
lesson/content" (E3) were somewhat evident in 64 to 70 percent of classrooms observed. Of concern to the
Team was that "understands how her/his work is assessed" (E4) was evident in only 17 percent of classrooms
observed and represented the lowest area of this Learning Environment with a rating of 1.71.
Given recent changes to the school's grading policy that specifically references students having multiple
opportunities to demonstrate understanding, the Team is equally troubled that students generally do not
understand how their work is assessed. Student feedback could be improved through the use of descriptive
criteria associated with classroom exemplars and/or through re-teaching prompted by 10X10 formative
assessment results to help students self-diagnose their own learning (i.e., assessment "for" learning, rather
than assessment "of" learning).
The Well-Managed Learning Environment received an overall rating of 2.26 on a 4 point scale and represents
the strongest of the seven Learning Environments observed. In 41 percent of classrooms, observers found
evidence that students speak and interact "respectfully with teacher(s) and peers" (F1), "follows classroom
rules and works well others" (F2) and "knows classroom routines, behavioral expectations and consequences"
(F5). Observers noted that transitions between activities generally failed to maximize time and lacked
organization. "Students transitioning smoothly and efficiently to activities," for example, were evident in only 17
percent of classrooms and somewhat evident in 59 percent of classrooms. This represents the lowest rating of
this Learning Environment with a rating of 1.94. Team members found inconsistencies in the use of positive
behavioral supports and in some instances, significant loss in instructional time was expended on non-
instructional tasks.
The Digital Learning Environment received an overall rating of 1.75 on a 4 point scale. It was evident in 35
percent of classrooms (G1) that technology was used to exhibit videos or share teacher created PowerPoint
presentations aligned to lesson content. Student use of technology to "conduct research, solve problems,
and/or create original works for learning" (G2) was evident in 12 percent of classrooms and resulted in a rating
of 1.59. Student use of technology to "communicate and work collaboratively for learning" was evident in 18
percent of classrooms and resulted in a rating of 1.65. The Digital Learning Environment was the lowest of the
seven Learning Environments evaluated, suggesting that the recent additions of technology (e.g., shared
Tablet carts) have not yet been leveraged by teachers and students to individualize learning.
Document Generated On March 2, 2016
Kentucky Department of Education Dayton Independent
© 2016 Advance Education, Inc. All rights reserved unless otherwise granted by written agreement. Page 13
Kentucky Department of Education Dayton Independent
© 2016 Advance Education, Inc. All rights reserved unless otherwise granted by written agreement. Page 13
Kentucky Department of Education Dayton Independent
© 2016 Advance Education, Inc. All rights reserved unless otherwise granted by written agreement. Page 13
Kentucky Department of Education Dayton Independent
© 2016 Advance Education, Inc. All rights reserved unless otherwise granted by written agreement. Page 13

eleot™ Data Summary
A. Equitable Learning %
Item Average Description
Ver
yE
vid
ent
Evi
den
t
So
mew
hat
Evi
den
t
No
tO
bse
rved
1. 2.00 Has differentiated learning opportunitiesand activities that meet her/his needs
0.00% 35.29% 29.41% 35.29%
2. 2.53 Has equal access to classroomdiscussions, activities, resources,technology, and support
0.00% 52.94% 47.06% 0.00%
3. 2.41 Knows that rules and consequences arefair, clear, and consistently applied
0.00% 52.94% 35.29% 11.76%
4. 1.53 Has ongoing opportunities to learnabout their own and other'sbackgrounds/cultures/differences
0.00% 5.88% 41.18% 52.94%
Overall rating on a 4 point scale: 2.12
B. High Expectations %
Item Average Description
Ver
yE
vid
ent
Evi
den
t
So
mew
hat
Evi
den
t
No
tO
bse
rved
1. 2.29 Knows and strives to meet the highexpectations established by the teacher
0.00% 35.29% 58.82% 5.88%
2. 2.35 Is tasked with activities and learning thatare challenging but attainable
0.00% 47.06% 41.18% 11.76%
3. 1.59 Is provided exemplars of high qualitywork
0.00% 23.53% 11.76% 64.71%
4. 2.29 Is engaged in rigorous coursework,discussions, and/or tasks
0.00% 35.29% 58.82% 5.88%
5. 2.29 Is asked and responds to questions thatrequire higher order thinking (e.g.,applying, evaluating, synthesizing)
0.00% 35.29% 58.82% 5.88%
Overall rating on a 4 point scale: 2.16
Document Generated On March 2, 2016
Kentucky Department of Education Dayton Independent
© 2016 Advance Education, Inc. All rights reserved unless otherwise granted by written agreement. Page 14
Kentucky Department of Education Dayton Independent
© 2016 Advance Education, Inc. All rights reserved unless otherwise granted by written agreement. Page 14
Kentucky Department of Education Dayton Independent
© 2016 Advance Education, Inc. All rights reserved unless otherwise granted by written agreement. Page 14
Kentucky Department of Education Dayton Independent
© 2016 Advance Education, Inc. All rights reserved unless otherwise granted by written agreement. Page 14
C. Supportive Learning %
Item Average Description
Ver
yE
vid
ent
Evi
den
t
So
mew
hat
Evi
den
t
No
tO
bse
rved
1. 2.35 Demonstrates or expresses thatlearning experiences are positive
0.00% 41.18% 52.94% 5.88%
2. 2.12 Demonstrates positive attitude about theclassroom and learning
0.00% 35.29% 41.18% 23.53%
3. 2.12 Takes risks in learning (without fear ofnegative feedback)
0.00% 23.53% 64.71% 11.76%
4. 2.59 Is provided support and assistance tounderstand content and accomplishtasks
0.00% 58.82% 41.18% 0.00%
5. 1.76 Is provided additional/alternativeinstruction and feedback at theappropriate level of challenge for her/hisneeds
0.00% 11.76% 52.94% 35.29%
Overall rating on a 4 point scale: 2.19
D. Active Learning %
Item Average Description
Ver
yE
vid
ent
Evi
den
t
So
mew
hat
Evi
den
t
No
tO
bse
rved
1. 2.29 Has several opportunities to engage indiscussions with teacher and otherstudents
0.00% 35.29% 58.82% 5.88%
2. 1.82 Makes connections from content to real-life experiences
0.00% 23.53% 35.29% 41.18%
3. 2.35 Is actively engaged in the learningactivities
0.00% 41.18% 52.94% 5.88%
Overall rating on a 4 point scale: 2.16
Document Generated On March 2, 2016
Kentucky Department of Education Dayton Independent
© 2016 Advance Education, Inc. All rights reserved unless otherwise granted by written agreement. Page 15
Kentucky Department of Education Dayton Independent
© 2016 Advance Education, Inc. All rights reserved unless otherwise granted by written agreement. Page 15
Kentucky Department of Education Dayton Independent
© 2016 Advance Education, Inc. All rights reserved unless otherwise granted by written agreement. Page 15
Kentucky Department of Education Dayton Independent
© 2016 Advance Education, Inc. All rights reserved unless otherwise granted by written agreement. Page 15

E. Progress Monitoring and Feedback %
Item Average Description
Ver
yE
vid
ent
Evi
den
t
So
mew
hat
Evi
den
t
No
tO
bse
rved
1. 1.94 Is asked and/or quizzed about individualprogress/learning
0.00% 11.76% 70.59% 17.65%
2. 2.12 Responds to teacher feedback toimprove understanding
0.00% 23.53% 64.71% 11.76%
3. 2.35 Demonstrates or verbalizesunderstanding of the lesson/content
0.00% 35.29% 64.71% 0.00%
4. 1.71 Understands how her/his work isassessed
0.00% 17.65% 35.29% 47.06%
5. 2.12 Has opportunities to revise/improvework based on feedback
0.00% 41.18% 29.41% 29.41%
Overall rating on a 4 point scale: 2.05
F. Well-Managed Learning %
Item Average DescriptionV
ery
Evi
den
t
Evi
den
t
So
mew
hat
Evi
den
t
No
tO
bse
rved
1. 2.41 Speaks and interacts respectfully withteacher(s) and peers
0.00% 41.18% 58.82% 0.00%
2. 2.35 Follows classroom rules and works wellwith others
0.00% 41.18% 52.94% 5.88%
3. 1.94 Transitions smoothly and efficiently toactivities
0.00% 17.65% 58.82% 23.53%
4. 2.24 Collaborates with other students duringstudent-centered activities
5.88% 29.41% 47.06% 17.65%
5. 2.35 Knows classroom routines, behavioralexpectations and consequences
0.00% 41.18% 52.94% 5.88%
Overall rating on a 4 point scale: 2.26
Document Generated On March 2, 2016
Kentucky Department of Education Dayton Independent
© 2016 Advance Education, Inc. All rights reserved unless otherwise granted by written agreement. Page 16
Kentucky Department of Education Dayton Independent
© 2016 Advance Education, Inc. All rights reserved unless otherwise granted by written agreement. Page 16
Kentucky Department of Education Dayton Independent
© 2016 Advance Education, Inc. All rights reserved unless otherwise granted by written agreement. Page 16
Kentucky Department of Education Dayton Independent
© 2016 Advance Education, Inc. All rights reserved unless otherwise granted by written agreement. Page 16

FindingsImprovement PriorityCollaboratively develop, implement and formally monitor a districtwide instructional process that clearly informs
students of learning expectations and standards of performance; provides students with exemplars of high
quality work; uses data from multiple measures, including formative assessments, to inform and modify
instruction and provides students with specific and timely feedback about their learning.
(Indicator 3.6)
Primary Indicator
Indicator 3.6
Evidence and Rationale
Student Performance Data:
Student performance data, as detailed in the attachments of this report, indicate gains have been made in
English II over the three-year testing cycle as well as gains in Algebra II, Biology, U.S. History and writing.
However, Dayton High School performed below the state average in every assessed area (English II, Algebra
II, Biology, U.S. History, writing, language mechanics) in 2014-2015 as well as in 2013-2014. Additionally, a
negative trend prevails over a three year testing cycle in language mechanics. Data show inconsistent growth
in student performance over a three-year testing cycle in Algebra II and writing. The school’s overall lowest
performance area was Algebra II for 2014-2015. This suggests the district has not established practices or
conditions that ensure a consistently implemented, well-defined instructional process that uses formative
assessment data to guide modifications to instruction.
Classroom Observation Data:
G. Digital Learning %
Item Average Description
Ver
yE
vid
ent
Evi
den
t
So
mew
hat
Evi
den
t
No
tO
bse
rved
1. 2.00 Uses digital tools/technology to gather,evaluate, and/or use information forlearning
5.88% 29.41% 23.53% 41.18%
2. 1.59 Uses digital tools/technology to conductresearch, solve problems, and/or createoriginal works for learning
0.00% 11.76% 35.29% 52.94%
3. 1.65 Uses digital tools/technology tocommunicate and work collaborativelyfor learning
0.00% 17.65% 29.41% 52.94%
Overall rating on a 4 point scale: 1.75
Document Generated On March 2, 2016
Kentucky Department of Education Dayton Independent
© 2016 Advance Education, Inc. All rights reserved unless otherwise granted by written agreement. Page 17
Kentucky Department of Education Dayton Independent
© 2016 Advance Education, Inc. All rights reserved unless otherwise granted by written agreement. Page 17
Kentucky Department of Education Dayton Independent
© 2016 Advance Education, Inc. All rights reserved unless otherwise granted by written agreement. Page 17
Kentucky Department of Education Dayton Independent
© 2016 Advance Education, Inc. All rights reserved unless otherwise granted by written agreement. Page 17

Classroom observation data, as detailed in the Teaching and Learning Impact section of this report, revealed
students are rarely “provided exemplars of high quality work” with this item rated evident/very evident in 24
percent of classrooms. Moreover, classroom observation data were mixed relative to students being “tasked
with activities and learning that are challenging” and “engaged in rigorous coursework, discussions, and/or
tasks” with only 47 percent and 35 percent of classrooms rated as evident/very evident, respectively.
Classroom observation data also suggest a minimal level of progress monitoring occurred in classrooms as
evidenced by this learning environment being rated at 1.94 on a 4 point scale. Specifically, the Team rated
“responding to teacher feedback to improve learning” evident/very evident in 24 percent of classrooms and
“demonstrating or verbalizing their understanding of the lesson” evident/very evident in 35 percent of
classrooms. These results suggest the district does not currently implement or monitor a well-articulated
instructional process that clearly informs students of their learning expectations and standards of performance,
provide students with exemplars of high-quality work or give students specific and timely feedback about their
learning.
Stakeholder Survey Data:
Sixty-three percent of student respondents agreed/strongly agreed with the statement “All of my teachers
explain their expectations for learning and behavior so I can be successful.” In addition, only 67 percent of
student respondents agreed/strongly agreed with the statement “All of my teachers provide me with information
about my learning and grades.” Although parent survey results revealed 92 percent of respondents
agreed/strongly agreed with the statement “My child knows the expectations for learning in all classes”, staff
survey results indicated 52 percent of respondents agreed/strongly agreed with a similar statement, “All
teachers in our school provide students with specific and timely feedback about their learning.”
Stakeholder Interviews:
Interviews with stakeholders did not reveal the existence of a well-articulated instructional process that
systemically guides teaching and learning across the district.
Improvement PriorityDevelop and implement a process for school and district leadership to monitor the effectiveness of programs
and district-wide initiatives to ensure implementation fidelity, documentation of progress and analysis of results.
(Indicator 5.2)
Primary Indicator
Indicator 5.2
Evidence and Rationale
Student Performance Data:
Student performance data, as detailed in the attachments of this report, indicate some positive gains have
Document Generated On March 2, 2016
Kentucky Department of Education Dayton Independent
© 2016 Advance Education, Inc. All rights reserved unless otherwise granted by written agreement. Page 18
Kentucky Department of Education Dayton Independent
© 2016 Advance Education, Inc. All rights reserved unless otherwise granted by written agreement. Page 18
Kentucky Department of Education Dayton Independent
© 2016 Advance Education, Inc. All rights reserved unless otherwise granted by written agreement. Page 18
Kentucky Department of Education Dayton Independent
© 2016 Advance Education, Inc. All rights reserved unless otherwise granted by written agreement. Page 18

been made in English II over the three-year testing cycle as well as gains in Algebra II, Biology, U.S. History
and writing. However, Dayton High School performed below the state average in every assessed area (English
II, Algebra II, Biology, U.S. History, writing, and language mechanics) in 2014-2015 as well as in 2013-2014.
Additionally, a negative trend prevails over a three-year testing cycle in language mechanics. Data revealed
inconsistent student growth in performance over a three-year testing cycle in Algebra II and writing. The
school’s overall lowest performance area was Algebra II for 2014-2015. Data suggest the district has not been
effective in monitoring program effectiveness and district-wide initiatives to ensure verifiable growth in student
achievement over time.
Stakeholder Interviews:
The superintendent’s presentation revealed that many initiatives and programs have been implemented;
however, district administrators were unable to identify a process by which these programs and initiatives were
monitored and evaluated for effectiveness.
Documents and artifacts:
A review of evidence and artifacts did not reveal a formally documented process and did not indicate that all
system personnel use data to monitor and evaluate program effectiveness. The district and its respective
schools have launched a myriad of programs designed to meet the unique learning needs and interests of the
students they serve. However, the district has not formally established a mechanism by which these programs
can be monitored and evaluated to determine the impact on student success or the fidelity of implementation
across the district.
Improvement PriorityDevelop, implement, document and continuously monitor a process that engages all stakeholders in the
systematic review and adjustment of curriculum, instruction and assessment based on multiple sources of
student performance data, as well as an examination of professional practice.
(Indicator 3.2)
Primary Indicator
Indicator 3.2
Evidence and Rationale
Student Performance Data:
Student performance data, as detailed in the attachments of this report, indicated the district’s achievement
gap delivery targets were not met in math, social studies and writing. Furthermore, the percentage of students
scoring proficient/distinguished on End-of-Course assessments in Algebra II, U.S. History, writing and
language mechanics were well below state averages. The percentage of students meeting the benchmarks on
the ACT in English and math shows a downward trend over the past three years.
Document Generated On March 2, 2016
Kentucky Department of Education Dayton Independent
© 2016 Advance Education, Inc. All rights reserved unless otherwise granted by written agreement. Page 19
Kentucky Department of Education Dayton Independent
© 2016 Advance Education, Inc. All rights reserved unless otherwise granted by written agreement. Page 19
Kentucky Department of Education Dayton Independent
© 2016 Advance Education, Inc. All rights reserved unless otherwise granted by written agreement. Page 19
Kentucky Department of Education Dayton Independent
© 2016 Advance Education, Inc. All rights reserved unless otherwise granted by written agreement. Page 19

Stakeholder Survey Data:
Forty-eight percent of students agreed/strongly agreed with the statement, “All of my teachers change their
teaching to meet my learning needs,” suggesting that teachers do not systematically adjust instruction based
on student performance data. Sixty-eight percent of staff agreed/strongly agreed with the statement, “All
teachers in our school monitor and adjust curriculum, instruction, and assessment based on data from student
assessments and examination of professional practice,” suggesting many teachers do not differentiate
instruction to meet the specific needs of students.
Stakeholder Interviews:
In interviews, district administrators were not able to define how the district systematically supports the school
in adjusting curriculum, instruction and assessment based on multiple student performance data. Although
there is ample evidence of informal conversations occurring between district and school administrators, there is
no evidence of a clearly defined process by which these conversations lead to improved student achievement
or professional practice.
Documents and artifacts:
A review of evidence and artifacts did not reveal the existence of a curriculum document aligned to standards
or a formally, documented process by which curriculum is monitored and adjusted based on student
performance data.
Improvement PriorityEstablish, implement and document a formal and consistent districtwide process that monitors the
implemented curriculum and instructional practices and provides teachers and school leadership with specific
and timely written feedback on the improvement of instructional practices aligned to district values and beliefs
and ensures students are actively engaged in meaningful learning.
(Indicator 3.4)
Primary Indicator
Indicator 3.4
Evidence and Rationale
Student Performance Data:
Student performance data, as detailed in the attachments of this report, indicated a downward trend in the
percentage of students meeting the ACT PLAN and ACT Benchmark scores. While students scoring
proficient/distinguished on the End-of-Course exams demonstrated an increase in three content areas, data
indicated a decline in student performance in U.S. History, writing and language mechanics over the past three
years. Although there has been an increase in the overall state accountability scores for Dayton Independent
Schools, the district’s graduation rate goal was not met in 2014-2015. Data suggest the district has not
Document Generated On March 2, 2016
Kentucky Department of Education Dayton Independent
© 2016 Advance Education, Inc. All rights reserved unless otherwise granted by written agreement. Page 20
Kentucky Department of Education Dayton Independent
© 2016 Advance Education, Inc. All rights reserved unless otherwise granted by written agreement. Page 20
Kentucky Department of Education Dayton Independent
© 2016 Advance Education, Inc. All rights reserved unless otherwise granted by written agreement. Page 20
Kentucky Department of Education Dayton Independent
© 2016 Advance Education, Inc. All rights reserved unless otherwise granted by written agreement. Page 20
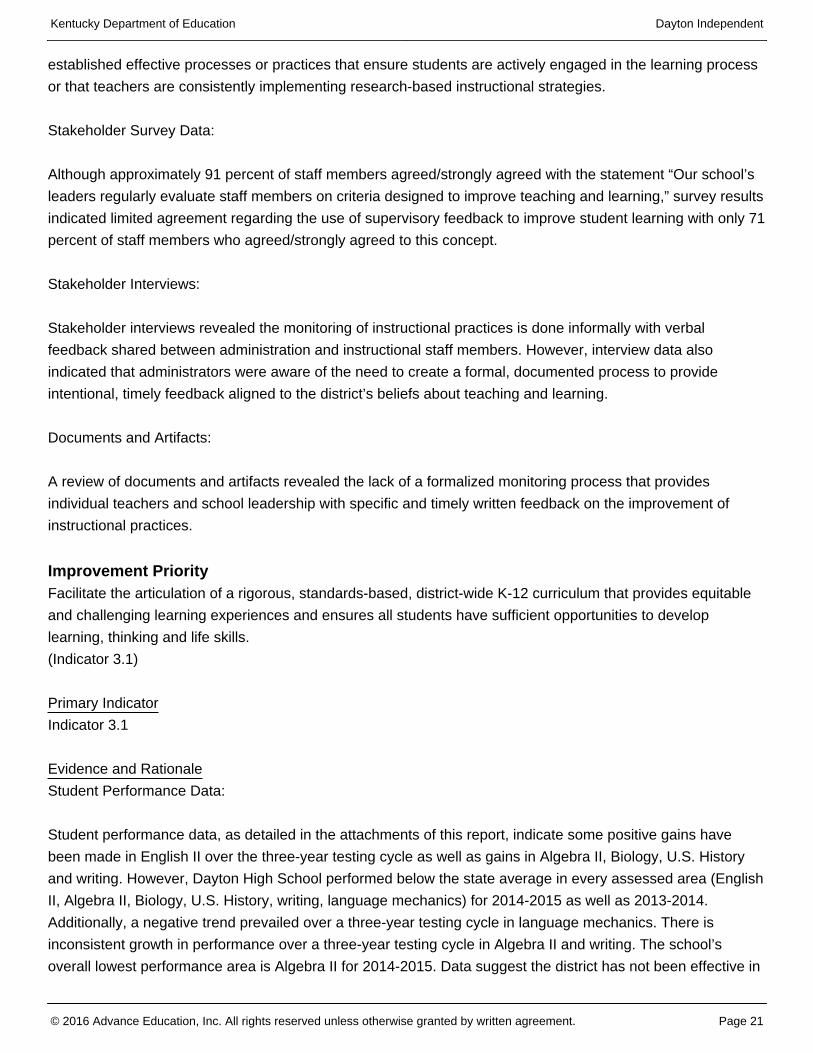
established effective processes or practices that ensure students are actively engaged in the learning process
or that teachers are consistently implementing research-based instructional strategies.
Stakeholder Survey Data:
Although approximately 91 percent of staff members agreed/strongly agreed with the statement “Our school’s
leaders regularly evaluate staff members on criteria designed to improve teaching and learning,” survey results
indicated limited agreement regarding the use of supervisory feedback to improve student learning with only 71
percent of staff members who agreed/strongly agreed to this concept.
Stakeholder Interviews:
Stakeholder interviews revealed the monitoring of instructional practices is done informally with verbal
feedback shared between administration and instructional staff members. However, interview data also
indicated that administrators were aware of the need to create a formal, documented process to provide
intentional, timely feedback aligned to the district’s beliefs about teaching and learning.
Documents and Artifacts:
A review of documents and artifacts revealed the lack of a formalized monitoring process that provides
individual teachers and school leadership with specific and timely written feedback on the improvement of
instructional practices.
Improvement PriorityFacilitate the articulation of a rigorous, standards-based, district-wide K-12 curriculum that provides equitable
and challenging learning experiences and ensures all students have sufficient opportunities to develop
learning, thinking and life skills.
(Indicator 3.1)
Primary Indicator
Indicator 3.1
Evidence and Rationale
Student Performance Data:
Student performance data, as detailed in the attachments of this report, indicate some positive gains have
been made in English II over the three-year testing cycle as well as gains in Algebra II, Biology, U.S. History
and writing. However, Dayton High School performed below the state average in every assessed area (English
II, Algebra II, Biology, U.S. History, writing, language mechanics) for 2014-2015 as well as 2013-2014.
Additionally, a negative trend prevailed over a three-year testing cycle in language mechanics. There is
inconsistent growth in performance over a three-year testing cycle in Algebra II and writing. The school’s
overall lowest performance area is Algebra II for 2014-2015. Data suggest the district has not been effective in
Document Generated On March 2, 2016
Kentucky Department of Education Dayton Independent
© 2016 Advance Education, Inc. All rights reserved unless otherwise granted by written agreement. Page 21
Kentucky Department of Education Dayton Independent
© 2016 Advance Education, Inc. All rights reserved unless otherwise granted by written agreement. Page 21
Kentucky Department of Education Dayton Independent
© 2016 Advance Education, Inc. All rights reserved unless otherwise granted by written agreement. Page 21
Kentucky Department of Education Dayton Independent
© 2016 Advance Education, Inc. All rights reserved unless otherwise granted by written agreement. Page 21

facilitating conversations about the state-adopted core standards to ensure a standards-based K-12 curriculum
that promotes challenging and equitable coursework.
Classroom Observation Data:
Classroom observations, as detailed in the Teaching and Learning Impact section of this report, revealed that
high expectations for all students and rigor are areas in need of improvement. It was evident/very evident in 35
percent of classroom that students “know and strive to meet high expectations established by the teacher.”
Instances in which students were provided “additional/alternative instruction and feedback at appropriate level
of challenge” were evident/very evident in 12 percent of classrooms. In addition, only 35 percent of
observations indicated it was evident/very evident that classrooms had differentiated learning opportunities and
activities that met individual student needs.
Stakeholder Survey Data:
Parent survey data indicated that 75 percent of respondents agreed/strongly agreed with the statement, “All of
my child’s teachers give work that challenges my child.” Additionally, parent survey results indicated 85 percent
of respondents agreed/strongly agreed with the statement, “My child is prepared for success in the next school
year.”
Data collected from student surveys, however, revealed information inconsistent to these findings. Sixty-eight
percent of student respondents agreed/strongly agreed with the statement, “My school provides me with
challenging curriculum and learning experiences,” suggesting the majority of students cannot confirm this
highly effective condition exists across the school. Student survey data indicated that 45 percent of
respondents agreed/strongly agreed with the statement, “My school prepares me to deal with issues I may face
in the future.” Further, student survey data indicated that 48 percent of respondents agreed/strongly agreed
with the statement, “All of my teachers change their teaching to meet my learning needs.”
Stakeholder Interviews:
While stakeholder interview data indicated that informal and cordial conversations among all administrators
occurred frequently, there was little evidence to indicate that curriculum planning, guidance and feedback has
been district-initiated.
Documents and artifacts:
A review of unit plans, pacing guides, daily lesson plans, Professional Learning Community agendas and
District Leadership Team meeting agendas did not reveal the existence of a defined, challenging and equitable
K-12 curriculum. Furthermore, little evidence existed that suggested the district provided feedback or guidance
about the quality of curriculum being implemented across the system.
Document Generated On March 2, 2016
Kentucky Department of Education Dayton Independent
© 2016 Advance Education, Inc. All rights reserved unless otherwise granted by written agreement. Page 22
Kentucky Department of Education Dayton Independent
© 2016 Advance Education, Inc. All rights reserved unless otherwise granted by written agreement. Page 22
Kentucky Department of Education Dayton Independent
© 2016 Advance Education, Inc. All rights reserved unless otherwise granted by written agreement. Page 22
Kentucky Department of Education Dayton Independent
© 2016 Advance Education, Inc. All rights reserved unless otherwise granted by written agreement. Page 22

Leadership CapacityThe capacity of leadership to ensure an institution's progress towards its stated objectives is an essential
element of organizational effectiveness. An institution's leadership capacity includes the fidelity and
commitment to its institutional purpose and direction, the effectiveness of governance and leadership to enable
the institution to realize its stated objectives, the ability to engage and involve stakeholders in meaningful and
productive ways, and the capacity to enact strategies to improve results of student learning.
Purpose and direction are critical to successful institutions. A study conducted in 2010 by the London-based
Chartered Institute of Personnel and Development (CIPD) reported that "in addition to improving performance,
the research indicates that having a sense of shared purpose also improves employee engagement" and that
"lack of understanding around purpose can lead to demotivation and emotional detachment, which in turn lead
to a disengaged and dissatisfied workforce."
AdvancED has found through its evaluation of best practices in more than 32,000 institutions around the world
that a successful institution commits to a shared purpose and direction and establishes expectations for
student learning that are aligned with the institutions' vision and supported by internal and external
stakeholders. These expectations serve as the focus for assessing student performance and overall institution
effectiveness.
Governance and leadership are key factors in raising institutional quality. Leaders, both local administrators
and governing boards/authorities, are responsible for ensuring all learners achieve while also managing many
other facets of an institution. Institutions that function effectively do so without tension between the governing
board/authority, administrators, and educators and have established relationships of mutual respect and a
shared vision (Feuerstein & Opfer, 1998). In a meta-analysis of educational institution leadership research,
Leithwood and Sun (2012) found that leaders (school and governing boards/authority) can significantly
"influence school conditions through their achievement of a shared vision and agreed-on goals for the
organization, their high expectations and support of organizational members, and their practices that
strengthen school culture and foster collaboration within the organization." With the increasing demands of
accountability placed on institutional leaders, leaders who empower others need considerable autonomy and
involve their communities to attain continuous improvement goals. Leaders who engage in such practices
experience a greater level of success (Fink & Brayman, 2006). Similarly, governing boards/authorities that
focus on policy-making are more likely to allow institutional leaders the autonomy to make decisions that
impact teachers and students and are less responsive to politicization than boards/authorities that respond to
vocal citizens (Greene, 1992).
AdvancED's experience, gained through evaluation of best practices, has indicated that a successful institution
has leaders who are advocates for the institution's vision and improvement efforts. The leaders provide
direction and allocate resources to implement curricular and co-curricular programs that enable students to
achieve expectations for their learning. Leaders encourage collaboration and shared responsibility for school
improvement among stakeholders. The institution's policies, procedures, and organizational conditions ensure
equity of learning opportunities and support for innovation.
Document Generated On March 2, 2016
Kentucky Department of Education Dayton Independent
© 2016 Advance Education, Inc. All rights reserved unless otherwise granted by written agreement. Page 23
Kentucky Department of Education Dayton Independent
© 2016 Advance Education, Inc. All rights reserved unless otherwise granted by written agreement. Page 23
Kentucky Department of Education Dayton Independent
© 2016 Advance Education, Inc. All rights reserved unless otherwise granted by written agreement. Page 23
Kentucky Department of Education Dayton Independent
© 2016 Advance Education, Inc. All rights reserved unless otherwise granted by written agreement. Page 23

Standard 1 - Purpose and DirectionThe system maintains and communicates at all levels of the organization a purpose and direction for
continuous improvement that commit to high expectations for learning as well as shared values and beliefs
about teaching and learning.
Standard 2 - Governance and LeadershipThe system operates under governance and leadership that promote and support student performance and
system effectiveness.
Indicator Description Review TeamScore
1.1 The system engages in a systematic, inclusive, and comprehensive process toreview, revise, and communicate a system-wide purpose for student success.
2.67
1.2 The system ensures that each school engages in a systematic, inclusive, andcomprehensive process to review, revise, and communicate a school purpose forstudent success.
2.33
1.3 The school leadership and staff at all levels of the system commit to a culturethat is based on shared values and beliefs about teaching and learning andsupports challenging, equitable educational programs and learning experiencesfor all students that include achievement of learning, thinking, and life skills.
2.00
1.4 Leadership at all levels of the system implement a continuous improvementprocess that provides clear direction for improving conditions that supportstudent learning.
2.00
Indicator Description Review TeamScore
2.1 The governing body establishes policies and supports practices that ensureeffective administration of the system and its schools.
2.83
2.2 The governing body operates responsibly and functions effectively. 3.00
2.3 The governing body ensures that the leadership at all levels has the autonomy tomeet goals for achievement and instruction and to manage day-to-dayoperations effectively.
3.00
2.4 Leadership and staff at all levels of the system foster a culture consistent with thesystem's purpose and direction.
2.67
2.5 Leadership engages stakeholders effectively in support of the system's purposeand direction.
2.17
2.6 Leadership and staff supervision and evaluation processes result in improvedprofessional practice in all areas of the system and improved student success.
2.17
Document Generated On March 2, 2016
Kentucky Department of Education Dayton Independent
© 2016 Advance Education, Inc. All rights reserved unless otherwise granted by written agreement. Page 24
Kentucky Department of Education Dayton Independent
© 2016 Advance Education, Inc. All rights reserved unless otherwise granted by written agreement. Page 24
Kentucky Department of Education Dayton Independent
© 2016 Advance Education, Inc. All rights reserved unless otherwise granted by written agreement. Page 24
Kentucky Department of Education Dayton Independent
© 2016 Advance Education, Inc. All rights reserved unless otherwise granted by written agreement. Page 24
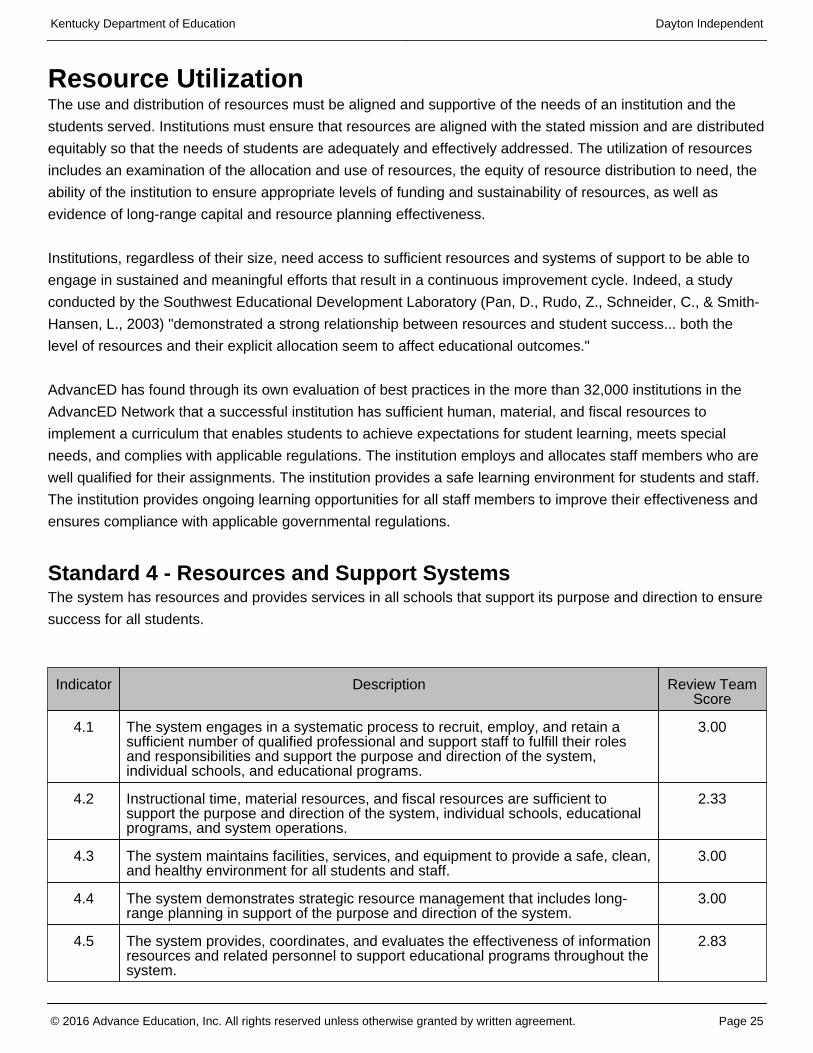
Resource UtilizationThe use and distribution of resources must be aligned and supportive of the needs of an institution and the
students served. Institutions must ensure that resources are aligned with the stated mission and are distributed
equitably so that the needs of students are adequately and effectively addressed. The utilization of resources
includes an examination of the allocation and use of resources, the equity of resource distribution to need, the
ability of the institution to ensure appropriate levels of funding and sustainability of resources, as well as
evidence of long-range capital and resource planning effectiveness.
Institutions, regardless of their size, need access to sufficient resources and systems of support to be able to
engage in sustained and meaningful efforts that result in a continuous improvement cycle. Indeed, a study
conducted by the Southwest Educational Development Laboratory (Pan, D., Rudo, Z., Schneider, C., & Smith-
Hansen, L., 2003) "demonstrated a strong relationship between resources and student success... both the
level of resources and their explicit allocation seem to affect educational outcomes."
AdvancED has found through its own evaluation of best practices in the more than 32,000 institutions in the
AdvancED Network that a successful institution has sufficient human, material, and fiscal resources to
implement a curriculum that enables students to achieve expectations for student learning, meets special
needs, and complies with applicable regulations. The institution employs and allocates staff members who are
well qualified for their assignments. The institution provides a safe learning environment for students and staff.
The institution provides ongoing learning opportunities for all staff members to improve their effectiveness and
ensures compliance with applicable governmental regulations.
Standard 4 - Resources and Support SystemsThe system has resources and provides services in all schools that support its purpose and direction to ensure
success for all students.
Indicator Description Review TeamScore
4.1 The system engages in a systematic process to recruit, employ, and retain asufficient number of qualified professional and support staff to fulfill their rolesand responsibilities and support the purpose and direction of the system,individual schools, and educational programs.
3.00
4.2 Instructional time, material resources, and fiscal resources are sufficient tosupport the purpose and direction of the system, individual schools, educationalprograms, and system operations.
2.33
4.3 The system maintains facilities, services, and equipment to provide a safe, clean,and healthy environment for all students and staff.
3.00
4.4 The system demonstrates strategic resource management that includes long-range planning in support of the purpose and direction of the system.
3.00
4.5 The system provides, coordinates, and evaluates the effectiveness of informationresources and related personnel to support educational programs throughout thesystem.
2.83
Document Generated On March 2, 2016
Kentucky Department of Education Dayton Independent
© 2016 Advance Education, Inc. All rights reserved unless otherwise granted by written agreement. Page 25
Kentucky Department of Education Dayton Independent
© 2016 Advance Education, Inc. All rights reserved unless otherwise granted by written agreement. Page 25
Kentucky Department of Education Dayton Independent
© 2016 Advance Education, Inc. All rights reserved unless otherwise granted by written agreement. Page 25
Kentucky Department of Education Dayton Independent
© 2016 Advance Education, Inc. All rights reserved unless otherwise granted by written agreement. Page 25
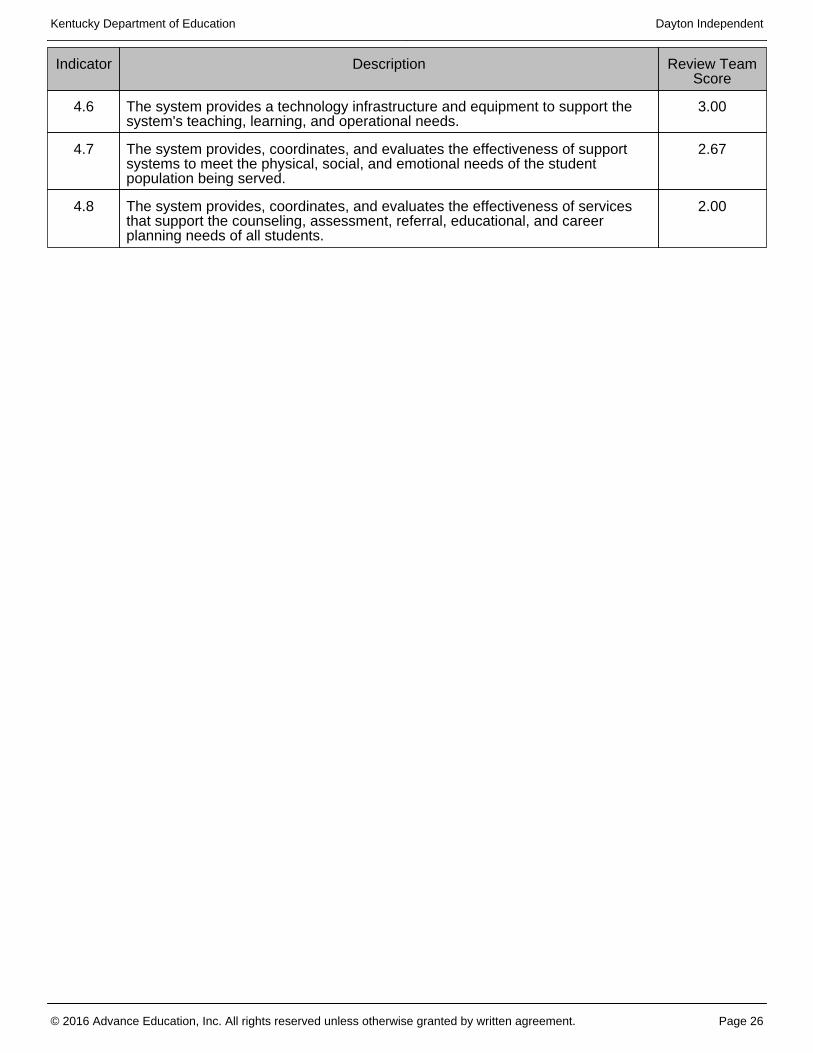
Indicator Description Review TeamScore
4.6 The system provides a technology infrastructure and equipment to support thesystem's teaching, learning, and operational needs.
3.00
4.7 The system provides, coordinates, and evaluates the effectiveness of supportsystems to meet the physical, social, and emotional needs of the studentpopulation being served.
2.67
4.8 The system provides, coordinates, and evaluates the effectiveness of servicesthat support the counseling, assessment, referral, educational, and careerplanning needs of all students.
2.00
Document Generated On March 2, 2016
Kentucky Department of Education Dayton Independent
© 2016 Advance Education, Inc. All rights reserved unless otherwise granted by written agreement. Page 26
Kentucky Department of Education Dayton Independent
© 2016 Advance Education, Inc. All rights reserved unless otherwise granted by written agreement. Page 26
Kentucky Department of Education Dayton Independent
© 2016 Advance Education, Inc. All rights reserved unless otherwise granted by written agreement. Page 26
Kentucky Department of Education Dayton Independent
© 2016 Advance Education, Inc. All rights reserved unless otherwise granted by written agreement. Page 26

ConclusionThe district's last Diagnostic Review report identified eight Improvement Priorities with each of the respective
indicators rated at a level 1. These Improvement Priorities emphasized the development of a systematic
process to review, revise and communicate a system-wide purpose for student success; the implementation of
engaging instructional strategies within a well-articulated instructional process; the revision of school grading
practices and policies and the creation of effective recruitment and retention processes as well as the
coordination of learning support services and strategic resource management practices to support the purpose
and direction of Dayton Independent Schools. As outlined in the Leadership Addendum of this report, the 2016
Diagnostic Review Team believes that four of these Improvement Priorities have been addressed satisfactorily
with evidence supporting the partial implementation of three. Finally, one Improvement Priority is addressed
again as part of this report.
Interview data revealed that the district engaged stakeholders in a collaborative process to establish a system-
wide vision and mission that emphasizes student achievement, continuous improvement, positive school and
community partnerships and fiscal responsibility. The leadership team of Dayton Independent Schools
appeared to genuinely care for the students and expressed concern about the high school's performance.
Isolated examples of effectiveness in teaching and classroom management were observed by the school's
Diagnostic Review Team, and evidence suggests that teachers sometimes work individually and
collaboratively to review data, make informed instructional decisions and plan improvement efforts.
Data from leadership and staff interviews suggested that they are aware of many areas of needed
improvement related to student achievement, professional practice and organizational effectiveness. The
superintendent spoke candidly of holding staff, parents and students to high expectations in order to develop a
positive culture that fosters a safe, orderly and challenging learning environment for all students. District
administrators frankly expressed their desire to competitively recruit effective teachers to maximize learning
opportunities for all students through purposeful staff assignment. Moreover, the school's administrative team
articulated the need to implement a more accountable evaluation process in which routine classroom
walkthroughs result in meaningful feedback to assist teachers in improving their professional practice, thereby
increasing student achievement.
The district has implemented a few strategies to promote positive student behavioral expectations; however,
staff members acknowledged the need to implement a more organized, consistent behavior management
system with clear goals and expectations that can be tracked and communicated to stakeholders. Although
the Team observed isolated examples of effectiveness in teaching and classroom management, the quality of
instruction varied among classrooms, and few instances of instructional differentiation to meet the various
needs of students were noted. Stakeholder interviews, survey data and a review of documents and artifacts
substantiated the need for the school community to focus on developing a culture of collective responsibility
among leadership and staff. A commitment to shared values and beliefs about teaching and learning that
ensure students receive equitable, challenging and engaging learning experiences should be a priority.
Addressing curriculum, instruction and assessment practices remain critical areas of needed improvement for
Document Generated On March 2, 2016
Kentucky Department of Education Dayton Independent
© 2016 Advance Education, Inc. All rights reserved unless otherwise granted by written agreement. Page 27
Kentucky Department of Education Dayton Independent
© 2016 Advance Education, Inc. All rights reserved unless otherwise granted by written agreement. Page 27
Kentucky Department of Education Dayton Independent
© 2016 Advance Education, Inc. All rights reserved unless otherwise granted by written agreement. Page 27
Kentucky Department of Education Dayton Independent
© 2016 Advance Education, Inc. All rights reserved unless otherwise granted by written agreement. Page 27
Kentucky Department of Education Dayton Independent
© 2016 Advance Education, Inc. All rights reserved unless otherwise granted by written agreement. Page 27

-
-
the district. Classroom observation data revealed a lack of research-based, rigorous instruction being
consistently implemented. Assessment practices indicated teachers sometimes use data in purposeful ways to
inform instruction, but interview data revealed that teachers rarely used formative assessment results to guide
instructional planning. The district should find ways to actively engage teachers in collaboration related to
aligning curriculum alignment, developing assessments, using data to assess student progress and
differentiating instruction to meet the individual needs of students.
The system has established effective district grading policies. The governing body of the district and school
has adopted grading policies that reflect both summative and formative assessment practices. Furthermore,
teachers are more effectively aligning grading practices with mastery of content standards and developing a
common understanding of grading practices at all levels to ensure grades reflect attainment of content
knowledge and skills.
Classroom observations, stakeholder interviews, stakeholder surveys and a review of documentation
suggested the district should focus on the development and implementation of formally documented processes
to establish effective results-driven continuous improvement planning processes. The Diagnostic Review Team
found little evidence to suggest the district engages stakeholders in the systemic and systematic process of
continuous improvement. In addition, the district has not established systems to monitor implemented plans
and to communicate improvement results to stakeholders. Although the current administrative team embraces
beliefs focused on continuous improvement, systems within the district are not directly aligned to the expected
outcomes for student learning. The district has taken steps to effectively incorporate a teacher evaluation
system linked to high expectations for professional practice; however, presently few effective mechanisms
exist for ensuring high-quality delivery of curriculum, assessment and instruction or to use data to guide
instructional decision-making. Interview data revealed that the district has not identified key quality
performance indicators to measure school effectiveness. In addition, currently little evidence exists that shows
that data were used to evaluate program progress over time; to monitor the impact of specific strategies in goal
areas or to determine whether improvement goals are attained. The district should establish and commit to a
clear set of performance metrics so that it can monitor and determine its ability to meet future improvement
goals.
Improvement PrioritiesThe institution should use the findings from this review to guide the continuous improvement process. The
institution must address the Improvement Priorities listed below:
Collaboratively develop, implement and formally monitor a districtwide instructional process that clearly
informs students of learning expectations and standards of performance; provides students with
exemplars of high quality work; uses data from multiple measures, including formative assessments, to
inform and modify instruction and provides students with specific and timely feedback about their
learning.
Develop and implement a process for school and district leadership to monitor the effectiveness of
programs and district-wide initiatives to ensure implementation fidelity, documentation of progress and
analysis of results.
Document Generated On March 2, 2016
Kentucky Department of Education Dayton Independent
© 2016 Advance Education, Inc. All rights reserved unless otherwise granted by written agreement. Page 28
Kentucky Department of Education Dayton Independent
© 2016 Advance Education, Inc. All rights reserved unless otherwise granted by written agreement. Page 28
Kentucky Department of Education Dayton Independent
© 2016 Advance Education, Inc. All rights reserved unless otherwise granted by written agreement. Page 28
Kentucky Department of Education Dayton Independent
© 2016 Advance Education, Inc. All rights reserved unless otherwise granted by written agreement. Page 28
Kentucky Department of Education Dayton Independent
© 2016 Advance Education, Inc. All rights reserved unless otherwise granted by written agreement. Page 28

-
-
-
Develop, implement, document and continuously monitor a process that engages all stakeholders in the
systematic review and adjustment of curriculum, instruction and assessment based on multiple sources
of student performance data, as well as an examination of professional practice.
Establish, implement and document a formal and consistent districtwide process that monitors the
implemented curriculum and instructional practices and provides teachers and school leadership with
specific and timely written feedback on the improvement of instructional practices aligned to district
values and beliefs and ensures students are actively engaged in meaningful learning.
Facilitate the articulation of a rigorous, standards-based, district-wide K-12 curriculum that provides
equitable and challenging learning experiences and ensures all students have sufficient opportunities to
develop learning, thinking and life skills.
Document Generated On March 2, 2016
Kentucky Department of Education Dayton Independent
© 2016 Advance Education, Inc. All rights reserved unless otherwise granted by written agreement. Page 29
Kentucky Department of Education Dayton Independent
© 2016 Advance Education, Inc. All rights reserved unless otherwise granted by written agreement. Page 29
Kentucky Department of Education Dayton Independent
© 2016 Advance Education, Inc. All rights reserved unless otherwise granted by written agreement. Page 29
Kentucky Department of Education Dayton Independent
© 2016 Advance Education, Inc. All rights reserved unless otherwise granted by written agreement. Page 29
Kentucky Department of Education Dayton Independent
© 2016 Advance Education, Inc. All rights reserved unless otherwise granted by written agreement. Page 29
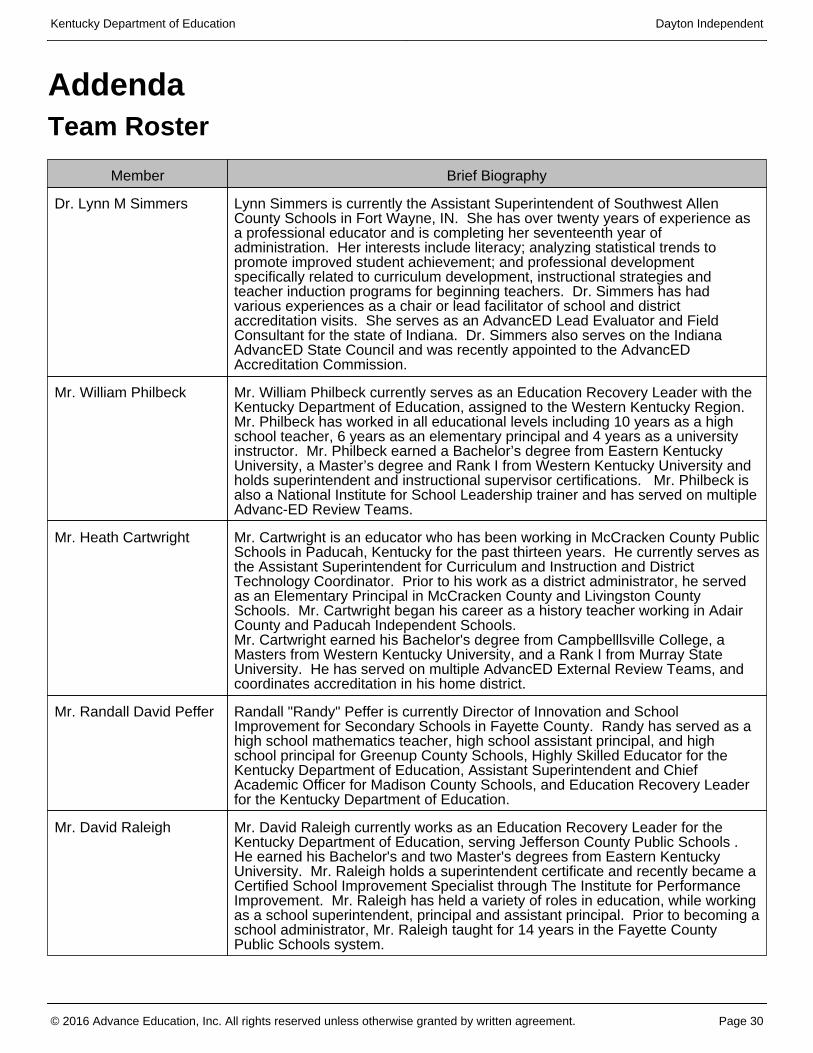
AddendaTeam Roster
Member Brief Biography
Dr. Lynn M Simmers Lynn Simmers is currently the Assistant Superintendent of Southwest AllenCounty Schools in Fort Wayne, IN. She has over twenty years of experience asa professional educator and is completing her seventeenth year ofadministration. Her interests include literacy; analyzing statistical trends topromote improved student achievement; and professional developmentspecifically related to curriculum development, instructional strategies andteacher induction programs for beginning teachers. Dr. Simmers has hadvarious experiences as a chair or lead facilitator of school and districtaccreditation visits. She serves as an AdvancED Lead Evaluator and FieldConsultant for the state of Indiana. Dr. Simmers also serves on the IndianaAdvancED State Council and was recently appointed to the AdvancEDAccreditation Commission.
Mr. William Philbeck Mr. William Philbeck currently serves as an Education Recovery Leader with theKentucky Department of Education, assigned to the Western Kentucky Region.Mr. Philbeck has worked in all educational levels including 10 years as a highschool teacher, 6 years as an elementary principal and 4 years as a universityinstructor. Mr. Philbeck earned a Bachelor’s degree from Eastern KentuckyUniversity, a Master’s degree and Rank I from Western Kentucky University andholds superintendent and instructional supervisor certifications. Mr. Philbeck isalso a National Institute for School Leadership trainer and has served on multipleAdvanc-ED Review Teams.
Mr. Heath Cartwright Mr. Cartwright is an educator who has been working in McCracken County PublicSchools in Paducah, Kentucky for the past thirteen years. He currently serves asthe Assistant Superintendent for Curriculum and Instruction and DistrictTechnology Coordinator. Prior to his work as a district administrator, he servedas an Elementary Principal in McCracken County and Livingston CountySchools. Mr. Cartwright began his career as a history teacher working in AdairCounty and Paducah Independent Schools.Mr. Cartwright earned his Bachelor's degree from Campbelllsville College, aMasters from Western Kentucky University, and a Rank I from Murray StateUniversity. He has served on multiple AdvancED External Review Teams, andcoordinates accreditation in his home district.
Mr. Randall David Peffer Randall "Randy" Peffer is currently Director of Innovation and SchoolImprovement for Secondary Schools in Fayette County. Randy has served as ahigh school mathematics teacher, high school assistant principal, and highschool principal for Greenup County Schools, Highly Skilled Educator for theKentucky Department of Education, Assistant Superintendent and ChiefAcademic Officer for Madison County Schools, and Education Recovery Leaderfor the Kentucky Department of Education.
Mr. David Raleigh Mr. David Raleigh currently works as an Education Recovery Leader for theKentucky Department of Education, serving Jefferson County Public Schools .He earned his Bachelor's and two Master's degrees from Eastern KentuckyUniversity. Mr. Raleigh holds a superintendent certificate and recently became aCertified School Improvement Specialist through The Institute for PerformanceImprovement. Mr. Raleigh has held a variety of roles in education, while workingas a school superintendent, principal and assistant principal. Prior to becoming aschool administrator, Mr. Raleigh taught for 14 years in the Fayette CountyPublic Schools system.
Document Generated On March 2, 2016
Kentucky Department of Education Dayton Independent
© 2016 Advance Education, Inc. All rights reserved unless otherwise granted by written agreement. Page 30
Kentucky Department of Education Dayton Independent
© 2016 Advance Education, Inc. All rights reserved unless otherwise granted by written agreement. Page 30
Kentucky Department of Education Dayton Independent
© 2016 Advance Education, Inc. All rights reserved unless otherwise granted by written agreement. Page 30
Kentucky Department of Education Dayton Independent
© 2016 Advance Education, Inc. All rights reserved unless otherwise granted by written agreement. Page 30
Kentucky Department of Education Dayton Independent
© 2016 Advance Education, Inc. All rights reserved unless otherwise granted by written agreement. Page 30
Kentucky Department of Education Dayton Independent
© 2016 Advance Education, Inc. All rights reserved unless otherwise granted by written agreement. Page 30

Member Brief Biography
Mrs. Tammy Stephens Tammy Stephens is an educator, facilitator, and collaborator. Experiencesinclude working with middle school students in grades 5-9 in English LanguageArts, reading and writing interventionist, literacy/curriculum coach, and districtdirector of secondary education. Currently, Tammy works as EducationRecovery Specialist for the Kentucky Department of Education. Other projectscompleted for KDE include literacy/strategies consultant and English LanguageArts Content Specialist.
Document Generated On March 2, 2016
Kentucky Department of Education Dayton Independent
© 2016 Advance Education, Inc. All rights reserved unless otherwise granted by written agreement. Page 31
Kentucky Department of Education Dayton Independent
© 2016 Advance Education, Inc. All rights reserved unless otherwise granted by written agreement. Page 31
Kentucky Department of Education Dayton Independent
© 2016 Advance Education, Inc. All rights reserved unless otherwise granted by written agreement. Page 31
Kentucky Department of Education Dayton Independent
© 2016 Advance Education, Inc. All rights reserved unless otherwise granted by written agreement. Page 31
Kentucky Department of Education Dayton Independent
© 2016 Advance Education, Inc. All rights reserved unless otherwise granted by written agreement. Page 31
Kentucky Department of Education Dayton Independent
© 2016 Advance Education, Inc. All rights reserved unless otherwise granted by written agreement. Page 31

About AdvancEDAdvancED is the world leader in providing improvement and accreditation services to education providers of all
types in their pursuit of excellence in serving students. AdvancED serves as a trusted partner to more than
32,000 public and private schools and school systems – enrolling more than 20 million students - across the
United States and 70 countries.
In 2006, the North Central Association Commission on Accreditation and School Improvement (NCA CASI),
the Southern Association of Colleges and Schools Council on Accreditation and School Improvement (SACS
CASI), both founded in 1895, and the National Study of School Evaluation (NSSE) came together to form
AdvancED: one strong, unified organization dedicated to education quality. In 2011, the Northwest
Accreditation Commission (NWAC) that was founded in 1917 became part of AdvancED.
Today, NCA CASI, NWAC and SACS CASI serve as accreditation divisions of AdvancED. The Accreditation
Divisions of AdvancED share research-based quality standards that cross school system, state, regional,
national, and international boundaries. Accompanying these standards is a unified and consistent process
designed to engage educational institutions in continuous improvement.
Document Generated On March 2, 2016
Kentucky Department of Education Dayton Independent
© 2016 Advance Education, Inc. All rights reserved unless otherwise granted by written agreement. Page 32
Kentucky Department of Education Dayton Independent
© 2016 Advance Education, Inc. All rights reserved unless otherwise granted by written agreement. Page 32
Kentucky Department of Education Dayton Independent
© 2016 Advance Education, Inc. All rights reserved unless otherwise granted by written agreement. Page 32
Kentucky Department of Education Dayton Independent
© 2016 Advance Education, Inc. All rights reserved unless otherwise granted by written agreement. Page 32
Kentucky Department of Education Dayton Independent
© 2016 Advance Education, Inc. All rights reserved unless otherwise granted by written agreement. Page 32
Kentucky Department of Education Dayton Independent
© 2016 Advance Education, Inc. All rights reserved unless otherwise granted by written agreement. Page 32

-
-
-
-
-
-
-
-
-
-
-
-
-
-
-
-
-
-
ReferencesAlwin, L. (2002). The will and the way of data use. School Administrator, 59(11), 11.
Baumert, J., Kunter, M., Blum, W., Brunner, M., Voxx, T., Jordan, A., Klusmann, U., Krauss, S.,
Nuebrand, M., & Tsai, Y. (2010). Teachers' mathematical knowledge, cognitive activation in the
classroom, and student progress. American Educational Research Journal, 47(1), 133-180.
Chartered Institute of Personnel and Development. (2012). Shared purpose: the golden thread?
London: CIPD.
Colbert, J., Brown, R., Choi, S., & Thomas, S. (2008). An investigation of the impacts of teacher-driven
professional development. Teacher Education Quarterly, 35(2), 134-154.
Conley, D.T. (2007). Redefining college readiness (Vol. 3). Eugene, OR: Educational Policy
Improvement Center.
Datnow, A., Park, V., & Wohlstetter, P. (2007). Achieving with data: How high-performing school
systems use data to improve instruction for elementary students. Los Angeles, CA: Center on
Educational Governance, USC.
Dembosky, J., Pane, J., Barney, H., & Christina, R. (2005). Data driven decision making in
Southwestern Pennsylvania school districts. Working paper. Santa Monica, CA: RAND.
Ding, C. & Sherman, H. (2006). Teaching effectiveness and student achievement: Examining the
relationship. Educational Research Quarterly, 29 (4), 40-51.
Doyle, D. P. (2003). Data-driven decision making: Is it the mantra of the month or does it have staying
power? T.H.E. Journal, 30(10), 19-21.
Feuerstein, A., & Opfer, V. D. (1998). School board chairmen and school superintendents: An analysis
of perceptions concerning special interest groups and educational governance. Journal of School
Leadership, 8, 373-398.
Fink, D., & Brayman, C. (2006). School leadership succession and the challenges of change.
Educational Administration Quarterly, 42 (62), 61-89.
Greene, K. (1992). Models of school-board policy-making. Educational Administration Quarterly, 28
(2), 220-236.
Horng, E., Klasik, D., & Loeb, S. (2010). Principal time-use and school effectiveness. American
Journal of Education 116, (4) 492-523.
Lafee, S. (2002). Data-driven districts. School Administrator, 59(11), 6-7, 9-10, 12, 14-15.
Leithwood, K., & Sun, J. (2012). The Nature and effects of transformational school leadership: A meta-
analytic review of unpublished research. Educational Administration Quarterly, 48 (387). 388-423.
Marks, H., Louis, K.S., & Printy, S. (2002). The capacity for organizational learning: Implications for
pedagogy and student achievement. In K. Leithwood (Ed.), Organizational learning and school
improvement (p. 239-266). Greenwich, CT: JAI Press.
McIntire, T. (2002). The administrator's guide to data-driven decision making. Technology and
Learning, 22(11), 18-33.
Pan, D., Rudo, Z., Schneider, C., & Smith-Hansen, L. (2003). Examination of resource allocation in
education: connecting spending to student performance. Austin, TX: SEDL.
Document Generated On March 2, 2016
Kentucky Department of Education Dayton Independent
© 2016 Advance Education, Inc. All rights reserved unless otherwise granted by written agreement. Page 33
Kentucky Department of Education Dayton Independent
© 2016 Advance Education, Inc. All rights reserved unless otherwise granted by written agreement. Page 33
Kentucky Department of Education Dayton Independent
© 2016 Advance Education, Inc. All rights reserved unless otherwise granted by written agreement. Page 33
Kentucky Department of Education Dayton Independent
© 2016 Advance Education, Inc. All rights reserved unless otherwise granted by written agreement. Page 33
Kentucky Department of Education Dayton Independent
© 2016 Advance Education, Inc. All rights reserved unless otherwise granted by written agreement. Page 33
Kentucky Department of Education Dayton Independent
© 2016 Advance Education, Inc. All rights reserved unless otherwise granted by written agreement. Page 33
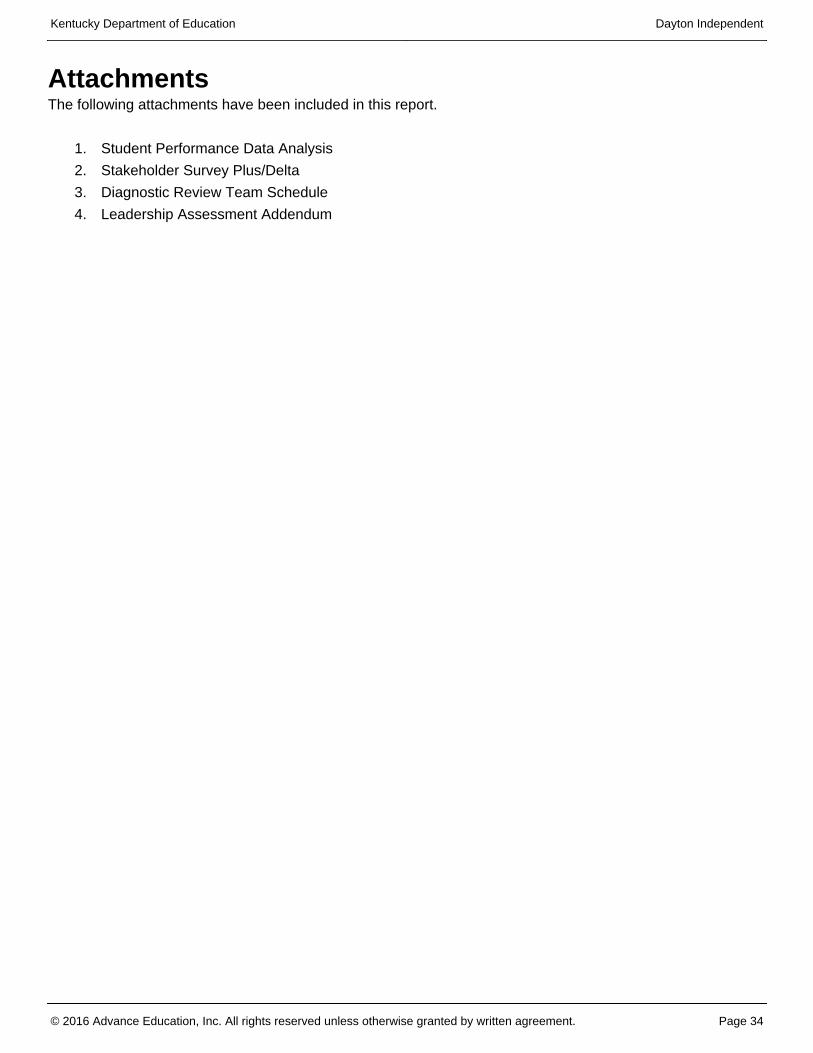
1.
2.
3.
4.
AttachmentsThe following attachments have been included in this report.
Student Performance Data Analysis
Stakeholder Survey Plus/Delta
Diagnostic Review Team Schedule
Leadership Assessment Addendum
Document Generated On March 2, 2016
Kentucky Department of Education Dayton Independent
© 2016 Advance Education, Inc. All rights reserved unless otherwise granted by written agreement. Page 34
Kentucky Department of Education Dayton Independent
© 2016 Advance Education, Inc. All rights reserved unless otherwise granted by written agreement. Page 34
Kentucky Department of Education Dayton Independent
© 2016 Advance Education, Inc. All rights reserved unless otherwise granted by written agreement. Page 34
Kentucky Department of Education Dayton Independent
© 2016 Advance Education, Inc. All rights reserved unless otherwise granted by written agreement. Page 34
Kentucky Department of Education Dayton Independent
© 2016 Advance Education, Inc. All rights reserved unless otherwise granted by written agreement. Page 34
Kentucky Department of Education Dayton Independent
© 2016 Advance Education, Inc. All rights reserved unless otherwise granted by written agreement. Page 34
Kentucky Department of Education Dayton Independent
© 2016 Advance Education, Inc. All rights reserved unless otherwise granted by written agreement. Page 34

Student Performance Team Worksheet for Dayton High School School Name: Dayton High School (Grades 9-12), Dayton Independent Schools
Annual Measurable Objective (AMO)
Year Prior Year
Overall Score AMO Goal
Overall Score
Met AMO Goal
Met Participation
Rate Goal
Met Graduation Rate Goal
2014-2015 60.3 61.3 68.1 Yes Yes No
2013-2014 62.4 63.4 60.4 No Yes Yes
Plus
Dayton High School met AMO for 2014-2015
Dayton High School met Participation Rate in 2013-2014 and 2014-2015
Dayton High School met Graduation Rate for 2013-2014 Delta
Dayton High School did not meet AMO for 2013-2014
Dayton High School did not meet Graduation Rate for 2014-2015
Percentages of Students Scoring at Proficient/Distinguished (P/D) Levels on the K-PREP End-of-Course Assessments at the School and in the State (2012-2013, 2013-2014, 2014-2015)
Content Area
%P/D School (12-13)
%P/D State (12-13)
%P/D School (13-14)
%P/D State (13-14)
%P/D School (14-15)
%P/D State (14-15)
English II 36.4 55.8 39.6 55.4 56.2 56.7
Algebra II 17.9 36.0 9.7 37.9 27.3 38.1
Biology 20.5 36.3 17.6 39.8 37.7 39.6
U.S. History
55.3 51.3 34.7 58.0 37.5 56.8
Writing 45.9 48.2 33.0 43.3 43.1 50.0
Language Mech.
53.5 51.4 46.3 49.9 36.2 51.6
Green = At or above state average = Scored higher than previous year = Scored lower than previous year
Plus
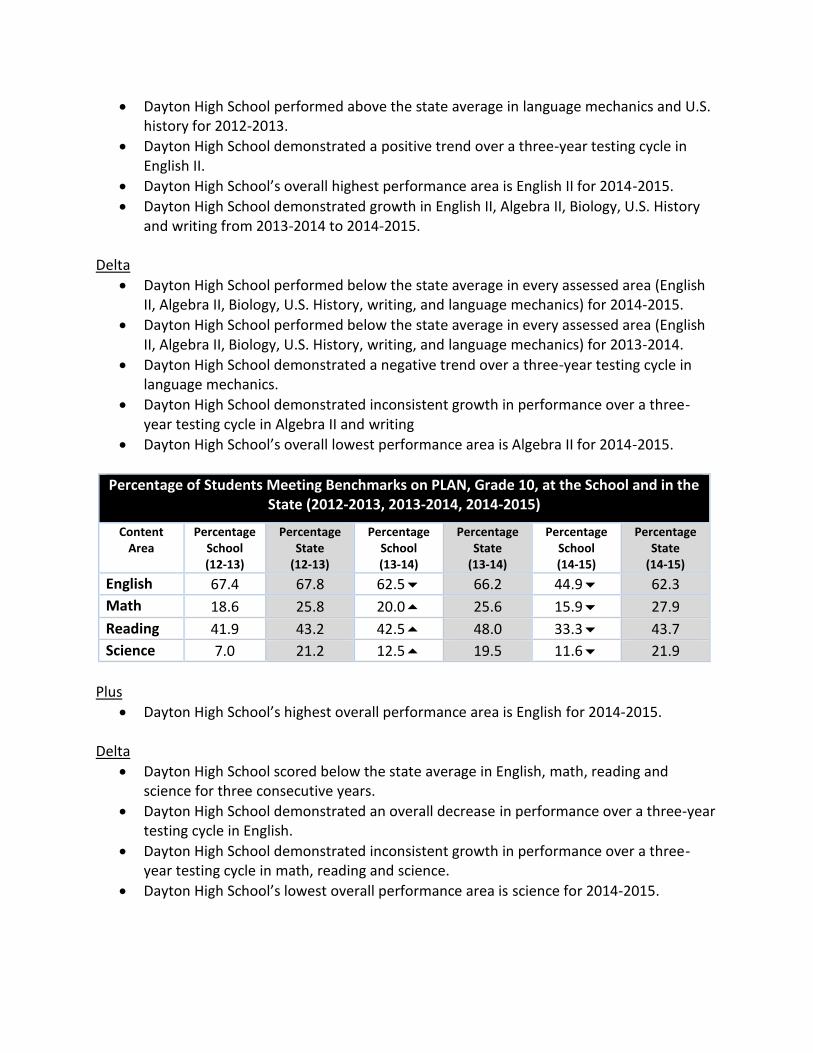
Dayton High School performed above the state average in language mechanics and U.S. history for 2012-2013.
Dayton High School demonstrated a positive trend over a three-year testing cycle in English II.
Dayton High School’s overall highest performance area is English II for 2014-2015.
Dayton High School demonstrated growth in English II, Algebra II, Biology, U.S. History and writing from 2013-2014 to 2014-2015.
Delta
Dayton High School performed below the state average in every assessed area (English II, Algebra II, Biology, U.S. History, writing, and language mechanics) for 2014-2015.
Dayton High School performed below the state average in every assessed area (English II, Algebra II, Biology, U.S. History, writing, and language mechanics) for 2013-2014.
Dayton High School demonstrated a negative trend over a three-year testing cycle in language mechanics.
Dayton High School demonstrated inconsistent growth in performance over a three-year testing cycle in Algebra II and writing
Dayton High School’s overall lowest performance area is Algebra II for 2014-2015.
Percentage of Students Meeting Benchmarks on PLAN, Grade 10, at the School and in the State (2012-2013, 2013-2014, 2014-2015)
Content Area
Percentage School (12-13)
Percentage State
(12-13)
Percentage School (13-14)
Percentage State
(13-14)
Percentage School (14-15)
Percentage State
(14-15)
English 67.4 67.8 62.5 66.2 44.9 62.3
Math 18.6 25.8 20.0 25.6 15.9 27.9
Reading 41.9 43.2 42.5 48.0 33.3 43.7
Science 7.0 21.2 12.5 19.5 11.6 21.9
Plus
Dayton High School’s highest overall performance area is English for 2014-2015.
Delta
Dayton High School scored below the state average in English, math, reading and science for three consecutive years.
Dayton High School demonstrated an overall decrease in performance over a three-year testing cycle in English.
Dayton High School demonstrated inconsistent growth in performance over a three-year testing cycle in math, reading and science.
Dayton High School’s lowest overall performance area is science for 2014-2015.

Percentages of Students Meeting Benchmarks on ACT, Grade 11, at the School and in the State (2012-2013, 2013-2014, 2014-2015)
Content Area
Percentage School (12-13)
Percentage State
(12-13)
Percentage School (13-14)
Percentage State
(13-14)
Percentage School (14-15)
Percentage State
(14-15)
English 47.5 53.1 39.5 55.9 36.6 55.3
Math 27.5 39.6 25.6 43.5 24.2 38.1
Reading 37.5 44.2 39.5 47.1 41.5 47.4
Plus
Dayton High School’s highest overall performance area is reading for 2014-2015.
Dayton High School demonstrated an overall growth in performance over a three-year testing cycle in Reading.
Delta
Dayton High School scored below the state average in English, math and reading three consecutive years.
Dayton High School demonstrated an overall decrease in performance over a three-year testing cycle in math.
Dayton High School demonstrated an overall decrease in performance over a three-year testing cycle in English.
Dayton High School’s lowest overall performance area is math for 2014-2015.
School Achievement of Proficiency and Gap Delivery Targets (2014-2015)
Tested Area Proficiency
Delivery Target for % P/D
Actual Score
Met Target (Yes or No)
Gap Delivery Target
for % P/D
Actual Score
Met Target (Yes or No)
Combined Reading & Math
33.9 42.3 Yes 31.2 35.8 Yes
Reading 44.0 56.5 Yes 40.1 53.7 Yes
Math 21.3 28.1 Yes 34.5 27.5 No
Science 28.7 37.3 Yes 24.2 39.2 Yes
Social Studies 40.3 35.9 No 35.7 31.3 No
Writing 46.5 44.5 No 42.8 41.6 No
Plus
Dayton High School’s highest overall performance area in proficiency is reading.
Dayton High School’s highest overall performance area in gap is reading.
Dayton High School met proficiency delivery targets in combined reading and math, reading, math and science.
Dayton High School met gap delivery targets in combined reading and math, reading and science.

Delta
Dayton High School’s overall lowest performance area in proficiency is math.
Dayton High School’s overall lowest performance area in gap is math.
Dayton High School did not meet proficiency targets in social studies and writing.
Dayton High school did not meet gap targets in math, social studies, and writing.
School Achievement of College and Career Readiness (CCR) and Graduation Rate Delivery Targets (2014-2015)
Delivery Target Type Delivery Target
(School) Actual Score
(School) Actual Score
(State) Met Target (Yes or No)
College and Career Readiness
57.0 56.4 67.0 No
Graduation Rate (for 4-year adjusted cohort)
84.8 71.7 88.7 No
Graduation Rate (for 5-year adjusted cohort)
85.8 90.5 89.3 Yes
Plus
Dayton High School met Graduation Rate (5-Year Adjusted Cohort) delivery target and is above the state average for 2014-2015.
Delta
Dayton High School did not meet Graduation Rate (4-Year Adjusted Cohort) delivery target and is below state average for 2014-2015.
Dayton High School did not meet its College and Career Readiness delivery target and is below the state average for 2014-2015.
Program Reviews 2014-2015
Program Area
Curriculum and
Instruction (3 pts
possible)
Formative & Summative Assessment
(3 pts possible)
Professional Development
(3 pts
possible)
Administrative/ Leadership
Support
(3 pts possible)
Total Score
(12 points possible)
Classification
Arts and Humanities
1.82 2.00 1.89 2.10 7.8 Needs
Improvement
Practical Living
1.80 2.33 1.67 1.92 7.7 Needs
Improvement
Writing 1.89 1.63 1.89 2.00 7.4
Needs Improvement
World Language and Global
1.64 1.82 0.89 0.77 5.1 Needs
Improvement

Competency* *The 2014-15 World Language Program Reviews scores for High Schools will be included with other program reviews to generate the comparable 2014-15 program review baseline score needed for 2015-16 accountability reporting. Plus
Dayton High School’s highest overall performance area based on total score in Program Review is arts and humanities, with an overall score of 7.8
Dayton High School’s highest overall combined performance area is formative and summative assessment (1.95).
Delta
Dayton High School program reviews are classified as Needs Improvement in arts and humanities, practical living, writing, and world language.
Dayton High School’s lowest overall performance area based on total score in Program Review is world language, with an overall score of 5.1.
Dayton High School’s lowest overall combined performance area is professional development (1.59).
Summary of Student Performance Data Student performance data indicate some positive gains have been made in English II over the three-year testing cycle as well as gains in Algebra II, Biology, US History and writing. However, Dayton High School performed below the state average in every assessed area (English II, Algebra II, Biology, U.S. History, writing and language mechanics) in 2014-2015 as well as 2013-2014. Additionally, a negative trend prevails over a three-year testing cycle in language mechanics. Data revealed inconsistent student growth in performance over a three-year testing cycle in Algebra II and writing. The school’s overall lowest performance area is Algebra II for 2014-2015.
Student performance data from 2014-2015 show proficiency targets being met for all students, as well as for the non-duplicated gap group, in the areas of combined reading and math, reading, and science. Math data show the delivery target was met for all students while the non-duplicated gap group did not meet the target. Delivery targets were not met in the content areas of social studies or writing for either the all students or the non-duplicated gap group categories. The highest scoring performance content area is reading for all students and the non-duplicated gap group. The lowest scoring performance content area is math for all students and the non-duplicated gap group. The smallest discrepancy between the all students group and the non-duplicated gap group is in math with the largest discrepancy being in social studies.
Over the course of three PLAN ACT assessment cycles, the percentage of students who met benchmarks decreased in English, math, and reading. There was a 5.5 percent increase in students who met the benchmark in science from 2012-13 to 2013-14 but dropped again in 2014-15. The ACT assessment results show similar results. The percent of students who met benchmarks in English and math have steadily declined on the past three assessment cycles;
however, the percentage of students who met benchmarks in reading have increased during that same time period. Data indicated Dayton High School failed to meet its College and Career Readiness delivery target for 2014-2015 with their actual score falling below the state average for 2014-2015. In addition, although Dayton High School met its graduation rate delivery target for the five-year adjusted cohort, the school did not met the four-year adjusted cohort delivery target for 2014-2015 with 71.7 percent falling below the state’s average of 88.7 percent.
Dayton High School’s Program Review ratings for all programs received the designation of Needs Improvement which correlates to existing student data. The school’s highest performance area based on the total score is arts and humanities with an overall score of 7.8. In addition, the school’s highest overall combined performance area is formative and summative assessment with a score of 1.95. Conversely, Dayton High School’s lowest overall combined performance area is professional development at 1.59.

Stakeholder Survey Plus/Delta
The Survey Plus/Delta is the team’s brief analysis all stakeholder survey data which is intended to
highlight areas of strength (pluses) that were identified through the survey process as well as leverage
points for improvement (deltas).
Teaching and Learning Impact
Plus: (minimum of 75 percent agreed/strongly agreed)
1. 93 percent of parents agreed/strongly agreed with the statement, “My child knows the
expectations for learning in all classes.”
2. 86 percent of parents agreed/strongly agreed with the statement, “My child has at least one
adult advocate in the school.”
3. 88 percent of parents agreed/strongly agreed with the statement, “My child has up-to-date
computers and other technology to learn.”
4. 76 percent of students agreed/strongly agreed with the statement, “My school gives me
multiple assessments to check my understanding of what was taught.”
5. 97 percent of staff agreed/strongly agreed with the statement, “Our school’s leaders expect
staff members to hold all students to high academic standards.”
6. 94 percent of staff agreed/strongly agreed with the statement, “All teachers in our school
participate in collaborative learning communities that meet both informally and formally across
grade levels and content areas.”
7. 94 percent of staff agreed/strongly agreed with the statement, “Our school leaders monitor
data related to school continuous improvement goals.”
Delta:
1. 52 percent of staff agreed/strongly agreed with the statement, “All teachers in our school
personalize instructional strategies and interventions to address individual learning needs of
students.”
2. 48 percent of staff agreed/strongly agreed with the statement, “In our school, all school
personnel regularly engage families in their children’s learning progress.”
3. 52 percent of staff agreed/strongly agreed with the statement, “All teachers in our school
provide students with specific and timely feedback about their learning.”
4. 48 percent of students agreed/strongly agreed with the statement, “All of my teachers change
their teaching to meet my learning needs.”
5. 48 percent of students agreed/strongly agreed with the statement, “My school makes sure
there is at least one adult who knows me well and shows interest in my education and future.”
6. 60 percent of parents agreed/strongly agreed with the statement, “All of my teachers keep my
family informed of my academic progress.”

7. 60 percent of parents agreed/strongly agreed with the statement, “All of my child’s teachers
meet his/her learning needs by individualizing instruction.”
Leadership Capacity
Plus: (minimum of 75 percent agreed/strongly agreed)
1. 95 percent of parents agreed/strongly agreed with the statement, “Our school’s purpose
statement is clearly focused on student success.”
2. 96 percent of parents agreed/strongly agreed with the statement, “Our school has established
goals and a plan for improving student learning.”
3. 76 percent of students agreed/strongly agreed with the statement, “In my school, the principal
and teachers have high expectations of me.”
4. 100 percent of staff agreed/strongly agreed with the statement, “Our school’s purpose
statement is clearly focused on student success.”
5. 100 percent of staff agreed/strongly agreed with the statement, “Our school has a continuous
improvement process based on data, goals, actions, and measure for growth.”
6. 97 percent of staff agreed/strongly agreed with the statement, “Our school’s purpose statement
is based on shared values and beliefs that guide decision-making.”
7. 97 percent of staff agreed/strongly agreed with the statement, “Our school’s purpose statement
is supported by the policies and practices adopted by the school board or governing body.”
8. 97 percent of staff agreed/strongly agreed with the statement, “Our school’s leaders expect
staff members to hold all students to high academic standards.”
Delta:
1. 48 percent of staff agreed/strongly agreed with the statement, “In our school, all school
personnel regularly engage families in their children’s learning progress.”
2. 48 percent of students agreed/strongly agreed with the statement, “All of my teachers change
their teaching to meet my learning needs.”
3. 48 percent of students agreed/strongly agreed with the statement, “My school offers
opportunities for my family to become involved in school activities and my learning.”
4. 50 percent of students agreed/strongly agreed with the statement, “All of my teachers keep my
family informed of my academic progress.”
5. 55 percent of students agreed/strongly agreed with the statement, “My school considers
students’ opinions when planning ways to improve the school.”

Resource Utilization
Plus: (minimum of 75 percent agreed/strongly agreed)
1. 94 percent of staff agreed/strongly agreed with the statement, “Our school provides qualified
staff members to support student learning.”
2. 97 percent of staff agreed/strongly agreed with the statement, “Our school maintains facilities
that contribute to a safe environment.”
3. 94 percent of staff agreed/strongly agreed with the statement, “Our school provides
opportunities for students to participate in activities that interest them.”
4. 89 percent of parents agreed/strongly agreed with the statement, “Our school provides
qualified staff members to support student learning.”
5. 90 percent of parents agreed/strongly agreed with the statement, “Our school provides a safe
learning environment.”
6. 89 percent of parents agreed/strongly agreed with the statement, “Our school ensures that the
facilities support student learning.”
Delta:
1. 52 percent of students agreed/strongly agreed with the statement, “In my school, the building
and grounds are safe, clean, and provide a healthy place for learning.”
39 percent of staff agreed/strongly agreed with the statement, “Our school provides sufficient material
resources to meet student needs.”

Diagnostic Review Team Schedule
Dayton Independent Schools
Sunday, January 31, 2016
Time Event Where Who 3:00 p.m. Hotel Check-in Hotel Diagnostic Review Team
Members
4:00 p.m. -5:30 p.m. Orientation and Planning Session Hotel Conference
Room
Diagnostic Review Team
Members
5:30 p.m. – 6:30 p.m. Dinner TBD
Diagnostic Review Team
Members
6:30 p.m. – 7:30 p.m.
Principal’s Overview Presentation & Standards
Presentation
Questions/topics to be addressed:
1. Vision, i.e., where has the school come from, where is
the school now, and where is the school trying to go from
here?
This presentation should specifically address the findings
from the Leadership Assessment Report completed two
years ago. It should point out the impact of school
improvement initiatives begun as a result of the previous
Leadership Assessment, and it should provide details and
documentation as to how the school has improved student
achievement as well as conditions that support learning.
2. Overview of the School Self Assessment - review and
explanation of ratings, strengths and potential
improvement priorities.
3. How did the school and system ensure that the Internal
Review process was carried out with integrity at the school
level?
4. What has the school and system done to evaluate,
support, monitor and ensure improvement in student
performance as well as conditions that support learning?
5. What has been the result of school/system efforts at the
school? What evidence can the school present to indicate
that learning conditions and student achievement have
improved?
6. What professional development has the school provided
in the last two years targeting improvement in teacher
professional practice and student success? What should the
Hotel Conference
Room
Diagnostic Review Team
Members
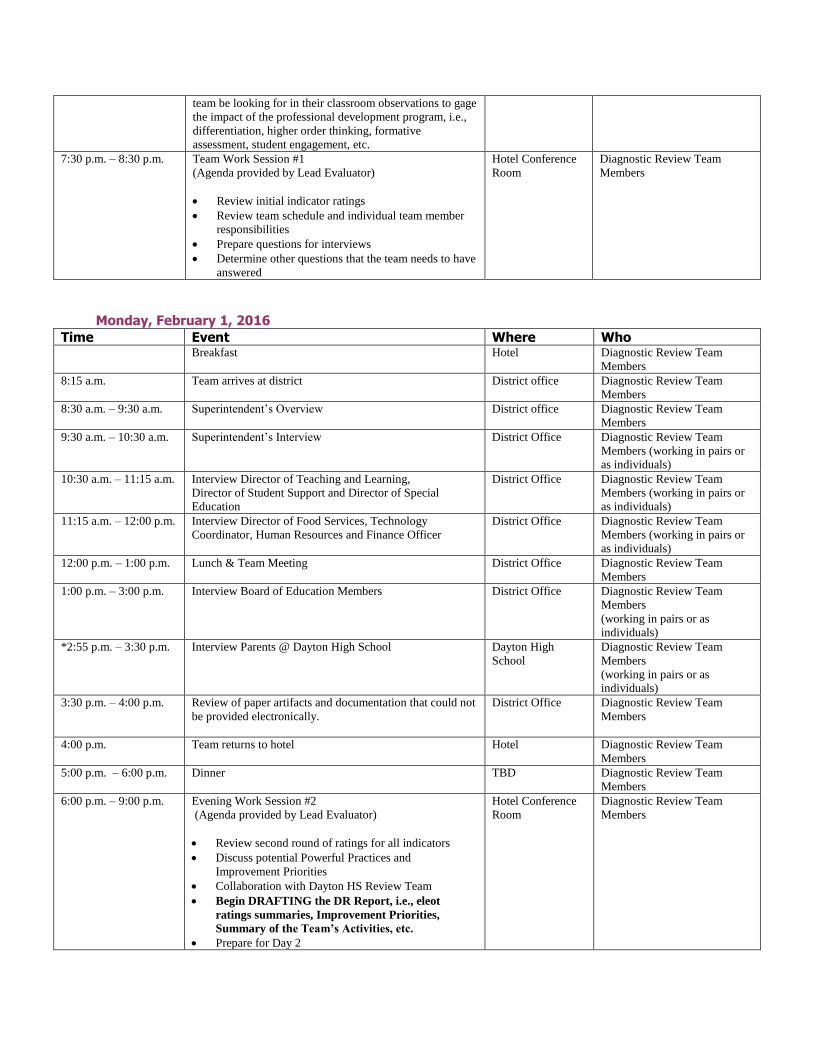
team be looking for in their classroom observations to gage
the impact of the professional development program, i.e.,
differentiation, higher order thinking, formative
assessment, student engagement, etc.
7:30 p.m. – 8:30 p.m. Team Work Session #1
(Agenda provided by Lead Evaluator)
Review initial indicator ratings
Review team schedule and individual team member
responsibilities
Prepare questions for interviews
Determine other questions that the team needs to have
answered
Hotel Conference
Room
Diagnostic Review Team
Members
Monday, February 1, 2016
Time Event Where Who Breakfast Hotel Diagnostic Review Team
Members
8:15 a.m. Team arrives at district
District office Diagnostic Review Team
Members
8:30 a.m. – 9:30 a.m. Superintendent’s Overview District office Diagnostic Review Team
Members
9:30 a.m. – 10:30 a.m. Superintendent’s Interview District Office Diagnostic Review Team
Members (working in pairs or
as individuals)
10:30 a.m. – 11:15 a.m. Interview Director of Teaching and Learning,
Director of Student Support and Director of Special
Education
District Office Diagnostic Review Team
Members (working in pairs or
as individuals)
11:15 a.m. – 12:00 p.m. Interview Director of Food Services, Technology
Coordinator, Human Resources and Finance Officer
District Office Diagnostic Review Team
Members (working in pairs or
as individuals)
12:00 p.m. – 1:00 p.m.
Lunch & Team Meeting District Office Diagnostic Review Team
Members
1:00 p.m. – 3:00 p.m. Interview Board of Education Members District Office Diagnostic Review Team
Members
(working in pairs or as
individuals)
*2:55 p.m. – 3:30 p.m. Interview Parents @ Dayton High School
Dayton High
School
Diagnostic Review Team
Members
(working in pairs or as
individuals)
3:30 p.m. – 4:00 p.m.
Review of paper artifacts and documentation that could not
be provided electronically.
District Office Diagnostic Review Team
Members
4:00 p.m. Team returns to hotel Hotel Diagnostic Review Team
Members
5:00 p.m. – 6:00 p.m. Dinner TBD Diagnostic Review Team
Members
6:00 p.m. – 9:00 p.m. Evening Work Session #2
(Agenda provided by Lead Evaluator)
Review second round of ratings for all indicators
Discuss potential Powerful Practices and
Improvement Priorities
Collaboration with Dayton HS Review Team
Begin DRAFTING the DR Report, i.e., eleot
ratings summaries, Improvement Priorities,
Summary of the Team’s Activities, etc.
Prepare for Day 2
Hotel Conference
Room
Diagnostic Review Team
Members
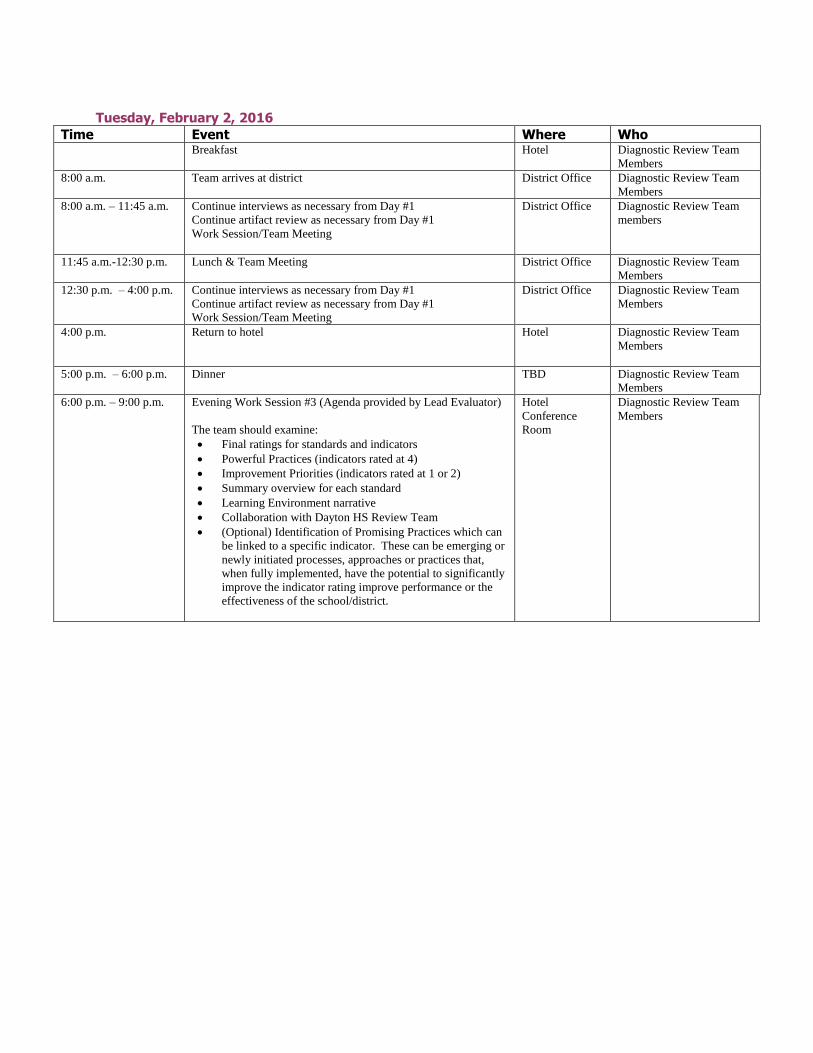
Tuesday, February 2, 2016
Time Event Where Who Breakfast Hotel Diagnostic Review Team
Members
8:00 a.m. Team arrives at district District Office Diagnostic Review Team
Members
8:00 a.m. – 11:45 a.m. Continue interviews as necessary from Day #1
Continue artifact review as necessary from Day #1
Work Session/Team Meeting
District Office Diagnostic Review Team
members
11:45 a.m.-12:30 p.m.
Lunch & Team Meeting District Office Diagnostic Review Team
Members
12:30 p.m. – 4:00 p.m. Continue interviews as necessary from Day #1
Continue artifact review as necessary from Day #1
Work Session/Team Meeting
District Office Diagnostic Review Team
Members
4:00 p.m. Return to hotel Hotel Diagnostic Review Team
Members
5:00 p.m. – 6:00 p.m. Dinner TBD Diagnostic Review Team
Members
6:00 p.m. – 9:00 p.m. Evening Work Session #3 (Agenda provided by Lead Evaluator)
The team should examine:
Final ratings for standards and indicators
Powerful Practices (indicators rated at 4)
Improvement Priorities (indicators rated at 1 or 2)
Summary overview for each standard
Learning Environment narrative
Collaboration with Dayton HS Review Team
(Optional) Identification of Promising Practices which can
be linked to a specific indicator. These can be emerging or
newly initiated processes, approaches or practices that,
when fully implemented, have the potential to significantly
improve the indicator rating improve performance or the
effectiveness of the school/district.
Hotel
Conference
Room
Diagnostic Review Team
Members
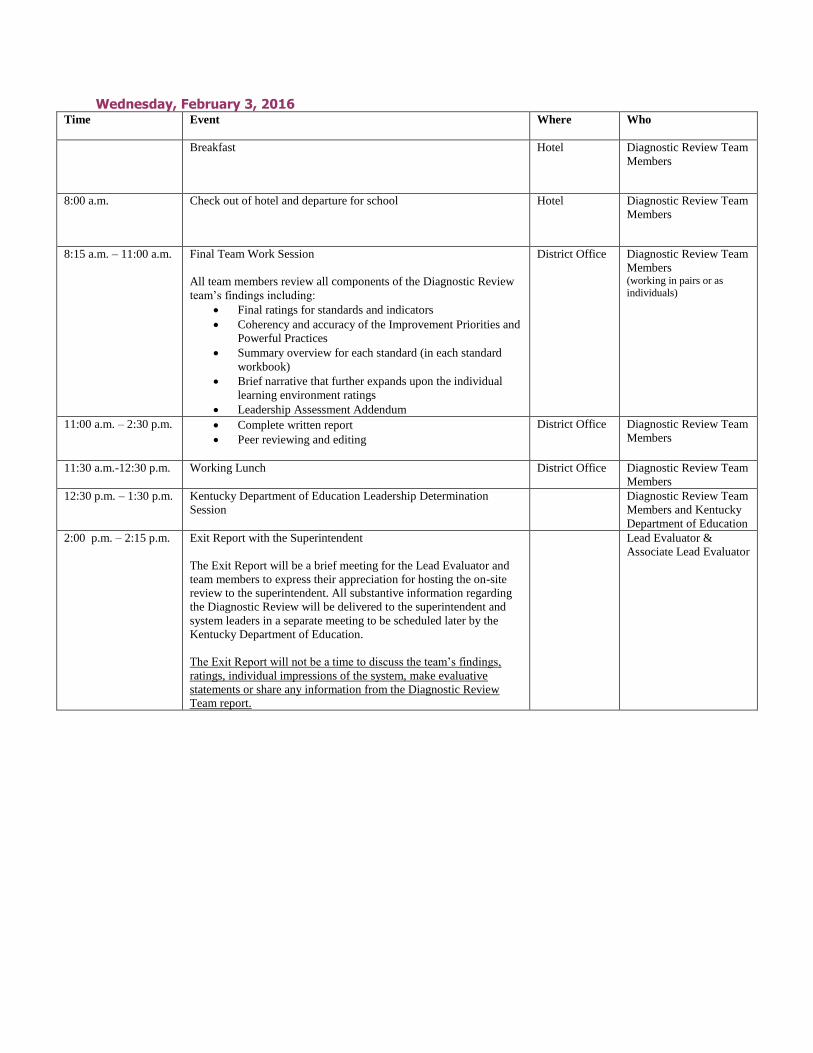
Wednesday, February 3, 2016 Time Event Where Who
Breakfast Hotel Diagnostic Review Team
Members
8:00 a.m.
Check out of hotel and departure for school Hotel
Diagnostic Review Team
Members
8:15 a.m. – 11:00 a.m. Final Team Work Session
All team members review all components of the Diagnostic Review
team’s findings including:
Final ratings for standards and indicators
Coherency and accuracy of the Improvement Priorities and
Powerful Practices
Summary overview for each standard (in each standard
workbook)
Brief narrative that further expands upon the individual
learning environment ratings
Leadership Assessment Addendum
District Office Diagnostic Review Team
Members (working in pairs or as
individuals)
11:00 a.m. – 2:30 p.m. Complete written report
Peer reviewing and editing
District Office Diagnostic Review Team
Members
11:30 a.m.-12:30 p.m. Working Lunch District Office Diagnostic Review Team
Members
12:30 p.m. – 1:30 p.m. Kentucky Department of Education Leadership Determination
Session
Diagnostic Review Team
Members and Kentucky
Department of Education
2:00 p.m. – 2:15 p.m. Exit Report with the Superintendent
The Exit Report will be a brief meeting for the Lead Evaluator and
team members to express their appreciation for hosting the on-site
review to the superintendent. All substantive information regarding
the Diagnostic Review will be delivered to the superintendent and
system leaders in a separate meeting to be scheduled later by the
Kentucky Department of Education.
The Exit Report will not be a time to discuss the team’s findings,
ratings, individual impressions of the system, make evaluative
statements or share any information from the Diagnostic Review
Team report.
Lead Evaluator &
Associate Lead Evaluator

2015-16 LEADERSHIP ASSESSMENT/DIAGNOSTIC REVIEW ADDENDUM
The purpose of this addendum is to provide feedback on progress made in addressing
identified Improvement Priorities from the 2013-2014 Diagnostic Review or Progress
Monitoring Visit for Dayton Independent Schools.
Improvement Priority 1
Indicator 1.1
2013-14 Team Rating
2015-16 School/District
Self- Rating
2015-16 Team Rating
The system engages in a systematic, inclusive, and comprehensive process to review, revise, and communicate a system-wide purpose for student success.
1 4
3
1.1 Improvement Priority (2013-14)
Complete the process already underway to review, revise and communicate a system-wide purpose for student success. Ensure that the revised formal statements of purpose and direction commit to high expectations for learning as well as shared values and beliefs about teaching and learning. Further ensure that the process is 1) formalized and implemented with fidelity on a regular schedule, 2) inclusive of representatives from all stakeholder groups, and 3) is well documented.
School Self- Rating
Team Rating
This Improvement Priority has been addressed in an exemplary manner. X This Improvement Priority has been addressed satisfactorily. X This Improvement Priority has been partially addressed. There is little or no evidence that this Improvement Priority has been addressed.
School Evidence:
Board of Education minutes
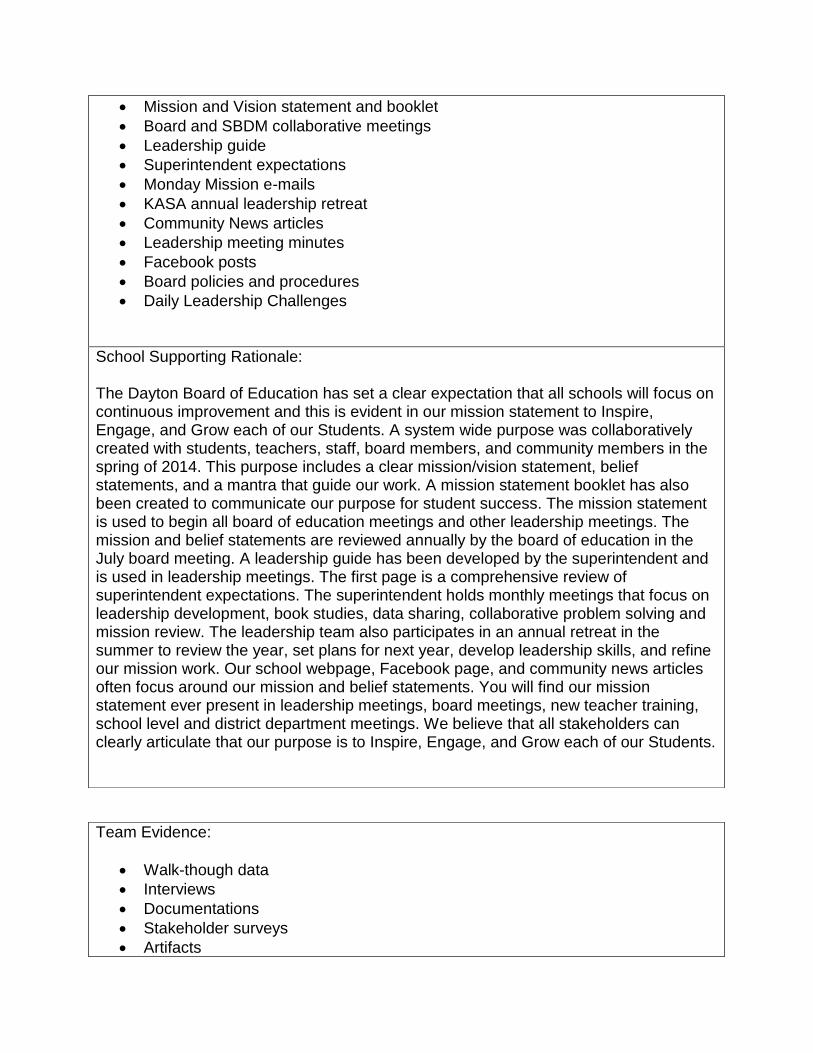
Mission and Vision statement and booklet
Board and SBDM collaborative meetings
Leadership guide
Superintendent expectations
Monday Mission e-mails
KASA annual leadership retreat
Community News articles
Leadership meeting minutes
Facebook posts
Board policies and procedures
Daily Leadership Challenges
School Supporting Rationale: The Dayton Board of Education has set a clear expectation that all schools will focus on continuous improvement and this is evident in our mission statement to Inspire, Engage, and Grow each of our Students. A system wide purpose was collaboratively created with students, teachers, staff, board members, and community members in the spring of 2014. This purpose includes a clear mission/vision statement, belief statements, and a mantra that guide our work. A mission statement booklet has also been created to communicate our purpose for student success. The mission statement is used to begin all board of education meetings and other leadership meetings. The mission and belief statements are reviewed annually by the board of education in the July board meeting. A leadership guide has been developed by the superintendent and is used in leadership meetings. The first page is a comprehensive review of superintendent expectations. The superintendent holds monthly meetings that focus on leadership development, book studies, data sharing, collaborative problem solving and mission review. The leadership team also participates in an annual retreat in the summer to review the year, set plans for next year, develop leadership skills, and refine our mission work. Our school webpage, Facebook page, and community news articles often focus around our mission and belief statements. You will find our mission statement ever present in leadership meetings, board meetings, new teacher training, school level and district department meetings. We believe that all stakeholders can clearly articulate that our purpose is to Inspire, Engage, and Grow each of our Students.
Team Evidence:
Walk-though data
Interviews
Documentations
Stakeholder surveys
Artifacts

Improvement Priority 2
Indicator 1.2
2013-14 Team Rating
2015-16 School/District
Self- Rating
2015-16 Team Rating
The system ensures that each school engages in a systematic, inclusive, and comprehensive process to review, revise, and communicate a school purpose for student success.
1 3 2
1.2 Improvement Priority (2013-14) Develop policies and procedures that ensure all schools engage in a systematic, inclusive and comprehensive process to review, revise and communicate a school purpose for student success.
School Self- Rating
Team Rating
This Improvement Priority has been addressed in an exemplary manner. This Improvement Priority has been addressed satisfactorily. X This Improvement Priority has been partially addressed. X There is little or no evidence that this Improvement Priority has been addressed.
Administrative presentations/overview
Team Supporting Rationale: The mission and vision of the district are widely shared through a variety of media sources including social sites, the school and district websites, the school and district marquees and stakeholder communication. During interviews, the superintendent articulated the process he used to lead the district and a variety of stakeholders through a revision of the district’s vision and mission. The lack of evidence documenting the revision process did not support an exemplary rating. Stakeholder survey data suggest the district has completed a process to review, revise and communicate a school purpose that clearly focuses on student success. One hundred percent of staff agreed/strongly agreed with the statement “Our school’s purpose statement is clearly focused on student success.” Moreover, 100 percent of staff agreed/strongly agreed that “Our school’s purpose statement is formally reviewed and revised with stakeholders.”
School Evidence:

Mission and Vision statement and booklet
Board of Education minutes
Board and SBDM collaborative meetings
CDIP and CSIP, Leadership guide
Superintendent expectations
Monday Mission e-mails
KASA annual leadership retreat
Community News articles
Leadership meeting minutes
Facebook posts
Board policies and procedures
Daily Leadership Challenges
District attendance and support at SBDM meetings
Student Assistance Team meetings
School Leadership Team meetings
School Supporting Rationale: Schools report monthly detailed updates to the board of education at board meetings. The use of data is clearly evident in these reports. The schools also update the board of education on their purpose for student success at joint board/council meetings that occur twice a year. The councils also submit a detailed needs assessment that is presented to the board to begin the budgeting process for the upcoming school year. The collaborative CDIP/CSIP process also ensures that district and school goals align. District representatives are active participants in SBDM meetings, student assistance meetings, and PLC’s. The CDIP/CSIP is reviewed and revised multiple times during the year. Monthly leadership meetings often revisit the superintendent expectation for use of mission/purpose to guide the work at each school. This expectation is evidenced in the Leadership Guide under superintendent expectations. Dayton Independent Schools engage in a systematic, inclusive, and comprehensive process to review, revise, and communicate a system-wide purpose for student success.
Team Evidence:
Walk-though data
Interviews
Documentations
Stakeholder surveys
Artifacts
Board policy
Administrative presentations/overview

Improvement Priority 3
Indicator 3.3
2013-14 Team Rating
2015-16 School/District
Self- Rating
2015-16 Team Rating
Teachers throughout the district engage students in their learning through instructional strategies that ensure achievement of learning expectations.
1 2 2
3.3 Improvement Priority (2013-14) Ensure teachers deliberately plan and effectively implement high-yield instructional strategies that require students to participate in activities that require collaboration, self- reflection, and development of critical thinking skills, etc. Analyze student formative assessment data to design personalized instruction to meet the needs of the individual learners. Identify and implement instructional strategies which promote higher order knowledge and skills, the integration of content with other disciplines, and the use of technologies as instructional resources and tools.
School Self- Rating
Team Rating
This Improvement Priority has been addressed in an exemplary manner. This Improvement Priority has been addressed satisfactorily. This Improvement Priority has been partially addressed. X X There is little or no evidence that this Improvement Priority has been
Team Supporting Rationale: Stakeholder interviews indicated the district has established policies and procedures outlining the expectations for schools regarding a process for review, revision and communication of a purpose for student success. However, the Diagnostic Review Team found limited evidence that monitoring and feedback of implemented policies and procedures occurred. Stakeholder survey data are consistent with these findings with 100 percent of staff members who agreed/strongly agreed with the statement “Our school’s purpose statement is supported by the policies and practices adopted by the school board or governing body” and 84 percent of parents agreed/strongly agreed with the statement “Our school’s purpose statement is formally reviewed and revised with involvement from parents.”
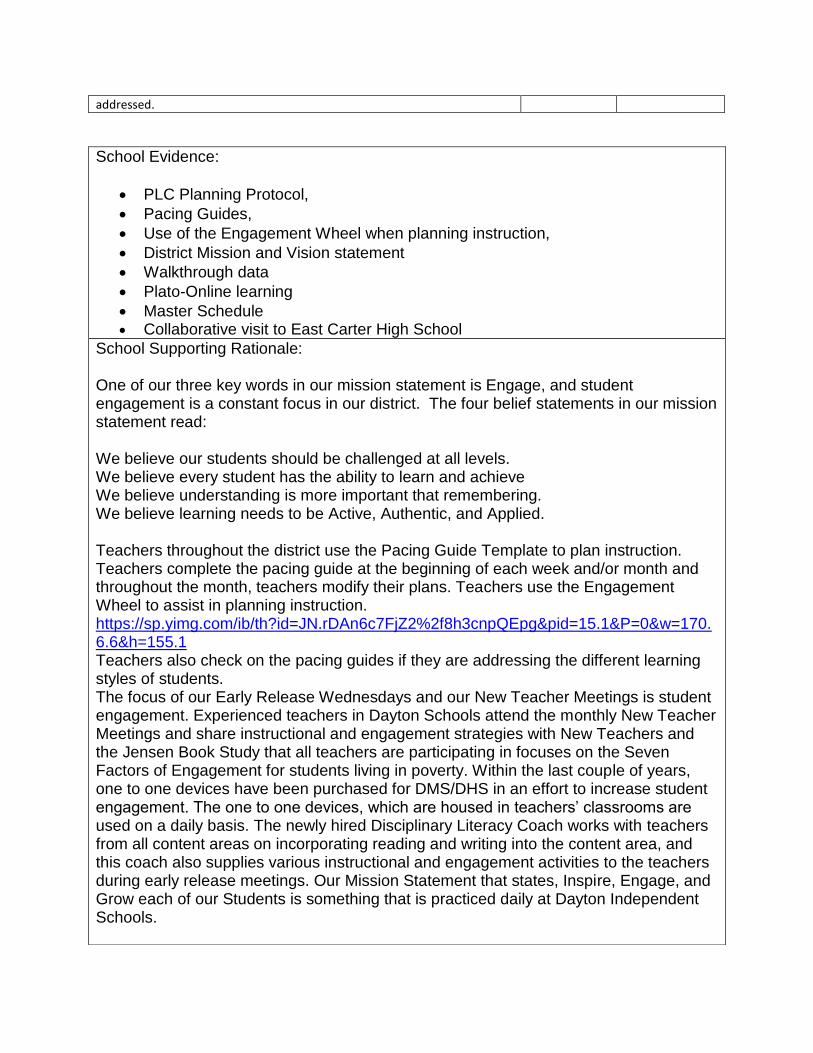
addressed.
School Evidence:
PLC Planning Protocol,
Pacing Guides,
Use of the Engagement Wheel when planning instruction,
District Mission and Vision statement
Walkthrough data
Plato-Online learning
Master Schedule Collaborative visit to East Carter High School
School Supporting Rationale: One of our three key words in our mission statement is Engage, and student engagement is a constant focus in our district. The four belief statements in our mission statement read: We believe our students should be challenged at all levels. We believe every student has the ability to learn and achieve We believe understanding is more important that remembering. We believe learning needs to be Active, Authentic, and Applied. Teachers throughout the district use the Pacing Guide Template to plan instruction. Teachers complete the pacing guide at the beginning of each week and/or month and throughout the month, teachers modify their plans. Teachers use the Engagement Wheel to assist in planning instruction. https://sp.yimg.com/ib/th?id=JN.rDAn6c7FjZ2%2f8h3cnpQEpg&pid=15.1&P=0&w=170.6.6&h=155.1 Teachers also check on the pacing guides if they are addressing the different learning styles of students. The focus of our Early Release Wednesdays and our New Teacher Meetings is student engagement. Experienced teachers in Dayton Schools attend the monthly New Teacher Meetings and share instructional and engagement strategies with New Teachers and the Jensen Book Study that all teachers are participating in focuses on the Seven Factors of Engagement for students living in poverty. Within the last couple of years, one to one devices have been purchased for DMS/DHS in an effort to increase student engagement. The one to one devices, which are housed in teachers’ classrooms are used on a daily basis. The newly hired Disciplinary Literacy Coach works with teachers from all content areas on incorporating reading and writing into the content area, and this coach also supplies various instructional and engagement activities to the teachers during early release meetings. Our Mission Statement that states, Inspire, Engage, and Grow each of our Students is something that is practiced daily at Dayton Independent Schools.

Team Evidence:
Walk-though data
Interviews
Documentations
Stakeholder surveys
Artifacts
Team Supporting Rationale: The Diagnostic Review Team agreed with the district’s self-rating of this Improvement Priority. Interviews revealed the district in collaboration with the high school has implemented several processes to ensure the use of instructional strategies in the classroom that require student collaboration, self- reflection and development of critical thinking skills. Processes such as “10 for 10”, the use of the Engagement Wheel, content Professional Learning Communities (PLC’s) and the district’s New Teacher Orientation program give teachers the opportunity to gain valuable instructional skills. However, limited evidence and classroom observation data suggest this process has been only partially addressed. Classroom observations revealed there is a lack of research-based, rigorous instruction being consistently implemented. Furthermore, display of high quality work and meaningful feedback to students is seldom. Assessment practices indicate teachers sometimes use data in purposeful ways to inform instruction with teacher interviews revealing the use of formative assessment data is rare. The district must find ways to actively engage teachers in collaboration related to curriculum alignment, assessment development, using data to assess student progress and differentiating instruction to meet the individual needs of students. Classroom observation data specific to the Digital Learning Environment received a rating of 1.75 on a 4 point scale with this being the school’s lowest rating of all learning environments. Observers noted few meaningful instances of students using technology to “gather, evaluate, and/or use information for learning” with this indicator being rated as “not observed” in 41 percent of classrooms. Moreover, there were even fewer instances of students “using digital tools to conduct research, solve problems and/or create original works for learning” with this indicator being rated as “not observed” in 53 percent of classrooms. Stakeholder survey data is consistent with these findings with 52 percent of staff strongly agreeing/agreeing with the statement, “All teachers in our school personalize instructional strategies and interventions to address individual learning needs of students.” Furthermore, 52 percent of staff agreed/strongly agreed with the statement, “All teachers in our school provide students with specific and timely feedback about

Improvement Priority 4
Indicator 3.6
2013-14 Team Rating
2015-16 School/District
Self- Rating
2015-16 Team Rating
Teachers implement the system’s instructional process in support of student learning.
1 2 1
3.6 Improvement Priority (2013-14) Strengthen and revise the district instructional process to ensure it is highly effective in 1) informing students of learning expectations and standards of performance, 2) using exemplars to enhance student understanding, 3) using formative assessments to guide and inform possible modifications to curriculum and instruction, 4) providing specific and timely feedback to students about their learning.
School Self- Rating
Team Rating
This Improvement Priority has been addressed in an exemplary manner. This Improvement Priority has been addressed satisfactorily. This Improvement Priority has been partially addressed. X There is little or no evidence that this Improvement Priority has been addressed.
X
their learning.” Forty-eight percent of students agreed/strongly agreed with the statement, “All of my teachers change their teaching to meet my learning needs,” suggesting the deliberate planning and use of high-yield instructional strategies and the personalization and/or differentiation of instruction is not consistent across all classrooms.
School Evidence:
PLC Planning Protocol
Pacing Guide Template and Examples
I Can statements
School grading policy
Exemplars posted in classrooms
Goal Setting in student planners
GradeCam
Document cameras
10 for 10 weekly formative assessments

CERT testing with immediate feedback
RTI/Intervention bell for students not meeting benchmarks on CERT
School Supporting Rationale: All teachers at Dayton Middle/High School are implementing the PLC protocol during their common planning time. As part of this PLC protocol, teachers must share exemplars that will be used with the students. Teachers also are required to post student friendly learning targets in the form of “I Can Statements.” These “I Can Statements,” are reviewed with the students. Teachers also are giving what we call “10 for 10” assessments, in which students take a weekly assessment that consists of 10 “ACT-like” assessments and the students have 10 minutes to take the assessment. Students make retake the assessment as many times as needed once the teacher has retaught the standards that appear on the assessment. This school year a grading policy was adopted by the DMS/DHS SBDM council. This policy outlined for teachers that formative assessments accounted for 70 percent of a student’s grade and summative assessments accounted for 30 percent of a student’s grade.
Team Evidence:
Walk-though data
Interviews
Documentations
Stakeholder surveys
Artifacts
Team Supporting Rationale: Stakeholder interviews revealed the district has not developed a collaborative system to implement, monitor and document an instructional process that clearly informs students of learning expectations and standards of performance; provides students exemplars of high quality work; uses data from multiple measures, including formative assessments, to inform and modify instruction; and provides students with specific and timely feedback about their learning. Leadership and staff could not articulate a research-based instructional process that systemically guides teaching and learning across the district. Classroom observations revealed students are rarely “provided exemplars of high quality work” with this indicator being rated evident/very evident in 24 percent of classrooms. Moreover, classroom observations were mixed relative to students being “tasked with activities and learning that are challenging” and “engaged in rigorous coursework, discussions, and/or tasks” with only 47 percent and 35 percent of classrooms rated as evident/very evident respectively. Classroom observations suggest
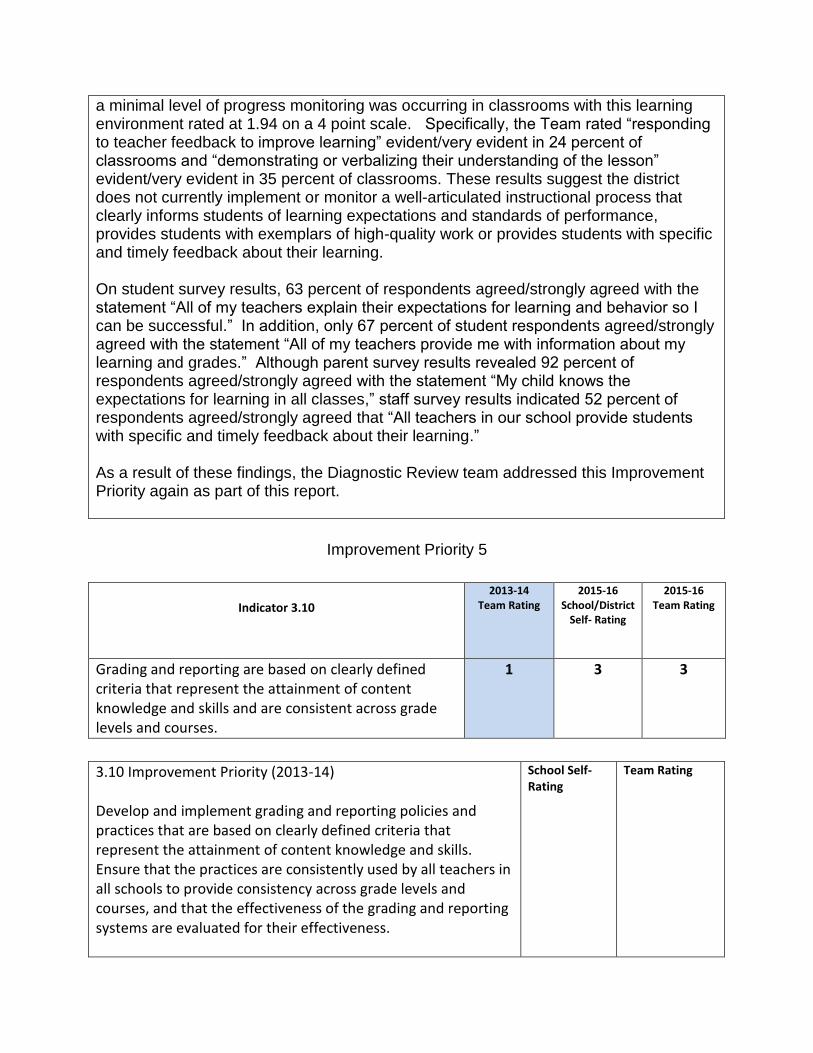
Improvement Priority 5
Indicator 3.10
2013-14 Team Rating
2015-16 School/District
Self- Rating
2015-16 Team Rating
Grading and reporting are based on clearly defined criteria that represent the attainment of content knowledge and skills and are consistent across grade levels and courses.
1 3 3
3.10 Improvement Priority (2013-14) Develop and implement grading and reporting policies and practices that are based on clearly defined criteria that represent the attainment of content knowledge and skills. Ensure that the practices are consistently used by all teachers in all schools to provide consistency across grade levels and courses, and that the effectiveness of the grading and reporting systems are evaluated for their effectiveness.
School Self- Rating
Team Rating
a minimal level of progress monitoring was occurring in classrooms with this learning environment rated at 1.94 on a 4 point scale. Specifically, the Team rated “responding to teacher feedback to improve learning” evident/very evident in 24 percent of classrooms and “demonstrating or verbalizing their understanding of the lesson” evident/very evident in 35 percent of classrooms. These results suggest the district does not currently implement or monitor a well-articulated instructional process that clearly informs students of learning expectations and standards of performance, provides students with exemplars of high-quality work or provides students with specific and timely feedback about their learning. On student survey results, 63 percent of respondents agreed/strongly agreed with the statement “All of my teachers explain their expectations for learning and behavior so I can be successful.” In addition, only 67 percent of student respondents agreed/strongly agreed with the statement “All of my teachers provide me with information about my learning and grades.” Although parent survey results revealed 92 percent of respondents agreed/strongly agreed with the statement “My child knows the expectations for learning in all classes,” staff survey results indicated 52 percent of respondents agreed/strongly agreed that “All teachers in our school provide students with specific and timely feedback about their learning.” As a result of these findings, the Diagnostic Review team addressed this Improvement Priority again as part of this report.

This Improvement Priority has been addressed in an exemplary manner. This Improvement Priority has been addressed satisfactorily. X X This Improvement Priority has been partially addressed. There is little or no evidence that this Improvement Priority has been addressed.
School Evidence:
SBDM Grading
Missing Work Policy
Council minutes
Council policies
10 for 10 data
East Carter Site Visit
15 Fixes to Broken Grades book New grading policy (70% summative, 30% formative)
School Supporting Rationale: The Dayton Independent School District has an ungraded primary program in which students receive a standard based report card. Students in grades K- 3 receive a score of 1, 2, or 3 depending on the students’ knowledge of the standards. Teachers of students in grades four to six have their grade book set up as follows: 60% assessments, 30% classroom assignments, and 10% homework. The DMS/DHS SBDM Council adopted a new grading policy beginning with the 2015 – 2016 school year. A leadership team comprised of teachers researched grading practices and policies and agreed upon a policy that was presented to staff and the SBDM council. Once the council approved the policy, the new grading system was shared with students during grade level class meetings. The policy was also shared with parents during Orientation Nights and sent to all parents via email through Infinite Campus. At DMS/DHS all formative assessments account for 30% of a student’s grade and summative assessments account for 70% of a student’s grade. Student grades are based on attainment of content knowledge and skills. The assessment questions that appear on the weekly 10 for 10 assessments are all tied to standards, and students have multiple opportunities to retake the 10 for 10 assessments once the teachers reteach the content. The new grading system at the high school created a comprehensive grading system in the school that is consistent and is used to assess what students actually know.
Team Evidence:
• Collaborative process with stakeholders in developing new grading policy

Improvement Priority 6
Indicator 3.12
2013-14 Team Rating
2015-16 School/District
Self- Rating
2015-16 Team Rating
The system and its schools provide and coordinate learning support services to meet the unique learning needs of students.
1 3 2
3.12 Improvement Priority (2013-14) Use data to systematically and continuously identify unique
School Self- Rating
Team Rating
• Implementation of 10 for 10 formative assessment strategy • Implementation of End-of-Course benchmark assessments • Use of Grade Cam • Stakeholder interviews • Board policy • Administrative presentations/overview
Team Supporting Rationale: The Diagnostic Review Team agreed with the district’s self-rating of this Improvement Priority. Interviews revealed that district leadership worked collaboratively with Dayton High School teachers to develop a new grading policy. This grading policy represents a balance between summative (70 percent) and formative assessment (30 percent) practices. Current grading policies have been approved by the governing body of the district and school. Furthermore, teachers are continuing to more accurately align grading practices with the mastery of content standards and develop a common understanding of grading practices at all levels to ensure grades reflect attainment of content knowledge and skills. Stakeholders are aware of the new grading policies, processes and procedures. Although the system has established effective grading policies throughout the district, classroom observation data revealed students do not have a clear understanding of how their work is assessed. Observations revealed students do not consistently “understand how their work is assessed” with this indicator being rated as “not observed” or “partially observed” in 82 percent of classrooms. Furthermore, students indicated in 29 percent of classrooms that they do not “have opportunities to revise/improve work based on feedback,” suggesting the effectiveness of new assessment and grading practices and their impact on student learning is not yet evident.
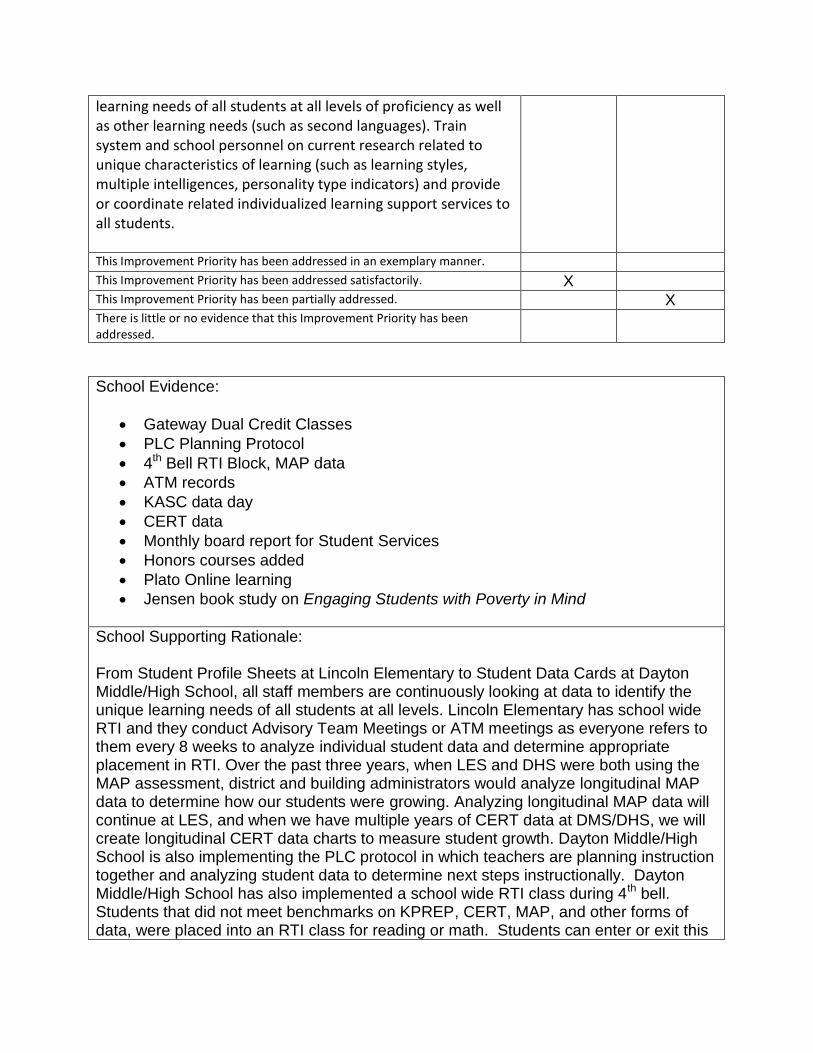
learning needs of all students at all levels of proficiency as well as other learning needs (such as second languages). Train system and school personnel on current research related to unique characteristics of learning (such as learning styles, multiple intelligences, personality type indicators) and provide or coordinate related individualized learning support services to all students. This Improvement Priority has been addressed in an exemplary manner. This Improvement Priority has been addressed satisfactorily. X This Improvement Priority has been partially addressed. X There is little or no evidence that this Improvement Priority has been addressed.
School Evidence:
Gateway Dual Credit Classes
PLC Planning Protocol
4th Bell RTI Block, MAP data
ATM records
KASC data day
CERT data
Monthly board report for Student Services
Honors courses added
Plato Online learning
Jensen book study on Engaging Students with Poverty in Mind
School Supporting Rationale: From Student Profile Sheets at Lincoln Elementary to Student Data Cards at Dayton Middle/High School, all staff members are continuously looking at data to identify the unique learning needs of all students at all levels. Lincoln Elementary has school wide RTI and they conduct Advisory Team Meetings or ATM meetings as everyone refers to them every 8 weeks to analyze individual student data and determine appropriate placement in RTI. Over the past three years, when LES and DHS were both using the MAP assessment, district and building administrators would analyze longitudinal MAP data to determine how our students were growing. Analyzing longitudinal MAP data will continue at LES, and when we have multiple years of CERT data at DMS/DHS, we will create longitudinal CERT data charts to measure student growth. Dayton Middle/High School is also implementing the PLC protocol in which teachers are planning instruction together and analyzing student data to determine next steps instructionally. Dayton Middle/High School has also implemented a school wide RTI class during 4th bell. Students that did not meet benchmarks on KPREP, CERT, MAP, and other forms of data, were placed into an RTI class for reading or math. Students can enter or exit this

4th bell RTI depending upon their score on the CERT assessment. For students that are continually having difficulty mastering standards, a special education referral process is in place for any teacher that suspects a disability in a child. The Youth Service Center is in place to address other outside factors that may be impeding students from learning, and the ILP’s are utilized and completed by each student to determine interests and goals of students.
Team Evidence:
CERT data
MAP data
Student enrollment in credit recovery
Student enrollment in interventions
Student enrollment in Gateway dual credit classes
Interviews
Administrative presentations/overview
Youth Service Center support
Team Supporting Rationale: Evidence indicated various programs and initiatives are being implemented to address the unique learning needs of students. Interviews revealed the district has implemented the College Equipped Readiness Tool (CERT) in grades seven through eleven to monitor student progression on the college readiness standards while continuing with Measures of Academic Progress (MAP) in the elementary grades. Students at Dayton Middle School are provided with dual reading and math classes based on data. Additionally, students at Dayton High School who fail the first semester of a course are provided with a credit recovery opportunity to stay on track for graduation. Dayton High School implements an intervention schedule for students not meeting the benchmarks on the Kentucky Performance Rating for Educational Progress (KPREP) or CERT and a book study on Engaging Students with Poverty in Mind has been a district initiative due to the high percentage of students who qualify for free or reduced lunch. Furthermore, the district pays tuition and book costs for Gateway Community College dual credit courses for students who meet two out of three benchmarks on the American College Testing (ACT) assessment. Interviews with Youth Service Center personnel revealed a variety of supports available to assist students with outside barriers that may impede their learning and success in school. Classroom observations indicated a supportive learning environment exists to some degree, rated at 2.19 on a 4 point scale. In several classrooms, students “demonstrated or expressed that learning experiences were positive,” rated at 2.35 on a 4 point scale
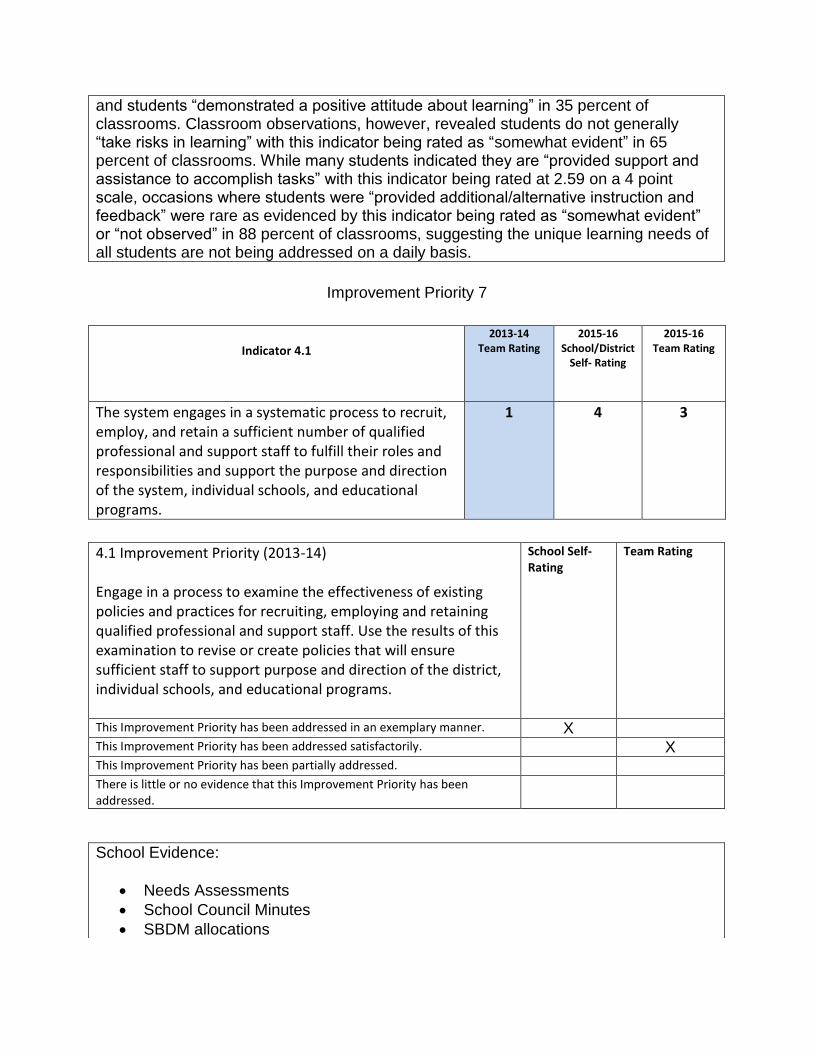
Improvement Priority 7
Indicator 4.1
2013-14 Team Rating
2015-16 School/District
Self- Rating
2015-16 Team Rating
The system engages in a systematic process to recruit, employ, and retain a sufficient number of qualified professional and support staff to fulfill their roles and responsibilities and support the purpose and direction of the system, individual schools, and educational programs.
1 4 3
4.1 Improvement Priority (2013-14) Engage in a process to examine the effectiveness of existing policies and practices for recruiting, employing and retaining qualified professional and support staff. Use the results of this examination to revise or create policies that will ensure sufficient staff to support purpose and direction of the district, individual schools, and educational programs.
School Self- Rating
Team Rating
This Improvement Priority has been addressed in an exemplary manner. X This Improvement Priority has been addressed satisfactorily. X This Improvement Priority has been partially addressed. There is little or no evidence that this Improvement Priority has been addressed.
and students “demonstrated a positive attitude about learning” in 35 percent of classrooms. Classroom observations, however, revealed students do not generally “take risks in learning” with this indicator being rated as “somewhat evident” in 65 percent of classrooms. While many students indicated they are “provided support and assistance to accomplish tasks” with this indicator being rated at 2.59 on a 4 point scale, occasions where students were “provided additional/alternative instruction and feedback” were rare as evidenced by this indicator being rated as “somewhat evident” or “not observed” in 88 percent of classrooms, suggesting the unique learning needs of all students are not being addressed on a daily basis.
School Evidence:
Needs Assessments
School Council Minutes
SBDM allocations

TalentEd website
New Teacher Training program
District budget
School Supporting Rationale: The district gives each school and school council the opportunity to fill out a Needs Assessment of its building. Within the Needs Assessment each building evaluates the number of personnel and how they are assigned. Each Principal and School council also has a school allocation sheet that allows for the distribution of staff. This past year, DHS was supplied additional funding for a Disciplinary/Literacy Coach, an additional business teacher, and a registrar. LES was provided with 2 additional teachers to decrease class sizes. These positions were created to help our students grow in their reading abilities and keep them Inspired and Engaged in their classrooms. A school nurse and a school resource officer are also provided from district funds to assist students in their emotional and social well-being. The district spends over 75% of its total budget in personnel. When financial cuts needed to be made the district office eliminated 2.5 positions so that we could continue to have small class sizes and keep teachers and faculty in the classrooms. We have purchased an online program, TalentEd to help us recruit and retain better teachers. The District also attends the NKU Job fair to recruit new aspiring teachers. We also have a first year teacher training program that is conducted by our Director of Teaching and Learning to assist and train new teachers in our district.
Team Evidence:
TalentEd K-12 Strategic Talent Management website
District administrator interview
New teacher training program
Section 7 allocation
Team Supporting Rationale: Stakeholder interviews revealed Dayton Independent Schools uses the Talent Ed K-12 Strategic Talent Management website for potential applicants to apply for jobs online to assist in the recruiting of staff. District staff also recruit teachers by attending job fairs at Northern Kentucky University. All new teachers participate in an induction program led by the Director of Teaching and Learning. The Dayton Independent Board of Education allocates additional staffing through the Section 7 process to ensure the schools have sufficient staff to meet the needs of students. Furthermore, Dayton High School, through Section 7, has received allocations for a discipline/literacy coach, business teacher and a registrar. District administrators spoke candidly of their desire to competitively recruit effective teachers in an effort to maximize the learning opportunities for all students through purposeful staff assignment. Additionally, staff

Improvement Priority 8
Indicator 4.4
2013-14 Team Rating
2015-16 School/District
Self- Rating
2015-16 Team Rating
The system demonstrates strategic resource management that includes long-range planning in support of the purpose and direction of the system.
1 3 3
4.4 Improvement Priority (2013-14) Establish policies and procedures that clearly define a process to develop a long range resource management plan ensuring that fiscal resources are allocated to fund positions, the budget, facilities, and other strategic components critical to achieve the purpose and direction of the system, schools, and educational programs over a 3-5 year period. Evaluate the resource management plan for effectiveness and create improvement plans related to the process based on these results.
School Self- Rating
Team Rating
This Improvement Priority has been addressed in an exemplary manner. This Improvement Priority has been addressed satisfactorily. X X This Improvement Priority has been partially addressed. There is little or no evidence that this Improvement Priority has been addressed.
survey results are indicative of the system’s efforts with 94 percent of staff who agreed/strongly agreed with the statement, “Our school provides qualified staff members to support student learning.”
School Evidence:
District budget
Audit report
Local Planning Committee minutes
CDIP
District Facility Plan
School Supporting Rationale:

The Dayton Independent School District and Board of Education collaboratively create and establish an annual budget. The budget is created in three stages: The Draft Budget, the Working Budget, and the Actual Budget. Each of these three stages must be approved at a Board meeting throughout the year. Before the Draft Budget is approved the Budget Committee meets to discuss the current year’s budget and look at ways to improve and adjust the upcoming year’s Draft Budget. The Budget Committee consists of a Board representative, Superintendent, Chief Finance Officer, and other members. Each year, an Independent Auditing Firm reviews the budget and spending practices of the system. They make recommendations and suggestions to the Board of Education to improve Fiscal procedures and resource management. Also, the District Facility Plan is created by the Local Planning Committee (LPC). The LPC is required to meet, discuss and create a vision for facilities over a 10-year period. The LPC must reconvene before any decisions are made to enhance or change any of the facilities in the district. The Comprehensive District Improvement Plan (CDIP) looks at 5 areas: Graduation Rate, College and Career Readiness, Academic Achievement, Gap groups, and Evaluation systems. The CDIP is collaboration between teachers and administrators to improve the overall effectiveness of our District.
Team Evidence:
Budget
Board policies
Local Planning Committee minutes
District Facilities Plan
Stakeholder interviews
Administrative presentations/overview
Team Supporting Rationale: The Diagnostic Review Team agrees with the district’s self-rating of this Improvement Priority. A review of evidence and stakeholder interviews indicates Dayton Independent Schools has established effective policies and procedures for strategic resource management. The system employs a long-range strategic planning process in the areas of budget, facilities and other strategic system components. Strategic plans are implemented with fidelity by the school Board and system leaders have built-in measures to monitor implementation and completion.
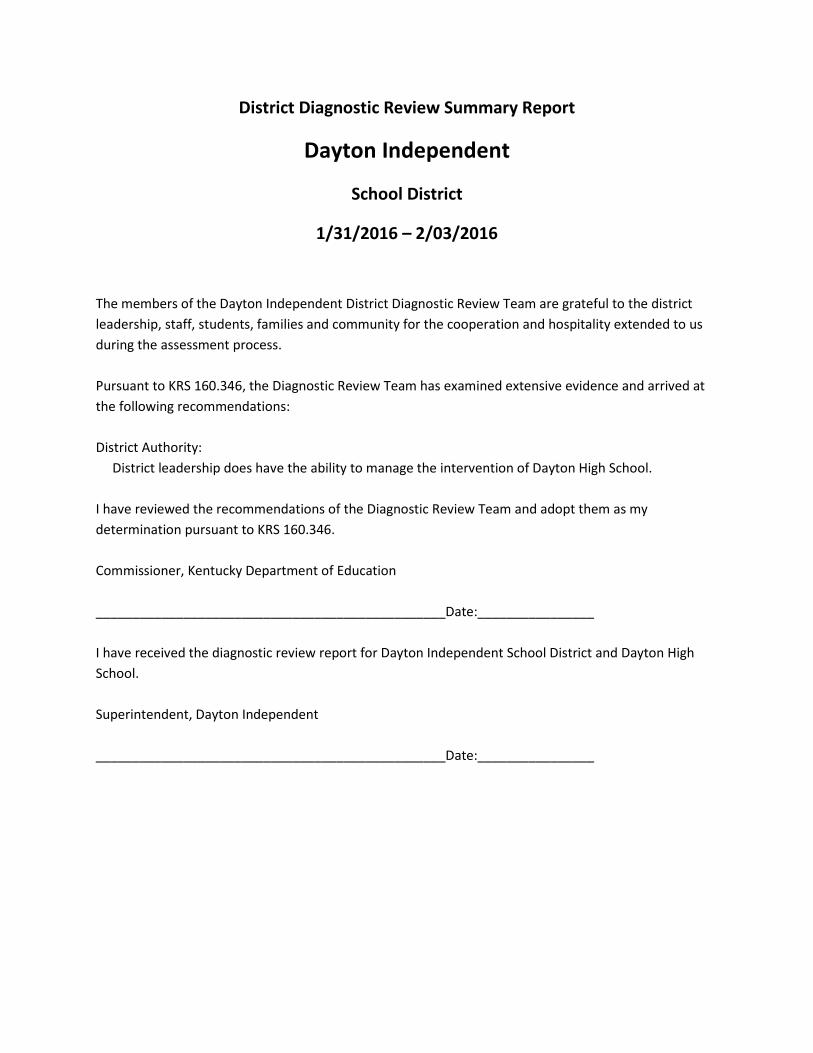
District Diagnostic Review Summary Report
Dayton Independent
School District
1/31/2016 – 2/03/2016
The members of the Dayton Independent District Diagnostic Review Team are grateful to the district leadership, staff, students, families and community for the cooperation and hospitality extended to us during the assessment process. Pursuant to KRS 160.346, the Diagnostic Review Team has examined extensive evidence and arrived at the following recommendations: District Authority: District leadership does have the ability to manage the intervention of Dayton High School. I have reviewed the recommendations of the Diagnostic Review Team and adopt them as my determination pursuant to KRS 160.346. Commissioner, Kentucky Department of Education ________________________________________________Date:________________ I have received the diagnostic review report for Dayton Independent School District and Dayton High School. Superintendent, Dayton Independent ________________________________________________Date:________________