Embed Size (px)
Citation preview

April 16, 2007
Document of the World Bank
Report No. 39672-CL
ChileInvestment Climate Assessment
(In Two Volumes) Volume I: Executive Summary and PolicyRecommendations
Finance and Private Sector UnitPoverty Reduction and Economic Management UnitLatin America and the Caribbean Region
39672P
ublic
Dis
clos
ure
Aut
horiz
edP
ublic
Dis
clos
ure
Aut
horiz
edP
ublic
Dis
clos
ure
Aut
horiz
edP
ublic
Dis
clos
ure
Aut
horiz
edP
ublic
Dis
clos
ure
Aut
horiz
edP
ublic
Dis
clos
ure
Aut
horiz
edP
ublic
Dis
clos
ure
Aut
horiz
edP
ublic
Dis
clos
ure
Aut
horiz
ed


ABBREVIATIONS AND ACRONYMS ACCIF ACHEL AUGE C A I CAS CASEN CONAF CONICYT CORFO DIPRES DPR ENIA EU FDI FECU FEDIT FIA FIDES FOGAPE FONASA FONTEC FOSIS FSSA FTAs FTE GDP IMF INE ISP L A C L D C MIDEPLAN MINEDUC MOPTT MPG NIS NSF OECD OMIL PASIS PAYGO PDP PEE PEPS PISA PRI SBIF SENCE
Average Country Citation Impact Factor Asociacion Chilena de Leasing Plan o f Universal Access with Explicit Guarantees Cuenta de Ahorro de Indemnizaci6n Country Assistance Strategy Chile’s National Household Survey Chile’s National Forest Corporation National Commission o f Science and Technology Industrial Development Corporation Budget Office, Ministry o f Finance Development Policy Review Encuesta Nacional Industrial Anual European Union Foreign Direct Investment Ficha Unica Codijicada Uniforme Spanish Federation o f Technological Innovation Entities Agrarian Innovation Foundation Fondos de Inversion de Desarrollo de Empresas Fondo de Garantia para la Pequeiia Empresa Publicly Run Social Health Insurance System Fondo Nacional de Desarrollo Tecnoldgico y Productivo Social Development Fund Financed by Chilean Government Financial Systems Stability Assessment Free Trade Agreements Full-Time Equivalent Gross Domestic Product International Monetary Fund National Statistics Institute Public Health Institute Latin America and the Caribbean Least Developed Countries Chile’s Ministry o f Planning and Cooperation Chile’s Ministry o f Education Ministerio de Obras Pu’blicas Minimum Pension Guarantee National Innovation system National Science Foundation (USA) Organization o f Economic co-operation and Development Ojicina Municipal de Intermediacidn Laboral Non Contributory, Social Assistance Benefit to Elderly Indigent Pay-as-you-go Financing for Social Insurance Institutions Program Desarrollo de Proveedores Plan Especial de Empleo Public Employment Programs Program for International Student Assessment Public Research Institute Superintendencia de Bancos e Instituciones Financieras Chile’s Social Risk Management Survey
1

SESMA SIC S I I SIMCE SING S M E svs SUBTEL TFP T M C USD VAT WB
Chile’s Environmental Metropolitan health Service Sistema Interconectado Central Servicio de Impuestos Internos Subsidies for Employment Creation Sistema Interconectado del Norte Grande Small and Medium Enterprise Superintendencia de Valores y Seguros Telecommunications Sub-secretariat Total Factor Productivity Tasa Mdxima Convencional United Sates Dollar Value Added Tax World Bank
2

ACKNOWLEDGEMENTS
This report was prepared by a team led by Jose Guilherme Reis and comprised of Stefka Slavova (Business Regulation), Pablo Fajnzylber (Technology and Innovation), Tito Yepes (Infrastructure), and Emanuel Salinas (Finance). The productivity analysis i s based on a background paper prepared by Alvaro Escribano, Jose Luis Guasch, Jorge Pena and Manuel de Orte. Leonid Koryukin also provided inputs for the productivity analysis and the analysis of the ENIA data base. Leyla Castillo, Mariam Dayoub and Patricia Melo provided valuable assistance in the preparation of the report. Peer reviewers Sara Calvo, William Maloney and Mary Hallward-Driemeier provided valuable comments and suggestions. Additional important inputs were received from Susan Goldmark, Marianne Fay, Jose Luis Guasch, Constantinos Stephanou, Raffaella Mota, James Parks, Daniel Oks, Phillippe Durand, Esperanza Lasagabaster, Juan Gaviria, Michael Goldberg and Francis J. Earwaker.
We would l i ke to acknowledge important contributions received from government officials in Chile, especially from the Subsecretaria de Economia, Ana Maria Correa, the former Subsecretario de Economia, Carlos Alvarez, as well as from Rosella Cominetti, Albert0 Ergas, Jaime Gre, Marisa Ernst, Andres Sanfuentes and Isabel Zuiiiga, a l l of them from Ministerio de Economia. The team also benefited from the insights provided in meetings with the Ministerio de Hacienda, led by the (then) economic policy coordinator, Marcel0 Tokman, as well as with Comision Nacional de Energia, Ministerio de Obras Pu'blicas, Transporte y Telecomunicaciones, Superintendencia de Electricidad y Combustibles (SEC), Fundacidn Chile, Corfo (Corporacidn de Foment0 de la Produccidn) and Sofofa (private sector manufacturing association).
The findings and views expressed here are exclusively those of the World Bank and do not represent the views of the government of Chile.
3

TABLE OF CONTENTS Abbreviations and Acronyms ......................................................................................................................... 1 Acknowledgements ........................................................................................................................................ 3 Table of Contents ............................................................................................................................................ 4 List of Figures ................................................................................................................................................. 5 List of Tables .................................................................................................................................................. 6 L i s t of Boxes ................................................................................................................................................... 6 Foreword ....................................................................................................................................................... 12
Background ............................................................................................................................................... 13
Finance ..................................................................................................................................................... 23 Business and Labor Regulations ............................................................................................................... 28 Innovation ................................................................................................................................................. 35 Infrastructure ............................................................................................................................................ 39
Annex: Productivity Analysis: A Summary of the Methodology ................................................................. 44 References ................................................................................................................................................ 46
General Findings ....................................................................................................................................... 16
4
LIST OF FIGURES
Figure 1 . GDP growth- International Comparison ...................................................................................... 13 Figure 2 . Entrepreneurs' perceptions of Obstacles to growth ....................................................................... 17 Figure 3 . Perceptions o f Obstacles to Growth .............................................................................................. 18 Figure 4 . Interpretations o f Government Regulations Predictable, Percentage o f Respondents sharing this view .............................................................................................................................................................. 19 Figure 5 . Losses due to infrastructure related issues. crime and security (% o f total sales) ......................... 19 Figure 6 . Profitability of the median firm in the manufacturing sector ....................................................... 20 Figure 7 . Productivity Elasticities and Semielasticities with respect to I C variables ................................... 21 Figure 8 . Average Productivity Impact (Gains and Losses) of Investment Climate Variables- Aggregate Level ............................................................................................................................................................. 22 Figure 9 . Domestic credit to private sector (% o f GDP) ............................................................................... 24 Figure 10 . Credit constraining by industry ................................................................................................... 27 Figure 1 1 . The Time Tax: percent of senior management time devoted to government regulations. inspections. taxes, customs, etc .................................................................................................................... 29 Figure 12 . Construction Permits Are Relatively Time-Consuming .............................................................. 29 Figure 13 . Percent of Sales Reported to Tax Authorities: An International Comparison ............................. 30 Figure 14 . Trust in the Judiciary: percentage of respondents who believe that the courts w i l l uphold their contractual and property rights ..................................................................................................................... 31 Figure 15 . Number o f Days to Resolve a Payment Dispute in Court. by Country ....................................... 31 Figure 16 . Chile: Minimum Wage. Mean wage and Productivity ................................................................ 33 Figure 17 . Productivity and Labor Cost in Manufacturing ........................................................................... 33 Figure 18 . Main Reasons for not changing the Size o f the Labor Force ....................................................... 34
Figure 20 . Differences with Chile in the fraction of firms with Investments in R&D. Technology Licensing. and I S 0 Certification (same sectors. size, export and FDI status) ................................................................ 37 Figure 21 . Investments in Infrastructure in Latin America .......................................................................... 39 Figure 22 . Composite Index of Productive Infrastructure ............................................................................ 40 Figure 23 . Investment in Transport Infrastructure ........................................................................................ 42 Figure 24 . Percentage of Firms that reported breakage or theft in transit ..................................................... 43
Figure 19 . Chile's Knowledge Economy Index relative to OECD and emerging countries ......................... 36
5

LIST OF TABLES
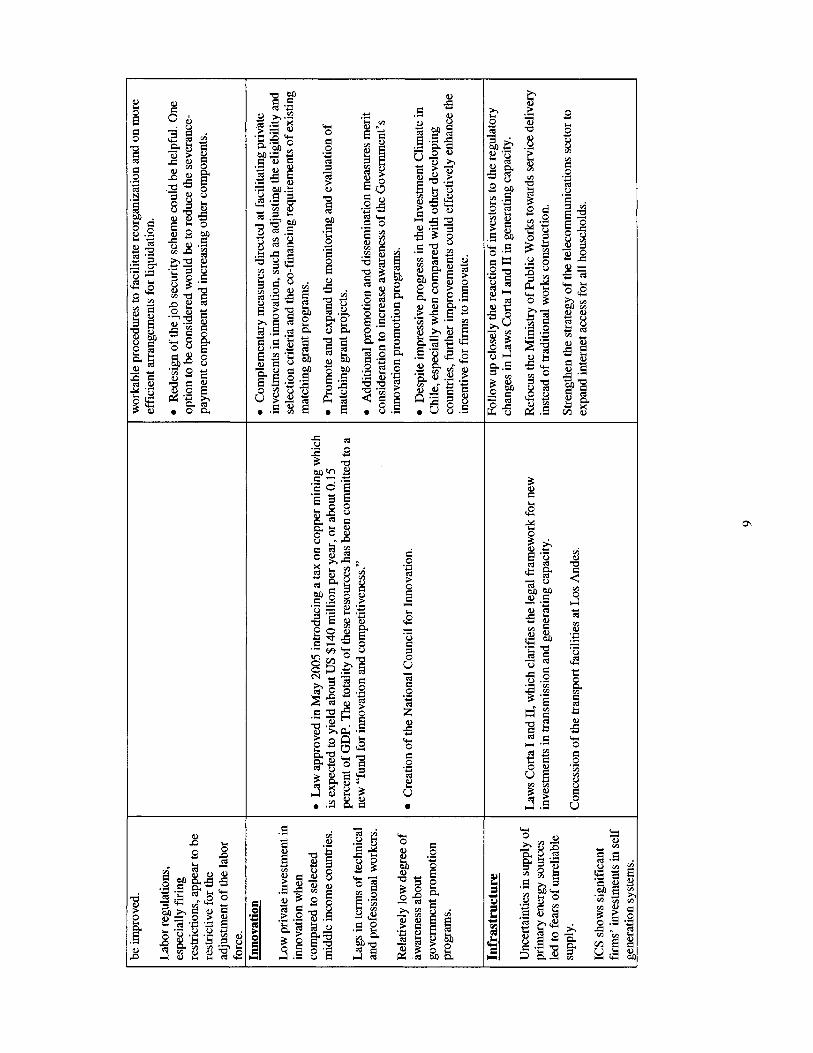
Table 1 . Chile at a Glance ............................................................................................................................... 7 Table 2 . Summary o f the Current Agenda and Main Messages of t h i s Report ............................................... 8
LIST OF BOXES
Box 1 . Productivity deceleration: cyclical or structural? .............................................................................. 15 Box 2 . What i s an Investment Climate Assessment? .................................................................................... 16
6
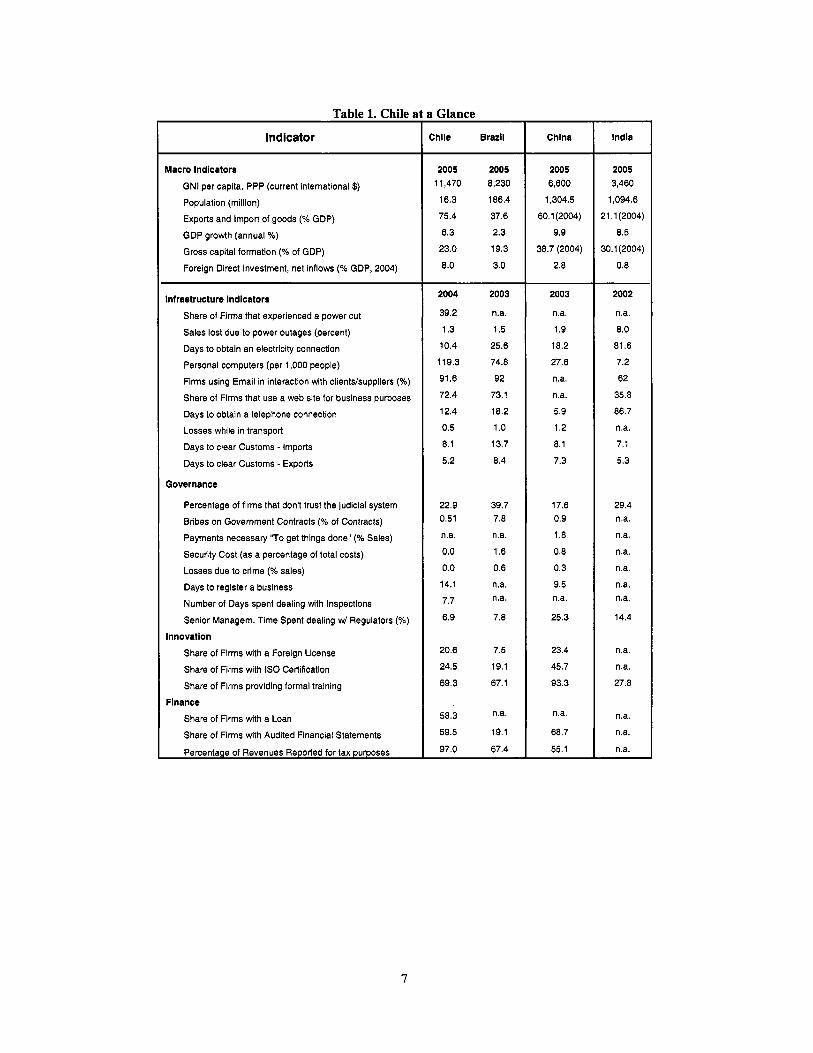
Table 1. Chile a
Indicator
Macro Indicators
GNI per capita, PPP (current international $)
Population (million)
Exports and Import of goods (“IO GDP) GDP growth (annual %)
Gross capital formation (?? of GDP) Foreign Direct Investment, net inflow (% GDP, 2004)
Infrastructure Indicators
Share of Firms that experienced a power cut
Sales lost due to power outages (percent) Days to obtain an electricity connection
Personal computers (per 1,000 people) Firms using Email in interaction with clients/suppliers (“IO)
Share of Firms that use a web site for business purposes Days to obtain a telephone connection Losses while in transport Days to clear Customs - Imports
Days to clear Customs - Exports
Governance
Percentage of firms that don’t trust the judicial system
Bribes on Government Contracts (% of Contracts) Payments necessary “To get things done” (% Sales)
Security Cost (as a percentage of total costs) Losses due to crime (% sales)
Days to register a business Number of Days spent dealing with Inspections
Senior Managem. Time Spent dealing w/ Regulators (“IO)
Innovation
Share of Firms with a Foreign License Share of Firms with IS0 Certification
Share of Firms providing formal training Flnance
Share of Firms with a Loan
Share of Firms with Audited Financial Statements
Percentage of Revenues Reported for tax purposes
I Glance
:bile Brazil
2005 2005 11,470 8,230
16.3 186.4
75.4 37.6
6.3 2.3
23.0 19.3
8.0 3.0
2004
39.2
1.3
10.4
119.3
91.6
72.4
12.4
0.5
8.1
5.2
22.9 0.51
n.a.
0.0
0.0
14.1
7.7
6.9
20.6
24.5
69.3
58.3
59.5
97.0
2003
n.a.
1.5
25.6
74.8
92
73.1
18.2
1 .o 13.7
8.4
39.7 7.8
n.a.
1.6
0.6
n.a. n.a.
7.8
7.5
19.1
67. I
n.a.
19.1
67.4
China
2005 6,600
1,304.5
60.1 (2004)
9.9
38.7 (2004)
2.8
2003
n.a.
1.9
18.2
27.6
n.a.
n.a. 5.9
1.2
8.1
7.3
17.6 0.9
1.8
0.8
0.3
9.5 n.a.
25.3
23.4
45.7
93.3
n.a.
68.7
55.1
India
2005 3,460
1,094.6
21.1(2004)
8.5
30.1 (2004)
0.8
2002
n.a.
8.0
81.6
7.2
62
35.8
86.7
n.a. 7.1
5.3
29.4 n.a. n.a.
n.a. n.a.
n.a. n.a.
14.4
n.a. n.a.
27.8
n.a. n.a.
ma.
7

E 0
1- 2
2 Y u
8 2 3
Y
m x e
$ ,n
.3 2 x E
0
0
.3 2 u
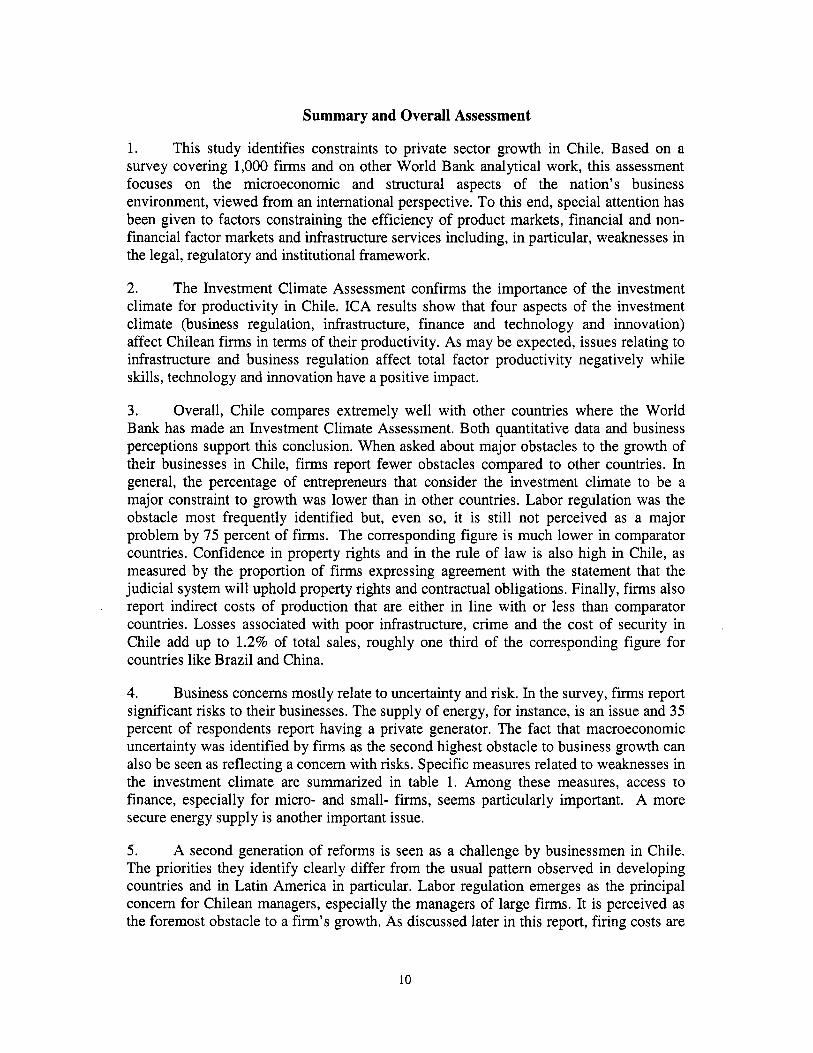
Summary and Overall Assessment
1. This study identifies constraints to private sector growth in Chile. Based on a survey covering 1,000 f i r m s and on other World Bank analytical work, this assessment focuses on the microeconomic and structural aspects o f the nation’s business environment, viewed from an international perspective. To this end, special attention has been given to factors constraining the efficiency o f product markets, financial and non- financial factor markets and infrastructure services including, in particular, weaknesses in the legal, regulatory and institutional framework.
2. The Investment Climate Assessment confirms the importance o f the investment climate for productivity in Chile. ICA results show that four aspects o f the investment climate (business regulation, infrastructure, finance and technology and innovation) affect Chilean firms in terms of their productivity. As may be expected, issues relating to infrastructure and business regulation affect total factor productivity negatively while ski l ls, technology and innovation have a positive impact.
3. Overall, Chile compares extremely well with other countries where the World Bank has made an Investment Climate Assessment. Both quantitative data and business perceptions support th i s conclusion. When asked about major obstacles to the growth of their businesses in Chile, f i r m s report fewer obstacles compared to other countries. In general, the percentage of entrepreneurs that consider the investment climate to be a major constraint to growth was lower than in other countries. Labor regulation was the obstacle most frequently identified but, even so, i t i s s t i l l not perceived as a major problem by 75 percent of f i r m s . The corresponding figure i s much lower in comparator countries. Confidence in property rights and in the ru le of law i s also high in Chile, as measured b y the proportion of f i r m s expressing agreement with the statement that the judicial system wi l l uphold property rights and contractual obligations. Finally, f i r m s also report indirect costs of production that are either in line with or less than comparator countries. Losses associated with poor infrastructure, crime and the cost of security in Chile add up to 1.2% of total sales, roughly one third o f the corresponding figure for countries l ike Brazil and China.
4. Business concerns mostly relate to uncertainty and risk. In the survey, f i r m s report significant risks to their businesses. The supply o f energy, for instance, i s an issue and 35 percent o f respondents report having a private generator. The fact that macroeconomic uncertainty was identified by f i r m s as the second highest obstacle to business growth can also be seen as reflecting a concern with risks. Specific measures related to weaknesses in the investment climate are summarized in table 1. Among these measures, access to finance, especially for micro- and small- f i r m s , seems particularly important. A more secure energy supply i s another important issue.
5. A second generation o f reforms i s seen as a challenge by businessmen in Chile. The priorities they identify clearly differ from the usual pattern observed in developing countries and in Latin America in particular. Labor regulation emerges as the principal concern for Chilean managers, especially the managers o f large f i rms. I t i s perceived as the foremost obstacle to a f i rm’s growth. As discussed later in t h i s report, firing costs are
10

identified as the main problem. This result seems to reflect the fact that labor market reforms are progressing only slowly in Chile, and they constrain the ability of f i r m s to compete in international and domestic markets. However, it also may reflect the fact that significant advance has already been made in other areas, such as regulatory policy and financial markets. The availability o f skilled workers also concerns Chilean businessmen. This i s an indication of the challenges faced by Chilean society in the area o f education, innovation and technology. These issues have been placed at the top of the agenda by government officials when focusing on prospects for long term growth in Chile.
6. Data from the Investment Climate survey confirms that Chilean private firms are less likely to invest in innovation than their counterparts from comparator countries. Compared with f i r m s of the same size, sector, export performance and foreign ownership profile operating in China, Brazil, Eastern Europe, India and South Africa, Chilean f i r m s invest less in R&D, technology licensing (except China), and I S 0 certification (except Brazil). Chile s t i l l has ample room for increasing i t s R&D investments in sectors where it has a revealed comparative advantage. On the positive side, the number o f joint ventures, the investment in fixed capital and the formal training offered to workers i s higher in Chile than in comparator countries - comparing f i r m s of the same size operating in the same industries.
7. Overall, the analysis confirms that an increased emphasis on innovation, technology and sk i l ls i s appropriate. In the econometric analysis, the estimated elasticities and the contribution to average productivity o f technology, innovation and sk i l l s are particularly significant. The results are consistent with business perceptions that the supply of sk i l l s as one of the most severe obstacles to growth. However, the outcome of this assessment suggests that the obstacles faced by f i rms in Chile are less severe than in other developing countries and that the profitability of f i r m s in Chile i s not particularly high (although not particularly low either). The evidence indicates that, while there are s t i l l obstacles to be dealt with in Chile, there i s room to focus more on engines of growth - and issues of technology, innovation and sk i l ls emerge as key focuses for public policy.
8. The government has been pursuing an active policy in this area, including the recent introduction o f a mining tax and an innovation fund. Nevertheless, additional measures could help promote higher private sector investments in innovation. They include complementary measures directed at facilitating private investment in innovation, such as reconfiguring the eligibility and selection criteria and the co-financing guidelines for existing matching grant programs. If there i s no demand for innovation on the part of the private sector, efforts to improve the S&T capacity on the supply side w i l l be ineffectual. Whi le matching grant schemes are an appropriate mechanism to promote private sector innovation, the effectiveness o f the schemes wi l l depend upon rigorous monitoring and evaluation, so that the eligibility and co-financing requirements may be adjusted if necessary. Finally, there i s a need to better inform private f i r m s of the available instruments. The Investment Climate survey revealed that, of the f i r m s that have not yet benefited from Government programs for innovation and competitiveness, more than half o f them are not aware that the programs exist. In the case o f the recently created PDP (Prograrna de Desarrollo de Proveedores), for instance, about three quarters o f the surveyed f i r m s did not know about the program.
11

FOREWORD The objective o f this study i s to evaluate constraints to private sector growth in Chile. Based on a survey covering 1,000 f i r m s and other Wor ld Bank analytical work, this assessment focuses on the microeconomic and structural dimensions o f the national business environment, viewed from an international perspective. T o this end, the study examines in detail factors constraining the efficiency o f product markets, financial and non-financial factor markets and infrastructure services including, in particular, weaknesses in the legal, regulatory and institutional framework.
In the simplest terms, the investment climate establishes the rules o f the game and the environment within which al l f i r m s must operate. This study focuses o n policies and institutions that influence the rate o f return and the risk associated with investment. I t includes regulatory policies, administrative procedures, infrastructure, as wel l as institutional issues such as the security o f property rights and the rule o f law.
This first volume presents the main results o f the analysis, including pol icy recommendations. More in-depth analyses are presented in Volume 11, which i s divided into seven chapters. The first chapter provides an overview o f the key questions and issues to be discussed and a background on methodology. The second chapter reviews recent economic trends in Chile. The third chapter presents a general statistical overview, including an econometric analysis o f the productivity o f f i r m s . The remaining chapters provide a detailed analysis o f four issues affecting the investment climate: access to and the cost o f finance, business and labor regulation, technology and innovation and infrastructure. There i s also a technical annex on the econometric methodology.
This assessment seeks to provide a diagnosis and policy recommendations for both the public and the private sectors in Chile. The Investment Climate Assessment (ICA) i s based on the Investment Climate Survey (ICs), but also goes beyond it. The report does not restrict itself to the results o f the survey-the I C s i s essentially a diagnostic tool that helps identify key bottlenecks to business growth. The report describes the main findings o f the survey and provides pol icy recommendations in selected areas. Other sources o f information are used to complement the analysis: background papers that were prepared in selected areas to complement the findings o f the I C s and other documents prepared by the World Bank, including the World Bank Country Assistance Strategy, the New Economy Study (2004) and the recent Development Policy Review (DPR).
To the extent possible, the views and the performance o f Chilean f i r m s are compared to those observed in fast growing economies and selected middle income countries. The I C s data base allows for international comparisons, because a core group o f questions i s asked in every country. China and India were chosen as comparators because they have been growing at a fast pace, at an annual average o f 5% in per capita terms, attracting a natural interest in the successful policies adopted by these countries. Benchmarking with Lat in America i s also important because o f the common institutional and economic background, and Brazi l was selected as a comparator. South Africa, Malaysia and selected countries o f East Europe (Czech Republic, Poland and Slovakia) were included as comparators as well.
12
BACKGROUND
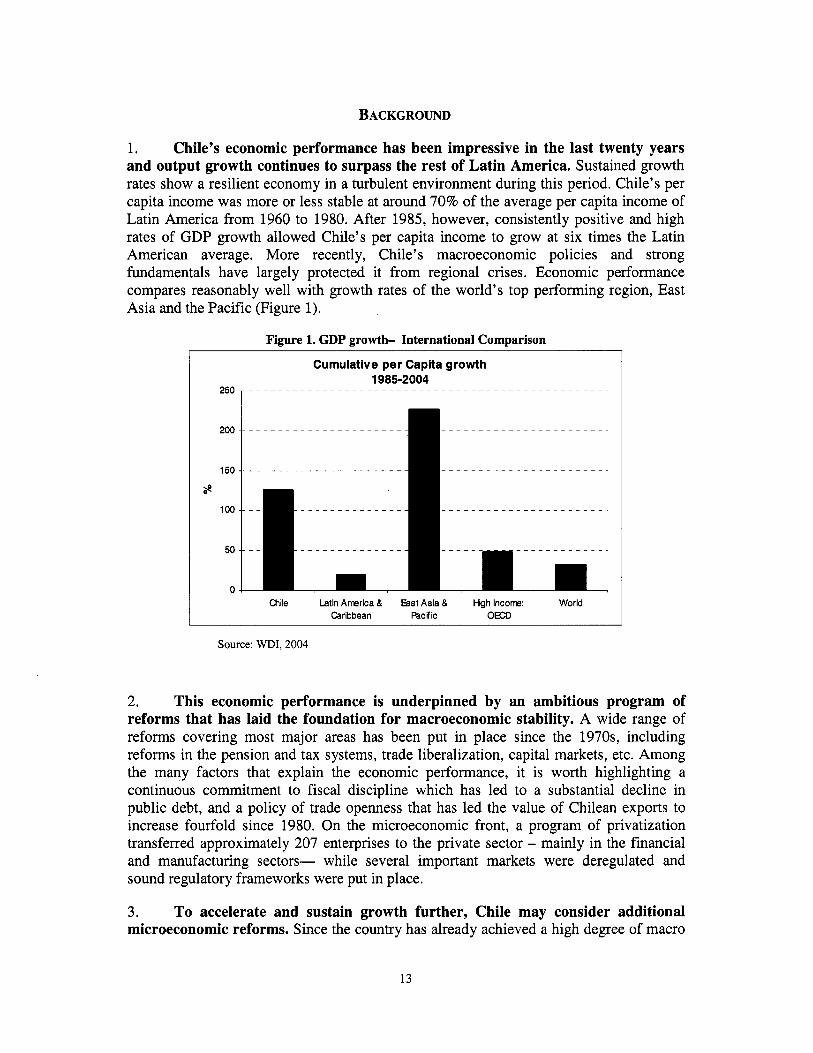
1. Chile’s economic performance has been impressive in the last twenty years and output growth continues to surpass the rest of Latin America. Sustained growth rates show a resilient economy in a turbulent environment during this period. Chile’s per capita income was more or less stable at around 70% of the average per capita income of Latin America from 1960 to 1980. After 1985, however, consistently positive and high rates of GDP growth allowed Chile’s per capita income to grow at six times the Latin American average. More recently, Chile’s macroeconomic policies and strong fundamentals have largely protected it from regional crises. Economic performance compares reasonably well with growth rates o f the world’s top performing region, East Asia and the Pacific (Figure 1).
Figure 1. GDP growth- International Comparison
250
200
150
ae 100
50
0 Chile Latin America & East Asia & Hgh income: World
Caribbean Pacific OECD
Source: WDI, 2004
2. This economic performance is underpinned by an ambitious program of reforms that has laid the foundation for macroeconomic stability. A wide range of reforms covering most major areas has been put in place since the 1970s, including reforms in the pension and tax systems, trade liberalization, capital markets, etc. Among the many factors that explain the economic performance, it i s worth highlighting a continuous commitment to fiscal discipline which has led to a substantial decline in public debt, and a policy of trade openness that has led the value o f Chilean exports to increase fourfold since 1980. On the microeconomic front, a program of privatization transferred approximately 207 enterprises to the private sector - mainly in the financial and manufacturing sectors- while several important markets were deregulated and sound regulatory frameworks were put in place.
3. To accelerate and sustain growth further, Chile may consider additional microeconomic reforms. Since the country has already achieved a high degree of macro
13
stability and an very good regulatory framework, it would be opportune to focus on a new round of microeconomic reforms aimed at further increasing long term economic growth. A new round of reforms may be needed as an additional impetus to growth because the macro and micro reforms initiated in the 1970s have already been fully deployed.
4. I n terms of human capital, Chile has almost achieved universal primary and secondary enrollment but still faces significant challenges. There i s urgent need to improve the quality of education and the equity o f education opportunities, as evidenced by comparing test scores with those o f countries with a similar per capita income, or a similar level of government expenditure per capita on primary and secondary education. Chile does not have a sufficient number o f technical and professional workers and achievement in primary school mathematics i s lagging.
5. Increasing emphasis has been placed on how to improve education and increase the adoption of innovatiodtechnology. Innovation has been placed at the top o f Government's priorities because greater innovation by both the public and private sectors wi l l not only increase long term growth but wi l l also help to reduce poverty and inequality. Despite major improvements in incentives and in infrastructure for innovation, international comparisons s t i l l reveal significant weaknesses in the areas o f education and innovative capacity. For a natural resource-rich country l i ke Chile, i t i s critical that sk i l ls and technology be in place to fully exploit i t s natural resources.
6. Building a sound environment for private sector growth requires a continuous program of reforms in several areas. Besides innovation, as discussed in a recent World Bank report, sustained high growth requires an efficient allocation of factors of production. As new f i r m s enter the market and less efficient ones leave it, a reallocation o f factors takes place and higher factor productivity i s achieved. The key i s having in place a private sector environment or investment climate that allows for the efficient entry and exit of f i r m s and the reallocation o f factors of production'. Chile has succeeded in improving the business environment in the last 25 years, and today it has an investment climate that compares favorably with many other countries. Nevertheless, there are opportunities for further improvement in areas such as labor regulation, competition policies, credit markets and the overall business regulatory environment. This report attempts to identify the remaining impediments and opportunities to stronger growth with new evidence from the Investment Climate Survey, which i s based on data collection from nearly 1000 f i r m s in 5 regions and 9 industries in Chile.
' World Bank (2005) DPR, p.62
14
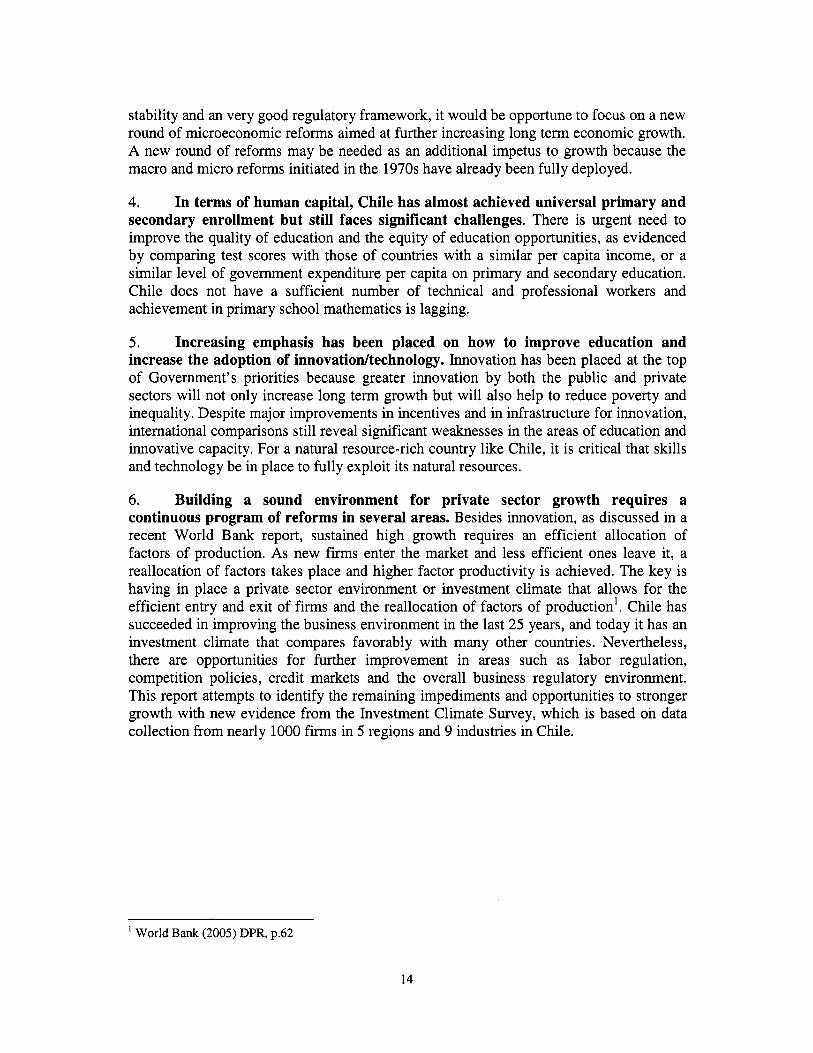
Trends in Potential Output
s based on ENIA . Source: Ministry of Finance
See World Bank (2005) and chapter 2 o f volume I1 of this report.
15

te investment a
xperience 111 a range
en August and December 2004, with a
GENERAL FINDINGS
7. Chile compares extremely well with other countries where the World Bank has undertaken Investment Climate Assessments. Both quantitative data and business perceptions support that conclusion. When asked about the major obstacles to growth o f their businesses in Chile, f i r m s report fewer and less serious obstacles compared with other c ~ u n t r i e s . ~ In general, the percentage o f entrepreneurs that consider the investment climate to be a major constraint to grow was lower than in other countries. Labor regulation was the obstacle most frequently identified but, even so, it i s s t i l l not perceived as a major problem by 75 percent of firms. The corresponding figure i s much
Adapted from World Bank (2005), El Salvador Investment Climate Assessment,
In order to evaluate which are the most important investment climate constraints affecting Chilean firms, t h i s report uses both subjective and objective indicators. Greater emphasis i s placed on the latter. Perceptions, however, can help identify some constraints. A five-point scale i s used, ranging from extremely severe to not important. Figure 2 below sums up the findings, indicating the percentage o f firms that consider the obstacle as “severe” and “extremely severe”.
16

lower in comparator countries. The same applies to macroeconomic uncertainty which was ranked second by Chilean f i r m s . Yet only 25 percent o f f i r m s considered it a severe or very severe problem, while in Brazil, for instance, the percentage i s three times higher. Perception-based measures suggest that business managers in Chile are not greatly concerned about any o f the nineteen areas covered by the survey. No t surprisingly, the importance attached by respondents to the perceived obstacles to a f i r m s ’ growth in Chile clearly differs f rom the pattern observed in other developing countries and in Lat in America in particular. A greater weight i s given to problems l inked with a second generation o f reforms. That may suggest that Chile has already successfully tackled a first round o f micro reforms, but it also highlights the more complex challenges that l ie ahead.
Bectricity Cost of financing
Tax Addnistration
Figure 2. Entrepreneurs’ perceptions of obstacles to growth
17.8% 17.7%
15.4%
Source: ICs
8. Managers were more likely to be concerned about labor regulations, macroeconomic uncertainty, labor skills, informal practices, access to financing and tax rates than other aspects of the investment climate. Labor regulation emerges as the principal concern for Chilean managers, especially the managers o f large f i rms. As discussed later in this report, firing costs are identified as the key constraint. This result seems to confirm the fact that labor market reforms are progressing only slowly in Chile and are constraining firms in their ability to compete in international and domestic markets. However, fact that labor regulations are cited as the most important obstacle to company growth may indicate that significant advances have already been made in other areas, such as regulatory pol icy and financial markets.’ Macroeconomic uncertainty and four other issues fol low closely behind labor regulation as a concern for managers. Hence, it i s difficult to single out one key issue perceived by f i r m s to be an overriding concern.
Furthermore, the survey was made in 2004, when the issue of labor regulation was being widely debated.
17
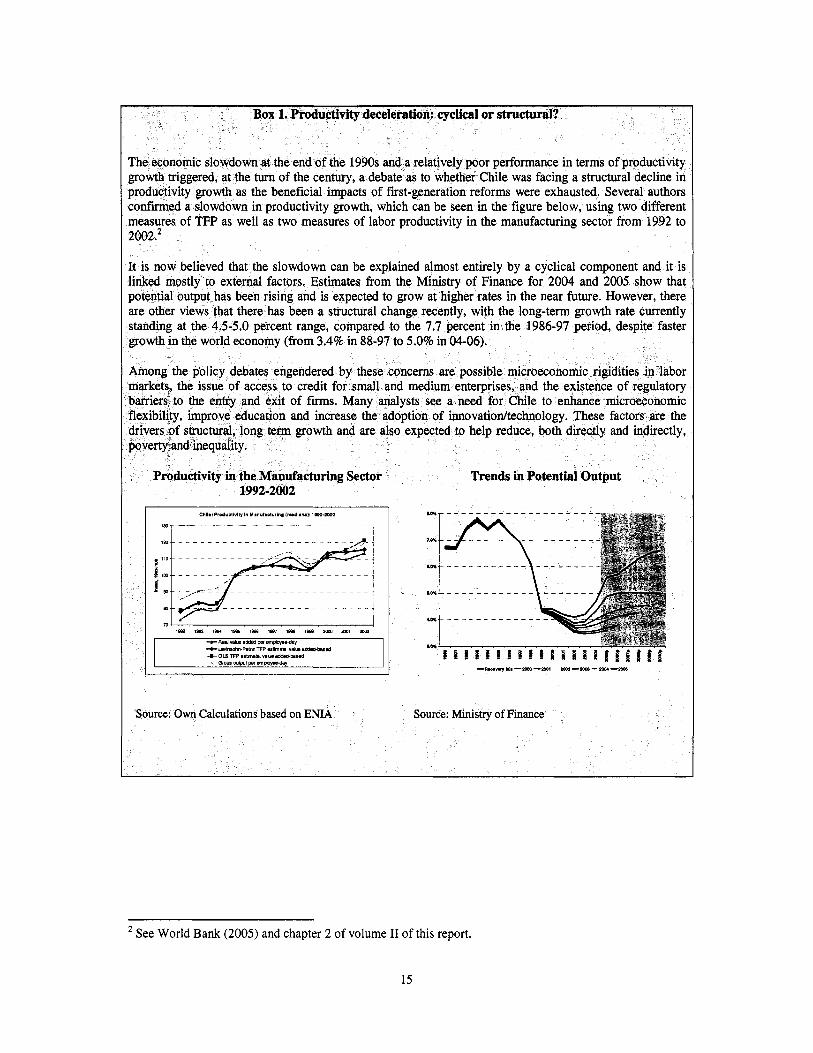
Figure 3. Perceptions of Obstacles to Growth Major Obstacle by Country
(Percentage of entrepreneurs that considered the obstacle as severe or very severe)
90
80
70
60
50
40
30
20
10
0
a9
-. 04
Chile - Labor Brazil - Tax China - Tax India - South Africa Poland - Tax Regulation Rates Rates Corruption - Skills of Rates
Workers
Source: ICs
9. Confidence in property rights and in the rule of law i s high in Chile. Trust in the decisions of government officials i s greater in Chile than in seven comparator countries. Chile has the largest share of f i r m s expressing agreement with the statement that the decisions of public officials are predictable. An even a higher proportion of f i r m s (49 percent) express agreement with the statement that the judicial system wil l uphold
' property rights and contractual obligations.
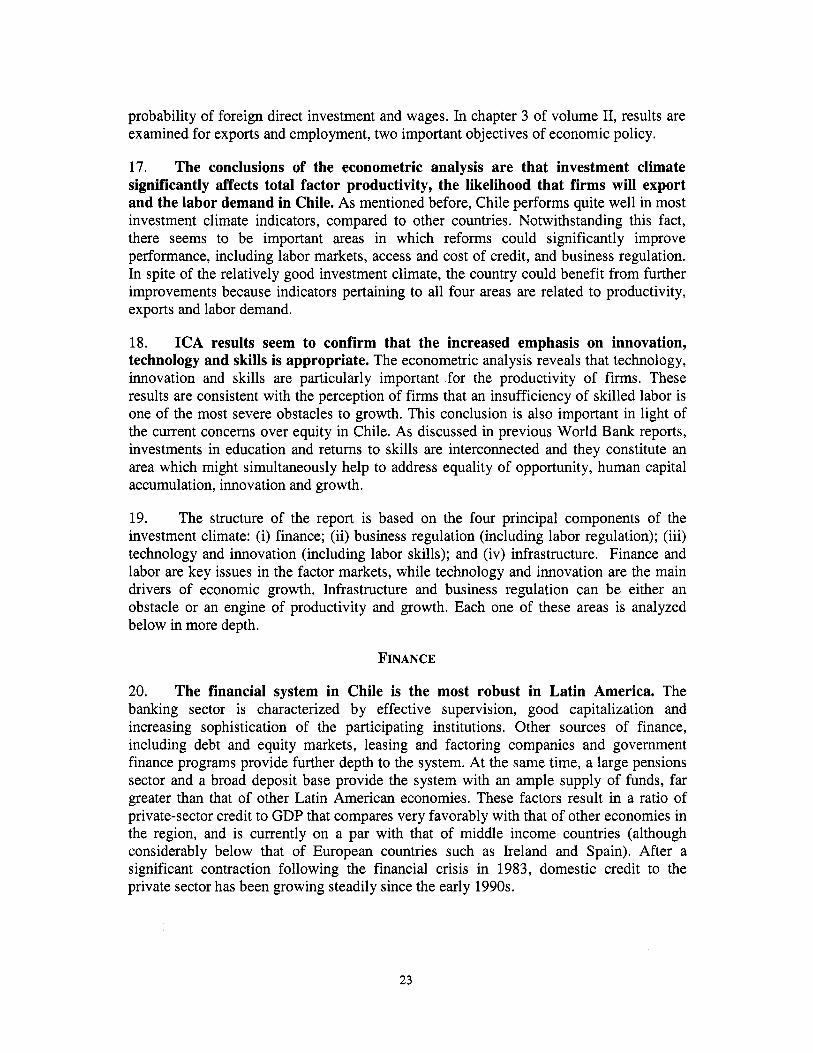
10. Firms in Chile report indirect costs of production that are either in line with or less than comparator countries. The ICs allows us to calculate indirect costs that f i r m s face in the production process, stemming from poor infrastructure, crime and government regulation. These objective measures of costs are consistent with perceptions. Losses associated with poor infrastructure, crime and the cost of security in Chile add up to 1.2% of total sales, roughly one third of the corresponding figures for countries l ike Brazil and China and slightly higher than the estimate for Poland.
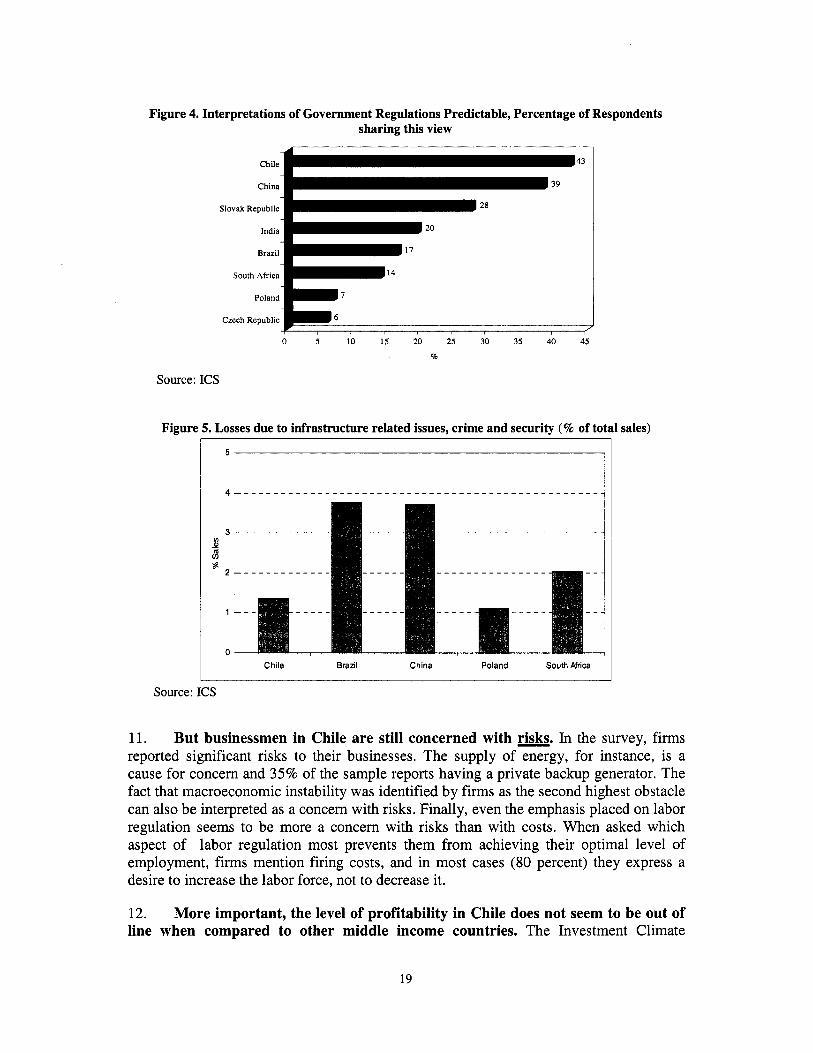
Figure 4. Interpretations of Government Regulations Predictable, Percentage of Respondents sharing this view
Source:
43 Chile
China 39
Slovak Republic 28
India 20
17 Brazil
South Africa 14
_ _ _ _ . . _ _ ~ _ _ _ r
0 5 I O 15 20 25 30 35 40 45
'KO
ICs
Figure 5. Losses due to infrastructure related issues, crime and security (% of total sales) I
5
4
3 a I * *
1
0 Chile Bradl China Poland South Africa
Source: ICs
11. But businessmen in Chile are still concerned with risks. In the survey, f i r m s reported significant risks to their businesses. The supply o f energy, for instance, i s a cause for concern and 35% of the sample reports having a private backup generator. The fact that macroeconomic instability was identified by f i r m s as the second highest obstacle can also be interpreted as a concern wi th risks. Finally, even the emphasis placed on labor regulation seems to be more a concern with r isks than with costs. When asked which aspect o f labor regulation most prevents them f rom achieving their optimal level o f employment, f i r m s mention firing costs, and in most cases (80 percent) they express a desire to increase the labor force, not to decrease it.
12. More important, the level of profitability in Chile does not seem to be out of line when compared to other middle income countries. The Investment Climate
19

Surveys permits a comparison o f profitability between countries. Profitability was estimated for manufacturing f i r m s in four comparator countries excluding indirect costs and depreciation because this data were not available for a l l countries. For the median Chilean enterprise, profitability was about 24.2 percent in 2004, higher than in Poland (17.4 percent), but lower than in South Africa (25 percent), Brazil (29.4 percent) and India (34.4 percent). These are approximate numbers, but the important point to note i s that profitability, while lower, i s comparable to that of other middle income countries where Investment Climate Surveys have been completed.
Figure 6. Profitability of the median firm in the manufacturing sector - International Comparison
Brazil' -I
0% 5% 10% 15% 20% 25% 30% 35% 40%
Profitability i s calculated as (Total Sales - Total Material Cost -Labor Cost - Electricity Cost)/ Sales * Estimate based on direct cost of materials instead of total material cost Source: ICs
13. Econometric analysis confirms the expected association between the investment climate and the productivity of firms. A number of investment climate indicators drawn from the Chile ICs were used as explanatory variables for productivity. Factors that enhance or detract from the competitiveness of manufacturing f i r m s in Chile were identified using statistically significant results from the regressions. The econometric methodology developed by Escribano and Guasch (2005) was employed in t h i s analysis. Different specifications of the production function were examined in order to get robust empirical elasticities for policy analysis. For purposes of the econometric analysis, the investment climate (IC) was separated into four component parts: (i) infrastructure; (ii) governance (including red tape and crime); (iii) finance; and (iv) quality, innovation and skil ls. Data was drawn from f i r m s having similar characteristics with respect to location, industry group, size, and other factors. The detailed results as well as details of the methodology are presented in the Annex.
20

14. The overall results of the ICs show that all four component parts of investment climate affect the productivity of Chilean firms. The results are summarized in Figure 7 and they indicate that three components of the investment climate in particular have a statistically significant association with productivity. Red tape, corruption and crime have, in general, a significant negative impact upon productivity. An increase of 1 percent in the number of inspections results in a decrease of 0.1 percent in productivity. Infrastructure shortcomings such as power outages and shipment losses have a strong negative effect. An increase o f 1 percent in the number o f days required for exports to clear customs reduces productivity by 0.1 percent. There i s strong evidence that labor training and innovation - as measured by the share of staff engaged in R&D - increase productivity, with a strong positive impact in the case of in- firm training. The experience o f the manager i s also important. Finally, with respect to finance, a l ine of credit was the only factor found to have a significant positive impact on the productivity o f f i r m s . Those f i r m s that have opened a l ine o f credit are 3 percent more productive.
Figure 7. Productivity Elasticities and Semielasticities with respect to I C variables- Average Levels of OLS Coefficients
In f rast ructures Qual i ty , Other Control Variables Red Tape,
Corruption and liInance Innovation and
0.3 0.25
0.2 0.15
0.1 0.05
0 -0.05
-0.1 -0.15
-0.2
Crime
nl I n
-0.05
1.1 1.2 1.3 1.4 2.1 2.2 2.3 2.4 3.1 1.1 Days to clear customs for exports. 1.2 Power outages. 1.3 Slipment losses. 1.4 Internet page. 2.1 Security. 2.2 Number o f inspections. 2.3 Cost o f entry. 2.4 Absenteeism. 3.1 Financing line program.
Labor S k i l l s U.26 r $4
0.005 ,ii',, u -0*01
-0.09
I
4.1 4.2 4.3 4.4 5.1 5.2 5.3 5.4 5.5 5.6 4.1 R + D . 4.2 Internal training. 4.3 University staff. 4.4 Experience o f the manager. 5.1 Incorporated company. 5.2 Foreign direct investment. 5.3 Exporter. 5.4 Capacity utilization. 5.5 Rent land. 5.6 Trade union.
*When the I C variable i s not expressed in log form, the estimated coefficient i s generally described as a productivity-IC semi-elasticity (in yellow). While the constant productivity-IC elasticity measures the percentage change in productivity induced by a percentage change in the I C variable, the semi-elasticity coefficient multiplied by 100, measures the percentage change in productivity induced by a unitary change in the I C variable. Source: Own Calculations based on ICs.
21

15. Quality, innovation and labor skills all have a significant positive impact on average productivity. Figure 8 shows the impact of average IC variables on average (log) productivity. The average impact of IC variables on productivity of Chilean f i r m s can be assessed by taking into account the elasticities and semielasticities of each variable measured at their sample mean (see Annex for details). For infrastructure the two most important factors affecting average productivity are power outages (-6.98 percent) and shipment losses (-6.91 percent). As far as business regulations are concerned, the cost of entry has the highest coefficient but it only represents -0.3 1 percent in terms of average productivity. Having a line of credit could account for 2 percent of average (log) productivity. Finally, with regard to quality, innovation and labor ski l ls , and staff with at least one year of university studies represents 6.51 percent of average productivity, despite presenting a very low coefficient (0.005), while having an experienced manager represents almost 30 percent of average productivity.
Figure 8. Average Productivity Impact (Gains and Losses) of Investment Climate Variables- Aggregate Level
%
Infrastructure
120
40
20
-20
-40
~i~~~~ Quality, Innovation and Other Control Variables Red Tape, Corruption and
Crime Labor s t i l l s
1.1 1.2 1.3 1.4 2.1 2.2 2.3 2.4 3.1 4.1 4.2 4.3 4.4 5.1 5.2 5.3 5.4 5.5 5.6
1.1 Days to clear customs to exports (log). 1.2 Average duration of power outages. 1.3 Shipment losses. 1.4 Internet page. 2.1 Security. 2.2 Number of inspections. 2.3 Cost of entry. 2.4 Absenteeism. 3.1 Financing Line Program.
4.1 R + D . 4.2 Internal training. 4.3 University staff. 4.4 Experience of the manager. 5.1 Incorporated company. 5.2 Foreign direct investment. 5.3 Exporter. 5.4 Capacity utilization. 5.5 Rent land. 5.6 Trade Union.
Source: Own Calculations. ICs data
16. I n addition, the investment climate affects the demand for labor and the prospects that a firm may become an exporter. The ICA supports the conclusion that that both exports and employment are directly and indirectly affected by the investment climate. A simultaneous equation model was employed to assess the impact of the investment climate on such factors as the probability of exporting, labor demand, the
22
probability of foreign direct investment and wages. In chapter 3 of volume 11, results are examined for exports and employment, two important objectives o f economic policy.
17. The conclusions of the econometric analysis are that investment climate significantly affects total factor productivity, the likelihood that firms will export and the labor demand in Chile. As mentioned before, Chile performs quite well in most investment climate indicators, compared to other countries. Notwithstanding this fact, there seems to be important areas in which reforms could significantly improve performance, including labor markets, access and cost of credit, and business regulation. In spite of the relatively good investment climate, the country could benefit from further improvements because indicators pertaining to a l l four areas are related to productivity, exports and labor demand.
18. ICA results seem to confirm that the increased emphasis on innovation, technology and skills i s appropriate. The econometric analysis reveals that technology, innovation and sk i l ls are particularly important for the productivity of f i r m s . These results are consistent with the perception of f i r m s that an insufficiency o f skilled labor i s one of the most severe obstacles to growth. This conclusion i s also important in light of the current concerns over equity in Chile. As discussed in previous World Bank reports, investments in education and returns to sk i l ls are interconnected and they constitute an area which might simultaneously help to address equality o f opportunity, human capital accumulation, innovation and growth.
19. The structure o f the report i s based on the four principal components of the investment climate: (i) finance; (ii) business regulation (including labor regulation); (iii) technology and innovation (including labor skills); and (iv) infrastructure. Finance and labor are key issues in the factor markets, while technology and innovation are the main drivers of economic growth. Infrastructure and business regulation can be either an obstacle or an engine of productivity and growth. Each one o f these areas i s analyzed below in more depth.
FINANCE
20. The financial system in Chile is the most robust in Latin America. The banking sector i s characterized by effective supervision, good capitalization and increasing sophistication of the participating institutions. Other sources of finance, including debt and equity markets, leasing and factoring companies and government finance programs provide further depth to the system. At the same time, a large pensions sector and a broad deposit base provide the system with an ample supply o f funds, far greater than that o f other Latin American economies. These factors result in a ratio of private-sector credit to GDP that compares very favorably with that of other economies in the region, and i s currently on a par with that of middle income countries (although considerably below that of European countries such as Ireland and Spain). After a significant contraction following the financial crisis in 1983, domestic credit to the private sector has been growing steadily since the early 1990s.
23

(%of GDP)
Domestic credit to private sector refers to financial resources provided to the private sector, such as through loans, purchases of non-equity securities, and trade credits and other accounts receivable, that establish a claim for repayment. For some countries these claims include credit to public enterprises. Source: World Bank WDI Database.
-Chile &High imome +Middie illcome +Latin Ametica
21. Financing of the corporate private sector i s highly dependent on bank credit, which has grown at a modest pace. The overall size of the banking sector’s credit portfolio has increased substantially over the past f ive years. However, this has been largely fuelled by growth in consumer credit and housing finance, while corporate credit has lagged behind. That i s due to the fact that large companies started to tap capital markets and external funding sources that offer cheaper finance than the domestic banking sector which, in turn, resulted in a significant reduction in bank lending. In addition, the banking sector has not been very active in seeking to increase lending to small and medium enterprises (SMES)~.
22. Funding through capital markets is largely closed to SMEs. The cost o f issuing domestic debt in Chile i s the highest among large Lat in American economies due, in part, to the stamp tax levied on financial transactions. As a result the smallest practical debt issue i s estimated at US$45 mi l l ion for domestic debt (US$200 mi l l ion for international issues), which was wel l above the financial capacity o f most Chilean f i rms. While many SMEs were listed in the stock market in the early 1990s, t h i s source o f funds has largely dried up for all but the largest companies, and n o new issues were made by SMEs from 1998 to 2004. That has been attributed to concerns over company profitability and deficiencies in corporate governance such as lack o f transparency and limited minority shareholder rights. By the same token, private equity i s s t i l l very limited,
The definition for firm size used in the present document corresponds to the standard World Bank classification based in the total number of permanent workers, Le. large (250+ workers); medium (50-249), small (16-49) and micro (<16). The sample covers establishments in nine industries and i s mainly concentrated in the manufacturing sector.
24

largely due to lack of interest of institutional investors following the poor track record of the sector.
23. Pension funds are the most important institutional investors in Chile, but their role as a source of finance is limited to large corporations. The investment portfolio of pension funds ( A F P s ) represents 70 percent of Chile’s GDP, making these funds the largest institutional investors, with a strong influence on the domestic debt and equity markets. However, their conservative investment requirements constrain the role of AFPs as direct suppliers of credit to private firms. In the bond market AFPs’ holdings are mostly concentrated on the highest-rated issues. Since AFPs build a buffer to protect against rating downgrades7, the universe of actual issuers i s limited to the very large f i rms. On the equity side, AFPs are allowed to invest only in companies listed as eligible. AFPs’ actual equity investments have been concentrated on the most liquid shares among those eligible, because investing in illiquid stocks could create price bubbles, or lock AFPs’ in their investments. A large proportion of the funds from AFPs to the private sector i s intermediated by banks, which receive considerable funding mainly through low-yield, short-term certificates of deposit acquired by AFPs. A judicious relaxation of the rigid investment regime of AFPs8, without undermining their financial integrity, may increase the flow of direct financing to the private sector although the impact would be gradual. Insurance companies, although smaller than the pension funds, also constitute important institutional investors, especially in instruments with longer term maturities.
24. Leasing and financial factoring appear to have considerable potential as sources of finance to the private sector, but their impact i s still very limited. The volume of leasing operations in Chile has grown substantially. In 2005, the leasing portfolio accounted for 4.3 percent of the total credit portfolio of banks, up from 2.1 percent in 1999. However, these operations appear to serve mainly large clients, while penetration into the SME sector i s s t i l l limited. By the same token, the volume of factoring transactions i s increasing although the industry i s s t i l l at an early development stage. There i s significant room for growth and competition, which would benefit clients. Proposed and recently introduced enhancements to the regulatory framework could help to expand the impact of both leasing and factoring as sources of finance to the private sector in Chile.
25. The Government of Chile participates actively in the provision of finance to the private sector. Banco Estado, a government-owned bank, i s the largest lender to smaller companies in Chile. I t focuses on those market segments that appear underserved by privately-owned commercial banks, such as small and micro enterprises, and f i r m s in higher-risk industries such as agriculture and fish farming. The government also provides financing indirectly through CORFO (a development entity that supports small and micro f i rms) and FOGAPE (a government fund that provides guarantees on loans to SMEs). The focus of FOGAPE and CORFO i s not particularly linked to innovative industries, but i s largely concentrated in domestic trade (both retail and wholesale) and on agriculture.
Since AFPs are not allowed to hold sub-inqestment grade bonds, holdings of debt rated at lower investment-grades creates the risk of substantial losses from illiquid bonds in case o f a downgrade. * For example, allowing a very moderate holding of sub-investment grade bonds, which would greatly reduce risks of holding lower investment-grade debt issues.
7
25

26. I f enacted, a proposed reform to the Capital Markets Law could strengthen the financial system. The proposed reform includes measures to improve corporate governance and enhance security for investors. It would strengthen the value o f a company’s collateral (especially important for smaller f i r m s that possess l imited assets to pledge as guarantees), and enhances prospects for the development of a venture capital sector.
27. Information gaps hamper access to credit, especially by SMJ3s. The inaccuracy and lack o f standardization o f financial information reported by SMEs has been cited as the reason why banks require collateral in order to lend. The introduction o f FECUPYME (a system that defines the reporting formats required for SMEs) in 2004 appears to be a step in the right direction. However, the full impact o f FECUPYME may take some time to materialize and so far i t s use has been very limited. Start-up requirements, the need to train companies in the use o f th i s reporting tool, and especially, the time required for banks to modify their credit processes are some o f the potential explanations for the limited use o f FECUPYME but there may be others that need to be investigated. At the same time, there may s t i l l remain issues related to the quality o f information because the accuracy and sufficiency o f the information self-reported by companies in the past has been questioned.
28. There i s plenty of short-term credit available, but collateral requirements constrain access to bank loans. Access to credit i s not just a question o f availability but also o f the terms and maturity needed by companies. While companies in Chile appear to have ample access to short-term credit, the availability o f longer term bank loans i s more restricted, and it does not appear to be strictly linked to the viability o f companies as measured by their profitability. Two major obstacles appear to limit access to longer-term credit. On the supply side there i s a lack o f transparency, especially among smaller companies, which impairs the ability o f banks to evaluate credit risk. Similarly, caps on interest rates can constrain the ability o f banks to correctly price credit to smaller f i rms . On the demand side, collateral i s an important consideration for banks to make credit available, and hence collateral requirements are perceived to be a major constraint for access to credit by companies surveyed.
29. Not surprisingly, firms in innovative industries find it more difficult to access credit. O n average, companies operating in industries that require constant innovation (e.g. biotechnology or IT) appear to have greater difficulty accessing bank loans than companies operating in more traditional industries. This may be explained by banks’ reliance on real estate as collateral. The assets o f f i r m s in innovative industries may be intangible (patents, software) and they may have a lower value as collateral. This problem i s exacerbated by the lack o f a wel l developed risk capital industry (which usually undertakes investments in innovative industries), and the l imited support f rom entities such as CORFO and FOGAPE. A recently created ‘Fund for Innovation and Competitiveness” may help to bridge the financing gap for these industries, fostering the development o f new forms o f venture capital.
26

Figure 10. Credit constraints by industry
Source: Investment Climate Survey Chile
Policy Recommendations
30. Enhance access to credit by underserved segments of the economy by mobilizing the positive experience with government programs. The guarantees program o f FOGAPE has facilitated access to credit for many companies that lack sufficient qualifying collateral. However, a significant proportion o f the guarantees are allocated to companies operating in retail and wholesale trade, while the data collected through the ICs shows that industrial sectors related to innovation face the most serious credit constrains. CORFO also supports a large number o f small and micro f i rms ' through second-tier financing and technical assistance. However, a large proportion of i t s operations" are concentrated in agriculture and livestock. I t would be helpful to review the economic sectors currently served by FOGAPE and CORFO in order to ensure that the government support targets those areas that a) are considered important for the economic development' in Chile, and b) are not already served by commercial financial institutions. Similarly, it would be useful to undertake an evaluation of the impact o f FOGAPE and CORFO's programs both in terms o f the benefit to client companies, and the effectiveness o f the programs as mechanisms to foster sustainable commercial financing to targeted sectors.
31. Enactment of the draft laws recently submitted to Congress would help enhance access to financing. The passing o f the Capital Markets 11 law would enhance the legal framework governing collateralized lending. I t would also facilitate access to credit by smaller prospective borrowers by enhancing the value of their collateral. Similarly, th i s law would probably make risk capital more readily available to SMEs (especially in areas related to innovation) by creating fiscal incentives for investors and enhancing the rules of corporate governance. B y the same token, the passing of another
Above 36,000 companies as o f March 2006. lo Estimated by the number o f companies, as opposed to the volume in monetary terms.
27
draft law that would create the legal framework for mobilizing reciprocal guarantees which could facilitate access to finance for SMEs. The establishment of a proposed central registry of mortgages and pledges could enhance the mobility of borrowers.
32. Facilitate the expansion of formal factoring services through a country-wide factoring platform. The untapped potential for financial factoring services appears high, given the number of prospective participants and the size of their portfolios. The new law on receivables (Ley de Titulo Ejecutivo de Fucturus) enacted in April 2005 significantly improves the viability of th i s service by enabling the electronic exchange of ownership of receivables and by strengthening their value in legal proceedings. The development of a country-wide financial factoring platform linking suppliers, factoring services and buyers such as that recently implemented by a development bank in Mexico may enhance significantly this industry by reducing risks and transaction costs while increasing competition.
33. Access to finance for smaller firms could be enhanced by a reform of the stamp tax and the cap on interest rates. The stamp tax has an important impact on the overall cost of credit and creates distortions in favor of loans with a longer maturity. Accordingly, the burden falls disproportionately on smaller companies, which have less access to long-term funding than larger ones. A tax reform that eliminated or decreased this tax rate could make it more attractive for small companies to seek credit. Eliminating the cap on interest rates could enhance the commercial appeal of micro borrowers for financial institutions. At the same time, the elimination of interest rate ceilings could enhance the interest of micro-entrepreneurs to work with financial institutions.
BUSINESS AND LABOR REGULATIONS
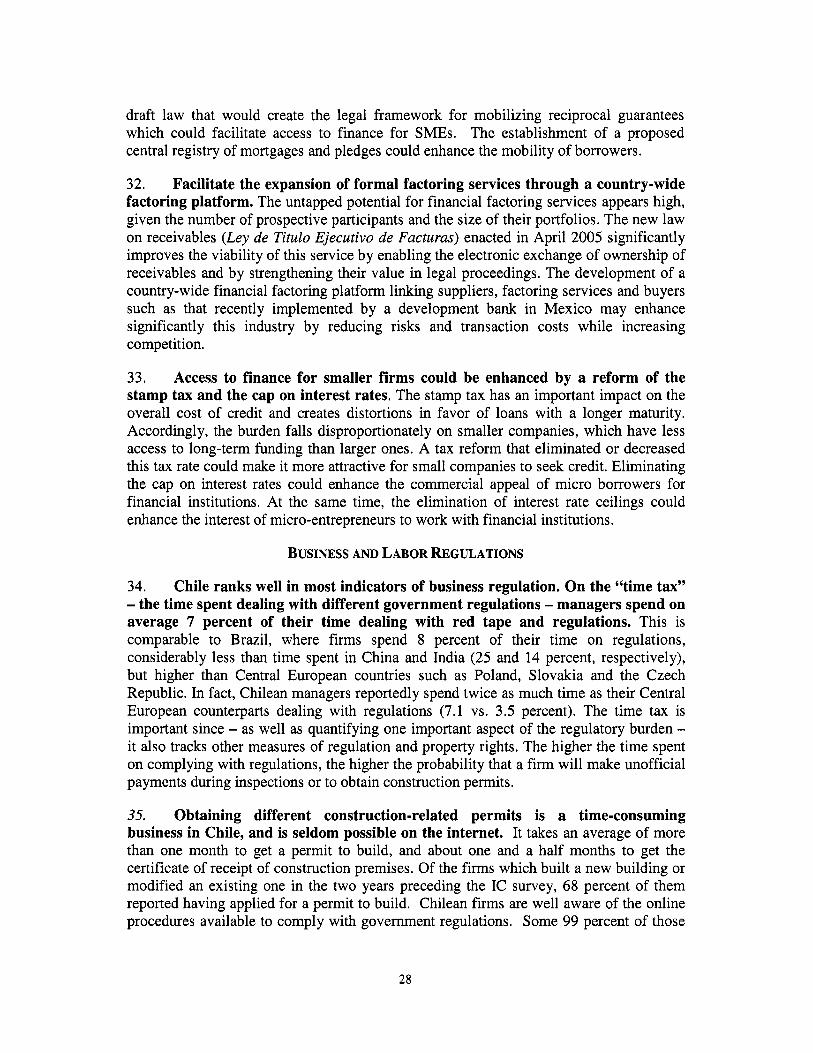
34. Chile ranks well in most indicators of business regulation. On the “time tax” - the time spent dealing with different government regulations - managers spend on average 7 percent of their time dealing with red tape and regulations. This i s comparable to Brazil, where f i r m s spend 8 percent of their time on regulations, considerably less than time spent in China and India (25 and 14 percent, respectively), but higher than Central European countries such as Poland, Slovakia and the Czech Republic. In fact, Chilean managers reportedly spend twice as much time as their Central European counterparts dealing with regulations (7.1 vs. 3.5 percent). The time tax i s important since - as well as quantifying one important aspect of the regulatory burden - it also tracks other measures of regulation and property rights. The higher the time spent on complying with regulations, the higher the probability that a firm wil l make unofficial payments during inspections or to obtain construction permits.
35. Obtaining different construction-related permits is a time-consuming business in Chile, and i s seldom possible on the internet. I t takes an average of more than one month to get a permit to build, and about one and a half months to get the certificate of receipt of construction premises. Of the f i r m s which built a new building or modified an existing one in the two years preceding the IC survey, 68 percent of them reported having applied for a permit to build. Chilean firms are well aware of the online procedures available to comply with government regulations. Some 99 percent of those
28
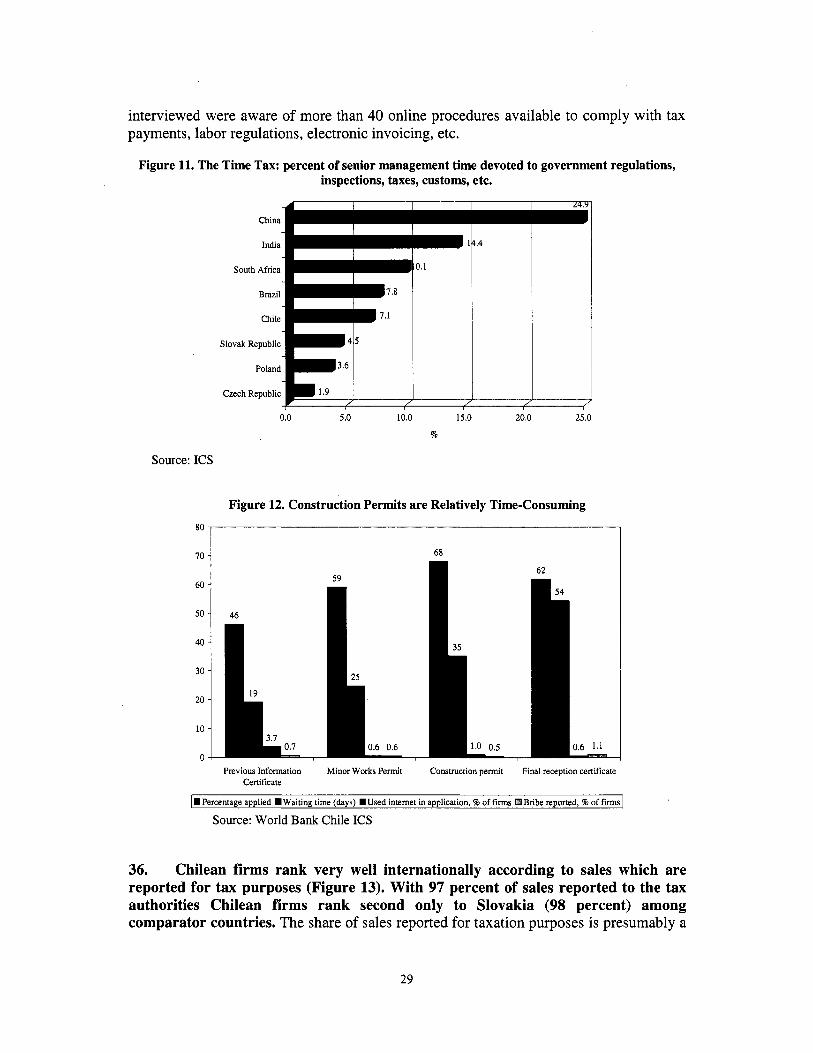
interviewed were aware of more than 40 online procedures available to comply with tax payments, labor regulations, electronic invoicing, etc.
Figure 11. The Time Tax: percent of senior management time devoted to government regulations, inspections, taxes, customs, etc.
China
India
South Africa
Brazil
Chile
Slovak Republic
Poland
Czech Republic
0.0 5.0 10.0 15.0 20.0 25.0
%
Source: ICs
Figure 12. Construction Permits are Relatively Time-Consuming 80
712 68 ,-
62 59
60 -
50 46
40 -
30 -
20 -
10 - 0.6 0.6
0 - Previous Information Minor Works Permit Construction permit Final reception certificate
Certificate
1 .Percentage applied Waiting time (days) W Used internet in application, % of firms c3 Bribe reported, 5% of firms 1 Source: World Bank Chile ICs
36. Chilean firms rank very well internationally according to sales which are reported for tax purposes (Figure 13). With 97 percent of sales reported to the tax authorities Chilean firms rank second only to Slovakia (98 percent) among comparator countries. The share of sales reported for taxation purposes i s presumably a
29

measure of the taxation burden and the efficiency of the tax administration system. The less complex the taxation system, with fewer exemptions and distortions, the better the compliance and the lower the opportunities to hide income (legally or illegally). Furthermore, the more efficient the collection, reporting and penalty system - the higher the degree of compliance. There i s not much variation in the share of sales reported by different types of f i r m s (classified by size and industry) - with al l f i r m s reporting between 96 and 98 percent of sales to the IRS. Therefore, the survey data suggest that there are no particular problems with the burden of corporate taxation - as perceived by the interviewed Chilean f i rms. However, tax rates are seen as problematic by 23 percent of interviewed f i r m s and are among the top five perceived constraints to business operation. In contrast, tax administration i s cited as a major or severe obstacle by only 14 percent of f i rms,
Figure 13. Percent of Sales Reported to Tax Authorities: A n International Comparison
97 Chile
South Afnca
Poland
I I I I I I I I I I
Brazil -61 I I China 5
/ / / / / / / / /
0 10 20 30 40 50 60 70 80 90 100
I
Source: ICs
37. One half of interviewed Chilean manufacturing companies express a strong degree of trust in the ability of the courts to defend their contractual and property rights. Confidence in the courts i s higher than in other comparator countries, and only a bit less than that expressed by Chinese ICs respondents (Figure 14). Conversely, only 14 percent of Chilean f i r m s distrust the courts - a share which i s the second lowest among the group of comparators. It i s also noteworthy that court users do not distrust the courts any more than non-users do. The share of either group that distrusts the courts i s a low 14 percent. The share of users that trust the courts i s lower than that of non-users (45 versus 52 percent), and the difference in means i s statistically significant at the 10 percent level. Court users are defined as f i r m s that report having been involved in a court case in the three years preceding the survey. Almost a third of manufacturing companies (31 percent) are court users according to t h i s definition, and so are 24 percent of surveyed non-manufacturing f i r m s .
30
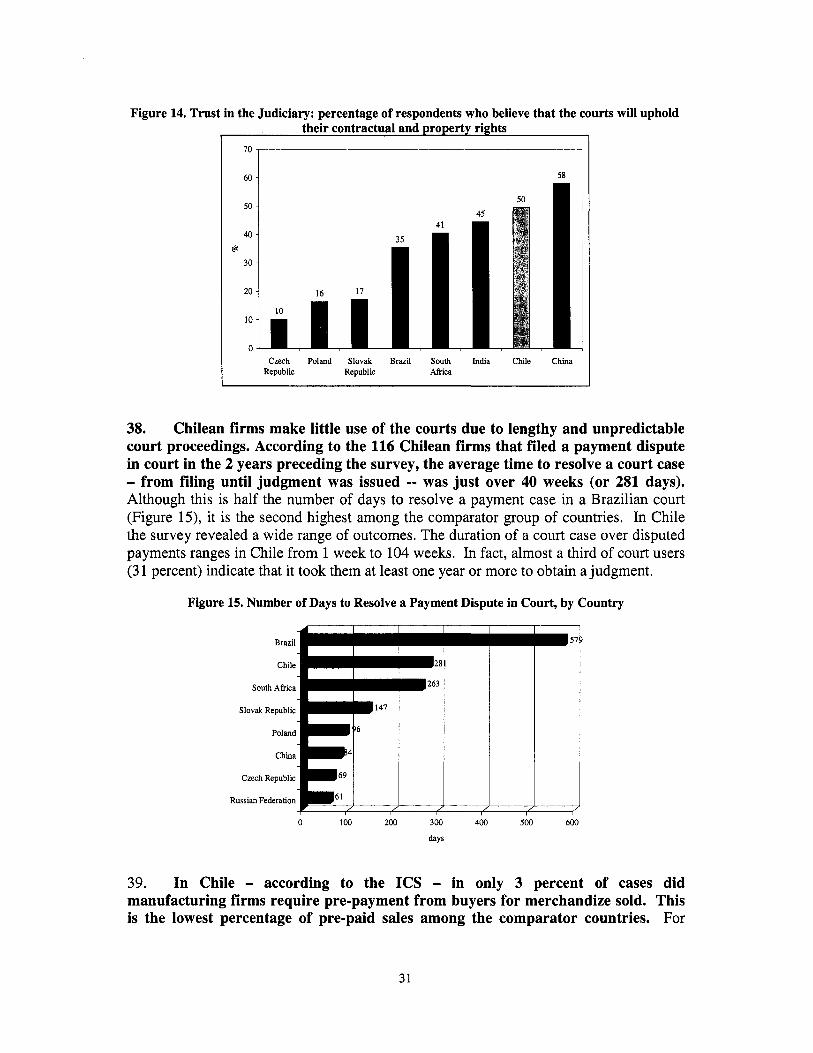
Figure 14. Trust in the Judiciary: percentage of respondents who believe that the courts will uphold their contractual and property rights
7
_____
70 nn 58 -"
50
40 g
30
20
10
0 Czech Poland Slovak Brazil South India Chile China
Republic Republic Afr ica
38. Chilean firms make little use of the courts due to lengthy and unpredictable court proceedings. According to the 116 Chilean firms that filed a payment dispute in court in the 2 years preceding the survey, the average time to resolve a court case - from filing until judgment was issued -- was just over 40 weeks (or 281 days). Although t h i s i s half the number of days to resolve a payment case in a Brazilian court (Figure 15), it i s the second highest among the comparator group of countries. In Chile the survey revealed a wide range of outcomes. The duration of a court case over disputed payments ranges in Chile from 1 week to 104 weeks. In fact, almost a third of court users (3 1 percent) indicate that it took them at least one year or more to obtain a judgment.
Figure 15. Number of Days to Resolve a Payment Dispute in Court, by Country
-_
Chile
South Africa
Slovak Republic
Poland
China
Czech Republic 69
61 Russian Federation
0 100 200 300 400 500 600
days
39. In Chile - according to the ICs - in only 3 percent of cases did manufacturing firms require pre-payment from buyers for merchandize sold. This i s the lowest percentage of pre-paid sales among the comparator countries. For
31
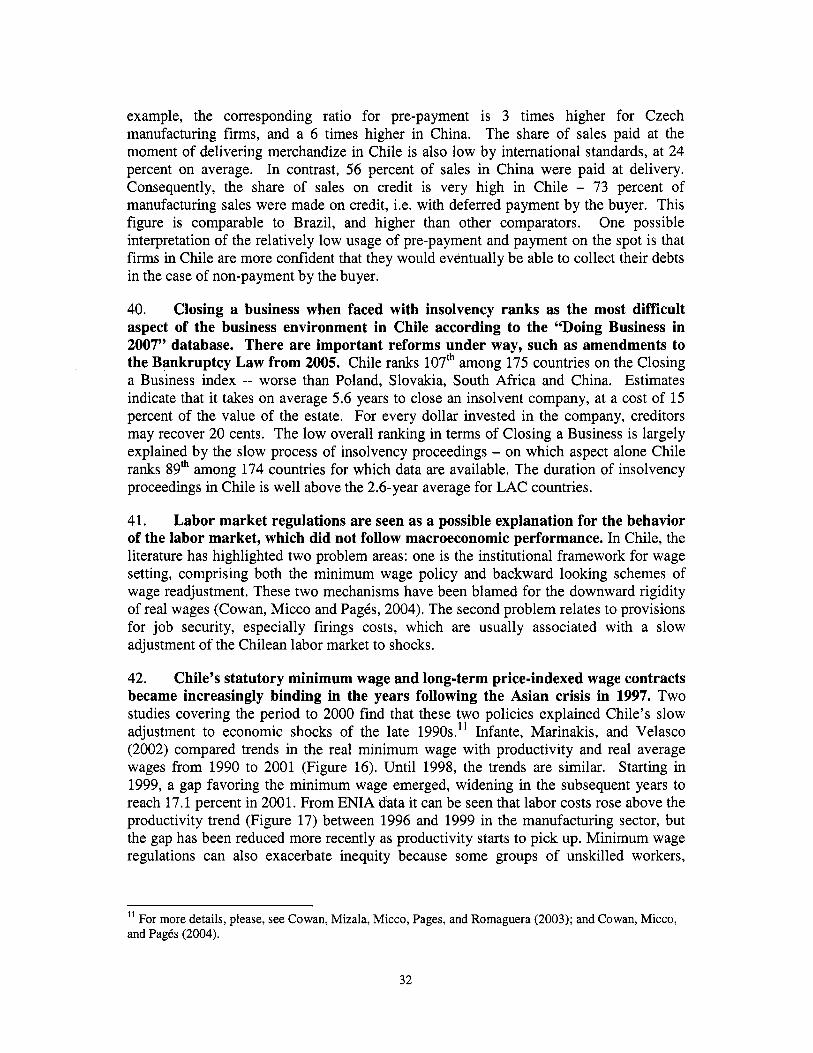
example, the corresponding ratio for pre-payment i s 3 times higher for Czech manufacturing f i rms, and a 6 times higher in China. The share of sales paid at the moment of delivering merchandize in Chile i s also low by international standards, at 24 percent on average. In contrast, 56 percent of sales in China were paid at delivery. Consequently, the share of sales on credit i s very high in Chile - 73 percent of manufacturing sales were made on credit, i.e. with deferred payment by the buyer. This figure i s comparable to Brazil, and higher than other comparators. One possible interpretation of the relatively low usage of pre-payment and payment on the spot i s that f i r m s in Chile are more confident that they would eventually be able to collect their debts in the case of non-payment by the buyer.
40. Closing a business when faced with insolvency ranks as the most difficult aspect of the business environment in Chile according to the “Doing Business in 2007” database. There are important reforms under way, such as amendments to the Bankruptcy Law from 2005. Chile ranks 107” among 175 countries on the Closing a Business index -- worse than Poland, Slovakia, South Africa and China. Estimates indicate that it takes on average 5.6 years to close an insolvent company, at a cost of 15 percent of the value of the estate. For every dollar invested in the company, creditors may recover 20 cents. The low overall ranking in terms of Closing a Business i s largely explained by the slow process of insolvency proceedings - on which aspect alone Chile ranks 89* among 174 countries for which data are available. The duration of insolvency proceedings in Chile i s well above the 2.6-year average for LAC countries.
41. Labor market regulations are seen as a possible explanation for the behavior of the labor market, which did not follow macroeconomic performance. In Chile, the literature has highlighted two problem areas: one i s the institutional framework for wage setting, comprising both the minimum wage policy and backward looking schemes of wage readjustment. These two mechanisms have been blamed for the downward rigidity of real wages (Cowan, Micco and PagCs, 2004). The second problem relates to provisions for job security, especially firings costs, which are usually associated with a slow adjustment of the Chilean labor market to shocks.
42. Chile’s statutory minimum wage and long-term price-indexed wage contracts became increasingly binding in the years following the Asian crisis in 1997. Two studies covering the period to 2000 find that these two policies explained Chile’s slow adjustment to economic shocks of the late 1990s.” Infante, Marinakis, and Velasco (2002) compared trends in the real minimum wage with productivity and real average wages from 1990 to 2001 (Figure 16). Until 1998, the trends are similar. Starting in 1999, a gap favoring the minimum wage emerged, widening in the subsequent years to reach 17.1 percent in 2001. From ENIA data it can be seen that labor costs rose above the productivity trend (Figure 17) between 1996 and 1999 in the manufacturing sector, but the gap has been reduced more recently as productivity starts to pick up. Minimum wage regulations can also exacerbate inequity because some groups of unskilled workers,
l1 For more details, please, see Cowan, Mizala, Micco, Pages, and Romaguera (2003); and Cowan, Micco, and Pages (2004).
32

especially the youngest, are likely to be worse off in terms of employment, while others are better off in terms of income.
Figure 16. Chile: Minimum Wage, Mean wage and Productivity
1990-2001
Index
200
180
180
140
12Cl
1W
BU
- A 147.9 ?
we0 isgt 1.w 1083 1884 IQM 1006 i e w ~ B B B IQW 2wo 2001
Source: Infante, Marinakis and Velasco (2002)
Figure 17. Productivity and Labor Cost in Manufacturing
130
120
8 110 5-
@ 100
J - c 90 U
80
70 1992 1993 1994 1995 1996 1997 1998 1999 2000 2001 2002
+Real value added per employeeday --.C Levinsohn-Petrin TFP estimate, value added-based + OLS TFP estimate, value added-based i - Total labor cost per employee-day -- Total labor cost per employee-day: unskilled -+T- Gross output per employee-day
Source: Own Calculations based on ENIA
33

43. The ICs indicates that firms see labor legislation, especially firing restrictions, as having a significant impact on the size of a firm's labor force. The ICs helps identify which aspect of labor regulation impacts most strongly on firms. ICs data show that 27 percent of f i r m s would l i ke to change the size of their labor force, while keeping constant the level of output. Among the 21 percent who wish to hire more people, 59 percent identify higher firing costs as a constraint to making the adjustment. This i s a greater issue than lack of flexibility in working hours (19 percent), minimum wages and obligatory benefits (10 percent) or union pressure (2.4 percent). Even though labor costs are felt principally when a worker i s fired, f i r m s cite that legislation i s a greater barrier to hiring workers. Similarly, of the 6 percent of f i r m s that wish to reduce the size of the labor force, nearly 77 percent cited firing restrictions. This result i s in l ine with a growing literature on labor market issues in Chile that identifies firing restrictions as one of the rigidities that affect labor market outcomes in Chile.I2
Figure 18. M a i n Reasons for not changing the Size of the Labor Force
High Firing Costs Deter Changes in Number of Permanent Employees
90 80 70 60 50 40 30 20 10 0
77
19
6 5 10
0
High firing costs Lack of flexibility High minimum Other laws and Others in working hours , salary and/or regulations about
obligatory contracting and benefits firing of workers
I Top reason to not increase current employment even if desired I Top reason to not decrease current employment even if desired
Source: ICs
Policy Recommendations
44. Chile has already made substantial efforts in making its national business environment conducive to opening and operating a business, especially in making government procedures available online and allowing for more transparency in the process of business regulation. As a result, Chile ranks 28' among 175 countries on the index of Ease of Doing Business (Doing Business in 2007). For instance, with respect to business registration - a process which tends to be time-consuming, procedurally burdensome and expensive in a number of comparator countries - Chile ranks 32nd. The
l2 See Gatica and Romaguera (2006), as well as Cowan and Micco (2006).
34

27 days needed to complete 9 procedures puts Chile above some OECD countries such as Switzerland and Belgium. Despite these very favorable international rankings, it i s worth noting that certain registrations - such as sanitary authorization or municipal licenses - are s t i l l rather time-consuming, taking more than 1 month to accomplish. Online compliance with those procedures i s very low - compared with the filing and payment of taxes, for example. One possible improvement may be to expand the use and the efficiency o f online procedures, and to provide more extensive public information about existing ones, which are underused at present (e.g. health permits by SESMA and ISP, registrations with the Labor Directorate, registration of trademarks with the Department of Industrial Property, etc.).
45. Problems remain in the area of construction permits - such as relatively long waiting times - and the Government could reduce those problems through better use of online processes. At present, less than 5 percent o f applicants for construction permits and licenses make use of online processes to get them.
46. In terms of labor regulation, redesigning the job security scheme seems to offer good prospects for increasing employment. The I C A reinforces the view that firing costs are the most important constraint for f i r m s in Chile as far as labor regulations are concerned. An option to be considered, as suggested in recent document^'^, would be to reduce the severance-payment component and to increase other components. This would maintain the overall amount of job security while avoiding distortions in f i r m s ’ hiring and firing decision^.'^
INNOVATION
47. Despite significantly better incentives regime and an improved infrastructure for innovation, international comparisons suggest that the country st i l l has relative weaknesses in the areas of education and capacity for innovation. The World Bank Knowledge Economy Index shows that Chile has an outstanding performance in the economic and incentive regime. Thus, compared to countries with similar levels of income, Chile gets very high marks for the quality o f regulations, the supervision of financial institutions, the degree of competition in the domestic market, and the prevalence of the rule of law (see upper right quadrant o f figure 19). Chile’s performance with regard to the infrastructure for innovation i s also outstanding, as confirmed by the development of electronic government, the use o f computers and the internet, and the investments in telecommunications (upper left quadrant o f figure 19). In contrast, the country underperforms in most indicators of innovative capacity (lower left quadrant) and human capital development (lower right quadrant). While some o f the corresponding indicators are potentially controversial - e.g. one could argue that having a low
l3 See (World Bank 2005), as well as Gatica and Romaguera (2006). As stated in this last paper (page 13), “. . ..parece razonable promover en el futuro una reforma que aumente progresivamente el seguro desempleo, a la vez que reduzca y mejore el disefio de las indemnizaciones.”
As mentioned by Fajnzylber and Reyes (2005), the benefits provided through the unemployment insurance mechanism introduced in 2002 are much smaller than mandatory severance payments. Workers that have been employed for less than a year - about 36 percent o f all salaried, as per the 2003 CASEN survey - are not eligible for severance payments.
14
35
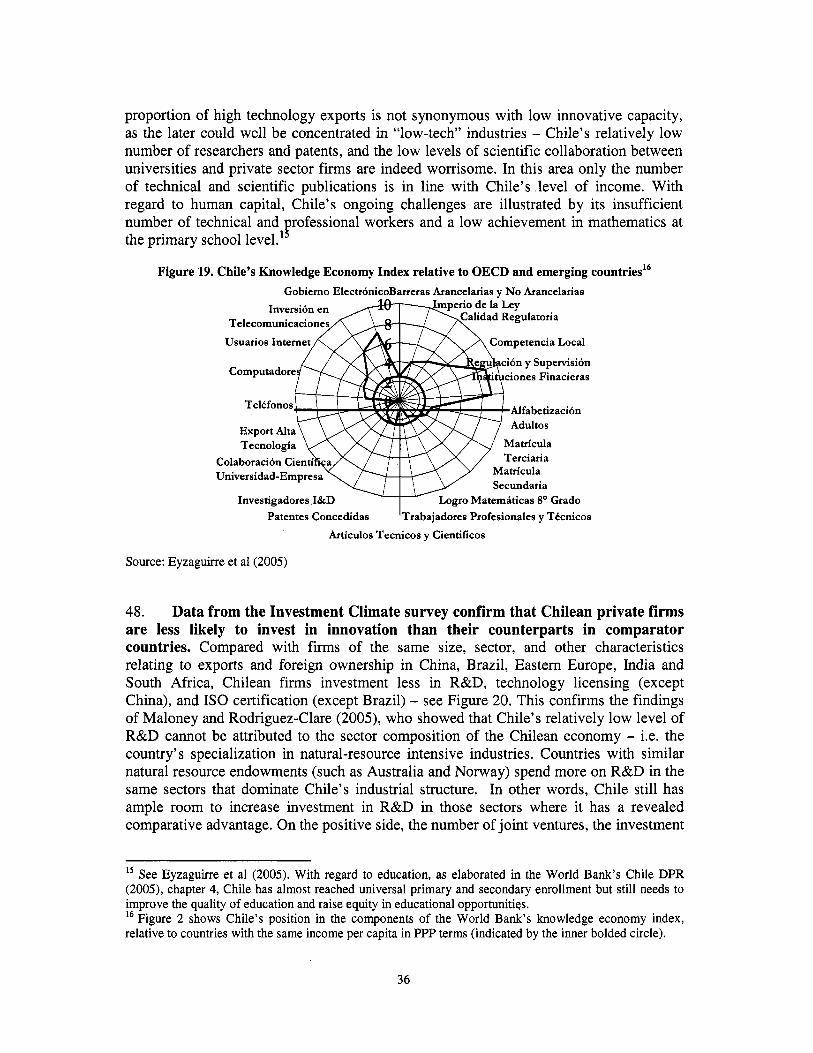
proportion of high technology exports i s not synonymous with low innovative capacity, as the later could well be concentrated in “low-tech” industries - Chile’s relatively low number of researchers and patents, and the low levels of scientific collaboration between universities and private sector f i r m s are indeed worrisome. In th i s area only the number of technical and scientific publications i s in line with Chile’s level of income. With regard to human capital, Chile’s ongoing challenges are illustrated by i t s insufficient number of technical and rofessional workers and a low achievement in mathematics at the primary school level. IP
Figure 19. Chile’s Knowledge Economy Index relative to OECD and emerging countries16 Gobierno Electr6nicoBarreras Arancelarias y N o Arancelarias
Telecomunicaci
Usuarios Inter
iones Finacieras
Alfabetizacibn
Investigadores I&D ro Matematicas 8’ Grado Patentes Concedidas ‘Trabajadores Profesionales y TCcnicos
Ardculos Tecnicos y Cientificos
Source: Eyzaguirre et a1 (2005)
48. Data from the Investment Climate survey confirm that Chilean private firms are less likely to invest in innovation than their counterparts in comparator countries. Compared with f i r m s of the same size, sector, and other characteristics relating to exports and foreign ownership in China, Brazil, Eastern Europe, India and South Africa, Chilean f i r m s investment less in R&D, technology licensing (except China), and I S 0 certification (except Brazil) - see Figure 20. This confirms the findings of Maloney and Rodriguez-Clare (2005), who showed that Chile’s relatively low level of R&D cannot be attributed to the sector composition of the Chilean economy - i.e. the country’s specialization in natural-resource intensive industries. Countries with similar natural resource endowments (such as Australia and Norway) spend more on R&D in the same sectors that dominate Chile’s industrial structure. In other words, Chile s t i l l has ample room to increase investment in R&D in those sectors where it has a revealed comparative advantage. On the positive side, the number of joint ventures, the investment
l5 See Eyzaguirre et a1 (2005). With regard to education, as elaborated in the World Bank’s Chile DPR (2005), chapter 4, Chile has almost reached universal primary and secondary enrollment but still needs to improve the quality of education and raise equity in educational opportunities. l6 Figure 2 shows Chile’s position in the components o f the World Bank’s knowledge economy index, relative to countries with the same income per capita in PPP terms (indicated by the inner bolded circle).
36

0.45
Chi le ) Chile) E a s t . E u r o p e
f v s . C h . ) India ( v s . C h l f r ) S o u t h Afrlcs
tvs. Ch. )

Policy Recommendations
50. Notwithstanding the importance of improving the S&T policy framework, additional measures could help boost private sector investment in innovation. They includes supportive measures directed at facilitating private investments in innovation, such as adjusting the eligibility and selection criteria and the co-financing requirements of matching grant programs. Indeed, if there i s no demand for innovation on the part of the private sector, efforts to improve the S&T capacity on the supply side wil l be ineffectual. Fundamentally, spending public money to provide public goods wil l be “pushing on a string” and wil l not lead to productivity growth unless there i s a positive response from the private sector.
51. Even though R&D tax credits are used in many industrialized countries to stimulate private sector innovation, they are subject to drawbacks that should be carefully considered. Tax credits lower the cost of innovation without specifying the sector or type of R&D that should be done, thus leaving those difficult decisions to the private sector, and minimizing potential “government failures.” Nevertheless, the tax credit system has several drawbacks. First, it i s complex to design a system that i s not excessively costly and s t i l l provides a significant stimulus to incremental R&D. ’* Second, tax auditors usually lack the science and engineering background needed to distinguish between true R&D and other expenditures that f i r m s may wrongly claim. A third drawback i s that, while subsidies for R&D should focus on areas where the gap between social and private returns i s high, f i r m s are likely to consider only the private rate of return when deciding on R&D. In t h i s respect, the use of matching grants to stimulate private R&D has the advantage of flexibility with regard to the projects that can be subsidized, while at the same time favoring projects where the gap between private and social returns i s higher. Lower subsidies can be furnished for projects with lower social returns.
52. While the matching grant schemes employed by Chile are an appropriate mechanism to promote private sector innovation, it i s crucial to monitor and evaluate their impact rigorously, and to adjust the eligibility and co-financing requirements as indicated by monitoring and evaluation. Since the 1990s Chile has relied on programs of matching grants to stimulate private sector investment in innovation. While some of these programs appear to have generated social returns in terms of higher sales and employment - see Universidad de Chile (2004a, 2004b) - their impact on innovation i s less clear. Moreover, there i s a lack of systematic impact evaluations that could provide a basis for adjusting eligibility and selection criteria, as well as co-financing requirements with a view to fostering private sector innovation more effectively. For instance, the Government could consider the possibility of greater support for projects that involve the adoption of already existing technologies and imitative R&D, as opposed to focusing only on the introduction of products or processes not previously available in the country. Projects that adopt and adapt already existing technologies are likely to have lower spillover effects - with lower gaps between social and private returns - so cost-sharing from Government grants may be lower, and private
See Hall (2005).
38
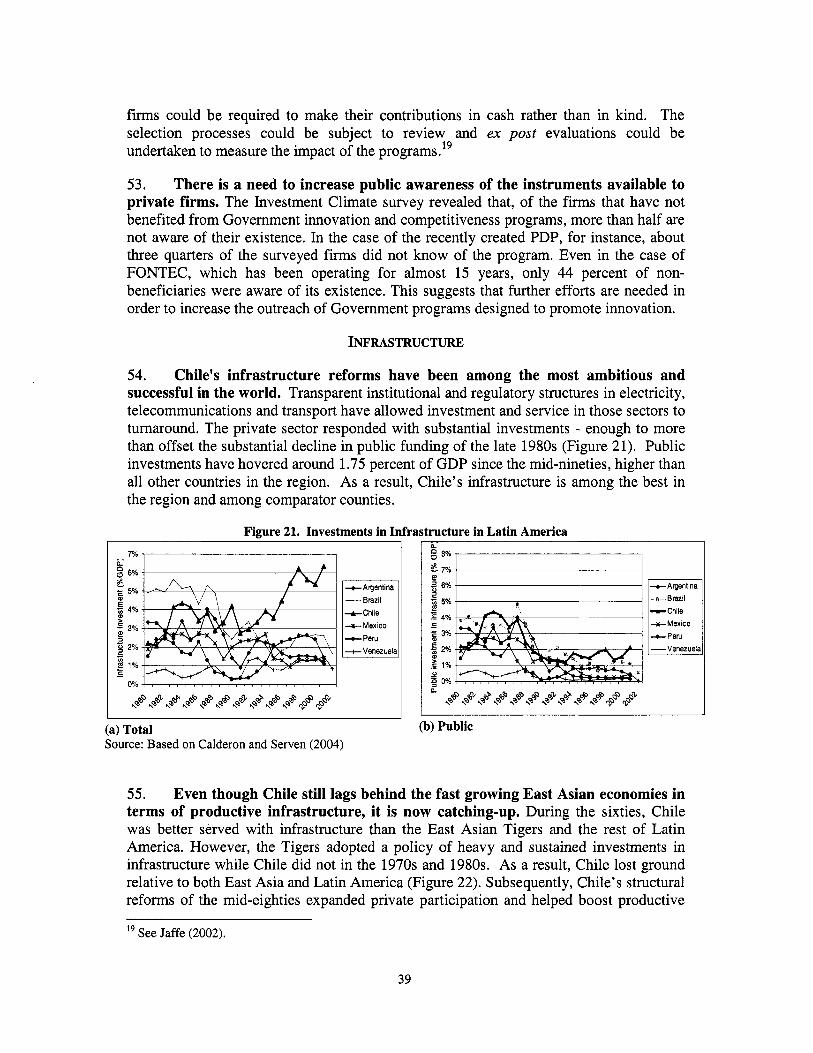
f i r m s could be required to make their contributions in cash rather than in kind. The selection processes could be subject to review and ex post evaluations could be undertaken to measure the impact o f the programs."
53. There i s a need to increase public awareness of the instruments available to private firms. The Investment Climate survey revealed that, o f the f i r m s that have not benefited f rom Government innovation and competitiveness programs, more than half are not aware o f their existence. In the case o f the recently created PDP, for instance, about three quarters o f the surveyed f i r m s did not know o f the program. Even in the case o f FONTEC, which has been operating for almost 15 years, only 44 percent o f non- beneficiaries were aware o f i t s existence. This suggests that further efforts are needed in order to increase the outreach of Government programs designed to promote innovation.
INFRASTRUCTURE
54. Chile's infrastructure reforms have been among the most ambitious and successful in the world. Transparent institutional and regulatory structures in electricity, telecommunications and transport have allowed investment and service in those sectors to turnaround. The private sector responded with substantial investments - enough to more than offset the substantial decline in public funding o f the late 1980s (Figure 21). Public investments have hovered around 1.75 percent o f GDP since the mid-nineties, higher than al l other countries in the region. As a result, Chile's infrastructure i s among the best in the region and among comparator counties.
Figure 21. Investments in Infrastructure in Latin America I ) I
7% , I
+Argentina -Brazil -+Chile +Mexico
+Venezuela
I 'i 5% B .E 4%
3%
2%
I
c ._
0 .- E 1%
n g 8%
6% t Argantina m Brazil
+Chile +--Mexico
+Venezuela
I ' I
(a) Total (b) Public Source: Based on Calderon and Serven (2004)
55. Even though Chile still lags behind the fast growing East Asian economies in terms of productive infrastructure, it i s now catching-up. During the sixties, Chile was better served with infrastructure than the East Asian Tigers and the rest o f Lat in America. However, the Tigers adopted a pol icy o f heavy and sustained investments in infrastructure while Chile did not in the 1970s and 1980s. As a result, Chile lost ground relative to both East Asia and Latin America (Figure 22). Subsequently, Chile's structural reforms o f the mid-eighties expanded private participation and helped boost productive
"See Jaffe (2002).
39

infrastructure. As a result, by 2000, Chile had almost closed the infrastructure gap with the East Asian Tigers.
Figure 22. Composite Index of Productive Infrastructure''
I a77 ELAC WEAP
800
600
400
200
0
.................
..
..... .. - El OECD
1349
957 t" ---$.
I 1960 1970 1980 1990 2000
Source: Own calculations based on Calderon and Serven (2004) database Note: The balloons in the graph represent the values for OECD countries, which are so much
higher as to require a different scale.
56. However Chile recently undertook a series of new reforms in the electric power sector to alleviate fears of unreliable supply. The Sistema Interconectado del Norte Grande (SING) i s thermal (hence gas dependant) while the Sistema Interconectado Central (SIC) largely relies o n hydro generation. The overall balance between the two (59 percent thermal, the balance hydro) i s seen as sound and they are wel l interconnected. However recent events have resulted in nervousness in the business community regarding the reliability of electricity supply. A serious drought (the worst in 40 years) during the summer o f 1998-99 disrupted hydro generation, causing serious outages across the country.*l This remains as a potential risk for SIC, even though past trends suggest that another very dry year i s very unlikely in the near future. In addition, recent problems with the supply o f gas f rom Argentina have affected the SING area, which relies on the Argentine gas supply for about 60 percent of generation. This has also created difficulties for industrial users of natural gas.
57. Firms have responded to uncertainty with precautionary investments in backup self-generation systems. The I C survey reports that 35 percent o f Chilean f i r m s have a generator - double the figure in Brazi l where the quality o f the public grid service i s lower. O f f i r m s with a generator, 60 percent bought their generator in or after the
20 The aggregate index o f productive infrastructure combines a number o f indicators including: giga watts of electricity generation capacity per worker, telephone mainlines per worker, and kilometers o f paved roads per square kilometer o f land area. The index i s calibrated so that Chile had a value o f 100 in 1960. The index for East Asia i s a simple average o f the indexes for China, Indonesia, South Korea, Malaysia, Philippines, Singapore, Thailand, and Vietnam. For the rest o f Latin America, the index includes Argentina, Bolivia, Brazil, Colombia, Costa Rica, Ecuador, El Salvador, Mexico, Paraguay, Peru, Uruguay, and Venezuela. OECD index includes al l OECD European countries, the US and Canada. '' Engel, Galetovic and Fischer (2003).
40

drought year of 1998. According to the IC survey more than 5 percent of electricity consumed by firms i s self generated: a figure that i s consistent with data from the National Commission of Energy (CNE).22 Self generated electric power in Chile i s three times that in China and Brazil (but lower than in India).
58. Although firms can balance energy costs by generating their own electricity at the margin, it i s an activity that i s not their core business. The cost of a generator i s 0.9 percent of the total value' of assets for an average manufacturing firm, rising up to 3.9 percent in micro-enterprises. The burden of self-generation i s greater in the region of Valparaiso and Lagos. However, the highest percentage of f i r m s owning a generator i s located in Santiago. Installed self-generating capacity i s greater in sectors with perishable products l i ke farm-fishing and food and beverages, with levels over 50 percent. Also chemicals and paper products have substantial self-generating capacity. In general, it does not appear to be an issue of co-generation, which might be the case with wood products. Self generation i s subject to economies of scale and ownership of a generator i s positively correlated with firm size. Self generation may be an effective way of guaranteeing supply, but it i s not efficient for the economy as a whole as f i r m s are channeling financial and managerial resources to non-core activities.
59. New laws have aligned the financial incentives for needed investments. Investments in power generation using coal, diesel or even LNG could not compete profitably with a piped natural gas from Argentina or even from Bolivia or Peru. Diesel and LNG, are two to three times more expensive than natural gas. Therefore, new plants could not offer energy at market prices if they had to compete with an unconstrained supply of piped natural gas. The government has implemented regulatory measures through Laws Corta I and 11, which attempt to clarify signals for new investments in transmission and generation to encourage reliance on alternative energy sources for generation - coal, diesel or even LNG. The Law Corta I1 was issued with the central objective of creating a price index to stabilize signals for investors. Weights in the index determined the shares of primary energy that generators would use for up to 15 years which, in turn, wil l be defined by a bidding process. The index i s to be applied in such a way as to permit each generator to sell at a market price, while paying differential costs of primary energy.
60. While it i s too early to evaluate the impact of the new regulations, there are no worries of power shortages in the near term. In the short term, there i s enough water in the multi-annual dams. In addition, new plants for a total of 421-MV generation capacity started operations in the SIC in 2005. There could be some uncertainty in the medium-term, between 2007 and 2009 or 2010, when new generation projects are expected to enter into operation. However, shortages would require a combination of severe drought plus severe restrictions in natural gas supply. Even in t h i s eventuality, while energy in general would become more expensive, Chile would not face severe supply constraints. In the longer term, the impact of Law Corta I1 should be a more diversified energy matrix as well as electricity generation system.
22 This i s not driven b y a few outliers. There are firms to be found along the entire range o f self-generating capacity from zero to 100 percent o f consumed electricity.
41

61. Transport infrastructure has improved remarkably in the past decade due to the most successful concessions program in Lat in America. The concessions program was created under the Concessions Law, enacted in 1991. It defined competitive bidding among national and international f i r m s as the selecting mechanism for granting concessions. The Law provides a flexible guideline for the adjustment o f user fees, public subsidies, income guarantees for the private sector, fees for preexisting facilities, distribution o f risk during the construction and/or operation stages, standards on quality, and license fees. By 2004, the concessions had been granted for the most important highways, seaports, and airports, with an aggregate asset value o f nearly US$6.7 billion. During the last five years each dollar o f public investment in transport infrastructure has leveraged 1.1 dollar o f additional private investment.
Figure 23. Investment in Transport Infrastructure US$
1800
1600
1400
1200
1000
800
600
400
200
0 1990 1992 1994 1996 1998 2000 2002 2004
rn Private I
Source: MOPTT
62. The high quality of infrastructure and the country’s needs in terms of service, allows sector institutions ample room to adapt their role and enhance the efficiency of operations still financed by the public sector. For instance, the Ministry o f Public Works could improve the social returns to i t s programs and the efficiency of i t s service by using a more modern system o f performance based contracts rather than traditional contracts based on unit costs.
63. Although transport i s a less of a severe constraint to growth for Chilean business than i s electricity, the quality of transport services varies according to destination, market and the size of firms. Transport for products shipped to international market i s better than for products destined for the national market. However, the difference in overall cost i s not substantial because the cost o f addressing customer’s complaints i s high in the international market. More than 17 percent o f f i r m s reported breakages in deliveries to international destinations, compared with 25 percent in national deliveries (Figure 24). The financial impact i s greater for medium and large f i r m s than for small and micro enterprises. However, the overall economic impact i s not great.
42

Reported losses account for less than 1 percent of sales. Transport constraints were found to be higher in Chile than in China.
Figure 24. Percentage of Firms that reported breakage or theft in transit
I Micro Small 0 Medium 0 Large
I breakage I theft I breakage I theft I I National Market I international Shipments I
Source: ICs
64. Small and micro enterprises use fewer third party services and their transport costs are 70 percent lower than large and medium firms. More than fifty percent of small and micro enterprises use their own means to transport products, while only 19 percent of large f i r m s do so directly. B y using their own transport, small and micro enterprises reduce direct transport costs, which are 70 percent lower than large and medium size f i rms.
65. Access to the Internet by both households and firms i s high in Chile. However, greater Internet access by households would improve competitiveness. At first glance, overall Internet access may not seem important for competitiveness since f i r m s tend to have a higher rate of Internet and email use, compared with rest of the economy. More than 90 percent of f i r m s use email to communicate with clients, and at least 70 percent o f f i r m s have set up their own internet page. On average these f i r m s manage to sell about 6 percent via the Internet, especially small and micro enterprises. However, the overall Internet penetration could play an important role in competitiveness since it helps to build up the necessary sk i l ls for today’s production technologies. In 2004, Internet penetration in Chile was 28 users per 100 habitants, three times the level of India, China, and Thailand, but s t i l l below OECD countries (43) and other comparator countries.
Policy Recommendations
66. Strong institutions and a sustained level o f financing have placed the infrastructure sectors of Chile on a firm foundation. The views expressed by entrepreneurs together with an analysis o f sector issues suggest that growth prospects could be further improved by action along the following lines: a) consider closely monitoring new investments in electric power generating capacity as investors respond to new incentives; b) second, consider refocusing the Ministry of Public Works more towards service delivery as opposed to the construction o f infrastructure; c) finally, consider strengthening the strategic focus of telecommunications policies towards Internet access for all households.
43
ANNEX: PRODUCTIVITY ANALYSIS: A SUMMARY OF THE METHODOLOGY
A.l The productivity approach followed here i s based on the robust econometric methodology o f Escribano and Guasch (2005) as described in Escribano, Guasch, Pena and Orte (2006), a background paper prepared for this project. Volume I1 includes an Annex with a detailed explanation o f the methodology. The present section provides a summary o f the main methodological issues and the key steps and procedures undertaken.
A.2 Productivity (P), or multifactor productivity, refers to the effects of any variable different from the inputs --labor (L), intermediate materials (M) and capital services (K)--, affecting the production (sales) process. In general, we expect productivity to be correlated with the inputs L, M and K, and therefore the inputs must be treated as endogenous regressors when estimating production functions. In particular, TFP i s assumed to include the effects o f I C variables such as infrastructure, governance, quality of labor, innovation, research and development (R&D), technological and regulatory changes, competition and any other firm-specific characteristics or control variables (C).
A.3 The fact that the inputs of the production function (K, L and M) are endogenous and correlated with productivity (TFP) invalidates the use o f two steps least squares estimation techniques, where one first estimates TFP and then runs a regression o f TFP on I C variables. Thus, to address the endogeneity problem, we follow the approach proposed by Escribano and Guasch (2005). That is, we proxy the usually unobserved firm specific fixed effects (which are the main cause o f the endogeneity o f the inputs) by a long l i s t o f firm specific observed fixed effects coming from the investment climate information
A.4 There i s no universally accepted measure of productivity or total factor productivity (TFP). The analysis followed in this report seeks to measure the impact o f different investment climate (IC) variables on (log) productivity, controlling for other characteristics. Inevitably, any empirical evaluation o f the impact of the I C variables w i l l be contingent upon the productivity measure used. This methodology aims to obtain robust and consistent conclusions from all productivity measures, providing a consistent range o f productivity gains and losses due to I C variables.
AS The alternative productivity measures considered in the analysis come from considering:
1. different functional forms o f the production functions (Cobb-Douglas and Translog),
2. different set o f assumptions (technology and market conditions) to get consistent estimators based on Solow's residuals, or OLS, RE, etc. and,
3. different levels o f aggregation in measuring input-output elasticities (at the industry level or at the aggregate country level).
TABLE .1. SUMMARY OF PRODUCTIVITY MEASURES AND ESTIMATED INVESTMENT CLIMATE (I~)'ELASTICITIES
1.l.a OLS Two Step 1.1 Restricted Coef 1.1 .b RE 2 (Pi,) measures
1, Solow's Residual Estimation 1 -2.a OLS 4 (IC) elasticities 1.2 Unrestricted Coef 1.2.b RE
44

2.l.a OLS Single Step 2.1 Restricted Coef 2.1 .b RE 4 (Pi,) measures
2. Cobb-Douglas Estimation 2.2.a OLS 4 (IC) elasticities 2.2 Unrestricted Coef 2.2.b RE
3.l.a OLS Single Step 3.1 Restricted Coef 3.l.b RE 4 (Pi,) measures
3. Translog Estimation 3.2.a OLS 4 (IC) elasticities
10 (Pi,) measures 3.2 Unrestricted Coef 3.2.b RE
Total 12 (IC) elasticities
Restricted Coef.= Equal input-output elasticities in all industries Unrestricted Coef.= Different input output elasticities by industry OLS = Pooling Ordinary Least Squares estimation (with robust standard errors) RE = Random Effects estimation.
A.6 To reduce the simultaneous equation bias and the risk o f getting reverse causality problems for those I C variables that are endogenous, we use their region-industry average ( ). The productivity coefficients o f investment climate ( ) variables and other plant-specific control (C) variables are maintained constant but we allow the production function elasticities, and therefore the productivity measures, to change for each functional form (Cobb-Douglas and Translog), and for each aggregation levels (industry and regions). Restricted estimation (equal input-output elasticities among industries) and unrestricted estimation (different input-output elasticities for each industry), are the two levels o f aggregation considered in the input-output elasticities of the production functions.
A.7 Furthermore, we consider two different estimators (pooling OLS and random effects) for each productivity measure. Thus we obtain 10 different productivity measures and we evaluate the impact o f I C variables on each o f them based on two estimation procedures, pooling OLS and RE. Table B.6 of the annex in volume 11 reports the correlations for each of the (log) productivity measures obtained from the eight production functions estimated in 1-step and from the two Solow’s residuals respectively.
45
REFERENCES
Calderbn, C. and L. Servtn (2004) “Trends in Infrastructure in Latin America, 1980- 2001.” Working Papers Central Bank of Chile 269.
Cowan, K.; A. Mizala and Micco, A. (2005). “El Seguro de Desempleo en Chile Reformas Pendientes”. En Foco No. 53, Corporaci6n Expansiva., 2005.
Cowan, K.; A. Mizala; A. Micco; C. Pages; and P. Romaguera (2005) “Unemployment in Chile: A diagnosis” (In Spanish). Universidad de Chile and Inter-American Development Bank. Santiago, April 2005.
Cowan, K.; A. Micco; and C. Pagts (2004) “Labor Market Adjustment in Chile.” Economia, The journal of the Latin American and Caribbean Economic Association. Fall 2004, 5 (1):183-218.
Engel, E.; A. Galetovic; and R. Fischer (2003) “Privatizing Highways in Latin America: i s it Possible to Fix What Went Wrong?” Documentos de Trabajo 163, Centro de Economia Aplicada, Universidad de Chile.
Escribano, A. and Guasch, J.L. (2005) “Assessing the Impact of Investment Climate on Productivity using Firm Level Data: Methodology and the Cases of Guatemala, Honduras and Nicaragua.” The World Bank, Policy Research Working Paper # 3621. June.
Escribano, A,; J.L. Guasch; J. Pena; and M. Orte, M. (2006) “Investment Climate Assessment (ICA) on Productivity and their Effects on Exports, Foreign Direct Investment, Wages and Employment - Analysis Based on Firm Level Data from Chile 2001-2003.” The World Bank and Universidad Carlos III, February.
Eyzaguirre, N.; M. Marcel; J. Rodriguez; and M. Tokman (2005) “The Way to the Economy of Knowledge: The Road to Growing Equitably in the Long Term.” Estudios Pu’blicos, No. 97, Centro de Estudios Pdblicos, Santiago, pp. 5-57.
Fajnzylber, E. and Reyes, G. (2006). ‘‘Dintimica del Empleo Juvenil - Resultados preliminares con datos del seguro de Cesantia”. En Foco No. 54, Corporaci6n Expansiva., 2006
Gatica, J. and Romaguera, P. (2006) “El Mercado Laboral en Chile: Nuevos temas y Desafios”. En Foco No. 55, Corporaci6n Expansiva., 2006
Hall, B. (2005) “The Financing of Innovation.” In: Shane, S., Blackwell Handbook of Technology and Innovation Management, Oxford: Blackwell Publishers, Ltd., December 2005.
Jaffe, A.B. (2002) “Building Programme Evaluation into the Design of Public Research- Support Programmes.” Oxford Review of Economic Policy 18(1), pp.22-34.
Maloney, W. and A. Rodriguez-Clare (2005) “Innovation Shortfalls.” Unpublished paper, World Bank and Inter-American Development Bank, Washington, DC.
Universidad de Chile (2004a) “Evaluaci6n Impact0 Fondo de Desarrollo e Innovaci6n.” Informe Final.
Universidad de Chile (2004b) “Evaluaci6n de 10s Resultados Econdmicos de 10s Proyectos de Innovaci6n Tecnol6gica Financiados por e l FONTEC.”
World Bank (2005) “El Salvador Investment Climate Assessment.” World Bank Report
World Bank (2005) “Chile: Development Policy Review.” Washington, D.C.: The World
World Bank (2007) “Doing Business Report 2007.” Washington, DC: World Bank. 189p.
NO. 3271 1-SV.
Bank.
46