Embed Size (px)
Citation preview

Report and Financial Statements
Jigsaw Homes Group Limited
(Formerly Adactus Housing Group Limited) For the year ended 31 March 2018


Miles Pla�ng Birthday Time Capsule, April 2017Buried in 2017 - to be opened in 100 years!


Warwick Road South, Stre�ordAn AHA development of 60 proper�es for affordable rent.


Adactus Housing Group Ltd
BeechHousing Association Ltd
AdactusHousing Association Ltd
The Stanley RoadManagement Co. Ltd
James Tomkinson Memorial Cottages
Trust
Heartland Court Management Ltd
Chorley Community Housing
Snugg Properties Ltd
Palatine Contracts Ltd


NNNNYYYYYYYYYYYYYYYYYYYYYYYYYYYYYYYYYYYAveragecompletion timefor non emergencyrepairs (days)
Boardattendance
Callsanswered in60 seconds
Calls resolvedon first call
Completedscrutinyreviews
Completionof unplannedcomponentreplacements
Generalneeds voidsloss
Managementcostperunit
Net promoterscore
Non execmembers witha portfoliointerest
Number ofpropertieswhose energyefficiencyrating is belowD
Plannedmaintenancecost per unit
Practicalcompletionsagainsttarget
Rent collected Responsivemaintenancecost per unit
Retirementlivingrentloss
Sale proceedsfrom voiddisposals
Satisfiedwithhandling ofASB case
Satisfied withplanned works
Satisfied withrepairs Supported
void loss
Tenantedpropertieswith currentgas safetycertificate
Totaloperatingcost per unit Units
ownedandmanaged
Death orInjury fromfire
Poor quality ofIndependent Livingstock / products
Death orInjury fromgas
Death or seriousinjury (staff / 3rdparty)
IneffectiveSafeguarding ofstaff, customersand third parties
Cyberdisruption tosystems
Non−Cyberdisruptionto systems
Ineffectiveapproach tolone working
Late orinaccuratestatutory andregulatoryreturns
Breachof dataregulations
UnanticipatedGovernment policyshift
Delays todevelopmentprogramme
Poor workingconditions /arrangements
Inadequatecompetency ofstaff
Poor qualityof generalneeds housing
Insufficientcashflow
Inabilityto chargeproperties
Failure toescalateissues
Delays in planningapprovals
Inadequatefinancialappraisals
Vulnerabilityof clientgroup
Failure tomeet covenantrequirements
Poor provision ofservices by thirdparty providers(IT)
PoorInvestment
Death orinjury fromasbestos
Loss ofskills andknowledge
Poor provision ofservices by thirdparty providers(independent living)
Tenancyfailure
Over exposure tohousing marketcrash
Poor assetmanagementinformation
Lack of resourcesto deliverAsset ManagementStrategy
Impairmentof Land Bankvalue
Poorsalesperformance
Failure tounderstandcustomerexpectations
Poor dataleads to poordecisions
Inadequateresourcingof contactcentres
Unattractivegrantsubmissions
Disruption tofunding streams
Contractpenalties
Increase inPension costs


Processes
Key
contributes to the measurements of…
Otherinfluences
EconomySpending less
Effectiveness Spending wisely
Outputs Services/new housing
Outcomes New housing development Tenancy services Community investment
Value for money The optimal use of resources to achieve the intended outcomes
Resources Housing assets
Inputs Finance/staffing
Objectives Q1 Maintain effective governance Q2 Provide VfM customer services E1 Increase the size of the business D1 Provide targeted neighbourhood investment
Efficiency Spending well
/����������#��
0�� �*�1-���������2��*��
.��3���������+�4��������������
(����������#��
������5���
"���������#��
0�� 6*�7�-�����������
0�& $*�)����������#����7�-�����*�����*��������*�
��#��������������*�
-33�������.��3�������*�
0� 6*��**-�������#���*���
�����-�������+���2�3��3������
��������������
"�3��*�����+������
"�-�����*����������
.�������*����������
8�9�����3����
��#�����3��#����
7�-�����*�����*������������
.-�������+������+�4���������
8�����*���:���������
�**-�������������#��
0
10
20
30
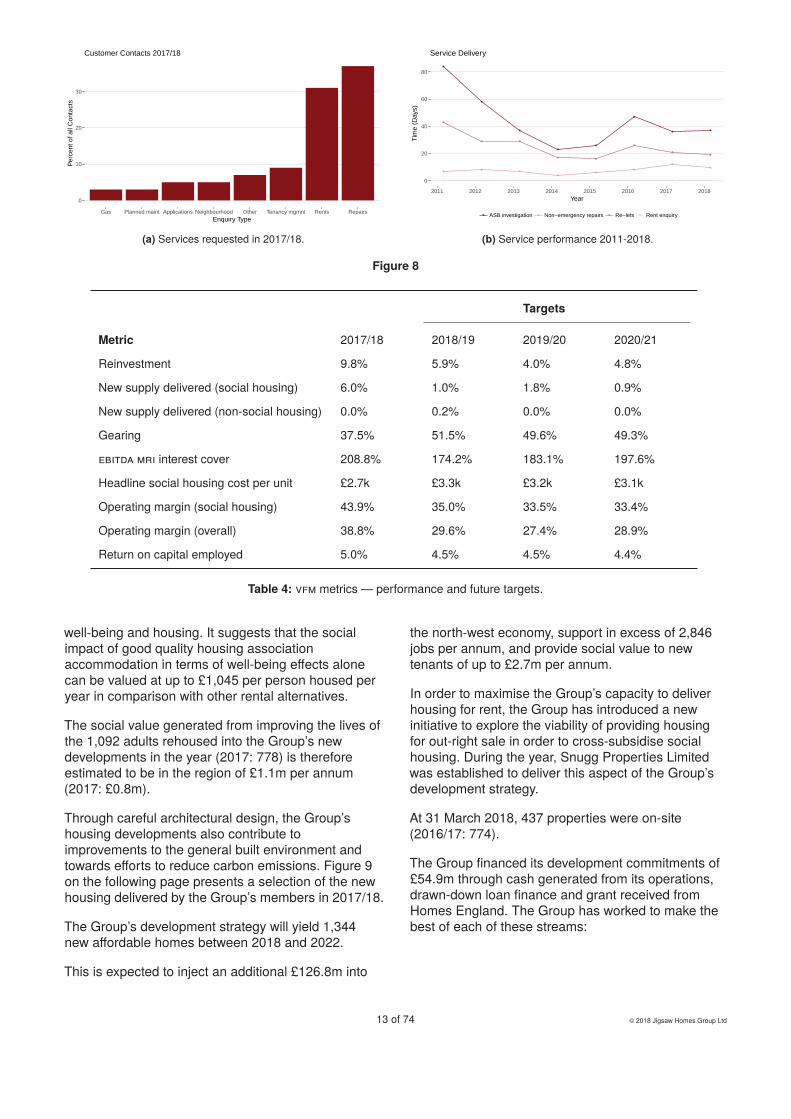
Gas Planned maint Applications Neighbourhood Other Tenancy mgmnt Rents RepairsEnquiry Type
Perc
ent o
f all
Con
tact
s
Customer Contacts 2017/18●
●
●
●
●
●
●
●
●
●
●
●
●
●
●
●
●
●
●
●
●
●
●
●
●
●
●
●
●
●
●
●0
20
40
60
80
2011 2012 2013 2014 2015 2016 2017 2018Year
Tim
e (D
ays)
● ● ● ●ASB investigation Non−emergency repairs Re−lets Rent enquiry
Service Delivery

●
●
●
●
●
●
●
● ●
●
●
●
●
●
●
●
●
● ●
●
●
Target
Target
30
40
50
60
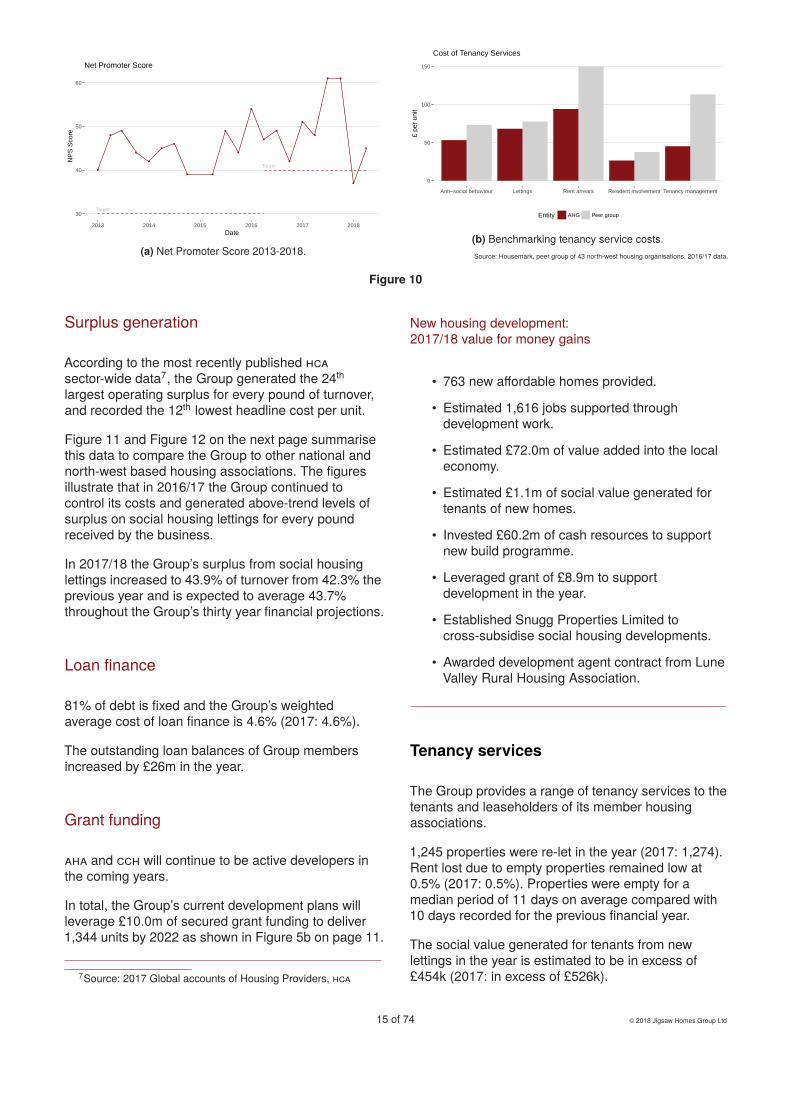
2013 2014 2015 2016 2017 2018Date
NP
S S
core
Net Promoter Score
0
50
100
150
Anti−social behaviour Lettings Rent arrears Resident involvement Tenancy management
£ pe
r uni
t
Entity AHG Peer group
Cost of Tenancy Services

AHG is within the highlighted area
Sector median
0
10
20
30
5 10Cost per unit (£k)
coun
t
●
●
●●
●
●●●
● ●
●
●●
●●
●
●
●
●●
●
●●
●
●●
●
●●●●●
●
●
●●
●●●
●
0
20,000
40,000
60,000
80,000
0 100,000 200,000Turnover from Social Housing Lettings (£k)
Surp
lus
from
Soc
ial H
ousi
ng L
ettin
gs (£
k)
Organisation ● ●AHG Other
Operating Surplus from Social Housing Lettings

●
●
●
●
●
●
●
●
●
●
●
●
300
350
400
450
2012 2013 2014 2015 2016 2017Date
Tota
l Cos
t per
Uni
t (£)
AHG Peer group
Annual Cost of Tenancy Management
0.0
2.5
5.0
7.5
AHA BHA CCH Group Sector
%
Return on Capital Employed
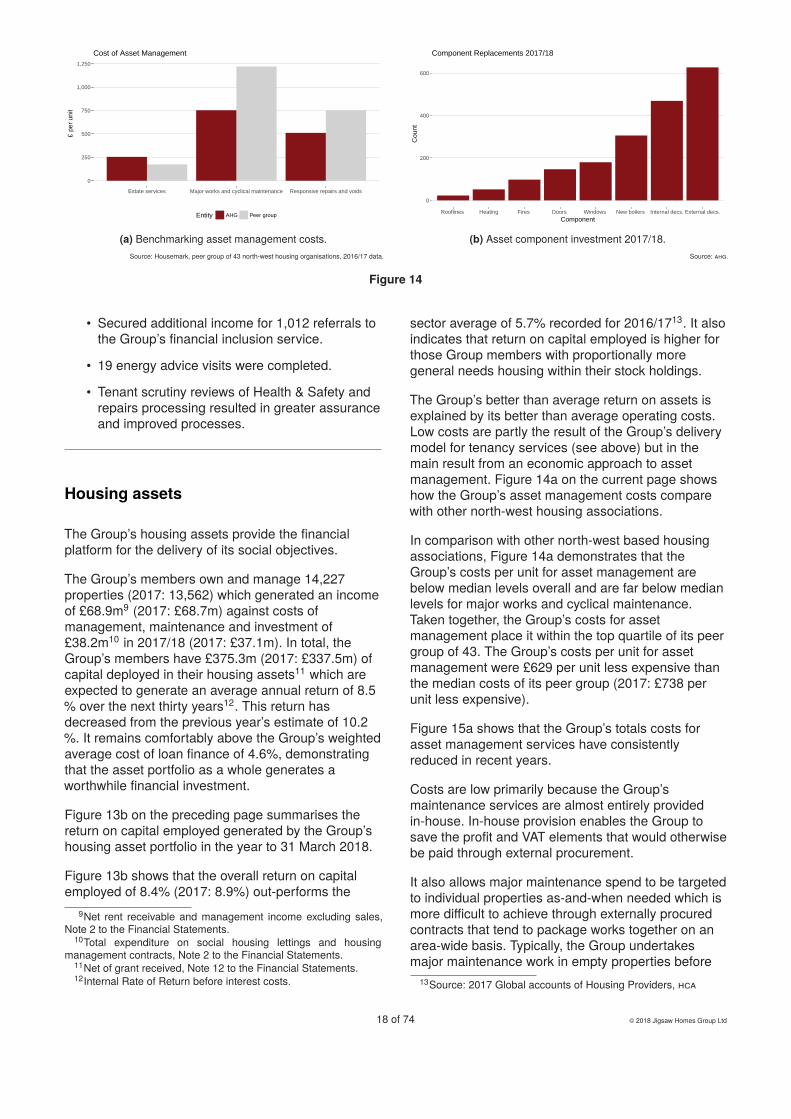
0
250
500
750
1,000
1,250
Estate services Major works and cyclical maintenance Responsive repairs and voids
£ pe
r uni
t
Entity AHG Peer group
Cost of Asset Management
0
200
400
600
Rooflines Heating Fires Doors Windows New boilers Internal decs. External decs.Component
Cou
nt
Component Replacements 2017/18

●
●
●
●
●
●
●
●
●
●
●
●
1,500
1,750
2,000
2,250
2,500
2012 2013 2014 2015 2016 2017Date
Tota
l Cos
t per
Uni
t (£)
AHG Peer group
Annual Cost of Asset Management

0
50000
100000
150000
200000
Employment Resident Involvement Youth Zone Other Environmental Neighbourhood Fund
£
Planned Community Investment 2018/19

Chorley Moor Fun Day, August 2017Over 200 visitors helped us celebrate 10 years in Chorley.


Greater Manchester Housing Providers GMHPWe want everyone to live in a home they can afford!


Old Trafford Clean up day, 2017 Over 200 Trafford residents took part, filling four free skips!

Year ended 31 March 2018
Group Association Group Association
£’000 £’000 £’000 £’000
Turnover 2 76,584 22,186 74,058 21,825
Cost of sales 2 (6,208) - (6,848) -
Operating expenditure 2 (38,186) (22,154) (37,127) (21,757)
Operating surplus 32,190 32 30,083 68
Profit/(loss) on disposal of non-housing assets 5 11 - (97) -
Interest receivable 6 108 1 157 4
Interest and financing costs 7 (14,220) (32) (11,603) (57)
Surplus before tax 8 18,089 1 18,540 15
Taxation 9 (181) (14) (104) (32)
Surplus/(deficit) for the year after tax 17,908 (14) 18,436 (17)
Other comprehensive income
Actuarial gain/(loss) in respect of pension schemes 30 751 - (1,196) -
Total comprehensive income for the year 18,659 (14) 17,240 (17)
2017
Notes
2018

Aindow Court, Southport Re�rement Living
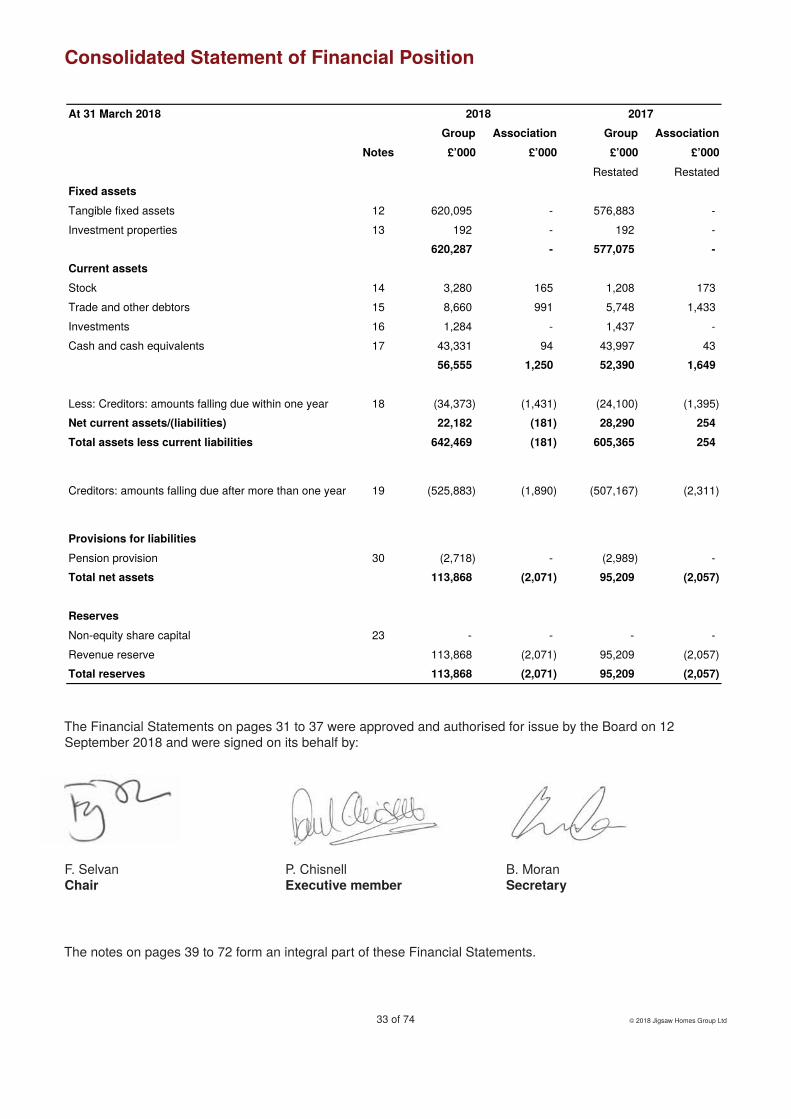
At 31 March 2018
Group Association Group Association
£’000 £’000 £’000 £’000
Restated Restated
Fixed assets
Tangible fixed assets 12 620,095 - 576,883 -
Investment properties 13 192 - 192 -
620,287 - 577,075 -
Current assets
Stock 14 3,280 165 1,208 173
Trade and other debtors 15 8,660 991 5,748 1,433
Investments 16 1,284 - 1,437 -
Cash and cash equivalents 17 43,331 94 43,997 43
56,555 1,250 52,390 1,649
Less: Creditors: amounts falling due within one year 18 (34,373) (1,431) (24,100) (1,395)
Net current assets/(liabilities) 22,182 (181) 28,290 254
Total assets less current liabilities 642,469 (181) 605,365 254
Creditors: amounts falling due after more than one year 19 (525,883) (1,890) (507,167) (2,311)
Provisions for liabilities
Pension provision 30 (2,718) - (2,989) -
Total net assets 113,868 (2,071) 95,209 (2,057)
Reserves
Non-equity share capital 23 - - - -
Revenue reserve 113,868 (2,071) 95,209 (2,057)
Total reserves 113,868 (2,071) 95,209 (2,057)
2017
Notes
2018

Breathe Investment GrantsInvested £142,120 in 91 Adactus Housing Associa�on projects!
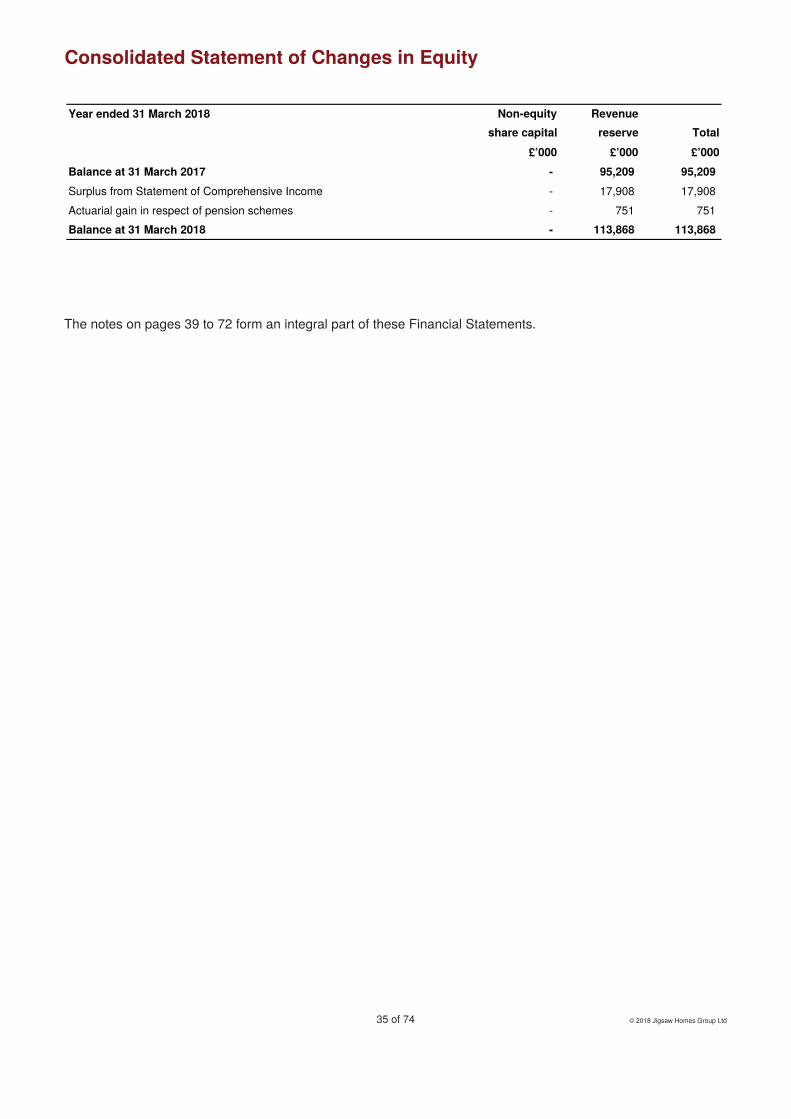
Year ended 31 March 2018 Non-equity
share capital
Revenue
reserve Total
£’000 £’000 £’000
Balance at 31 March 2017 - 95,209 95,209
Surplus from Statement of Comprehensive Income - 17,908 17,908
Actuarial gain in respect of pension schemes - 751 751
Balance at 31 March 2018 - 113,868 113,868

Appren�ceships Voted ‘Employer of the Year 2018’ - Sysco Business Skills Academy.

Year ended 31 March 2018 2018 2017
£’000 £’000
Net cash generated from operating activities (see below) 32,244 30,527
Cash flow from investing activities
Purchase of tangible fixed assets (60,210) (59,577)
Proceeds from sale of tangible fixed assets 8,701 9,527
Grants received 8,901 8,325
Interest received 108 157
(42,500) (41,568)
Cash flow from financing activities
Interest paid (16,483) (13,194)
New secured loans 39,626 28,500
Repayment of borrowings (13,707) (9,022)
9,436 6,284
Net change in cash and cash equivalents (820) (4,757)
Cash and cash equivalents at beginning of the year 45,434 50,191
Cash and cash equivalents at end of the year 44,614 45,434
2018 2017
£’000 £’000
Cash flow from operating activities
Surplus for the year 18,659 17,240
Adjustments for non-cash items:
Depreciation of tangible fixed assets 8,660 7,683
Decrease/(increase) in properties for sale (37) 233
Decrease/(increase) in trade and other debtors (1,438) (3,578)
Increase/(decrease) in trade and other creditors (294) 2,556
Pension costs less contributions payable (1,427) 484
Carrying amount of tangible fixed asset disposals 5,712 6,523
Adjustments for investing or financing activities:
Proceeds from the sale of tangible fixed assets (8,701) (9,698)
Government grants utilised in the year (3,001) (2,362)
Interest paid 14,219 11,603
Interest received (108) (157)
Net cash generated from operating activities 32,244 30,527

Priory, LitherlandA CCH development of 13 proper�es for affordable rent.


Turnover Cost of sales
Operating
expenditure
Operating
surplus
£’000 £’000 £’000 £’000
Social housing lettings (Note 3) 60,634 - (34,028) 26,606
Other social housing activities:
Housing management contracts 6,812 - (4,190) 2,622
First tranche low cost home ownership sales 971 (990) - (19)
Sales of other housing properties 7,702 (5,218) - 2,484
Other 465 - 32 497
Total 76,584 (6,208) (38,186) 32,190
2018
Turnover Cost of sales
Operating
expenditure
Operating
surplus
£’000 £’000 £’000 £’000
Social housing lettings (Note 3) 57,714 - (33,325) 24,389
Other social housing activities:
Housing management contracts 6,309 - (3,869) 2,440
First tranche low cost home ownership sales 4,178 (3,296) - 882
Sales of other housing properties 5,380 (3,552) - 1,828
Other 477 - 67 544
Total 74,058 (6,848) (37,127) 30,083
2017

General
housing
Supported
housing and
housing for
older people
Low cost
home
ownership Total 2018 Total 2017
£’000 £’000 £’000 £’000 £’000
Income
Rent receivable net of identifiable service
charges and net of voids40,464 9,037 2,279 51,780 49,406
Service charge income 1,006 3,459 682 5,147 4,932
Charges for support services - 776 - 776 944
Amortised government grants 2,726 - 205 2,931 2,432
Turnover from social housing lettings 44,196 13,272 3,166 60,634 57,714
Operating expenditure
Management 4,643 1,788 386 6,817 6,707
Service charge costs 1,057 4,270 680 6,007 5,905
Routine maintenance 5,183 1,467 197 6,847 6,536
Planned maintenance 3,312 1,543 31 4,886 5,786
Major repairs expenditure 698 55 11 764 601
Bad debts 284 67 5 356 303
Property lease charges 179 - - 179 262
Depreciation of housing properties 6,252 1,340 321 7,913 6,911
Other costs 203 45 11 259 314
Operating expenditure on social housing
lettings21,811 10,575 1,642 34,028 33,325
Operating surplus on social housing lettings 22,385 2,697 1,524 26,606 24,389
Void losses 186 99 33 318 343
Group
Owned Managed Owned Managed
Social Housing
General needs housing
Social rent 6,792 1,419 6,821 1,444
Affordable rent 2,503 - 1,794 -
Sheltered housing for older people 1,645 71 1,645 71
Supported housing 442 - 445 -
Low-cost home ownership 833 90 832 87
Leasehold where the Group owns the freehold 432 - 423 -
Total units social housing 12,647 1,580 11,960 1,602
2018 No. of units 2017 No. of units

Group – In development 2018 2017
No. of units No. of units
Social Housing
General needs housing
Social rent 29 94
Affordable rent 378 665
Low-cost home ownership 30 15
Total units social housing 437 774
Group - Movement in the year (owned properties) No.of units
Opening number of units at 1 April 2017 11,960
New units developed 581
New units acquired 182
Units sold (75)
Other adjustments (1)
Closing number of units at 31 March 2018 12,647
Group 2018 2017
£’000 £’000
Proceeds of sales 53 225
Carrying value (42) (318)
Incidental costs - (4)
Total loss 11 (97)
Group 2018 2017
£’000 £’000
Bank interest receivable 108 157
Total 108 157

Group 2018 2017
£’000 £’000
Restated
Loans and bank overdrafts 13,108 12,768
Early redemption costs* 1,898 -
Amortisation of loan fees 312 207
Notional interest on RCGF/DPF 7 2
Interest on pension deficit 384 219
Interest capitalised on housing properties under construction (1,489) (1,593)
Total 14,220 11,603
Group 2018 2017
£’000 £’000
The operating surplus is stated after charging:
Auditor's remuneration (excluding VAT):
Audit of the Group financial statements* 11 10
Audit of subsidiaries 37 27
Fees payable to the company’s auditor & its associates for other services to the Group
Taxation advice 15 15
Other 3 6
Operating lease rentals:
Land and buildings 162 252
Other 672 640
Depreciation:
Depreciation of housing properties 7,914 6,911
Depreciation of other fixed assets 765 772

Group 2018 2017
£’000 £’000
Current tax
Current tax on income for the year 175 74
Adjustments in respect of previous periods - (6)
Total current tax charge 175 68
Deferred tax
Origination and reversal of timing differences 15 9
Adjustment in respect of previous years (9) -
Effect of tax rate change on opening balance - 27
Total deferred tax charge 6 36
Total tax recognised in the Statement of Comprehensive Income 181 104
Current tax Deferred tax Total tax Current tax Deferred tax Total tax
£’000 £’000 £’000 £’000 £’000 £’000
Recognised in Statement of
Comprehensive Income175 6 181 68 36 104
Total tax 175 6 181 68 36 104
2018 2017
Reconciliation of effective tax rate 2018 2017
£’000 £’000
Surplus for the year 17,908 18,436
Total tax expense 181 104
Surplus excluding taxation 18,089 18,540
Tax using the UK corporation tax rate of 19% (2017: 20%) 3,437 3,708
Effect of tax free income due to charitable activities (3,196) (3,654)
Fixed asset differences 36 -
Net expenses not deductable for tax purposes 16 15
Income not taxable for tax purposes (48)
Adjustments in respect of prior periods (75) (7)
Tax rate differences on deferred tax (3) 26
Chargeable gains 20 17
Deferred tax not recognised (6) (1)
Total tax charge 181 104

Deferred tax assets and
liabilities
2018 2017 2018 2017 2018 2017
£’000 £’000 £’000 £’000 £’000 £’000
Accelerated capital allowances - - 38 46 38 46
Unused tax losses (97) (43) - - (97) (43)
Other short term timing
differences(393) (462) - - (393) (462)
Tax (assets) / liabilities (490) (505) 38 46 (452) (459)
Assets Liabilities ���
Group 2018 2017
£’000 £’000
The aggregate emoluments paid to or receivable by non-executive directors and former non-
executive directors59 60
The aggregate emoluments paid to or receivable by executive directors and former executive
directors513 710
The aggregate compensation paid to or receivable by directors (key management personnel) 1,183 1,345
The emoluments paid to the highest paid director excluding pension contributions 174 196
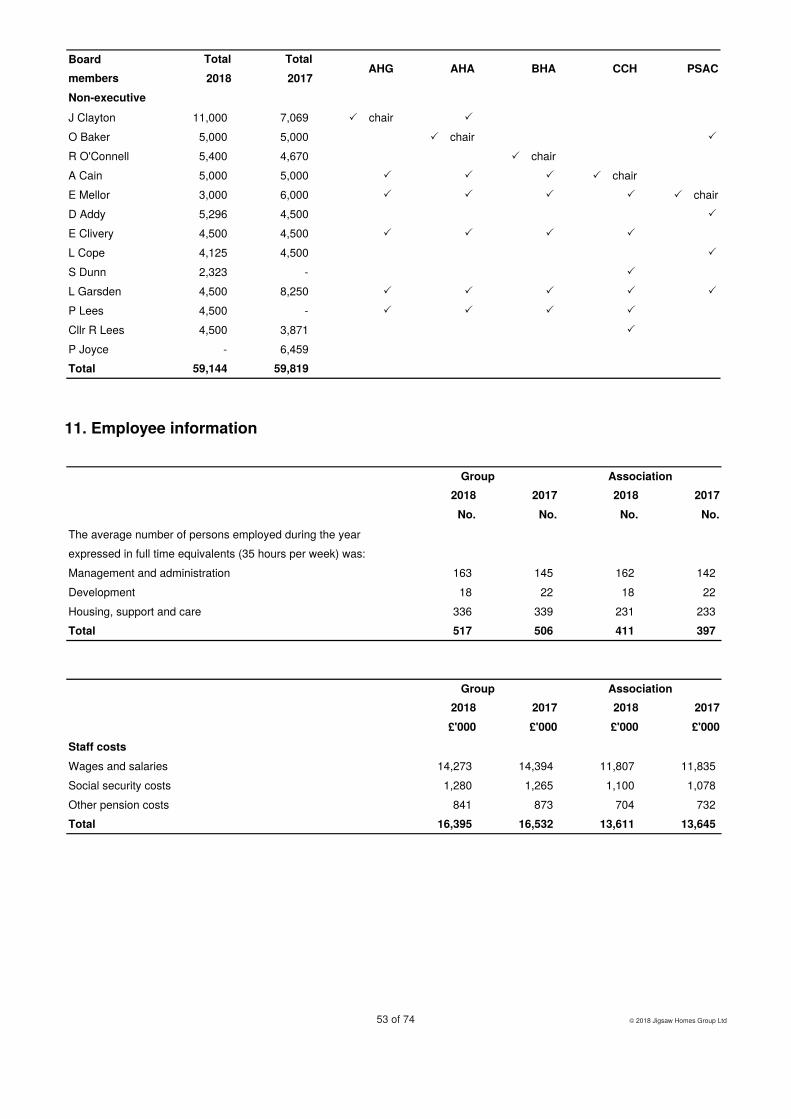
Total Total
2018 2017
Non-executive
J Clayton 11,000 7,069 ��chair �
O Baker 5,000 5,000 ��chair �
R O'Connell 5,400 4,670 ��chair
A Cain 5,000 5,000 � � � ��chair
E Mellor 3,000 6,000 � � � � ��chair
D Addy 5,296 4,500 �
E Clivery 4,500 4,500 � � � �
L Cope 4,125 4,500 �
S Dunn 2,323 - �
L Garsden 4,500 8,250 � � � � �
P Lees 4,500 - � � � �
Cllr R Lees 4,500 3,871 �
P Joyce - 6,459
Total 59,144 59,819
PSACBoard
membersAHG AHA BHA CCH
2018 2017 2018 2017
No. No. No. No.
The average number of persons employed during the year
expressed in full time equivalents (35 hours per week) was:
Management and administration 163 145 162 142
Development 18 22 18 22
Housing, support and care 336 339 231 233
Total 517 506 411 397
Group Association
2018 2017 2018 2017
£'000 £'000 £'000 £'000
Staff costs
Wages and salaries 14,273 14,394 11,807 11,835
Social security costs 1,280 1,265 1,100 1,078
Other pension costs 841 873 704 732
Total 16,395 16,532 13,611 13,645
Group Association

��������������� ���������������������������� ����������� ������������� �� ������ ������������������������������ �
2018
No.
2017
No.
£60,001 - £70,000 5 6
£70,001 - £80,000 2 2
£80,001 - £90,000 1 1
£90,001 - £100,000 2 2
£100,001 - £110,000 - -
£110,001 - £120,000 2 2
£120,001 - £130,000 - -
£130,001 - £140,000 - -
£140,001 - £150,000 - -
£150,001 - £160,000 1 3
£160,001 - £170,000 1 -
£170,001 - £180,000 2 2
£180,001 - £190,000 1 -
£190,001 - £200,000 - 1
Group

Housing properties
Social
housing
properties for
letting
completed
Social
housing
properties for
letting under
construction
Shared
ownership
properties
completed
Shared
ownership
properties
under
construction
Total housing
properties
£’000 £’000 £’000 £’000 £’000
Cost
At start of the year 527,359 48,029 56,207 595 632,190
Additions to properties acquired (123) 49,120 35 5,129 54,161
Capitalised administration costs - 1,281 (3) 71 1,349
Interest capitalised - 1,411 - 78 1,489
Transfers to/from stock - - (86) (1,996) (2,082)
Reclassification (509) - 509 - -
Component replacements 2,757 - - - 2,757
Components replaced (968) 1 - - (967)
Schemes completed 84,706 (84,706) 2,609 (2,609) -
Disposals (4,194) - (2,499) - (6,693)
At end of the year 609,028 15,136 56,772 1,268 682,204
Depreciation and impairment
At start of the year 60,432 - 3,090 - 63,522
Charge for the year 7,495 - 420 - 7,915
Components replaced (968) - - - (968)
Reclassification (30) - 30 - -
Disposals (378) - (112) - (490)
At end of the year 66,551 - 3,428 - 69,979
Net book value:
At 31 March 2018 542,477 15,136 53,344 1,268 612,225
At 31 March 2017 466,927 48,029 53,117 595 568,668
Group 2018 2017
£’000 £’000
Works to existing properties in the year:
Improvement works capitalised 2,757 2,653
Amounts charged to expenditure 5,648 6,387
Total 8,405 9,040

Other fixed assetsLand and
buildings
Furniture and
equipment
Motor
vehicles
Total other
fixed assets
£’000 £’000 £’000 £’000
Cost
At start of the year 7,383 5,961 363 13,707
Additions to properties acquired 48 248 167 463
Disposals - (427) (113) (540)
At end of the year 7,431 5,782 417 13,630
Depreciation and impairment
At start of the year 1,997 3,326 169 5,492
Charge for the year 249 446 71 766
Disposals - (424) (74) (498)
At end of the year 2,246 3,348 166 5,760
Net book value:
At 31 March 2018 5,185 2,434 251 7,870
At 31 March 2017 5,386 2,635 194 8,215
Group 2018 2017
£’000 £’000
At start of year 192 192
At end of year 192 192

2018 2017 2018 2017
£'000 £'000 £'000 £'000
First tranche shared ownership properties
Completed 718 589 - -
Work in progress 2,398 402 - -
Outright sale properties
Completed - 44 - -
Stock 165 173 165 173
Total 3,280 1,208 165 173
Group Association
2018 2017 2018 2017
£'000 £'000 £'000 £'000
Restated
Rent arrears 2,083 1,871 - -
Less: provision for bad debts (983) (864) - -
Sub-total 1,100 1,007 - -
Prepayments and accrued income 3,748 2,825 420 675
Amounts owed by group undertakings - - 44 237
Other taxation and social security 35 16 35 16
Deferred tax 490 505 490 505
Other debtors 2,632 1,285 2 -
Lease debtor 655 110 - -
Total 8,660 5,748 991 1,433
Group Association

2018 2017 2018 2017
£'000 £'000 £'000 £'000
Cash at bank 43,331 43,997 94 43
Total 43,331 43,997 94 43
Group Association
2018 2017 2018 2017
£'000 £'000 £'000 £'000
Restated Restated
Loans and overdrafts (Note 19b) 15,908 4,459 - -
Trade creditors 1,172 1,165 326 110
Amounts owed to group undertakings - - 31 200
Funds held on behalf of homeowners 934 798 - -
Rents and service charges paid in advance 1,848 1,857 - 216
Deferred tax 38 46 - -
Other taxation and social security payable 526 412 0 -
Accruals and deferred income 6,472 9,751 431 461
Deferred capital grant (Note 20) 2,639 2,486 - -
Recycled capital grant fund (Note 21) 806 706 - -
Disposal proceeds fund (Note 22) 101 - - -
Other creditors 2,843 1,784 218 -
SHPS pension agreement plan (Note 30) 1,086 636 425 408
Total 34,373 24,100 1,431 1,395
Group Association
2018 2017 2018 2017
£'000 £'000 £'000 £'000
Restated Restated
Social housing loans (Note 19b) 283,348 269,790 - -
Deferred capital grant (Note 20) 234,255 228,724 - -
Recycled capital grant fund (Note 21) 2,422 1,236 - -
Disposal proceeds fund (Note 22) 71 242 - -
Local authority loan 105 - - -
SHPS pension agreement plan (Note 30) 5,682 7,175 1,890 2,311
Total 525,883 507,167 1,890 2,311
Group Association

Group 2018 2017
£’000 £’000
Social housing loans
Loans repayable by instalments:
Within one year 3,908 4,431
In one year or more but less than two years 3,992 4,525
In two years or more but less than five years 31,048 14,023
In five years or more 157,243 171,518
Loans not repayable by instalments:
Within one year 12,000 -
In one year or more but less than two years 12,000 -
In two years or more but less than five years 21,014 33,014
In five years or more 62,026 49,400
Fair value adjustment on financial instruments 701 780
Less: loan issue costs (4,677) (3,846)
Non housing loans
Loans repayable by instalments:
Within one year - 28
In one year or more but less than two years - 28
In two years or more but less than five years - 85
In five years or more - 263
Total loans 299,255 274,249
The interest rate profile of the Group at 31 March
2018 was: Total Variable rate Fixed rate
Weighted
average rate
Weighted
average term
£’000 £’000 £’000 % Years
Instalment loans 196,192 - 196,192
Non-instalment loans 105,414 56,014 49,400
Total loans 301,606 56,014 245,592 4.55 21.7
At 31 March 2018 the Group had the following borrowing facilities: £’000
Undrawn facilities 83,500
Total 83,500

Group 2018 2017
£'000 £'000
At start of the year 231,210 226,922
Grant received in the year 10,377 9,516
Disposals (1,611) (2,797)
Released to income in the year (2,931) (2,431)
Adjustment (150) -
At end of the year 236,895 231,210
Amount due to be released within one year 2,639 2,486
Amount due to be released after more than one year 234,255 228,724
Total 236,894 231,210
Group 2018 2017
£’000 £’000
At the start of the year 1,942 1,932
Inputs: grants to recycle 1,414 1,194
Interest accrued 7 2
Recycling: grants recycled (135) (1,186)
At the end of the year 3,228 1,942
Amount three years or older where repayment may be required - -
Group 2018 2017
£’000 £’000
At the start of the year 242 420
Net PRTB receipts - 69
Interest accrued (70) (247)
At the end of the year 172 242
Amount three years or older where repayment may be required - -

Association 2018 2017
£ £
Allotted issued and fully paid
At the start of the year 10 9
Issued during the year - 1
At the end of the year 10 10
Group 2018 2017
£’000 £’000
Capital expenditure contracted for but not provided for in the Financial Statements 25,760 43,703
Capital expenditure authorised by the Board but not yet been contracted for 36,158 69,271
Total 61,918 112,974
The Group expects these commitments to be financed with:
Social housing grant 9,271 16,504
Proceeds from the sales of properties 3,590 1,821
Committed loan facilities and surpluses generated from operating activities 49,057 94,649
Total 61,918 112,974
Operating lease payment obligations are as follows:
2018 2017 2018 2017
£'000 £'000 £'000 £'000
Land and buildings:
Within one year 161 186 - -
In one year or more but less than five years 518 585 - -
In five years or more 622 698 - -
Others:
Within one year 637 589 637 589
In one year or more but less than five years 678 1,093 678 1,093
In five years or more - - - -
Total 2,616 3,151 1,315 1,682
Group Association

Group 2018 2017
£’000 £’000
The total accumulated government grant and financial assistance received or receivable at 31
March:
Held as deferred capital grant (Note 20) 236,894 231,210
Recognised as income in Statement of Comprehensive Income 32,369 29,699
Total 269,263 260,909


2018 2017 2016
£’000 £’000 £’000
Present value of provision (Group) 6,769 7,811 8,431
Present value of provision (Association) 2,315 2,719 2,983
£’000 £’000 £’000 £’000
Group Association Group Association
Provision at 1 April 7,811 2,720 8,431 2,984
Unwinding of the discount factor (interest expense) 95 32 163 57
Deficit contribution paid (1,044) (408) (1,006) (392)
Remeasurements - impact of any change in assumptions (94) (29) 223 71
Provision at 31 March 6,768 2,315 7,811 2,720
2018 2017

£’000 £’000 £’000 £’000
Group Association Group Association
Interest expense 95 32 163 57
Remeasurements – impact of any change in assumptions (94) (29) 223 71
Contributions paid in respect of future service 1,243 781 1,231 776
Costs recognised in Statement of Comprehensive Income 1,244 784 1,617 904
2018 2017


Assets Obligations
Net (liability) /
asset
£’000 £’000 £’000
Fair value of plan assets 2,199 - 2,199
Present value of funded liabilities - 3,058 (3,058)
Opening position as at 1 April 2017 2,199 3,058 (859)
Service cost
Current service cost* - 78 (78)
Total service cost - 78 (78)
Net interest
Interest income on plan assets 57 - 57
Interest cost on defined benefit obligation - 80 (80)
Total net interest 57 80 (23)
Total defined benefit cost recognised in surplus or (deficit) 57 158 (101)
Cashflows
Plan participants' contributions 12 12 -
Employer contributions 37 - 37
Benefits paid (56) (56) -
Expected closing position 2,249 3,172 (923)
Remeasurements
Changes in financial assumptions - (61) 61
Return on assets excluding amounts included in net interest 10 - 10
Total remeasurements recognised in Other Comprehensive Income 10 (61) 71
Fair value of plan assets 2,259 - 2,259
Present value of funded liabilities - 3,111 (3,111)
Closing position as at 31 March 2018 2,259 3,111 (852)
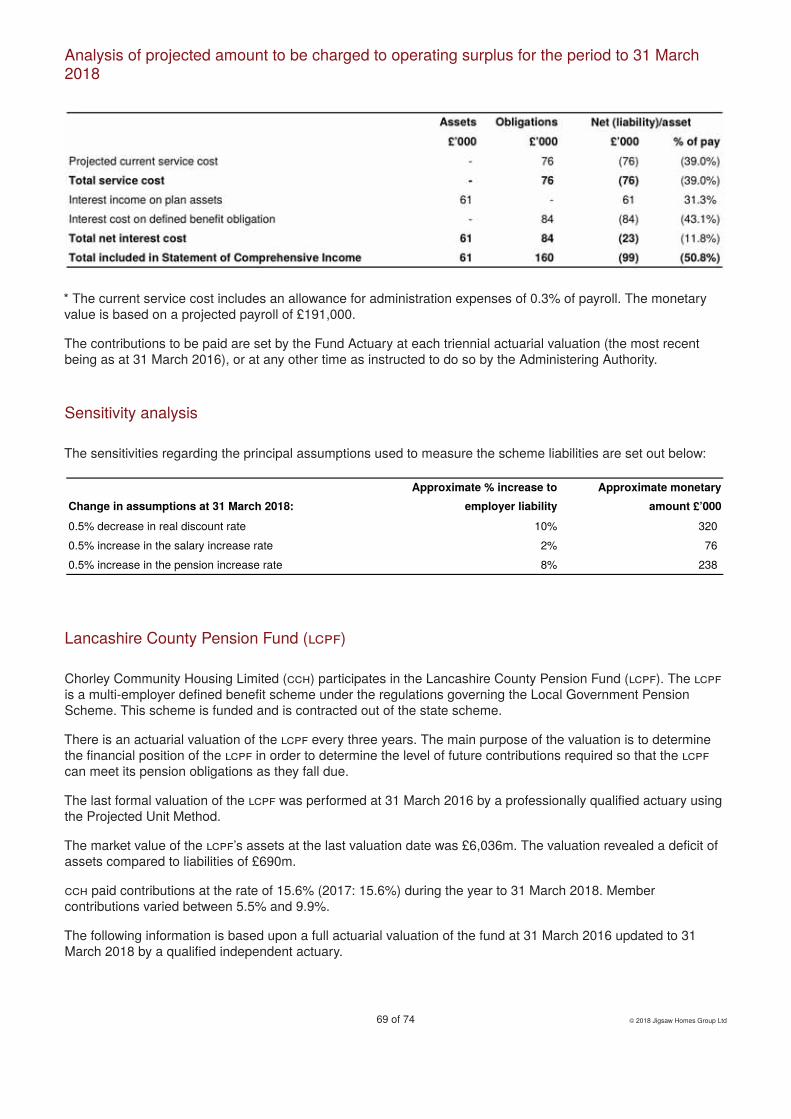
Change in assumptions at 31 March 2018:
Approximate % increase to
employer liability
Approximate monetary
amount £’000
0.5% decrease in real discount rate 10% 320
0.5% increase in the salary increase rate 2% 76
0.5% increase in the pension increase rate 8% 238


Ambergate, WiganRe�rement Living