Embed Size (px)
Citation preview
Gene 436 (2009) 12–22
Contents lists available at ScienceDirect
Gene
j ourna l homepage: www.e lsev ie r.com/ locate /gene
Repetitive DNA elements, nucleosome binding and human gene expression
Ahsan Huda a, Leonardo Mariño-Ramírez b,c, David Landsman b, I. King Jordan a,⁎a School of Biology, Georgia Institute of Technology, 310 Ferst Drive, Atlanta, GA 30332, USAb National Center for Biotechnology Information, National Library of Medicine, National Institutes of Health, Bethesda, MD 20894, USAc Computational Biology and Bioinformatics Unit, Biotechnology and Bioindustry Center, Corporacion Colombiana de InvestigacionAgropecuaria - CORPOICA, Km. 14 Via a Mosquera, Bogota, Colombia
Abbreviations: TE, transposable element; SSR, stranscriptional start site; GNF2, Novartis mammalian ge⁎ Corresponding author. Tel.: +1 404 385 2224; fax:
E-mail address: [email protected] (I.K
0378-1119/$ – see front matter © 2009 Elsevier B.V. Aldoi:10.1016/j.gene.2009.01.013
a b s t r a c t
a r t i c l e i n f oArticle history:
We evaluated the epigeneti Received 22 January 2009Accepted 23 January 2009Available online 5 February 2009Received by M. Batzer
Keywords:Transposable elementsNucleosome bindingEpigeneticsSimple sequence repeatsGene regulationPromoter architectureHuman genome
c contributions of repetitive DNA elements to human gene regulation. Humanproximal promoter sequences show distinct distributions of transposable elements (TEs) and simple sequencerepeats (SSRs). TEs are enriched distal from transcriptional start sites (TSSs) and their frequency decreases closerto TSSs, being largely absent from the core promoter region. SSRs, on the other hand, are found at low frequencydistal to the TSS and then increase in frequency starting ∼150 bp upstream of the TSS. The peak of SSR density iscentered around the −35 bp position where the basal transcriptional machinery assembles. These trends inrepetitive sequence distribution are strongly correlated, positively for TEs and negatively for SSRs, with relativenucleosome binding affinities along the promoters. Nucleosomes bind with highest probability distal from theTSS and the nucleosomebinding affinity steadily decreases reaching its nadir just upstreamof the TSS at the samepoint where SSR frequency is at its highest. Promoters that are enriched for TEs are more highly and broadlyexpressed, on average, than promoters that are devoid of TEs. In addition, promoters that have similar repetitiveDNA profiles regulate genes that have more similar expression patterns and encode proteins with more similarfunctions than promoters that differ with respect to their repetitive DNA. Furthermore, distinct repetitive DNApromoter profiles are correlated with tissue-specific patterns of expression. These observations indicate thatrepetitive DNA elementsmediate chromatin accessibility in proximal promoter regions and the repeat content ofpromoters is relevant to both gene expression and function.
© 2009 Elsevier B.V. All rights reserved.
1. Introduction
The prevalence of repetitive DNA sequences inmammalian genomeshas been appreciated since the classic re-association kinetic (COT-curve)experiments of the late nineteen-sixties (Britten and Kohne, 1968). Thecompletion of the human genomeprojects at the turn of themillenniumfurther underscored the extent towhich thehumangenomesequence ismade up of repetitive DNA elements (Lander et al., 2001; Venter et al.,2001). There are several distinct categories of repetitive sequence ele-ments in the human genome. Interspersed repeat sequences, alsoknown as transposable elements (TEs), make up at least 45% of theeuchromatic genome sequence, and novel human TE families continueto be discovered and characterized (Wang et al., 2005; Nishihara et al.,2006). Simple sequence repeats (SSRs) consist of tandem repeats ofexact or nearly exact units of length k (k-mers), with k=1–13 corres-ponding to microsatellites and k=1–500 for minisatellites. Analysis ofthe human genome sequence showed that ∼3% of the euchromaticsequencewasmade up of SSRs, and both SSRs and TEs are thought to be
imple sequence repeat; TSS,ne expresssion atlas 2.+1 404 894 0519.. Jordan).
l rights reserved.
far more abundant in heterochromatin. Segmental duplications of 1–200 kb were initially shown to account for ∼3% of the human genomesequence (Lander et al., 2001), and more recent results reveal that copynumber variants populate the genome to aneven greater extent (Kidd etal., 2008).
The evolutionary significance and the functional role that repetitivegenomic elements, TEs in particular, play has long been a matter ofspeculation and inquiry. Once regarded as selfish, or parasitic, genomicelementswith little or no phenotypic relevance (Doolittle and Sapienza,1980;Orgel andCrick,1980), it has since becomeapparent thatTEsmakesubstantial contributions to the structure, function and evolution oftheir host genomes (Kidwell and Lisch, 2001). Perhaps the mostsignificant functional effect that TEs have had on their host genomes ismanifest through the donation of regulatory sequences that control theexpression of nearby genes (Feschotte, 2008). Studies of TE regulatoryeffects have focused, for the most part, on discrete well characterizedregulatory elements such as transcription factor binding sites (Jordanet al., 2003; van de Lagemaat et al., 2003; Wang et al., 2007), enhancers(Bejerano et al., 2006) and alternative promoters (Dunn et al., 2003;Conley et al., 2008). A number of recent studies have also outlined thecontributions of TEs to regulatory RNA genes (Smalheiser and Torvik,2005; Borchert et al., 2006; Piriyapongsa and Jordan, 2007; Piriyapongsaet al., 2007). For this study, we sought to analyze the contribution of
13A. Huda et al. / Gene 436 (2009) 12–22
repetitive DNA to epigenetic aspects of gene regulation, specifically therelationship between repetitive DNA elements and the chromatinenvironment of human promoter sequences.
Genomic DNA in eukaryotes is wrapped around histone proteinsand packaged into repeating subunits of chromatin called nucleo-somes (Kornberg and Lorch, 1999). The importance of specificgenomic sequences in determining the binding locations of nucleo-somes has recently been confirmed (Segal et al., 2006). A number offactors point to a relationship between repetitive DNA elements, thelocal chromatin environment and epigenetic gene regulation. Denselycompact heterochromatin is enriched for both TEs and SSRs in anumber eukaryotic organisms (Dimitri and Junakovic, 1999). Hetero-chromatin functions to mitigate potentially deleterious effectsassociated with TEs by repressing both element transcription andectopic recombination between dispersed element sequences (Grewaland Jia, 2007). In fact, it has been proposed that heterochromatinoriginally evolved to serve as a genome defense mechanism bysilencing TEs (Henikoff and Matzke, 1997; Henikoff, 2000). In theplant Arabidopsis, de novo heterochromatin formation can be causedby insertions of TEs into euchromatin, and TEs are able toepigenetically silence genes when they are inserted nearby or insidethem (Lippman et al., 2004). In other words, TEs have been shown tocause specific in situ changes in the chromatin environment that canspread locally and regulate gene expression in a way that is region-specific but sequence-independent (i.e. epigenetic).
The previously established connections between genome repeats,chromatin environment and gene regulation for model organisms,taken together with the repeat-rich nature of the human genome,suggest that repetitive sequence elements may play a role inregulating human gene expression by modulating the local chromatinenvironment. Specifically, we hypothesized that gene regulatoryrelated differences in nucleosome binding at human promotersequences are mediated in part by repetitive genomic elements. Weevaluated the relationship between nucleosome binding, repetitiveelement promoter distributions and human gene expression to testthis idea. Human proximal promoter sequences were characterizedwith respect to both their repetitive DNA architectures and predictednucleosome binding affinities, and the repetitive DNA environment ofthe promoters was considered with respect to patterns of geneexpression.
2. Materials and methods
2.1. Promoter sequence analysis
Our analysis focused on proximal promoter sequence regions,which we define for a gene as ranging from−1 kb at the 5′ end to thetranscription start (TSS) at the 3′ end. We relied on the Database ofTranscriptional Start Sites (DBTSS) to identify experimentally charac-terized TSS, based on aligned full-length cDNA sequences, in thehuman genome (Suzuki et al., 2002). These TSS were mapped to theMarch 2006 human genome reference sequence (NCBI Build 36.1) andused to extract 1 kb proximal promoter sequences as describedpreviously (Marino-Ramirez et al., 2004; Tharakaraman et al., 2005).This procedure was used to ensure analysis of the most accurate set ofhuman proximal promoter sequences possible. For the additionalthree mammalian species analyzed – chimpanzee (Pan troglodytes),mouse (Mus musculus) and rat (Rattus norvegicus) – the locations ofproximal promoter sequences were determined based on the 5′ mostposition of NCBI Refseq gene models (Pruitt et al., 2007). Thesepositions were used to download 1 kb proximal promoter sequencesfrom the latest respective genome builds for each organism from theUCSC Genome Browser (Karolchik et al., 2003): chimpanzeen=24,170, mouse n=20,589 and rat n=8737.
The program RepeatMasker (Smit et al., 1996–2004) was used todetect and annotate repetitive elements in the proximal promoter
sequences. RepeatMasker was run using 500 bp of flanking sequenceon either end of the proximal promoter regions analyzed to avoid edgeeffects in the detection of repeats. Repetitive elements detected byRepeatMasker were broken down into two main categories: inter-spersed repeats, also known as transposable elements (TEs), andsimple sequence repeats (SSRs). SSRs may be annotated as lowcomplexity sequences and correspond to runs of repeating k-merswhere k=1–13 bp for microsatellites and k=14–500 for minisatel-lites. TEs were further divided into specific classes: LINEs, SINEs, LTRand DNA as well as specific families L1 and Alu.
Proximal promoter sequences, including 500 bp flanks, wereanalyzed using the Nucleosome Prediction software developed by theSegal lab (Segal et al., 2006). This software was used to calculate theprobability of each nucleotide being occupied by a nucleosome in allpromoter sequences. These nucleosome occupancy probabilities arebased on the periodicity of dinucleotides – AA/TT/TA – that are acharacteristic of genomic sequences that have been experimentallyisolated as bound to nucleosomes. Predictions for the relativeplacement of nucleosomes along genomic sequence are furtherinformed by a thermodynamic stability model. The nucleosomeprediction model used in our analysis is based on experimentallycharacterized nucleosome bound sequences reported for chicken(Satchwell et al., 1986). The chicken model has been proven accuratewhen used on other vertebrate genomes (Segal et al., 2006). For setsof promoter sequences, nucleosome occupancy averages werecalculated over each position of the 1 kb proximal promoter regionsand these average values were taken as the position-specificnucleosome binding affinities (nba) reported here.
Two sets of promoter sequence randomizations were done andposition-specific nucleosome binding affinities were re-calculated onthe randomized sequence sets. The first randomization consisted ofrandomly shuffling entire 1 kb proximal promoter sequences. This hasthe effect of maintaining overall nucleotide composition of thepromoter sequences while changing the dinucleotide composition aswell as any regional nucleotide biases along the promoters. Thesecond randomization procedure consisted on randomly shufflingnon-overlapping 100 bp windows along the promoter sequences inplace. This has the effect of maintaining both overall and localnucleotide compositions of the promoters while changing thedinucleotide composition.
2.2. Repeat-based promoter clustering
Human proximal promoter sequences were clustered solely basedon their repetitive DNA architectures. To do this, we generated 1000-unit vectors that represent the position-specific repeat content foreach promoter sequence. A discrete value was assigned to eachpromoter sequence position (nucleotide) in the following manner:
Xi =1 if thenucleotide is part of a TE sequence
−1 if thenucleotide is part of a SSR sequence0 if thenucleotide is part of a non−repetitive sequence
8<:
where Xi represents the nucleotide at position i.Promoter sequence repeat vectors were then clustered using a
combination of k-means clustering (k=5, 10, 20) and Self OrganizedMapping using the program Genesis (Sturn et al., 2002). We foundthat using k-means clustering with k=5 followed by a Self OrganizedMap generated the most coherent clusters in terms of the repeatcontent of the vectors.
2.3. Gene expression analysis
We used version 2 of the Novartis mammalian gene expressionatlas (GNF2), which provides replicate Affymetrix microarray data for44,775 probes across 79 human tissues (Su et al., 2004). GNF2
14 A. Huda et al. / Gene 436 (2009) 12–22
expression data, in the form of Affymetrix signal intensity values, wereobtained from the UCSC Table Browser (Karolchik et al., 2004), andAffymetrix probes were mapped to NCBI Refseq identifiers using theUCSC Table Browser tools. For each gene, the average, maximum andbreadth of expression were computed across the 79 tissues in theGNF2 data set. Expression breadth is taken as the number of tissueswhere the gene has a signal intensity value of N350. Co-expressionbetween gene pairs was measured by computing the Pearsoncorrelation coefficient (r) between pairs of gene-specific expressionsignal intensity vectors:
gi = t1; t2 N t79½ �where gi is the ith gene and tn is the expression level for that gene inthe nth tissue.
For each repeat-specific promoter cluster, the average r-value forall pairwise comparisons between genes in the cluster was computed.In addition, the difference (diff) between the cluster-specific r-valueaverages (cluster-r) and all possible pairwise r-values between genes(all-r) was computed for each cluster:
diff =cluster−r−all−r:
The significance of these differences was computed using thenormal deviate:
z= diff =sediff
where sediff is the standard error of the difference.
2.4. Probabilistic analysis of promoter repeats
We used a probabilistic representation of the repeat content of thehuman proximal promoter sequence clusters in order to derive gene(promoter)-specific similarity scores that indicate the probability thatany human gene (promoter) belongs to a specific repeat cluster. To dothis, each proximal promoter sequence (1 kb upstream of the TSS) in acluster was divided into 20 non-overlapping windows of 50 bp each.For each window (w), the probability (p) of the occurrence of a TEnucleotide, or SSR nucleotide or a non-repetitive (NR) nucleotide wascalculated separately using the following formula:
p b;wð Þ= fb;w + s bð ÞN+
XbVa T;S;Nf g
s bVð Þ
where fb,w=counts of base b in window w and b represents counts ofeither TE nucleotides, or SSR nucleotides or non-repetitive nucleo-tides, N=number of sites in the window (50) and s(b)=apseudocount function. The probabilities thus calculated for eachwindowwere averaged for all promoters in the cluster. This procedurewas repeated to yield repetitive DNA probabilistic representationmodels for each of the six promoter clusters.
All the proximal promoter sequences analyzed were then scoredagainst each of the six cluster-specific probabilisticmodels using a log-likelihood ratio approach illustrated as follows:
LLb;w = lnX
TE;SSR;NR
fb;wlnfb;wfb
where fb,w=pb,w×50, which is the model frequency used as back-ground. Promoter-specific scores (S) were then computed as the sumof log-likelihood ratios over the 20 windows of 50 bp each:
S=X20w = 1
LLb;w:
Using this method, we scored all genes (promoters) against each ofthe six cluster models to generate six cluster-specific gene (promoter)score vectors. This modeling and scoring method is a modification of
the approach used to score sequence motifs, such as transcriptionfactor binding sites, based on motif-characteristic position-weightmatrices (Wasserman and Sandelin, 2004).
In order to relate promoter sequence repetitive DNA architectureto tissue-specific gene expression, the gene (promoter)-specificprobabilistic repeat cluster scores were correlated with tissue-specificgene expression signal intensity values for each of the 79 tissues inGNF. This was repeated with gene (promoter)-specific scores assignedto each gene for each of the six repeat clusters. For example, for thecluster1 (c1) versus tissue1 (t1) comparison:
c1= Sg1; Sg2 N Sg7913� �
x t1= eg1; eg2 N eg7913� �
where gi is the ith gene, S is the score for the cluster1 model and e isthe expression level for that gene in tissue1. In other words, each geneanalyzed is assigned a repeat probability score for each of the sixclusters, and these six sets of repeat probability promoter scores areindividually correlated with the GNF2 tissue-specific expressionvalues for the genes. This procedure resulted in a 6×79 matrix ofcorrelation values.
2.5. Gene Ontology (GO) analysis
GO annotation terms (Ashburner et al., 2000) for human geneswere obtained from the Gene Ontology Annotation database (http://www.ebi.ac.uk/GOA/). GO terms were further mapped to higher levelGO slim categories. Expected versus observed frequencies of GO slimterms were compared using χ2 tests for each promoter repeat cluster,as well as for the combined TE− and TE+ groups, in order to look forover-represented GO slim categories. The pairwise similarity betweenGO terms was computed using modified semantic similarity method(Lord et al., 2003; Azuaje et al., 2005) as described previously(Marino-Ramirez et al., 2006; Tsaparas et al., 2006). The GO similaritydifference (GOdiff) was calculated between the average pairwisesimilarity for GO terms from pairs of genes within TE groups (e.g. TE+) and the average pairwise GO similarity for all possible pairs ofgenes:
GOdiff = GOsim− TE+ð Þ−GOsim− allð Þ:
The significance of the difference was measured using the normaldeviate as described for the gene expression analysis.
2.6. Statistical analysis
Standard statistical tests were used to compare population meansfor pairwise (Student's t-test) and for multiple comparisons (ANOVA),to correlated vectors of nucleosome binding affinities, TE and SSRdensities, expression and promoter score values (Pearson correlationcoefficient), to control for the confounding effects ofmultiple variableson correlation values obtained (partial correlation) and to evaluate thedifference between observed and expected GO terms (χ2) (Zar, 1999).
3. Results and discussion
3.1. Repetitive DNA and nucleosome binding affinity
Experimentally characterized human gene proximal promotersequences (n=7913) were taken from the Database of TranscriptionalStart Sites (DBTSS) (Suzuki et al., 2002) and analyzed with respect totheir repetitive DNA content and nucleosome binding affinities. Thelocations of repetitive DNA elements along promoter sequences weredetermined by the RepeatMasker program and nucleosome bindingaffinities were predicted using the method of (Segal et al. (2006). Twoclasses of repetitive DNA were analyzed separately: interspersedrepeats, also known as transposable elements (TEs) and simplesequence repeats (SSRs), which are made up of runs of exact or nearly
15A. Huda et al. / Gene 436 (2009) 12–22
exact repeating k-mers. For each promoter position, from 1 kbupstream to the transcriptional start site (TSS), the average TE andSSR densities over all promoter sequences were calculated as thefraction of sequences for which that position was occupied by a TE orSSR. Average nucleosome binding affinities across promoter positionswere calculated as the fraction of sequences for which a given positionwas predicted to be occupied (bound) by a nucleosome. Averagenucleosome binding affinities and the average TE density followparallel trends along the proximal promoter regions (Fig. 1a).Nucleosomes bind more tightly and TEs are found more frequentlydistal to the TSS, whereas nucleosomes bind promoter sequencesmostproximal to the TSSwith lower affinity and TEs are rarely found close tothe TSS. SSRs show a distinctly different trend with a higher densityclose to the TSS that corresponds to the decrease in nucleosomebinding affinity. The SSR density matches the nucleosome bindingeven more closely than the TE density just upstream of the TSS.Nucleosome binding affinities decrease steadily from distal regionsuntil∼35 bp upstreamof the TSS, then the nucleosome binding affinityincreases towards the TSS. Similarly, the SSR density increases to thesame point and then drops off as the nucleosome binding affinityincreases (Fig. 1a). This core promoter region where nucleosomebinding affinity is at its lowest and SSR density is at its highestcorresponds to the locationwhere the basal transcriptional machineryassembles, and RNA polymerase II binds, to initiate transcription.
The correlations between nucleosome binding affinities with TEand SSR densities along human proximal promoter regions are robustand highly statistically significant (Fig. 1b). Previously, we observed
Fig. 1. Repetitive DNA density and nucleosome binding affinity along human proximalpromoter sequences. (a) Average nucleosome binding affinities (green line, values onleft y-axis) along with average TE densities (blue line, values on right y-axis) andaverage SSR densities (pink line, values on right y-axis) over 7913 human proximalpromoter sequences are plotted over each promoter position starting from −1000 bpupstream and progressing to the transcriptional start site (TSS at position 0). (b) Lineartrends and correlations relating position-specific nucleosome binding affinities (y-axis)to TE (blue) and SSR (pink) densities (x-axis) are shown. Statistical significance levelsof the r-values are based on the Student's t-distribution with df=n−2=998 wheret= r⁎sqrt((n−2)/(1−r2)).
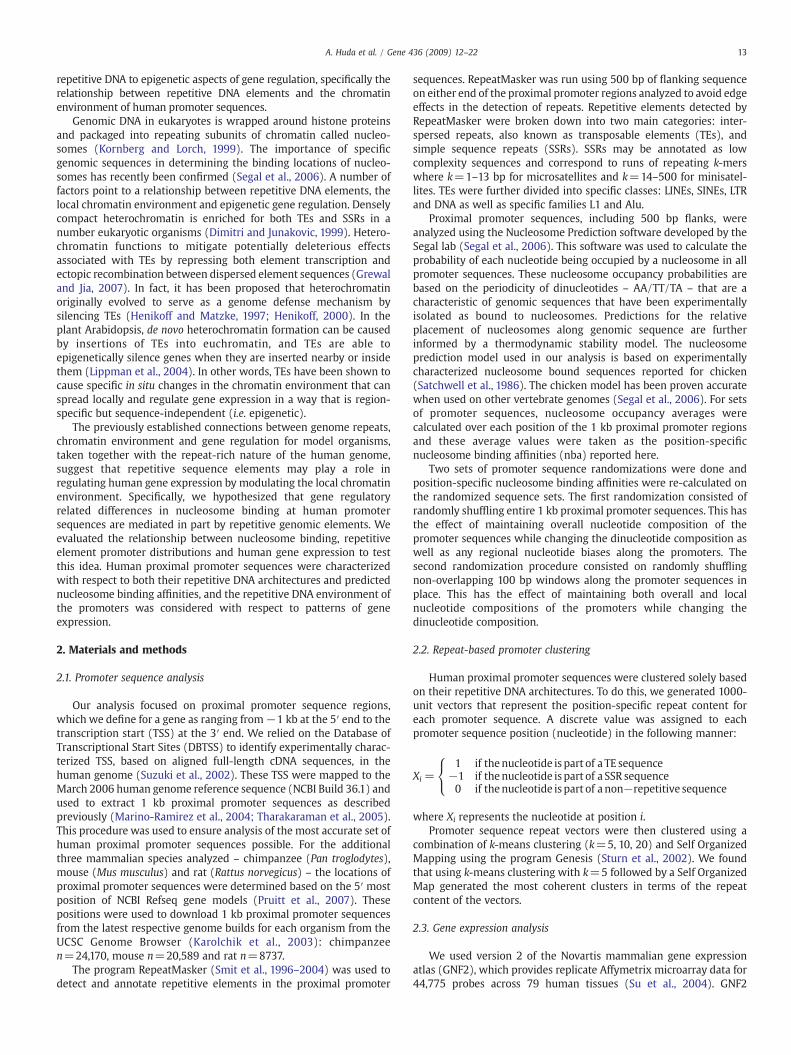
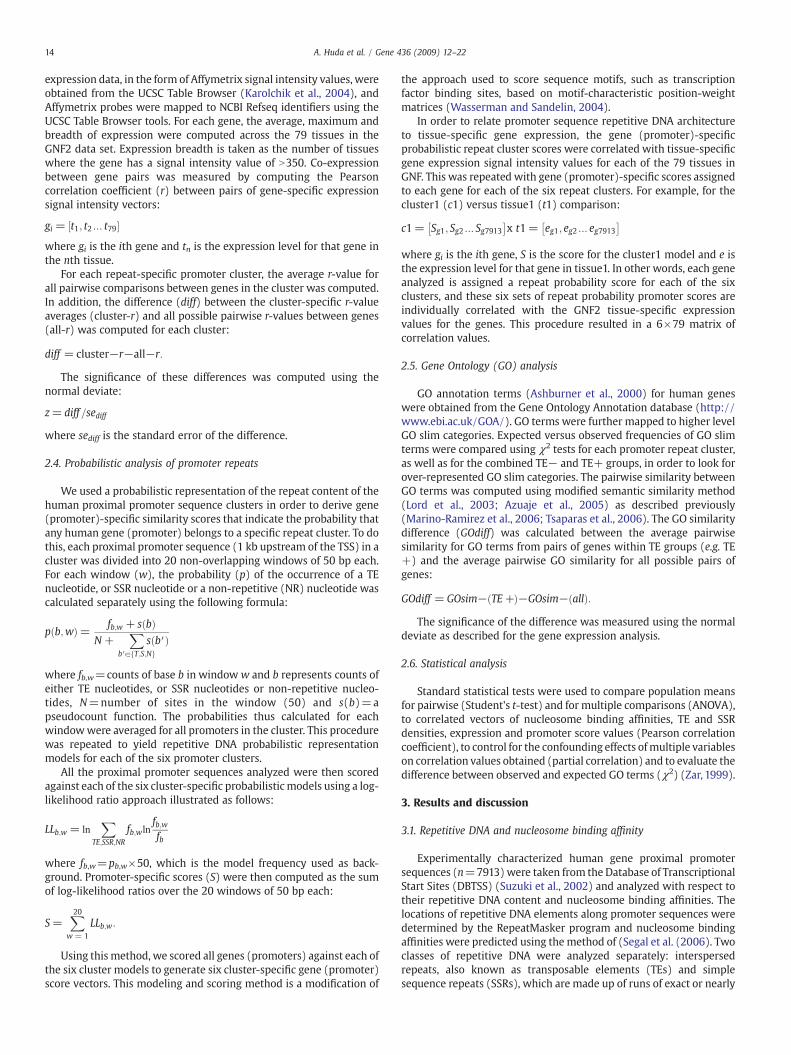
Fig. 2. Nucleosome binding properties for repetitive versus non-repetitive DNA. (a)Average predicted nucleosome binding affinities are shown for TE, SSR and non-repetitive human promoter sequences. (b) Periodicity of the nucleosome binding(wrapping) characteristic dinucleotides AA/TT/TA are shown for 39 experimentallycharacterized nucleosome bound TE sequences from chicken. (c) Histogram showingthe inter-peak distances for AA/TT/TA dinucleotides.
that nucleotide composition changesmarkedly along human proximalpromoter sequences with an increase in CpG frequency close to theTSS (Marino-Ramirez et al., 2004), while the nucleosome binding
Table 1Average⁎ nucleosome binding affinities for TE classes (families)
TE class (family)a Avg nba±s.e.b
L1 0.849±6.8e–4LINE other 0.805±7.6e–4Alu 0.510±5.2e–4SINE other 0.789±7.0e–4LTR 0.807±7.9e–4DNA 0.802±9.8e–4
a TEs are broken down by class (family) using RepeatMasker. The L1 and Alu familiesare considered separately from all other LINEs and SINEs respectively. All LTR and DNAelements are considered together as classes.
b Average nucleotide binding affinities±standard errors.⁎ All differences are statistically significant (ANOVA, F=2.8e4, P≈0).
16 A. Huda et al. / Gene 436 (2009) 12–22
prediction method we employed in this analysis relies on theperiodicity of AT-rich dinucleotides (Segal et al., 2006). Thus, it ispossible that the high (low) nucleosome binding affinity of TE (SSR)sequences in proximal promoter regions is a corollary effect of localdifferences in nucleotide composition. We attempted to control forthis possibility in several ways. First of all, average nucleosomebinding affinities were computed for all TE, SSR and non-repetitivesequences irrespective of their locations along proximal promoterregions. On average, TE sequences bind nucleosomes most tightly,followed by non-repetitive DNA and SSRs, which have the lowestnucleosome affinities (Fig. 2a); all differences are highly statisticallysignificant (ANOVA, F=4.5e11, P≈0).
In addition to the binding affinity observations that are based onthe nucleosome prediction software, we also analyzed the nucleo-some wrapping characteristic AA/TT/TA dinucleotide frequenciesalong experimentally characterized nucleosome bound sequencesfrom chicken (Satchwell et al., 1986) that we identified as beingderived from TEs (n=39). The chicken TE sequences show thecharacteristic AA/TT/TA dinucleotide periodicity expected of nucleo-some bound sequences (Fig. 2b); in fact, the average distance betweendinucleotide peaks for these TE sequences is ∼10.3 bp, which is closeto the expected distance of 10.2 bp corresponding to one turn of the
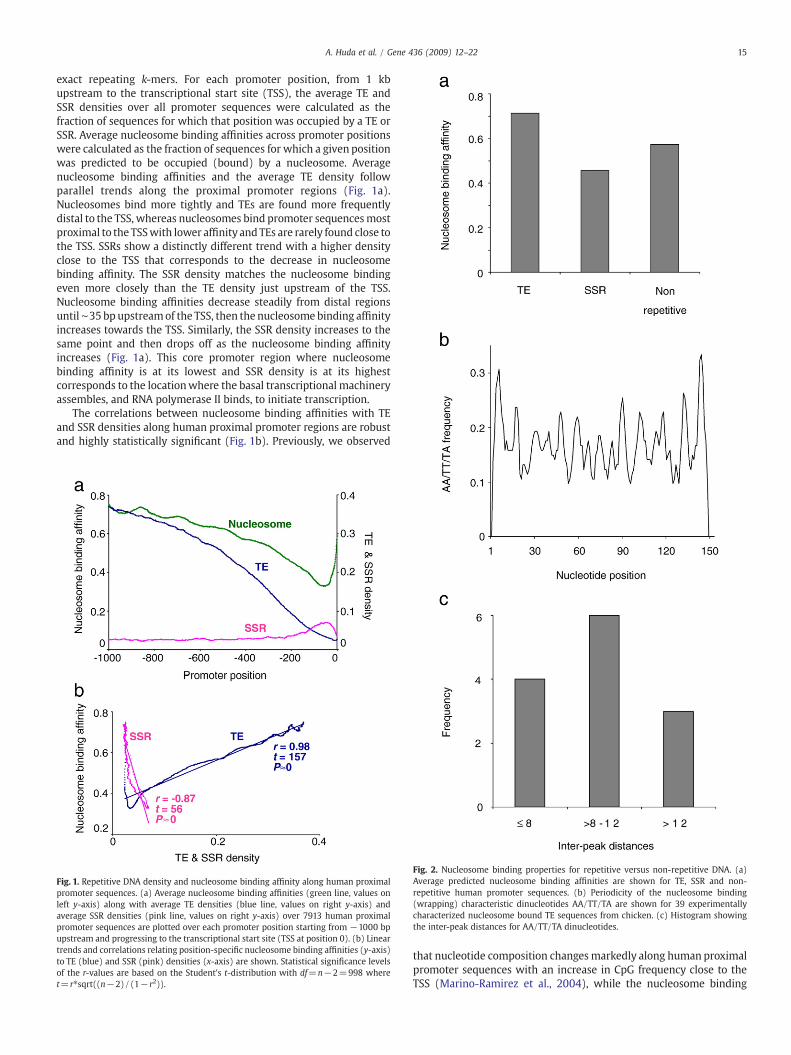
Fig. 3. Clusters of human proximal promoters based on their repetitive DNA sequence di−1000 bp upstream to the transcriptional start site (TSS). Promoter sequences are color cpositions occupied by TEs are shown in blue, SSR positions are shown in yellow and non-repnumber of sequences in each cluster. There are two (c1 and c2) clusters that contain promotfour clusters (TE+, c3–c6) contain increasing numbers of TEs.
DNA helix (Fig. 2c). This is significant because DNA sequences arethought to wrap around nucleosomes by bending sharply at eachrepeating turn of the DNA helix, and this sharp bending is facilitatedby the specific AA/TT/TA dinucleotides (Widom, 2001).
We also attempted to control for nucleotide composition effects byrandomizing promoter sequences and re-calculating nucleosomebinding affinities. First, entire 1 kb promoter sequences wererandomized and nucleosome binding affinities were re-calculated.This control procedure has the effect of eliminating both nativedinucleotide occurrences and local nucleotide composition biases. Theaverage nucleotide binding affinity for such randomized promotersequences (nba=0.16) is ∼3× lower than seen for the observedpromoter sequences (nba=0.49), and the difference betweenrandom and observed affinities is highly significant (t=23,P=5.3e–100). In addition to differences in the magnitude of thenucleosome binding affinities, the relative affinity trends along thepromoters were compared for the random versus observed sets.Partial correlation was used to control for the effects of the randomsequences on the observed relationship between nucleosome bindingaffinity with TE and SSR densities along proximal promoters. Thepositive (negative) correlations between nucleosome binding for TE(SSR) do not change when the correlations between randomsequences and nucleosome binding along the promoters areaccounted for [rnba·TE|random1=0.99 and rnba·SSR|random1=0.85].
A second randomization procedure was done to account for localdifferences in nucleotide composition along proximal promotersequences. In this case, sequences were randomized within non-overlapping 100 bpwindows along thepromoters. This had the effect ofeliminating native dinucleotide occurrences while maintaining localnucleotide composition. Aswith the complete sequence randomizationprocedure, the locally randomized sequences have significantly lowernucleosome binding affinities (nba=0.23) than the observedsequences (nba=0.49), and this 2.1× difference is highly statisticallysignificant (t=17, P=5.0e–55). Clearly, local nucleotide compositionalone cannot explain the observed nucleosome binding affinities.However, the relative trends in nucleosome binding show different
stributions. Proximal promoter sequences are represented left-to-right from positionoded according to their repeat element distributions. Individual promoter nucleotideetitive positions are shown in black. The vertical size of the clusters corresponds to theers largely devoid of TE sequences (TE−), and the promoter sequences of the remaining
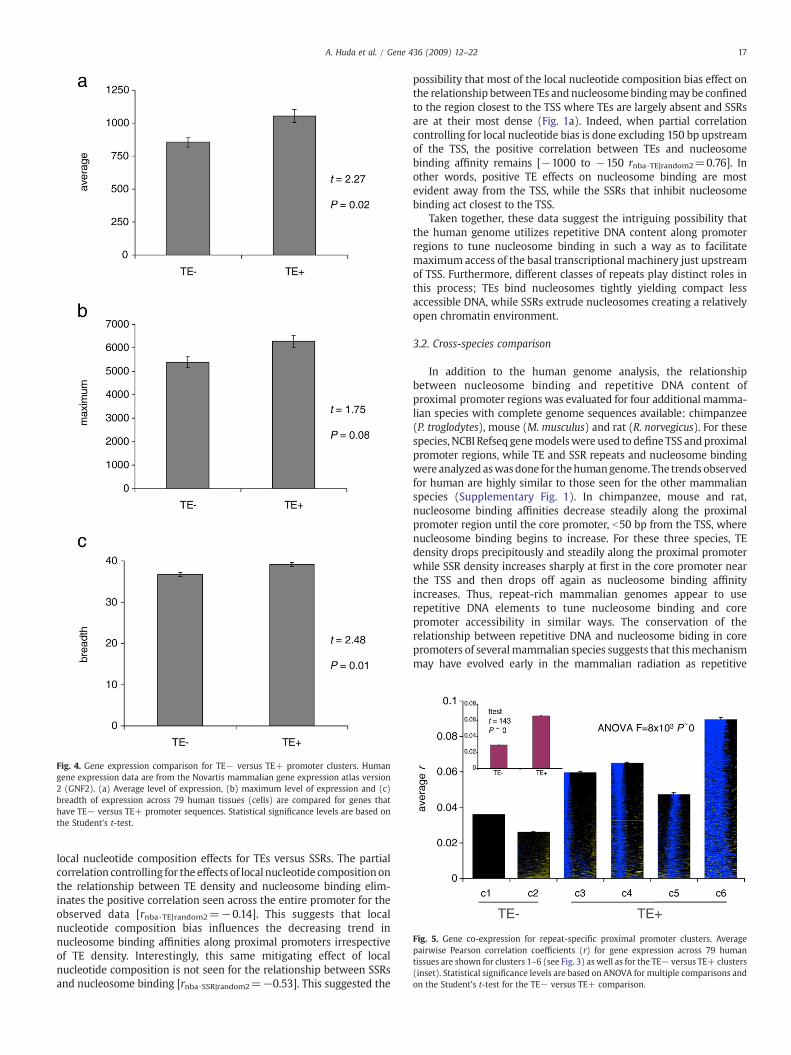
Fig. 4. Gene expression comparison for TE− versus TE+ promoter clusters. Humangene expression data are from the Novartis mammalian gene expression atlas version2 (GNF2). (a) Average level of expression, (b) maximum level of expression and (c)breadth of expression across 79 human tissues (cells) are compared for genes thathave TE− versus TE+ promoter sequences. Statistical significance levels are based onthe Student's t-test.
Fig. 5. Gene co-expression for repeat-specific proximal promoter clusters. Averagepairwise Pearson correlation coefficients (r) for gene expression across 79 humantissues are shown for clusters 1–6 (see Fig. 3) as well as for the TE− versus TE+ clusters(inset). Statistical significance levels are based on ANOVA for multiple comparisons andon the Student's t-test for the TE− versus TE+ comparison.
17A. Huda et al. / Gene 436 (2009) 12–22
local nucleotide composition effects for TEs versus SSRs. The partialcorrelation controlling for the effects of local nucleotide compositiononthe relationship between TE density and nucleosome binding elim-inates the positive correlation seen across the entire promoter for theobserved data [rnba·TE|random2=−0.14]. This suggests that localnucleotide composition bias influences the decreasing trend innucleosome binding affinities along proximal promoters irrespectiveof TE density. Interestingly, this same mitigating effect of localnucleotide composition is not seen for the relationship between SSRsand nucleosome binding [rnba·SSR|random2=−0.53]. This suggested the
possibility that most of the local nucleotide composition bias effect onthe relationship betweenTEs and nucleosome bindingmay be confinedto the region closest to the TSS where TEs are largely absent and SSRsare at their most dense (Fig. 1a). Indeed, when partial correlationcontrolling for local nucleotide bias is done excluding 150 bp upstreamof the TSS, the positive correlation between TEs and nucleosomebinding affinity remains [−1000 to −150 rnba·TE|random2=0.76]. Inother words, positive TE effects on nucleosome binding are mostevident away from the TSS, while the SSRs that inhibit nucleosomebinding act closest to the TSS.
Taken together, these data suggest the intriguing possibility thatthe human genome utilizes repetitive DNA content along promoterregions to tune nucleosome binding in such a way as to facilitatemaximum access of the basal transcriptional machinery just upstreamof TSS. Furthermore, different classes of repeats play distinct roles inthis process; TEs bind nucleosomes tightly yielding compact lessaccessible DNA, while SSRs extrude nucleosomes creating a relativelyopen chromatin environment.
3.2. Cross-species comparison
In addition to the human genome analysis, the relationshipbetween nucleosome binding and repetitive DNA content ofproximal promoter regions was evaluated for four additional mamma-lian species with complete genome sequences available: chimpanzee(P. troglodytes), mouse (M. musculus) and rat (R. norvegicus). For thesespecies, NCBI Refseq genemodelswere used to define TSS andproximalpromoter regions, while TE and SSR repeats and nucleosome bindingwere analyzed aswasdone for thehumangenome. The trends observedfor human are highly similar to those seen for the other mammalianspecies (Supplementary Fig. 1). In chimpanzee, mouse and rat,nucleosome binding affinities decrease steadily along the proximalpromoter region until the core promoter, b50 bp from the TSS, wherenucleosome binding begins to increase. For these three species, TEdensity drops precipitously and steadily along the proximal promoterwhile SSR density increases sharply at first in the core promoter nearthe TSS and then drops off again as nucleosome binding affinityincreases. Thus, repeat-rich mammalian genomes appear to userepetitive DNA elements to tune nucleosome binding and corepromoter accessibility in similar ways. The conservation of therelationship between repetitive DNA and nucleosome biding in corepromoters of severalmammalian species suggests that thismechanismmay have evolved early in the mammalian radiation as repetitive
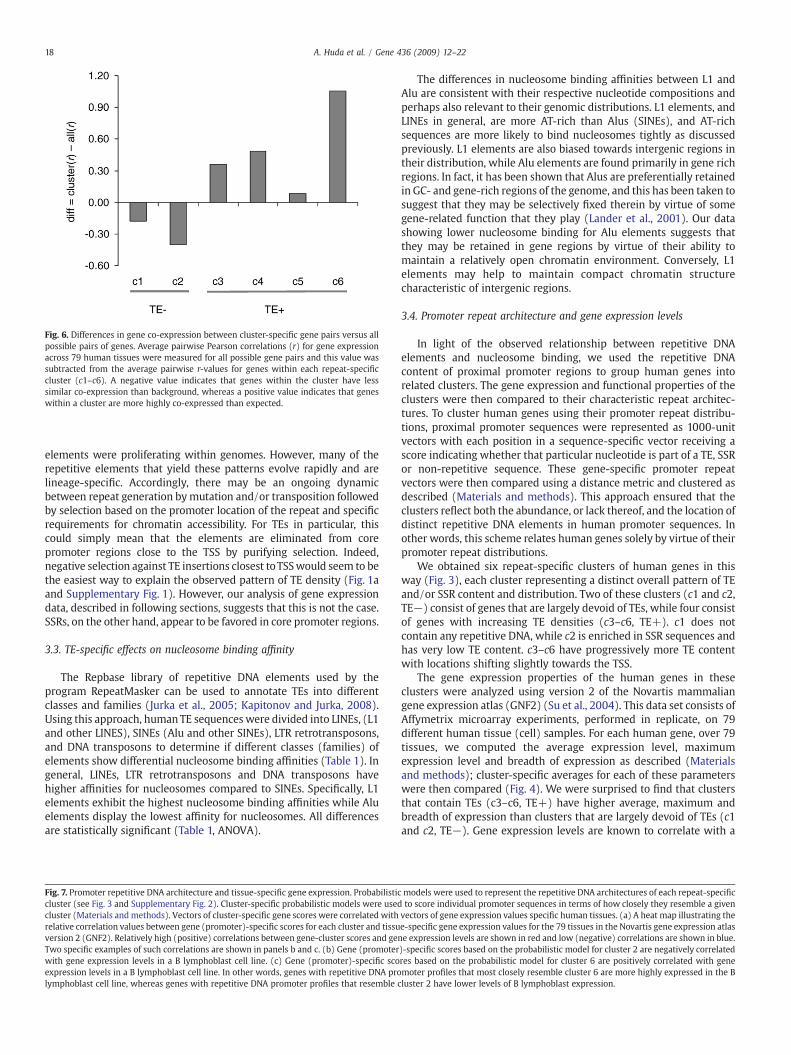
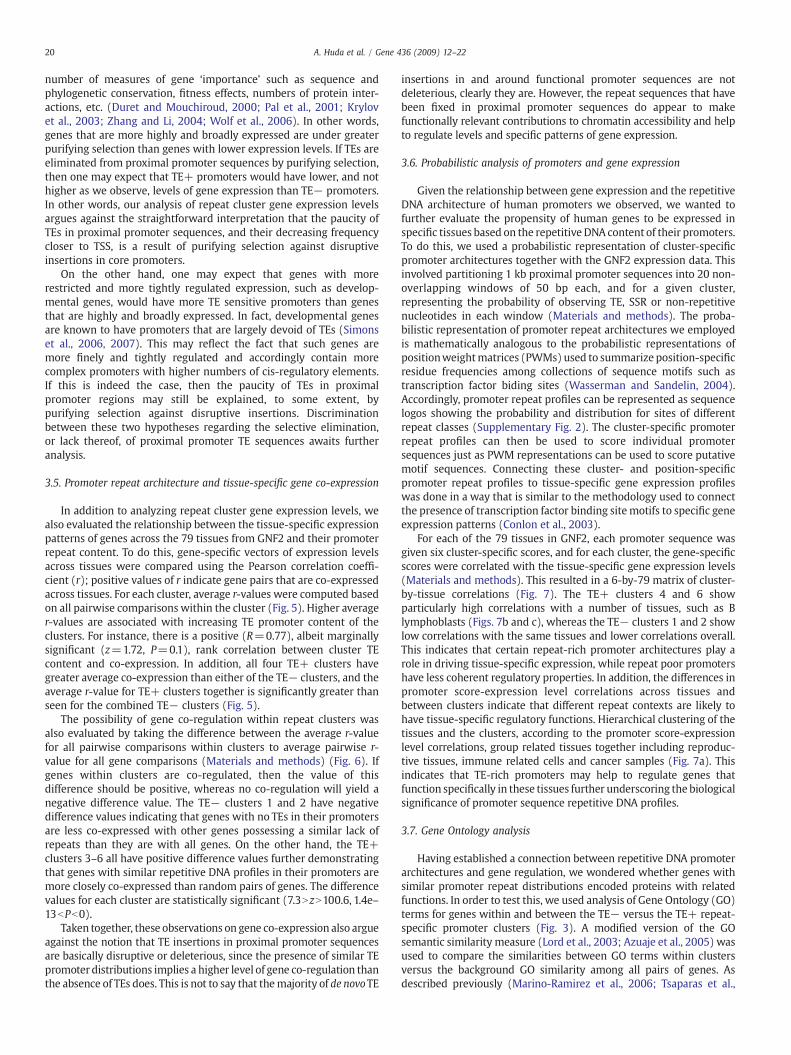
Fig. 6. Differences in gene co-expression between cluster-specific gene pairs versus allpossible pairs of genes. Average pairwise Pearson correlations (r) for gene expressionacross 79 human tissues were measured for all possible gene pairs and this value wassubtracted from the average pairwise r-values for genes within each repeat-specificcluster (c1–c6). A negative value indicates that genes within the cluster have lesssimilar co-expression than background, whereas a positive value indicates that geneswithin a cluster are more highly co-expressed than expected.
18 A. Huda et al. / Gene 436 (2009) 12–22
elements were proliferating within genomes. However, many of therepetitive elements that yield these patterns evolve rapidly and arelineage-specific. Accordingly, there may be an ongoing dynamicbetween repeat generation bymutation and/or transposition followedby selection based on the promoter location of the repeat and specificrequirements for chromatin accessibility. For TEs in particular, thiscould simply mean that the elements are eliminated from corepromoter regions close to the TSS by purifying selection. Indeed,negative selection against TE insertions closest toTSSwould seem to bethe easiest way to explain the observed pattern of TE density (Fig. 1aand Supplementary Fig. 1). However, our analysis of gene expressiondata, described in following sections, suggests that this is not the case.SSRs, on the other hand, appear to be favored in core promoter regions.
3.3. TE-specific effects on nucleosome binding affinity
The Repbase library of repetitive DNA elements used by theprogram RepeatMasker can be used to annotate TEs into differentclasses and families (Jurka et al., 2005; Kapitonov and Jurka, 2008).Using this approach, humanTE sequences were divided into LINEs, (L1and other LINES), SINEs (Alu and other SINEs), LTR retrotransposons,and DNA transposons to determine if different classes (families) ofelements show differential nucleosome binding affinities (Table 1). Ingeneral, LINEs, LTR retrotransposons and DNA transposons havehigher affinities for nucleosomes compared to SINEs. Specifically, L1elements exhibit the highest nucleosome binding affinities while Aluelements display the lowest affinity for nucleosomes. All differencesare statistically significant (Table 1, ANOVA).
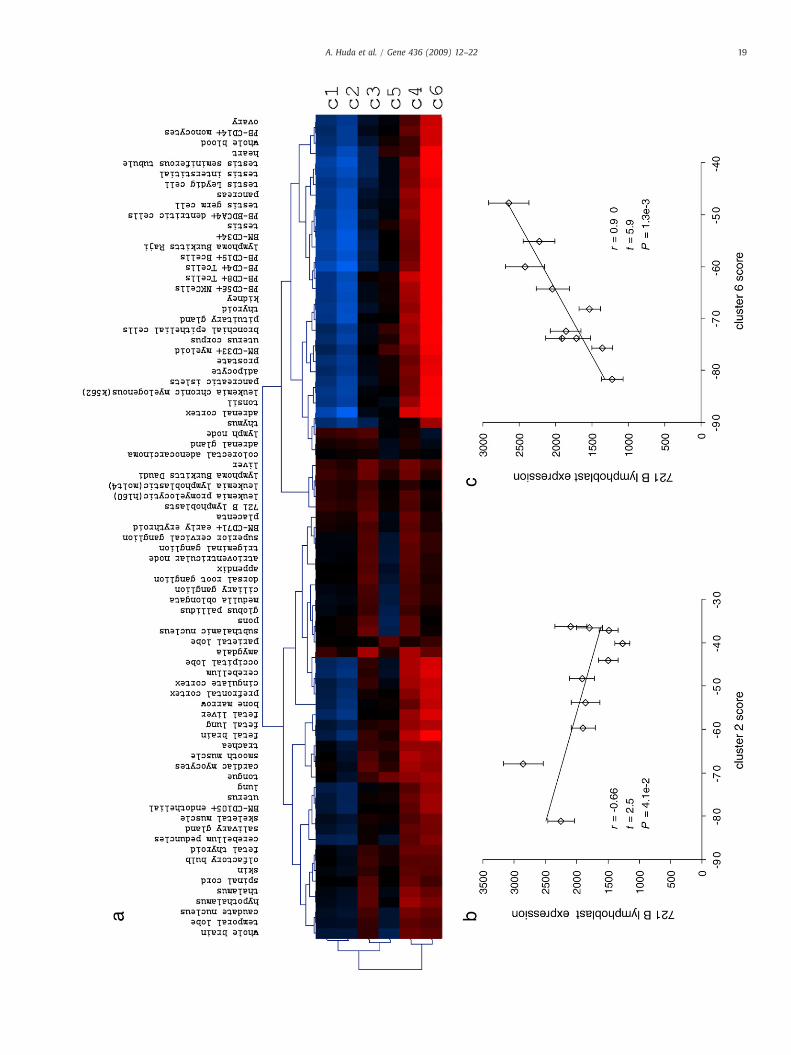
Fig. 7. Promoter repetitive DNA architecture and tissue-specific gene expression. Probabilisticcluster (see Fig. 3 and Supplementary Fig. 2). Cluster-specific probabilistic models were usedcluster (Materials and methods). Vectors of cluster-specific gene scores were correlated withrelative correlation values between gene (promoter)-specific scores for each cluster and tissuversion 2 (GNF2). Relatively high (positive) correlations between gene-cluster scores and genTwo specific examples of such correlations are shown in panels b and c. (b) Gene (promoterwith gene expression levels in a B lymphoblast cell line. (c) Gene (promoter)-specific scoexpression levels in a B lymphoblast cell line. In other words, genes with repetitive DNA prolymphoblast cell line, whereas genes with repetitive DNA promoter profiles that resemble c
The differences in nucleosome binding affinities between L1 andAlu are consistent with their respective nucleotide compositions andperhaps also relevant to their genomic distributions. L1 elements, andLINEs in general, are more AT-rich than Alus (SINEs), and AT-richsequences are more likely to bind nucleosomes tightly as discussedpreviously. L1 elements are also biased towards intergenic regions intheir distribution, while Alu elements are found primarily in gene richregions. In fact, it has been shown that Alus are preferentially retainedin GC- and gene-rich regions of the genome, and this has been taken tosuggest that they may be selectively fixed therein by virtue of somegene-related function that they play (Lander et al., 2001). Our datashowing lower nucleosome binding for Alu elements suggests thatthey may be retained in gene regions by virtue of their ability tomaintain a relatively open chromatin environment. Conversely, L1elements may help to maintain compact chromatin structurecharacteristic of intergenic regions.
3.4. Promoter repeat architecture and gene expression levels
In light of the observed relationship between repetitive DNAelements and nucleosome binding, we used the repetitive DNAcontent of proximal promoter regions to group human genes intorelated clusters. The gene expression and functional properties of theclusters were then compared to their characteristic repeat architec-tures. To cluster human genes using their promoter repeat distribu-tions, proximal promoter sequences were represented as 1000-unitvectors with each position in a sequence-specific vector receiving ascore indicating whether that particular nucleotide is part of a TE, SSRor non-repetitive sequence. These gene-specific promoter repeatvectors were then compared using a distance metric and clustered asdescribed (Materials and methods). This approach ensured that theclusters reflect both the abundance, or lack thereof, and the location ofdistinct repetitive DNA elements in human promoter sequences. Inother words, this scheme relates human genes solely by virtue of theirpromoter repeat distributions.
We obtained six repeat-specific clusters of human genes in thisway (Fig. 3), each cluster representing a distinct overall pattern of TEand/or SSR content and distribution. Two of these clusters (c1 and c2,TE−) consist of genes that are largely devoid of TEs, while four consistof genes with increasing TE densities (c3–c6, TE+). c1 does notcontain any repetitive DNA, while c2 is enriched in SSR sequences andhas very low TE content. c3–c6 have progressively more TE contentwith locations shifting slightly towards the TSS.
The gene expression properties of the human genes in theseclusters were analyzed using version 2 of the Novartis mammaliangene expression atlas (GNF2) (Su et al., 2004). This data set consists ofAffymetrix microarray experiments, performed in replicate, on 79different human tissue (cell) samples. For each human gene, over 79tissues, we computed the average expression level, maximumexpression level and breadth of expression as described (Materialsand methods); cluster-specific averages for each of these parameterswere then compared (Fig. 4). We were surprised to find that clustersthat contain TEs (c3–c6, TE+) have higher average, maximum andbreadth of expression than clusters that are largely devoid of TEs (c1and c2, TE−). Gene expression levels are known to correlate with a
models were used to represent the repetitive DNA architectures of each repeat-specificto score individual promoter sequences in terms of how closely they resemble a givenvectors of gene expression values specific human tissues. (a) A heat map illustrating thee-specific gene expression values for the 79 tissues in the Novartis gene expression atlase expression levels are shown in red and low (negative) correlations are shown in blue.)-specific scores based on the probabilistic model for cluster 2 are negatively correlatedres based on the probabilistic model for cluster 6 are positively correlated with genemoter profiles that most closely resemble cluster 6 are more highly expressed in the Bluster 2 have lower levels of B lymphoblast expression.
19A. Huda et al. / Gene 436 (2009) 12–22
20 A. Huda et al. / Gene 436 (2009) 12–22
number of measures of gene ‘importance’ such as sequence andphylogenetic conservation, fitness effects, numbers of protein inter-actions, etc. (Duret and Mouchiroud, 2000; Pal et al., 2001; Krylovet al., 2003; Zhang and Li, 2004; Wolf et al., 2006). In other words,genes that are more highly and broadly expressed are under greaterpurifying selection than genes with lower expression levels. If TEs areeliminated from proximal promoter sequences by purifying selection,then one may expect that TE+ promoters would have lower, and nothigher as we observe, levels of gene expression than TE− promoters.In other words, our analysis of repeat cluster gene expression levelsargues against the straightforward interpretation that the paucity ofTEs in proximal promoter sequences, and their decreasing frequencycloser to TSS, is a result of purifying selection against disruptiveinsertions in core promoters.
On the other hand, one may expect that genes with morerestricted and more tightly regulated expression, such as develop-mental genes, would have more TE sensitive promoters than genesthat are highly and broadly expressed. In fact, developmental genesare known to have promoters that are largely devoid of TEs (Simonset al., 2006, 2007). This may reflect the fact that such genes aremore finely and tightly regulated and accordingly contain morecomplex promoters with higher numbers of cis-regulatory elements.If this is indeed the case, then the paucity of TEs in proximalpromoter regions may still be explained, to some extent, bypurifying selection against disruptive insertions. Discriminationbetween these two hypotheses regarding the selective elimination,or lack thereof, of proximal promoter TE sequences awaits furtheranalysis.
3.5. Promoter repeat architecture and tissue-specific gene co-expression
In addition to analyzing repeat cluster gene expression levels, wealso evaluated the relationship between the tissue-specific expressionpatterns of genes across the 79 tissues from GNF2 and their promoterrepeat content. To do this, gene-specific vectors of expression levelsacross tissues were compared using the Pearson correlation coeffi-cient (r); positive values of r indicate gene pairs that are co-expressedacross tissues. For each cluster, average r-values were computed basedon all pairwise comparisons within the cluster (Fig. 5). Higher averager-values are associated with increasing TE promoter content of theclusters. For instance, there is a positive (R=0.77), albeit marginallysignificant (z=1.72, P=0.1), rank correlation between cluster TEcontent and co-expression. In addition, all four TE+ clusters havegreater average co-expression than either of the TE− clusters, and theaverage r-value for TE+ clusters together is significantly greater thanseen for the combined TE− clusters (Fig. 5).
The possibility of gene co-regulation within repeat clusters wasalso evaluated by taking the difference between the average r-valuefor all pairwise comparisons within clusters to average pairwise r-value for all gene comparisons (Materials and methods) (Fig. 6). Ifgenes within clusters are co-regulated, then the value of thisdifference should be positive, whereas no co-regulation will yield anegative difference value. The TE− clusters 1 and 2 have negativedifference values indicating that genes with no TEs in their promotersare less co-expressed with other genes possessing a similar lack ofrepeats than they are with all genes. On the other hand, the TE+clusters 3–6 all have positive difference values further demonstratingthat genes with similar repetitive DNA profiles in their promoters aremore closely co-expressed than random pairs of genes. The differencevalues for each cluster are statistically significant (7.3NzN100.6, 1.4e–13bPb0).
Taken together, these observations on gene co-expression also argueagainst the notion that TE insertions in proximal promoter sequencesare basically disruptive or deleterious, since the presence of similar TEpromoter distributions implies a higher level of gene co-regulation thanthe absence of TEs does. This is not to say that themajority of de novoTE
insertions in and around functional promoter sequences are notdeleterious, clearly they are. However, the repeat sequences that havebeen fixed in proximal promoter sequences do appear to makefunctionally relevant contributions to chromatin accessibility and helpto regulate levels and specific patterns of gene expression.
3.6. Probabilistic analysis of promoters and gene expression
Given the relationship between gene expression and the repetitiveDNA architecture of human promoters we observed, we wanted tofurther evaluate the propensity of human genes to be expressed inspecific tissues based on the repetitive DNA content of their promoters.To do this, we used a probabilistic representation of cluster-specificpromoter architectures together with the GNF2 expression data. Thisinvolved partitioning 1 kb proximal promoter sequences into 20 non-overlapping windows of 50 bp each, and for a given cluster,representing the probability of observing TE, SSR or non-repetitivenucleotides in each window (Materials and methods). The proba-bilistic representation of promoter repeat architectures we employedis mathematically analogous to the probabilistic representations ofpositionweightmatrices (PWMs) used to summarize position-specificresidue frequencies among collections of sequence motifs such astranscription factor biding sites (Wasserman and Sandelin, 2004).Accordingly, promoter repeat profiles can be represented as sequencelogos showing the probability and distribution for sites of differentrepeat classes (Supplementary Fig. 2). The cluster-specific promoterrepeat profiles can then be used to score individual promotersequences just as PWM representations can be used to score putativemotif sequences. Connecting these cluster- and position-specificpromoter repeat profiles to tissue-specific gene expression profileswas done in a way that is similar to the methodology used to connectthe presence of transcription factor binding sitemotifs to specific geneexpression patterns (Conlon et al., 2003).
For each of the 79 tissues in GNF2, each promoter sequence wasgiven six cluster-specific scores, and for each cluster, the gene-specificscores were correlated with the tissue-specific gene expression levels(Materials and methods). This resulted in a 6-by-79 matrix of cluster-by-tissue correlations (Fig. 7). The TE+ clusters 4 and 6 showparticularly high correlations with a number of tissues, such as Blymphoblasts (Figs. 7b and c), whereas the TE− clusters 1 and 2 showlow correlations with the same tissues and lower correlations overall.This indicates that certain repeat-rich promoter architectures play arole in driving tissue-specific expression, while repeat poor promotershave less coherent regulatory properties. In addition, the differences inpromoter score-expression level correlations across tissues andbetween clusters indicate that different repeat contexts are likely tohave tissue-specific regulatory functions. Hierarchical clustering of thetissues and the clusters, according to the promoter score-expressionlevel correlations, group related tissues together including reproduc-tive tissues, immune related cells and cancer samples (Fig. 7a). Thisindicates that TE-rich promoters may help to regulate genes thatfunction specifically in these tissues further underscoring the biologicalsignificance of promoter sequence repetitive DNA profiles.
3.7. Gene Ontology analysis
Having established a connection between repetitive DNA promoterarchitectures and gene regulation, we wondered whether genes withsimilar promoter repeat distributions encoded proteins with relatedfunctions. In order to test this, we used analysis of Gene Ontology (GO)terms for genes within and between the TE− versus the TE+ repeat-specific promoter clusters (Fig. 3). A modified version of the GOsemantic similarity measure (Lord et al., 2003; Azuaje et al., 2005) wasused to compare the similarities between GO terms within clustersversus the background GO similarity among all pairs of genes. Asdescribed previously (Marino-Ramirez et al., 2006; Tsaparas et al.,
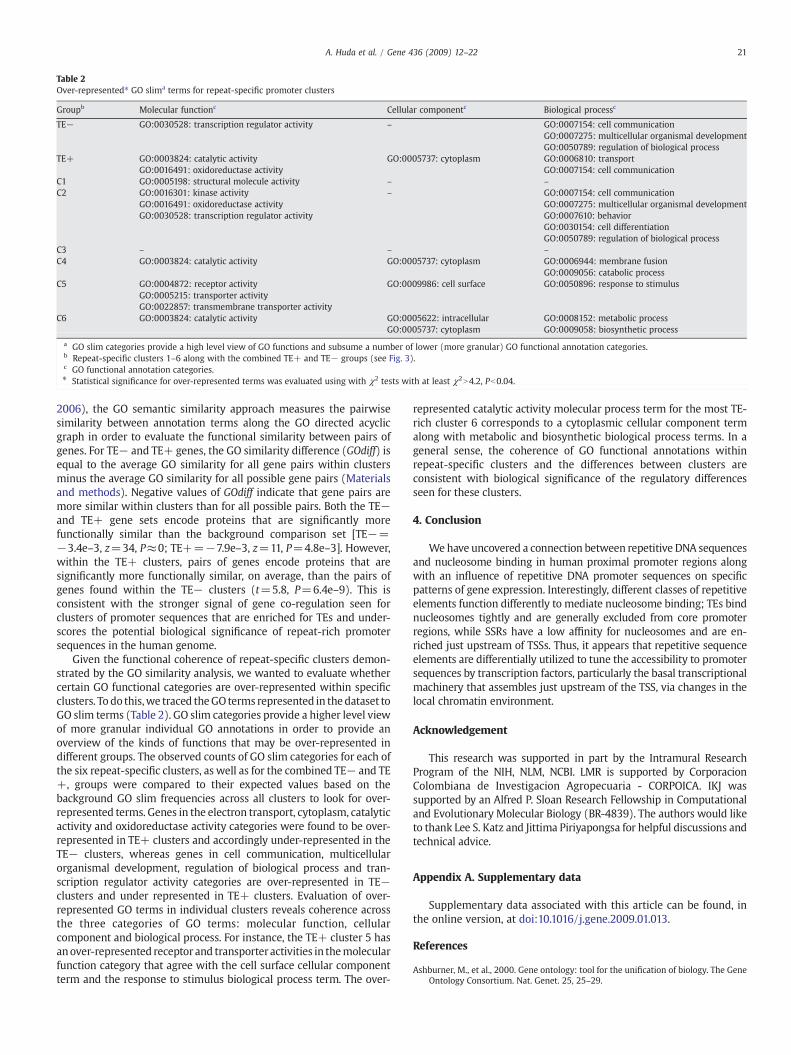
Table 2Over-represented⁎ GO slima terms for repeat-specific promoter clusters
Groupb Molecular functionc Cellular componentc Biological processc
TE− GO:0030528: transcription regulator activity – GO:0007154: cell communicationGO:0007275: multicellular organismal developmentGO:0050789: regulation of biological process
TE+ GO:0003824: catalytic activity GO:0005737: cytoplasm GO:0006810: transportGO:0016491: oxidoreductase activity GO:0007154: cell communication
C1 GO:0005198: structural molecule activity – –
C2 GO:0016301: kinase activity – GO:0007154: cell communicationGO:0016491: oxidoreductase activity GO:0007275: multicellular organismal developmentGO:0030528: transcription regulator activity GO:0007610: behavior
GO:0030154: cell differentiationGO:0050789: regulation of biological process
C3 – – –
C4 GO:0003824: catalytic activity GO:0005737: cytoplasm GO:0006944: membrane fusionGO:0009056: catabolic process
C5 GO:0004872: receptor activity GO:0009986: cell surface GO:0050896: response to stimulusGO:0005215: transporter activityGO:0022857: transmembrane transporter activity
C6 GO:0003824: catalytic activity GO:0005622: intracellular GO:0008152: metabolic processGO:0005737: cytoplasm GO:0009058: biosynthetic process
a GO slim categories provide a high level view of GO functions and subsume a number of lower (more granular) GO functional annotation categories.b Repeat-specific clusters 1–6 along with the combined TE+ and TE− groups (see Fig. 3).c GO functional annotation categories.⁎ Statistical significance for over-represented terms was evaluated using with χ2 tests with at least χ2N4.2, Pb0.04.
21A. Huda et al. / Gene 436 (2009) 12–22
2006), the GO semantic similarity approach measures the pairwisesimilarity between annotation terms along the GO directed acyclicgraph in order to evaluate the functional similarity between pairs ofgenes. For TE− and TE+ genes, the GO similarity difference (GOdiff) isequal to the average GO similarity for all gene pairs within clustersminus the average GO similarity for all possible gene pairs (Materialsand methods). Negative values of GOdiff indicate that gene pairs aremore similar within clusters than for all possible pairs. Both the TE−and TE+ gene sets encode proteins that are significantly morefunctionally similar than the background comparison set [TE−=−3.4e–3, z=34, P≈0; TE+=−7.9e–3, z=11, P=4.8e–3]. However,within the TE+ clusters, pairs of genes encode proteins that aresignificantly more functionally similar, on average, than the pairs ofgenes found within the TE− clusters (t=5.8, P=6.4e–9). This isconsistent with the stronger signal of gene co-regulation seen forclusters of promoter sequences that are enriched for TEs and under-scores the potential biological significance of repeat-rich promotersequences in the human genome.
Given the functional coherence of repeat-specific clusters demon-strated by the GO similarity analysis, we wanted to evaluate whethercertain GO functional categories are over-represented within specificclusters. To do this,we traced theGO terms represented in thedataset toGO slim terms (Table 2). GO slim categories provide a higher level viewof more granular individual GO annotations in order to provide anoverview of the kinds of functions that may be over-represented indifferent groups. The observed counts of GO slim categories for each ofthe six repeat-specific clusters, as well as for the combined TE− and TE+, groups were compared to their expected values based on thebackground GO slim frequencies across all clusters to look for over-represented terms. Genes in the electron transport, cytoplasm, catalyticactivity and oxidoreductase activity categories were found to be over-represented in TE+ clusters and accordingly under-represented in theTE− clusters, whereas genes in cell communication, multicellularorganismal development, regulation of biological process and tran-scription regulator activity categories are over-represented in TE−clusters and under represented in TE+ clusters. Evaluation of over-represented GO terms in individual clusters reveals coherence acrossthe three categories of GO terms: molecular function, cellularcomponent and biological process. For instance, the TE+ cluster 5 hasanover-represented receptor and transporteractivities in themolecularfunction category that agree with the cell surface cellular componentterm and the response to stimulus biological process term. The over-
represented catalytic activity molecular process term for the most TE-rich cluster 6 corresponds to a cytoplasmic cellular component termalong with metabolic and biosynthetic biological process terms. In ageneral sense, the coherence of GO functional annotations withinrepeat-specific clusters and the differences between clusters areconsistent with biological significance of the regulatory differencesseen for these clusters.
4. Conclusion
Wehave uncovered a connection between repetitive DNA sequencesand nucleosome binding in human proximal promoter regions alongwith an influence of repetitive DNA promoter sequences on specificpatterns of gene expression. Interestingly, different classes of repetitiveelements function differently to mediate nucleosome binding; TEs bindnucleosomes tightly and are generally excluded from core promoterregions, while SSRs have a low affinity for nucleosomes and are en-riched just upstream of TSSs. Thus, it appears that repetitive sequenceelements are differentially utilized to tune the accessibility to promotersequences by transcription factors, particularly the basal transcriptionalmachinery that assembles just upstream of the TSS, via changes in thelocal chromatin environment.
Acknowledgement
This research was supported in part by the Intramural ResearchProgram of the NIH, NLM, NCBI. LMR is supported by CorporacionColombiana de Investigacion Agropecuaria - CORPOICA. IKJ wassupported by an Alfred P. Sloan Research Fellowship in Computationaland Evolutionary Molecular Biology (BR-4839). The authors would liketo thank Lee S. Katz and Jittima Piriyapongsa for helpful discussions andtechnical advice.
Appendix A. Supplementary data
Supplementary data associated with this article can be found, inthe online version, at doi:10.1016/j.gene.2009.01.013.
References
Ashburner, M., et al., 2000. Gene ontology: tool for the unification of biology. The GeneOntology Consortium. Nat. Genet. 25, 25–29.
22 A. Huda et al. / Gene 436 (2009) 12–22
Azuaje, F., Wang, H., Bodenreider, O., 2005. Ontology-driven similarity approaches tosupporting gene functional assessment. Proc ISMB SIG meeting on Bio-ontologies2005, 9–10.
Bejerano, G., et al., 2006. A distal enhancer and an ultraconserved exon are derived froma novel retroposon. Nature 441, 87–90.
Borchert, G.M., Lanier, W., Davidson, B.L., 2006. RNA polymerase III transcribes humanmicroRNAs. Nat. Struct. Mol. Biol. 13, 1097–1101.
Britten, R.J., Kohne, D.E., 1968. Repeated sequences in DNA. Hundreds of thousands ofcopies of DNA sequences have been incorporated into the genomes of higherorganisms. Science 161, 529–540.
Conley, A.B., Piriyapongsa, J., Jordan, I.K., 2008. Retroviral promoters in the humangenome. Bioinformatics 24, 1563–1567.
Conlon, E.M., Liu, X.S., Lieb, J.D., Liu, J.S., 2003. Integrating regulatory motif discoveryand genome-wide expression analysis. Proc. Natl. Acad. Sci. U. S. A. 100, 3339–3344.
Dimitri, P., Junakovic, N., 1999. Revising the selfish DNA hypothesis: new evidence onaccumulationof transposable elements inheterochromatin. TrendsGenet.15,123–124.
Doolittle, W.F., Sapienza, C., 1980. Selfish genes, the phenotype paradigm and genomeevolution. Nature 284, 601–603.
Dunn, C.A., Medstrand, P., Mager, D.L., 2003. An endogenous retroviral long terminalrepeat is the dominant promoter for human beta1,3-galactosyltransferase 5 in thecolon. Proc. Natl. Acad. Sci. U. S. A. 100, 12841–12846.
Duret, L., Mouchiroud, D., 2000. Determinants of substitution rates in mammaliangenes: expression pattern affects selection intensity but not mutation rate. Mol.Biol. Evol. 17, 68–74.
Feschotte, C., 2008. Transposable elements and the evolution of regulatory networks.Nat. Rev. Genet. 9, 397–405.
Grewal, S.I., Jia, S., 2007. Heterochromatin revisited. Nat. Rev. Genet. 8, 35–46.Henikoff, S., 2000. Heterochromatin function in complex genomes. Biochim. Biophys.
Acta 1470, O1–8.Henikoff, S., Matzke, M.A., 1997. Exploring and explaining epigenetic effects. Trends
Genet. 13, 293–295.Jordan, I.K., Rogozin, I.B., Glazko, G.V., Koonin, E.V., 2003. Origin of a substantial fraction of
human regulatory sequences from transposable elements. Trends Genet. 19, 68–72.Jurka, J., Kapitonov, V.V., Pavlicek, A., Klonowski, P., Kohany, O., Walichiewicz, J., 2005.
Repbase Update, a database of eukaryotic repetitive elements. Cytogenet. GenomeRes. 110, 462–467.
Kapitonov, V.V., Jurka, J., 2008. A universal classification of eukaryotic transposableelements implemented in Repbase. Nat. Rev. Genet. 9, 411–412 author reply 414.
Karolchik,D., et al., 2003. TheUCSCGenomeBrowserDatabase.NucleicAcidsRes. 31, 51–54.Karolchik, D., et al., 2004. The UCSC Table Browser data retrieval tool. Nucleic Acids Res.
32, D493–D496.Kidd, J.M., et al., 2008. Mapping and sequencing of structural variation from eight
human genomes. Nature 453, 56–64.Kidwell, M.G., Lisch, D.R., 2001. Perspective: transposable elements, parasitic DNA, and
genome evolution. Evolution Int. J. Org. Evolution 55, 1–24.Kornberg, R.D., Lorch, Y., 1999. Twenty-five years of the nucleosome, fundamental
particle of the eukaryote chromosome. Cell 98, 285–294.Krylov, D.M., Wolf, Y.I., Rogozin, I.B., Koonin, E.V., 2003. Gene loss, protein sequence
divergence, gene dispensability, expression level, and interactivity are correlated ineukaryotic evolution. Genome Res. 13, 2229–2235.
Lander, E.S., et al., 2001. Initial sequencing and analysis of the human genome. Nature409, 860–921.
Lippman, Z., et al., 2004. Role of transposable elements in heterochromatin andepigenetic control. Nature 430, 471–476.
Lord, P.W., Stevens, R.D., Brass, A., Goble, C.A., 2003. Investigating semantic similaritymeasures across the Gene Ontology: the relationship between sequence andannotation. Bioinformatics 19, 1275–1283.
Marino-Ramirez, L., Spouge, J.L., Kanga, G.C., Landsman,D., 2004. Statistical analysisof over-represented words in human promoter sequences. Nucleic Acids Res. 32, 949–958.
Marino-Ramirez, L., Bodenreider, O., Kantz, N., Jordan, I.K., 2006. Co-evolutionary ratesof functionally related yeast genes. Evol. Bioinform Online 2, 295–300.
Nishihara, H., Smit, A.F., Okada, N., 2006. Functional noncoding sequences derived fromSINEs in the mammalian genome. Genome Res. 16, 864–874.
Orgel, L.E., Crick, F.H., 1980. Selfish DNA: the ultimate parasite. Nature 284, 604–607.Pal, C., Papp, B., Hurst, L.D., 2001. Highly expressed genes in yeast evolve slowly.
Genetics 158, 927–931.Piriyapongsa, J., Jordan, I.K., 2007. A family of human microRNA genes from miniature
inverted-repeat transposable elements. PLoS ONE 2, e203.Piriyapongsa, J., Marino-Ramirez, L., Jordan, I.K., 2007. Origin and evolution of human
microRNAs from transposable elements. Genetics 176, 1323–1337.Pruitt, K.D., Tatusova, T., Maglott, D.R., 2007. NCBI reference sequences (RefSeq): a
curated non-redundant sequence database of genomes, transcripts and proteins.Nucleic Acids Res. 35, D61–D65.
Satchwell, S.C., Drew, H.R., Travers, A.A., 1986. Sequence periodicities in chickennucleosome core DNA. J. Mol. Biol. 191, 659–675.
Segal, E., et al., 2006. A genomic code for nucleosome positioning. Nature 442, 772–778.Simons, C., Pheasant, M., Makunin, I.V., Mattick, J.S., 2006. Transposon-free regions in
mammalian genomes. Genome Res. 16, 164–172.Simons, C., Makunin, I.V., Pheasant, M., Mattick, J.S., 2007. Maintenance of transposon-
free regions throughout vertebrate evolution. BMC Genomics 8, 470.Smalheiser, N.R., Torvik, V.I., 2005. Mammalian microRNAs derived from genomic
repeats. Trends Genet. 21, 322–326.Smit, A.F.A., Hubley, R. and Green, P. (1996–2004), RepeatMasker. p. http://repeatmasker.
org.Sturn, A., Quackenbush, J., Trajanoski, Z., 2002. Genesis: cluster analysis of microarray
data. Bioinformatics 18, 207–208.Su, A.I., et al., 2004. A gene atlas of the mouse and human protein-encoding
transcriptomes. Proc. Natl. Acad. Sci. U. S. A. 101, 6062–6067.Suzuki, Y., Yamashita, R., Nakai, K., Sugano, S., 2002. DBTSS: database of human
transcriptional start sites and full-length cDNAs. Nucleic Acids Res. 30, 328–331.Tharakaraman, K., Marino-Ramirez, L., Sheetlin, S., Landsman, D., Spouge, J.L., 2005.
Alignments anchored on genomic landmarks can aid in the identification ofregulatory elements. Bioinformatics 21 (Suppl. 1) i440-8.
Tsaparas, P., Marino-Ramirez, L., Bodenreider, O., Koonin, E.V., Jordan, I.K., 2006. Globalsimilarity and local divergence in human and mouse gene co-expression networks.BMC Evol. Biol. 6, 70.
van de Lagemaat, L.N., Landry, J.R., Mager, D.L., Medstrand, P., 2003. Transposableelements in mammals promote regulatory variation and diversification of geneswith specialized functions. Trends Genet. 19, 530–536.
Venter, J.C., et al., 2001. The sequence of the human genome. Science 291, 1304–1351.Wang, H., et al., 2005. SVA elements: a hominid-specific retroposon family. J. Mol. Biol.
354, 994–1007.Wang, T., et al., 2007. Species-specific endogenous retroviruses shape the transcriptional
network of the human tumor suppressor protein p53. Proc. Natl. Acad. Sci. U. S. A.104, 18613–18618.
Wasserman, W.W., Sandelin, A., 2004. Applied bioinformatics for the identification ofregulatory elements. Nat. Rev. Genet. 5, 276–287.
Widom, J., 2001. Role of DNA sequence in nucleosome stability and dynamics. Q. Rev.Biophys. 34, 269–324.
Wolf, Y.I., Carmel, L., Koonin, E.V., 2006. Unifying measures of gene function andevolution. Proc. Biol. Sci. 273, 1507–1515.
Zar, J.H., 1999. Biostatistical Analysis, Fourth ed. Prentice-Hall, Upper Saddle River.Zhang, L., Li, W.H., 2004. Mammalian housekeeping genes evolve more slowly than
tissue-specific genes. Mol. Biol. Evol. 21, 236–239.
![Computational biology: deep learning...from DNA sequence, RNA polymerase binding, nucleosome positioning and transcriptional data [16], as well as gene expression from histone modifications](https://img.dokumen.tips/doc/110x75/61487fc62918e2056c22ba9d/computational-biology-deep-learning-from-dna-sequence-rna-polymerase-binding.jpg)