Embed Size (px)
Citation preview

5468–5482 Nucleic Acids Research, 2014, Vol. 42, No. 9 Published online 05 March 2014doi: 10.1093/nar/gku176
A dynamic interplay of nucleosome and Msn2 bindingregulates kinetics of gene activation and repressionfollowing stressNils Elfving1,‡, Razvan V. Chereji2,†,‡, Vasudha Bharatula3, Stefan Bjorklund1, AlexandreV. Morozov2,4 and James R. Broach3,∗
1Department of Medical Biochemistry and Biophysics, Umea University, Umea 901 87, Sweden, 2Department ofPhysics and Astronomy, Rutgers University, Piscataway, NJ 08854, USA, 3Department of Biochemistry and MolecularBiology, Penn State College of Medicine, Hershey, PA 17033, USA and 4BioMaPS Institute for Quantitative Biology,Rutgers University, Piscataway, NJ 08854, USA
Received January 15, 2014; Revised February 11, 2014; Accepted February 13, 2014
ABSTRACT
The transcription factor Msn2 mediates a significantproportion of the environmental stress response,in which a common cohort of genes changes ex-pression in a stereotypic fashion upon exposureto any of a wide variety of stresses. We have ap-plied genome-wide chromatin immunoprecipitationand nucleosome profiling to determine where Msn2binds under stressful conditions and how that bind-ing affects, and is affected by, nucleosome posi-tioning. We concurrently determined the effect ofMsn2 activity on gene expression following stressand demonstrated that Msn2 stimulates both activa-tion and repression. We found that some genes re-sponded to both intermittent and continuous Msn2nuclear occupancy while others responded only tocontinuous occupancy. Finally, these studies docu-ment a dynamic interplay between nucleosomes andMsn2 such that nucleosomes can restrict access ofMsn2 to its canonical binding sites while Msn2 canpromote reposition, expulsion and recruitment of nu-cleosomes to alter gene expression. This interplaymay allow the cell to discriminate between differenttypes of stress signaling.
INTRODUCTION
Regulation of eukaryotic gene expression involves a com-plex interplay among transcription factors, core transcrip-tional machinery and the chromatin template on whichthese factors operate. A number of studies over the last sev-
eral years have documented that the chromatin structureacross a cell’s genome remains well defined and remarkablystatic under all conditions (1–3). Generally, well-positionednucleosomes bracket the promoter region of most genes tomaintain a nucleosome-depleted region (NDR) upstream ofthe transcriptional start site of the gene, with nucleosomesassuming a well-ordered periodic array extending into thecoding region with periodicity diminishing with increasingdistance from the promoter (1,4–6). This chromatin struc-ture serves an instructive role in transcription factor bind-ing, with factors able to bind to their cognate sites lyingwithin the NDR but unable to bind to those sites occludedby nucleosomes in other regions (3,7,8). Against this back-drop of static chromatin structure, nucleosome depletionaround the NDR is in some cases associated with transcrip-tional activation and nucleosome recruitment to the NDRassociated with transcriptional repression (9–12). This lo-cal reorganization depends on the action of chromatin re-modeling factors that slide, evict or recruit nucleosomes(2,11,13–19). These rearrangements also occur in concertwith transcription factor binding and transcriptional repro-gramming, although the causal nature of those relations isnot entirely clear. To address this question, we have exam-ined transcriptional reprogramming and nucleosome rear-rangements associated with the yeast stress response.
All cells mount a rapid adaptive response to a new andstressful environment and that response generally includessubstantial transcriptional reprogramming. The transcrip-tional response of yeast cells to any of a wide variety ofstresses, including heat shock, oxidative agents, nutrient de-pletion and hypo- and hyperosmolarity, comprises a stereo-typic repression and induction of the same large number ofgenes independent of the particular type of stress, referredto as the environmental stress response (ESR), as well as
∗To whom correspondence should be addressed. Tel: +717 531 8586; Fax: +717 531 7072; Email: [email protected].†Present address: Program in Genomics of Differentiation, Eunice Kennedy Shriver National Institute for Child Health and Human Development, National Institutesof Health, Bethesda, MD 20892, USA.‡These authors contributed equally to the research.
C© The Author(s) 2014. Published by Oxford University Press on behalf of Nucleic Acids Research.This is an Open Access article distributed under the terms of the Creative Commons Attribution License (http://creativecommons.org/licenses/by/3.0/), whichpermits unrestricted reuse, distribution, and reproduction in any medium, provided the original work is properly cited.
Downloaded from https://academic.oup.com/nar/article-abstract/42/9/5468/1246885by gueston 21 February 2018
Nucleic Acids Research, 2014, Vol. 42, No. 9 5469
changes specific to the individual stress (20,21). This tran-scriptional reprogramming has minimal impact on the sur-vival of cells to the eliciting stressful condition but doesserve to protect cells to subsequent stresses (22–25).
The structurally related, stress-responsive transcriptionfactors, Msn2 and Msn4, mediate a major component ofthe ESR (21,26). These two transcription factors residein the cytoplasm in unstressed cells, due to active exportfrom the nucleus by the Msn5 exportin machinery and torestricted import as a consequence of protein kinase A(PKA) catalyzed phosphorylation and inhibition of the nu-clear import signals on the proteins (27–30). A number ofmicrofluidics-based single-cell time lapse studies have doc-umented that acute stress causes rapid cycling of Msn2and Msn4 into and out of the nucleus, due to inhibitionof PKA and activation of protein phosphatase 1 and theSnf1 adenosine-monophosphate (AMP)-activated kinase(31–35). Cells exhibit idiosyncratic patterns of Msn2 nu-clear cycling such that genetically identical cells under thesame stress condition show markedly different patterns ofcycling. Moreover, different stresses elicit different classesof nuclear localization patterns (34,35). How Msn2 cyclingrelates to the transcriptional output from Msn2 remains tobe resolved, although recent results suggest that differentpromoters respond to Msn2 cycling in different ways (36).
Once in the nucleus, Msn2 can bind to stress response el-ements (STREs) within the genome to alter transcriptionof genes neighboring the sites (26,37). Approximately 3000STREs reside upstream of yeast genes, but only a fractionof these serve as binding sites for Msn2. Many of these sitesare likely occluded by positioned nucleosomes that preventaccess to Msn2 (38). Moreover, since each cell contains only100–200 Msn2 molecules (39), formation of stable Msn2complexes with a large number of STREs within a singlecell’s genome would not be possible. One explanation forthe rapid dynamics of Msn2 localization may be to facilitatesampling of multiple sites by individual Msn2 molecules.Whether different stresses affect the selection of differentsubsets of sites––either by modifying Msn2’s deoxyribonu-cleic acid (DNA) binding recognition region or by alteringthe accessibility of different sites––has not been extensivelyexplored.
Several previous studies have addressed the localizationof Msn2 binding on a genome-wide basis. Venters et al. (40)examined global Msn2 binding in response to heat shockin the context of a much larger study to map the major-ity of transcription factor binding sites in yeast. More re-cently, Huebert et al. (41) mapped the location of Msn2binding over time over the entire genome following treat-ment of cell with peroxide and correlated that binding withgenome-wide changes in nucleosome positioning. Here weexamine the binding of Msn2 to genomic sites in responseto a nutritional stress. We also measure the global nucleo-some architecture before and after application of the stressboth in the presence and absence of Msn2 in order to ad-dress the extent to which Msn2 binding influences and is in-fluenced by nucleosomes. Finally, we assess the sufficiencyand necessity of Msn2 binding on changes in expression ofeach associated gene to determine the effect on transcrip-tion elicited by Msn2 binding. Our results document an ex-tensive interplay between nucleosome binding and Msn2
binding such that nucleosome occlusion can restrict Msn2binding in some conditions but in other cases Msn2 bindingleads to repositioning of occluding nucleosomes. These re-sults point to a complex choreography between general andspecific transcription factors in order to mount a coherenttranscriptional program. In a companion paper (Elfving etal. 2014, submitted), we also examine the role of Mediatorin this process.
MATERIALS AND METHODS
Yeast strain growth and construction
Standard methods were used to grow, maintain and con-struct strains (42). Strains used in this study are listed inTable 1.
The myc-tagged Msn2 strain was made by replacing thestop codon in the corresponding ORF (YMR037C) with aG8–13xMyc-KanMx6 construct. This construct was madeby polymerase chain reaction (PCR) from the template plas-mid pFA6a-13Myc-kanMX6. The flexible G8–linker was in-troduced in order to improve in vivo function of the epitope-tagged protein as suggested by Sabourin et al. (43). The con-struct was transformed using standard methods into strainFY4 (Y4015), a prototroph in the S288C background (44).
The estradiol inducible MSN2 strains were constructedessentially as described in (45). First, MSN2-GFP was in-tegrated into the MSN2 locus of strain Y4098 (MATamsn2::URA3 leu2�0 ura3�0) as described (35) to generatestrain Y4105. MSN2S288A,S582A,S620A,S625A,S633A,S686A-GFP,designated MSN26A, was constructed from the MSN2-GFPLEU2 plasmid B2802 using the QuikChange R© II XL Site-directed mutagenesis kit (Agilent) and also integrated intostrain Y4098 to generate strain Y4107. The Z4EV promoterwas inserted upstream of MSN2-GFP or MSN26A-GFP lo-cus in these two strains by PCR amplification of the Z4EVpromoter from plasmid pMN10 (45). The resulting strains,Y4108 and Y4109, were crossed with strain DBY12416(MAT� leu2-PACT1-Z4EV ybr034w::LEU2) (45) and pro-totrophic segregants from each cross carrying the Z4EVtranscription factor and the Z4EV-driven MSN2 locus wereretained as Y4131 and Y4132.
Growth protocols
Glucose downshift. Yeast cells were grown at 30◦C in Syn-thetic Complete (SC) + 2% glucose media and maintainedin mid log phase for at least 24 h by dilution. When cul-tures reached a density of (3–4) × 106 cells/ml, cells werecollected by filtration (Stericup-GP, 0.22-�m filtering sys-tems, Millipore Corporation, Billerica, MA, USA), washedand resuspended in SC + 3% glycerol media and then sub-jected to sample preparation at the desired time points.Zero-minute samples were taken before this procedure.
Estradiol induction. Cells were grown at 30◦C in SD +2% glucose to a cell density of 4 × 10⁶ cells/ml and estra-diol added to a final concentration of 10 �M. Samples (5ml) were harvested at specified times and ribonucleic acid(RNA) extracted as described below.
Downloaded from https://academic.oup.com/nar/article-abstract/42/9/5468/1246885by gueston 21 February 2018

5470 Nucleic Acids Research, 2014, Vol. 42, No. 9
Table 1. Strains used in this study
Strain Genotype Source
Y2864 MAT� gal1::HIS3 ade2–1 can1–100 his3–11,15 leu2–3,112 trp1–1 ura3–1 (46)Y3513 MAT� msn2::KanMX4 msn4::KanMX4 gal1::HIS3 ade2–1 can1–100
his3–11,15 leu2–3,112 trp1–1 ura3–1 (isogenic to Y2864)This study
Y4105 MATaleu2�0 ura3�0 MSN2-GFP ”Y4108 MATaleu2�0 ura3�0 KanMX4-PZ4EV-MSN2-GFP ”Y4015 MATa prototroph (44)Y4016 MATaMSN2–8xGly-13xMyc-KanMX4 (isogenic to Y4015) This studyY4131 MATaleu2�::PACT1-Z4EV-NatMX KanMX4-PZ4EV-MSN2-GFP
ybr032w::LEU2”
Y4132 MATaleu2�::PACT1-Z4EV-NatMX KanMX4-PZ4EV-MSN26A-GFPybr032w::LEU2
”
Y4108 MATaleu2� KanMX-PZ4EV-MSN2-GFP ”
Nucleosomal DNA sample preparation
Mononucleosomal DNA from the wild-type parent strainand the msn2�msn4� strain was isolated as previouslydescribed (3). Briefly, for each sample, a 650-ml culturewas formaldehyde crosslinked, converted to spheroplasts,then resuspended in NP buffer, and micrococcal nuclease(Sigma-Aldrich, St. Louis, MO, USA) was added. DNA–protein cross-links were reversed by incubation at 65◦C forat least 4 h. DNA was then purified by PCR clean-up kit(Qiagen, Valencia, CA, USA), and the sample was analyzedby gel electrophoresis to ensure that the extent of diges-tion did not vary significantly from sample to sample. Datawere obtained from single samples for each time point, withgreater than 1.3 × 10⁷ unique 2 × 100-bp reads per sample.
mRNA sample preparation and transcript analysis
Messenger RNA (mRNA) was isolated and hybridized toAgilent yeast microarrays as described in (46). Briefly, 5-ml cultures were collected on filters and snap frozen in liq-uid nitrogen. Total RNA was extracted using the QiagenRNeasy Mini kit, including the additional DNase I diges-tion step. Chromosomal RNA (cRNA) for microarray hy-bridization was synthesized following the standard proto-col of the Agilent Low RNA Input Linear Amplificationkit (Agilent Technologies). cRNA was extracted using theQiagen RNeasy Mini kit and hybridized to Agilent YeastGene Expression Microarray (8 × 15K G4813A) slides andscanned at 5-�m resolution. Data were extracted using Ag-ilent Feature Extraction software version 9.5 with LinearLowess dye normalization and no background subtractionand were submitted to the Princeton University Microarraydatabase for storage and analysis.
For estradiol induction experiments, time course foldchange in transcript levels was fit to a Hill plot by optimiza-tion of n, f0, K and Vmax for each gene for the equation f(t) =f0 + Vmax·tn/(Kn + tn). Delay times were determined by ex-trapolation of the derivative of this function at f(t) = Vmax/2to the x-axis intercept.
Chromatin preparation for chromatin immunoprecipitation
Chromatin extract production was adapted from (47), withsome modifications. Briefly, 45-ml yeast cultures prior toor post the glucose downshift procedure were crosslinkedwith formaldehyde (0.8% final concentration) for 10 min
and quenched with glycine for 5 min. Cells were har-vested by centrifugation, 3000 X g, 4◦C, 5 min, andwashed with cold buffer (50-mM 4-(2-hydroxyethyl)-1-piperazineethanesulfonic acid (HEPES) pH 7.5, 140-mMNaCl), resuspended in 400-�l cold ChIP lysis buffer (50-mM HEPES pH 7.5, 140-mM NaCl, 1-mM ethylenedi-aminetetraacetic acid (EDTA), 1% Triton, 0.1% sodiumdeoxycholate, 1-mM phenylmethylsulfonyl fluoride and aRoche complete protease inhibitor tablet) and snap frozenin liquid nitrogen. Samples were thawed in 37◦C water bath,put on ice, and cold glass beads were added to 1 mm be-low meniscus. Cells were disrupted with a Fast Prep-24 (MPBiomedicals) bead beating system on setting 5.5 m/s 3 ×40 s in a 4◦C cold room. The resulting cell lysates werecentrifuged at 20 800 x g, 4◦C, 30 min. The supernatantswere removed, and the pellets were resuspended in 100-�l ChIP lysis buffer and placed in 120-�l Covaris tubesfor sonication shearing. Chromatin was sheared to an av-erage fragment size of 350 bp using a Covaris E220 sys-tem. The sheared chromatin samples were transferred to anEppendorf tube and sample volume adjusted to 200 �l (byadding ChIP lysis buffer) and centrifuged at 10000 x g, 4◦C,5 min. The pellets were the ‘insoluble fraction’ and the su-pernatants were transferred to a new Eppendorf tube andcentrifuged again, 10 000 x g, 4◦C, 15 min. The final super-natants were the chromatin extract used for ChIP.
Chromatin immunoprecipitation
For each ChIP, 2.5-�l anti-myc (Clontech, clone 9E10,cat#631206) or anti-Pol II C-terminal domain (Pol II8WG16 Monoclonal Antibody, Covance) antibody wasadded to 15-�l resuspended protein G Dynabeads (Invit-rogen), coupled according to the Dynabeads manual andwashed and resuspended in 233-�l lysis buffer per sample.Sixty-seven microliter chromatin extract was incubated withthe antibody-bound beads (total volume 300 �l) with ro-tation for 4 h at room temperature (RT). The beads werethen collected with the magnet and washed (resuspendedand nutated 4 min, RT) with 0.5-ml sodium dodecyl sul-phate (SDS) buffer (50-mM HEPES pH 7.5, 140-mM NaCl,1-mM EDTA and 0.025% SDS). Beads were subsequentlywashed with 0.5-ml high salt buffer (50-mM HEPES pH7.5, 500-mM NaCl, 1-mM EDTA), followed by 0.5-ml tris-lithium (TL) buffer (20-mM Tris-Cl pH 7.5, 140-mM NaCl,250-mM LiCl, 1-mM EDTA), followed by two washes in
Downloaded from https://academic.oup.com/nar/article-abstract/42/9/5468/1246885by gueston 21 February 2018

Nucleic Acids Research, 2014, Vol. 42, No. 9 5471
0.5-ml tris-EDTA (TE) buffer (20-mM Tris-Cl pH 7.5, 0.1-mM EDTA). Washed beads were resuspended for elutionin 72-�l TE + 1% SDS buffer (20-mM Tris-Cl pH 7.5, 0.1-mM EDTA, 1% SDS), vortexed and heated in a 65◦C waterbath, 2 min. The beads were vortexed well again and super-natants were taken from the beads. Twenty-five microliterwas used for western blots and 45 �l was taken to reversecrosslink at 65◦C, 14 h.
Reverse crosslinking and purification of DNA
Input DNA (2-�l chromatin extract (input DNA) and 118-�l TE + 1% SDS buffer) and ChIP DNA (45-�l ChIP eluate+ 75-�l TE + 1% SDS buffer) were incubated at 65◦C, 14 hfor reverse crosslinking. Reverse crosslinked samples werepurified on Qiagen PCR purification columns, eluted in 2× 35-�l Qiagen Elution buffer and kept frozen until libraryconstruction.
Library construction
ChIP-DNA was amplified using the LM-PCR method de-scribed in Agilent Yeast ChIP-on-chip analysis protocolversion 9.2, May 2007 and subjected to the Illumina TruSeqpaired-end sequencing protocol.
Sequence analysis
Paired-end sequences were mapped to the Saccharomycescerevisiae reference genome s288c Saccharomyces GenomeDatabase (SGD) version r64-1-1 20110203, using Bowtiefor Illumina (version 1.1.2) with seed length 22 and a maxi-mum permitted total of quality scores of 70 at mismatchedread positions, also allowing a maximum of two mismatchesin the seed. Twenty samples each for the Msn2 ChIP at 0 and20 min were combined to yield 2 × 10⁵ total reads for eachtime point. Alignments that mapped to more than one posi-tion on the reference genome were randomly distributed be-tween the reportable alignments. To eliminate PCR amplifi-cation artifacts, precise duplicates of paired-end ChIP readalignments mapping to a genomic position were excludedfrom analysis. Resulting sequence positions were then sub-jected to further analysis in MATLAB. Occupancy at eachbase pair position across the genome for both nucleosomesand ChIP profiles was determined by summing the totalnumber of unique sequence reads at that position and thennormalizing the summed values such that the average occu-pancy per bp for each experiment equals 1 over each chro-mosome. Peaks of Msn2 binding were identified either asthose with a maximal peak intensity 6-fold above the av-erage binding over the chromosome in which it is locatedor as those with z-score greater than 5 for the integratedarea of binding in the 250-bp region around a binding maxi-mum. Visualizations were performed using MATLAB stan-dard bioinformatics methods. The positions of STRE ele-ments were obtained from SGD (http://www.yeastgenome.org/cgi-bin/PATMATCH/nph-patmatch). Functional anal-ysis of groups of genes was performed using the Gene On-tology Term Finder from SGD.
Accession numbers and deposition of microarray data
Read data for the ChIP-Seq and MNase-Seq experimentsare publically available at NCBI SRA with the acces-sion number SRP033438. Microarray data are publiclyavailable at http://puma.princeton.edu/cgi-bin/publication/viewPublication.pl?pub no=559 and as a processed spread-sheet in Supplementary Table S2.
RESULTS
Msn2 binds to a limited number of sites in vivo
To explore the relation between transcription factor bind-ing, transcriptional changes and nucleosome repositioning,we determined the global binding pattern of Msn2 by chro-matin immunoprecipitation and DNA sequencing of theprecipitated fragments (ChIP-Seq) prior to and 20 min aftertransition of cells from growth on glucose to growth on glyc-erol, a condition that induces the ESR. We performed ChIP-Seq using anti-Myc antibodies on a strain in which MSN2was replaced with MSN2 tagged with 13 copies of the Mycepitope attached to the carboxy terminus of the protein andexpressed under its own promoter. The Myc-tagged versionof the protein showed normal nuclear localization and tran-scriptional activation in response to both hydrogen peroxideand glucose downshift conditions (Elfving et al. 2014, sub-mitted). We obtained 3–4-fold average sequence coverageover the entire genome for both time points and 180 readsover the most abundant unique binding site at the 20 mintime point. To assess the interplay of nucleosome remodel-ing and Msn2 binding, we concurrently mapped genome-wide nucleosome positions prior to and 20 min after theglucose-to-glycerol switch in an MSN2 MSN4 strain andin an isogenic msn2 msn4 strain by sequencing size-selectedDNA fragments following micrococcal nuclease treatmentof cross-linked chromatin. We obtained >100-fold sequencecoverage of the entire genome for both strains at each timepoint.
ChIP-Seq identified few Msn2 binding sites prior to thecarbon source downshift and a large number after thedownshift. We computationally identified sites of Msn2binding as described in the Materials and Methods section.The positions of the major Msn2 binding sites are shown inFigure 1. We hand annotated each of the peaks to identifythe genomic features associated with each site. This processyielded 273 distinct and robust peaks of bound Msn2, dis-tributed over 269 genes, 20 min after the glucose downshift.The positions of these sites, the associated gene or genomicfeature and the relative abundance of Msn2 at these sitesprior to and after the glucose downshift are listed in Sup-plementary Table S1. The majority (192) of those sites cor-responded to promoter regions with the remaining peaksmapping solely to gene coding sequences (36 peaks) or toTy elements (40 peaks), with the latter displaying a verycharacteristic pattern of Msn2 distribution based on themanner in which sequence reads were apportioned to re-peat sequences. Because Ty elements are not readily distin-guished by sequence, we could not determine whether all Tyelements bind Msn2 at equal levels or whether some havegreater affinity than others. Most of the coding sequencesregistering significant Msn2 binding were expressed at high
Downloaded from https://academic.oup.com/nar/article-abstract/42/9/5468/1246885by gueston 21 February 2018

5472 Nucleic Acids Research, 2014, Vol. 42, No. 9
Figure 1. Msn2 binding sites. The relative positions of the 268 Msn2 binding sites determined in this study are indicated by short vertical lines aboveeach chromosome (horizontal black lines). The vertical lines below the chromosomes denote the 212 most robust binding sites identified in (41) followingexposure of cells to hydrogen peroxide. The binding sites identified in the current study are denoted by color specified in the legend as residing solely in thecoding region of a gene (coding region), over a transposable element (Ty) or in the promoter of a gene induced, repressed or unaffected (neutral) by Msn2.See Supplementary Table S1 for a detailed description of each site.
levels, as measured by PolII occupancy (Supplementary Ta-ble S1), consistent with the growing appreciation that highlyexpressed genes are retrieved inadvertently as artifacts ofthe ChIP protocol (48). In fact, more than half of the 50most highly expressed genes were recovered in the Msn2ChIP experiment (P < 10−100). Moreover, most coding re-gions to which Msn2 bound lack an STRE, the binding mo-tif for Msn2. In sum, our experiments identified a numberof sites for Msn2 binding following glucose downshift, witha majority of the robust sites mapping to promoter regionsand a smaller number mapping to Ty elements and to cod-ing domains of highly expressed genes.
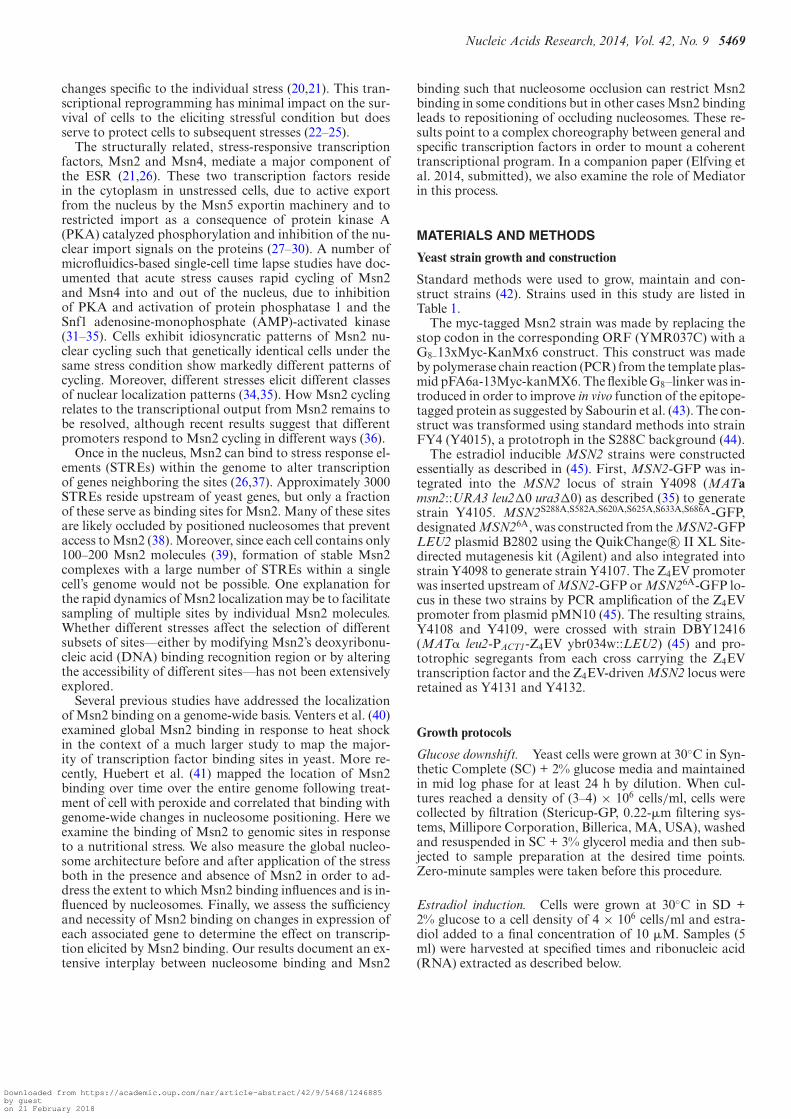
Previous in vivo and in vitro studies have identified acanonical binding site for Msn2, the STRE with a sequenceRGGGG (26,37,49–51). As shown in Figure 2A, Msn2binding is significantly enriched around STREs. Moreover,the probability of an STRE residing close to a peak of Msn2binding is significantly greater than that expected for a ran-dom distribution of STREs relative to binding sites (Fig-ure 2B). However, while approximately 11,500 STRE se-quences are present in yeast genome, with 3160 lying inthe promoters of almost 2000 genes, Msn2 fails to bindmost of these sites. Reasons for this selective binding to
only a subset of STREs are addressed below. The proba-bility of Msn2 binding to a promoter was correlated withthe number of STREs within that promoter (Supplemen-tary Figure S1). This may result from cooperative bindingof Msn2 to adjacent STREs, particularly since the fractionof multiple STRE-containing promoters that are bound byMsn2 is higher than that predicted assuming independentinteraction of Msn2 with each STRE within a promoter(Supplementary Figure S1). We also observed low but de-tectable levels of Msn2 binding over STREs prior to thenutrient downshift. This is consistent with the observationthat, while Msn2 resides predominantly in the cytoplasm inthe absence of stress, Msn2 is not completely excluded fromthe nucleus under those conditions (35). Moreover, even un-der robust growth conditions, Msn2 exhibits random nu-clear bursting, such that Msn2 congregates in the nucleusfor a short period of time in a small number of individualcells. Thus, the low level of Msn2 binding we observe on av-erage in unstressed cells may represent robust Msn2 bindingin a very small number of cells in the population.
We compared the binding sites identified in our experi-ment with those observed by Huebert et al. following treat-ment of cells with hydrogen peroxide (41). This study re-
Downloaded from https://academic.oup.com/nar/article-abstract/42/9/5468/1246885by gueston 21 February 2018
Nucleic Acids Research, 2014, Vol. 42, No. 9 5473
Figure 2. Msn2 binds near STREs. (A) The average Msn2 occupancy at a particular site is plotted as a function of distance of that site from each of the3150 promoter STREs (RGGGG motifs), before and 20 min after a glucose-to-glycerol downshift. (B) The likelihood of an STRE residing at a particularsite is plotted as a function of distance of that site from each of the peaks of Msn2 binding identified in this study and listed in Supplementary Table S1. Thevalues are calculated as the fraction of Msn2 peaks that contain an STRE at the indicated position, averaged over a 20 bp moving window. By comparison,the probability of finding STRE at a random site is less than 9 × 10⁻⁴.
ported 1289 sites that were statistically enriched in thetreated samples. Plotting the 212 sites with the highest re-ported peak values from the Huebert et al. experiment rel-ative to the positions of the most robust sites from our ex-periment indicates a significant overlap in the two sets ofdata (Figure 1). In fact, the peaks of 113 sites (42%) iden-tified in our experiment lie within 500 bp of a peak amongthe 212 most abundant sites identified by Huebert et al. (P< 10−250). Moreover, 76% of the peaks identified in our ex-periment coincide with the location of one of the significantsites identified by Huebert et al. Thus, the vast majority ofde novo Msn2 binding sites are recapitulated under differentstress conditions, consistent with a relative uniform tran-scriptional response of cells to stress, independent of thenature of the initiating stress.
Stress-specific binding of Msn2 to promoters reflectedboth common and condition-specific responses to stress.While most of the Msn2-binding sites identified upon nu-trient downshift overlap those identified following oxida-tive stress, we noted that a number of stress-induced Msn2binding sites identified after oxidative stress were absentupon nutrient downshift, and vice versa. Those genes inwhose promoters Msn2 bound following oxidative stressbut not after glucose downshift were enriched for telom-eric sequences and for those involved specifically in responseto treatment with oxidizing agents (13/69; P = 10−4). Sim-ilarly, those genes in whose promoters Msn2 bound fol-lowing glucose downshift but not in response to oxidativeagents were highly enriched in those involved in carbohy-drate metabolism (P = 4 × 10⁻⁵). Thus, in addition to bind-ing to promoters of genes involved in a common stress re-sponse, Msn2 binds specifically to a subset of genes asso-ciated with response to the particular initiating stress. Wediscuss below possible mechanistic bases for this discrimi-nation.
Msn2 mediates both gene activation and gene repression
We assessed the effect of Msn2 on transcriptional repro-gramming under nutrient downshift conditions in severalways. First, we determined the level of Pol II associated
with all coding regions prior to and 20 min after glucoseto glycerol transition by performing ChIP-Seq using anti-bodies targeting the C-terminal repeat domain of the Rpb1subunit of Pol II. In addition, we examined global transcriptlevels by microarray analysis of both an MSN2 MSN4 andan msn2 msn4 strain pre- and post-transition. These dataprovide information on the extent to which transcriptionalchanges that occur following the carbon source downshiftare dependent on the Msn transcription factors. Finally, toidentify those transcriptional changes that occur specificallyin response to activation of Msn2, we measured global tran-scriptional changes following ectopic induction of Msn2.This was accomplished using a hybrid zinc-finger transcrip-tion factor recently described, termed Z4EV (45). Specifi-cally, we used a strain in which MSN2 expression was drivenby a modified GAL1 promoter in which four repeats ofa zinc-finger DNA binding protein recognition sequencereplaced the Gal4 binding sites. The strain expressed theZ4EV fusion protein, consisting of the zinc-finger bindingprotein targeting the modified GAL1 promoter as well as theVP16 activation domain and an estrogen receptor fragmentencompassing the Hsp90 and estrogen binding domains.Z4EV resides in the cytoplasm in the absence of estradiol,due to binding Hsp90, and rapidly dissociates from Hsp90following estradiol addition, resulting in relocation to thenucleus and induction of transcription of genes with a up-stream activator sequence (UAS) containing the specificzinc-finger binding motifs. Since this sequence does not nor-mally exist in the yeast genome, the only gene induced byestradiol treatment is the one engineered to be linked to thatsequence. Accordingly, estradiol induces production only ofMsn2 in this strain. While the induced Msn2 resides pre-dominantly in the cytoplasm upon estradiol treatment, suf-ficient nuclear localization occurs, through partitioning inall cells and bursting in some cells, to allow Msn2 to ex-ert its transcriptional effects (see below). We conclude thatany gene rapidly induced or repressed by estradiol treatmentmust be under the direct regulation of Msn2.
Using the transcript data from the experiments describedabove, we could identify those genes whose expression
Downloaded from https://academic.oup.com/nar/article-abstract/42/9/5468/1246885by gueston 21 February 2018

5474 Nucleic Acids Research, 2014, Vol. 42, No. 9
was directly affected by Msn2 in response to the glucosedownshift. The strong correlation between transcript levelchanges and the changes in Pol II occupancy over the corre-sponding coding regions following nutrient downshift con-firmed that transcript level changes were a consequenceof changes in transcriptional activation rather than post-transcriptional processes (Supplementary Figure S2). Weidentified those genes activated by Msn2 as those thatshowed increased transcript levels upon estradiol treatmentof the Z4EV strain described above as well as diminished in-duction, or more substantial repression, of transcript levelsin the msn2 msn4 strain versus the MSN2 MSN4 strain af-ter the glucose downshift. Similarly, we identified genes re-pressed by Msn2 as those whose transcript levels fell uponestradiol treatment of the Z4EV strain and exhibited highertranscript levels in the msn2 msn4 strain versus the MSN2MSN4 strain after glucose downshift. These independentmeasures of sufficiency and necessity of Msn2 activity ongene expression were reasonably consistent (SupplementaryTable S1). Moreover, approximately two-thirds of genesexhibiting Msn2-dependent regulation by the above crite-ria showed Msn2 promoter binding in response to a glu-cose downshift, consistent with the hypothesis that Msn2binding directly affected expression of the correspondinggene and that most genes whose transcription modula-tion are Msn2-dependent are directly regulated by Msn2binding. Finally, a significant number of genes (86/192) towhose promoter Msn2 bound after the glucose downshiftshowed Msn2-dependent transcriptional activation, consis-tent with Msn2’s reported role as a transcriptional activa-tor. These were enriched in genes involved in energy reservemetabolism (P = 3 × 10⁻¹¹), oxidation-reduction processes(P = 5 × 10⁻¹⁰) and glycogen (P = 7 × 10⁻¹⁰) and trehalose(P = 4 × 10⁻⁷) metabolism. However, a significant num-ber of genes (44/192) to whose promoter Msn2 bound ex-hibited Msn2-dependent transcriptional repression follow-ing glucose downshift or during induction of Msn2. Thesewere enriched in genes involved in glucose catabolism (P =10−4). The remaining genes to which Msn2 bound were ei-ther Ty elements or coding regions noted above or showedno Msn2-dependent change in expression. These results in-dicate that Msn2 functions both as a transcriptional acti-vator and a transcriptional repressor. The basis of this dualactivity is discussed below.
Msn2 elicits different patterns of gene regulation kinetics
Evaluation of the transcriptional consequences of activat-ing Msn2 using the Z4EV system revealed several unex-pected aspects of Msn2 regulation. First, a number of genessignificantly changed expression following Z4EV inductionof Msn2 but did not exhibit significant Msn2 binding inthe ChIP-Seq analysis or display Msn2-dependent tran-scriptional changes following the glucose downshift. Theinduced genes in this set generally contained one or moreSTREs in their upstream intergenic regions. For instance,85 of the 100 most induced genes following estradiol treat-ment of the Z4EV strain contained one or more upstreamSTREs, although only 40 of these showed significant bind-ing of Msn2 by ChIP-Seq in the glucose downshift experi-ment. This suggests a hierarchy of STRE binding affinities
such that lower affinity sites are bound only when Msn2 isexpressed at higher levels but that such sites can mediate ac-tivation under that condition. A number of these promotersexhibited Msn2-dependent nucleosome remodeling (see be-low) during the glucose downshift, indicating that even lowlevel or transient Msn2 binding can affect local chromatinstructure. Those genes repressed following Msn2 inductionby Z4EV are highly enriched for ribosome biogenesis genes(P = 10−24) but only ∼10% show Msn2 binding by ChIP-Seq and most (60%) do not contain STREs in their promot-ers. This suggests that much of the repression is an indirecteffect of Msn2 induction.
The Z4EV induction data also revealed unexpected diver-sity in the kinetics of activation of Msn2 responsive genes.Genes induced upon activation of Msn2 in the Z4EV strainbegin to accumulate transcripts following estradiol additionbut only after a delay. As illustration, the induction kineticsof several genes are shown in Figure 3A–D. The duration ofthis delay showed a broad distribution among the inducedgenes, with the majority of genes initiating transcript accu-mulation 35–45 min after estradiol addition while a signif-icant minority of the genes initiated accumulation greaterthan 45 min following addition (Figure 3I and J). Since theZ4EV cells in which Msn2 was induced by estradiol were un-stressed, Msn2 remained predominantly in the cytoplasm,with only occasional random bursts of nuclear occupancy inindividual cells (Supplementary Movie S1 and Supplemen-tary Figure S3A). To test whether this limited nuclear occu-pancy contributed to the variable lag in transcript accumu-lation, we performed the transcription study using the Z4EVstrain to drive expression of a mutant Msn2, designatedMsn26A, in which all six PKA phosphorylation sites in theprotein were converted to alanines. Since PKA-mediatedphosphorylation is responsible for retaining Msn2 in thecytoplasm and Msn26A could not be phosphorylated byPKA, Msn26A induced by estradiol treatment immediatelyentered the nucleus in all cells (Supplementary Movie S2and Supplementary Figure S3B). Notably, the duration ofthe delay in transcript accumulation was reduced for mostgenes to 15–25 min (Figure 3E–J), without a significantchange in the rate of transcript accumulation once induc-tion began (Figure 3K). Repressed genes exhibited a similarpattern of kinetics (data not shown). Thus, Msn2 responsivegenes fall into roughly two categories based on their activa-tion kinetics in conditions of limited Msn2 nuclear occu-pancy: rapid responders and slow responders. Notably, thisdichotomy is lost under conditions of high Msn2 nuclearoccupancy, ruling out the possibility that the two classessimply reflect direct versus indirect targets of Msn2 regu-lation. Rather, Msn2-regulated genes exhibit distinctly dif-ferent patterns of response to wild-type Msn2 activation.
Msn2 can promote repositioning of nucleosomes following nu-tritional stress
Consistent with our previous observations (3), we find thatnutrient downshift results in relatively limited nucleosomerepositioning, in spite of the significant transcriptional re-programming (Supplementary Figure S4). However, by de-termining global nucleosome positions before and after glu-cose downshift in both an MSN2 MSN4 and an msn2 msn4
Downloaded from https://academic.oup.com/nar/article-abstract/42/9/5468/1246885by gueston 21 February 2018

Nucleic Acids Research, 2014, Vol. 42, No. 9 5475
Figure 3. Different genes exhibit different induction kinetics in response to Msn2. (A–D) Induction kinetics for four Msn2-inducible genes followingestradiol addition to strains containing wild-type MSN2 under control of the hybrid Z4EV transcription factor. Blue circles: fold increase in gene transcriptlevels relative to that immediately prior to estradiol addition; solid red line: best fit of the data for each gene to the function f(t) = f0 + Vmax · tn/(Kn +tn); dashed line: tangent line to the curve at f(t) = Vmax/2, whose extrapolation to the x-axis provides the measure of the time delay in response to Msn2induction. (E–H) Induction kinetics for the genes shown in (A–D) following estradiol addition to strains containing MSN26A under control of the hybridZ4EV transcription factor. (I) Histogram of time delay values for the 96 genes induced more than 2-fold in both the MSN2 wild-type and MSN26A strainsand whose induction values are reasonably fit by the Hill curve. Blue line: delay values in the MSN2 wild-type strain; red line: delay values in the MSN26A
mutant strain. (J) Scatter plot of the delay time for each gene in I in the MSN26A strain relative to that in the MSN2 wild-type strain. (K) Histogram ofrates of induction, i.e. the slope of the tangent line to the fitted curve at f(t) = Vmax/2, for the 96 genes in (I). Blue line: delay values in the MSN2 wild-typestrain; red line: delay values in the MSN26A mutant strain.
Downloaded from https://academic.oup.com/nar/article-abstract/42/9/5468/1246885by gueston 21 February 2018

5476 Nucleic Acids Research, 2014, Vol. 42, No. 9
Figure 4. Msn2 promotes nucleosome repositioning over gene promoters. Shown are binding profiles of Msn2 (row 1) and PolII (row 2) as well as thenucleosome profiles (rows 3 and 4) over four different Msn2-regulated genes and the surrounding regions along the genome. Each panel shows a bindingprofile before the glucose-to-glycerol switch (blue lines) and 20 min after the transition (red lines). The nucleosome profiles were obtained for both anMSN2 MSN4 (row 3) and an msn2 msn4 strain (row 4). Two of the genes, PGM2 and HSP30, are induced by Msn2 following the nutrient downshift, whilethe other two, ERG11 and ZRT1, are repressed. In order to be able to compare the occupancy profiles obtained from different experiments with differentsequencing coverage, we normalized all profiles such that the average occupancy across each chromosome in each experiment equals 1.
Figure 5. Msn2 reduces the average nucleosome occupancy near its binding sites following nutrient downshift. The distribution of nucleosome occupancyaround STREs (A) and Msn2 binding sites (B), as defined in the legend to Figure 2, are shown before (blue line) and after (green line) the glucose-to-glyceroldownshift in wild-type cells and before (red line) and after (cyan line) the glucose-to-glycerol downshift in msn2 msn4 mutant cells.
strain, we were able to identify promoters in which expres-sion change was associated with nucleosome repositioningand determine whether that repositioning was dependenton Msn2 and/or Msn4. In this manner, we identified a num-ber of genes in which transcriptional activation, Msn2 bind-ing and nucleosome depletion from the promoter were co-incident and in which nucleosome depletion was dependenton Msn2 and/or Msn4. Two examples of genes, PGM2 andHSP30, that show this pattern are profiled in Figure 4Aand C. Similarly, we identified several genes at which tran-
scriptional repression, Msn2 binding and nucleosome ac-quisition are coincident and in which nucleosome acquisi-tion is dependent on Msn2 (Figure 4B and D). In sum, 72%(62/86) of induced genes regulated by Msn2 show nucleo-some depletion and 60% of those show complete or partialdependence of the nucleosome depletion on Msn2 and/orMsn4. Similarly, 50% (22/44) of repressed genes regulatedby Msn2 show nucleosome remodeling, primarily nucleo-some acquisition, and 45% of those show dependence ofnucleosome remodeling on Msn2 and/or Msn4. From these
Downloaded from https://academic.oup.com/nar/article-abstract/42/9/5468/1246885by gueston 21 February 2018

Nucleic Acids Research, 2014, Vol. 42, No. 9 5477
Figure 6. Msn2 binds to STREs in nucleosome free promoters. All STREs residing upstream of gene transcription start sites were organized by k-meansclustering (k = 10) on the basis of the nucleosome occupancy profiles over the 1 kb regions centered on STRE at 20 min following the glucose-to-glycerolnutrient downshift. The clustered nucleosome occupancy profiles are presented as a heat map (A). A heat map of the binding profiles of Msn2 at 20 minfollowing the nutrient downshift is shown in (B), with the same gene order as in (A). The average nucleosome and Msn2 occupancy in the 1kb regionscentered on STRE elements for each cluster, before and 20 min after the switch, are shown in (C).
Figure 7. Msn2 and STRE distribution relative to the well-positioned nu-cleosomes. We selected well-positioned nucleosome, with dyad positionscharacterized by at least five sequencing reads. The blue line shows the av-erage Msn2 occupancy relative to the dyad locations of the well-positionednucleosomes. The green line shows the probability of finding a nearbySTRE element.
studies, we conclude that a significant function of Msn2 is toexpose promoter regions during gene activation and to oc-clude promoter regions during gene repression. Thus, Msn2is not simply a passive respondent to remodeling promoted
by other agents but plays an active role in restructuring theNDR during transcriptional reprogramming.
The Msn2/Msn4-dependent reorganization of nucleo-somes noted above could be observed on a global scale. Wecalculated the nucleosome occupancy around all promoterSTRE sites before and after the nutrient downshift in boththe wild-type and msn2 msn4 strains. As evident from theplot of the average nucleosome occupancy as a function ofdistance from every STRE under these four conditions, nu-trient downshift results in reduction of nucleosome densityover these sites (Figure 5A). This is consistent with an over-all increase in expression of stress-responsive genes follow-ing a downshift, and observed correlation between reducedoccupancy of nucleosomes in promoters and increased tran-scription. However, the reduction in nucleosome density ofSTREs was approximately twice as large in the wild-typestrain compared to the msn2 msn4 strain. We observed sim-ilar results by examining nucleosome density around sitesof Msn2 binding (Figure 5B). These observations demon-strate that Msn proteins play an active role in reducing nu-cleosome occupancy during transcriptional activation.
Nucleosomes restrict access of Msn2 to STREs
While our data described above demonstrate that Msn2binding can alter adjacent nucleosome occupancy, we find
Downloaded from https://academic.oup.com/nar/article-abstract/42/9/5468/1246885by gueston 21 February 2018

5478 Nucleic Acids Research, 2014, Vol. 42, No. 9
Figure 8. Possible mechanisms for stress-specific binding of Msn2 to different sets of genes. (A) Different stresses could result in distinct modifications (redversus green dots) of Msn2 (blue oval), which could alter the binding specificity or the nuclear occupancy dynamics and which would lead to interactionwith different but overlapping sets of stress-responsive genes. (B) Different stresses could activate Msn2 (blue oval) as well as a stress-specific transcriptionfactor (red oval for nutrient stress and green oval for oxidative stress). Those genes with STREs lying in nucleosome-free domains would bind Msn2 undereither condition. However, binding of the stress-specific transcription factor could partially unwrap adjacent nucleosomes (beige ovals) to reveal additional,previously inaccessible STREs to which Msn2 could bind.
that nucleosome position significantly restricts accessibil-ity of Msn2 to its canonical binding sites. First, while mostSTREs in the genome reside in coding regions, Msn2 didnot bind to any of these sites, likely because they are oc-cluded by well-positioned nucleosomes. Second, we used k-means clustering to categorize patterns of nucleosome oc-cupancy around the 3150 transcription start site proximalSTREs prior to the nutrient downshift (Figure 6A and C).These patterns range from cases in which nucleosomes sitdirectly over the STRE to cases in which the STRE residesin an NDR centered on the STRE to cases in which theSTRE resides in an extended NDR. We then determinedto which of these STREs Msn2 bound following the nu-trient downshift. As evident in Figure 6B and C, Msn2bound almost exclusively only to those STREs residing inextended NDRs. Moreover, the extent of Msn2 binding wasessentially inversely proportional to the nucleosome den-sity around the STRE. Surprisingly, even those STREs lyingin open chromatin domains of limited dimension were notsubstrates for Msn2 binding (cluster 2, for example). Thus,at the global scale, nucleosome occupancy restricts Msn2binding.
We also find a local effect of nucleosome occupancy onMsn2 binding. In Figure 7 we plot the density of STRE ele-ments within the footprint of well-positioned nucleosomesacross the genome. Superimposed on that plot is the aver-age binding of Msn2 to STREs at the indicated positionfollowing nutrient downshift. Quite evident from this dia-gram, STREs are enriched under the nucleosome umbrella,perhaps reflecting the guanosine/cytosine bias in nucleo-somal positioning sequences. In contrast, Msn2 binding isuniformly low within the 90-bp inner core of the positionednucleosomes, significantly higher in the nucleosome adja-cent region and proportionately increasing with increasingdistance from the inner core of the nucleosome footprint.These results suggest that well-positioned nucleosomes pre-vent access of Msn2 to its cognate binding sites when thosesites reside under the core of the nucleosome. However,Msn2 can gain access to its cognate sites that lie under theedges of the positioned nucleosomes. As discussed below,this observation is consistent with dynamic partial unwrap-
ping of DNA bound to nucleosomes and competition be-tween nucleosome binding and transcription factor bindingto specific target sequences.
DISCUSSION
Stress-specific and stress-non-specific Msn2 binding
We have mapped Msn2 binding sites across the genome fol-lowing a nutrient downshift, which elicits the ESR. Someof the binding sites correspond to structural features suchas transposable elements or transcribed regions of highlyexpressed genes. The former are repeated sequences, whichprevents assignment of binding to specific elements, so wecannot determine from our data whether all Ty elementsor only a subset binds Msn2. However, binding to Ty ele-ments is consistent with stress activation of Ty transposi-tion (52,53) and suggests that Msn2 may play a role in stim-ulating such transposition. The latter structural feature––transcribed coding regions––may be an artifact of theChIP-Seq protocol, since antibodies to many unrelated pro-teins have been reported to retrieve these same sequences(48,54,55). We also find that anti-Myc antibodies to mul-tiple different tagged proteins in this experiment retrievedthese sequences (data not shown). The majority of the bind-ing sites correspond to promoters of transcribed genes.Moreover, most of these binding sites lie within several hun-dred base pairs of one or more STREs, previously definedas Msn2 binding sites. We conclude that most Msn2 bind-ing is targeted to specified Msn2 binding motifs in promoterregions of genes.
Comparing our data with those previously obtained forMsn2 binding following peroxide treatment revealed a com-mon core of Msn2-bound genes as well as condition-specificbinding. Since we examined binding at only one time pointfollowing nutrient shift, we may not have captured all thenutrient-dependent binding sites. Nonetheless, the bind-ing pattern mirrors the transcriptional changes associatedwith different stresses, in which a core stress response isaugmented by activation/repression of genes targeted tospecific stresses (20,21). Consistent with this interpreta-tion, those genes bound by Msn2 uniquely following per-
Downloaded from https://academic.oup.com/nar/article-abstract/42/9/5468/1246885by gueston 21 February 2018

Nucleic Acids Research, 2014, Vol. 42, No. 9 5479
oxide treatment are enriched for those associated with re-mediation of oxidative stress while those uniquely boundfollowing glucose downshift are involved in carbohydratemetabolism. These results suggest that the stress-specifictranscriptional response is mediated at least in part byMsn2.
How might Msn2 binding be responsive to specific stim-uli? One possibility is that post-translational modificationof Msn2 dictated by different stress signaling pathwaysmodifies the binding specificity of the protein (Figure 8A).In this context, different stresses yield different patterns ofMsn2 nuclear entry and exit, patterns that may well be per-ceived by different promoters in different ways (34–36). Wefound in this study that Msn2 responsive genes had quitedivergent delay times in response to Msn2 activation whenMsn2 was largely cytoplasmic and exhibited only randombursts of nuclear occupancy. This difference was essentiallyeliminated when Msn2 resided predominately in the nu-cleus. This divergence in response times may reflect the dis-tinction recently described by Hansen and O’Shea (36), whonoted that some genes respond to both sustained and pul-satile Msn2 nuclear localization (fast promoters) while oth-ers responded only to sustained Msn2 localization (slowpromoters). In fact, two of the three slow-responding genesdefined by Hansen and O’Shea, ALD3 and TKL2, wereamong the slowest responding genes to wild-type Msn2 in-duction in our study, while all four of the fast-respondinggenes from Hansen and O’Shea, DDR2, DCS2, RTN2 andHXK1, initiated mRNA accumulation significantly earlier,along with the majority of induced genes (Figure 3A–D).The third slow-responding gene characterized by Hansenand O’Shea was not captured adequately for analysis in ourmicroarray study. We could not identify a correlation be-tween any aspect of nucleosome remodeling with responsedelay times: both fast- and slow-responding genes exhibitedMsn2/4-dependent clearance of nucleosomes from theirNDRs, for instance. However, further analysis of Msn2binding, response kinetics and nucleosome remodeling mayprove informative.
Another possible scenario to explain stress-specific Msn2promoter binding is that transcription factors responsiveto specific stress signals, e.g. Yap1 for oxidative stress orthe Hap1–4 complex for glucose downshift (56–59), bind topromoters in a stress-specific manner and stimulate chro-matin clearance at those promoters, allowing access ofMsn2 to STRE sites that would otherwise be occluded (Fig-ure 8B). This may represent an example of cooperative bind-ing of transcription factors by sequential unwrapping ofDNA from nucleosomes, such that binding of a transcrip-tion factor to its cognate site near the periphery of a po-sitioned nucleosome provides access to a binding site for asecond transcription factor that would be otherwise buriedunder the interior of the nucleosome (60,61). Consistentwith this model, we note a significant overlap (P < 10−24)between Msn2 binding and promoters at which Floer et al.mapped RSC-associated and partially unwrapped nucleo-somes (62). Moreover, we find that more than 70% of thepromoters to which Msn2 binds and activates transcriptionundergo nucleosome remodeling and for 40% of those theremodeling is independent of Msn2. Thus, other transcrip-
tion factors may well clear the space to allow Msn2 bindingand that clearance may well be stress specific.
Msn2 promotes both transcriptional activation and transcrip-tional repression
We find that Msn2 binding stimulates both transcriptionalactivation and transcriptional repression. The capacity ofMsn2 to promote transcriptional activation is well docu-mented and consistent with the structural features of theprotein (26,63). The activity as a repressor is less well docu-mented. Our data demonstrate that repression is not an in-direct effect, as might result from transcriptional activationof a repressor protein or inhibition of growth. Rather, Msn2binds to promoters of repressed genes and in some cases isresponsible for recruitment of nucleosomes into the NDR.How Msn2 binding results in activation in some cases andrepression in others is certainly not clear but may involvethe type of combinatorial interaction with transcriptionalmodulators as mentioned above. Moreover, in a companionpaper (Elfving et al. 2014, submitted), we show that Msn2recruits mediator complex, most often to promote recruit-ment and activation of Pol II but occasionally to repositionMediator to a non-productive position in the promoter .Thus, the same basic activity can function both in activa-tion and repression. Finally, since stress is associated withat least a transient cessation of growth (58,64,65), we wereinterested in understanding whether Msn2 might repressgenes whose expression is necessary for growth. In fact, asignificant component of the ESR consists of repression ofgenes that promote growth, such as ribosomal protein andribosome biogenesis genes (21). We do find that many ofthe genes repressed upon activation of Msn2 are highly en-riched for those involved in ribosome biogenesis. However,few of these genes are bound by Msn2, at least under condi-tions of nutrient downshift. Rather, we observed that Msn2activates transcription of DOT1, which encodes a repressorof ribosome biogenesis genes (see Supplementary Tables S1and S2). Moreover, we find that Msn2 binds to and acti-vates transcription of XBP1, which encodes a repressor ofa number of genes required for cell cycle progression (66).Accordingly, Msn2, while a primary purveyor of the ESR,may indirectly repress the growth-associated genes encom-passed in the ESR.
A complex interplay between Msn2 binding and nucleosomeoccupancy
More than 10,000 canonical Msn2 recognition sites reside inthe yeast genome and yet only a small fraction of these serveas binding sites for Msn2 in vivo. Comparing nucleosomeoccupancy to subsequent Msn2 binding, we see that thoseSTREs that fail to serve as binding sites generally lie in re-gions of well-ordered nucleosomes. Moreover, those STREslying under the core of a well-positioned nucleosome showdiminished binding of Msn2, relative to sites outside nucle-osomes or at the edges of positioned nucleosomes. Thus, po-sitioned nucleosomes serve to restrict Msn2 binding. More-over, the gradient of Msn2 binding as a function of the dis-tance of an STRE from the edge of a nucleosome is consis-tent with partial unwrapping of DNA from a nucleosome
Downloaded from https://academic.oup.com/nar/article-abstract/42/9/5468/1246885by gueston 21 February 2018

5480 Nucleic Acids Research, 2014, Vol. 42, No. 9
in vivo. Finally, we note that Msn2 fails to bind to STREslying in NDRs of limited width. This may suggest that suchNDRs may be stably obstructed by factors other than nu-cleosomes or by nucleosomal subparticles of non-canonicallength. In short, well-positioned nucleosomes, as well asother unidentified chromatin features, occlude STRE bind-ing of Msn2 and thereby dictate which of the many elementsare available for promoting regulatory changes in responseto stress-induced Msn2 entry into the nucleus.
While nucleosomes generally restrict access of Msn2 to itscognate sites on the genome, Msn2 can serve to alter nucle-osome positioning. Shivaswamy et al. (11) showed that nu-cleosomes over some STREs were lost following heat shockand suggested that such loss allowed binding of Msn2 andsubsequent transcriptional activation, arguing for a passiverole for Msn2 in nucleosome remodeling. However, by ex-amining nucleosome positioning in both a wild-type and anmsn2 msn4 strain, we have shown that in many cases nu-cleosome repositioning is dependent on Msn function andthus that Msn2, Msn4 or both play an active role in nucle-osome remodeling. Our results are consistent with those ofHuebert et al. (41) who found that Msn2 binding to STREsoccluded by nucleosome preceded nucleosome removal fol-lowing peroxide treatment. We find that Msn2 does not bindto STREs located under the central core of nucleosomes butrather can bind to sites located near the periphery of thenucleosomes. This suggests a model in which partial un-wrapping of nucleosomes in vivo allows initial binding ofMsn2 to STREs at the edges of nucleosomes. Subsequentrecruitment of chromatin modifying and remodeling pro-teins by Msn2 would lead to reposition or eviction of the oc-cluding nucleosome. In a similar way, recruitment of Msn2to STREs in NDRs could result in restructuring the localchromatin environment. Thus, while nucleosomes obstructMsn2 binding, Msn2 binding can evict nucleosomes fromsome STREs and can alter the nucleosome positioning inits vicinity.
Global measurement versus individual responses
The studies described in this report measure Msn2 bindingand nucleosome positioning over the entire population ofcells in a culture and thus provide a measure only of the av-erage behavior over all cells. However, microfluidics-basedstudies demonstrate that stress elicits a variable Msn2 re-sponse, with some cells exhibiting substantial and sustainedMsn2 nuclear occupancy while others showing no accu-mulation (34,35). Moreover, Msn2 shows bursting behaviorin which the cellular cohort of Msn2 makes random tran-sient forays into the nucleus. Thus, the pattern of bindingwe observe by ChIP-Seq likely does not reflect the patternof Msn2 genome occupancy in any individual cell, partic-ularly since the number of Msn2 molecules is apparentlyless than the number of bound sites identified in our andother studies. This raises the possibility that the cohort ofgenes induced byMsn2 may differ significantly among dif-ferent cells, either in a completely random fashion or in dis-tinct subsets of responses. Such diversity in transcriptionaloutput may allow genetically identical cells in a popula-tion to respond individually and in quite distinct ways to a
common stress, enhancing the number of survival strategiesavailable to the population of cells as a whole.
FUNDING
Swedish Cancer Society, the Swedish Research Coun-cil and the Kempe Foundation [S.B.]; National Insti-tutes of Health [R01 HG004708 to A.V.M.]; Alfred P.Sloan Research Fellowship [A.V.M.]; National Institutesof Health [GM076562 to J.R.B.]; Center for QuantitativeBiology/National Institutes of Health [P50 GM071508 toJ.R.B]. Funding for open access charge: NIH GM076562.
SUPPLEMENTARY DATA
Supplementary Data are available at NAR Online.
ACKNOWLEDGEMENTS
The authors would like to thank Scott McIsaac for provid-ing strains and sharing unpublished data, Mark Rutledgefor assistance with analysis of microarray data and JohnMatese for management of microarray data archiving.
REFERENCES1. Segal,E., Fondufe-Mittendorf,Y., Chen,L., Thastrom,A., Field,Y.,
Moore,I.K., Wang,J.P. and Widom,J. (2006) A genomic code fornucleosome positioning. Nature, 442, 772–778.
2. Tolkunov,D., Zawadzki,K.A., Singer,C., Elfving,N., Morozov,A.V.and Broach,J.R. (2011) Chromatin remodelers clear nucleosomesfrom intrinsically unfavorable sites to establish nucleosome-depletedregions at promoters. Mol. Biol. Cell, 22, 2106–2118.
3. Zawadzki,K.A., Morozov,A.V. and Broach,J.R. (2009)Chromatin-dependent transcription factor accessibility rather thannucleosome remodeling predominates during global transcriptionalrestructuring in Saccharomyces cerevisiae. Mol. Biol. Cell, 20,3503–3513.
4. Jiang,C. and Pugh,B.F. (2009) A compiled and systematic referencemap of nucleosome positions across the Saccharomyces cerevisiaegenome. Genome Biol., 10, R109.
5. Lee,W., Tillo,D., Bray,N., Morse,R.H., Davis,R.W., Hughes,T.R. andNislow,C. (2007) A high-resolution atlas of nucleosome occupancy inyeast. Nat. Genet., 39, 1235–1244.
6. Yuan,G.C., Liu,Y.J., Dion,M.F., Slack,M.D., Wu,L.F., Altschuler,S.J.and Rando,O.J. (2005) Genome-scale identification of nucleosomepositions in S. cerevisiae. Science, 309, 626–630.
7. Morse,R.H. (2007) Transcription factor access to promoter elements.J. Cell. Biochem., 102, 560–570.
8. Workman,J.L. (2006) Nucleosome displacement in transcription.Genes Dev., 20, 2009–2017.
9. Hogan,G.J., Lee,C.K. and Lieb,J.D. (2006) Cell cycle-specifiedfluctuation of nucleosome occupancy at gene promoters. PLoSGenet., 2, e158.
10. Lee,C.K., Shibata,Y., Rao,B., Strahl,B.D. and Lieb,J.D. (2004)Evidence for nucleosome depletion at active regulatory regionsgenome-wide. Nat. Genet., 36, 900–905.
11. Shivaswamy,S., Bhinge,A., Zhao,Y., Jones,S., Hirst,M. and Iyer,V.R.(2008) Dynamic remodeling of individual nucleosomes across aeukaryotic genome in response to transcriptional perturbation. PLoSBiol., 6, e65.
12. Zhang,L., Ma,H. and Pugh,B.F. (2011) Stable and dynamicnucleosome states during a meiotic developmental process. GenomeRes., 21, 875–884.
13. Geng,F. and Laurent,B.C. (2004) Roles of SWI/SNF and HATsthroughout the dynamic transcription of a yeast glucose-repressiblegene. EMBO J., 23, 127–137.
14. Martens,J.A. and Winston,F. (2003) Recent advances inunderstanding chromatin remodeling by Swi/Snf complexes. Curr.Opin. Genet. Dev., 13, 136–142.
Downloaded from https://academic.oup.com/nar/article-abstract/42/9/5468/1246885by gueston 21 February 2018
Nucleic Acids Research, 2014, Vol. 42, No. 9 5481
15. Mellor,J. and Morillon,A. (2004) ISWI complexes in Saccharomycescerevisiae. Biochim. Biophys. Acta, 1677, 100–112.
16. Saha,A., Wittmeyer,J. and Cairns,B.R. (2006) Chromatinremodelling: the industrial revolution of DNA around histones. Nat.Rev. Mol. Cell Biol., 7, 437–447.
17. Sudarsanam,P. and Winston,F. (2000) The Swi/Snf familynucleosome-remodeling complexes and transcriptional control.Trends Genet., 16, 345–351.
18. Whitehouse,I. and Tsukiyama,T. (2006) Antagonistic forces thatposition nucleosomes in vivo. Nat. Struct. Mol. Biol., 13, 633–640.
19. Lorch,Y., Griesenbeck,J., Boeger,H., Maier-Davis,B. andKornberg,R.D. (2011) Selective removal of promoter nucleosomes bythe RSC chromatin-remodeling complex. Nat. Struct. Mol. Biol., 18,881–885.
20. Causton,H.C., Ren,B., Koh,S.S., Harbison,C.T., Kanin,E.,Jennings,E.G., Lee,T.I., True,H.L., Lander,E.S. and Young,R.A.(2001) Remodeling of yeast genome expression in response toenvironmental changes. Mol. Biol. Cell, 12, 323–337.
21. Gasch,A.P., Spellman,P.T., Kao,C.M., Carmel-Harel,O., Eisen,M.B.,Storz,G., Botstein,D. and Brown,P.O. (2000) Genomic expressionprograms in the response of yeast cells to environmental changes.Mol. Biol. Cell, 11, 4241–4257.
22. Berry,D.B. and Gasch,A.P. (2008) Stress-activated genomicexpression changes serve a preparative role for impending stress inyeast. Mol. Biol. Cell, 19, 4580–4587.
23. Berry,D.B., Guan,Q., Hose,J., Haroon,S., Gebbia,M., Heisler,L.E.,Nislow,C., Giaever,G. and Gasch,A.P. (2011) Multiple means to thesame end: the genetic basis of acquired stress resistance in yeast.PLoS Genet., 7, e1002353.
24. Giaever,G., Chu,A.M., Ni,L., Connelly,C., Riles,L., Veronneau,S.,Dow,S., Lucau-Danila,A., Anderson,K., Andre,B. et al. (2002)Functional profiling of the Saccharomyces cerevisiae genome. Nature,418, 387–391.
25. Klosinska,M.M., Crutchfield,C.A., Bradley,P.H., Rabinowitz,J.D.and Broach,J.R. (2011) Yeast cells can access distinct quiescent states.Genes Dev., 25, 336–349.
26. Martinez-Pastor,M.T., Marchler,G., Schuller,C., Marchler-Bauer,A.,Ruis,H. and Estruch,F. (1996) The Saccharomyces cerevisiae zincfinger proteins Msn2p and Msn4p are required for transcriptionalinduction through the stress response element (STRE). EMBO J., 15,2227–2235.
27. De Wever,V., Reiter,W., Ballarini,A., Ammerer,G. and Brocard,C.(2005) A dual role for PP1 in shaping the Msn2-dependenttranscriptional response to glucose starvation. EMBO J., 24,4115–4123.
28. Gorner,W., Durchschlag,E., Martinez-Pastor,M.T., Estruch,F.,Ammerer,G., Hamilton,B., Ruis,H. and Schuller,C. (1998) Nuclearlocalization of the C2H2 zinc finger protein Msn2p is regulated bystress and protein kinase A activity. Genes Dev., 12, 586–597.
29. Gorner,W., Durchschlag,E., Wolf,J., Brown,E.L., Ammerer,G.,Ruis,H. and Schuller,C. (2002) Acute glucose starvation activates thenuclear localization signal of a stress-specific yeast transcriptionfactor. EMBO J., 21, 135–144.
30. Santhanam,A., Hartley,A., Duvel,K., Broach,J.R. and Garrett,S.(2004) PP2A phosphatase activity is required for stress and Torkinase regulation of yeast stress response factor Msn2p. Eukaryot.Cell, 3, 1261–1271.
31. Garmendia-Torres,C., Goldbeter,A. and Jacquet,M. (2007)Nucleocytoplasmic oscillations of the yeast transcription factorMsn2: evidence for periodic PKA activation. Curr. Biol., 17,1044–1049.
32. Gonze,D., Jacquet,M. and Goldbeter,A. (2008) Stochastic modellingof nucleocytoplasmic oscillations of the transcription factor Msn2 inyeast. J. R. Soc. Interface, 5(Suppl. 1), S95–S109.
33. Hao,N., Budnik,B.A., Gunawardena,J. and O’Shea,E.K. (2013)Tunable signal processing through modular control of transcriptionfactor translocation. Science, 339, 460–464.
34. Hao,N. and O’Shea,E.K. (2012) Signal-dependent dynamics oftranscription factor translocation controls gene expression. Nat.Struct. Mol. Biol., 19, 31–39.
35. Petrenko,N., Chereji,R.V., McClean,M.N., Morozov,A.V. andBroach,J.R. (2013) Noise and interlocking signaling pathwayspromote distinct transcription factor dynamics in response todifferent stresses. Mol. Biol. Cell, 24, 2045–2057.
36. Hansen,A.S. and O’Shea,E.K. (2013) Promoter decoding oftranscription factor dynamics involves a trade-off between noise andcontrol of gene expression. Mol. Syst. Biol., 9, 704.
37. Marchler,G., Schuller,C., Adam,G. and Ruis,H. (1993) ASaccharomyces cerevisiae UAS element controlled by protein kinaseA activates transcription in response to a variety of stress conditions.EMBO J., 12, 1997–2003.
38. Liu,Y., Ye,S. and Erkine,A.M. (2009) Analysis of Saccharomycescerevisiae genome for the distributions of stress-response elementspotentially affecting gene expression by transcriptional interference.In Silico Biol., 9, 379–389.
39. Ghaemmaghami,S., Huh,W.K., Bower,K., Howson,R.W., Belle,A.,Dephoure,N., O’Shea,E.K. and Weissman,J.S. (2003) Global analysisof protein expression in yeast. Nature, 425, 737–741.
40. Venters,B.J., Wachi,S., Mavrich,T.N., Andersen,B.E., Jena,P.,Sinnamon,A.J., Jain,P., Rolleri,N.S., Jiang,C., Hemeryck-Walsh,C.et al. (2011) A comprehensive genomic binding map of gene andchromatin regulatory proteins in Saccharomyces. Mol. Cell, 41,480–492.
41. Huebert,D.J., Kuan,P.F., Keles,S. and Gasch,A.P. (2012) Dynamicchanges in nucleosome occupancy are not predictive of geneexpression dynamics but are linked to transcription and chromatinregulators. Mol. Cell. Biol., 32, 1645–1653.
42. Amberg,D.C., Burke,D.J. and Strathern,J.N. (2005) Methods in YeastGenetics: A Cold Spring Harbor Laboratory Course Manual, 2005Edition. Cold Spring Harbor Laboratory Press, Cold Spring Harbor,NY.
43. Sabourin,M., Tuzon,C.T., Fisher,T.S. and Zakian,V.A. (2007) Aflexible protein linker improves the function of epitope-taggedproteins in Saccharomyces cerevisiae. Yeast, 24, 39–45.
44. Winston,F., Dollard,C. and Ricupero-Hovasse,S.L. (1995)Construction of a set of convenient Saccharomyces cerevisiae strainsthat are isogenic to S288C. Yeast, 11, 53–55.
45. McIsaac,R.S., Oakes,B.L., Wang,X., Dummit,K.A., Botstein,D. andNoyes,M.B. (2013) Synthetic gene expression perturbation systemswith rapid, tunable, single-gene specificity in yeast. Nucleic AcidsRes., 41, e57.
46. Zaman,S., Lippman,S.I., Schneper,L., Slonim,N. and Broach,J.R.(2009) Glucose regulates transcription in yeast through a network ofsignaling pathways. Mol. Syst. Biol., 5, 245.
47. Fisher,T.S., Taggart,A.K. and Zakian,V.A. (2004) Cellcycle-dependent regulation of yeast telomerase by Ku. Nat. Struct.Mol. Biol., 11, 1198–1205.
48. Teytelman,L., Thurtle,D.M., Rine,J. and van Oudenaarden,A. (2013)Highly expressed loci are vulnerable to misleading ChIP localizationof multiple unrelated proteins.110,18602–18607.
49. Badis,G., Chan,E.T., van Bakel,H., Pena-Castillo,L., Tillo,D.,Tsui,K., Carlson,C.D., Gossett,A.J., Hasinoff,M.J., Warren,C.L.et al. (2008) A library of yeast transcription factor motifs reveals awidespread function for Rsc3 in targeting nucleosome exclusion atpromoters. Mol. Cell, 32, 878–887.
50. Fordyce,P.M., Gerber,D., Tran,D., Zheng,J., Li,H., DeRisi,J.L. andQuake,S.R. (2010) De novo identification and biophysicalcharacterization of transcription-factor binding sites withmicrofluidic affinity analysis. Nat. Biotechnol., 28, 970–975.
51. Zhu,C., Byers,K.J., McCord,R.P., Shi,Z., Berger,M.F.,Newburger,D.E., Saulrieta,K., Smith,Z., Shah,M.V.,Radhakrishnan,M. et al. (2009) High-resolution DNA-bindingspecificity analysis of yeast transcription factors. Genome Res., 19,556–566.
52. Chenais,B., Caruso,A., Hiard,S. and Casse,N. (2012) The impact oftransposable elements on eukaryotic genomes: from genome sizeincrease to genetic adaptation to stressful environments. Gene, 509,7–15.
53. Servant,G., Pinson,B., Tchalikian-Cosson,A., Coulpier,F.,Lemoine,S., Pennetier,C., Bridier-Nahmias,A., Todeschini,A.L.,Fayol,H., Daignan-Fornier,B. et al. (2012) Tye7 regulates yeast Ty1retrotransposon sense and antisense transcription in response toadenylic nucleotides stress. Nucleic Acids Res., 40, 5271–5282.
54. Azvolinsky,A., Giresi,P.G., Lieb,J.D. and Zakian,V.A. (2009) Highlytranscribed RNA polymerase II genes are impediments to replicationfork progression in Saccharomyces cerevisiae. Mol. Cell, 34, 722–734.
55. Shor,E., Warren,C.L., Tietjen,J., Hou,Z., Muller,U., Alborelli,I.,Gohard,F.H., Yemm,A.I., Borisov,L., Broach,J.R. et al. (2009) The
Downloaded from https://academic.oup.com/nar/article-abstract/42/9/5468/1246885by gueston 21 February 2018

5482 Nucleic Acids Research, 2014, Vol. 42, No. 9
origin recognition complex interacts with a subset of metabolic genestightly linked to origins of replication. PLoS Genet., 5, e1000755.
56. Temple,M.D., Perrone,G.G. and Dawes,I.W. (2005) Complex cellularresponses to reactive oxygen species. Trends Cell Biol., 15, 319–326.
57. Toone,W.M. and Jones,N. (1999) AP-1 transcription factors in yeast.Curr. Opin. Genet. Dev., 9, 55–61.
58. Broach,J.R. (2012) Nutritional control of growth and development inyeast. Genetics, 192, 73–105.
59. Zaman,S., Lippman,S.I., Zhao,X. and Broach,J.R. (2008) HowSaccharomyces responds to nutrients. Annu. Rev. Genet., 42, 27–81.
60. Moyle-Heyrman,G., Tims,H.S. and Widom,J. (2011) Structuralconstraints in collaborative competition of transcription factorsagainst the nucleosome. J. Mol. Biol., 412, 634–646.
61. Tims,H.S., Gurunathan,K., Levitus,M. and Widom,J. (2011)Dynamics of nucleosome invasion by DNA binding proteins. J. Mol.Biol., 411, 430–448.
62. Floer,M., Wang,X., Prabhu,V., Berrozpe,G., Narayan,S., Spagna,D.,Alvarez,D., Kendall,J., Krasnitz,A., Stepansky,A. et al. (2010) A
RSC/nucleosome complex determines chromatin architecture andfacilitates activator binding. Cell, 141, 407–418.
63. Schmitt,A.P. and McEntee,K. (1996) Msn2p, a zinc fingerDNA-binding protein, is the transcriptional activator of themultistress response in Saccharomyces cerevisiae. Proc. Natl. Acad.Sci. U.S.A., 93, 5777–5782.
64. Airoldi,E.M., Huttenhower,C., Gresham,D., Lu,C., Caudy,A.A.,Dunham,M.J., Broach,J.R., Botstein,D. and Troyanskaya,O.G. (2009)Predicting cellular growth from gene expression signatures. PLoSComput. Biol., 5, e1000257.
65. Brauer,M.J., Huttenhower,C., Airoldi,E.M., Rosenstein,R.,Matese,J.C., Gresham,D., Boer,V.M., Troyanskaya,O.G. andBotstein,D. (2008) Coordination of growth rate, cell cycle, stressresponse, and metabolic activity in yeast. Mol. Biol. Cell, 19, 352–367.
66. Miles,S., Li,L., Davison,J. and Breeden,L.L. (2013) Xbp1 directsglobal repression of budding yeast transcription during the transitionto quiescence and is important for the longevity and reversibility ofthe quiescent state. PLoS Genet, 9, e1003854.
Downloaded from https://academic.oup.com/nar/article-abstract/42/9/5468/1246885by gueston 21 February 2018


![[2] Reconstitution of Nucleosome Core Particles from Recombinant](https://img.dokumen.tips/doc/110x75/585a00ef1a28ab6e3290e795/2-reconstitution-of-nucleosome-core-particles-from-recombinant-.jpg)