Embed Size (px)
Citation preview
1
University of Oregon Investment Group
May 27, 2015 Technology
Original Investment Thesis Nielsen Holdings has long been the industry standard for media
measurement, utilizing polling methods that are now outdated. Since its inception in 2009, Rentrak’s TV Essentials uses a census like data collection that allows advertising agencies and networks to better target their viewers.
This year Rentrak signed a 7 year contract with CBS and its subsidiaries. This was the first major network to use Rentrak’s alternative approach to gain insight on customer viewership and attributes. By using both Rentrak and Nielsen, CBS is paving the road for other networks to use Rentrak as a complimentary source for TV measurement.
In the first 3Q alone, Rentrak has already surpassed the amount of political advertising revenue than they received this year compared to last. With Supreme Court ruling against setting a cap on political spending, money for political advertisements should increase dramatically. Firms like Rentrak will see a large jump in clients as political advertising firms seek the best locations, demographics, and time frames for their advertisements.
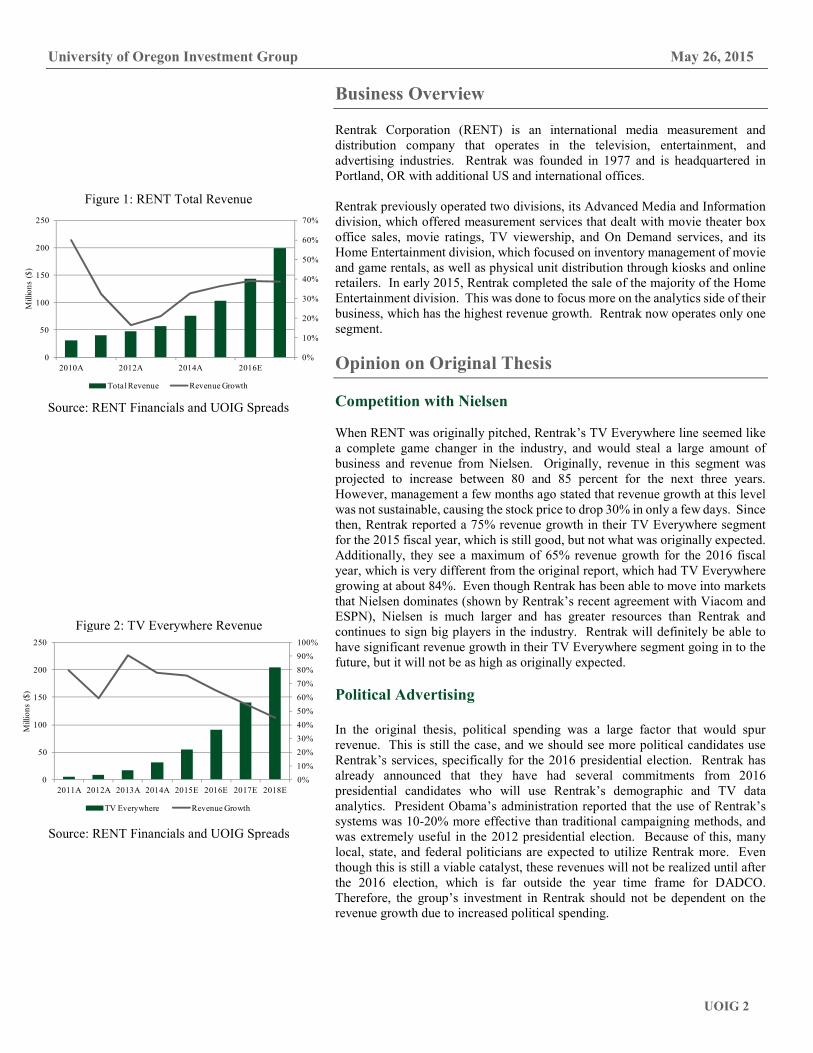
Rentrak Corporation Ticker: RENT Current Price: $67.16
Recommendation: Underperform Original Price Target: $65.41
One-Year Stock Chart
0
500000
1000000
1500000
2000000
2500000
3000000
3500000
$0.00
$10.00
$20.00
$30.00
$40.00
$50.00
$60.00
$70.00
$80.00
$90.00
May-14 Jul-14 Sep-14 Nov-14 Jan-15 Mar-15 May-15Volume Adjusted Close 50-Day Avg 200-Day AvgCovering Analyst: Charles Pontrelli
Key Statistics52 Week Price Range50-Day Moving AverageEstimated BetaDividend YieldMarket Capitalization (mm)3-Year Revenue CAGRTrading StatisticsDiluted Shares Outstanding (mm) 15.20Average Volume (3-Month) 288,159Institutional Ownership 51.10%Insider Ownership 25.00%EV/RevenueMargins and RatiosGross Margin (2016E) 72.95%EBITDA Margin (2016E) 4.68%Net Margin (2016E) -1.51%Debt to Enterprise Value 0
6.55x
$43.62 - $87.40$54.14
1.37NA
$1,021.17-6.02%
Revised Price Target: $71.84
University of Oregon Investment Group May 26, 2015
UOIG 2
Business Overview Rentrak Corporation (RENT) is an international media measurement and distribution company that operates in the television, entertainment, and advertising industries. Rentrak was founded in 1977 and is headquartered in Portland, OR with additional US and international offices. Rentrak previously operated two divisions, its Advanced Media and Information division, which offered measurement services that dealt with movie theater box office sales, movie ratings, TV viewership, and On Demand services, and its Home Entertainment division, which focused on inventory management of movie and game rentals, as well as physical unit distribution through kiosks and online retailers. In early 2015, Rentrak completed the sale of the majority of the Home Entertainment division. This was done to focus more on the analytics side of their business, which has the highest revenue growth. Rentrak now operates only one segment. Opinion on Original Thesis Competition with Nielsen When RENT was originally pitched, Rentrak’s TV Everywhere line seemed like a complete game changer in the industry, and would steal a large amount of business and revenue from Nielsen. Originally, revenue in this segment was projected to increase between 80 and 85 percent for the next three years. However, management a few months ago stated that revenue growth at this level was not sustainable, causing the stock price to drop 30% in only a few days. Since then, Rentrak reported a 75% revenue growth in their TV Everywhere segment for the 2015 fiscal year, which is still good, but not what was originally expected. Additionally, they see a maximum of 65% revenue growth for the 2016 fiscal year, which is very different from the original report, which had TV Everywhere growing at about 84%. Even though Rentrak has been able to move into markets that Nielsen dominates (shown by Rentrak’s recent agreement with Viacom and ESPN), Nielsen is much larger and has greater resources than Rentrak and continues to sign big players in the industry. Rentrak will definitely be able to have significant revenue growth in their TV Everywhere segment going in to the future, but it will not be as high as originally expected. Political Advertising In the original thesis, political spending was a large factor that would spur revenue. This is still the case, and we should see more political candidates use Rentrak’s services, specifically for the 2016 presidential election. Rentrak has already announced that they have had several commitments from 2016 presidential candidates who will use Rentrak’s demographic and TV data analytics. President Obama’s administration reported that the use of Rentrak’s systems was 10-20% more effective than traditional campaigning methods, and was extremely useful in the 2012 presidential election. Because of this, many local, state, and federal politicians are expected to utilize Rentrak more. Even though this is still a viable catalyst, these revenues will not be realized until after the 2016 election, which is far outside the year time frame for DADCO. Therefore, the group’s investment in Rentrak should not be dependent on the revenue growth due to increased political spending.
0%10%20%30%40%50%60%70%
0
50
100
150
200
250
2010A 2012A 2014A 2016E
Millio
ns ($)
Total Revenue Revenue Growth
0%10%20%30%40%50%60%70%80%90%100%
0
50
100
150
200
250
2011A 2012A 2013A 2014A 2015E 2016E 2017E 2018E
Millio
ns ($)
TV Everywhere Revenue Growth
Figure 1: RENT Total Revenue
Source: RENT Financials and UOIG Spreads
Figure 2: TV Everywhere Revenue
Source: RENT Financials and UOIG Spreads

University of Oregon Investment Group May 26, 2015
UOIG 3
Revised Investment Thesis All of the original investment theses remain intact, just not at the level that was expected originally. Additionally, some of the revenue drivers do not correspond with the investment strategies for some of the portfolios. This high revenue growth was what made Rentrak attractive in the first place. While it did realize considerable revenue growth in the areas that were expected to have this growth, this performance was significantly below what was expected, and it is projected that this same growth will not be sustainable. This is shown by management changing their revenue guidance for their TV Everywhere segment from around 80% in the coming years to 65%. Another aspect to Rentrak’s stock is how investors react to news regarding the stock. The stock price dropped 30% in one day because of management announcing that current revenue streams are not sustainable, but increased almost 25% in one day when Rentrak announced earnings. This stock is extremely sensitive to news regarding its revenue, and, while this can work for the benefit of the group, is a huge liability. Even though Rentrak has room for growth, any growth lower than the already lowered guidance would cause a huge impact on the stock price. Additionally, the large revenue growths that the group is looking for will not be realized until after the year is over.
Catalysts Upside
Continued transition of major networks to shift from traditional data collection methods to larger census level analysis will grow Rentrak’s customer base.
The removal of the political spending cap will provide a great amount of opportunity for Rentrak in the 2016 presidential election.
Downside
Potential slowing of revenue streams will affect Rentrak’s stock performance significantly.
Larger, more established companies are beginning to move towards Rentrak’s type of data sampling and collection.
Revised Valuation For the revised valuation, the majority of the price change came from changes in revenue growth and management guidance on operating expenses, as well as recent trends in operating expenses. Additionally, the DCF was updated to reflect new fiscal results, and all of the valuation was shifted to the DCF, due to the significant changes to the previous comparables and to Rentrak. One of the main comparables went private, one of the other comparables has had a significant change in market capitalization, and the other major comparables are just too large to be considered appropriate. TiVo was added since it is one of Rentrak’s main competitors and helps reflect the space that Rentrak operates in. Still, the relative valuation based off these companies does not properly reflect that valuation of Rentrak due to its unique positioning in the market and its singular business operations.
Figure 3: Five-Month Stock Chart
Source: Yahoo Finance
Beta SE Weighting1 Year Daily 1.12 0.31 5.00%3 Year Daily 1.32 0.15 55.00%5 Year Daily 1.47 0.09 40.00%3 Year Weekly 0.41 0.38 0.00%5 Year Weekly 1.44 0.21 0.00%Rentrak Corporation Beta 1.37
Figure 4: RENT Beta Estimate
Source: UOIG Spreads
0
50,000,000
100,000,000
150,000,000
200,000,000
250,000,000
300,000,000
350,000,000
400,000,000
$40.00$45.00$50.00$55.00$60.00$65.00$70.00$75.00$80.00$85.00
Jan-15 Jan-15 Jan-15 Feb-15 Feb-15 Mar-15 Mar-15 Apr-15 Apr-15 May-15 May-15Volume Adjusted Close 50-Day Avg 200-Day Avg

University of Oregon Investment Group May 26, 2015
UOIG 4
Finally, the revised valuation took into account historical trends of Rentrak’s current business operations, which excludes the portion that was sold off in the beginning of 2015. Rentrak recently reported financial data provided more color on how its current operations operated in the past. This was useful in adjusting some of the previous assumptions in the DCF and projecting into the future. It should be noted, however, that Rentrak is extremely sensitive to any changes in the level of its COGS and operating expenses. While it is believed that these new assumptions are more accurate than when the company was previously pitched due to the large amount of new informational available, it should be taken into account that any significant changes can be material to Rentrak’s operations, and ultimately its stock price. Recommendation
From the revised valuation a slightly higher price target was found. However, with the recent increase in price it is a much lower undervaluation. The combination of lower revenue growth, catalysts being outside of the time frame for the DADCO portfolio, and extremely sensitive investors, the undervaluation is not high enough to justify the risks associated with holding Rentrak. Therefore, a sell is recommended for the DADCO portfolio.
Source Implied Price WeightingDCF Analysis $71.84 100%Comparable Analysis 41.49 0%Weighted Implied Price $71.84Current Price $67.16Undervalued 6.96%
Figure 5: RENT Beta Estimate
Source: UOIG Spreads
University of Oregon Investment Group May 26, 2015
UOIG 5
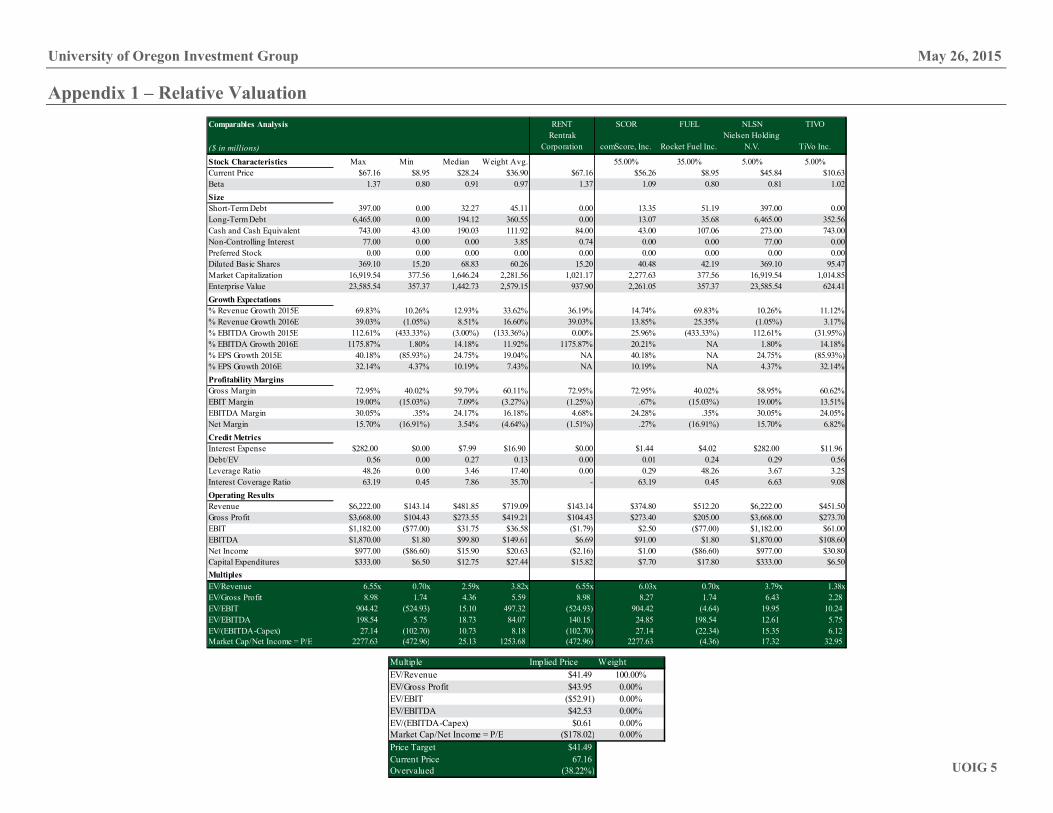
Appendix 1 – Relative Valuation Comparables Analysis RENT SCOR FUEL NLSN TIVO
($ in millions)Rentrak
Corporation comScore, Inc. Rocket Fuel Inc.Nielsen Holding
N.V. TiVo Inc.Stock Characteristics Max Min Median Weight Avg. 55.00% 35.00% 5.00% 5.00%Current Price $67.16 $8.95 $28.24 $36.90 $67.16 $56.26 $8.95 $45.84 $10.63Beta 1.37 0.80 0.91 0.97 1.37 1.09 0.80 0.81 1.02SizeShort-Term Debt 397.00 0.00 32.27 45.11 0.00 13.35 51.19 397.00 0.00Long-Term Debt 6,465.00 0.00 194.12 360.55 0.00 13.07 35.68 6,465.00 352.56Cash and Cash Equivalent 743.00 43.00 190.03 111.92 84.00 43.00 107.06 273.00 743.00Non-Controlling Interest 77.00 0.00 0.00 3.85 0.74 0.00 0.00 77.00 0.00Preferred Stock 0.00 0.00 0.00 0.00 0.00 0.00 0.00 0.00 0.00Diluted Basic Shares 369.10 15.20 68.83 60.26 15.20 40.48 42.19 369.10 95.47Market Capitalization 16,919.54 377.56 1,646.24 2,281.56 1,021.17 2,277.63 377.56 16,919.54 1,014.85Enterprise Value 23,585.54 357.37 1,442.73 2,579.15 937.90 2,261.05 357.37 23,585.54 624.41Growth Expectations % Revenue Growth 2015E 69.83% 10.26% 12.93% 33.62% 36.19% 14.74% 69.83% 10.26% 11.12%% Revenue Growth 2016E 39.03% (1.05%) 8.51% 16.60% 39.03% 13.85% 25.35% (1.05%) 3.17%% EBITDA Growth 2015E 112.61% (433.33%) (3.00%) (133.36%) 0.00% 25.96% (433.33%) 112.61% (31.95%)% EBITDA Growth 2016E 1175.87% 1.80% 14.18% 11.92% 1175.87% 20.21% NA 1.80% 14.18%% EPS Growth 2015E 40.18% (85.93%) 24.75% 19.04% NA 40.18% NA 24.75% (85.93%)% EPS Growth 2016E 32.14% 4.37% 10.19% 7.43% NA 10.19% NA 4.37% 32.14%Profitability MarginsGross Margin 72.95% 40.02% 59.79% 60.11% 72.95% 72.95% 40.02% 58.95% 60.62%EBIT Margin 19.00% (15.03%) 7.09% (3.27%) (1.25%) .67% (15.03%) 19.00% 13.51%EBITDA Margin 30.05% .35% 24.17% 16.18% 4.68% 24.28% .35% 30.05% 24.05%Net Margin 15.70% (16.91%) 3.54% (4.64%) (1.51%) .27% (16.91%) 15.70% 6.82%Credit MetricsInterest Expense $282.00 $0.00 $7.99 $16.90 $0.00 $1.44 $4.02 $282.00 $11.96Debt/EV 0.56 0.00 0.27 0.13 0.00 0.01 0.24 0.29 0.56Leverage Ratio 48.26 0.00 3.46 17.40 0.00 0.29 48.26 3.67 3.25Interest Coverage Ratio 63.19 0.45 7.86 35.70 - 63.19 0.45 6.63 9.08Operating ResultsRevenue $6,222.00 $143.14 $481.85 $719.09 $143.14 $374.80 $512.20 $6,222.00 $451.50Gross Profit $3,668.00 $104.43 $273.55 $419.21 $104.43 $273.40 $205.00 $3,668.00 $273.70EBIT $1,182.00 ($77.00) $31.75 $36.58 ($1.79) $2.50 ($77.00) $1,182.00 $61.00EBITDA $1,870.00 $1.80 $99.80 $149.61 $6.69 $91.00 $1.80 $1,870.00 $108.60Net Income $977.00 ($86.60) $15.90 $20.63 ($2.16) $1.00 ($86.60) $977.00 $30.80Capital Expenditures $333.00 $6.50 $12.75 $27.44 $15.82 $7.70 $17.80 $333.00 $6.50MultiplesEV/Revenue 6.55x 0.70x 2.59x 3.82x 6.55x 6.03x 0.70x 3.79x 1.38xEV/Gross Profit 8.98 1.74 4.36 5.59 8.98 8.27 1.74 6.43 2.28EV/EBIT 904.42 (524.93) 15.10 497.32 (524.93) 904.42 (4.64) 19.95 10.24EV/EBITDA 198.54 5.75 18.73 84.07 140.15 24.85 198.54 12.61 5.75EV/(EBITDA-Capex) 27.14 (102.70) 10.73 8.18 (102.70) 27.14 (22.34) 15.35 6.12Market Cap/Net Income = P/E 2277.63 (472.96) 25.13 1253.68 (472.96) 2277.63 (4.36) 17.32 32.95
Multiple Implied Price WeightEV/Revenue $41.49 100.00%EV/Gross Profit $43.95 0.00%EV/EBIT ($52.91) 0.00%EV/EBITDA $42.53 0.00%EV/(EBITDA-Capex) $0.61 0.00%Market Cap/Net Income = P/E ($178.02) 0.00%Price Target $41.49Current Price 67.16Overvalued (38.22%)
University of Oregon Investment Group May 26, 2015
UOIG 6
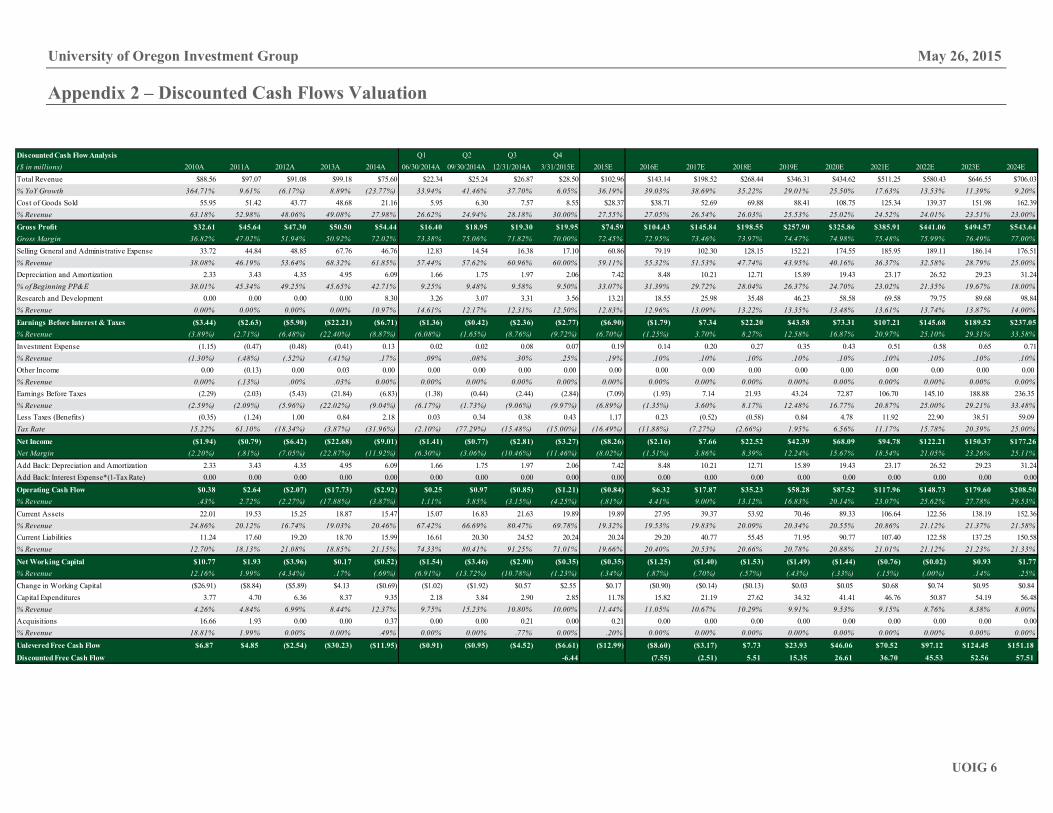
Appendix 2 – Discounted Cash Flows Valuation
Discounted Cash Flow Analysis Q1 Q2 Q3 Q4
($ in millions) 2010A 2011A 2012A 2013A 2014A 06/30/2014A 09/30/2014A 12/31/2014A 3/31/2015E 2015E 2016E 2017E 2018E 2019E 2020E 2021E 2022E 2023E 2024ETotal Revenue $88.56 $97.07 $91.08 $99.18 $75.60 $22.34 $25.24 $26.87 $28.50 $102.96 $143.14 $198.52 $268.44 $346.31 $434.62 $511.25 $580.43 $646.55 $706.03% YoY Growth 364.71% 9.61% (6.17%) 8.89% (23.77%) 33.94% 41.46% 37.70% 6.05% 36.19% 39.03% 38.69% 35.22% 29.01% 25.50% 17.63% 13.53% 11.39% 9.20%Cost of Goods Sold 55.95 51.42 43.77 48.68 21.16 5.95 6.30 7.57 8.55 $28.37 $38.71 52.69 69.88 88.41 108.75 125.34 139.37 151.98 162.39% Revenue 63.18% 52.98% 48.06% 49.08% 27.98% 26.62% 24.94% 28.18% 30.00% 27.55% 27.05% 26.54% 26.03% 25.53% 25.02% 24.52% 24.01% 23.51% 23.00%Gross Profit $32.61 $45.64 $47.30 $50.50 $54.44 $16.40 $18.95 $19.30 $19.95 $74.59 $104.43 $145.84 $198.55 $257.90 $325.86 $385.91 $441.06 $494.57 $543.64Gross Margin 36.82% 47.02% 51.94% 50.92% 72.02% 73.38% 75.06% 71.82% 70.00% 72.45% 72.95% 73.46% 73.97% 74.47% 74.98% 75.48% 75.99% 76.49% 77.00%Selling General and Administrative Expense 33.72 44.84 48.85 67.76 46.76 12.83 14.54 16.38 17.10 60.86 79.19 102.30 128.15 152.21 174.55 185.95 189.11 186.14 176.51% Revenue 38.08% 46.19% 53.64% 68.32% 61.85% 57.44% 57.62% 60.96% 60.00% 59.11% 55.32% 51.53% 47.74% 43.95% 40.16% 36.37% 32.58% 28.79% 25.00%Depreciation and Amortization 2.33 3.43 4.35 4.95 6.09 1.66 1.75 1.97 2.06 7.42 8.48 10.21 12.71 15.89 19.43 23.17 26.52 29.23 31.24% of Beginning PP&E 38.01% 45.34% 49.25% 45.65% 42.71% 9.25% 9.48% 9.58% 9.50% 33.07% 31.39% 29.72% 28.04% 26.37% 24.70% 23.02% 21.35% 19.67% 18.00%Research and Development 0.00 0.00 0.00 0.00 8.30 3.26 3.07 3.31 3.56 13.21 18.55 25.98 35.48 46.23 58.58 69.58 79.75 89.68 98.84% Revenue 0.00% 0.00% 0.00% 0.00% 10.97% 14.61% 12.17% 12.31% 12.50% 12.83% 12.96% 13.09% 13.22% 13.35% 13.48% 13.61% 13.74% 13.87% 14.00%Earnings Before Interest & Taxes ($3.44) ($2.63) ($5.90) ($22.21) ($6.71) ($1.36) ($0.42) ($2.36) ($2.77) ($6.90) ($1.79) $7.34 $22.20 $43.58 $73.31 $107.21 $145.68 $189.52 $237.05% Revenue (3.89%) (2.71%) (6.48%) (22.40%) (8.87%) (6.08%) (1.65%) (8.76%) (9.72%) (6.70%) (1.25%) 3.70% 8.27% 12.58% 16.87% 20.97% 25.10% 29.31% 33.58%Investment Expense (1.15) (0.47) (0.48) (0.41) 0.13 0.02 0.02 0.08 0.07 0.19 0.14 0.20 0.27 0.35 0.43 0.51 0.58 0.65 0.71% Revenue (1.30%) (.48%) (.52%) (.41%) .17% .09% .08% .30% .25% .19% .10% .10% .10% .10% .10% .10% .10% .10% .10%Other Income 0.00 (0.13) 0.00 0.03 0.00 0.00 0.00 0.00 0.00 0.00 0.00 0.00 0.00 0.00 0.00 0.00 0.00 0.00 0.00% Revenue 0.00% (.13%) .00% .03% 0.00% 0.00% 0.00% 0.00% 0.00% 0.00% 0.00% 0.00% 0.00% 0.00% 0.00% 0.00% 0.00% 0.00% 0.00%Earnings Before Taxes (2.29) (2.03) (5.43) (21.84) (6.83) (1.38) (0.44) (2.44) (2.84) (7.09) (1.93) 7.14 21.93 43.24 72.87 106.70 145.10 188.88 236.35% Revenue (2.59%) (2.09%) (5.96%) (22.02%) (9.04%) (6.17%) (1.73%) (9.06%) (9.97%) (6.89%) (1.35%) 3.60% 8.17% 12.48% 16.77% 20.87% 25.00% 29.21% 33.48%Less Taxes (Benefits) (0.35) (1.24) 1.00 0.84 2.18 0.03 0.34 0.38 0.43 1.17 0.23 (0.52) (0.58) 0.84 4.78 11.92 22.90 38.51 59.09Tax Rate 15.22% 61.10% (18.34%) (3.87%) (31.96%) (2.10%) (77.29%) (15.48%) (15.00%) (16.49%) (11.88%) (7.27%) (2.66%) 1.95% 6.56% 11.17% 15.78% 20.39% 25.00%Net Income ($1.94) ($0.79) ($6.42) ($22.68) ($9.01) ($1.41) ($0.77) ($2.81) ($3.27) ($8.26) ($2.16) $7.66 $22.52 $42.39 $68.09 $94.78 $122.21 $150.37 $177.26Net Margin (2.20%) (.81%) (7.05%) (22.87%) (11.92%) (6.30%) (3.06%) (10.46%) (11.46%) (8.02%) (1.51%) 3.86% 8.39% 12.24% 15.67% 18.54% 21.05% 23.26% 25.11%Add Back: Depreciation and Amortization 2.33 3.43 4.35 4.95 6.09 1.66 1.75 1.97 2.06 7.42 8.48 10.21 12.71 15.89 19.43 23.17 26.52 29.23 31.24Add Back: Interest Expense*(1-Tax Rate) 0.00 0.00 0.00 0.00 0.00 0.00 0.00 0.00 0.00 0.00 0.00 0.00 0.00 0.00 0.00 0.00 0.00 0.00 0.00Operating Cash Flow $0.38 $2.64 ($2.07) ($17.73) ($2.92) $0.25 $0.97 ($0.85) ($1.21) ($0.84) $6.32 $17.87 $35.23 $58.28 $87.52 $117.96 $148.73 $179.60 $208.50% Revenue .43% 2.72% (2.27%) (17.88%) (3.87%) 1.11% 3.85% (3.15%) (4.25%) (.81%) 4.41% 9.00% 13.12% 16.83% 20.14% 23.07% 25.62% 27.78% 29.53%Current Assets 22.01 19.53 15.25 18.87 15.47 15.07 16.83 21.63 19.89 19.89 27.95 39.37 53.92 70.46 89.33 106.64 122.56 138.19 152.36% Revenue 24.86% 20.12% 16.74% 19.03% 20.46% 67.42% 66.69% 80.47% 69.78% 19.32% 19.53% 19.83% 20.09% 20.34% 20.55% 20.86% 21.12% 21.37% 21.58%Current Liabilities 11.24 17.60 19.20 18.70 15.99 16.61 20.30 24.52 20.24 20.24 29.20 40.77 55.45 71.95 90.77 107.40 122.58 137.25 150.58% Revenue 12.70% 18.13% 21.08% 18.85% 21.15% 74.33% 80.41% 91.25% 71.01% 19.66% 20.40% 20.53% 20.66% 20.78% 20.88% 21.01% 21.12% 21.23% 21.33%Net Working Capital $10.77 $1.93 ($3.96) $0.17 ($0.52) ($1.54) ($3.46) ($2.90) ($0.35) ($0.35) ($1.25) ($1.40) ($1.53) ($1.49) ($1.44) ($0.76) ($0.02) $0.93 $1.77% Revenue 12.16% 1.99% (4.34%) .17% (.69%) (6.91%) (13.72%) (10.78%) (1.23%) (.34%) (.87%) (.70%) (.57%) (.43%) (.33%) (.15%) (.00%) .14% .25%Change in Working Capital ($26.91) ($8.84) ($5.89) $4.13 ($0.69) ($1.02) ($1.92) $0.57 $2.55 $0.17 ($0.90) ($0.14) ($0.13) $0.03 $0.05 $0.68 $0.74 $0.95 $0.84Capital Expenditures 3.77 4.70 6.36 8.37 9.35 2.18 3.84 2.90 2.85 11.78 15.82 21.19 27.62 34.32 41.41 46.76 50.87 54.19 56.48% Revenue 4.26% 4.84% 6.99% 8.44% 12.37% 9.75% 15.23% 10.80% 10.00% 11.44% 11.05% 10.67% 10.29% 9.91% 9.53% 9.15% 8.76% 8.38% 8.00%Acquisitions 16.66 1.93 0.00 0.00 0.37 0.00 0.00 0.21 0.00 0.21 0.00 0.00 0.00 0.00 0.00 0.00 0.00 0.00 0.00% Revenue 18.81% 1.99% 0.00% 0.00% .49% 0.00% 0.00% .77% 0.00% .20% 0.00% 0.00% 0.00% 0.00% 0.00% 0.00% 0.00% 0.00% 0.00%Unlevered Free Cash Flow $6.87 $4.85 ($2.54) ($30.23) ($11.95) ($0.91) ($0.95) ($4.52) ($6.61) ($12.99) ($8.60) ($3.17) $7.73 $23.93 $46.06 $70.52 $97.12 $124.45 $151.18Discounted Free Cash Flow -6.44 (7.55) (2.51) 5.51 15.35 26.61 36.70 45.53 52.56 57.51

University of Oregon Investment Group May 26, 2015
UOIG 7
Appendix 3 – Revenue and Operating Expenses Model
Revenue Model Q1 Q2 Q3 Q4($ in millions) 2010A 2011A 2012A 2013A 2014A 06/30/2014A 09/30/2014A 12/31/2014A 3/31/2015E 2015E 2016E 2017E 2018E 2019E 2020E 2021E 2022E 2023E 2024EMovies Everywhere 8.14 18.23 21.05 23.95 26.49 7.39 7.37 7.43 7.60 29.79 33.66 38.38 44.13 49.87 54.86 59.25 63.39 67.20 70.56% Growth 39.01% 123.98% 15.47% 13.78% 10.62% 29.77% 16.22% 10.11% 10.00% 12.45% 13.00% 14.00% 15.00% 13.00% 10.00% 8.00% 7.00% 6.00% 5.00%% of Total Revenue 9.19% 18.78% 23.11% 24.15% 35.04% 33.09% 29.21% 27.63% 26.67% 28.93% 23.52% 19.33% 16.44% 14.40% 12.62% 11.59% 10.92% 10.39% 9.99%OnDemand Everywhere 6.11 10.54 11.14 12.56 12.84 3.25 3.34 3.73 3.90 14.22 15.36 16.43 17.42 18.29 19.11 19.88 20.57 21.24 21.88% Growth 123.73% 72.65% 5.69% 12.75% 2.24% (2.05%) 5.83% 19.92% 21.00% 10.75% 8.00% 7.00% 6.00% 5.00% 4.50% 4.00% 3.50% 3.25% 3.00%% of Total Revenue 6.89% 10.86% 12.23% 12.66% 16.99% 14.54% 13.24% 13.89% 13.68% 13.81% 10.73% 8.28% 6.49% 5.28% 4.40% 3.89% 3.54% 3.29% 3.10%TV Everywhere 3.22 5.79 9.23 17.60 31.32 10.51 13.32 14.79 16.40 55.02 90.78 140.71 204.03 275.44 358.07 429.68 494.13 555.90 611.49% Growth 1191.16% 80.09% 59.41% 90.68% 77.93% 84.41% 84.62% 76.12% 64.00% 75.69% 65.00% 55.00% 45.00% 35.00% 30.00% 20.00% 15.00% 12.50% 10.00%% of Total Revenue 3.63% 5.97% 10.13% 17.75% 41.42% 47.02% 52.77% 55.04% 57.54% 53.44% 63.42% 70.88% 76.01% 79.53% 82.39% 84.04% 85.13% 85.98% 86.61%Other 13.02 5.80 5.63 2.92 4.95 1.20 1.21 0.93 0.60 3.93 3.34 3.01 2.86 2.71 2.58 2.45 2.33 2.21 2.10% Growth (16.63%) (55.45%) (2.93%) (48.13%) 69.52% (.91%) 7.10% (26.76%) .50% (20.63%) (15.00%) (10.00%) (5.00%) (5.00%) (5.00%) (5.00%) (5.00%) (5.00%) (5.00%)% of Total Revenue 14.70% 5.98% 6.18% 2.94% 6.55% 5.36% 4.78% 3.44% 2.11% 3.82% 2.33% 1.51% 1.06% .78% .59% .48% .40% .34% .30%Total Revenue Excluding PPT 30.48 40.36 47.05 57.03 75.6 22.34 25.24 26.87 28.5 102.96 143.14 198.52 268.44 346.31 434.62 511.25 580.43 646.55 706.03% Growth 59.93% 32.43% 16.58% 21.21% 32.56% 33.94% 41.46% 37.70% 6.05% 36.19% 39.03% 38.69% 35.22% 29.01% 25.50% 17.63% 13.53% 11.39% 9.20%PPT 58.08 56.71 44.03 42.15 0.00 0.00 0.00 0.00 0.00 0.00 0.00 0.00 0.00 0.00 0.00 0.00 0.00 0.00 0.00% Growth (12.93%) (100.00%) (22.36%) (4.27%) (100.00%) (100.00%) (100.00%) (100.00%) 0.00% 0.00% 0.00% 0.00% 0.00% 0.00% 0.00% 0.00% 0.00% 0.00% 0.00%% of Total Revenue 446.14% 977.67% 782.01% 1443.32% 0.00% 0.00% 0.00% 0.00% 0.00% 0.00% 0.00% 0.00% 0.00% 0.00% 0.00% 0.00% 0.00% 0.00% 0.00%Total Revenue Including PPT 88.56 97.07 91.08 99.18 75.60 22.34 25.24 26.87 28.5 102.96 143.14 198.52 268.44 346.31 434.62 511.25 580.43 646.55 706.03% Growth 364.71% 9.61% (6.17%) 8.89% (23.77%) 33.94% 41.46% 37.70% 6.05% 36.19% 39.03% 38.69% 35.22% 29.01% 25.50% 17.63% 13.53% 11.39% 9.20%
Historical COGS (Excluding D&A) Q1 Q2 Q3 Q4($ in millions) 2010A 2011A 2012A 2013A 2014A 06/30/2014A 09/30/2014A 12/31/2014A 3/31/2015E 2015E 2016E 2017E 2018E 2019E 2020E 2021E 2022E 2023E 2024ECost of Goods Sold Excluding PPT 4.56 7.85 10.42 16.40 21.16 5.95 6.30 7.57 8.55 28.37 38.71 52.69 69.88 88.41 108.75 125.34 139.37 151.98 162.39% Growth N/A 72.15% 32.87% 57.29% 29.03% N/A N/A N/A N/A 34.08% 36.48% 36.10% 32.64% 26.50% 23.01% 15.26% 11.19% 9.05% 6.85%% of Total Revenue Excluding PPT 14.95% 19.44% 22.16% 28.75% 27.98% 26.62% 24.94% 28.18% 30.00% 27.55% 27.05% 26.54% 26.03% 25.53% 25.02% 24.52% 24.01% 23.51% 23.00%Cost of Goods Sold Including PPT 55.95 51.42 43.77 48.68 21.16 5.95 6.30 7.57 8.55 28.37 38.71 52.69 69.88 88.41 108.75 125.34 139.37 151.98 162.39% Growth (10.59%) (8.09%) (14.87%) 11.21% (56.53%) 4.42% (.77%) 12.29% 23.75% 34.05% 36.48% 36.10% 32.64% 26.50% 23.01% 15.26% 11.19% 9.05% 6.85%% of Total Revenue Including PPT 63.18% 52.98% 48.06% 49.08% 27.99% 26.62% 24.94% 28.18% 30.00% 27.55% 27.05% 26.54% 26.03% 25.53% 25.02% 24.52% 24.01% 23.51% 23.00%
Historical SG&A Q1 Q2 Q3 Q4($ in millions) 2010A 2011A 2012A 2013A 2014A 06/30/2014A 09/30/2014A 12/31/2014A 3/31/2015E 2015E 2016E 2017E 2018E 2019E 2020E 2021E 2022E 2023E 2024ESG&A Excluding PPT 23.90 33.55 38.25 56.00 48.80 12.83 14.54 16.38 17.10 60.86 79.19 102.30 128.15 152.21 174.55 185.95 189.11 186.14 176.51% Growth N/A 40.39% 14.01% 46.42% (12.86%) N/A N/A N/A N/A 24.72% 30.11% 29.19% 25.27% 18.77% 14.68% 6.53% 1.70% (1.57%) (5.18%)% of Total Revenue Excluding PPT 78.40% 83.11% 81.29% 98.19% 64.55% 57.44% 57.62% 60.96% 60.00% 59.11% 55.32% 51.53% 47.74% 43.95% 40.16% 36.37% 32.58% 28.79% 25.00%SG&A Including PPT 33.72 44.84 48.85 67.76 48.80 7.39 7.37 7.43 7.60 29.79 33.37 36.70 39.64 42.41 44.96 47.21 49.33 51.30 53.36% Growth 24.23% 32.96% 8.96% 38.69% (27.98%) 29.77% 16.22% 10.11% 10.00% (38.95%) 12.00% 10.00% 8.00% 7.00% 6.00% 5.00% 4.50% 4.00% 4.00%% of Total Revenue Including PPT 38.08% 46.19% 53.64% 68.32% 64.55% 33.09% 29.21% 27.63% 26.67% 28.93% 23.31% 18.49% 14.77% 12.25% 10.34% 9.23% 8.50% 7.93% 7.56%
Historical R&D Q1 Q2 Q3 Q4($ in millions) 2010A 2011A 2012A 2013A 2014A 06/30/2014A 09/30/2014A 12/31/2014A 3/31/2015E 2015E 2016E 2017E 2018E 2019E 2020E 2021E 2022E 2023E 2024ER&D Exlcuding PPT 2.94 4.50 4.66 6.22 9.01 3.26 3.07 3.31 3.56 13.21 18.55 25.98 35.48 46.23 58.58 69.58 79.75 89.68 98.84% Growth N/A 53.15% 3.65% 33.31% 45.04% N/A N/A N/A N/A 46.52% 40.44% 40.08% 36.56% 30.28% 26.72% 18.77% 14.62% 12.45% 10.22%% of Total Revenue Excluding PPT 9.64% 11.14% 9.91% 10.90% 11.92% 14.61% 12.17% 12.31% 12.50% 12.83% 12.96% 13.09% 13.22% 13.35% 13.48% 13.61% 13.74% 13.87% 14.00%
University of Oregon Investment Group May 26, 2015
UOIG 8
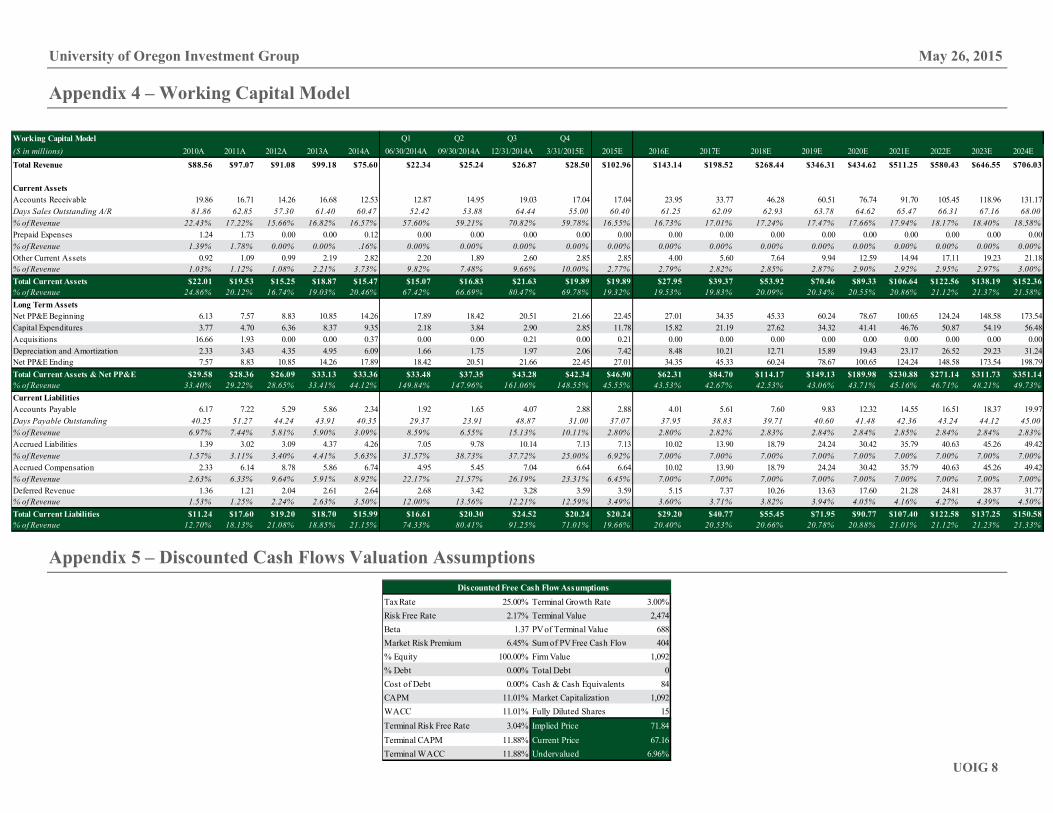
Appendix 4 – Working Capital Model
Appendix 5 – Discounted Cash Flows Valuation Assumptions
Working Capital Model Q1 Q2 Q3 Q4($ in millions) 2010A 2011A 2012A 2013A 2014A 06/30/2014A 09/30/2014A 12/31/2014A 3/31/2015E 2015E 2016E 2017E 2018E 2019E 2020E 2021E 2022E 2023E 2024ETotal Revenue $88.56 $97.07 $91.08 $99.18 $75.60 $22.34 $25.24 $26.87 $28.50 $102.96 $143.14 $198.52 $268.44 $346.31 $434.62 $511.25 $580.43 $646.55 $706.03Current AssetsAccounts Receivable 19.86 16.71 14.26 16.68 12.53 12.87 14.95 19.03 17.04 17.04 23.95 33.77 46.28 60.51 76.74 91.70 105.45 118.96 131.17Days Sales Outstanding A/R 81.86 62.85 57.30 61.40 60.47 52.42 53.88 64.44 55.00 60.40 61.25 62.09 62.93 63.78 64.62 65.47 66.31 67.16 68.00% of Revenue 22.43% 17.22% 15.66% 16.82% 16.57% 57.60% 59.21% 70.82% 59.78% 16.55% 16.73% 17.01% 17.24% 17.47% 17.66% 17.94% 18.17% 18.40% 18.58%Prepaid Expenses 1.24 1.73 0.00 0.00 0.12 0.00 0.00 0.00 0.00 0.00 0.00 0.00 0.00 0.00 0.00 0.00 0.00 0.00 0.00% of Revenue 1.39% 1.78% 0.00% 0.00% .16% 0.00% 0.00% 0.00% 0.00% 0.00% 0.00% 0.00% 0.00% 0.00% 0.00% 0.00% 0.00% 0.00% 0.00%Other Current Assets 0.92 1.09 0.99 2.19 2.82 2.20 1.89 2.60 2.85 2.85 4.00 5.60 7.64 9.94 12.59 14.94 17.11 19.23 21.18% of Revenue 1.03% 1.12% 1.08% 2.21% 3.73% 9.82% 7.48% 9.66% 10.00% 2.77% 2.79% 2.82% 2.85% 2.87% 2.90% 2.92% 2.95% 2.97% 3.00%Total Current Assets $22.01 $19.53 $15.25 $18.87 $15.47 $15.07 $16.83 $21.63 $19.89 $19.89 $27.95 $39.37 $53.92 $70.46 $89.33 $106.64 $122.56 $138.19 $152.36% of Revenue 24.86% 20.12% 16.74% 19.03% 20.46% 67.42% 66.69% 80.47% 69.78% 19.32% 19.53% 19.83% 20.09% 20.34% 20.55% 20.86% 21.12% 21.37% 21.58%Long Term AssetsNet PP&E Beginning 6.13 7.57 8.83 10.85 14.26 17.89 18.42 20.51 21.66 22.45 27.01 34.35 45.33 60.24 78.67 100.65 124.24 148.58 173.54Capital Expenditures 3.77 4.70 6.36 8.37 9.35 2.18 3.84 2.90 2.85 11.78 15.82 21.19 27.62 34.32 41.41 46.76 50.87 54.19 56.48Acquisitions 16.66 1.93 0.00 0.00 0.37 0.00 0.00 0.21 0.00 0.21 0.00 0.00 0.00 0.00 0.00 0.00 0.00 0.00 0.00Depreciation and Amortization 2.33 3.43 4.35 4.95 6.09 1.66 1.75 1.97 2.06 7.42 8.48 10.21 12.71 15.89 19.43 23.17 26.52 29.23 31.24Net PP&E Ending 7.57 8.83 10.85 14.26 17.89 18.42 20.51 21.66 22.45 27.01 34.35 45.33 60.24 78.67 100.65 124.24 148.58 173.54 198.79Total Current Assets & Net PP&E $29.58 $28.36 $26.09 $33.13 $33.36 $33.48 $37.35 $43.28 $42.34 $46.90 $62.31 $84.70 $114.17 $149.13 $189.98 $230.88 $271.14 $311.73 $351.14% of Revenue 33.40% 29.22% 28.65% 33.41% 44.12% 149.84% 147.96% 161.06% 148.55% 45.55% 43.53% 42.67% 42.53% 43.06% 43.71% 45.16% 46.71% 48.21% 49.73%Current LiabilitiesAccounts Payable 6.17 7.22 5.29 5.86 2.34 1.92 1.65 4.07 2.88 2.88 4.01 5.61 7.60 9.83 12.32 14.55 16.51 18.37 19.97Days Payable Outstanding 40.25 51.27 44.24 43.91 40.35 29.37 23.91 48.87 31.00 37.07 37.95 38.83 39.71 40.60 41.48 42.36 43.24 44.12 45.00% of Revenue 6.97% 7.44% 5.81% 5.90% 3.09% 8.59% 6.55% 15.13% 10.11% 2.80% 2.80% 2.82% 2.83% 2.84% 2.84% 2.85% 2.84% 2.84% 2.83%Accrued Liabilities 1.39 3.02 3.09 4.37 4.26 7.05 9.78 10.14 7.13 7.13 10.02 13.90 18.79 24.24 30.42 35.79 40.63 45.26 49.42% of Revenue 1.57% 3.11% 3.40% 4.41% 5.63% 31.57% 38.73% 37.72% 25.00% 6.92% 7.00% 7.00% 7.00% 7.00% 7.00% 7.00% 7.00% 7.00% 7.00%Accrued Compensation 2.33 6.14 8.78 5.86 6.74 4.95 5.45 7.04 6.64 6.64 10.02 13.90 18.79 24.24 30.42 35.79 40.63 45.26 49.42% of Revenue 2.63% 6.33% 9.64% 5.91% 8.92% 22.17% 21.57% 26.19% 23.31% 6.45% 7.00% 7.00% 7.00% 7.00% 7.00% 7.00% 7.00% 7.00% 7.00%Deferred Revenue 1.36 1.21 2.04 2.61 2.64 2.68 3.42 3.28 3.59 3.59 5.15 7.37 10.26 13.63 17.60 21.28 24.81 28.37 31.77% of Revenue 1.53% 1.25% 2.24% 2.63% 3.50% 12.00% 13.56% 12.21% 12.59% 3.49% 3.60% 3.71% 3.82% 3.94% 4.05% 4.16% 4.27% 4.39% 4.50%Total Current Liabilities $11.24 $17.60 $19.20 $18.70 $15.99 $16.61 $20.30 $24.52 $20.24 $20.24 $29.20 $40.77 $55.45 $71.95 $90.77 $107.40 $122.58 $137.25 $150.58% of Revenue 12.70% 18.13% 21.08% 18.85% 21.15% 74.33% 80.41% 91.25% 71.01% 19.66% 20.40% 20.53% 20.66% 20.78% 20.88% 21.01% 21.12% 21.23% 21.33%
Discounted Free Cash Flow AssumptionsTax Rate 25.00% Terminal Growth Rate 3.00%Risk Free Rate 2.17% Terminal Value 2,474Beta 1.37 PV of Terminal Value 688Market Risk Premium 6.45% Sum of PV Free Cash Flows 404% Equity 100.00% Firm Value 1,092% Debt 0.00% Total Debt 0Cost of Debt 0.00% Cash & Cash Equivalents 84CAPM 11.01% Market Capitalization 1,092WACC 11.01% Fully Diluted Shares 15Terminal Risk Free Rate 3.04% Implied Price 71.84Terminal CAPM 11.88% Current Price 67.16Terminal WACC 11.88% Undervalued 6.96%
University of Oregon Investment Group May 26, 2015
UOIG 9
Appendix 6 – Sources FactSet FinViz IBISWorld SEC Filings RENT Investor Relations Page RENT Earnings Call Transcripts