Embed Size (px)
Citation preview
NREL is a national laboratory of the U.S. Department of Energy Office of Energy Efficiency & Renewable Energy Operated by the Alliance for Sustainable Energy, LLC This report is available at no cost from the National Renewable Energy Laboratory (NREL) at www.nrel.gov/publications.
Contract No. DE-AC36-08GO28308
‘Renewables-Friendly’ Grid Development Strategies: Experience in the United States, Potential Lessons for China David Hurlbut and Ella Zhou National Renewable Energy Laboratory
Kevin Porter Exeter Associates
Douglas J. Arent Joint Institute for Strategic Energy Analysis
This work is a part of the China Grids Program for a Low-Carbon Future, supported by the Children’s Investment Fund Foundation.
Technical Report NREL/TP-6A20-64940 October 2015

NREL is a national laboratory of the U.S. Department of Energy Office of Energy Efficiency & Renewable Energy Operated by the Alliance for Sustainable Energy, LLC This report is available at no cost from the National Renewable Energy Laboratory (NREL) at www.nrel.gov/publications.
Contract No. DE-AC36-08GO28308
National Renewable Energy Laboratory 15013 Denver West Parkway Golden, CO 80401 303-275-3000 • www.nrel.gov
‘Renewables-Friendly’ Grid Development Strategies: Experience in the United States, Potential Lessons for China David Hurlbut and Ella Zhou National Renewable Energy Laboratory
Kevin Porter Exeter Associates
Douglas J. Arent Joint Institute for Strategic Energy Analysis
Prepared under Task No. ACTC.1320
Technical Report NREL/TP-6A20-64940 October 2015

NOTICE
This report was prepared as an account of work sponsored by an agency of the United States government. Neither the United States government nor any agency thereof, nor any of their employees, makes any warranty, express or implied, or assumes any legal liability or responsibility for the accuracy, completeness, or usefulness of any information, apparatus, product, or process disclosed, or represents that its use would not infringe privately owned rights. Reference herein to any specific commercial product, process, or service by trade name, trademark, manufacturer, or otherwise does not necessarily constitute or imply its endorsement, recommendation, or favoring by the United States government or any agency thereof. The views and opinions of authors expressed herein do not necessarily state or reflect those of the United States government or any agency thereof.
This report is available at no cost from the National Renewable Energy Laboratory (NREL) at www.nrel.gov/publications.
Available electronically at SciTech Connect http:/www.osti.gov/scitech
Available for a processing fee to U.S. Department of Energy and its contractors, in paper, from:
U.S. Department of Energy Office of Scientific and Technical Information P.O. Box 62 Oak Ridge, TN 37831-0062 OSTI http://www.osti.gov Phone: 865.576.8401 Fax: 865.576.5728 Email: [email protected]
Available for sale to the public, in paper, from:
U.S. Department of Commerce National Technical Information Service 5301 Shawnee Road Alexandria, VA 22312 NTIS http://www.ntis.gov Phone: 800.553.6847 or 703.605.6000 Fax: 703.605.6900 Email: [email protected]
Cover Photos by Dennis Schroeder: (left to right) NREL 26173, NREL 18302, NREL 19758, NREL 29642, NREL 19795.
NREL prints on paper that contains recycled content.

iii This report is available at no cost from the National Renewable Energy Laboratory (NREL) at www.nrel.gov/publications.
Preface China now installs more renewable electricity each year than any other country in the world. Much of this is variable renewable electricity, especially wind and solar generation. A growing body of experience exists from around the world on how to plan and operate electricity grids with high penetrations of variable renewable electricity. China is actively contributing to this body of experience given the rapid growth in renewable electricity deployment there, while at the same time digesting experiences from other countries.
This report is part of a series describing technical collaboration between the National Renewable Energy Laboratory (NREL), the China National Renewable Energy Center (CNREC) along with other key research institutes in China, and the Danish Energy Agency. The collaboration focuses on sharing experiences in the planning, deployment, and operation of high-penetration renewable electricity grid systems. The Children’s Investment Fund Foundation in the United Kingdom is funding this five-year collaboration.
The core element of the collaboration during this first year was a series of expert engagements in China to share technical knowledge and experience on four key topics:
1. Comprehensive energy scenario design and modeling
2. Renewable energy (RE)-friendly grid development
3. Power system flexibility
4. Boosting distributed generation of RE.
These engagements built on and significantly expanded existing collaboration between the Danish Energy Agency and CNREC experts.
This report summarizes some of the issues discussed during the engagement on the second topic listed above. It focuses on explaining the design of U.S. markets and describing U.S. experiences in the planning and operation of high penetration renewable electricity grid systems. Exploration of whether and how U.S. experiences can inform Chinese energy planning will be part of the continuing project, and will benefit from the knowledge base provided by this report. We believe the initial stage of collaboration represented in this report has successfully started a process of mutual understanding, helping Chinese researchers to begin evaluating how lessons learned in other countries might translate to China’s unique physical, economic, social, and political contexts.
We look forward to continuing the collaboration for the remaining four years and building on these initial successes.

iv This report is available at no cost from the National Renewable Energy Laboratory (NREL) at www.nrel.gov/publications.
Acknowledgments The authors would like to thank the following NREL colleagues for their review and comments: John Barnett, Kara Clark, Jaquelin Cochran, Jeffrey Logan, Patricia Statwick, and Ravi Vora. In addition, the authors would like to thank Ye Tao of the China National Renewable Energy Center and Donghan Feng of Shanghai Jiaotong University for their comments. This work is a part of the China Grids Program for a Low-Carbon Future, supported by the Children’s Investment Fund Foundation.
v This report is available at no cost from the National Renewable Energy Laboratory (NREL) at www.nrel.gov/publications.
Acronyms CAISO California Independent System Operator CHP combined heat and power DC direct current DOE U.S. Department of Energy EHV extra-high voltage EIM energy imbalance market ERCOT Electric Reliability Council of Texas FERC Federal Energy Regulatory Commission GW gigawatt ISO independent system operator km kilometer kV kilovolt LMP locational marginal price MISO Midcontinent Independent System Operator NERC North American Electric Reliability Corporation NREL National Renewable Energy Laboratory NWP numerical weather prediction PJM PJM Interconnection PSCo Public Service Company of Colorado REZ renewable energy zone RTO regional transmission organization UHV ultra-high voltage VG variable generation

vi This report is available at no cost from the National Renewable Energy Laboratory (NREL) at www.nrel.gov/publications.
Table of Contents 1 Introduction ........................................................................................................................................... 1 2 Two U.S. Market Models ...................................................................................................................... 3
2.1 Vertically Integrated Monopoly Utility ......................................................................................... 5 2.2 Regional Transmission Organization ............................................................................................ 7 2.3 Zonal Markets: An Experiment in the Middle .............................................................................. 9
3 Renewables-Friendly Grid Strategies ............................................................................................... 11 3.1 Capital Cost Recovery for Conventional Thermal Generation ................................................... 11 3.2 Forecasting, Scheduling, and Dispatch ....................................................................................... 14
3.2.1 Creating a Wind or Solar Forecast ................................................................................. 15 3.2.2 Solar Forecasting ............................................................................................................ 17 3.2.3 Accuracy of VG Forecasts ............................................................................................. 17
3.3 Ancillary Services and System Flexibility .................................................................................. 18 3.3.1 CAISO Flexible Ramping Constraint ............................................................................ 21 3.3.2 MISO .............................................................................................................................. 21 3.3.3 ERCOT Potential Future Ancillary Services .................................................................. 22 3.3.4 Public Service Company of Colorado (Subsidiary of Xcel Energy) .............................. 23
3.4 Grid Planning .............................................................................................................................. 23 3.5 Transmission Access and Renewable Energy Zones .................................................................. 27 3.6 Curtailing Renewable Resources ................................................................................................. 28
4 Conclusions ........................................................................................................................................ 30 References ................................................................................................................................................. 31 Appendix: Cost-Benefit Analysis ............................................................................................................ 38
List of Figures Figure 1. Coverage of RTOs and monopoly utilities (unshaded areas) in the United States ........................ 5 Figure 2. Coverage of the CAISO EIM ........................................................................................................ 6 Figure 3. Setting the market clearing price ................................................................................................... 7 Figure 4. LMP separation resulting from transmission congestion .............................................................. 7 Figure 5. Texas zonal market before 2010 .................................................................................................. 10 Figure 6. Current Texas nodal market ........................................................................................................ 10 Figure 7. Separating capital costs, variable costs in a monopoly utility market ......................................... 12 Figure 8. Sample short-term forecast mean absolute error, Alberta Electric System Operator (August
2012) ...................................................................................................................................... 16 Figure 9. Wind REZs in ERCOT, with 345-kV lines connecting wind to network load ............................ 28 Figure 10. REZs in the western United States, with proposed 500-kV DC line connecting Wyoming wind
to load in California ............................................................................................................... 28
List of Tables Table 1. Renewable Energy in Two Models of U.S. Grid Operations .......................................................... 4 Table 2. Types of Ancillary Services Commonly Used in the United States ............................................. 20 Table A-1. Costs and Benefits of Modeled Elements of the Wyoming–California EHV Line .................. 39

1 This report is available at no cost from the National Renewable Energy Laboratory (NREL) at www.nrel.gov/publications.
1 Introduction China is moving ahead with renewable energy development at a rapid pace. By February 2015, the country’s total grid-connected wind generation capacity exceeded 100 gigawatts (GW), more than a 13-fold increase from five years ago. Twenty-one GW of capacity is located in Inner Mongolia, and nearly 11 GW is in the neighboring Gansu Province (China News 2015).
Continued development and integration of wind at this pace has been the subject of increased research, concluding that successful further build-out and energy contributions would depend on addressing several grid-related issues such as transmission access, operational flexibility, electricity market design, interprovincial trading, and consistent planning of renewable energy and grid development (Luo et al. 2012; Zhao et al. 2012). As an indication of existing grid issues, curtailment of wind power reached an estimated 12% in 2014 (Xiao 2015). In the first half of 2015, curtailment increased to 15% overall and exceeded 43% in the province of Jilin, 31% in Gansu, 28.8% in Xinjiang, and 20% in West Inner Mongolia (NEA 2015).
A major cause of curtailment is inadequate transmission capacity from resource areas such as Inner Mongolia to load centers in the east. System inflexibility adds to the challenge. One reason for the inflexibility is the administrative priority given to the operation of combined heat and power (CHP) units so that heat supply to local residents can be guaranteed during the long winter months (CREIA 2015). As a result, thermal units often displace wind generation. Additionally, the winter demand for heat reduces the ability of CHP units to ramp down, making variable generation (VG) integration more difficult (Zhao et al. 2012).
China does not have an organized, actively traded electricity market (RAP 2014). The annual amount of inter-provincial power transmission is determined administratively each year by the local governments involved. Fuel prices are also administered and change very slowly. China’s coal-fired power plants operate under fixed tariffs priced on a per-megawatt-hour basis. The tariffs also guarantee the number of hours a plant will operate during the year, creating a potential conflict between least-cost system dispatch and making the coal plants financially whole. Unit commitment is not done on the basis of economic merit. Rather, schedules are set yearly, monthly, and weekly in a hierarchical manner from national, regional, and provincial to county and municipal levels. Traditionally, managing generator schedules focuses on making steady progress towards yearly contracts and administratively allocating generation hours among several power plants (Shi et al. 2014). Ancillary services are limited in China, both in variety and in how much a generator is paid.
Measures promulgated in 2007 started China on a path toward an “energy saving dispatch.” Several studies have examined the use of optimized unit commitment and economic dispatch (Sun et al. 2014; Xia et al. 2013; Li et al. 2012) and pricing mechanism design (Zhang and Sun 2013; Liu et al. 2014; Pan and Xie 2006; Wang and Zhou 2007). In early 2015, China embarked on a new round of power sector reform, with goals to increase the use of market mechanisms for ancillary services, direct electricity sales, and demand-side management programs (The General Office of the State Council 2015; National Development and Reform Commission 2015).
This report aims to provide a concise summary of experience in the United States with “renewables-friendly” grid management, focusing on experiences that might be applicable to

2 This report is available at no cost from the National Renewable Energy Laboratory (NREL) at www.nrel.gov/publications.
China. It focuses on utility-scale renewables and sets aside issues related to distributed generation, which are addressed elsewhere.1
“Renewables-friendly” refers to practices that accommodate the technical characteristics of wind, solar, and other renewable resources in the most efficient manner. These characteristics differ from those of conventional thermal generation in many ways. Rules and procedures that fail to account for these differences could constitute market barriers for new renewable energy investments, or they could lead to unnecessary operational costs that are ultimately paid by customers. In many cases, the modifications entail low costs relative to the savings and environmental benefits they produce.
The United States has two different and largely separate models for grid operations: regional transmission organizations (RTOs) and vertically integrated monopoly utilities. This report begins by describing and contrasting the key features of these two market models. In both cases, high penetrations of renewable resources have led to similar operational challenges. Some of the solutions have differed, however, and contrasting these solutions in the context of the different U.S. market models may help identify which approaches are the best fit with the direction of Chinese market reform.
The report then focuses on some of the key issues related to integrating utility-scale renewable energy in the United States. These include:
• Capital cost recovery for conventional generation: how the risk of under-recovery can affect renewable energy deployment and solutions
• The use of renewable resource forecasting in grid operations
• Managing the new demands on ancillary services when renewables constitute a larger portion of the resource mix
• Grid planning and the use of renewable energy zones
• Mitigating the operational causes of renewable resource curtailment.
Reform of China’s power sector has a uniquely Chinese starting point and will likely lead to uniquely Chinese solutions. Several regions of the United States now manage high penetrations of renewable resources on the grid, and the premise of this report is that this highly diverse U.S. experience can be a useful part of China’s knowledge base. The report concludes with some overall observations about the U.S. experience, tools that have proven useful, and potential implications for Chinese electric sector reforms.
1 Distributed renewables are addressed in “Historical and Current U.S. Strategies for Boosting Distributed Generation,” a companion report in this Children’s Investment Fund Foundation series (National Renewable Energy Laboratory report NREL/TP-6A20-68483).

3 This report is available at no cost from the National Renewable Energy Laboratory (NREL) at www.nrel.gov/publications.
2 Three U.S. Market Models Many U.S. utilities operate as vertically integrated monopolies. Federal agencies regulate matters of interstate commerce; state and local authorities regulate matters of retail electricity service and facility siting. This model prevailed almost exclusively up to the late 1990s. Among the many utility decisions that have to be approved by state and federal regulators are: rates charged to end-use customers, the profit margin the utility is entitled to earn, construction of new generators and transmission lines, the form of power purchase agreements and fuel contracts, and the use of eminent domain to procure right-of-way.2 With government authorization, a vertically integrated utility controls almost all aspects of electricity production, delivery, and sales within its territory, including power procurement from third parties.
In the late 1990s, a number of utilities began to combine operations into what eventually became RTOs. Control—although not ownership—of power generation and the transmission system transferred to an independent system operator (ISO) with an independent governance structure and robust stakeholder processes. Each RTO developed a consolidated set of operating protocols, transmission tariffs, and market rules that replaced the individual tariffs of the participating grid owners. The most important change in this new model is that the grid began to operate on an open-access basis, which allowed non-utility generators to compete with utility-owned generators on a least-cost basis. The aim was to reduce operational costs and improve reliability.
Table 1 contrasts the RTO and monopoly utility models on points with particular relevance to renewable energy development. Figure 1 shows the areas in the United States that are served by RTOs. The unshaded areas are still served by vertically integrated regulated monopoly utilities.
The RTO characteristics in Table 1 describe a restructured market with a high degree of competition. In practice, however, RTOs vary in the degree of commercial choice available to customers at both the wholesale and retail levels (Treadway 2014). The California Independent System Operator (CAISO) is still dominated by California’s three largest utilities, which serve more than three-fourths of all customers within the RTO area. CAISO ranks low with respect to commercial choice. It can be considered as between the two models contrasted in Table 1. Texas, on the other hand, is highly competitive. The state unbundled incumbent utilities into separate companies for generation, retail service, and transmission/distribution, with only the latter function remaining subject to cost-of-service regulation.3 Today, all generation—even the plants held by the former utilities’ successor entities—is treated as non-utility generation within Electric Reliability Council of Texas (ERCOT) operations. The two models shown in Table 1, therefore, represent two ends of a spectrum for how U.S. electricity markets operate.
2 Eminent domain refers to the authority of the state or national government to take private property for public use. The Fifth Amendment of the U.S. Constitution requires the government to provide just compensation to property owners (Cornell University 2015). 3 In cost-of-service regulation, the regulator determines the revenue requirement that reflects the total amounts that shall be collected in rates for the utility to recover its costs and earn a reasonable return.

4 This report is available at no cost from the National Renewable Energy Laboratory (NREL) at www.nrel.gov/publications.
Table 1. Renewable Energy in Two Models of U.S. Grid Operations
Vertically Integrated Monopoly Utility
Regional Transmission Organization with Competitive Restructuring
Captured retail customer base: utility is the only service provider
Retail customers may select from among several competitive retail electric providers
Utility has its own generation and is the sole buyer of non-utility power
All generation is non-utility; retail electric providers are wholesale buyers of power; RTO cannot own generation
Utility has one generation portfolio with one renewable/conventional fuel mix for all customers
Any retail service provider’s supply portfolio may be anywhere from 0% to 100% renewable
All customer rates are determined by regulators (state or local depending on franchising authority)
Retail electricity rates are set by each service provider, subject to government oversight against anticompetitive practices. Rates for transmission and distribution still subject to government oversight
Capital cost of utility-owned generation is recovered from captured customer base through regulated rates; little financial risk
Non-utility generators recover capital costs from inframarginal profitb, sometimes supplemented by forward capacity market payments; risk is factored into investment decision
Utility contracts with renewable energy providers must be approved by regulators
Retail service provider contracts with renewable energy providers need no government approval
Utility operates its own network Utility gives network control to an ISO
Utility decides generator schedule and dispatch ISO dispatches generators on a least-cost basis (security-constrained economic dispatch)
Utility manages renewable energy integration using its own resources, recovers cost through retail ratesa
ISO manages renewable energy integration through a combination of market-based and contract mechanisms; most costs are socialized
If government has a renewable energy requirement (minimum percent of supply from renewables), compliance burden is on utility
If government has a renewable energy requirement (minimum percent of supply from renewables), compliance burden is on each retail service provider
a More recently, a few utilities have imposed separate integration charges on variable generators directly. b Inframarginal profit is defined and explained on page 12 below.

5 This report is available at no cost from the National Renewable Energy Laboratory (NREL) at www.nrel.gov/publications.
Energy for load, 2014
(terawatts, United States only)
RTOs Non-RTOs
2,408 1,402
Figure 1. Coverage of RTOs and monopoly utilities (unshaded areas) in the United States
Sources: FERC 2015; EIA 2015a
2.1 Vertically Integrated Monopoly Utility Most U.S. utilities outside of an RTO that use wind and solar power buy it from non-utility developers (independent power producers, or IPPs); they seldom build renewable generation themselves. Consequently, a potential renewable energy project will often face a market with only one potential buyer; more than two-thirds of all U.S. wind capacity is obligated to a monopoly utility (DOE 2015a). Development opportunities depend on the utility’s need and willingness to purchase additional renewables. Three important demand factors from utilities are: (a) state requirements for renewable energy procurement, (b) the utility’s ability to manage variable renewable resources on its own grid, and (c) the utility’s desire to mitigate the price volatility of fuel for conventional generation, particularly natural gas. The pace of growth in this market is set by how frequently the utility issues requests for proposals. EPA’s issuance of the Clean Power Plan (CPP) in August 2015 is a potential fourth demand factor. The CPP requires electric generating plants to reduce carbon dioxide emissions from 2005 levels by 20% by 2022 and 32% by 2030 (EPA 2015). Wind and solar generation are among many compliance strategies for the CPP.
A monopoly utility normally self-schedules its own resources against its forecasted demand for the next day. Least-cost dispatch is a goal, but the utility might need to weigh other factors such as firm transmission commitments for others and the terms of power purchase agreements it has with non-utility generators. Scheduling and dispatch need not be optimized by computer, although the utility has a general economic incentive to keep dispatch costs as low as possible. Real-time balancing of demand, generation, and exchanges with neighboring utilities is normally done with the utility’s own reserves.
Studies and operational experience show that if the bulk electric system is larger and more geographically diverse, variable renewable resources such as wind and solar are easier and less costly to manage (Cochran et al. 2012; Bird et al. 2012; GE Energy 2010; Holttinen et al. 2009).
6 This report is available at no cost from the National Renewable Energy Laboratory (NREL) at www.nrel.gov/publications.
A single utility system usually lacks such diversity, but several U.S. utilities are effectively increasing their geographic diversity by coordinating some operations with their neighbors.
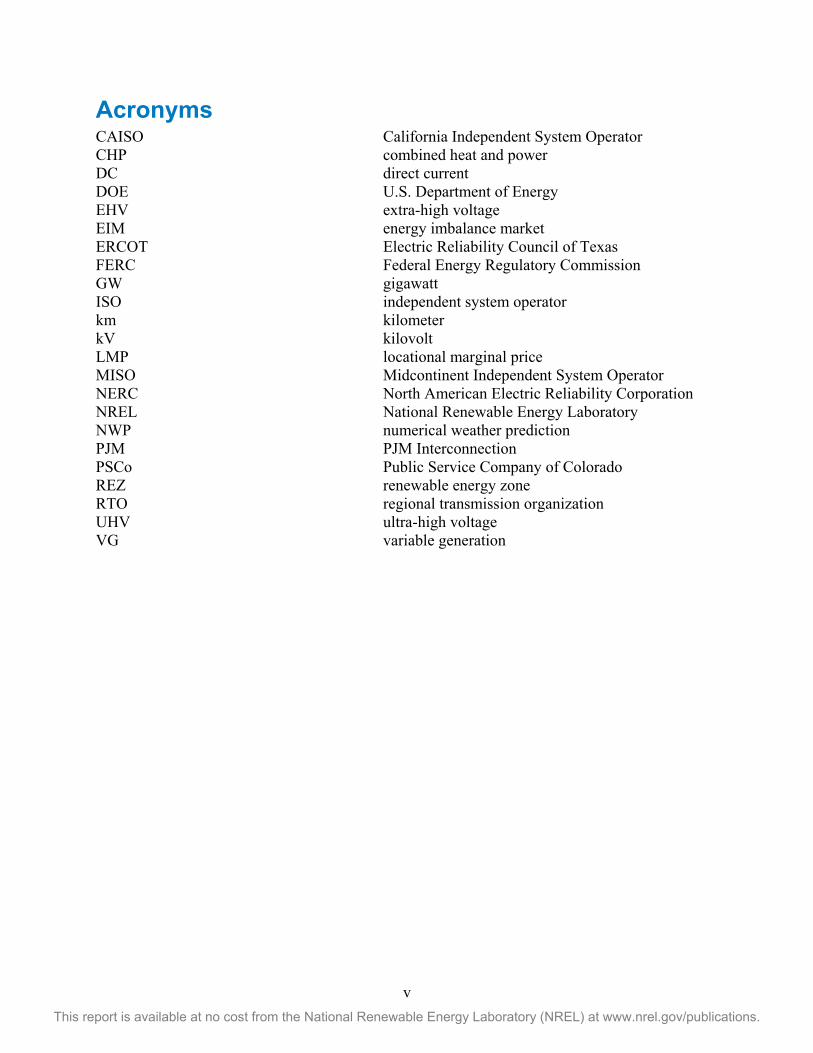
One solution that brings some of the benefits from larger geographic diversity is to aggregate generation and load across a large area with a limited set of energy services. For example, four utilities in the western United States are partnering with the CAISO to create a joint energy imbalance market (EIM), shown in Figure 2. Unlike a full RTO, the EIM’s function is limited to solving five-minute imbalances between generation and load across a large geographic footprint. The expanded geographic diversity offers three sources of efficiency: combining imbalances for each utility tends to result in a smaller net imbalance, there is a larger pool of balancing resources to draw from, and the combined variability of solar and wind resources is less (CAISO 2015).
Figure 2. Coverage of the Western EIM
Source: Puget Sound Energy 2015

7 This report is available at no cost from the National Renewable Energy Laboratory (NREL) at www.nrel.gov/publications.
2.2 Regional Transmission Organization Two key operational features of an RTO are system-wide auctions that determine which units are ultimately dispatched to serve load, and the use of locational marginal prices (LMPs)4 to determine payments from load-serving entities to generators. These two features result in challenges and opportunities for renewable energy that do not exist in a vertically integrated structure.
For energy, there are two sets of auctions. Day-ahead auctions are conducted for each operating hour of the following day and provide the primary dispatch order. Real-time markets, typically occurring every 5 to 15 minutes, serve primarily to eliminate imbalances between real-time load and generation that was dispatched on the basis of the day-ahead auction results. Capacity auctions for ancillary services run in conjunction with the day-ahead energy market.
A generator participates in an auction by submitting an offer for each hour their unit is available for dispatch. Each point in each offer curve indicates (a) a price and (b) the quantity of energy the generator will provide at that price. In a competitive environment, each price point represents the unit’s marginal cost of generation. For thermal generators, marginal cost primarily consists of fuel costs (which are responsive to daily market conditions), the unit’s heat rate, and variable operating and maintenance costs.
The market-clearing price represents the system-wide marginal cost of generation. As Figure 3 illustrates, it is the lowest uniform price at which the RTO can obtain enough energy to meet all market demand. Put another way, it is the additional system cost that would be incurred if demand were to increase by one megawatt-hour.
Figure 3. Setting the market-clearing price
Source: Sample LMP contour map from ERCOT (2015). Red-outlined dots indicate location of nodes where LMPs are calculated. 4 The locational marginal price represents the marginal cost of supplying the next increment of electric demand at a specific location on the electric power network from supply offers and demand bids. LMPs minimize the cost of energy, transmission congestion costs (if any) and the cost of transmission losses (if any).
Supply curve
Demand curve
Clearing price
$-
$25
$50
$75
$100
0 1 2 3 4 5
Resource cost ($/MWh)
GW offered by generators
8 This report is available at no cost from the National Renewable Energy Laboratory (NREL) at www.nrel.gov/publications.
All energy offers that are dispatched for that operating interval receive the market-clearing price. Except for the one offer that clears the market, the difference between the market-clearing price and a generator’s marginal cost constitutes the net revenue that is applied toward fixed costs (including capital cost) and profit.
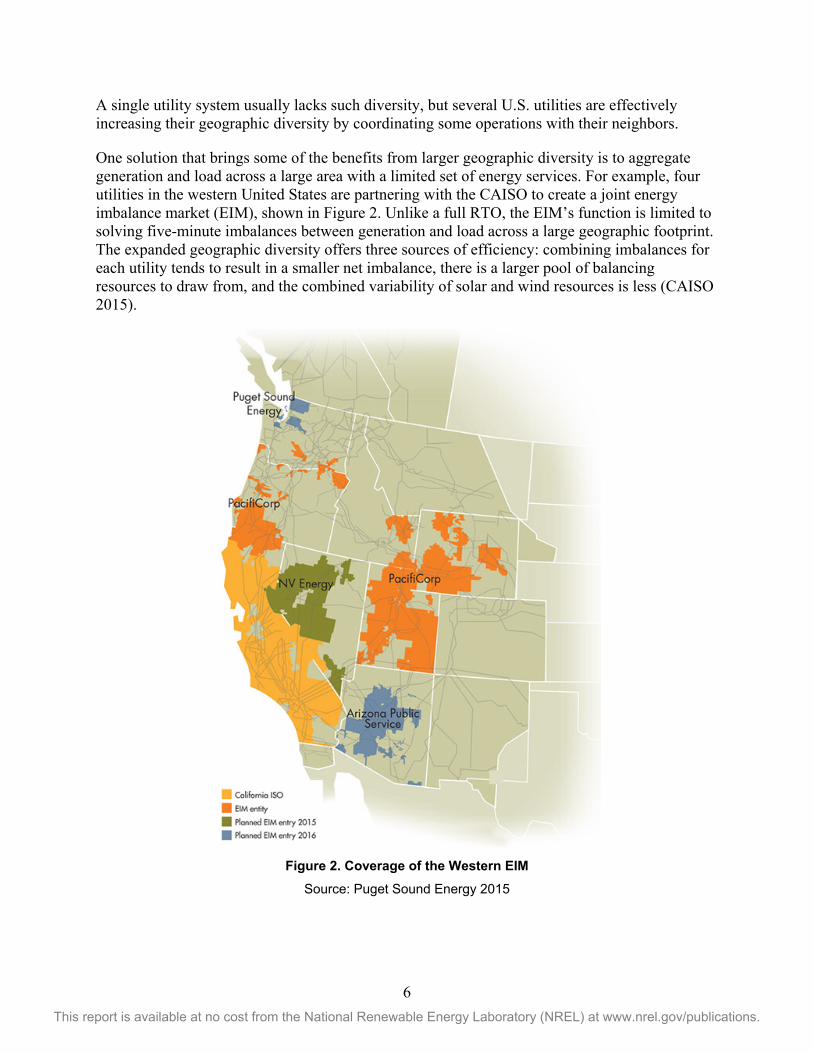
The market-clearing price separates into different LMPs (i.e., marginal prices that differ based on location) when there is transmission congestion on the grid, as illustrated in Figure 4. Security constraints on heavily used lines will limit the use of lower-cost units and require more use of higher-cost units that are not transmission constrained in meeting load. Each node on the system then has a unique contribution to marginal system cost (i.e., the cost to the system of adding one more megawatt of demand), which is captured in each node’s LMP.
Figure 4. LMP separation resulting from transmission congestion
In most cases, wind and solar generators submit offers that are priced at zero. This practice, called price taking, means the renewable generator will accept whatever price clears the market as long as it is dispatched in the auction. Price taking is a low-risk strategy for wind and solar generators because they have no fuel cost and near-zero marginal cost.
The use of the LMPs as price signals to direct, encourage, and penalize generator behavior contrasts with decision-making under the vertically integrated utility model. However, LMPs—and indeed, the RTO model itself—only work when certain pre-requisites are in place. The most important pre-requisites include:
• An open-access transmission system in which all eligible market participants receive nondiscriminatory treatment
• The absence of market power, such that no market participant has the ability to control prices or to prevent others from entering the market
• Transparency, so that no market participant has inside information on grid conditions that could lead to an unfair advantage
Low LMPs (more generation
increases congestion)
High LMPs (more generation
decreases congestion)

9 This report is available at no cost from the National Renewable Energy Laboratory (NREL) at www.nrel.gov/publications.
• Cost-responsive markets in which market participants can modify their behavior in a timely manner based on changes in their true marginal costs (i.e., costs determined directly by supply and demand rather than being set administratively)
• An open stakeholder process for setting market rules and arbitrating disputes among market participants.
The role of government in an RTO market changes because of these new requirements. In this model, regulators do not set electricity prices.5 Their focus instead is to ensure that markets work with sufficient competition, openness, and transparency to produce prices that are just and reasonable. They also do not certify the need for any specific generator, although they may approve mechanisms such as forward capacity markets that provide incentives for new generation on a competitive and nondiscriminatory basis. Regulators do provide important market policing functions, including enforcement and penalties to prevent market manipulation, and the review of market protocols to ensure competition is fair.
It is beyond the scope and role of this report to advise which U.S. model—RTOs or monopoly utilities—is most applicable to China’s power market reforms. Whether or not China should establish an RTO-like market that encompasses all aspects of operation, both nationally and provincially, is a threshold decision that reaches beyond renewable energy alone. The point here is that some renewables-friendly grid practices in the United States only work in the context of an RTO. If that is the path of reform, then the practices described in this section would be relevant. Otherwise, monopoly utility practices might be the more applicable model.
In both power market constructs in the U.S., markets with and without LMPs are trending towards faster scheduling, larger control areas, and other changes that help renewables expand and help reduce overall grid operation costs. In the RTO model, the particular mechanisms that achieve these renewables-friendly improvements are often inseparably linked to congestion management, dispatch, and other functions that are essential to how the entire market works.
2.3 Zonal Markets: An Experiment in the Middle A zonal market is operationally between a full nodal RTO market and a conventional monopoly utility market. A zone is geographically similar to a large monopoly utility’s transmission service territory (or a Chinese provincial grid authority), where load points and generators within the area can be managed together. ERCOT, for example, operated as a zonal market before implementing a full nodal market in 2010; Figure 5 and Figure 6 illustrate the differences explained in this section.
Utilities, generators, and load-serving entities in a zonal market set their own day-ahead schedules, but often there is a requirement that each schedule submitted to the market operator reflect a balance between forecasted load and the generation committed to serve it. Real-time imbalances between generation and load are solved on a least-cost basis through balancing
5 The regulated monopoly model does allow for some negotiated power purchases. A third-party generator that is not subject to regulation can offer to sell power to a utility at a price not set by the regulator directly. However, the regulator ultimately reviews the power purchase agreement to determine whether the cost is reasonable and, if so, whether the utility may recover the cost through its retail rates.

10 This report is available at no cost from the National Renewable Energy Laboratory (NREL) at www.nrel.gov/publications.
energy auctions. This differs from a nodal RTO market, where both day-ahead schedules and real-time balancing are determined by auction.
Figure 5. Texas zonal market pre-2010 Source: ERCOT (2015).
(Arrows indicate major interzonal flowgates; no flowgate between west and south zones)
Figure 6. Current Texas nodal market Source: Sample LMP contour map from ERCOT (2015).
(Typical market interval; lowest price areas in blue, highest price areas in red)
Power moves between zones across flowgates—combinations of transmission elements between two zones that can be monitored and managed as a single interface. As long as all flowgates from one zone to another are not congested, load and generation can be balanced across all zones as a single market. If any flowgate is congested, the zonal-level market separates and each zone has its own market-clearing price for balancing energy. Congestion within a zone is solved through operator-ordered curtailments and deployments that are paid at the zonal market-clearing price.
Managing congestion in a zonal market can lead to high levels of curtailment for variable renewable generation. In Texas, the first phase of wind development occurred in the western zone when ERCOT operated as a zonal market. Congestion between the west and north zones tended to depress market clearing prices in the west. Congestion within the zone was managed manually as operator-ordered curtailment. There was only one price signal for the entire zone, and it lacked the specificity needed to direct new development to low-congestion sites (Fink 2009; EIA 2014).
Today ERCOT (as well as other U.S. markets that experimented with the zonal model) operates as a nodal market, where location-specific LMP price signals have directed new development to less constrained locations.

11 This report is available at no cost from the National Renewable Energy Laboratory (NREL) at www.nrel.gov/publications.
3 Renewables-Friendly Grid Strategies 3.1 Capital Cost Recovery for Conventional Thermal Generation A structural change that jeopardizes the ability of a generator to recover its fixed capital costs can create significant market distortions, such as the risk of stranded assets, disincentives for new investment, and increased incentives for market manipulation. These problems do not affect variable operating costs such as fuel, nor do they affect generators where the asset value is fully depreciated and all capital cost obligations have been fully paid.6
The design of the wholesale power market can create a risk of unrecovered capital costs, and this could have consequences for large-scale renewable energy deployment. Fair and efficient assignment of this financial risk is an important consideration of market reform. For example, if the system dispatches generators based on offer price, and if compensation is largely (or solely) based on dispatch, then existing conventional generators with outstanding capital costs could be jeopardized if they lose their place in the dispatch order because of new generation that is capable of offering at a significantly lower price (because the new resource has no marginal cost or receives production incentives). Market reform would need to reconcile any social obligation to keep old generators financially whole with the social benefit of economic efficiency and expanded use of clean power. An administrative decision to simply keep old units running might leave less room for new renewables in the resource mix even if they are cost-effective.
Furthermore, if additional flexible generation were needed to enable higher penetrations of variable renewables, it might not be built if the generation owners did not expect to recover their capital costs. For example, quick-ramping natural gas combustion turbines in the United States operated at an average annual capacity factor of less 5% for 2013 and 2014(EIA 2015b; EIA 2013). Energy sales alone might not provide enough revenue to ensure capital cost recovery.
The two U.S. models for grid operations—classic monopoly utilities and RTOs—address the risk of insufficient capital recovery differently. In the classic monopoly model, capital costs are separated from variable costs and then allocated across all customers. This ensures the full recovery of capital costs on all generation investments regardless of how much or how little any unit actually runs. Figure 7 illustrates the main components contributing to the determination of rates for customers of regulated utilities.
6 A fully depreciated generator can continue to operate usefully. Prematurely retiring a depreciated generator does not entail stranded capital costs, although it can have other economic consequences.

12 This report is available at no cost from the National Renewable Energy Laboratory (NREL) at www.nrel.gov/publications.
Total does not vary
with operations
Paid-off assets not included in cost
Total varies with operations
Mostly fuel,
purchased power
Both costs are allocated to all customers
Figure 7. Separating capital costs, variable costs in a monopoly utility market
For example, if generating more with renewables means running a coal unit less, the capital costs of the coal unit would still be recovered through the rates charged to end-use customers even if its actual generation falls to zero. This approach also guarantees capital cost recovery for new flexible reserves that are dispatched only when needed for peak supply or quick ramping.
The State of Nevada enacted legislation specific to the problem of stranded costs relating to the reduction of coal units (Nevada Revised Statutes 2013). This was related to broader policy goals: to increase the use of renewables and natural gas generation and at the same time avoid jeopardizing the utility’s financial viability.
The RTO model is riskier for investors in new generation. In an RTO construct, capital cost recovery for new conventional generation is never guaranteed. Absent capacity markets, bilateral contracts, or other revenue sources, LMPs are the basis of most generator payments in an RTO, but by definition, LMPs represent the price of the last generator accepted to meet the final increment of electricity demand by load.7 Capital costs are not part of the LMP, at least not directly.
Inframarginal profit is the difference between the LMP at which a generator is paid and the unit’s actual marginal cost. It is an operating profit that—in theory—can cover capital and other fixed costs. In a simple market with no congestion and a uniform market-clearing price, the generator whose offer price clears the market has no inframarginal profit. For that unit, its marginal cost is equal to the LMP. All other units that were selected would have a lower marginal cost and more inframarginal profit. This means that to add new generation, a developer has to be confident that the inframarginal profit on energy will be large enough to cover the capital cost of a new unit. Otherwise, the new investment will be too risky to justify.
Some additional capacity-related payments are available through separate auctions for ancillary services. These auctions provide capacity payments for each megawatt held in reserve for a
7 In some RTO markets, retail energy suppliers will purchase power from specific generators through bilateral contracts. These deals usually involve some mechanism for reconciling the difference between the bilateral contract price and the LMPs that clear the market.
All capital costs
All variable
costs Rates
13 This report is available at no cost from the National Renewable Energy Laboratory (NREL) at www.nrel.gov/publications.
particular ancillary service. As in the energy auction, the market-clearing price for capacity sets the payment for all generators reserved for an ancillary service. They receive the capacity payment regardless of how much a unit is actually deployed for that service. If deployed, the unit also receives an energy payment equal to the prevailing LMP for each megawatt-hour used. For gas turbines and other units that might be priced out of the energy market, these ancillary service markets can provide an additional revenue stream that reduces the risk of stranded costs.
Monopoly utilities as well as RTOs have planning reserve margin requirements that are measured by the annual peak load and the generation capacity expected to be available at the time the peak occurs. Other metrics for planning reserve margin are described in accompanying CIFF program paper Advancing System Flexibility for High Penetration Renewable Integration (Milligan et al. 2015). A margin that is too small indicates that the system is vulnerable to reliability problems because total resources could be insufficient to meet electricity demand.
For monopoly utilities outside an RTO, reserve sufficiency is ensured by demonstrating to the regulator that a new generator is needed and that the plan for obtaining it is prudent. The approved costs are then added to the utility’s rate mechanisms, assuring capital cost recovery.
Reserve sufficiency is more complicated in an RTO, where the ISO is prohibited from owning any generation even if it is for the purpose of ensuring reliability. The RTO must therefore rely on market mechanisms and their resulting price signals to provide sufficient economic incentives for new capacity investments. RTOs generally use one of two approaches:
• Forward capacity market with limits on energy prices. This provides an additional revenue stream separate from a generator’s LMP payments. It is paid per megawatt of capacity, with the level determined by an auction. There are also limits on how high LMPs may go during conditions of scarcity. (For details on how PJM Interconnection’s [PJM’s] capacity market operates, see PJM [2015].)
• Energy-only market. This approach allows extremely high LMPs, but provides no supplemental forward capacity payment. It presumes that (a) when margins become small, LMPs will spike higher more often, and (b) that these periodic price excursions will provide sufficient revenue to encourage new investment.
A critical point is that both of these approaches are shaped by how an RTO works. Neither applies outside the context of an RTO. Both are indirect, presuming that the market will provide the most cost-effective solution at the right time in the future provided that the price signals are correct. If LMPs and other market-clearing prices fail to provide true price signals, either approach will likely fail to incentivize new investment.
A renewables-friendly grid separates scheduling and dispatch decisions from the ability to recover capital costs. RTOs and monopoly utilities accomplish this in different ways, based on how the markets operate.
14 This report is available at no cost from the National Renewable Energy Laboratory (NREL) at www.nrel.gov/publications.
3.2 Forecasting, Scheduling, and Dispatch Forecasting VG, which primarily comprises wind and solar, is essential for effective integration.8 VG forecasting serves multiple purposes. It allows RTOs and utilities to maintain fewer operating reserves—generation or demand that stands ready to handle unexpected events—than they would need otherwise. It also helps grid operators anticipate moderate to large changes in VG production either up or down (NERC 2010). VG forecasting also helps grid operators schedule and dispatch generating plants more efficiently, avoiding the costs and impacts associated with committing too many or too few conventional plants; these benefits include fewer emissions of air pollutants, better plant efficiency, decreased fuel costs, and decreased operations and maintenance expenses. For unit commitment and scheduling processes (day-ahead or earlier), VG forecasts can inform choices related to hydro reservoirs, natural gas purchases, and managing transmission congestion (Bird et al. 2012).
Market participants besides grid operators often purchase or create their own VG forecasts. Wind and solar companies use VG forecasts to anticipate periods of low and high production and to plan maintenance on their units. Energy traders and other wholesale market participants use VG forecasts to assist in forecasting day-ahead power market prices. Financial traders use VG forecasts to capitalize on price differences between day-ahead and real-time markets. For proposed wind and solar projects, VG forecasts are also often required to secure project financing.
There are several types of VG forecasts. Some of the most common include:
• Weather situational awareness forecasts provide severe weather alerts. Storms can lead to rapid changes in VG output.
• Day-ahead forecasts provide hourly power values for the next few days and are generally updated every 6 to 8 hours. They are often used in the unit commitment process when grid operators decide which generators will be used the next day. Starting thermal generators incurs costs and can require lengthy start-up times; forecasts help avoid unnecessary starts and stops.
• Intra-day forecasts generally provide power production estimates for the next few hours (usually 4 to 8 hours ahead). They are updated frequently—at least hourly, and often more frequently, such as every 10 minutes. Intra-day forecasting is an area of special focus, with emphasis not only on accuracy but also on predicting VG ramps. Intra-day forecasts also help dispatch state-of-the-art VG that has advanced control capabilities.
• Nodal forecasts aggregate VG forecasts (of the sort described above) for each node or transmission delivery point. Nodal forecasts can assist grid operations in planning for transmission congestion.
• Persistence forecasts simply assume that current output levels will remain unchanged in the very near future, from minutes to one to two hours ahead. Because wind plant
8 In this section, wind forecasting is emphasized more than solar forecasting because wind forecasting has been in place longer.

15 This report is available at no cost from the National Renewable Energy Laboratory (NREL) at www.nrel.gov/publications.
production tends to change slowly, persistence forecasts are often quite accurate within the hour and useful for short-term decisions.
• Ensemble forecasts are an aggregation of output from two or more forecasts (either from different vendors or from a single vendor using various sets of model parameters). Because no forecast of any type is perfect, many VG forecast users choose to rely on ensemble forecasts. This approach is especially useful when experienced judgment is available to choose from among several forecasts, and there is a history of production and observation data that can inform the moment-to-moment selection of forecasts from the ensemble (NERC 2010).
• Ramp forecasts are separate forecasts, used primarily for wind, that are intended to measure the probability of a severe ramp occurring, either up or down. ERCOT has a separate ramp forecast for wind. There is not universal agreement among VG forecasters that a separate ramp forecast is required. Those who do agree on the requirement say that phase errors—that is, when a predicted change occurs, but at a different time than predicted—are common in determining the timing and magnitude of a ramp (Zavadil et al. 2009). A contrasting viewpoint is that frequently updated intra-hour and day-ahead forecasts should be sufficient for detecting ramps (Ahlstrom 2011).
3.2.1 Creating a Wind or Solar Forecast VG forecasting utilizes various resources, from observed weather data, to numerical weather prediction models (NWP). NWP models have become the standard for forecast horizons of six hours and longer (IEA 2013). These large-scale models start with current weather observations and process this information using complex physics-based models to make predictions about the future state of the weather. The most commonly used models are run by public agencies, such as the National Oceanic and Atmospheric Administration, the Meteorological Service of Canada, and the National Center for Atmospheric Research. NWP models incorporate global weather data gathered by organizations worldwide (NOAA 2015; Widiss and Porter 2014).
NWP models have intrinsic limitations, however. The models can only take into account factors that affect the weather as we currently understand them, so important variables may be missing, or may be at insufficient resolution or collected at an inappropriate location. For example, commercial wind turbines are typically installed at 80 meters or higher, yet most weather stations are located at or below 10 meters above ground level. An NWP model might use a spatial resolution that does not capture terrain differences below a 10-kilometer (km) grid block (Bird et al.; Widiss and Porter 2014).
In China, most wind power forecasting systems use NWP models purchased from commercial foreign companies. The geographic resolution of atmospheric forecasts is relatively low (45 km x 45 km), although the atmospheric results are often scaled to a higher resolution (5 km x 5 km) by applying adjustments based on known topographical features (Yongning 2015). Often, however, the foreign models are not suitable for China’s specific weather patterns (China Electric Power Research Institute 2012). The China Meteorological Administration identified high-resolution NWP models as one of the key research projects to be tackled in 2014-2020 with the goal of achieving 1–3 km resolution (China Meteorological Administration 2014).
16 This report is available at no cost from the National Renewable Energy Laboratory (NREL) at www.nrel.gov/publications.
Because of these model limitations, utilities, RTOs, and VG forecasters often will incorporate more data and statistical analysis into the NWP model. Local weather data may be collected, and statistical models are created to measure the effect of the local terrain regarding changes in VG production. More specifically, the statistical models attempt to measure the relationship between the data from general weather models and historical weather conditions and VG production at a particular site. The combination of NWP model results and site-specific historical data can then be used to forecast VG power production. Because of the reliance upon historical data, statistical models are more capable at estimating output under normal weather conditions, unless the models are built to forecast irregularities (Bird et al. 2012; Widiss and Porter 2014).
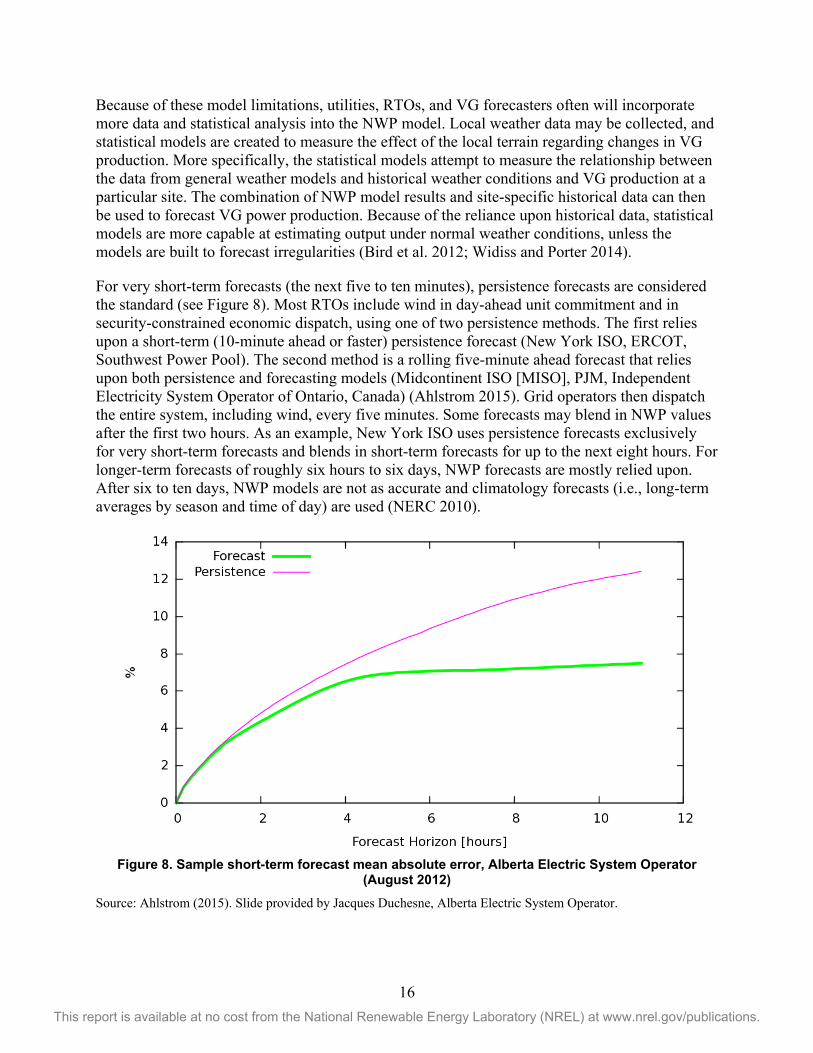
For very short-term forecasts (the next five to ten minutes), persistence forecasts are considered the standard (see Figure 8). Most RTOs include wind in day-ahead unit commitment and in security-constrained economic dispatch, using one of two persistence methods. The first relies upon a short-term (10-minute ahead or faster) persistence forecast (New York ISO, ERCOT, Southwest Power Pool). The second method is a rolling five-minute ahead forecast that relies upon both persistence and forecasting models (Midcontinent ISO [MISO], PJM, Independent Electricity System Operator of Ontario, Canada) (Ahlstrom 2015). Grid operators then dispatch the entire system, including wind, every five minutes. Some forecasts may blend in NWP values after the first two hours. As an example, New York ISO uses persistence forecasts exclusively for very short-term forecasts and blends in short-term forecasts for up to the next eight hours. For longer-term forecasts of roughly six hours to six days, NWP forecasts are mostly relied upon. After six to ten days, NWP models are not as accurate and climatology forecasts (i.e., long-term averages by season and time of day) are used (NERC 2010).
Figure 8. Sample short-term forecast mean absolute error, Alberta Electric System Operator
(August 2012) Source: Ahlstrom (2015). Slide provided by Jacques Duchesne, Alberta Electric System Operator.
17 This report is available at no cost from the National Renewable Energy Laboratory (NREL) at www.nrel.gov/publications.
3.2.2 Solar Forecasting Large-scale solar development is a recent phenomenon in the United States, and solar forecasting is at an early stage of development relative to wind power forecasting. The short-term variability of a single photovoltaic plant can be high, although there are geographic diversity benefits with multiple photovoltaic plants (Mills and Wiser 2010). On the other hand, operators can generally forecast when these periods of high intra-hour solar variability will occur during the week. This is in contrast to wind, which tends to be more consistent than solar on an hourly and intra-hourly basis but is generally more difficult to forecast over the course of a week (Lew and Brinkman 2013).
The production of solar generation varies based on how much solar radiation is received by the earth. That, in turn, varies based on clouds, water vapor, and aerosols. Hour-ahead solar photovoltaic forecasts utilize statistical models that rely upon a time series of site-specific insolation data, cloud and solar insolation measurements from off-site, and satellite pictures of water vapor that may affect the amount of solar radiation that reaches the earth. Day-ahead solar photovoltaic forecasts rely upon physics-based models using similar data. For longer time scales, NWP models may be needed to estimate the shape, size and movement of clouds.
Multiple methods will be necessary to predict solar energy production at different time scales. Currently, the measurement of clouds and cloud movement are the basis of short-term solar forecasts. Additionally, sky imagers located near solar plants can assist in finding advancing clouds and determining the possible effect on solar generation. Satellite images can also assist in locating and estimating the direction and speed of clouds (Porter et al. 2012). NWP models are necessary for predicting solar insolation for multiple days (NERC 2010).
3.2.3 Accuracy of VG Forecasts Accuracy is, of course, important for VG forecasts and the entities that rely upon them. A wind developer needs accurate forecasts for an individual project in order to schedule turbine maintenance and to project short-term revenue. Grid operators, on the other hand, are more concerned about aggregate effects on the entire system. VG forecasts can also be tools for identifying periods when the risk to reliability is increased, especially because small forecasting errors can sometimes have greater impacts at times of stress on the grid, such as during periods of low electric demand (minimum load), than large forecast errors during periods of normal operating conditions (NERC 2010).
Naturally, grid operators would like to see continuing improvements. With years of experience in forecasting load, day-ahead errors for these forecasts are now in the range of 1% to 3% (Bird et al. 2012). VG forecasts are not nearly this accurate. As a result, some utilities and RTOs report that while VG forecasting is helpful for identifying trends and the approximate timing of VG production, they interpret it with caution or even discount it altogether, particularly for longer time frames (Widiss and Porter 2014).
More accurate NWP forecasting for the power sector will necessitate data measurements from greater heights throughout the atmosphere and additional geographic diversity, as well as increased frequency of measurements and model runs. In the United States, such efforts are expected to require public-private collaboration and government financial support (Bird et al. 2012).
18 This report is available at no cost from the National Renewable Energy Laboratory (NREL) at www.nrel.gov/publications.
There are other options that would improve VG forecast accuracy significantly. Using larger balancing areas with more geographic diversity can smooth the variability of wind and solar output. In turn, this reduces net forecasting errors. Aggregating wind plants in this manner can generally reduce net forecast errors by 30%–50% (NERC 2010). So-called “virtual” balancing areas, such as those created by an EIM (described earlier in this paper), can provide similar benefits (Chase et al. 2011).
Faster scheduling intervals and more frequent forecast updates throughout the day improve forecasting accuracy, as forecast errors decrease closer to the time at which generation is dispatched to meet load. This allows greater use of persistence forecasting, which is quite accurate in very brief time intervals. For the next ten minutes or less, the error of a wind power persistence forecast is similar to load forecast error (NERC 2010).
3.3 Ancillary Services and System Flexibility Ancillary services are services needed to allow for the delivery of capacity and energy from resources to loads while ensuring continued electric service reliability. In the Federal Energy Regulatory Commission’s (FERC’s) Order 888 from 1997, FERC required transmission providers to provide six ancillary services, as described and defined below (FERC 1996):
• Scheduling, system control, and dispatch: Transmission operators provide this service as they schedule and dispatch the resources on their system.
• Reactive supply and voltage control from generation maintains transmission system voltages within required ranges and magnetic fields of alternating-current equipment and compensates for the reactive losses on transmission facilities. Reactive power is typically provided as a cost-based service (Open EI9).
• Regulation and frequency response service: Regulation connects generation with rapid changes in load (usually sub-hourly, and often as quickly as 5 minutes) by dispatching either generation or demand response via an automatic control signal (Monitoring Analytics 2012).
• Energy imbalance service: This service handles any differences between day-ahead scheduling and the real-time delivery of generation to meet load.
• Operating reserve–synchronized reserve service is provided by generation or demand-side resources that are synchronized to the grid and can respond quickly, generally within 10 minutes.
• Operating reserve–supplemental reserve service is supplied by generation or demand-side resources that are not synchronized to the grid but can respond within a specified time frame, usually defined as 30 minutes (Kirby 2007).
Although FERC’s requirement for ancillary services is consistent across all wholesale markets, there are substantial differences in how they are procured. Traditional monopoly utilities acquire and pay for ancillary services according to their FERC-approved rate schedules. For RTOs, most ancillary services are procured in competitive markets. More recently, market systems have 9 Reactive Power: http://en.openei.org/wiki/Definition:Reactive_Power. Accessed August 8, 2015.

19 This report is available at no cost from the National Renewable Energy Laboratory (NREL) at www.nrel.gov/publications.
improved so that the RTO’s various ancillary service procurements can be co-optimized with day-ahead energy procurements.
Higher levels of VG may impact ancillary service markets in several ways. For example, introducing higher levels of VG into the system may require reevaluating reserve requirements—their amount, timing, duration, and even how they are defined. In general, the amount of reserves will likely need to be increased as more VG is incorporated (Porter et al. 2012). Other potential ancillary service market impacts include:
• Ancillary services are typically relied upon to manage variability and uncertainty. When system variability and uncertainty are increased with increasing levels of VG, more ancillary services may be needed. Increasing the requirement for ancillary services can increase the demand and therefore the price for ancillary services.
• VG can displace synchronous, frequency-responsive power plants. Additional actions or changes in market design may be needed to ensure that sufficient frequency response is made available.
• VG may increase the occurrence of scarcity events when the variability and uncertainty of VG may result in ancillary service requirements that cannot by met because of some combination of commitment, transmission, or ramp limit constraints. That, in turn, could lead to price spikes.
• Increased aggregate variability and uncertainty may create a need for greater system flexibility, and that in turn may require changes in the design of ancillary services, changes in market design, and/or the introduction of new types of ancillary services.
Table 2 includes ancillary service definitions from NERC, in addition to a definition of load following. The definitions somewhat overlap and are not exact. Load following is not a required ancillary service by either NERC or FERC; it is defined to mean the change of generation and responsive load over several minutes or hours to account for changes in net load (load minus wind minus solar). For generation, this encompasses economic-dispatch commands from short-term demand forecasts, unit commitment, and dispatch (NERC 2014).
Other ancillary services, such as “black start,” operate for several hours at a time when called upon and are provided on the basis of cost or incentive rates (Monitoring Analytics 2015). Black start service is needed from generators for restoring electric grids after a blackout. Black start resources must be capable of starting without outside power supply, able to maintain frequency and voltage under varying load, and able to maintain rated output for a significant period of time (e.g., 16 hours). Many RTOs will issue a request for proposals for black start service and use cost-based recovery mechanisms for these resources (Ela et al. 2014).
The price of a market-procured ancillary service product reflects the marginal cost to provide the required volume at each location. It is set by the most expensive offers used to serve the product requirement and the opportunity cost for providing that product in lieu of energy. Analysis has shown that the price of ancillary services depends greatly on the operational flexibility of the generation fleet, including ramp rates and the fraction of the fleet available to provide reserves (Hummon et al. 2013). In addition, alternative sources of ancillary services, such as demand response and energy storage, may provide these products at lower cost. Therefore the price of an

20 This report is available at no cost from the National Renewable Energy Laboratory (NREL) at www.nrel.gov/publications.
ancillary service product may also be influenced by the ability of these alternative sources to participate in the market.
Still other services, such as primary frequency response and inertial response, do not always have access to cost-based or market mechanisms. Primary frequency response is provided by synchronous generator turbine governors that respond proportionally to changes, either up or down, in frequency. Primary frequency response corrects for changes in frequency and stabilizes frequency to a new steady-state level. Inertial response is often defined as the immediate injection of active power through the stored kinetic energy of the rotating mass of synchronous machines. Inertial response helps slow down the rate of change in frequency decline. Both primary frequency response and inertial response are critical services needed to preserve electric service reliability and avert under-frequency load-shedding, machine damage, and potential blackouts.
Table 2. Types of Ancillary Services Commonly Used in the United States
Category Description and Operation Regulation • Used to manage the minute‐to‐minute differences between load and
resources and to correct for unintended fluctuations in generator output to comply with NERC’s Real‐Power Balancing Control Performance Standards (BAL‐001‐1, BAL‐001‐2)
Load following • Follow load and resource imbalance to track the intra‐ and inter‐hour load fluctuations within a scheduled period
Spinning reserve • On‐line resources, synchronized to the grid that can increase output in response to a generator or transmission outage and can reach full output within 10 minutes to comply with NERC’s Real‐Power Balancing Control Performance Standards (BAL‐001‐1, BAL‐001‐2)
• Usually utilized after a contingency • Generally provides a faster and more reliable response • VGs may be non‐spinning, but can be utilized as spinning reserves
Non-spinning reserve
• Similar in purpose to spinning reserve; however, these resources can be offline and capable of reaching the necessary output within 15 minutes of being called
• Usually utilized after a contingency Supplemental reserve
• Resources used to restore spinning and non-spinning reserves to their pre-contingency status
• Deployed following a contingency event • Response does not need to begin immediately
Source: NERC 2014
Variable generators are not synchronous machines nor do they naturally change output in response to the frequency of the grid. Although this characteristic of VG does not directly increase the need for primary frequency response, higher penetrations of nonsynchronous VG can displace resources that provide primary frequency response and inertial response through automated frequency governors (Cochran et al. 2013). Some studies have shown that the frequency response in the United States, especially in the Eastern Interconnection, has been decreasing during the past 20 years or more, although not because of increased VG. Possible reasons include high governor deadbands, generators operating in modes that do not offer frequency-responsive reserve, governors that are not enabled, a reduced percentage of direct-drive motor load, and others. However, some have claimed that the wholesale electricity market

21 This report is available at no cost from the National Renewable Energy Laboratory (NREL) at www.nrel.gov/publications.
design, lack of incentives, and even the presence of disincentives to provide primary frequency response service are among the major causes of the decline (Ela et al. 2014a). Without any controls or changes, though, increased penetrations of nonsynchronous VG could further degrade primary frequency response and inertial response.
Continuing technological advances in VG will also help. Newer wind turbines are capable of providing frequency response and inertial response, while advanced inverters can provide or absorb reactive power and are capable of withstanding changes in voltage or system frequency. Having these capabilities, though, sometimes requires additional capital investment costs, and it may also involve reducing energy production in order to provide the required service. While newer VG plants may technically be able to provide these services, they may not do so because of the additional costs in doing so (Ela et al. 2014b; Van Hulle 2014).
The flexibility of available generation or responsive demand resources will determine whether the increased variability and uncertainty of VG can be accommodated or whether other actions are needed, such as increasing resources in day-ahead commitment or creating a new or revised ancillary service (e.g., a ramping or flexible reserve). A ramping or flexible reserve would address the probability of a system event that cannot be covered by spinning or non-spinning reserves. CAISO, ERCOT, MISO, and Xcel Energy’s Public Service Company of Colorado (PSCo) are experimenting with different approaches as discussed below.
3.3.1 CAISO Flexible Ramping Constraint CAISO established a “flexible ramping constraint” when it began experiencing shortages in ramping capability. CAISO attributed these shortages to multiple factors such as resources shutting down without sufficient notice, errors in VG forecasts, sudden changes in expected deliveries, contingency events, and high hydro runoff (Porter et al. 2012).
The flexible ramping constraint is an additional constraint imposed on the market-clearing engine that ensures that sufficient upward ramping capacity is committed and available in the real-time commitment and real-time dispatch process. Adding such a constraint decreases the occurrence of infeasible dispatch as compared to when upward ramp capability is not procured, and decreases the need to depend on regulation or on neighboring balancing areas. Operators determine the amount of needed upward ramp capability based on the (1) expected variability for the interval, (2) potential uncertainty as a result of load and VG forecast error, and (3) differences between the hourly 15-minute average net load levels and the actual 5-minute net load levels. These levels are determined from historical data, and CAISO publishes the total necessary requirements (Ela et al. 2014). For more on the CAISO flexible ramping constraints, see accompanying CIFF program paper Advancing System Flexibility for High Penetration Renewable Integration.
3.3.2 MISO In October 2014, FERC approved MISO’s petition for establishing a ramp capability product for both up and down ramps procured through its energy market. MISO explained in its filing to FERC that at times unexpected net load variations result in a short-term scarcity event.10 All 10 “Net load” is system energy demand minus the coincident output of all VG on the system.

22 This report is available at no cost from the National Renewable Energy Laboratory (NREL) at www.nrel.gov/publications.
dispatchable resources have available capacity, MISO explained, but they cannot respond (ramp up or down) quickly enough to unexpected changes in net load. These occurrences can result in a single, 5-minute dispatch interval or multiple consecutive dispatch intervals where the energy price is higher due to scarcity pricing, even if there is no threat to electric service reliability. Because of these short-term scarcity intervals, the hourly price of energy in MISO can increase substantially. By providing price signals that target specific reliability and economic needs, MISO expects its ramp capability product will decrease the incidence and associated costs of intra-hour scarcity events, reserve shortages, and uneconomic resource commitments and will result in annual savings of $3.8 million to $5.4 million. Note that MISO does not consider the ramp capability product a separate ancillary service because it will complement MISO’s other ancillary services.
Similar to CAISO, the ramp capability product adds a constraint to MISO’s day-ahead and real-time markets. If needed, MISO’s market model will withhold resources from providing energy in the current 5-minute dispatch interval to retain sufficient capacity to achieve required ramp levels in subsequent 5-minute dispatch intervals. MISO indicated it will rely upon load forecasts and historical net load variability data to determine requirements for the service (FERC 2014). MISO indicated it will not fully implement its ramp capability product until 2016 or 2017 (Porter et al. 2015).
3.3.3 ERCOT Potential Future Ancillary Services ERCOT has recently been reevaluating the structure of its ancillary services (ERCOT 2013). At issue is whether the services that have been adopted from historical practice are sufficient for today’s generation mix, which in ERCOT is now 10% wind power on an average annual basis, and continues to grow.
ERCOT’s future ancillary services concept paper contemplates five types of permanent services:
• Synchronous inertial response service, an instantaneous response that is continuously self-deployed from synchronous machines following disturbances
• Fast frequency response service, where full response is delivered within 0.5 second to changing frequency
• Primary frequency response service, instantaneous governor or governor-like action for frequency deviation, generally delivered completely within 12 seconds to 14 seconds
• Up and down regulating reserve service, to balance the system between 5-minute Security Constrained Economic Dispatch intervals, able to deliver and sustain the reserve deployments for up to 10 minutes
• Contingency reserve service, to ensure that ERCOT is able to restore interconnection frequency following a disturbance control standard event or large net load forecast error, deliverable within 10 minutes so that frequency can be restored within 15 minutes.
As of this writing, ERCOT is examining how to integrate these services into its operations. Issues include what methodology to use in determining how much of each service is needed, and how to economically optimize procurement through ERCOT’s open market system (ERCOT 2015)
23 This report is available at no cost from the National Renewable Energy Laboratory (NREL) at www.nrel.gov/publications.
3.3.4 Public Service Company of Colorado (Subsidiary of Xcel Energy) Both CAISO and MISO created their ramping-related enhancements within their RTO market frameworks. PSCo, on the other hand, is a traditional monopoly utility facing similar flexibility needs. PSCo submitted a petition in May 2014 to establish a Flex Reserve Service, which FERC conditionally approved five months later, establishing hearing and settlement procedures to resolve the material issues raised in the case (FERC 2014). The service is subject to refund if FERC finds PSCo’s proposed rates are not reasonable.
PSCo defines Flex Reserve Service as a supplemental reserve that maintains generation and load balancing if wind generation on its system falls 100 MW or more over at least 30 minutes due to drops in wind speed. PSCo added its Flex Reserve Service in 2008 after experiencing an increased number of drops in wind production in discrete time intervals as more wind was added. The utility experienced an increasing number of wind down-ramps between 2010 and 2013 that exceeded 300 MW, reaching as much as 788 MW (PSCo 2014).11
Flex Reserve Service is supplied by generation that is online but unloaded, generation able to start operations in 30 minutes, or interruptible or other non-generation resources able to provide capacity within 30 minutes. Any PSCo transmission or ancillary service customers using wind to meet load in or out of the PSCo balancing area must purchase Flex Reserve Service or self-supply it. PSCo warned that its system conditions may change, and PSCo may have to submit a separate filing to FERC to update the amount of required Flex Reserve Service if more wind capacity is added and/or if solar is included as requiring Flex Reserve Service. The Flex Reserve Service only applies to wind, but PSCo said it might include solar if solar capacity increases significantly (PSCo 2014).
PSCo explained it cannot use contingency reserves to respond to large wind ramps because the NERC’s standards on grid disturbances do not include large down-ramps for wind. In addition, NERC standards represent grid disturbances at 15 minutes or less, but wind ramps occur over larger time periods. PSCo also does not want to use regulation and frequency response reserves as it would exhaust PSCo’s resources to supply such service.
3.4 Grid Planning Additional transmission may be needed for the increased development of VG, as the best VG resources may be remote and located far from load and existing transmission may not be able to accommodate new generation. Today, VG utility scale plants can be realized (from proposal to grid connection) in relatively short time frames (e.g., months to a year or two). This relative speed of build-out contrasts to the longer timeframe typically required to approve and build new transmission (e.g., 5–10 years) (DOE 2015). In some cases, the absence of proactive transmission planning can result in one VG project having to pay costs related to a new line that later projects on that line would not have to pay.
11 Wind up-ramps are still addressed by ramping down spinning capacity, which does not affect contingency reserves. PSCo can also curtail wind production if up-ramps exceed what its spinning capacity can accommodate.

24 This report is available at no cost from the National Renewable Energy Laboratory (NREL) at www.nrel.gov/publications.
Utilities and RTOs engage in transmission planning to ensure the short-term and long-term reliability of the grid. Transmission planning varies by grid operator across the United States and can consist of a single utility, a consortium of utilities, or an RTO, or can be done interconnection-wide. Transmission plans typically include a long-term forecast of expected load demand, known generation additions, planned unit retirements, and the new transmission, transmission upgrades, or other upgrades that are expected to be necessary to maintain electric service reliability. A plan for reliability might or might not reduce transmission congestion, which is often modeled separately (Fink et al. 2011).
Planning will assess proposed transmission projects from four sources: reliability upgrades needed to satisfy reliability criteria (i.e., NERC standards), economic projects, transmission service and generation interconnection requests, and customer-funded projects (also referred to as participant-funded projects). Cost recovery depends on who owns the project or upgrade, which of the four types of need is driving it, and the tariff under which the owner operates. Costs for reliability-required projects are usually recovered from all customers across all loads covered by the owner’s transmission tariff; costs for interconnecting new generation or requests for transmission service might be recovered from all customers assigned to the service requestor, or split between both. Direct costs for a generator to interconnect with the grid are the responsibility of the generator. Economic projects advance only if they meet a cost-benefit test for social merit, such as a reduction in overall congestion costs. Customer-funded projects, as one would expect, are paid for by the customer (Fink et al. 2011).
Transmission planning has steadily evolved in response to new objectives, such as reducing greenhouse gas emissions, connecting more renewable and natural gas resources, replacing old infrastructure, increasing system flexibility, reducing transmission congestion costs, improving reliability, and increasing grid resiliency (DOE 2015b). Additionally, infrastructure investment programs that were part of the U.S. response to the 2008–2009 recession included a four-year effort for the development of integrated transmission plans for the country’s three main interconnections (Cowart 2013). This special planning effort was cross-jurisdictional, convening federal officials, state regulators, RTOs, and transmission-owning utilities from across the entire interconnection.
FERC has issued several orders related to the advancement of transmission planning over nearly the past 20 years. In 1996, FERC required FERC-jurisdictional transmission providers to file open-access transmission tariffs for wholesale power customers and other transmission providers to use on a non-discriminatory basis (FERC 1996).12 Order 2003, issued in July 2003, set out requirements for interconnecting generation to the transmission grid and spelled out the cost allocation responsibilities between generators and FERC-jurisdictional transmission providers (FERC 2003). In 2007, FERC issued Order 890 that, among other things, requires FERC-jurisdictional transmission providers to conduct transmission planning in an open and transparent manner and to incorporate nine criteria: 12 Some transmission providers (federal power administrations, for example) are not under FERC jurisdiction. For these providers, FERC established a “reciprocal tariff” principle by which non-jurisdictional transmission providers could file an advisory tariff. Having a reciprocal tariff facilitates transactions between jurisdictional and non-jurisdictional transmission providers, even though FERC does not have authority to approve rates and terms of a reciprocal tariff.

25 This report is available at no cost from the National Renewable Energy Laboratory (NREL) at www.nrel.gov/publications.
• Coordination
• Openness
• Transparency
• Information exchange
• Comparability
• Dispute resolution
• Regional participation
• Economic planning studies
• Cost allocation for new projects (FERC 2007).
FERC issued a comprehensive order in 2011 that requires FERC-jurisdictional transmission providers to participate in a public regional transmission planning process. The order consolidates principles set forth in previous orders and requires providers to produce a regional transmission plan. Transmission plans, both local and regional, must include transmission requirements driven by public policy requirements established by state or federal laws or regulations, such as state renewable energy procurement standards. FERC-jurisdictional transmission providers are required to coordinate to determine if more efficient or cost‐effective solutions are available.
That same order requires interregional coordination by neighboring transmission planning regions. FERC directs planning entities to share information on regional transmission requirements and possible solutions. FERC defined interregional transmission facilities as those that are located in two or more neighboring transmission planning regions. FERC did not require development of an interregional transmission plan or participation in interconnection-wide planning.
The order also limits the use of federally sanctioned “right of first refusal” under FERC-approved tariffs and agreements. When in force, the right of first refusal gives an area’s incumbent utility the first right to build a new transmission line, even if the project has been proposed by another commercial entity who wants to build and operate the line itself. FERC’s order eliminates an incumbent transmission utility’s ability to claim right of first refusal with respect to new transmission facilities selected in a regional transmission plan for the purposes of cost allocation, under certain conditions.
In addition, the regional transmission plans must include a regional cost allocation method consistent with six principles. If a region cannot reach agreement on a cost allocation methodology, then FERC would decide based on the record. The six principles are:
1. Costs allocated are “roughly commensurate” with estimated benefits.
2. Those who do not benefit from transmission do not have to pay for it.
26 This report is available at no cost from the National Renewable Energy Laboratory (NREL) at www.nrel.gov/publications.
3. Benefit‐to‐cost thresholds must not exclude projects with significant net benefits.13
4. There is no allocation of costs outside a region unless other region agrees.
5. Cost allocation methods and identification of beneficiaries must be transparent.
6. Different cost allocation methods could apply to different types of transmission facilities, including cost allocation methods for projects driven by different needs, i.e., reliability, economics, and public policy (FERC 2011).
Filings by FERC-jurisdictional transmission providers have been made for regional and interregional transmission plans. FERC is reviewing both regional transmission plans and inter-regional transmission plans. FERC has conditionally accepted inter-regional plans put forward by the Southeastern Regional Transmission Planning Process Region and Southwest Power Pool; Southwest Power Pool and MISO; MISO and PJM; PJM, ISO New England, and New York ISO; and a collection of planning regions in the western United States known as the Western entities. In reviewing these plans, cost allocation has been one of FERC’s primary concerns. For example, FERC ordered that CAISO match its neighbors’ approach to determining the benefits of inter-regional transmission projects based on the concern that CAISO might “pay a disproportionately lower share of costs” for such projects (Wiser 2015).
Despite this progress, some industry groups and market participants argue that further change is necessary. WIRES, a membership group consisting of those interested in adding more transmission capacity, commissioned the Brattle Group to study the state of transmission planning (Pfeifenberger et al. 2015). That report asserted that transmission planners and policymakers do not adequately consider the high costs and risks of an insufficiently robust and insufficiently flexible transmission infrastructure, or the risk-mitigation value of transmission investments. By not adequately considering the full range of benefits that transmission investments can provide, the group concluded, transmission planners and policymakers understate the expected value of such projects. The report recommended that policymakers:
• Resist making the assumption that less transmission investment is always a lower-cost solution.
• Urge planners to move from “least regrets” transmission planning that identifies only those projects that are beneficial under most circumstances to also considering the potential “regrettable circumstances” that could result in very high-cost outcomes because of inadequate infrastructure.
• Urge transmission planners to move from compartmentalizing projects into “reliability,” “economic,” and “public policy” projects.
• Expand interregional planning processes to allow for the evaluation of projects that address different needs in different regions.
• Refrain from resorting to “least common denominator” approaches to interregional planning that consider only a subset of the benefits recognized in the individual regions.
13 FERC uses 1.25 as an indicative ratio between benefits and costs.

27 This report is available at no cost from the National Renewable Energy Laboratory (NREL) at www.nrel.gov/publications.
• Consider the combined set of benefit metrics from all interconnected regions and also consider the unique additional values offered by interregional transmission projects, such as increased wheeling revenues or reserve sharing benefits (Pfeifenberger et al. 2015).
3.5 Transmission Access and Renewable Energy Zones The renewable energy zone (REZ) approach was created to guide utility-scale renewable energy development into areas that have the highest likelihood of being the most cost effective. A REZ is based on a technical assessment of a region’s natural development potential combined with demonstrations of financial commitment by developers. The objective is to maximize energy delivery (megawatt-hours) while minimizing the amount of capacity (megawatts) needed to generate it. In turn, this ensures higher utilization of any extra-high voltage (EHV) or ultra-high voltage (UHV) transmission needed to deliver the power to load. U.S. wind REZs typically target areas where generators can attain capacity factors of 40% to 50% or higher.
A REZ process develops new transmission plans ahead of generator development. This differs from traditional U.S. practice, where planning for a large thermal central generating station is concurrent with its transmission because both take the same amount of time to build. Wind and solar generators take much less time to develop, which means building the needed EHV/UHV transmission has to begin years before the generation capacity would be installed. Otherwise, cost-effective wind and solar development could slow down while curtailments of operating wind and solar projects increase (EIA 2014).
In full practice, the steps in identifying REZs and their associated transmission build-out plans are as follows:
1. Complete a renewable energy resource assessment. Ideally, the assessment should model hourly wind and solar output for a typical meteorological year and should reflect geospatial differences with enough granularity to identify areas with relatively high capacity factors. It should also locate known geothermal heat potential.
2. Using information from the renewable energy resource assessment, identify study areas where capacity factors and production profiles are high. Using geographic information system analysis, develop and apply environmental screens to exclude known sensitive habitat and terrain features that make project development impractical.
3. Conduct an open season by which renewable energy developers provide tangible demonstrations of commercial interest in specific study areas.14
4. Conduct production cost modeling and economic analysis of transmission scenarios that would interconnect the study areas with the highest levels of demonstrated commercial interest (See the appendix for background on cost-benefit analysis, which is often used with production cost modeling in economic analyses of REZ options.)
14 An open season for transmission is when a transmission provider issues a request for proposals from bidders interested in purchasing transmission service for a specified period of time. Price may be what a bidder submits or may be set in advance before the request for proposals is issued.

28 This report is available at no cost from the National Renewable Energy Laboratory (NREL) at www.nrel.gov/publications.
5. Select REZs from study areas with the highest density of screened developable potential, greatest demonstrated commercial interest, and greatest potential for reducing system-wide production costs.
6. Approve a transmission build-out plan for the selected REZs.
In the United States, REZ policies have addressed both in-network and trans-regional transmission. Texas developed a collection of new 345-kilovolt (kV) lines that enabled high-quality wind zones, alleviated congestion, and improved voltage stability throughout the network (Figure 9). In the western United States, planning has focused on direct current (DC) lines of 500 kV or larger to move high-quality wind power across long distances to major load centers without affecting intermediate networks along the way (Figure 10).
Variations of the REZ model have been applied in RTO markets as well as in areas served by monopoly utilities. In both cases, the ultimate success depends on the legal and regulatory authority by which REZ selection leads to an approved transmission plan.
Figure 9. Wind REZs in ERCOT, with 345-kV lines connecting wind to network load Source: ERCOT 2008
Figure 10. REZs in the western United States, with proposed 500-kV DC line connecting Wyoming wind to load in
California Source: Western Governors’ Association 2009
3.6 Curtailing Renewable Resources Before they developed effective grid management tools, RTOs and utilities would, at times, curtail wind production for reliability reasons. The tools and practices described in the previous sections have reduced or eliminated many of the reasons for curtailment of wind and solar generators by grid operators (Bird 2014).
In RTOs, market auction mechanisms have systematized unit dispatch to the point that any congestion-related reduction in output for wind or solar generators is largely economic. Transfer limits can result in a “generation pocket” where the amount of generation connecting to a small part of the system is more than what the affected transmission lines can accommodate under

29 This report is available at no cost from the National Renewable Energy Laboratory (NREL) at www.nrel.gov/publications.
some circumstances. Thermal units with above-zero marginal costs will be the first units limited. If there is too much remaining generation priced at zero, the RTO’s operational protocols will determine how the limited dispatch capability is allocated physically. In some areas, U.S. wind generators have adopted negative pricing strategies: submitting an offer at a negative price to establish dispatch priority over offers priced at zero. 15 The resulting LMPs may then be negative, meaning that zero-priced offers are not dispatched and the lowest negative-priced offers must pay to be dispatched. Negative LMPs, if regular, can provide wind developers with a strong price signal to build in sites with little congestion, which facilitates larger-scale wind integration.
Most RTOs have market mechanisms that enable VG owners (and any other generator) to hedge congestion risk financially. These hedging mechanisms—often called congestion revenue rights (CRRs) or financial transmission rights—do not guarantee physical dispatch, but they can provide payments if congestion limits the flow of power out of a generation pocket. For example, consider the congestion illustrated in Figure 6 on page 10. The red high-LMP area in central Texas corresponds to San Antonio, one of the state’s largest load centers. Most of the state’s wind power is located in the blue low-LMP areas in the western part of the state. The difference between the two sets of LMPs constitutes “congestion rent”—higher wholesale power costs that San Antonio pays for power from a wind generator in West Texas because of transmission congestion.
A West Texas VG owner with a contract to provide renewable power to San Antonio may bid for CRRs in a competitive auction. If that owner succeeds in obtaining CRRs corresponding to hours when congestion rent from the VG to San Antonio is likely, the VG owner will receive a payment corresponding to the number of megawatt-hours represented by the CRRs held and the LMP differential. This CRR payment hedges against the chance of negative LMPs where the VG is located, as well as the chance of not being economically dispatched.
In monopoly utility territories where the grid operator uses a manual dispatch system without using LMPs, power purchase agreements can contain specific provisions addressing operator-ordered curtailments. Such clauses specify how much curtailment is accommodated within the terms of the power purchase agreement. This can have the effect of sharing the economic risk of curtailment between the generator and the utility rather than placing the risk solely on the generator (Bird 2014).
Control system improvements have enabled new wind and solar projects to provide some ancillary services. The result is that reductions once treated as operator-ordered curtailment can now function as ancillary service deployments with appropriate compensation to the wind or solar facility.
15 Negative-pricing strategies for wind were made possible financially by federal incentives that were paid on each megawatt-hour of production. Thus, a wind generator with a negative-priced offer might pay the RTO to be dispatched, but would still receive the value of the federal incentive.

30 This report is available at no cost from the National Renewable Energy Laboratory (NREL) at www.nrel.gov/publications.
4 Conclusions Wholesale power markets in the United States—those run by RTOs as well as transactions with and among traditional monopoly utilities—are diverse and evolving. The ability to manage higher grid penetrations of variable renewable resources has been part of that evolution.
Regardless of how China’s power market reforms unfold, one key lesson from U.S. experience is the need for adaptability. Market design—however it unfolds in China—should allow for future redesign and modifications to address problems that might not be apparent or foreseeable today. This is especially important for efficient integration of renewable resources in a way that takes advantage of the latest technologies.
Other approaches from U.S. experience that could be applicable to China include:
• Rate and payment structures that allow conventional thermal generators to recover capital costs separate from their variable operating costs
• Expanded use of wind and solar resource forecasting, particularly in day-ahead unit commitment and scheduling
• Enlarging the effective size of balancing areas, either through consolidation of existing balancing areas or the sharing of services such as energy imbalances
• Reducing the duration of operating intervals for scheduling so that information from wind and solar forecasts can help deploy flexible reserves (generators as well as demand response) more efficiently
• Incorporating large-scale renewable energy deployment into mainstream grid planning
• Designating REZs for large-scale EHV and UHV transmission development, directing new renewables to areas with the highest capacity factors
• Developing resources that can provide ancillary services to help integrate large amounts of wind and solar power.
Some of the renewables-friendly management tools described in this report are specific to the rapid time scale of RTO’s organized wholesale power markets. Because of the high degree to which all RTO operations are integrated, these tools simultaneously meet other market operation tasks such as congestion management. Including these tools in this review is not intended to imply the need or desirability of an RTO structure in China—a larger question that is far beyond the scope of this review, but is one that this report could help inform.
This report discusses several common VG integration strategies that have proven successful in the United States. The availability of flexible generation, the existing mix of generation resources, and the level of national and subnational transmission interconnection are some of the key factors. Effective VG integration strategies that are adapted to each particular set of circumstances will more likely lead to least cost solutions and maximize social benefits. The solutions China may develop could be different than what other countries, states, or provinces have done, and will contribute new chapters to the international dialogue on how to integrate VG in the most socially beneficial way.

31 This report is available at no cost from the National Renewable Energy Laboratory (NREL) at www.nrel.gov/publications.
References Ahlstrom, Mark, James Blatchford, Matthew Davis, Jacques Duchesne, David Edelson, Ulrich
Focken, Debra Lew, Clyde Loutan, David Maggio, Melinda Marquis, Michael McMullen, Keith Parks, Ken Schuyler, Justin Sharp, and David Souder. 2011. “Atmospheric Pressure: Weather, Wind Forecasting and Energy Market Operations.” IEEE Power and Energy Magazine. http://www.uwig.org/ahlstrom.pdf.
Ahlstrom, Mark. 2015. “Maximizing Wind and Solar Energy” Presentation before the Western Clean Energy, San Francisco, California; January 8, 2015.
Bird, Lori, Jaquelin Cochran, and Xi Wang. 2014. Wind and Solar Energy Curtailment: Experience and Practices in the United States. Golden, CO: National Renewable Energy Laboratory. http://www.nrel.gov/docs/fy14osti/60983.pdf.
Bird, Lori, Sari Fink, Mike Hogan, Dave Lamont, Brendan Kirby, Christina Mudd, Kevin Porter, Jennifer Rogers, and Lisa Schwartz. 2012. Meeting Renewable Energy Targets in the West at Least Cost: The Integration Challenge. Denver: Western Governors’ Association. www.westgov.org/reports/cat.view/95-reports/263-2012.
CAISO (California Independent System Operator). 2015. Benefits for Participating in EIM. (Quarterly Report). July 30, 2015. Folsom, CA: CAISO.
Chase, L., D. Larson, S. Oxley, and V. Ravenscroft. 2011. “Energy Imbalance Market.” Presentation at State-provincial Steering Committee meeting, San Diego, CA. http://www.westgov.org/EIMcr/documents/eim-spsc.pdf.
Chi, Yongning, and Shuanglei Feng, China Electric Power Research Institute (CEPRI). Email correspondence to Kevin Porter (on file with authors), August 19, 2015.
China Electric Power Research Institute. 2012. Project Report on Wind Power Forecasting System and Operating Mechanism. (In Chinese). http://www.efchina.org/Reports-zh/reports-20131002-zh.
China Meteorological Administration. 2014. “Notice on the Implementation Plan for National Meteorological Technology Innovation Projects.” State Council of the People’s Republic of China. (In Chinese). http://www.gov.cn/gongbao/content/2015/content_2827236.htm.
China News. 2015. “China’s Grid Connected Wind Generation Capacity Exceeds 100 GW for the First Time.” China News, March 23. (In Chinese). http://finance.chinanews.com/cj/2015/03-23/7151858.shtml.
Cochran, Jaquelin, Lori Bird, Jenny Heeter, and Douglas J. Arent. 2012. Integrating Variable Renewable Energy in Electric Power Markets: Best Practices from International Experience. Golden, CO: National Renewable Energy Laboratory. http://www.nrel.gov/docs/fy12osti/53732.pdf.

32 This report is available at no cost from the National Renewable Energy Laboratory (NREL) at www.nrel.gov/publications.
Cochran, Jaquelin, Mackay Miller, Michael Milligan, Erik Ela, Douglas Arent, Aaron Bloom, Matthew Futch, Juha Kiviluoma, Hannele Holtinnen, Antje Orths, Emilio Gómez-Lázaro, Sergio Martín-Martínez, Steven Kukoda, Glycon Garcia, Kim Møller Mikkelsen, Zhao Yongqiang, and Kaare Sandholt. 2013. Market Evolution: Wholesale Electricity Market Design for 21st Century Power Systems. Golden CO: National Renewable Energy Laboratory. http://www.nrel.gov/docs/fy14osti/57477.pdf.
Corbus, D.; Hurlbut, D.; Ibanez, E.; Milligan, M.; Brinkman, G.; Paduru, A.; Diakov, V.; and Hand, M. 2014. California-Wyoming Grid Integration Study: Phase 1—Economic Analysis. National Renewable Energy Laboratory. http://www.nrel.gov/docs/fy14osti/61192.pdf.
Cornell University Law School Legal Information Institute. 2015. “Eminent Domain.” Accessed October 20, 2015. https://www.law.cornell.edu/wex/eminent_domain.
Cowart, Richard. 2013. “Interconnection-Wide Planning.” Memorandum from the Department of Energy’s Electricity Advisory Committee to the Honorable Patricia Hoffman, Assistant Secretary for Electricity Delivery and Energy Reliability, U.S. Department of Energy. http://energy.gov/sites/prod/files/2013/06/f1/EAC_InteronRecs.pdf.
CREIA (Chinese Renewable Energy Industries Association). 2015. “Electricity Demand Growth Slows Down, Wind Curtailment Increases.” http://www.creia.net/news/headline/4367.html.
DOE (U.S. Department of Energy). 2015a. “Chapter 3: Modernizing the Electric Grid.” Quadrennial Energy Review: Energy Transmission, Storage, and Distribution Infrastructure. http://energy.gov/sites/prod/files/2015/08/f25/QER%20Chapter%20III%20Electricity%20April%202015.pdf.
———. 2015b. 2014 Wind Technologies Market Report. http://www.energy.gov/sites/prod/files/2015/08/f25/2014-Wind-Technologies-Market-Report-8.7.pdf.
EIA (U.S. Energy Information Administration). 2013. “Natural gas-fired combustion turbines are generally used to meet peak electricity load.” Today in Energy, October 1, 2013. http://www.eia.gov/todayinenergy/detail.cfm?id=13191.
———. 2014. “Fewer wind curtailments and negative power prices seen in Texas after major grid expansion.” Washington, DC: EIA. Accessed September 15, 2015. http://www.eia.gov/todayinenergy/detail.cfm?id=16831
———. 2015a. Form EIA-826. Data spreadsheets for various years. http://www.eia.gov/electricity/data/eia826/.
———. 2015b. “Capacity Factors for Utility Scale Generators Primarily Using Fossil Fuels, January 2013-July 2015.” Electric Power Monthly, September 24, 2015. http://www.eia.gov/electricity/monthly/epm_table_grapher.cfm?t=epmt_6_07_a.

33 This report is available at no cost from the National Renewable Energy Laboratory (NREL) at www.nrel.gov/publications.
Ela, E.; M. Milligan, A. Bloom, A. Botterud, A. Townsend, and T. Levin. 2014a. Evolution of Wholesale Electricity Market Design with Increasing Levels of Renewable Generation. Golden, CO: National Renewable Energy Laboratory. http://www.nrel.gov/docs/fy14osti/61765.pdf.
Ela, E; V. Gevorgian, P. Fleming, Y.C. Zhang, M. Singh, E. Muljadi, A. Scholbrook, J. Aho, A. Buckspan, L. Pao, V. Singhvi, A. Tuohy, P. Pourbeik, D. Brooks, and N. Bhatt. 2014b. Active Power Controls from Wind Power: Bridging the Gaps. Golden, CO: National Renewable Energy Laboratory. http://www.nrel.gov/docs/fy14osti/60574.pdf.
EPA (U.S. Environmental Protection Agency). 2015. Carbon Pollution Emission Guidelines for Existing Stationary Sources: Electric Utility Generating Units (“Clean Power Plan”). 40 CFR Part 60, RIN 2060-AR33. http://www2.epa.gov/sites/production/files/2015-08/documents/cpp-final-rule.pdf.
ERCOT (Electric Reliability Council of Texas). 2008. Competitive Renewable Energy Zone (CREZ) Transmission Optimization Study. System Planning Report submitted to the Public Utility Commission of Texas in Docket No. 33672, Commission Staff’s Petition for Designation of Competitive Renewable Energy Zones.
———. 2013. ERCOT Concept Paper: Future Ancillary Services in ERCOT. Draft. http://www.ercot.com/content/committees/other/fast/keydocs/2014/ERCOT_AS_Concept_Paper_Version_1.1_as_of_11-01-13_1445_black.doc.
———. 2015. “FAST Procurement and Pricing.” May 18, 2015 FAST workshop presentation. http://www.ercot.com/content/wcm/key_documents_lists/62398/FAS_Procurement_and_Pricing_5_18_15.pptx.
FERC (Federal Energy Regulatory Commission). 1996. “Order No. 888: Promoting Wholesale Competition Through Open Access Non-discriminatory Transmission Services by Public Utilities; Recovery of Stranded Costs by Public Utilities and Transmitting Utilities.” http://www.ferc.gov/legal/maj-ord-reg/land-docs/order888.asp.
———. 1999. “Order 2000: Regional Transmission Organizations.” http://www.ferc.gov/whats-new/comm-meet/2007/021507/E-1.pdf.
———. 2003. “Order No. 2003: Standardization of Generator Interconnection Agreements and Procedures.” https://www.ferc.gov/whats-new/comm-meet/072303/E-1.pdf.
———. 2007. “Order No. 890: Preventing Undue Discrimination and Preference in Transmission Service.” http://www.ferc.gov/whats-new/comm-meet/2007/021507/E-1.pdf.
———. 2011. “Order No. 1000: Transmission Planning and Cost Allocation by Transmission Owning and Operating Public Utilities.” http://www.ferc.gov/whats-new/comm-meet/2011/072111/E-6.pdf.
34 This report is available at no cost from the National Renewable Energy Laboratory (NREL) at www.nrel.gov/publications.
———. 2014a. 2014. “Order Conditionally Accepting and Suspending Proposed Tariff Revisions, Subject to Refund, and Establishing Hearing and Settlement Judge Procedures.” Docket Nos. ER14-1969-000 through 002.
———. 2014b. “Order Conditionally Accepting Tariff Revisions. Midcontinent Independent System Operator, Inc.” Docket No. ER14-2156-000.
———. 2015. “Regional Transmission Organizations (RTO)/ Independent System Operators (ISO).” Accessed September 15, 2015. http://www.ferc.gov/industries/electric/indus-act/rto.asp
Fink, Sari, Kevin Porter, Christina Mudd, and Brett Morgenstern. 2009. Wind Energy Curtailment Case Studies. Golden, CO: National Renewable Energy Laboratory. http://www.nrel.gov/docs/fy10osti/46716.pdf.
Fink, Sari, Kevin Porter, Christina Mudd, and Jennifer Rogers. 2011. A Survey of Transmission Cost Allocation Methodologies for Regional Transmission Organizations. Golden, CO: National Renewable Energy Laboratory. http://www.nrel.gov/docs/fy11osti/49880.pdf.
GE Energy. 2010. Western Wind and Solar Integration Study. National Renewable Energy Laboratory, Subcontract Report No. NREL/SR-550-47434. http://www.nrel.gov/docs/fy10osti/47434.pdf.
Hannele Holttinen, Hannele, Peter Meibom, Antje Orths, Frans van Hulle, Bernhard Lange, Mark O’Malley, Jan Pierik, Bart Ummels, John Olav Tande, Ana Estanqueiro, Manuel Matos, Emilio Gomez, Lennart Söder, Goran Strbac, Anser Shakoor, Joao Ricardo, J. Charles Smith, Michael Milligan, and Erik Ela. 2009. Design and Operation of Power Systems with Large Amounts of Wind Power. Paris: International Energy Agency. http://www.ieawind.org/AnnexXXV/PDF/Final%20Report%20Task%2025%202008/T2493.pdf.
Hummon, Marissa, Paul Denholm, Jennie Jorgenson, David Palchak, Brendan Kirby, Ookie Ma. 2013. Fundamental Drivers of the Cost and Price of Operating Reserves. Golden, CO: National Renewable Energy Laboratory. http://www.nrel.gov/docs/fy13osti/58491.pdf.
Kirby, Brendan. 2007. Ancillary Services: Technical and Commercial Insights. Report prepared for Wartsila. http://www.science.smith.edu/~jcardell/Courses/EGR325/Readings /Ancillary_Services_Kirby.pdf.
Lew, Debra, and Greg Brinkman. 2013. The Western Wind and Solar Integration Study Phase 2. Golden, CO: National Renewable Energy Laboratory. http://www.nrel.gov/docs/fy13osti/55588.pdf.
Lew, Debra, Michael Milligan, Gary Jordan, and Richard Piwko. 2011. The Value of Wind Power Forecasting. Golden, CO: National Renewable Energy Laboratory. http://www.nrel.gov/wind/systemsintegration/pdfs/2011/lew_value_wind_forecasting.pdf.
35 This report is available at no cost from the National Renewable Energy Laboratory (NREL) at www.nrel.gov/publications.
Li, Canbing, Su Lu, Yijia Cao, Lina He, Wei Zhang, and Zixia Cheng. 2012 “A New Method for Day-Ahead Unit Commitment Based on Energy-Saving Generation Dispatching.” Proceedings of the CSEE, China. Soc. For Elec. Eng. 32:70–76.
Liu, Jian, Dongxiao Niu, Mian Xing, Lei Guo, and Shaoming Zheng. 2014 “Research and Strategy of Dynamic Electricity Price Based Real-Time Dispatching Pricing of New Energy.” Power System Technology 38:1346–1351.
Luo, Guo-liang, Fei Zhi, and Xinying Zhang. 2012. “Inconsistencies between China’s Wind Power Development and Grid Planning: An Institutional Perspective.” Renewable Energy 48:52–56.
Milligan, Michael, Bethany Frew, Ella Zhou, and Doug Arent. 2015. Advancing System Flexibility for High Penetration Renewable Integration. Golden, CO: National Renewable Energy Laboratory.
Mills, Andrew, and Ryan Wiser. 2010. Implications of Wide-Area Geographic Diversity for Short-Term Variability of Solar Power. Berkeley, CA: Lawrence Berkeley National Laboratory. http://emp.lbl.gov/sites/all/files/REPORT%20lbnl-3884e.pdf.
MISO (Midcontinent Independent System Operator). 2015. “LMP Contour Map and Table.” Accessed September 15, 2015. https://www.misoenergy.org/LMPContourMap/MISO_All.html.
Monitoring Analytics, LLC. 2012. “Section 9: Ancillary Service Markets.” Quarterly State of the Market Report for PJM: January through September. http://www.monitoringanalytics.com/reports/PJM_State_of_the_Market/2012/2012q3-som-pjm-sec9.pdf.
———. 2015. “Section 10: Ancillary Service Markets.” 2014 State of the Market Report for PJM. pp. 335–387. http://www.monitoringanalytics.com/reports/PJM_State_of_the_Market/2014/2014-som-pjm-volume2-sec10.pdf.
NDRC (National Development and Reform Commission). 2015. Guiding Opinions on Optimizing Power Sector Operation and Scheduling, Promoting Clean Energy. Beijing: NDRC and National Energy Agency (China).
NERC (North American Electric Reliability Corporation). 2010. Variable Generation Power Forecasting for Operations. Princeton, NJ: North American Electric Reliability Corporation. http://www.nerc.com/docs/pc/ivgtf/Task2-1%285.20%29.pdf.
———. 2014. Essential Reliability Services Task Force: A Concept Paper on Essential Reliability Services that Characterizes Bulk Power System Reliability. Princeton, NJ: North American Electric Reliability Corporation. http://www.nerc.com/comm/Other/essntlrlbltysrvcstskfrcDL/ERSTF%20Concept%20Paper.pdf.

36 This report is available at no cost from the National Renewable Energy Laboratory (NREL) at www.nrel.gov/publications.
Nevada Revised Statutes. 2013. Regulation of Public Utilities Generally. Section 704.110(13).
NOAA (National Oceanic and Atmospheric Administration). 2015. “Numerical Weather Prediction.” Accessed October 27, 2015. https://www.ncdc.noaa.gov/data-access/model-data/model-datasets/numerical-weather-prediction.
Pan, Jingdong, and Kai Xie. 2006. “Optimization Principle of Locational Marginal Pricing.” Automation of Electric Power Systems 30:38–42.
Pfeifenberger, Joannes, Judy Chang, Akarsh Sheilendranath. 2015. Toward More Effective Planning: Addressing the Costs and Risks of an Insufficiently Flexible Electricity Grid. Prepared for WIRES Group. http://wiresgroup.com/docs/reports/WIRES%20Brattle%20Rpt_TransPlanning_042315.pdf.
Piwko, Richard. 2009. “The Value of Wind Power Forecasting.” Presentation before the Utility Wind Integration Group Workshop on Wind Forecasting Applications for Utility Planning and Operations, Phoenix, AZ, February 18–19. http://www.nrel.gov/wind/systemsintegration/pdfs/2011/lew_value_wind_forecasting.pdf.
PJM Interconnection. 2015. PJM Manual 18: PJM Capacity Market. Rev. 28. http://pjm.com/~/media/documents/manuals/m18.ashx.
Porter, Kevin, Kevin Starr, and Andrew Mills. 2015. Variable Generation and Electricity Markets. Utility Variable-Generation Integration Group. May 18. http://uvig.org/newsroom/#!/6596/updated-summary-of-status-of-variable-generation-in-electricity-markets-released.
Porter, Kevin, Sari Fink, Jennifer Rogers, Christina Mudd, Michael Buckley, and Cali Clark. 2012. Task Report: Review of Industry Practice and Experience in the Integration of Wind and Solar Generation. PJM Renewable Integration Study. https://www.pjm.com/~/media/committees-groups/subcommittees/irs/postings/pris-task3b-best-practices-from-other-markets-final-report.ashx.
Public Service Company of Colorado. 2014. “Proposed Tariff Revisions.” FERC Docket ER14-1969. May 15.
Puget Sound Energy. 2015. “Energy Imbalance Market.” Accessed October 23, 2015. https://pse.com/aboutpse/EnergySupply /Pages/Energy-Imbalance-Market.aspx.
RAP (Regulatory Assistance Project). 2014. Integrating Renewable Energy into Power Systems in China: A Technical Primer. Beijing: RAP. http://www.raponline.org/document/download/id/7459.
Shi, Lei, Zhaowei Geng, Jing Zhang, Jianxun Song, Qixin Chen, Junhong Guo, and Hao Zhang. 2014. “Risk-Adaptable Monthly Generation Scheduling Mode.” Power System Technology 38:3384–3389.

37 This report is available at no cost from the National Renewable Energy Laboratory (NREL) at www.nrel.gov/publications.
State Council of People’s Republic of China. 2015. Opinions Regarding the Deepening of the Power Sector’s Reform. Beijing: The Central Committee of the Communist Party of China and the State Council of People’s Republic of China.
Sun, Yujun, Yang Li, Beibei Wang, Huiling Su, and Xiaocong Liu. 2014. “A Day-Ahead Scheduling Model Considering Demand Response and Its Uncertainty.” Power System Technology 38:2708–2714.
The General Office of the State Council (China). 2007. “Notice of the General Office of the State Council on the Forwarding of Measures on Energy-Saving Generation Dispatching (for Trial Implementation) by National Development and Reform Commission and Other Agencies.” (In Chinese). http://www.sdpc.gov.cn/zcfb/zcfbqt/200708/t20070828_156042.html.
Treadway, Nat. 2015. ABACCUS 2015: Annual Baseline Assessment of Choice in Canada and the United States. Distributed Energy Financial Group. July 28. http://defgllc.com/publication/abaccus-2015-annual-baseline-assessment-of-choice-in-canada-and-the-united-states/.
Wang, Xin-xing, and Hui Zhou. 2007. “Calculation of Locational Marginal Price Based on Primal-Dual Interior Point Method.” Power System Technology 31:23–28.
Western Governors’ Association. 2009. Western Renewable Energy Zones—Phase 1 Report. Joint Initiative of the Western Governors’ Association and the U.S. Department of Energy. Denver.
Widiss, Rebecca, and Kevin Porter. 2014. A Review of Variable Generation Forecasting in the West: July 2013 – March 2014. Subcontract Report. Golden, CO: National Renewable Energy Laboratory. http://www.nrel.gov/docs/fy14osti/61035.pdf.
Wong, Sue-lin, and Charlie Zhu. 2015. “Chinese Wind Earnings under Pressure with Fifth of Farms Idle.” Reuters, May 17. http://www.reuters.com/article/2015/05/17/china-windpower-idUSL3N0Y24DM20150517
Xia, Qing, Haiwang Zhong, and Chongqing Kang. 2013. “Review and Prospects of the Security Constrained Unit Commitment Theory and Application.” Proceedings of the CSEE, Chin. Soc. For Elec. Eng. 33:94–103.
Xiao, Qiang. 2015. “China’s Wind Generation Installation Accounts for One Quarter of the World’s Installations.” China Energy News 02, February 9. (In Chinese.) http://paper.people.com.cn/zgnyb/html/2015-02/09/content_1532917.htm.
Xinhua. 2015. “Inner Mongolia tops grid-connected wind generation capacity in China.” (In Chinese.) Xinhua, May 4. http://www.nmg.xinhuanet.com/xwzx/2015-05/04/c_1115161901.htm.
Zavadil, Robert, Nicholas Miller, Glenn Van Knowe, John Zack, Richard Piwko, and Gary Jordan. 2009. Technical Requirements for Wind Generation Interconnection and Integration. 128 pp. http://www.uwig.org/ISONEFinal16Nov09Interconnectionreqnewis_report.pdf.

38 This report is available at no cost from the National Renewable Energy Laboratory (NREL) at www.nrel.gov/publications.
Zhang, Senlin, and Yanming Sun. 2013. “Design of Two-Part Grid Purchase Price Mechanism based on Energy Conservation Generation Dispatching.” Power System Technology 37:1304–1310.
Zhao, X., S. Zhang, R. Yang, and M. Wang. 2012. “Constraints on the Effective Utilization of Wind Power in China: An Illustration from the Northeast China Grid.” Renewable and Sustainable Energy Reviews 16:4508–4514.
Appendix: Cost-Benefit Analysis Nearly every grid operator in the United States uses cost-benefit analysis to decide whether and where to add new transmission. Cost-benefit analysis can measure the net social benefit of EHV or UHV transmission to a high-quality wind area, so that it can be compared to the net social benefit of developing inferior wind resources that require no new transmission.
Cost-benefit analysis begins with the cost of a proposed transmission line. In U.S. applications, this involves three primary inputs:
• Project cost (capital costs plus the cost of permitting, taxes, contingencies, and other factors)
• The economic life of the project (the time over which all capital costs are to be recovered)
• The interest rate, often calculated as the weighted average cost of capital.
These inputs annualize the total cost so that they can be appropriately compared with annual benefits, which commonly include reduced production costs (including reduced congestion and redispatch costs), improved reliability, and other avoided capital costs. Other types of benefits can be included to the extent they can be monetized. If the anticipated costs and benefits differ from year to year, planners apply a net present value calculation.
Outcomes are expressed as a benefit-to-cost ratio. Benefits are greater than costs if the ratio is above 1.0, but in many instances planners look for a ratio significantly above that level as a clearer indication of social benefit. U.S. federal guidelines use an indicative threshold of 1.25.
A robust cost-benefit analysis includes sensitivity analysis for factors that are difficult to predict. In most U.S. power markets, the price of wholesale power—and consequently production costs—varies based on the price of natural gas. Another source of uncertainty is the future cost of wind and solar generation, both of which have been declining in recent years.
One example of cost-benefit analysis applied to renewable energy development involves EHV transmission to bring wind power from Wyoming to California, roughly equivalent to the distance between West Inner Mongolia and Beijing. Wyoming wind has annual capacity factors in excess of 50%; California has the largest load centers in the western United States. For this cost-benefit analysis, the National Renewable Energy Laboratory (NREL) modeled the cost of a 500-kV DC transmission line and several sources of potential savings, including:
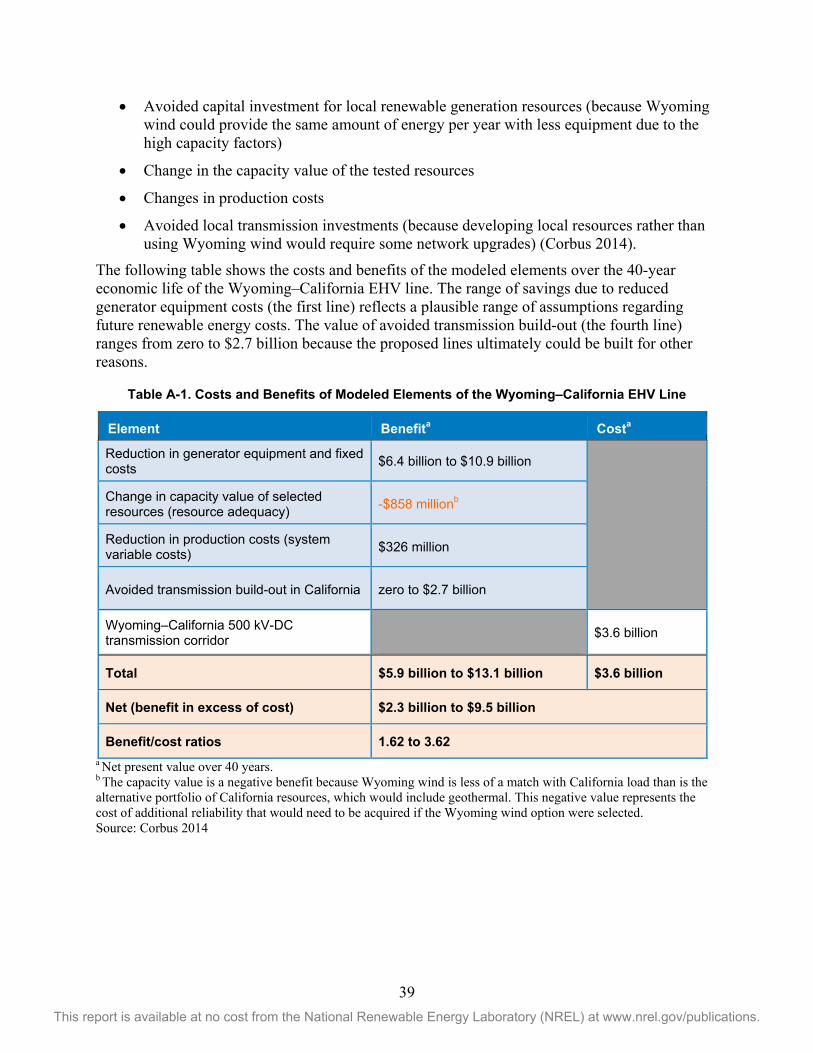
39 This report is available at no cost from the National Renewable Energy Laboratory (NREL) at www.nrel.gov/publications.
• Avoided capital investment for local renewable generation resources (because Wyoming wind could provide the same amount of energy per year with less equipment due to the high capacity factors)
• Change in the capacity value of the tested resources
• Changes in production costs
• Avoided local transmission investments (because developing local resources rather than using Wyoming wind would require some network upgrades) (Corbus 2014).
The following table shows the costs and benefits of the modeled elements over the 40-year economic life of the Wyoming–California EHV line. The range of savings due to reduced generator equipment costs (the first line) reflects a plausible range of assumptions regarding future renewable energy costs. The value of avoided transmission build-out (the fourth line) ranges from zero to $2.7 billion because the proposed lines ultimately could be built for other reasons.
Table A-1. Costs and Benefits of Modeled Elements of the Wyoming–California EHV Line
a Net present value over 40 years. b The capacity value is a negative benefit because Wyoming wind is less of a match with California load than is the alternative portfolio of California resources, which would include geothermal. This negative value represents the cost of additional reliability that would need to be acquired if the Wyoming wind option were selected. Source: Corbus 2014
Element Benefita Costa
Reduction in generator equipment and fixed costs $6.4 billion to $10.9 billion
Change in capacity value of selected resources (resource adequacy) -$858 millionb
Reduction in production costs (system variable costs) $326 million
Avoided transmission build-out in California zero to $2.7 billion
Wyoming–California 500 kV-DC transmission corridor
$3.6 billion
Total $5.9 billion to $13.1 billion $3.6 billion
Net (benefit in excess of cost) $2.3 billion to $9.5 billion
Benefit/cost ratios 1.62 to 3.62