Embed Size (px)
Citation preview
© 2014 Navigant Consulting, Inc.
NSTAR Urban Grid
Monitoring and Renewables
Integration
Technical Performance Report
Prepared for:
U.S. Department of Energy
On behalf of NSTAR Gas and Electric Corporation
Prepared by:
Stuart Schare, Director
Robin Maslowski
Tim Stanton
Navigant Consulting, Inc.
1375 Walnut Street
Suite 200
Boulder, CO 80302
303.728.2500
www.navigant.com
September 22, 2014
NSTAR Urban Grid Monitoring –Technical Performance Report Page ii September 22, 2014
Table of Contents
Executive Summary ................................................................................................................... 1
1 Scope .................................................................................................................................... 3
1.1 Project Team ......................................................................................................................................... 3
1.2 Project Objectives ................................................................................................................................ 4
1.3 System Design and Technologies ...................................................................................................... 4
1.4 Project Schedule and Decision Points............................................................................................... 8
1.5 Smart Grid Functions and Benefits ................................................................................................... 9
2 Technical Approach ........................................................................................................ 12
2.1 Project Plan......................................................................................................................................... 12
2.2 Data Collection and Benefits Analysis ........................................................................................... 12
2.3 Interoperability and Cyber Security Approach ............................................................................ 14
3 Results ............................................................................................................................... 16
3.1 Operation of Smart Grid Technologies and Systems ................................................................... 16
3.2 System Design Changes ................................................................................................................... 16
3.3 Impact Metrics and Benefits Analysis ............................................................................................ 18
4 Conclusions ...................................................................................................................... 19
NSTAR Urban Grid Monitoring –Technical Performance Report Page 1 September 22, 2014
Executive Summary
NSTAR Electric & Gas Corporation (“NSTAR”) is in the process of enhancing the grid monitoring
instrumentation on one of its secondary area network grids, the Boston Area 492 North Grid, in
downtown Boston, MA to provide unprecedented visibility into the operation of the grid. Using state-of-
the-art sensor equipment along with a novel, low-cost approach to monitoring current and conductor
temperature, NSTAR is in the process of greatly improving its understanding of grid status and behavior
and allowing for proactive maintenance that improves safety and increases reliability. The visibility
gained from this effort also offers the promise of increased capability for solar photovoltaics (PV)
distributed generation (DG) injection. The results and knowledge gained from this demonstration will be
broadly applicable to secondary area network grids in other urban areas across the U.S.
This Urban Grid Monitoring and Renewables Integration project is supported by the U.S. Department of
Energy through the Smart Grid Demonstration Program grant.
Project Scope
To accomplish the demonstration, NSTAR has deployed advanced sensors and instrumentation on one
of the 12 secondary area network grids that it operates in Boston, covering 436 nodes located within
manholes downtown. A Collection Server at one of the NSTAR’s Operations Centers collects data and
alarms from these sensors via various forms of electronic communication. NSTAR also enhanced
monitoring at distribution feeders to better characterize the supply side of the power flow onto the
distribution grid. Finally, NSTAR installed AMR meters and PV power meters at customer-owned solar
installations to monitor power flow to specific customers and obtain in-depth information about the
behavior of these installations in addition to the power flow on the nearby section of the grid.
Project Status
As of the date of this report, NSTAR has installed all grid monitoring, communications, and data
collection equipment. The project is now entering the data analysis phase, which consists of extensive
data analysis and commissioning in order to better understand the operational characteristics of the
secondary network and to investigate visibility for integration of PV DG.
Outcomes/Benefits
The broad benefits expected from the overall the project include:
• Greatly improving visibility into the status of the urban grid, both in terms of near real-time
information about load distribution and of improved understanding of the grid asset
inventory and condition.
• Investigating the visibility for integration of distributed generation such as PV.
• Enabling NSTAR to safely test inverter-based distributed resource integration (e.g. solar PV
installations) into the secondary area network grid.

NSTAR Urban Grid Monitoring –Technical Performance Report Page 2 September 22, 2014
• Assisting in the development of preventive maintenance programs for secondary area
networks in urban areas.
• Laying the groundwork for nationwide deployment of inverter-based distributed resources in
major urban areas across the U.S., which NSTAR and other utilities have not yet significantly
pursued due to safety and grid stability concerns.
• Applying the lessons learned from this demonstration to other secondary area networks in
urban areas across the country.
NSTAR Urban Grid Monitoring –Technical Performance Report Page 3 September 22, 2014
1 Scope
NSTAR Electric & Gas Corporation (“NSTAR”) is conducting the Urban Grid Monitoring and
Renewables Integration demonstration project to enhance the grid monitoring instrumentation on one of
its secondary area network grids, the Boston Area 492 North Grid, in downtown Boston, MA and
provide unprecedented visibility into the operation of the grid. Using state-of-the-art sensor equipment
along with a novel, low-cost approach to monitoring current and conductor temperature, NSTAR is in
the process of greatly improving its understanding of grid status and behavior and allowing for
proactive maintenance that improves safety and increases reliability. The visibility gained from this
effort also offers the promise of increased capability for solar photovoltaics (PV) distributed generation
(DG) injection, which has not generally been possible on this type of grid in the past. The results and
knowledge gained from this demonstration are broadly applicable to secondary area network grids in
other urban areas across the U.S.
This Urban Grid Monitoring and Renewables Integration project is supported by the U.S. Department of
Energy through the Smart Grid Demonstration Program grant.
1.1 Project Team
Key members of the demonstration project team include the following:
NSTAR leverages team members from a range of functional organizations, including, Substation and
Transmission Engineering, IT, Planning, Investment Planning, Project Management, and various
technical contributors serving as subject matter experts.
DigitalGrid, Inc. is the vendor supplying the major node sensor technology, the communications
technology to report the sensor readings, and integration of this information into the Collection Server
that serves as the data repository. They also supply expertise to assist in the technology deployment and
integration effort.
Softstuf, Inc. is the vendor supplying the minor node technology as well as expertise in the installation
and troubleshooting of this new technology. NSTAR and Softstuf, Inc. have jointly developed the minor
node technology approach and have an agreement in place for the commercialization of this technology.
Tendril Networks, Inc. is the vendor supplying the equipment installed at the customer premise,
including the technology used to monitor and disconnect, if necessary, the customer solar PV installation
from the grid.
Bahwan CyberTek, Inc. is conducting stability analysis of the minor nodes in order to determine proper
operation of the system and the viability of PV, plug-in hybrids, and battery storage integration.

NSTAR Urban Grid Monitoring –Technical Performance Report Page 4 September 22, 2014
1.2 Project Objectives
The specific objectives of this demonstration include the following:
• Improve visibility into the status of the urban grid, both in terms of near real-time
information about load distribution and in terms of improved understanding of the grid
asset inventory and condition.
• Use the knowledge gained from the project to help investigate the visibility for integration of
distributed generation such as PV.
• Enable NSTAR to safely test inverter-based distributed resource integration (e.g. solar PV
installations) into the secondary area network grid.
• Assist in the development of preventive maintenance programs for secondary area networks
in urban areas.
• Lay the groundwork for nationwide deployment of inverter-based distributed resources,
such as solar PV and electric vehicles in major urban areas across the U.S., which is seldom
pursued due to safety and grid stability concerns.
• Apply the lessons learned from this demonstration to other secondary area networks in
urban areas across the country.
1.3 System Design and Technologies
NSTAR operates 12 secondary area network grids in downtown Boston, with grid points covered by
approximately 4,600 manholes across the metro area. This project has deployed additional sensors and
monitoring instrumentation within one of these secondary area network grids, covering more than 400
manholes with various instrumentation grid points. NSTAR selected the specific grid based on the mix
of commercial and residential customer sites, as well as recent customer interest for PV type solar
integration. The monitoring effort will maximize safety as well as knowledge gained about the behavior
of the grid near distributed solar installations.
Figure 1 shows the overall topology of the project, with the “urban grid monitoring” occurring on the
secondary area network and the “renewables integration” enhancements appearing at the customer
premise. Each project component is described in more detail below.
NSTAR Urban Grid Monitoring –Technical Performance Report Page 5 September 22, 2014
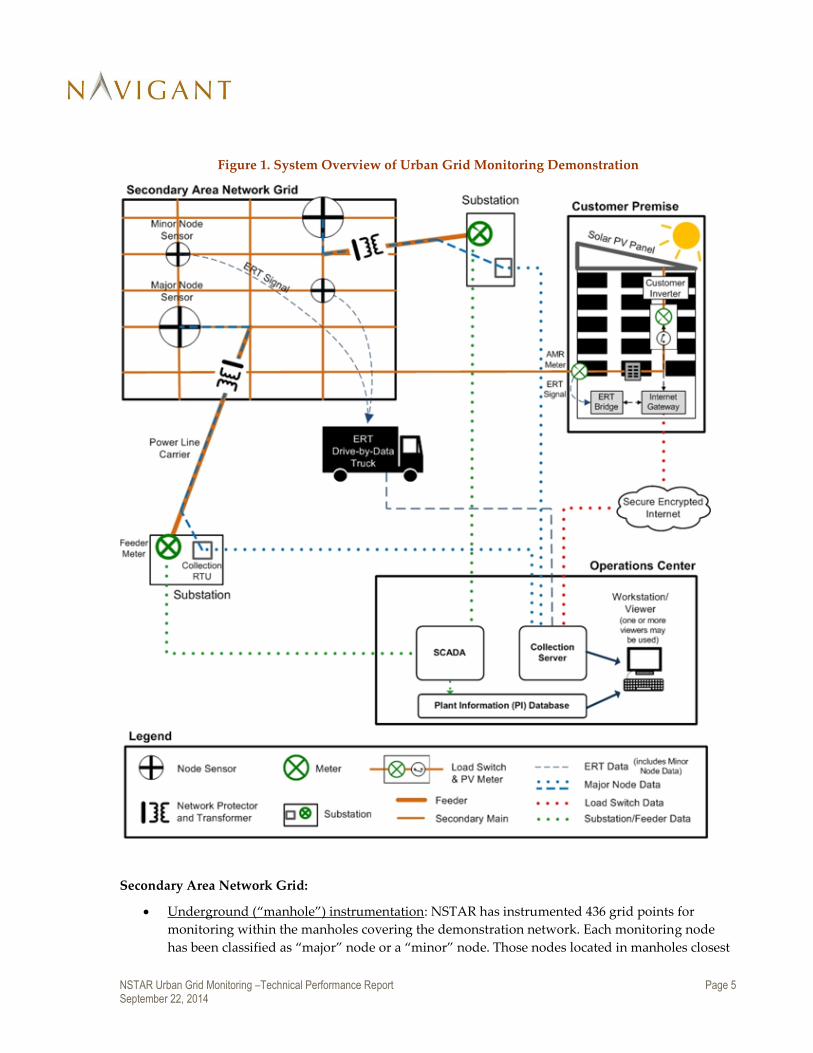
Figure 1. System Overview of Urban Grid Monitoring Demonstration
Secondary Area Network Grid:
Underground (“manhole”) instrumentation: NSTAR has instrumented 436 grid points for
monitoring within the manholes covering the demonstration network. Each monitoring node
has been classified as “major” node or a “minor” node. Those nodes located in manholes closest

NSTAR Urban Grid Monitoring –Technical Performance Report Page 6 September 22, 2014
to the network transformers (grid supply sources) and power exchanges (multiple connections
points in the grid) have current limiters that serve high density loads and are considered
“major” nodes. Those nodes serving the remainder of the load, which are in manholes located on
the secondary lines between the major nodes in the secondary grid and customers, are
considered “minor” nodes. There are currently 126 “major” nodes and 310 “minor” nodes
instrumented with these capabilities.
o Minor Nodes: Minor nodes have been instrumented with sensors that detect high and
low current and cable temperature threshold values on individual secondary-main
cables within a grid-point. Presently, there is no low-cost means to determine if or when
underground secondary mains (cables) on a particular grid are “broken” (open) or
overloaded due to an “open limiter.” Since utilities cannot remotely monitor these
secondary limiters, when enough of them incorrectly become "open," the remaining
secondary mains and their limiters start to become overloaded and can cause an
increased risk of fire or wide area power outages, which can cause the shutting down of
the network grid to make repairs. The installation of the monitors near the "limiter" in
the manhole will detect when the limiter is open or becoming overloaded, thereby
improving the performance of the grid.
Originally, NSTAR intended to equip these nodes with an AMR type radio transmitter
that would allow drive-by collection of this information. However, during the research
and development of the minor nodes, NSTAR realized the importance of near real-time
communication with the nodes. As a result, NSTAR updated the communication
medium within the node to communicate over the existing wireless cell
network. Wireless communications now provide NSTAR with near real-time alerts
when low-current and high-temperature conditions takes place.
o Major Nodes: Major nodes have been instrumented with DigitalGrid, Inc. technology,
which provides current sensing on a real time basis. These nodes are also equipped with
power line carrier technology that allows near real-time monitoring at the operations
center. The major nodes are able to monitor the secondary mains current on a real time
basis and provide information remotely on the status of the grid. Based on the
information received, the system operators will be able to take appropriate actions to
remedy any unusual event, thereby improving the performance level of the grid.
Network transformers: These are insulating fluid-filled three phase transformers specifically
designed and built to withstand high overload and short circuit current. These transformers are
typically installed in vaults and manholes, and are fed by primary cables (at 13.8kV) and the
secondary connected to the network at 208/120V. The network transformers are connected to the
primary mains, which are interlaced, and adjacent transformers are fed by different feeders. The
interlacing is arranged so that an outage of one feeder does not seriously impair voltage
regulation on the network grid and the load will be picked up over the secondary grid by
transformers on other feeders.
Network protectors: A network protector is installed on the secondary side of each network
transformer. The load side of the network protector is connected to the secondary grid. The
operation of the network protectors is based on two principles:
NSTAR Urban Grid Monitoring –Technical Performance Report Page 7 September 22, 2014
o Automatic opening of the network protectors when a primary feeder breaker is opened
or in the event of a fault on a primary feeder or in a network transformer.
o Automatic closing of network protectors to connect the network transformers to the
secondary grid when the primary feeder is energized.
Feeder data meters and collection RTUs: The original project plan also called for two substations
that supply the demonstration grid to be outfitted with advanced RTUs to better understand the
operating parameters at the substation. However, through field investigation, NSTAR
determined that the existing feeder data meters and collection RTUs are sufficient for the
purposes of this project and thus no upgrades to this equipment are required at this time.
NSTAR will reassess whether additional equipment is needed closer to the end of the data
analysis phase.
Customer Premise Equipment:
AMR Meter: Will be installed at customer owned solar installation sites for customers who are
integrating solar PV. NSTAR is not replacing or upgrading its back-end metering systems as part
of this project.
Encoder Receiver Transmitter (ERT) bridge and internet gateway: Will be installed at applicable
customer premises. These devices, supplied by Tendril Networks, will be used to communicate
interval meter reads to NSTAR.
Customer PV installation
Load switch/PV meter device: Will be installed within the customer premise for each PV
installation and will communicate using customer broadband connectivity.
Communications:
Cellular network: Used to communicate with the minor nodes.
Power Line Carrier (PLC): Used to communicate with the major nodes.
Data Analysis Systems:
Collection server: The information from the sensors and AMR meters are sent to a repository,
which is implemented on a collection server. The load parameters are analyzed and appropriate
actions taken to safely operate the secondary network. This improves overall understanding of
the system dynamics and planning of the network grid.
SCADA: Information from the feeder data meters are directly forwarded to SCADA including
alarm points. This data is then forwarded to PI.
Plant Information Database (PI): Information from SCADA is forwarded to the Plant
Information (PI) system, which is an NSTAR client-server database system that provides
information from field instrumentation to appropriate desktop computers throughout the
organization. This makes it possible for multiple functional organizations, including
Engineering, Planning, Dispatch, etc. to use this data for improving planning and operations.

NSTAR Urban Grid Monitoring –Technical Performance Report Page 8 September 22, 2014
NSTAR does not anticipate removing the monitoring devices. Assuming the demonstration continues
yielding successful results, the demonstration will continue to operate into the future.
NSTAR’s approach for the interoperability and cyber security of these technologies is discussed in
Section 2.3.
1.4 Project Schedule and Decision Points
NSTAR’s Urban Grid Monitoring and Renewables Integration project began in Q4 of 2010. As of Q3 of
2014, NSTAR has installed all project-related grid monitoring, communications, and data collection
equipment. The project is now entering the data analysis phase, which consists of system commissioning
and extensive data analysis in order to maximize the potential for PV distributed generation injection
within the network area as well as other DG options.
The current statuses of the key decision points outlined in NSTAR’s Project Management Plan are
presented below and a more detailed project schedule can be found in Appendix A.
Decision Point 1: Minor Node Instrumentation Viability Review
Description: The minor node sensors that NSTAR is currently testing for low-cost urban grid monitoring
are unique to NSTAR and have never been deployed on a large-scale basis. The vendor of these sensors,
Softstuf, Inc., also provides expertise in the installation and troubleshooting of the technology.
Criteria: Cable load and temperature flag data is must be >80% readable and determined to be accurate
at the Collection Server, ensuring that the data is available for analysis and operational decision making.
Status: As of January 22, 2014, there was 100% installation of 13 Itron and 297 Nighthawk minor nodes,
with the Nighthawk server successfully providing a log of date and times of alarms.
Decision Point 2: Preliminary Design and NEPA Compliance Review
Description: Before making significant resource investments in equipment procurement and installation,
NSTAR will seek approval to proceed with the final project design and construction. This will occur
upon completion of the system design process and approval from the DOE based on full NEPA
compliance.
Criteria: Passage of the NEPA Compliance Review.
Status: NEPA Compliance Review passed.
Decision Point 3: Major Node Communications Systems Review
Description: Issues communicating with DigitalGrid systems have occurred in NSTAR’s network in the
past. DigitalGrid and NSTAR have since made significant progress towards addressing these issues and
DigitalGrid systems are currently functioning as intended across NSTAR’s network; NSTAR does not
anticipate future problems. However, it is worth noting that the inability to consistently communicate
with the major nodes would require a change in project approach.

NSTAR Urban Grid Monitoring –Technical Performance Report Page 9 September 22, 2014
Criteria: Cable data on the following attributes--cable load condition, cable voltage, temperature-- is
determined to be > 90% available at the Collection Server and the readings are determined to be accurate.
Status: As of January 2, 2014, the DG4001 server was successfully collecting data from 126 major nodes
with sufficient coverage.
Decision Point 4: Operational Readiness Review
Description: At the end of 2013, NSTAR will have a fully installed, integrated, and tested system with
trained staff. With these benchmarks in place, NSTAR will seek approval to proceed with
Commissioning and Operations.
Criteria: Approval of the DOE after readiness review.
Status: All equipment installed, operated, and tested. NSTAR received DOE approval to proceed.
Decision Point 5: Review of System Readiness for PV Integration
Description: Once the software and database components are in place, the data collected will be
analyzed for proper system operation. Based on the analysis results, determination will be made
regarding the viability of allowing PV generation to interface with the secondary network urban grid.
The PMP will be updated as needed to include the impact of this significant project decision on the
project scope of activities and benefits.
Criteria: The system will be determined to be ready for PV integration once monitoring near the PV
installation determines that there has been no recent, inadvertent operation of Network Protectors
(described in more detail below) in the region of the install.
Status: NSTAR contracted Bahwan Cybertek, Inc. to analyze the system data for proper operation and
determine the viability of PV integration. This contract was awarded on 5/30/2014 and is scheduled for
completion by 11/30/2014. Upon completion of this contract, NSTAR will have the ability to continuously
collect and analyze data via an application designed by Bahwan Cybertek, Inc.
1.5 Smart Grid Functions and Benefits
The primary smart grid function of the Urban Grid Monitoring and Renewables Integration
demonstration project is the Diagnosis & Notification of Equipment Condition, which will facilitate the
increased deployment of distributed resources on NSTAR’s secondary area networks.
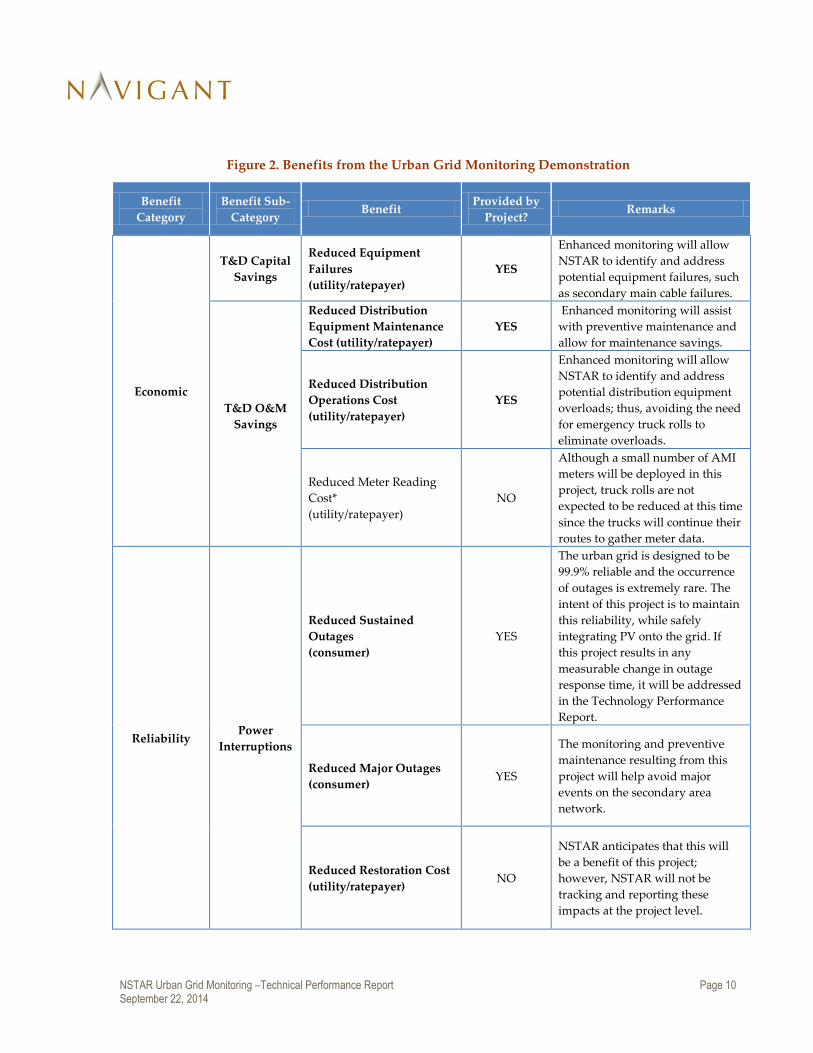
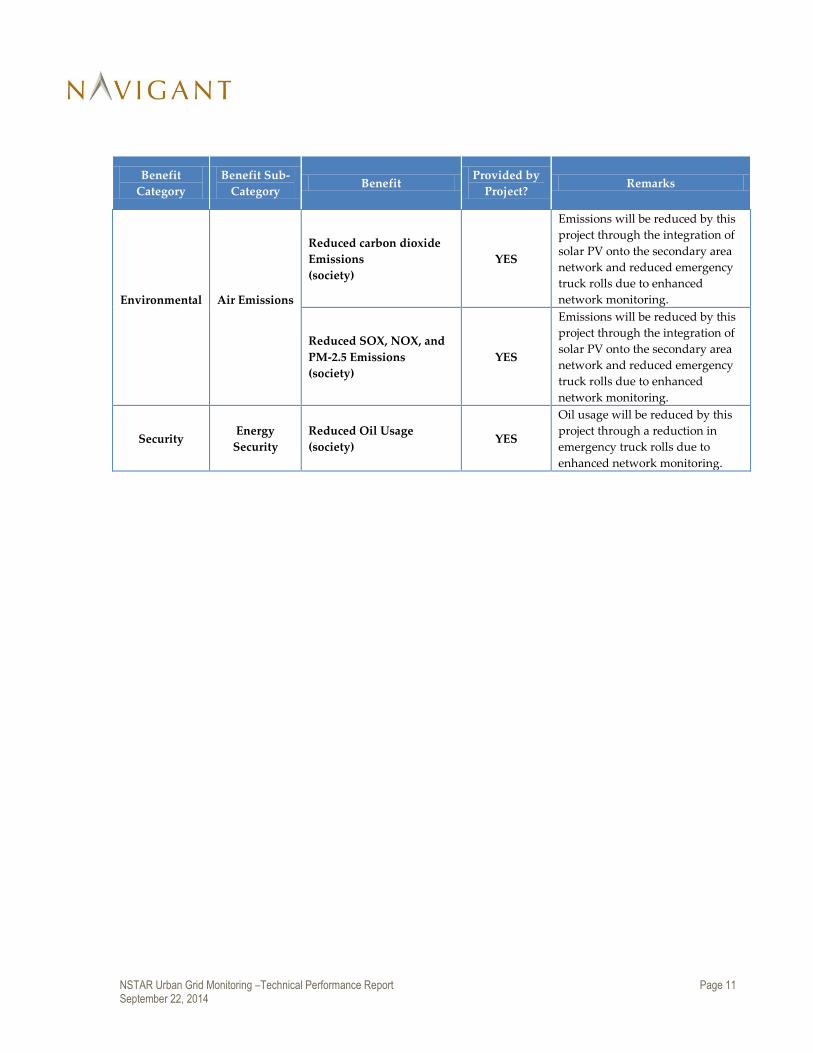
The following table summarizes the smart grid benefits of the project by economic, reliability,
environmental, and security categories. These benefits are also outlined in NSTAR’s Metrics and Benefits
Reporting Plan.
NSTAR Urban Grid Monitoring –Technical Performance Report Page 10 September 22, 2014
Figure 2. Benefits from the Urban Grid Monitoring Demonstration
Benefit
Category
Benefit Sub-
Category Benefit
Provided by
Project? Remarks
Economic
T&D Capital
Savings
Reduced Equipment
Failures
(utility/ratepayer)
YES
Enhanced monitoring will allow
NSTAR to identify and address
potential equipment failures, such
as secondary main cable failures.
T&D O&M
Savings
Reduced Distribution
Equipment Maintenance
Cost (utility/ratepayer)
YES
Enhanced monitoring will assist
with preventive maintenance and
allow for maintenance savings.
Reduced Distribution
Operations Cost
(utility/ratepayer)
YES
Enhanced monitoring will allow
NSTAR to identify and address
potential distribution equipment
overloads; thus, avoiding the need
for emergency truck rolls to
eliminate overloads.
Reduced Meter Reading
Cost*
(utility/ratepayer)
NO
Although a small number of AMI
meters will be deployed in this
project, truck rolls are not
expected to be reduced at this time
since the trucks will continue their
routes to gather meter data.
Reliability Power
Interruptions
Reduced Sustained
Outages
(consumer)
YES
The urban grid is designed to be
99.9% reliable and the occurrence
of outages is extremely rare. The
intent of this project is to maintain
this reliability, while safely
integrating PV onto the grid. If
this project results in any
measurable change in outage
response time, it will be addressed
in the Technology Performance
Report.
Reduced Major Outages
(consumer) YES
The monitoring and preventive
maintenance resulting from this
project will help avoid major
events on the secondary area
network.
Reduced Restoration Cost
(utility/ratepayer) NO
NSTAR anticipates that this will
be a benefit of this project;
however, NSTAR will not be
tracking and reporting these
impacts at the project level.
NSTAR Urban Grid Monitoring –Technical Performance Report Page 11 September 22, 2014
Benefit
Category
Benefit Sub-
Category Benefit
Provided by
Project? Remarks
Environmental
Air Emissions
Reduced carbon dioxide
Emissions
(society)
YES
Emissions will be reduced by this
project through the integration of
solar PV onto the secondary area
network and reduced emergency
truck rolls due to enhanced
network monitoring.
Reduced SOX, NOX, and
PM-2.5 Emissions
(society)
YES
Emissions will be reduced by this
project through the integration of
solar PV onto the secondary area
network and reduced emergency
truck rolls due to enhanced
network monitoring.
Security Energy
Security
Reduced Oil Usage
(society) YES
Oil usage will be reduced by this
project through a reduction in
emergency truck rolls due to
enhanced network monitoring.
NSTAR Urban Grid Monitoring –Technical Performance Report Page 12 September 22, 2014
2 Technical Approach
This section discusses the technical approach to the project, which includes a summary of the project
plan, the data collection and benefits analysis activities, and the interoperability and cyber security
approaches, per the Technical Performance Report Guidance issued by the DOE in 2011.
2.1 Project Plan
NSTAR is implementing grid monitoring in a layered approach. NSTAR has already deployed various
types of instrumentation at grid points within manholes throughout the distribution network, as
described in Section 1.3 above. These basic, relatively inexpensive instruments have been deployed at
“minor nodes” in the grid, and more expensive instruments with near real-time monitoring have been
deployed at “major nodes.”
For the current phase of the project, which began in May 2014, NSTAR contracted Bahwan Cybertek, Inc.
to conduct extensive analysis of the node data in order to optimize system operation and determine the
viability of PV integration. The results of this data analysis will allow NSTAR to determine whether
assets and infrastructure throughout the grid are operating at or beyond specified operating limits and,
where practicable, to adjust the infrastructure accordingly to within the operating limits. The increased
visibility of grid conditions will limit improper operation of secondary mains and allow for the
integration of distributed generation into the system without causing undue disturbance.
Once the equipment and protocols needed to effectively enforce system safeguards are in place, NSTAR
will install AMR meters at the PV test site chosen in the system design process and connect the PV load
to the nearest major node. Controlled operation of the system and incremental testing of the various
safeguards will determine system readiness for additional PV integration. NSTAR will perform testing
of the system with an end goal of validating that the system operates successfully and safely under the
IEEE 1547.6 recommendations.1 Once this testing process is complete, NSTAR will install additional
AMR meters near customer-owned solar installations to monitor specific customer interface points.
Performance of the grid in the location of installed PV will continue to be measured after the installation
of the PV.
2.2 Data Collection and Benefits Analysis
This section discusses which data are being recorded or calculated and describes how the benefits
analysis will be performed.
2.2.1 Data Collection
This project will extend system visibility and data collection down to the cable level, which has never
been possible in the past. The various instrumentation and sensor points will provide data that will be
accumulated in the Collection Server (repository). In addition, certain elements of the data will be made
available for other uses (e.g., the PI—Plant Information System, which provides access to other
1 http://standards.ieee.org/findstds/standard/1547.6-2011.html

NSTAR Urban Grid Monitoring –Technical Performance Report Page 13 September 22, 2014
Departments for planning and operations purposes), and the data will also be made available for DOE
analysis. Expected data includes:
Major Node Information: Each cable at a major node will now have monitoring down to the
individual cable level (e.g., there will be approximately 36 conductor cables within a typical
node in a single manhole). Each conductor cable will be monitored for the following attributes
o temperature,
o load (Amperes), and
o voltage (Volts).
This information will be sampled on an hourly basis and will also be available when polled
manually and collected at the Collection Server.
Minor Node Information: Each cable at a minor node (e.g., there will be approximately 15
cables within the manhole) will be monitored for the following flags:
o over temperature (at particular threshold), and
o under current (at a particular threshold).
Flags indicated on any cable will be transmitted via cellular network. This will provide specific
information on which nodes (manhole) have issues that require investigation.
Feeder Data Meters: Interval consumption data on a real time (10 seconds) sample rate will be
collected from each of 10 feeders supplying the selected secondary area network grid. This
information will be fed into the Collection Server and correlated with other demonstration data.
Network Protector Information: Network Protectors are installed at all transformer locations on
the secondary area network grid and are a primary source of the data that NSTAR currently
collects. The load side of each Network Protector is connected to the secondary grid and
automatically opens or closes in response to grid conditions.2 NSTAR collects the following
information from every Network Protector:
o Network Protector Position (open/close)
o Network Protector current measure
o Network Protector Nitrogen Pressure (in the protective encasement)
This set of information will provide an understanding of the power flow on the grid, which will allow
characterization of the behavior of the local grid characteristics prior to integration of any customer PV.
It will also provide the information needed to more proactively determine problem areas on the grid and
perform maintenance where necessary to avoid larger problems.
Once customer PV locations are determined, NSTAR will deploy instrumentation to collect the following
additional information:
2 Network protectors automatically open when a primary feeder breaker is opened or in the event of a fault on a
primary feeder or in a network transformer. Network protectors automatically close to connect the network
transformers to the secondary grid when the primary feeder is energized.
NSTAR Urban Grid Monitoring –Technical Performance Report Page 14 September 22, 2014
AMR Meters: Interval consumption data on a 15 minute sample rate will be collected from each
of these AMR meters at relevant customer premises through an ERT signal transmitted to an
ERT “bridge,” which will translate the data to an internet gateway device. This gateway device
will then send the interval data to NSTAR’s Collection Server via the customer’s broadband
connection. Tendril will provide the ERT bridge and internet gateway devices.
Customer PV-Meter/Switches: For each PV installation, 15 minute to 1 hour sampled power
flow from the PV installation and building load will be monitored and collected by the internet
gateway device.
This information will allow for more complete characterization of the grid behavior near the customer
PV integration, and also allow determination of a proper safety margin for operation of the PV.
2.2.2 Benefits Analysis
NSTAR will calculate the benefits from this project in accordance with the methodology outlined in
NSTAR’s most recent Metrics and Benefits Reporting Plan, dated September 2011. NSTAR does not
expect significant changes for this approach once the data analysis begins.
The enhanced distribution monitoring enabled through this project will greatly improve visibility into
the status of the urban grid, both in terms of near real-time information about load distribution and in
terms of improved understanding of the grid asset inventory and condition. The primary impact that
will be reported for these enhancements is the proactive identification and management of potential
distribution feeder and equipment overload incidents. NSTAR anticipates that this project will help
determine the status of equipment failures related to distribution operations and maintenance.
The impact metrics reported to the DOE under AMI and Customer Systems relate to the possible impacts
from integration of distributed PV into the urban grid. If this project results in a significant amount of
integrated PV capacity added to the network, as the energy export is realized NSTAR will apply the
appropriate formula to calculate emissions reductions. The AMI meters installed through this project
will enable the data collection needed for these metrics.
2.3 Interoperability and Cyber Security Approach
A key component of this project is ensuring that NSTAR properly addresses interoperability and cyber
security issues. The project will achieve interoperability by converting all collected data into a common
format via the Collection Server for consumption by other systems for engineering analysis, and
operational planning purposes. Additionally, the various instruments (major nodes, minor nodes, AMR
meters), communication devices, and other components will be flexibly replaceable and interchangeable
without significant impact to system operation or performance. NSTAR is addressing cyber security
concerns using the Distribution Cyber-Security Framework (DCS-F), which is summarized in NSTAR’s
Interoperability and Cyber Security Plan. The following sections discuss NSTAR’s approach to
interoperability and cyber security for this project in more detail.

NSTAR Urban Grid Monitoring –Technical Performance Report Page 15 September 22, 2014
2.3.1 Interoperability
NSTAR is fully committed to keeping abreast of relevant developing standards, with particular attention
on the emerging NIST standards for interoperability, to gauge impact on existing and planned
deployments. NSTAR’s strategy for communications technology solutions is to implement standards-
based solutions whenever project requirements allow it.
NSTAR expects the various instruments (major nodes, minor nodes, AMR meters), communication
devices, and other components to be flexibly replaceable and interchangeable, without significant impact
to system operation or performance. Failure of any of these would result in a situation no worse than
that before the device was installed, and the device would be repaired in the field using normal field
maintenance and repair operations.
All the information that is brought back to the Collection Server will be put in a common format for
consumption by other systems for engineering analysis, and operational planning purposes. To
accomplish this, NSTAR will leverage NSTAR’s proven system integration testing methodology and
Bahwan Cybertek, Inc.’s data analysis application.
2.3.2 Cyber Security
NSTAR is approaching cyber security for this project proactively, taking a holistic and ground-up
approach to ensuring the confidentiality, integrity, and availability of the system. NSTAR is leveraging
the National Institute of Standards and Technology (NIST) cyber security guidance as well as its
experience with and knowledge of the NERC Critical Infrastructure Protection (CIP) framework to
develop an appropriate security approach for the distribution system and ensure that security best
practices are being applied. NSTAR refers to this approach as the Distribution Cyber-Security
Framework (DCS-F).
To demonstrate and validate the effectiveness of NSTAR’s cyber security controls through DCS-F,
NSTAR will perform the following reviews, as needed:
Periodic vulnerability assessments of infrastructure and documentation of results;
Development of a remediation plan for evidence and review;
Periodic system security analysis, including reviews of architecture, operating procedures,
deployment and hardening process, event management and patch management;
Review on a periodic basis of all system accounts that result in disabling and/or terminating any
account that cannot be associated with an owner or process;
Periodic maintenance, monitoring and analysis of audit logs;
Periodic review of enterprise systems to insure up to date anti-malware signatures; and
Periodic review of services and ports, along with a change control program to document all
changes with an associated business justification.

NSTAR Urban Grid Monitoring –Technical Performance Report Page 16 September 22, 2014
3 Results
NSTAR has installed all grid monitoring, communications, and data collection equipment as of August
2013. The project is now entering the data analysis phase, which consist of extensive data analysis and
commissioning in order to maximize the integration of PV DG. Once the vendor-supplied data analysis
application is fully online and providing NSTAR with detailed real-time visibility into grid operating
conditions, NSTAR will have a better understanding of the overall success of the project.
3.1 Operation of Smart Grid Technologies and Systems
NSTAR reported the following operational data as of January 2014:
Major Nodes
• 6,480 sensors are distributed among 126 manholes throughout the Boston Area 492 North
Grid.
• 16 sensors are alarming every day due to faulted sensors. NSTAR confirmed the presence of
faulted sensors with true load readings taken in the field.
• Eleven sensors have recently alarmed due to the load exceeding 208 Amps beyond the set
threshold.
• NSTAR identified two broken limiters with the use of this technology.
Minor Nodes
• 4,386 sensors distributed among 310 manholes throughout the Boston Area 492 North Grid
• 193 sensors are alarming every day (periodically throughout the day) due to load cycling
above and below the 8 Amp threshold.
• 56 sensors alarming everyday (96 times per day). 51 sensors had field load readings taken,
indicating that there is verified low load (less than 8 Amps) on the mains.
3.2 System Design Changes
Originally, NSTAR intended to equip these nodes with an AMR type radio transmitter that would allow
drive-by collection of this information, as discussed in Section 1.3. However, during the research and
development of the minor nodes, NSTAR realized the importance of near real-time communication with
the nodes. As a result, NSTAR updated the communication medium within the node to communicate
over NSTAR’s existing wireless cell network. Wireless communications now provide NSTAR with near
real-time alerts when low-current and high-temperature conditions takes place. The benefits of this
approach include:
Leveraging existing wireless cell network,
Eliminating the need for a drive-by van to collect data,
Providing real-time alarm notifications,
Minor nodes reporting immediately,
Enabling quicker response to open limiters or overload, and
NSTAR Urban Grid Monitoring –Technical Performance Report Page 17 September 22, 2014
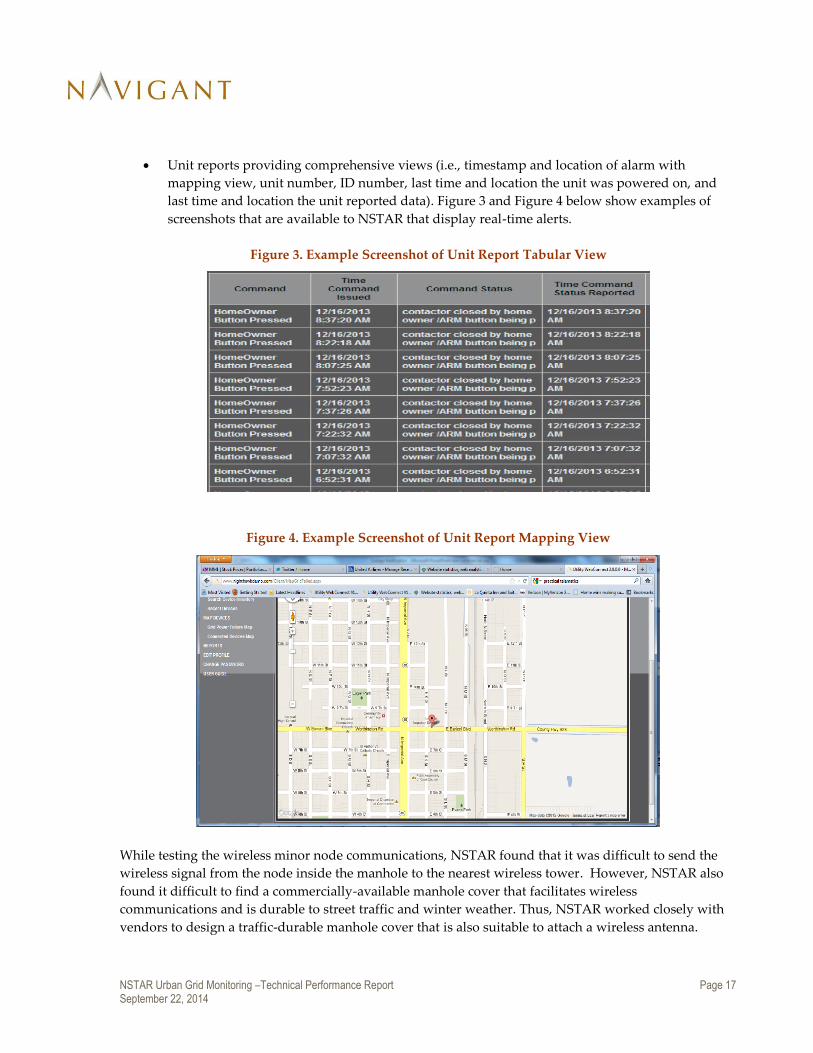
Unit reports providing comprehensive views (i.e., timestamp and location of alarm with
mapping view, unit number, ID number, last time and location the unit was powered on, and
last time and location the unit reported data). Figure 3 and Figure 4 below show examples of
screenshots that are available to NSTAR that display real-time alerts.
Figure 3. Example Screenshot of Unit Report Tabular View
Figure 4. Example Screenshot of Unit Report Mapping View
While testing the wireless minor node communications, NSTAR found that it was difficult to send the
wireless signal from the node inside the manhole to the nearest wireless tower. However, NSTAR also
found it difficult to find a commercially-available manhole cover that facilitates wireless
communications and is durable to street traffic and winter weather. Thus, NSTAR worked closely with
vendors to design a traffic-durable manhole cover that is also suitable to attach a wireless antenna.

NSTAR Urban Grid Monitoring –Technical Performance Report Page 18 September 22, 2014
NSTAR also made the following design improvements to the minor nodes:
• Added a fully connectorized enclosure, with a clear molded metal oxide varistor (MOV) circuit
board to protect the node against underground secondary fault current;
• Used an IP68 connecter as a RTU alarm, which is a water proof connector suitable for
underground applications
• Incorporated a detachable power supply cable to enable easy maintenance and replacement of
the units; and
• Added a detachable and chainable sensor harness to facilitate easy additions of sensors without
the need of additional units.
Finally, the major nodes were originally designed using a larger, less accurate current transformer (CT)
sensor; these were improved to use a smaller, more accurate CT sensor.
3.3 Impact Metrics and Benefits Analysis
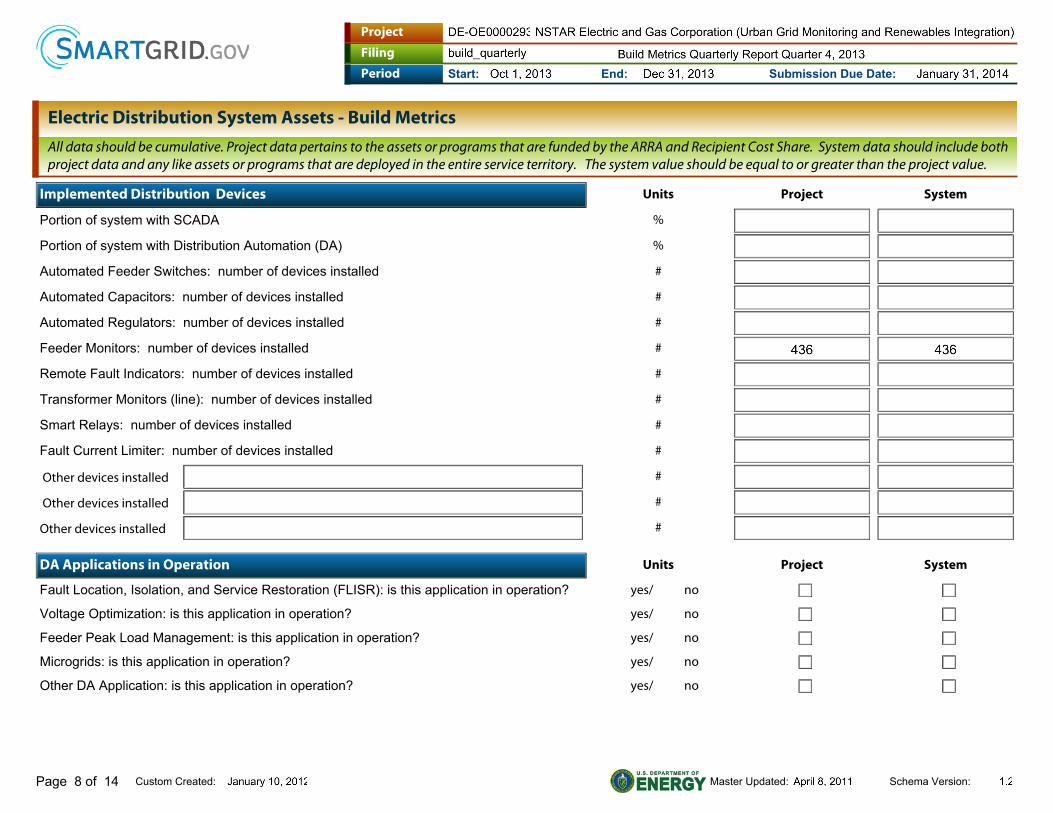
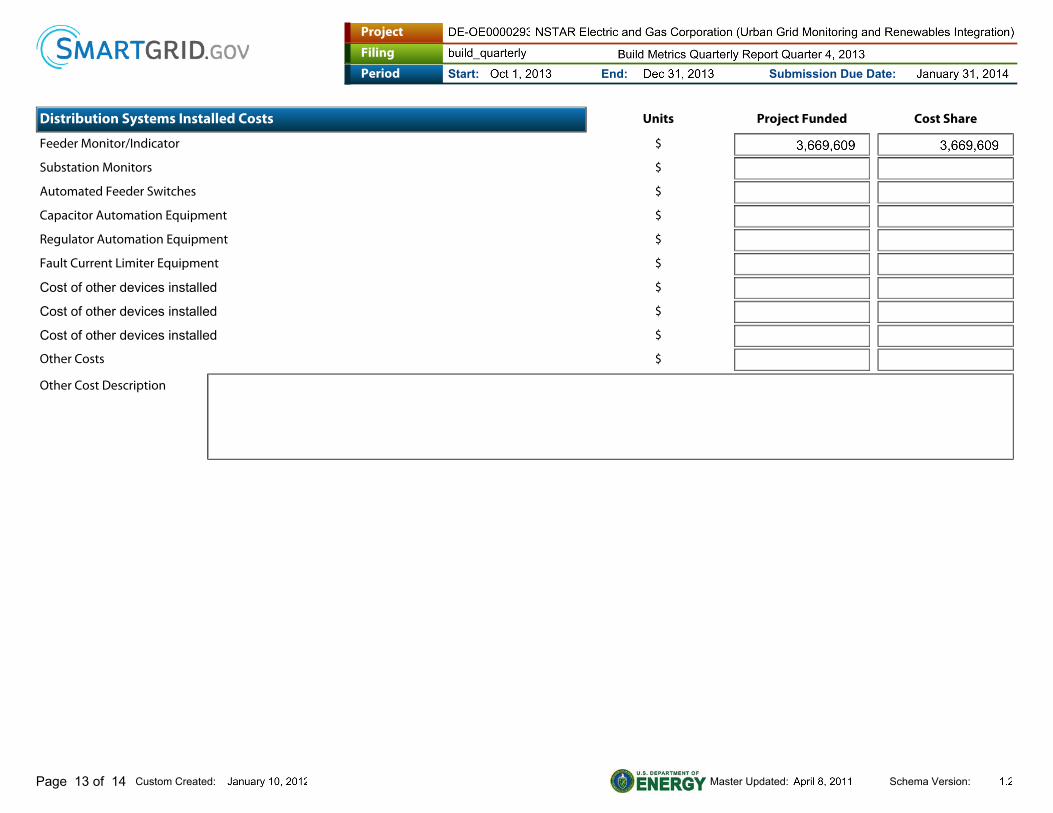
As of the end of January 2014, NSTAR has installed 436 distribution feeder monitors/indicators, using
$3,669,609 of project funding and $3,669,609 of DOE cost share. NSTAR’s most recent Build Metrics
report with this information is attached in Appendix B.
NSTAR has not yet collected sufficient information to report on any of the project’s impact metrics.
NSTAR Urban Grid Monitoring –Technical Performance Report Page 19 September 22, 2014
4 Conclusions
This section presents the conclusions from the installation phase of NSTAR’s Urban Grid Monitoring
and Renewables Integration project, including the potential implications of the project’s findings for
commercial-scale development and deployment across the U.S. More complete findings are expected
once the data analysis and commissioning phases of the project are completed.
Minor Node Instrumentation
The minor node instrumentation used in this project leverages a unique and low-cost approach to
monitoring underground grid points and may provide a new, more cost effective way to deploy such
systems in urban grids across the U.S. NSTAR has developed the product, which has been manufactured
by the vendor, and is committed to pursuing a path that leverages flexible, standards based
interconnectivity should the approach prove successful. NSTAR has a licensing arrangement with the
vendor to commercialize the technology upon successful demonstration of its capabilities. Thus far, the
new minor node technology and approach has shown to be viable on NSTAR’s grid using the existing
cellular network. The visibility provided by the minor nodes, in conjunction with the other project
instrumentation, will provide the information needed to more proactively determine problem areas on
the grid and perform maintenance where necessary to avoid larger problems.
Inverter-Based Distributed Resource Deployment
This demonstration project will also help facilitate large-scale deployment of inverter-based distributed
resources such as solar PV and electric vehicles, which NSTAR and other utilities have seldom pursued
in the past due to safety and grid stability concerns. This project will lay the groundwork for nationwide
deployment of these inverter-based distributed resources in major urban areas across the U.S. In
addition, this project will help the development of preventive maintenance programs for secondary area
networks in urban areas across the country.
Lessons Learned during the Installation Phase
Finally, NSTAR also identified the following findings and associated lessons learned from the
installation phase of the project that NSTAR recently completed:
Finding: Downtown Boston’s permitting policies caused delays, and NSTAR did not originally
anticipate difficulties due to traffic and the need to work off-peak hours.
Lesson Learned: The project timeline and budget should account for the various spatial and
temporal challenges that occur when working in dense urban areas.
Finding: Manhole cleaning and water plumbing incurred additional costs which NSTAR had not
originally accounted for.
Lesson Learned: Manhole cleaning and water plumbing costs should be incorporated into the
project budget.

NSTAR Urban Grid Monitoring –Technical Performance Report Page 20 September 22, 2014
Finding: Signals sent from inside the underground manhole transmitted poorly and created
challenges for the receivers to properly read the data packet. Finding a suitable manhole and
antenna location to accommodate traffic load and winter weather also proved to be difficult.
Lesson Learned: Optimizing manhole and antenna locations is imperative to high quality and
uninterrupted data transfer.
Finding: The system generated false alarms due to an incorrectly set current limit. NSTAR
originally set this limit based on customer load profiles in the area for which the utility did not
have sufficient data.
Lesson Learned: The current limit should either be less stringently set, or a more detailed
customer load profile should be understood prior to setting the alarms.
NSTAR expects to learn additional lessons and develop best practices upon completion of the data
analysis and commissioning phases of the project.

NSTAR Urban Grid Monitoring –Technical Performance Report Page 21 September 22, 2014
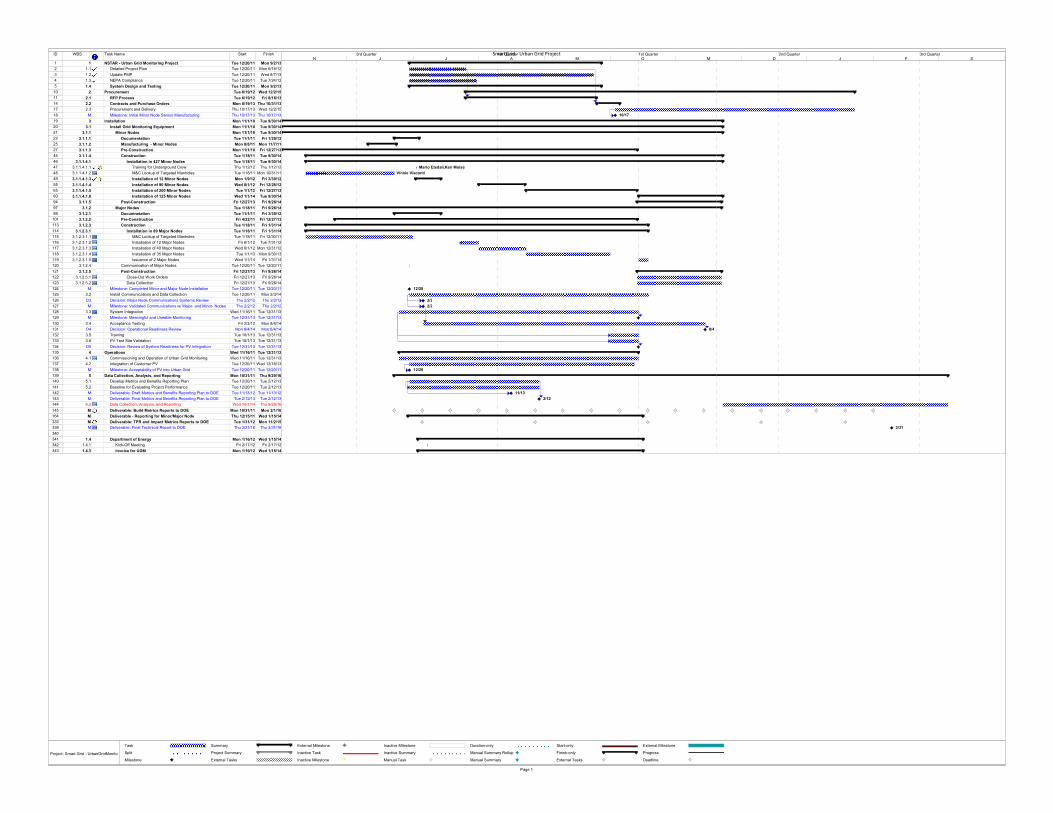
Appendix A Project Schedule – GANTT Chart
The project schedule is summarized below in the most recent project GANTT chart. NSTAR submitted
this document to the DOE in March 2014.
ID WBS Task Name Start Finish
1 1 NSTAR - Urban Grid Monitoring Project Tue 12/20/11 Mon 9/2/13
2 1.1 Detailed Project Plan Tue 12/20/11 Mon 6/18/12
3 1.2 Update PMP Tue 12/20/11 Wed 8/7/13
4 1.3 NEPA Compliance Tue 12/20/11 Tue 7/24/12
5 1.4 System Design and Testing Tue 12/20/11 Mon 9/2/13
10 2 Procurement Tue 6/19/12 Wed 12/2/15
11 2.1 RFP Process Tue 6/19/12 Fri 8/16/13
14 2.2 Contracts and Purchase Orders Mon 8/19/13 Thu 10/31/13
17 2.3 Procurement and Delivery Thu 10/17/13 Wed 12/2/15
18 M Milestone: Initial Minor Node Sensor Manufacturing Thu 10/17/13 Thu 10/17/13
19 3 Installation Mon 11/1/10 Tue 9/30/14
20 3.1 Install Grid Monitoring Equipment Mon 11/1/10 Tue 9/30/14
21 3.1.1 Minor Nodes Mon 11/1/10 Tue 9/30/14
22 3.1.1.1 Documentation Tue 11/1/11 Fri 1/20/12
25 3.1.1.2 Manufacturing - Minor Nodes Mon 8/8/11 Mon 11/7/11
27 3.1.1.3 Pre-Construction Mon 11/1/10 Fri 12/27/13
45 3.1.1.4 Construction Tue 1/18/11 Tue 9/30/14
46 3.1.1.4.1 Installation in 427 Minor Nodes Tue 1/18/11 Tue 9/30/14
47 3.1.1.4.1.1 Training for Underground Crew Thu 1/12/12 Thu 1/12/12
48 3.1.1.4.1.2 M&C Lookup of Targeted Manholes Tue 1/18/11 Mon 10/31/11
49 3.1.1.4.1.3 Installation of 12 Minor Nodes Mon 1/9/12 Fri 3/30/12
55 3.1.1.4.1.4 Installation of 90 Minor Nodes Wed 8/1/12 Fri 12/28/12
65 3.1.1.4.1.5 Installation of 200 Minor Nodes Tue 1/1/13 Fri 12/27/13
80 3.1.1.4.1.6 Installation of 125 Minor Nodes Wed 1/1/14 Tue 9/30/14
94 3.1.1.5 Post-Construction Fri 12/27/13 Fri 9/26/14
97 3.1.2 Major Nodes Tue 1/18/11 Fri 9/26/14
98 3.1.2.1 Documnetation Tue 11/1/11 Fri 3/30/12
101 3.1.2.2 Pre-Construction Fri 4/22/11 Fri 12/27/13
113 3.1.2.3 Construction Tue 1/18/11 Fri 1/31/14
114 3.1.2.3.1 Installation in 89 Major Nodes Tue 1/18/11 Fri 1/31/14
115 3.1.2.3.1.1 M&C Lookup of Targeted Manholes Tue 1/18/11 Fri 12/30/11
116 3.1.2.3.1.2 Installation of 12 Major Nodes Fri 6/1/12 Tue 7/31/12
117 3.1.2.3.1.3 Installation of 40 Major Nodes Wed 8/1/12 Mon 12/31/12
118 3.1.2.3.1.4 Installation of 35 Major Nodes Tue 1/1/13 Mon 9/30/13
119 3.1.2.3.1.5 Issuance of 2 Major Nodes Wed 1/1/14 Fri 1/31/14
120 3.1.2.4 Communication of Major Nodes Tue 12/20/11 Tue 12/20/11
121 3.1.2.5 Post-Construction Fri 12/27/13 Fri 9/26/14
122 3.1.2.5.1 Close-Out Work Orders Fri 12/27/13 Fri 9/26/14
123 3.1.2.5.2 Data Collection Fri 12/27/13 Fri 9/26/14
124 M Milestone: Completed Minor and Major Node Installation Tue 12/20/11 Tue 12/20/11
125 3.2 Install Communications and Data Collection Tue 12/20/11 Mon 2/3/14
126 D3 Decision: Major Node Communications Systems Review Thu 2/2/12 Thu 2/2/12
127 M Milestone: Validated Communications w/ Major- and Minor- Nodes Thu 2/2/12 Thu 2/2/12
128 3.3 System Integration Wed 11/16/11 Tue 12/31/13
129 M Milestone: Meaningful and Useable Monitoring Tue 12/31/13 Tue 12/31/13
130 3.4 Acceptance Testing Fri 2/3/12 Mon 8/4/14
131 D4 Decision: Operational Readiness Review Mon 8/4/14 Mon 8/4/14
132 3.5 Training Tue 10/1/13 Tue 12/31/13
133 3.6 PV Test Site Validation Tue 10/1/13 Tue 12/31/13
134 D5 Decision: Review of System Readiness for PV Integration Tue 12/31/13 Tue 12/31/13
135 4 Operations Wed 11/16/11 Tue 12/31/13
136 4.1 Commissioning and Operation of Urban Grid Monitoring Wed 11/16/11 Tue 12/31/13
137 4.2 Integration of Customer PV Tue 12/20/11 Wed 12/18/13
138 M Milestone: Acceptability of PV into Urban Grid Tue 12/20/11 Tue 12/20/11
139 5 Data Collection, Analysis, and Reporting Mon 10/31/11 Thu 9/29/16
140 5.1 Develop Metrics and Benefits Reporting Plan Tue 12/20/11 Tue 2/12/13
141 5.2 Baseline for Evaluating Project Performance Tue 12/20/11 Tue 2/12/13
142 M Deliverable: Draft Metrics and Benefits Reporting Plan to DOE Tue 11/13/12 Tue 11/13/12
143 M Deliverable: Final Metrics and Benefits Reporting Plan to DOE Tue 2/12/13 Tue 2/12/13
144 6.2 Data Collection, Analysis, and Reporting Wed 10/1/14 Thu 9/29/16
145 M Deliverable: Build Metrics Reports to DOE Mon 10/31/11 Mon 2/1/16
164 M Deliverable - Reporting for Minor/Major Node Thu 12/15/11 Wed 1/15/14
333 M Deliverable: TPR and Impact Metrics Reports to DOE Tue 1/31/12 Mon 11/2/15
339 M Deliverable: Final Technical Report to DOE Thu 3/31/16 Thu 3/31/16
340
341 1.4 Department of Energy Mon 1/16/12 Wed 1/15/14
342 1.4.1 Kick-Off Meeting Fri 2/17/12 Fri 2/17/12
343 1.4.3 Invoice for UGM Mon 1/16/12 Wed 1/15/14
10/17
Mario Etedali,Ken Moise
Vinnie Visconti
12/20
2/2
2/2
8/4
12/20
11/13
2/12
3/31
N J J A M O M D J F S3rd Quarter 4th Quarter 1st Quarter 2nd Quarter 3rd Quarter
Task
Split
Milestone
Summary
Project Summary
External Tasks
External Milestone
Inactive Task
Inactive Milestone
Inactive Milestone
Inactive Summary
Manual Task
Duration-only
Manual Summary Rollup
Manual Summary
Start-only
Finish-only
External Tasks
External Milestone
Progress
Deadline
SmartGrid - Urban Grid Project
Page 1
Project: Smart Grid - UrbanGridMonito
NSTAR Urban Grid Monitoring –Technical Performance Report Page 22 September 22, 2014
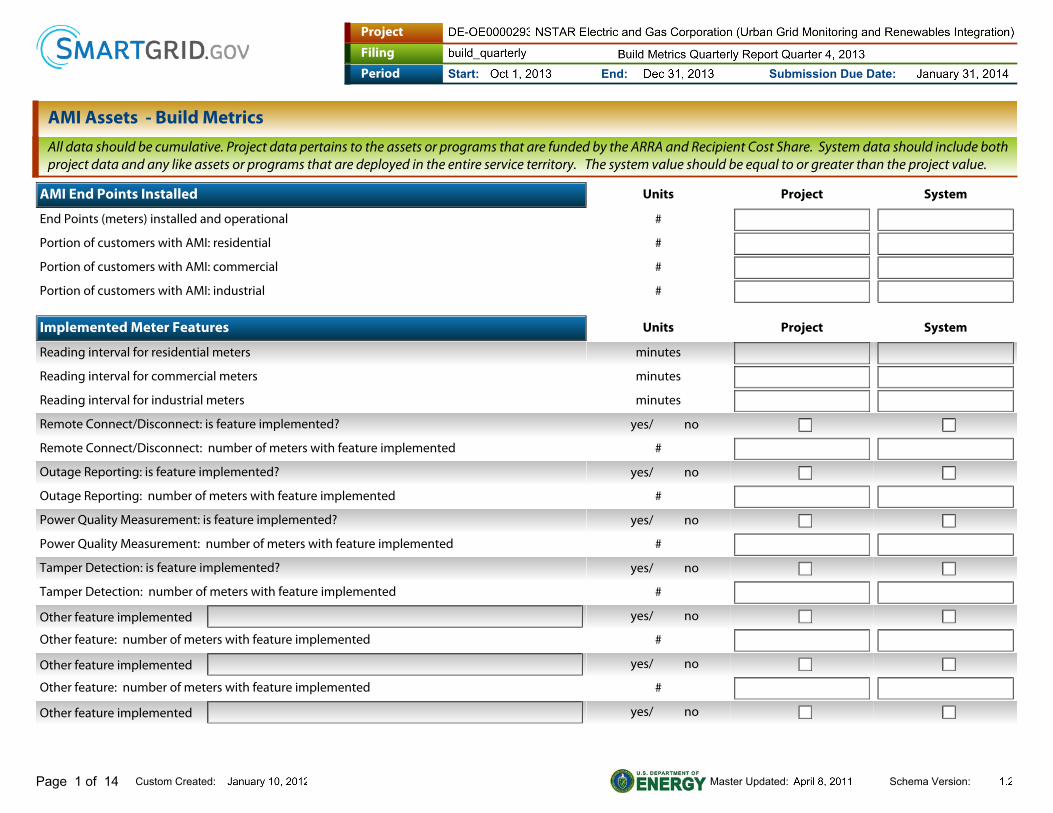
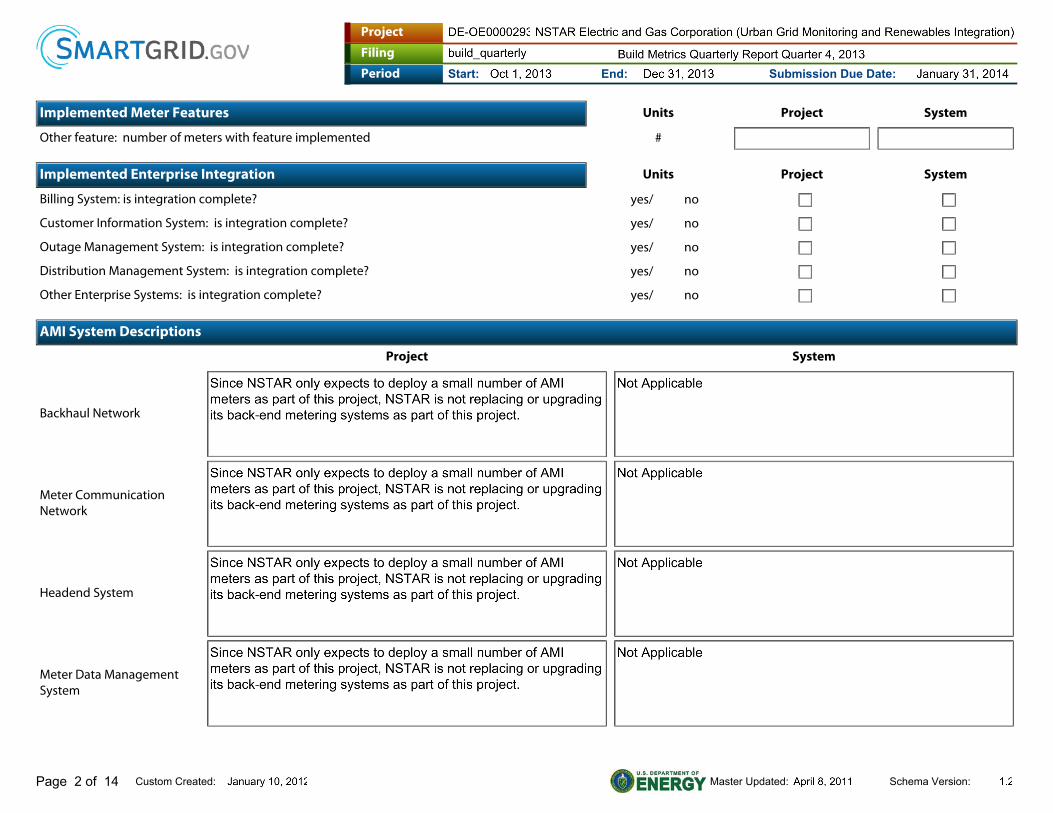
Appendix B Build Metrics Report
The most recent Build Metrics Report is attached below. NSTAR submitted this document to the DOE for
Q4 2013.
Project
Filing
Period
Page 1 of 14
Start: End: Submission Due Date:
Schema Version:Master Updated:Custom Created:
AMI Assets - Build MetricsAll data should be cumulative. Project data pertains to the assets or programs that are funded by the ARRA and Recipient Cost Share. System data should include both project data and any like assets or programs that are deployed in the entire service territory. The system value should be equal to or greater than the project value.
AMI End Points Installed Units Project System
End Points (meters) installed and operational #
Portion of customers with AMI: residential #
Portion of customers with AMI: commercial #
Portion of customers with AMI: industrial #
Implemented Meter Features Units Project System
Reading interval for residential meters minutes
Reading interval for commercial meters minutes
Reading interval for industrial meters minutes
Remote Connect/Disconnect: is feature implemented? yes/ no
Remote Connect/Disconnect: number of meters with feature implemented #
Outage Reporting: is feature implemented? yes/ no
Outage Reporting: number of meters with feature implemented #
Power Quality Measurement: is feature implemented? yes/ no
Power Quality Measurement: number of meters with feature implemented #
Tamper Detection: is feature implemented? yes/ no
Tamper Detection: number of meters with feature implemented #
Other feature implemented yes/ no
Other feature: number of meters with feature implemented #
Other feature implemented yes/ no
Other feature: number of meters with feature implemented #
Other feature implemented yes/ no
Project
Filing
Period
Page 2 of 14
Start: End: Submission Due Date:
Schema Version:Master Updated:Custom Created:
Implemented Meter Features Units Project System
Other feature: number of meters with feature implemented #
Implemented Enterprise Integration Units Project System
Billing System: is integration complete? yes/ no
Customer Information System: is integration complete? yes/ no
Outage Management System: is integration complete? yes/ no
Distribution Management System: is integration complete? yes/ no
Other Enterprise Systems: is integration complete? yes/ no
AMI System Descriptions
Project System
Backhaul Network
Meter Communication Network
Headend System
Meter Data Management System
Project
Filing
Period
Page 3 of 14
Start: End: Submission Due Date:
Schema Version:Master Updated:Custom Created:
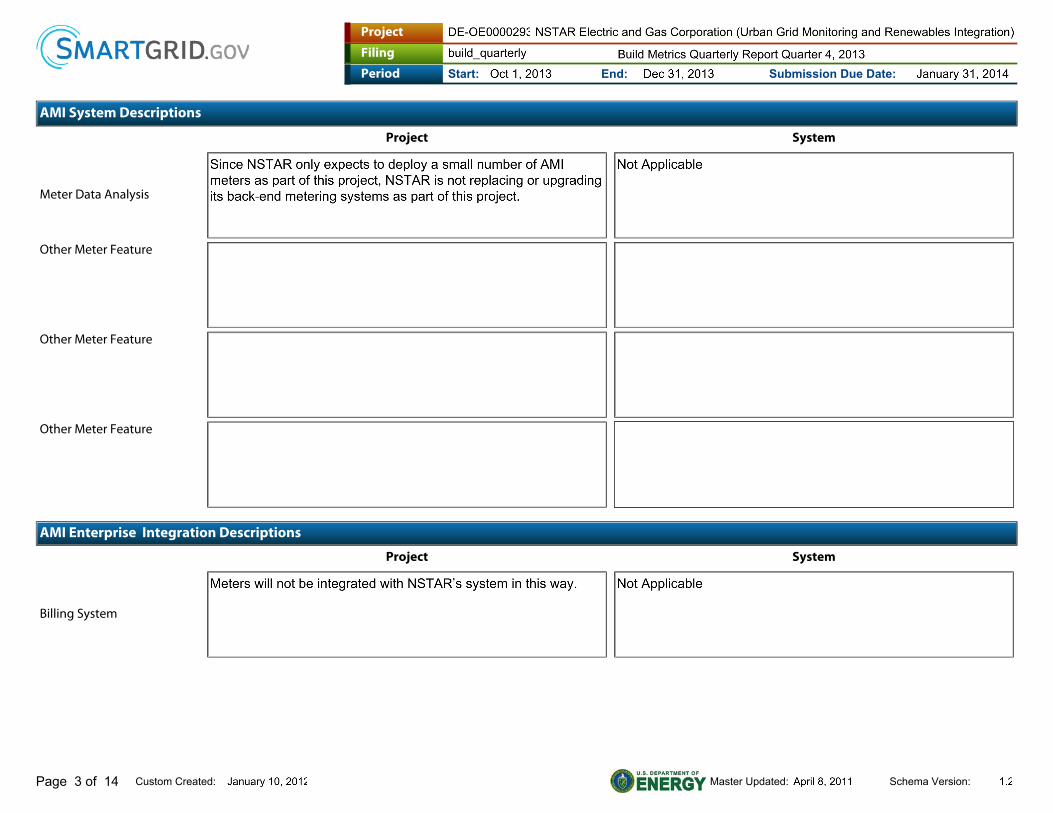
AMI System Descriptions
Project System
Meter Data Analysis
Other Meter Feature
Other Meter Feature
Other Meter Feature
AMI Enterprise Integration Descriptions
Project System
Billing System
Project
Filing
Period
Page 4 of 14
Start: End: Submission Due Date:
Schema Version:Master Updated:Custom Created:
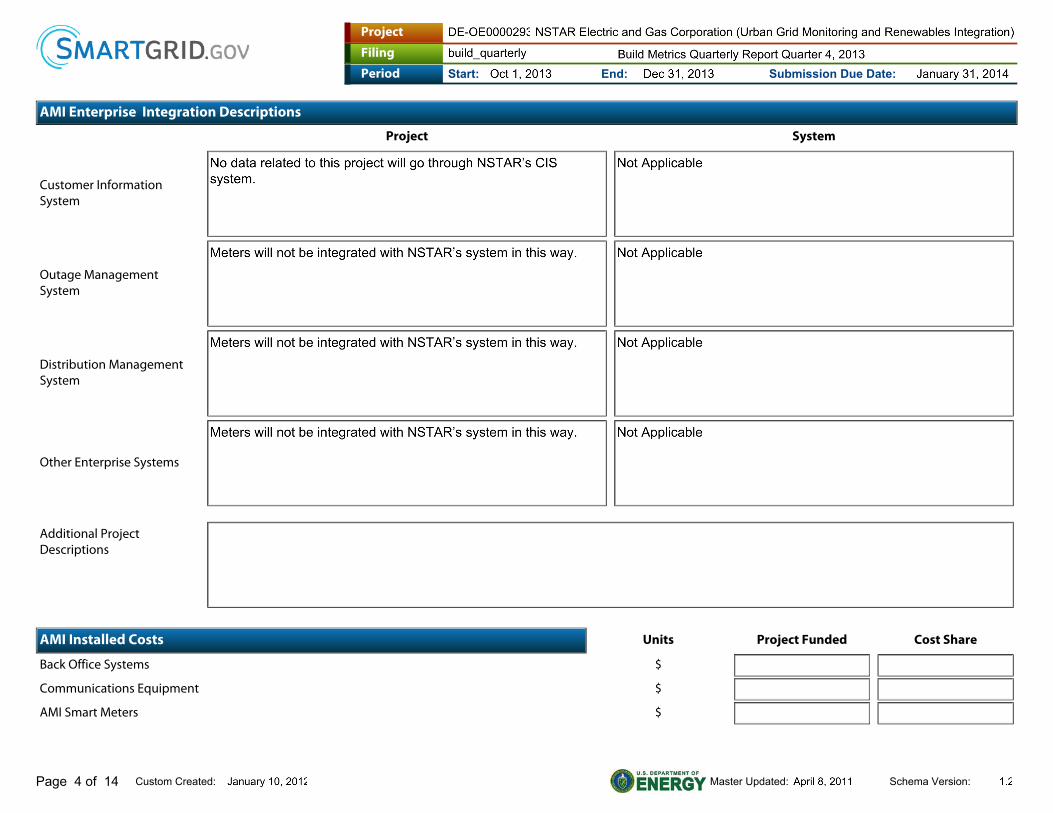
AMI Enterprise Integration Descriptions
Project System
Customer Information System
Outage Management System
Distribution Management System
Other Enterprise Systems
Additional Project Descriptions
AMI Installed Costs Units Project Funded Cost Share
Back Office Systems $
Communications Equipment $
AMI Smart Meters $
Project
Filing
Period
Page 5 of 14
Start: End: Submission Due Date:
Schema Version:Master Updated:Custom Created:
AMI Installed Costs Units Project Funded Cost Share
Other Costs $
Other Costs Description
Project
Filing
Period
Page 6 of 14
Start: End: Submission Due Date:
Schema Version:Master Updated:Custom Created:
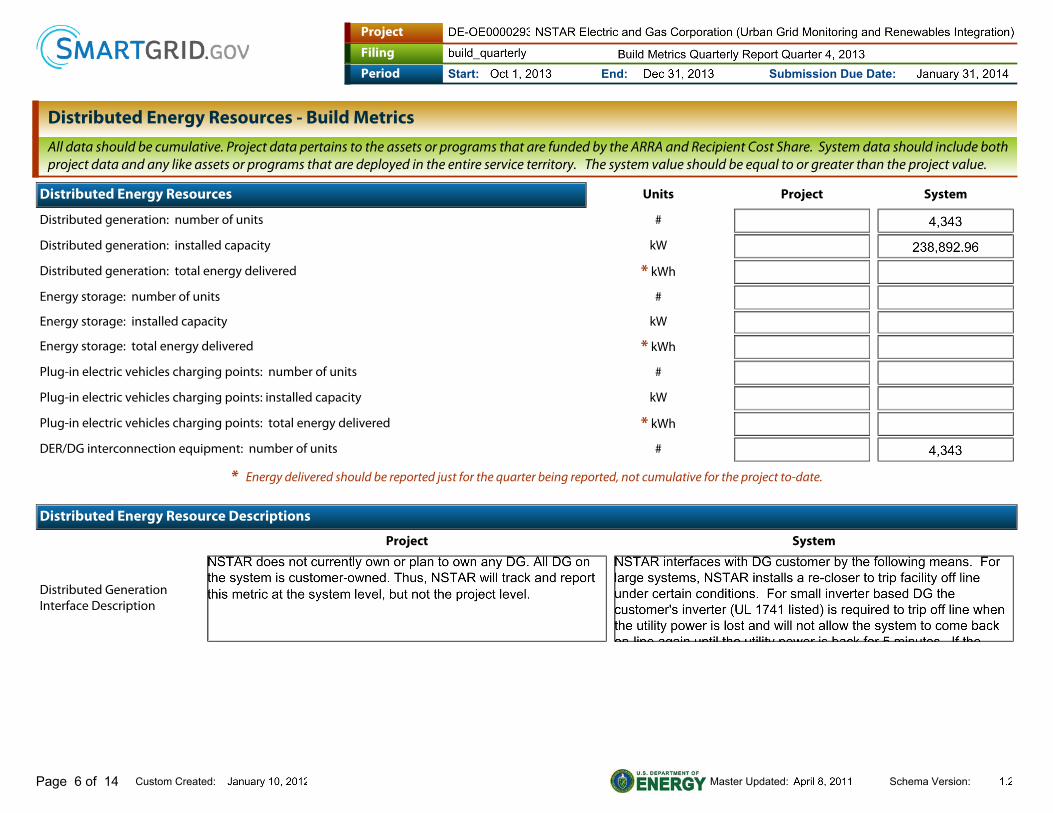
Distributed Energy Resources - Build MetricsAll data should be cumulative. Project data pertains to the assets or programs that are funded by the ARRA and Recipient Cost Share. System data should include both project data and any like assets or programs that are deployed in the entire service territory. The system value should be equal to or greater than the project value.
Distributed Energy Resources Units Project System
Distributed generation: number of units #
Distributed generation: installed capacity kW
Distributed generation: total energy delivered * kWh
Energy storage: number of units #
Energy storage: installed capacity kW
Energy storage: total energy delivered * kWh
Plug-in electric vehicles charging points: number of units #
Plug-in electric vehicles charging points: installed capacity kW
Plug-in electric vehicles charging points: total energy delivered * kWh
DER/DG interconnection equipment: number of units #
* Energy delivered should be reported just for the quarter being reported, not cumulative for the project to-date.
Distributed Energy Resource Descriptions
Project System
Distributed Generation Interface Description
Project
Filing
Period
Page 7 of 14
Start: End: Submission Due Date:
Schema Version:Master Updated:Custom Created:
Additional Project Descriptions
Distributed Energy Resources' Installed Costs Units Project Funded Cost Share
DER Interface Control Systems $
Communications Equipment $
DER/DG Interconnection Equipment $
Renewable DER $
Distributed Generation Equipment $
Stationary Electric Storage Equipment $
PEVs and Charging Stations $
Other Costs $
Other Cost Description
Project
Filing
Period
Page 8 of 14
Start: End: Submission Due Date:
Schema Version:Master Updated:Custom Created:
Electric Distribution System Assets - Build MetricsAll data should be cumulative. Project data pertains to the assets or programs that are funded by the ARRA and Recipient Cost Share. System data should include both project data and any like assets or programs that are deployed in the entire service territory. The system value should be equal to or greater than the project value.
Implemented Distribution Devices Units Project System
Portion of system with SCADA %
Portion of system with Distribution Automation (DA) %
Automated Feeder Switches: number of devices installed #
Automated Capacitors: number of devices installed #
Automated Regulators: number of devices installed #
Feeder Monitors: number of devices installed #
Remote Fault Indicators: number of devices installed #
Transformer Monitors (line): number of devices installed #
Smart Relays: number of devices installed #
Fault Current Limiter: number of devices installed #
Other devices installed #
Other devices installed #
Other devices installed #
DA Applications in Operation Units Project System
Fault Location, Isolation, and Service Restoration (FLISR): is this application in operation? yes/ no
Voltage Optimization: is this application in operation? yes/ no
Feeder Peak Load Management: is this application in operation? yes/ no
Microgrids: is this application in operation? yes/ no
Other DA Application: is this application in operation? yes/ no
Project
Filing
Period
Page 9 of 14
Start: End: Submission Due Date:
Schema Version:Master Updated:Custom Created:
Distribution Management System Integration Units Project System
AMI: is integration complete? yes/ no
Outage Management System: is integration complete? yes/ no
Transmission Management System: is integration complete? yes/ no
Distributed Energy Resources: is integration complete? yes/ no
Other Systems: is integration complete? yes/ no
Distribution Device Description
Project System
SCADA
Portion of system with SCADA
Portion of system with DA
DA devices
Project
Filing
Period
Page 10 of 14
Start: End: Submission Due Date:
Schema Version:Master Updated:Custom Created:
Distribution Device Description
Project System
DA communications network
Other device
Other device
Other device
Distribution Application Descriptions
Project System
FLISR
Project
Filing
Period
Page 11 of 14
Start: End: Submission Due Date:
Schema Version:Master Updated:Custom Created:
Voltage Optimization
Feeder Peak Load Management
Microgrids
Other DA Applications
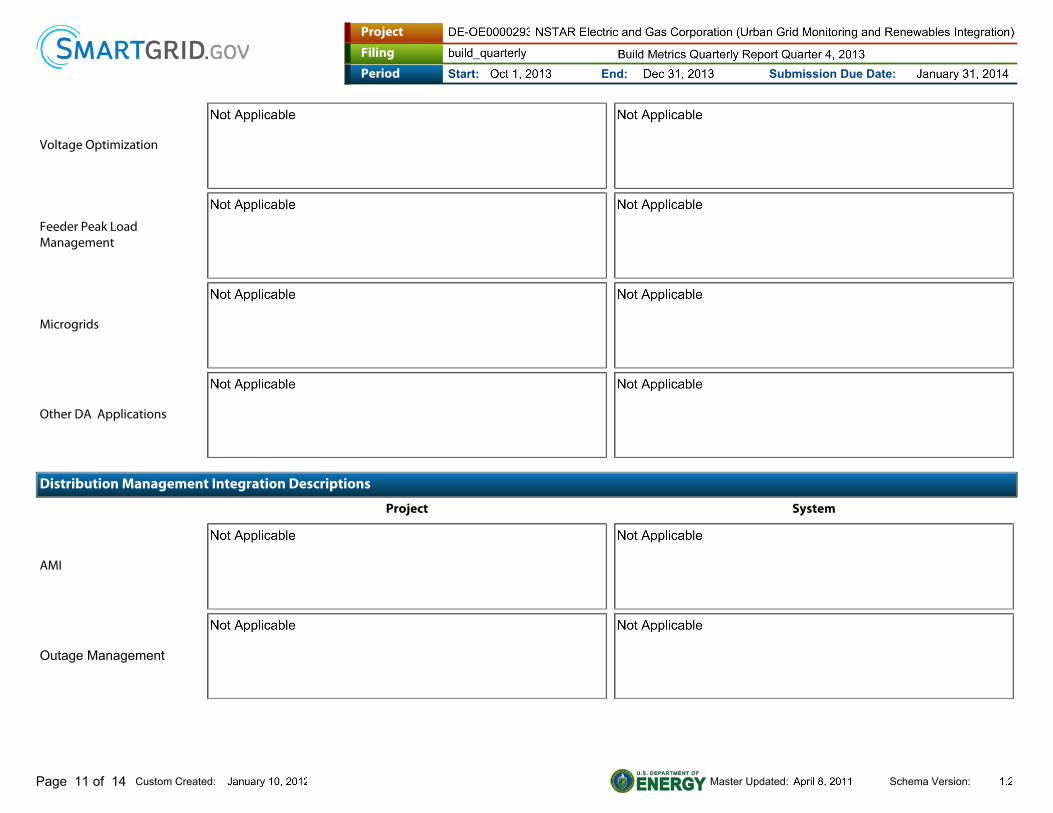
Distribution Management Integration Descriptions
Project System
AMI
Outage Management
Project
Filing
Period
Page 12 of 14
Start: End: Submission Due Date:
Schema Version:Master Updated:Custom Created:
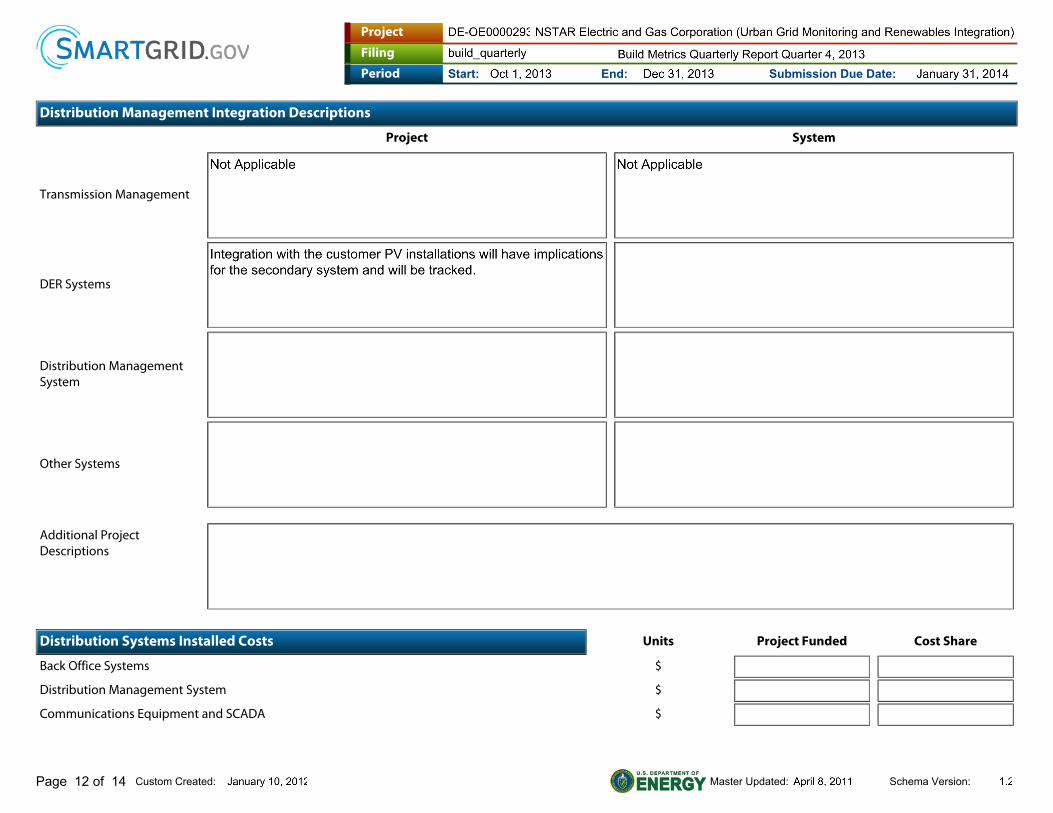
Distribution Management Integration Descriptions
Project System
Transmission Management
DER Systems
Distribution Management System
Other Systems
Additional Project Descriptions
Distribution Systems Installed Costs Units Project Funded Cost Share
Back Office Systems $
Distribution Management System $
Communications Equipment and SCADA $
Project
Filing
Period
Page 13 of 14
Start: End: Submission Due Date:
Schema Version:Master Updated:Custom Created:
Distribution Systems Installed Costs Units Project Funded Cost Share
Feeder Monitor/Indicator $
Substation Monitors $
Automated Feeder Switches $
Capacitor Automation Equipment $
Regulator Automation Equipment $
Fault Current Limiter Equipment $
Cost of other devices installed $
Cost of other devices installed $
Cost of other devices installed $
Other Costs $
Other Cost Description
Project
Filing
Period
Page 14 of 14
Start: End: Submission Due Date:
Schema Version:Master Updated:Custom Created: