Embed Size (px)
Citation preview

Renewable EnergyProgress ReportsData for 2009-2010
L.W.M. Beurskens
17 December 2013ECN-E--13-076

Acknowledgement
This report aims to serve the European energy experts and policy makers with a referencebook on renewable energy. The report focuses on the Progres Reports that were duein 2011, with data for 2009 and 2010. The ambi on is to also release a database withdata from the Progress Reports that are due in December 2013. See www.ecn.nl/nreapfor the developments regarding new work, but also to provide your highly appreciatedfeedback on this report and the database. The author would like to thank his colleaguesat ECN for the support to compile the database and edit this data report, which has beentypeset in LaTeX. For more informa on or background on this report contact the authorat [email protected].
Abstract
This report compiles and presents all data that were published by 27 European MemberStates to complywith Ar cle 22 from the Renewable Energy Direc ve (2009/28/EC). Thesereports were due by December 2011 and present the status of renewable energy for thesta s cal years 2009 and 2010. The original Progress Reports are available publicly, butgrabbing the data from the predefined tables is a challenge. In this report and the under-lying database (both available at www.ecn.nl/nreap) all data are presented in an accessblemanner. In the first part of the report the data have been grouped per country, in the sec-ond part per technology. Where possible EU-27 totals have been calculated in this secondpart. The report features an extensive index in order to increase its value as a referencebook.
Although the informa on contained in this report is derived from reliable sources and reasonable carehas been taken in the compiling of this report, ECN cannot be held responsible by the user for any errors,inaccuracies and/or omissions contained therein, regardless of the cause, nor can ECN be held responsiblefor any damages that may result therefrom. Any use that is made of the informa on contained in thisreport and decisions made by the user on the basis of this informa on are for the account and risk ofthe user. In no event shall ECN, its managers, directors and/or employees have any liability for indirect,non-material or consequen al damages, including loss of profit or revenue and loss of contracts or orders.

Contents
List of Tables 5
1 Introduc on 131.1 Progress Reports: the context 131.2 How to read this report? 141.3 Purpose and target audience 141.4 Future work 151.5 Ques onnaire 16
2 Austria 17
3 Belgium 23
4 Bulgaria 29
5 Cyprus 35
6 Czech Republic 41
7 Denmark 47
8 Estonia 53
9 Finland 59
10 France 65
11 Germany 71
12 Greece 77
13 Hungary 83
14 Ireland 89
15 Italy 95
16 Latvia 103
ECN-E--13-076 3

17 Lithuania 109
18 Luxembourg 115
19 Malta 121
20 Netherlands 127
21 Poland 133
22 Portugal 141
23 Romania 147
24 Slovakia 153
25 Slovenia 159
26 Spain 165
27 Sweden 171
28 United Kingdom 181
29 All 27 Member States 189
30 Table 1: the sectoral and overall RES shares 195
31 Table 1a: RES consump on in all sectors 199
32 Table 1b: Actual RES-E contribu ons 203
33 Table 1c: Actual RES-H/C contribu ons 225
34 Table 1d: Actual RES-T contribu ons 233
Index 241
4
List of Tables
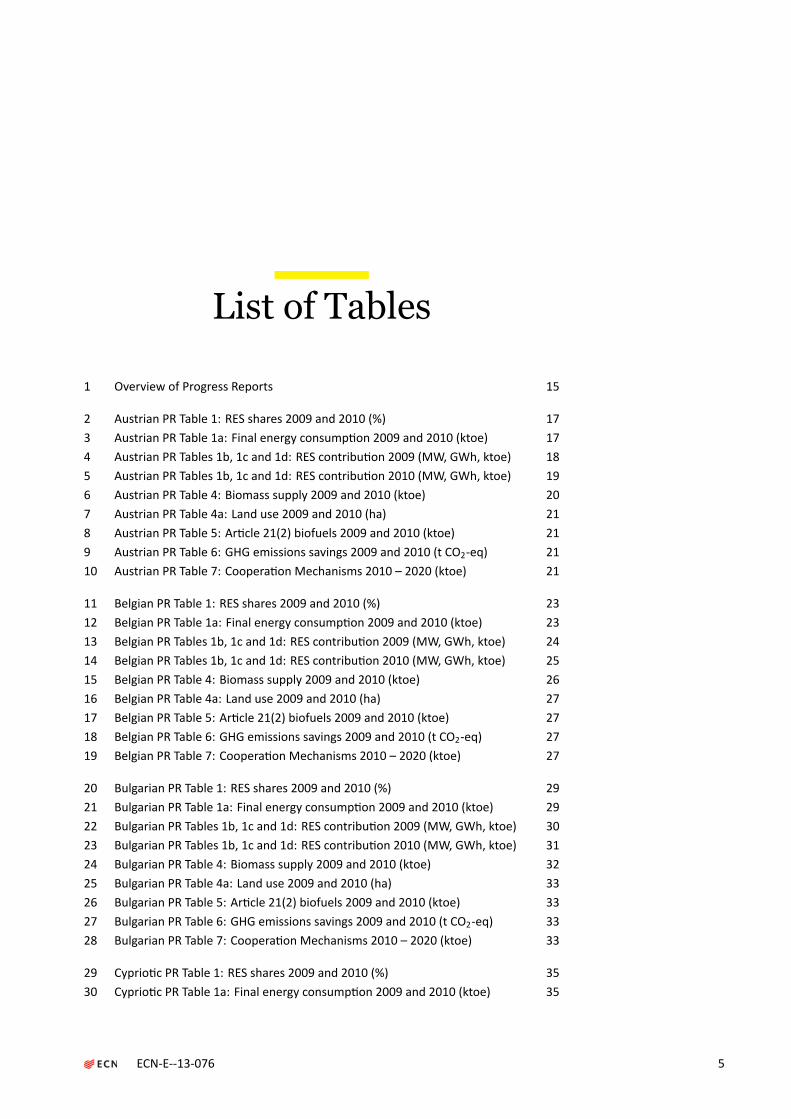
1 Overview of Progress Reports 15
2 Austrian PR Table 1: RES shares 2009 and 2010 (%) 173 Austrian PR Table 1a: Final energy consump on 2009 and 2010 (ktoe) 174 Austrian PR Tables 1b, 1c and 1d: RES contribu on 2009 (MW, GWh, ktoe) 185 Austrian PR Tables 1b, 1c and 1d: RES contribu on 2010 (MW, GWh, ktoe) 196 Austrian PR Table 4: Biomass supply 2009 and 2010 (ktoe) 207 Austrian PR Table 4a: Land use 2009 and 2010 (ha) 218 Austrian PR Table 5: Ar cle 21(2) biofuels 2009 and 2010 (ktoe) 219 Austrian PR Table 6: GHG emissions savings 2009 and 2010 (t CO2-eq) 2110 Austrian PR Table 7: Coopera on Mechanisms 2010 – 2020 (ktoe) 21
11 Belgian PR Table 1: RES shares 2009 and 2010 (%) 2312 Belgian PR Table 1a: Final energy consump on 2009 and 2010 (ktoe) 2313 Belgian PR Tables 1b, 1c and 1d: RES contribu on 2009 (MW, GWh, ktoe) 2414 Belgian PR Tables 1b, 1c and 1d: RES contribu on 2010 (MW, GWh, ktoe) 2515 Belgian PR Table 4: Biomass supply 2009 and 2010 (ktoe) 2616 Belgian PR Table 4a: Land use 2009 and 2010 (ha) 2717 Belgian PR Table 5: Ar cle 21(2) biofuels 2009 and 2010 (ktoe) 2718 Belgian PR Table 6: GHG emissions savings 2009 and 2010 (t CO2-eq) 2719 Belgian PR Table 7: Coopera on Mechanisms 2010 – 2020 (ktoe) 27
20 Bulgarian PR Table 1: RES shares 2009 and 2010 (%) 2921 Bulgarian PR Table 1a: Final energy consump on 2009 and 2010 (ktoe) 2922 Bulgarian PR Tables 1b, 1c and 1d: RES contribu on 2009 (MW, GWh, ktoe) 3023 Bulgarian PR Tables 1b, 1c and 1d: RES contribu on 2010 (MW, GWh, ktoe) 3124 Bulgarian PR Table 4: Biomass supply 2009 and 2010 (ktoe) 3225 Bulgarian PR Table 4a: Land use 2009 and 2010 (ha) 3326 Bulgarian PR Table 5: Ar cle 21(2) biofuels 2009 and 2010 (ktoe) 3327 Bulgarian PR Table 6: GHG emissions savings 2009 and 2010 (t CO2-eq) 3328 Bulgarian PR Table 7: Coopera on Mechanisms 2010 – 2020 (ktoe) 33
29 Cyprio c PR Table 1: RES shares 2009 and 2010 (%) 3530 Cyprio c PR Table 1a: Final energy consump on 2009 and 2010 (ktoe) 35
ECN-E--13-076 5

31 Cyprio c PR Tables 1b, 1c and 1d: RES contribu on 2009 (MW, GWh, ktoe) 3632 Cyprio c PR Tables 1b, 1c and 1d: RES contribu on 2010 (MW, GWh, ktoe) 3733 Cyprio c PR Table 4: Biomass supply 2009 and 2010 (ktoe) 3834 Cyprio c PR Table 4a: Land use 2009 and 2010 (ha) 3935 Cyprio c PR Table 5: Ar cle 21(2) biofuels 2009 and 2010 (ktoe) 3936 Cyprio c PR Table 6: GHG emissions savings 2009 and 2010 (t CO2-eq) 3937 Cyprio c PR Table 7: Coopera on Mechanisms 2010 – 2020 (ktoe) 39
38 Czech PR Table 1: RES shares 2009 and 2010 (%) 4139 Czech PR Table 1a: Final energy consump on 2009 and 2010 (ktoe) 4140 Czech PR Tables 1b, 1c and 1d: RES contribu on 2009 (MW, GWh, ktoe) 4241 Czech PR Tables 1b, 1c and 1d: RES contribu on 2010 (MW, GWh, ktoe) 4342 Czech PR Table 4: Biomass supply 2009 and 2010 (ktoe) 4443 Czech PR Table 4a: Land use 2009 and 2010 (ha) 4544 Czech PR Table 5: Ar cle 21(2) biofuels 2009 and 2010 (ktoe) 4545 Czech PR Table 6: GHG emissions savings 2009 and 2010 (t CO2-eq) 4546 Czech PR Table 7: Coopera on Mechanisms 2010 – 2020 (ktoe) 45
47 Denish PR Table 1: RES shares 2009 and 2010 (%) 4748 Denish PR Table 1a: Final energy consump on 2009 and 2010 (ktoe) 4749 Denish PR Tables 1b, 1c and 1d: RES contribu on 2009 (MW, GWh, ktoe) 4850 Denish PR Tables 1b, 1c and 1d: RES contribu on 2010 (MW, GWh, ktoe) 4951 Denish PR Table 4: Biomass supply 2009 and 2010 (ktoe) 5052 Denish PR Table 4a: Land use 2009 and 2010 (ha) 5153 Denish PR Table 5: Ar cle 21(2) biofuels 2009 and 2010 (ktoe) 5154 Denish PR Table 6: GHG emissions savings 2009 and 2010 (t CO2-eq) 5155 Denish PR Table 7: Coopera on Mechanisms 2010 – 2020 (ktoe) 51
56 Estonian PR Table 1: RES shares 2009 and 2010 (%) 5357 Estonian PR Table 1a: Final energy consump on 2009 and 2010 (ktoe) 5358 Estonian PR Tables 1b, 1c and 1d: RES contribu on 2009 (MW, GWh, ktoe) 5459 Estonian PR Tables 1b, 1c and 1d: RES contribu on 2010 (MW, GWh, ktoe) 5560 Estonian PR Table 4: Biomass supply 2009 and 2010 (ktoe) 5661 Estonian PR Table 4a: Land use 2009 and 2010 (ha) 5762 Estonian PR Table 5: Ar cle 21(2) biofuels 2009 and 2010 (ktoe) 5763 Estonian PR Table 6: GHG emissions savings 2009 and 2010 (t CO2-eq) 5764 Estonian PR Table 7: Coopera on Mechanisms 2010 – 2020 (ktoe) 57
65 Finnish PR Table 1: RES shares 2009 and 2010 (%) 5966 Finnish PR Table 1a: Final energy consump on 2009 and 2010 (ktoe) 5967 Finnish PR Tables 1b, 1c and 1d: RES contribu on 2009 (MW, GWh, ktoe) 6068 Finnish PR Tables 1b, 1c and 1d: RES contribu on 2010 (MW, GWh, ktoe) 6169 Finnish PR Table 4: Biomass supply 2009 and 2010 (ktoe) 6270 Finnish PR Table 4a: Land use 2009 and 2010 (ha) 6371 Finnish PR Table 5: Ar cle 21(2) biofuels 2009 and 2010 (ktoe) 6372 Finnish PR Table 6: GHG emissions savings 2009 and 2010 (t CO2-eq) 6373 Finnish PR Table 7: Coopera on Mechanisms 2010 – 2020 (ktoe) 63
74 French PR Table 1: RES shares 2009 and 2010 (%) 6575 French PR Table 1a: Final energy consump on 2009 and 2010 (ktoe) 6576 French PR Tables 1b, 1c and 1d: RES contribu on 2009 (MW, GWh, ktoe) 6677 French PR Tables 1b, 1c and 1d: RES contribu on 2010 (MW, GWh, ktoe) 67
6

78 French PR Table 4: Biomass supply 2009 and 2010 (ktoe) 6879 French PR Table 4a: Land use 2009 and 2010 (ha) 6980 French PR Table 5: Ar cle 21(2) biofuels 2009 and 2010 (ktoe) 6981 French PR Table 6: GHG emissions savings 2009 and 2010 (t CO2-eq) 6982 French PR Table 7: Coopera on Mechanisms 2010 – 2020 (ktoe) 69
83 German PR Table 1: RES shares 2009 and 2010 (%) 7184 German PR Table 1a: Final energy consump on 2009 and 2010 (ktoe) 7185 German PR Tables 1b, 1c and 1d: RES contribu on 2009 (MW, GWh, ktoe) 7286 German PR Tables 1b, 1c and 1d: RES contribu on 2010 (MW, GWh, ktoe) 7387 German PR Table 4: Biomass supply 2009 and 2010 (ktoe) 7488 German PR Table 4a: Land use 2009 and 2010 (ha) 7589 German PR Table 5: Ar cle 21(2) biofuels 2009 and 2010 (ktoe) 7590 German PR Table 6: GHG emissions savings 2009 and 2010 (t CO2-eq) 7591 German PR Table 7: Coopera on Mechanisms 2010 – 2020 (ktoe) 75
92 Greek PR Table 1: RES shares 2009 and 2010 (%) 7793 Greek PR Table 1a: Final energy consump on 2009 and 2010 (ktoe) 7794 Greek PR Tables 1b, 1c and 1d: RES contribu on 2009 (MW, GWh, ktoe) 7895 Greek PR Tables 1b, 1c and 1d: RES contribu on 2010 (MW, GWh, ktoe) 7996 Greek PR Table 4: Biomass supply 2009 and 2010 (ktoe) 8097 Greek PR Table 4a: Land use 2009 and 2010 (ha) 8198 Greek PR Table 5: Ar cle 21(2) biofuels 2009 and 2010 (ktoe) 8199 Greek PR Table 6: GHG emissions savings 2009 and 2010 (t CO2-eq) 81100 Greek PR Table 7: Coopera on Mechanisms 2010 – 2020 (ktoe) 81
101 Hungarian PR Table 1: RES shares 2009 and 2010 (%) 83102 Hungarian PR Table 1a: Final energy consump on 2009 and 2010 (ktoe) 83103 Hungarian PR Tables 1b, 1c and 1d: RES contribu on 2009 (MW, GWh, ktoe) 84104 Hungarian PR Tables 1b, 1c and 1d: RES contribu on 2010 (MW, GWh, ktoe) 85105 Hungarian PR Table 4: Biomass supply 2009 and 2010 (ktoe) 86106 Hungarian PR Table 4a: Land use 2009 and 2010 (ha) 87107 Hungarian PR Table 5: Ar cle 21(2) biofuels 2009 and 2010 (ktoe) 87108 Hungarian PR Table 6: GHG emissions savings 2009 and 2010 (t CO2-eq) 87109 Hungarian PR Table 7: Coopera on Mechanisms 2010 – 2020 (ktoe) 87
110 Irish PR Table 1: RES shares 2009 and 2010 (%) 89111 Irish PR Table 1a: Final energy consump on 2009 and 2010 (ktoe) 89112 Irish PR Tables 1b, 1c and 1d: RES contribu on 2009 (MW, GWh, ktoe) 90113 Irish PR Tables 1b, 1c and 1d: RES contribu on 2010 (MW, GWh, ktoe) 91114 Irish PR Table 4: Biomass supply 2009 and 2010 (ktoe) 92115 Irish PR Table 4a: Land use 2009 and 2010 (ha) 93116 Irish PR Table 5: Ar cle 21(2) biofuels 2009 and 2010 (ktoe) 93117 Irish PR Table 6: GHG emissions savings 2009 and 2010 (t CO2-eq) 93118 Irish PR Table 7: Coopera on Mechanisms 2010 – 2020 (ktoe) 93
119 Italian PR Table 1: RES shares 2009 and 2010 (%) 95120 Italian PR Table 1a: Final energy consump on 2009 and 2010 (ktoe) 95121 Italian PR Tables 1b, 1c and 1d: RES contribu on 2009 (MW, GWh, ktoe) 96122 Italian PR Tables 1b, 1c and 1d: RES contribu on 2010 (MW, GWh, ktoe) 97123 Italian PR Table 4: Biomass supply 2009 and 2010 (ktoe) 98124 Italian PR Table 4a: Land use 2009 and 2010 (ha) 99
ECN-E--13-076 7

125 Italian PR Table 5: Ar cle 21(2) biofuels 2009 and 2010 (ktoe) 99126 Italian PR Table 6: GHG emissions savings 2009 and 2010 (t CO2-eq) 99127 Italian PR Table 7: Coopera on Mechanisms 2010 – 2020 (ktoe) 99
128 Latvian PR Table 1: RES shares 2009 and 2010 (%) 103129 Latvian PR Table 1a: Final energy consump on 2009 and 2010 (ktoe) 103130 Latvian PR Tables 1b, 1c and 1d: RES contribu on 2009 (MW, GWh, ktoe) 104131 Latvian PR Tables 1b, 1c and 1d: RES contribu on 2010 (MW, GWh, ktoe) 105132 Latvian PR Table 4: Biomass supply 2009 and 2010 (ktoe) 106133 Latvian PR Table 4a: Land use 2009 and 2010 (ha) 107134 Latvian PR Table 5: Ar cle 21(2) biofuels 2009 and 2010 (ktoe) 107135 Latvian PR Table 6: GHG emissions savings 2009 and 2010 (t CO2-eq) 107136 Latvian PR Table 7: Coopera on Mechanisms 2010 – 2020 (ktoe) 107
137 Lithuanian PR Table 1: RES shares 2009 and 2010 (%) 109138 Lithuanian PR Table 1a: Final energy consump on 2009 and 2010 (ktoe) 109139 Lithuanian PR Tables 1b, 1c and 1d: RES contribu on 2009 (MW, GWh, ktoe) 110140 Lithuanian PR Tables 1b, 1c and 1d: RES contribu on 2010 (MW, GWh, ktoe) 111141 Lithuanian PR Table 4: Biomass supply 2009 and 2010 (ktoe) 112142 Lithuanian PR Table 4a: Land use 2009 and 2010 (ha) 113143 Lithuanian PR Table 5: Ar cle 21(2) biofuels 2009 and 2010 (ktoe) 113144 Lithuanian PR Table 6: GHG emissions savings 2009 and 2010 (t CO2-eq) 113145 Lithuanian PR Table 7: Coopera on Mechanisms 2010 – 2020 (ktoe) 113
146 Luxembourg PR Table 1: RES shares 2009 and 2010 (%) 115147 Luxembourg PR Table 1a: Final energy consump on 2009 and 2010 (ktoe) 115148 Luxembourg PR Tables 1b, 1c and 1d: RES contribu on 2009 (MW, GWh, ktoe) 116149 Luxembourg PR Tables 1b, 1c and 1d: RES contribu on 2010 (MW, GWh, ktoe) 117150 Luxembourg PR Table 4: Biomass supply 2009 and 2010 (ktoe) 118151 Luxembourg PR Table 4a: Land use 2009 and 2010 (ha) 119152 Luxembourg PR Table 5: Ar cle 21(2) biofuels 2009 and 2010 (ktoe) 119153 Luxembourg PR Table 6: GHG emissions savings 2009 and 2010 (t CO2-eq) 119154 Luxembourg PR Table 7: Coopera on Mechanisms 2010 – 2020 (ktoe) 119
155 Maltese PR Table 1: RES shares 2009 and 2010 (%) 121156 Maltese PR Table 1a: Final energy consump on 2009 and 2010 (ktoe) 121157 Maltese PR Tables 1b, 1c and 1d: RES contribu on 2009 (MW, GWh, ktoe) 122158 Maltese PR Tables 1b, 1c and 1d: RES contribu on 2010 (MW, GWh, ktoe) 123159 Maltese PR Table 4: Biomass supply 2009 and 2010 (ktoe) 124160 Maltese PR Table 4a: Land use 2009 and 2010 (ha) 125161 Maltese PR Table 5: Ar cle 21(2) biofuels 2009 and 2010 (ktoe) 125162 Maltese PR Table 6: GHG emissions savings 2009 and 2010 (t CO2-eq) 125163 Maltese PR Table 7: Coopera on Mechanisms 2010 – 2020 (ktoe) 125
164 Dutch PR Table 1: RES shares 2009 and 2010 (%) 127165 Dutch PR Table 1a: Final energy consump on 2009 and 2010 (ktoe) 127166 Dutch PR Tables 1b, 1c and 1d: RES contribu on 2009 (MW, GWh, ktoe) 128167 Dutch PR Tables 1b, 1c and 1d: RES contribu on 2010 (MW, GWh, ktoe) 129168 Dutch PR Table 4: Biomass supply 2009 and 2010 (ktoe) 130169 Dutch PR Table 4a: Land use 2009 and 2010 (ha) 131170 Dutch PR Table 5: Ar cle 21(2) biofuels 2009 and 2010 (ktoe) 131171 Dutch PR Table 6: GHG emissions savings 2009 and 2010 (t CO2-eq) 131
8

172 Dutch PR Table 7: Coopera on Mechanisms 2010 – 2020 (ktoe) 131
173 Polish PR Table 1: RES shares 2009 and 2010 (%) 133174 Polish PR Table 1a: Final energy consump on 2009 and 2010 (ktoe) 133175 Polish PR Tables 1b, 1c and 1d: RES contribu on 2009 (MW, GWh, ktoe) 134176 Polish PR Tables 1b, 1c and 1d: RES contribu on 2010 (MW, GWh, ktoe) 135177 Polish PR Table 4: Biomass supply 2009 and 2010 (ktoe) 136178 Polish PR Table 4a: Land use 2009 and 2010 (ha) 137179 Polish PR Table 5: Ar cle 21(2) biofuels 2009 and 2010 (ktoe) 137180 Polish PR Table 6: GHG emissions savings 2009 and 2010 (t CO2-eq) 137181 Polish PR Table 7: Coopera on Mechanisms 2010 – 2020 (ktoe) 137
182 Portugese PR Table 1: RES shares 2009 and 2010 (%) 141183 Portugese PR Table 1a: Final energy consump on 2009 and 2010 (ktoe) 141184 Portugese PR Tables 1b, 1c and 1d: RES contribu on 2009 (MW, GWh, ktoe) 142185 Portugese PR Tables 1b, 1c and 1d: RES contribu on 2010 (MW, GWh, ktoe) 143186 Portugese PR Table 4: Biomass supply 2009 and 2010 (ktoe) 144187 Portugese PR Table 4a: Land use 2009 and 2010 (ha) 145188 Portugese PR Table 5: Ar cle 21(2) biofuels 2009 and 2010 (ktoe) 145189 Portugese PR Table 6: GHG emissions savings 2009 and 2010 (t CO2-eq) 145190 Portugese PR Table 7: Coopera on Mechanisms 2010 – 2020 (ktoe) 145
191 Romanian PR Table 1: RES shares 2009 and 2010 (%) 147192 Romanian PR Table 1a: Final energy consump on 2009 and 2010 (ktoe) 147193 Romanian PR Tables 1b, 1c and 1d: RES contribu on 2009 (MW, GWh, ktoe) 148194 Romanian PR Tables 1b, 1c and 1d: RES contribu on 2010 (MW, GWh, ktoe) 149195 Romanian PR Table 4: Biomass supply 2009 and 2010 (ktoe) 150196 Romanian PR Table 4a: Land use 2009 and 2010 (ha) 151197 Romanian PR Table 5: Ar cle 21(2) biofuels 2009 and 2010 (ktoe) 151198 Romanian PR Table 6: GHG emissions savings 2009 and 2010 (t CO2-eq) 151199 Romanian PR Table 7: Coopera on Mechanisms 2010 – 2020 (ktoe) 151
200 Slovakian PR Table 1: RES shares 2009 and 2010 (%) 153201 Slovakian PR Table 1a: Final energy consump on 2009 and 2010 (ktoe) 153202 Slovakian PR Tables 1b, 1c and 1d: RES contribu on 2009 (MW, GWh, ktoe) 154203 Slovakian PR Tables 1b, 1c and 1d: RES contribu on 2010 (MW, GWh, ktoe) 155204 Slovakian PR Table 4: Biomass supply 2009 and 2010 (ktoe) 156205 Slovakian PR Table 4a: Land use 2009 and 2010 (ha) 157206 Slovakian PR Table 5: Ar cle 21(2) biofuels 2009 and 2010 (ktoe) 157207 Slovakian PR Table 6: GHG emissions savings 2009 and 2010 (t CO2-eq) 157208 Slovakian PR Table 7: Coopera on Mechanisms 2010 – 2020 (ktoe) 157
209 Slovenian PR Table 1: RES shares 2009 and 2010 (%) 159210 Slovenian PR Table 1a: Final energy consump on 2009 and 2010 (ktoe) 159211 Slovenian PR Tables 1b, 1c and 1d: RES contribu on 2009 (MW, GWh, ktoe) 160212 Slovenian PR Tables 1b, 1c and 1d: RES contribu on 2010 (MW, GWh, ktoe) 161213 Slovenian PR Table 4: Biomass supply 2009 and 2010 (ktoe) 162214 Slovenian PR Table 4a: Land use 2009 and 2010 (ha) 163215 Slovenian PR Table 5: Ar cle 21(2) biofuels 2009 and 2010 (ktoe) 163216 Slovenian PR Table 6: GHG emissions savings 2009 and 2010 (t CO2-eq) 163217 Slovenian PR Table 7: Coopera on Mechanisms 2010 – 2020 (ktoe) 163
ECN-E--13-076 9

218 Spanish PR Table 1: RES shares 2009 and 2010 (%) 165219 Spanish PR Table 1a: Final energy consump on 2009 and 2010 (ktoe) 165220 Spanish PR Tables 1b, 1c and 1d: RES contribu on 2009 (MW, GWh, ktoe) 166221 Spanish PR Tables 1b, 1c and 1d: RES contribu on 2010 (MW, GWh, ktoe) 167222 Spanish PR Table 4: Biomass supply 2009 and 2010 (ktoe) 168223 Spanish PR Table 4a: Land use 2009 and 2010 (ha) 169224 Spanish PR Table 5: Ar cle 21(2) biofuels 2009 and 2010 (ktoe) 169225 Spanish PR Table 6: GHG emissions savings 2009 and 2010 (t CO2-eq) 169226 Spanish PR Table 7: Coopera on Mechanisms 2010 – 2020 (ktoe) 169
227 Swedish PR Table 1: RES shares 2009 and 2010 (%) 171228 Swedish PR Table 1a: Final energy consump on 2009 and 2010 (ktoe) 171229 Swedish PR Tables 1b, 1c and 1d: RES contribu on 2009 (MW, GWh, ktoe) 172230 Swedish PR Tables 1b, 1c and 1d: RES contribu on 2010 (MW, GWh, ktoe) 173231 Swedish PR Table 4: Biomass supply 2009 and 2010 (ktoe) 174232 Swedish PR Table 4a: Land use 2009 and 2010 (ha) 175233 Swedish PR Table 5: Ar cle 21(2) biofuels 2009 and 2010 (ktoe) 175234 Swedish PR Table 6: GHG emissions savings 2009 and 2010 (t CO2-eq) 175235 Swedish PR Table 7: Coopera on Mechanisms 2010 – 2020 (ktoe) 175
236 UK’s PR Table 1: RES shares 2009 and 2010 (%) 181237 UK’s PR Table 1a: Final energy consump on 2009 and 2010 (ktoe) 181238 UK’s PR Tables 1b, 1c and 1d: RES contribu on 2009 (MW, GWh, ktoe) 182239 UK’s PR Tables 1b, 1c and 1d: RES contribu on 2010 (MW, GWh, ktoe) 183240 UK’s PR Table 4: Biomass supply 2009 and 2010 (ktoe) 184241 UK’s PR Table 4a: Land use 2009 and 2010 (ha) 185242 UK’s PR Table 5: Ar cle 21(2) biofuels 2009 and 2010 (ktoe) 185243 UK’s PR Table 6: GHG emissions savings 2009 and 2010 (t CO2-eq) 185244 UK’s PR Table 7: Coopera on Mechanisms 2010 – 2020 (ktoe) 185
245 All 27 Member States PR Table 1: RES shares 2009 and 2010 (%) 189246 All 27 Member States PR Table 1a: final energy consump on 2009 and 2010
(ktoe) 189247 All 27 Member States PR Tables 1b, 1c and 1d: RES contribu on 2009 (MW,
GWh, ktoe) 190248 All 27 Member States PR Tables 1b, 1c and 1d: RES contribu on 2010 (MW,
GWh, ktoe) 191249 All 27 Member States PR Table 4: biomass supply 2009 and 2010 (ktoe) 192250 All 27 Member States PR Table 4a: land use 2009 and 2010 (ha) 193251 All 27 Member States PR Table 5: Ar cle 21(2) biofuels 2009 and 2010 (ktoe) 193252 All 27 Member States PR Table 6: GHG emissions savings 2009 and 2010 (t
CO2-eq) 193253 All 27 Member States PR Table 7: Coopera on Mechanisms 2010 – 2020 (ktoe) 193
254 PR Table 1: Renewable hea ng and cooling (%) 195255 PR Table 1: Renewable electricity (%) 196256 PR Table 1: Renewable Transport (%) 196257 PR Table 1: Overall renewable energy share (%) 197258 PR Table 1: Renewables through coopera on mechanism (%) 197259 PR Table 1: Surplus for coopera on mechanism (%) 198
260 PR Table 1a: Gross final consump on of RES for hea ng and cooling (ktoe) 199
10

261 PR Table 1a: Gross final consump on of electricity from RES (ktoe) 200262 PR Table 1a: Gross final consump on of energy from RES in transport (ktoe) 200263 PR Table 1a: Gross total RES consump on (ktoe) 201264 PR Table 1a: Transfer of RES to other Member States (ktoe) 201265 PR Table 1a: Transfer of RES from other Member States and 3rd countries
(ktoe) 202266 PR Table 1a: RES consump on adjusted for target (ktoe) 202
267 PR Table 1b: Hydropower (MW, GWh) 204268 PR Table 1b: Hydropower (non pumped) (MW, GWh) 205269 PR Table 1b: Hydropower <1 MW (non pumped) (MW, GWh) 206270 PR Table 1b: Hydropower 1 MW - 10 MW (non pumped) (MW, GWh) 207271 PR Table 1b: Hydropower >10 MW (non pumped) (MW, GWh) 208272 PR Table 1b: Hydropower pumped storage (MW, GWh) 209273 PR Table 1b: Hydropower mixed (normalised) (MW, GWh) 210274 PR Table 1b: Geothermal electricity (MW, GWh) 211275 PR Table 1b: Solar electricity (PV and CSP) (MW, GWh) 212276 PR Table 1b: Solar photovoltaic (PV) (MW, GWh) 213277 PR Table 1b: Concentrated solar power (CSP) (MW, GWh) 214278 PR Table 1b: Tidal, wave and ocean energy (electricity) (MW, GWh) 215279 PR Table 1b: Wind power (onshore and offshore) (MW, GWh) 216280 PR Table 1b: Onshore wind (MW, GWh) 217281 PR Table 1b: Offshore wind (MW, GWh) 218282 PR Table 1b: Biomass for electricity (MW, GWh) 219283 PR Table 1b: Solid biomass for electricity (MW, GWh) 220284 PR Table 1b: Biogas for electricity (MW, GWh) 221285 PR Table 1b: Bioliquids for electricity (MW, GWh) 222286 PR Table 1b: Total for electricity (MW, GWh) 223287 PR Table 1b: Total CHP (electric) (MW, GWh) 224
288 PR Table 1c: Geothermal heat (ktoe) 225289 PR Table 1c: Solar thermal heat (ktoe) 226290 PR Table 1c: Biomass heat (ktoe) 227291 PR Table 1c: Solid biomass heat (ktoe) 227292 PR Table 1c: Biogas heat (ktoe) 228293 PR Table 1c: Bioliquids heat (ktoe) 228294 PR Table 1c: Renewable energy from heat pumps (ktoe) 229295 PR Table 1c: Aerothermal heat pumps (ktoe) 229296 PR Table 1c: Geothermal heat pumps (ktoe) 230297 PR Table 1c: Hydrothermal heat pumps (ktoe) 230298 PR Table 1c: Total heat (ktoe) 231299 PR Table 1c: Total district hea ng (heat) (ktoe) 231300 PR Table 1c: Total biomass in households (heat) (ktoe) 232
301 PR Table 1d: Bioethanol / bio-ETBE (ktoe) 233302 PR Table 1d: Bioethanol / bio-ETBE Ar cle 21.2 (ktoe) 234303 PR Table 1d: Bioethanol / bio-ETBE imported (ktoe) 235304 PR Table 1d: Biodiesel (ktoe) 235305 PR Table 1d: Biodiesel Ar cle 21.2 (ktoe) 236306 PR Table 1d: Biodiesel imported (ktoe) 236307 PR Table 1d: Hydrogen from renewables (ktoe) 237
ECN-E--13-076 11

308 PR Table 1d: Renewable electricity in (road and non-road) transport (ktoe) 237309 PR Table 1d: Renewable electricity road transport (ktoe) 238310 PR Table 1d: Renewable electricity non-road transport (ktoe) 238311 PR Table 1d: Other biofuels (ktoe) 239312 PR Table 1d: Other biofuels Ar cle 21.2 (ktoe) 239313 PR Table 1d: Total (transport) (ktoe) 240
12

1Introduction
This work is an integrated compila on of all Progress Reports on renewable energy in theEuropean Union (27 Member States). First, the legal documents following the EuropeanDirec ve and their context are beingmen oned (Sec on 1.1), followed by a reader’s guideto this work (Sec on 1.2). Next, the purpose of this report and the targeted audience areexplained in Sec on 1.3. Then, possible future work is being announced (Sec on 1.4) andfinally an the possibility is introduced for the reader to provide feedback (Sec on 1.5).
1.1 Progress Reports: the context
Following the European Union Direc ve 2009/28/EC all European Union (EU) MemberAll European Union MemberStates have obliga ons onrepor ng in the framework ofRES Direc ve 2009/28/EC
States (MS) have the obliga on to inform the European Commission (EC) on:
1. Their es mate for Renewable Energy Sources (RES) development up to the year 2020,as defined in Ar cle 4 of the RES Direc ve. These projec ons have all been publishedand are available for download at the website of the European Commission1. Thesereports are called ‘Na onal Renewable Energy Ac on Plans’ (NREAPs).
2. Their progress regarding the implementa onof RES. This needs to bedone in a ‘ProgressReport’ (PR) which is to be published every two years, as defined in Ar cle 22 of theRES Direc ve. The first versions of the 27 Progress Reports (with data for 2009 and2010) were due on 31 December 2011 and are available for download at the websiteof the European Commission2. An overview of the Progress Reports and their deliverydates is presented in Table 1.
ECN has compiled a database (last update November 2011) of all the energy projec onsPreviously, ECN has made all RESprojec ons up to 2020 publiclyavailable at www.ecn.nl/nreap
towards 2020 (the NREAPs, available at www.ecn.nl/nreap). This database and the ac-companying data report assist stakeholders in evalua ng the ambi ons of the EuropeanUnion Member States. These NREAPs were all published in 2010-2011 and are ‘carved instone’, i.e. these documents will remain valid up to 2021, when the EU RES target will beevaluated. Possibly, MS provide updates of their reports, which might be added to the
1 h p://ec.europa.eu/energy/renewables/ac on_plan_en.htm (sourced October 2013)
2 h p://ec.europa.eu/energy/renewables/reports/2011_en.htm (sourced October 2013)
ECN-E--13-076 Chapter 1. Introduc on 13

ECN database3 in a later stage.
Un l now the data from the progress reports (which were due in December 2011) wereThis report makes all ProgressReport data integrally available,along with a database. Both areavailable at www.ecn.nl/nreap
never released in an integral and accessible manner. This has been done in the current re-port. Aworksheet with all underlying data is available for download at www.ecn.nl/nreap.
1.2 How to read this report?
This data report and the accompanying data tables make a large amount of data available.The PDF version of this reporthas clickable references.
Consequently, this report featuresmany tables. In some cases comments have beenmadeto the data, which mostly stem from the original progress reports but also have beenadded by the author for clarifica on. In most cases the translated versions of the progressreports have been used.
The nomenclature of the tables in this report follow the original numbering as defined inthe Template for the Progress Report4.
The report first presents an overview of renewable energy per country, star ng with Aus-tria (page 17) up to the United Kingdom (page 181). The added value of these tables isthat all data are available at a glance, and can easily be compared to data from othercountries. Moreover, the achievements in renewable electricity, in renewable hea ngand cooling and in renewable transport have been displayed in aggregate tables (one for2009 and one for 2010), which addi onally shows the importance of each of these sourcesin the overall picture by calculated shares. On page 189 an overview is presented for theEuropean Union (27 Member States). These data have been calculated by summing thecontribu ons from the individual Member States.
Secondly, the report presents a separate table for country contribu ons to each of theProgress Report table’s rows. This makes it possible to see differences between countriesfor each reported parameter. This part runs from page 195 to 240.
Note that Member States in their Progress Reports do not consistently apply the sameamount of decimals in their data tables. Naturally, for smaller countries the decimals havemore relevance than for large countries. For the purpose of this report it has been decidedto display the original decimals without rounding. This makes that the table columns aligndata non-consistently.
As the report is meant as a reference book, the reader is encouraged to not print thedocument, but to use in in its original format, namely PDF. This version has addi onalfunc onality like automated cross-links (pagenumbers in the comments and the index)and ac ve hyperlinks to relevant loca ons on the internet.
1.3 Purpose and target audience
The inten on of this work is to serve the European energy experts with a reference bookEnergy professionals and policymakers may benefit from thework in this report
on renewable energy: research ins tutes, sta s cal offices, the energy industry, energyservice companies, renewable energy associa ons, energy consultants, banks and policymakers on local, na onal and European level. This report focuses on the Progres Reports
3 A er the closure of the ECN NREAP database in November 2011 three Member States amended their projec ons:the Czech Republic, Poland and Spain. This has not been covered yet in the NREAP database and data report.
4 h p://ec.europa.eu/energy/renewables/reports/2011_en.htm (sourced October 2013)
14
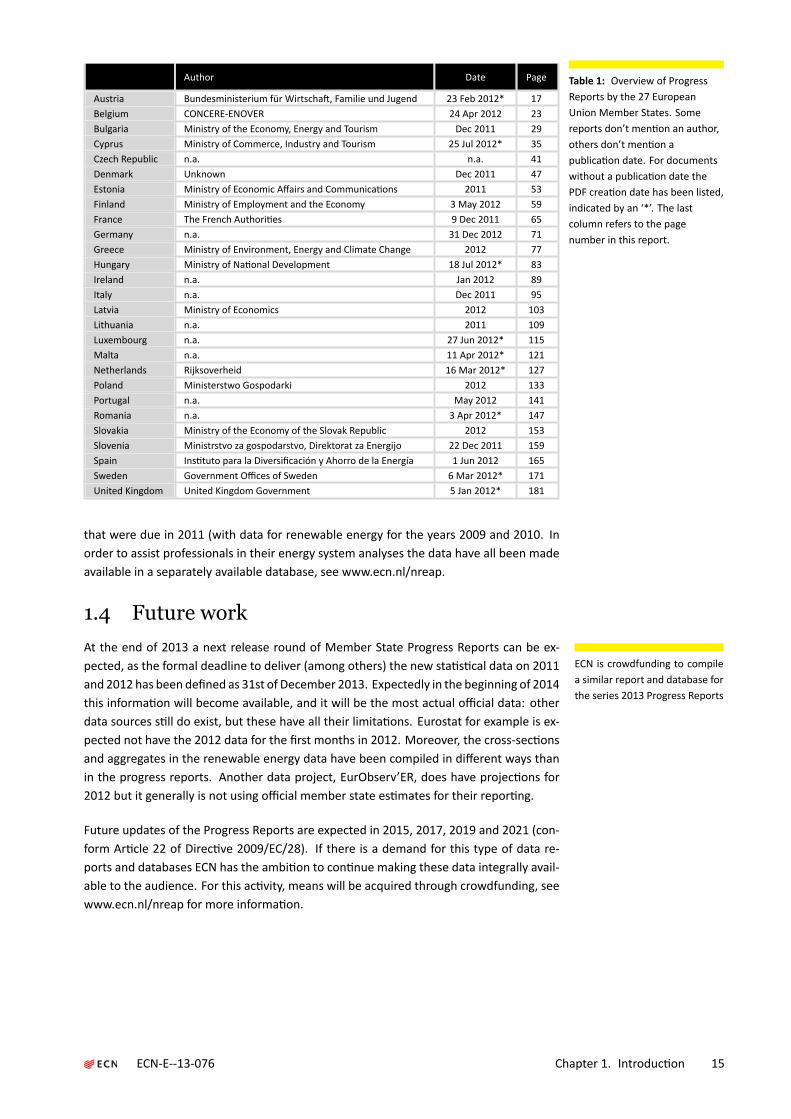
Author Date Page
Austria Bundesministerium für Wirtscha , Familie und Jugend 23 Feb 2012* 17Belgium CONCERE-ENOVER 24 Apr 2012 23Bulgaria Ministry of the Economy, Energy and Tourism Dec 2011 29Cyprus Ministry of Commerce, Industry and Tourism 25 Jul 2012* 35Czech Republic n.a. n.a. 41Denmark Unknown Dec 2011 47Estonia Ministry of Economic Affairs and Communica ons 2011 53Finland Ministry of Employment and the Economy 3 May 2012 59France The French Authori es 9 Dec 2011 65Germany n.a. 31 Dec 2012 71Greece Ministry of Environment, Energy and Climate Change 2012 77Hungary Ministry of Na onal Development 18 Jul 2012* 83Ireland n.a. Jan 2012 89Italy n.a. Dec 2011 95Latvia Ministry of Economics 2012 103Lithuania n.a. 2011 109Luxembourg n.a. 27 Jun 2012* 115Malta n.a. 11 Apr 2012* 121Netherlands Rijksoverheid 16 Mar 2012* 127Poland Ministerstwo Gospodarki 2012 133Portugal n.a. May 2012 141Romania n.a. 3 Apr 2012* 147Slovakia Ministry of the Economy of the Slovak Republic 2012 153Slovenia Ministrstvo za gospodarstvo, Direktorat za Energijo 22 Dec 2011 159Spain Ins tuto para la Diversificación y Ahorro de la Energía 1 Jun 2012 165Sweden Government Offices of Sweden 6 Mar 2012* 171United Kingdom United Kingdom Government 5 Jan 2012* 181
Table 1: Overview of ProgressReports by the 27 EuropeanUnion Member States. Somereports don’t men on an author,others don’t men on apublica on date. For documentswithout a publica on date thePDF crea on date has been listed,indicated by an ‘*’. The lastcolumn refers to the pagenumber in this report.
that were due in 2011 (with data for renewable energy for the years 2009 and 2010. Inorder to assist professionals in their energy system analyses the data have all been madeavailable in a separately available database, see www.ecn.nl/nreap.
1.4 Future work
At the end of 2013 a next release round of Member State Progress Reports can be ex-ECN is crowdfunding to compilea similar report and database forthe series 2013 Progress Reports
pected, as the formal deadline to deliver (among others) the new sta s cal data on 2011and 2012 has been defined as 31st of December 2013. Expectedly in the beginning of 2014this informa on will become available, and it will be the most actual official data: otherdata sources s ll do exist, but these have all their limita ons. Eurostat for example is ex-pected not have the 2012 data for the first months in 2012. Moreover, the cross-sec onsand aggregates in the renewable energy data have been compiled in different ways thanin the progress reports. Another data project, EurObserv’ER, does have projec ons for2012 but it generally is not using official member state es mates for their repor ng.
Future updates of the Progress Reports are expected in 2015, 2017, 2019 and 2021 (con-form Ar cle 22 of Direc ve 2009/EC/28). If there is a demand for this type of data re-ports and databases ECN has the ambi on to con nue making these data integrally avail-able to the audience. For this ac vity, means will be acquired through crowdfunding, seewww.ecn.nl/nreap for more informa on.
ECN-E--13-076 Chapter 1. Introduc on 15

1.5 Questionnaire
In order to know more about the preferences of the targeted audience, ECN is hos ngECN welcomes feedback on thisreport at www.ecn.nl/nreap
an online ques onnaire at www.ecn.nl/nreap where readers can indicate which featuresthey would prefer for the upcoming reports. The following op ons might be cked:
1. In which form are the Progress Report data most useful to you?
a) Data report in PDF.
b) Database in spreadsheet format.
c) Database ready for use in pivot tables.
2. What features would you welcome for the upcoming Progress Report compila on re-port?
a) Derived indicators (annual growth, rela ve shares, per capita figures).
b) Not only tables but also graphs.
c) A comparison with other data sources (Eurostat, EurObserv’ER).
d) Online access and online graphical interface.
e) Comparison to the ‘Indica ve Trajectory’ as defined in Direc ve 28/2009/EC.
f) A presenta on in different energy units (TJ or GWh instead of ktoe).
The ques onnaire also addresses ques ons on the financing of this new report, in returnof which readers may obtain ‘early-releases’ of the new-to-be-published progress reportcompila on or database. Finally, it is possible to leave your e-mail address for receiving ano fica on once the report has been published.
16

2Austria
Unit 2009 2010 Comment
Renewable hea ng and cooling % 32.3 32.2Renewable electricity % 67.4 65.3Renewable Transport % 8 7.9Overall renewable energy share % 30.9 30.8Renewables through coopera on mechanism % 0 0Surplus for coopera on mechanism % 0 0
Table 2: Austrian PR Table 1: Thesectoral (electricity, hea ng andcooling, and transport) andoverall shares of energy fromrenewable sources in Austria (seeTable 3 and Table 4a of theNREAP)
Unit 2009 2010 Comment
Gross final consump on of RES for hea ng and cooling ktoe 3678 4070Gross final consump on of electricity from RES ktoe 3886 3948Gross final consump on of energy from RES in transport ktoe 728 716Gross total RES consump on ktoe 8100 8539Transfer of RES to other Member States ktoe 0 0Transfer of RES from other Member States and 3rd countries ktoe 0 0RES consump on adjusted for target ktoe 8100 8539
Table 3: Austrian PR Table 1a:Calcula on table for therenewable energy contribu on inAustria of each sector to finalenergy consump on (ktoe) (seeTable 4a of the NREAP)
ECN-E--13-076 Chapter 2. Austria 17

2009
Capacity Energy Comment
Renewable Electricity MW GWh ktoe %
Hydropower 10651 38757 3333 40.2%Hydropower (non pumped) 7828 34653 2980 35.9%Hydropower <1 MW (non pumped) 222 1610 138 1.7%Hydropower 1 MW - 10 MW (non pumped) 630 3251 280 3.4%Hydropower >10 MW (non pumped) 6976 29793 2562 30.9%Hydropower pumped storage 2823 4104 353 4.3%Hydropower mixed (normalised) 10651 38757 3333 40.2%Geothermal 1 2 0 0.0%Solar 51 49 4 0.1%Solar photovoltaic 51 49 4 0.1%Concentrated solar power 0 0 0 0.0%Tidal, wave and ocean energy 0 0 0 0.0%Wind power 994 2024 174 2.1%Onshore wind 994 2024 174 2.1%Offshore wind 0 0 0 0.0%Biomass 1150 4370 376 4.5%Solid biomass 684 2599 223 2.7%Biogas 161 611 53 0.6%Bioliquids 305 1160 100 1.2%Total 14709 45201 3887 46.9%Total CHP 563 2141 184 2.2%
Renewable Hea ng and Cooling ktoe % Comment
Geothermal 19 0.2%Solar thermal 123 1.5%Biomass 3421 41.3%Solid biomass 3388 40.9%Biogas 27 0.3%Bioliquids 6 0.1%Renewable energy from heat pumps 115 1.4%Aerothermal heat pumps n.a. n.a.Geothermal heat pumps n.a. n.a.Hydrothermal heat pumps n.a. n.a.Total 3678 44.4%Total district hea ng 614 7.4%Total biomass in households 1504 18.1%
Renewable Transport ktoe % Comment
Bioethanol / bio-ETBE 63 0.8%Bioethanol / bio-ETBE Ar cle 21.2 n.a. n.a.Bioethanol / bio-ETBE imported 34 0.4%Biodiesel 355 4.3%Biodiesel Ar cle 21.2 n.a. n.a.Biodiesel imported 278 3.4%Hydrogen from renewables 0 0.0%Renewable electricity 193 2.3%Renewable electricity road transport 0 0.0%Renewable electricity non-road transport 193 2.3%Other biofuels 114 1.4%Other biofuels Ar cle 21.2 n.a. n.a.Total 728 8.8%
Table 4: Austrian PR Table 1b,Table 1c and Table 1d: Total actual
contribu on (installed capacity,gross electricity genera on, finalenergy consump on) from eachrenewable energy technology in
Austria for 2009 to meet thebinding 2020 targets and the
indica ve interim trajectory forthe shares of energy from
renewable resources in electricity(see Table 10a of the NREAP),
hea ng and cooling (see Table 11of the NREAP) and in the
transport sector (see Table 12 ofthe NREAP)
18

2010
Capacity Energy Comment
Renewable Electricity MW GWh ktoe %
Hydropower 10600 39237 3374 40.7%Hydropower (non pumped) 7843 34647 2979 35.9%Hydropower <1 MW (non pumped) 134 1677 144 1.7%Hydropower 1 MW - 10 MW (non pumped) 762 3343 287 3.5%Hydropower >10 MW (non pumped) 6947 29627 2547 30.7%Hydropower pumped storage 2757 4590 395 4.8%Hydropower mixed (normalised) 10600 39237 3374 40.7%Geothermal 1 1 0 0.0%Solar 93 89 8 0.1%Solar photovoltaic 93 89 8 0.1%Concentrated solar power 0 0 0 0.0%Tidal, wave and ocean energy 0 0 0 0.0%Wind power 977 2035 175 2.1%Onshore wind 994 2035 175 2.1%Offshore wind 0 0 0 0.0%Biomass 1198 4554 392 4.7%Solid biomass 704 2674 230 2.8%Biogas 171 649 56 0.7%Bioliquids 324 1232 106 1.3%Total 14971 45916 3948 47.6%Total CHP 616 2339 201 2.4%
Renewable Hea ng and Cooling ktoe % Comment
Geothermal 20 0.2%Solar thermal 164 2.0%Biomass 3767 45.4%Solid biomass 3734 45.0%Biogas 28 0.3%Bioliquids 4 0.0%Renewable energy from heat pumps 119 1.4%Aerothermal heat pumps n.a. n.a.Geothermal heat pumps n.a. n.a.Hydrothermal heat pumps n.a. n.a.Total 4070 49.1%Total district hea ng 727 8.8%Total biomass in households 1681 20.3%
Renewable Transport ktoe % Comment
Bioethanol / bio-ETBE 68 0.8%Bioethanol / bio-ETBE Ar cle 21.2 n.a. n.a.Bioethanol / bio-ETBE imported 39 0.5%Biodiesel 374 4.5%Biodiesel Ar cle 21.2 n.a. n.a.Biodiesel imported 322 3.9%Hydrogen from renewables 0 0.0%Renewable electricity 194 2.3%Renewable electricity road transport 0 0.0%Renewable electricity non-road transport 194 2.3%Other biofuels 77 0.9%Other biofuels Ar cle 21.2 n.a. n.a.Total 720 8.7%
Table 5: Austrian PR Table 1b,Table 1c and Table 1d: Total actualcontribu on (installed capacity,gross electricity genera on, finalenergy consump on) from eachrenewable energy technology inAustria for 2010 to meet thebinding 2020 targets and theindica ve interim trajectory forthe shares of energy fromrenewable resources in electricity(see Table 10a of the NREAP),hea ng and cooling (see Table 11of the NREAP) and in thetransport sector (see Table 12 ofthe NREAP)
ECN-E--13-076 Chapter 2. Austria 19

Biomass supply for hea ng and electricity Domes c raw material
Unit 2009 2010 Comment
Direct supply of wood biomass from forests and otherwooded land energy genera on
ktoe 1660 n.a.
Indirect supply of wood biomass ktoe 1320 n.a.Energy crops ktoe 5 n.a.Agricultural by-products / processed residues and fisheryby-products
ktoe n.a. n.a.
Biomass from waste ktoe n.a. n.a.Others ktoe n.a. n.a.Total biomass for hea ng and electricity* ktoe 2985 n.a.
Biomass supply for transport Unit 2009 2010 Comment
Common arable crops for biofuels ktoe n.a. n.a.Energy crops and short rota on trees for biofuels ktoe n.a. n.a.Others ktoe n.a. n.a.Total biomass for transport* ktoe n.a. n.a.
Total biomass for all sectors* ktoe 2985 0
Biomass supply for hea ng and electricity Raw material imported from EU
Unit 2009 2010 CommentDirect supply of wood biomass from forests and otherwooded land energy genera on
ktoe 200 n.a.
Indirect supply of wood biomass ktoe 880 n.a.Energy crops ktoe n.a. n.a.Agricultural by-products / processed residues and fisheryby-products
ktoe n.a. n.a.
Biomass from waste ktoe n.a. n.a.Others ktoe n.a. n.a.Total biomass for hea ng and electricity* ktoe 1080 n.a.
Biomass supply for transport Unit 2009 2010 Comment
Common arable crops for biofuels ktoe 0 n.a.Energy crops and short rota on trees for biofuels ktoe 0 n.a.Others ktoe 0 n.a.Total biomass for transport* ktoe 0 n.a.
Total biomass for all sectors* ktoe 1080 0
Biomass supply for hea ng and electricity Raw material imported from non-EU
Unit 2009 2010 CommentDirect supply of wood biomass from forests and otherwooded land energy genera on
ktoe n.a. n.a.
Indirect supply of wood biomass ktoe 70 n.a.Energy crops ktoe n.a. n.a.Agricultural by-products / processed residues and fisheryby-products
ktoe n.a. n.a.
Biomass from waste ktoe n.a. n.a.Others ktoe n.a. n.a.Total biomass for hea ng and electricity* ktoe 70 n.a.
Biomass supply for transport Unit 2009 2010 Comment
Common arable crops for biofuels ktoe 0 n.a.Energy crops and short rota on trees for biofuels ktoe 0 n.a.Others ktoe 0 n.a.Total biomass for transport* ktoe 0 n.a.
Total biomass for all sectors* ktoe 70 0
* The values indicated with ‘*’ are calculated values and have not been men oned in the Progress Reportsas such.
Table 6: Austrian PR Table 4:Biomass supply for hea ng and
electricity (see Table 7 of theNREAP)
20

Unit 2009 2010 Comment
Land used for common arable crops and oil seeds ha 50000 50000 1 (p.22)Land used for short rota on trees ha 900 1100Land used for other energy crops such as grasses ha 1450 1320
Table 7: Austrian PR Table 4a:Current domes c agriculturalland use for produc on of cropsdedicated to energy produc on(see Table 8 of the NREAP)
Unit 2009 2010 Comment
Produc on - Fuel type X ktoe 0 0 2 (p.22)Consump on - Fuel type X ktoe 0 0Total produc on Art.21.2.biofuels ktoe 0 0Total consump on Art.21.2. biofuels ktoe 0 0Share of 21(2) fuels from total RES-T % 0 0
Table 8: Austrian PR Table 5:Produc on and consump on ofAr cle 21(2) biofuels (ktoe)
Unit 2009 2010 Comment
Total es mated net GHG emission saving from RES t CO2-eq 28.8 29.9Es mated net GHG saving from the use of RES-E t CO2-eq 17.9 18.2Es mated net GHG saving from the use of RES-H/C t CO2-eq 10.9 11.7Es mated net GHG saving from the use of RES-T t CO2-eq n.a. n.a.
Table 9: Austrian PR Table 6:Es mated GHG emission savingsfrom the use of renewable energy
Actual/es matedexcess produc on
Actual/es mateddeficit produc on
Comment
Renewable energy - -Origin/des na on - -Unit ktoe ktoe2010 0 02011 0 02012 0 02013 0 02014 0 02015 0 02016 0 02017 0 02018 0 02019 0 02020 0 0
Table 10: Austrian PR Table 7:Actual and es mated excessand/or deficit (-) produc on ofrenewable energy compared tothe indica ve trajectory whichcould be transferred to/fromother Member States and/orthird countries in Austria (ktoe)(see Table 9 of the NREAP)
ECN-E--13-076 Chapter 2. Austria 21

Comments for Austria
1: Values: 50000 ha (net) versus 115000 ha (gross). Net surface takes into account surfacefactoring for coproduc on of protein feed (DDGS, rapeseed cake). Only part of ethanolproduc on (starch) and vegetable oil produc on (oil) yield is used to produce biofuels;most of the raw material is used for high-grade protein feed for livestock and, as such,can subs tute protein feed imports (e.g. soya imports from soya-growing areas in SouthAmerica). Gross surface, does not take into account coproduc on of high-grade proteinfeeds. Gross surfaces are o en used in misleading argumenta ons about the compe veposi on of land use, therefore, the indica on of net surfaces has greater importance.2: At the moment there are no market-relevant volumes in Austria
22

3Belgium
Unit 2009 2010 Comment
Renewable hea ng and cooling % 4.35 4.51Renewable electricity % 6.33 6.97Renewable Transport % 3.03 4.46Overall renewable energy share % 4.51 5.05Renewables through coopera on mechanism % 0 0Surplus for coopera on mechanism % 0 0
Table 11: Belgian PR Table 1: Thesectoral (electricity, hea ng andcooling, and transport) andoverall shares of energy fromrenewable sources in Belgium(see Table 3 and Table 4a of theNREAP)
Unit 2009 2010 Comment
Gross final consump on of RES for hea ng and cooling ktoe 839.48 987.48Gross final consump on of electricity from RES ktoe 493.98 596.23Gross final consump on of energy from RES in transport ktoe 228.49 345.49Gross total RES consump on ktoe 1561.95 1929.21Transfer of RES to other Member States ktoe n.a. n.a.Transfer of RES from other Member States and 3rd countries ktoe n.a. n.a.RES consump on adjusted for target ktoe n.a. n.a.
Table 12: Belgian PR Table 1a:Calcula on table for therenewable energy contribu on inBelgium of each sector to finalenergy consump on (ktoe) (seeTable 4a of the NREAP)
ECN-E--13-076 Chapter 3. Belgium 23

2009
Capacity Energy Comment
Renewable Electricity MW GWh ktoe %
Hydropower 1428.9 1801.3 155 9.2%Hydropower (non pumped) 118.9 372.1 32 1.9%Hydropower <1 MW (non pumped) 8.8 24.7 2 0.1%Hydropower 1 MW - 10 MW (non pumped) 54.7 198.2 17 1.0%Hydropower >10 MW (non pumped) 55.3 149.1 13 0.8%Hydropower pumped storage 1310 1429.3 123 7.3%Hydropower mixed (normalised) 0 0 0 0.0%Geothermal 0 0 0 0.0%Solar 218.4 169.4 15 0.9%Solar photovoltaic 218.4 169.4 15 0.9%Concentrated solar power 0 0 0 0.0%Tidal, wave and ocean energy 0 0 0 0.0%Wind power 586.4 1092.7 94 5.6%Onshore wind 554.9 1010.8 87 5.2%Offshore wind 31.5 82 7 0.4%Biomass 900.7 4103.8 353 21.0%Solid biomass 638 3268.1 281 16.7%Biogas 111.8 462.2 40 2.4%Bioliquids 150.9 373.5 32 1.9%Total 3134.3 7167.3 616 36.6%Total CHP 181 971.5 84 5.0%
Renewable Hea ng and Cooling ktoe % Comment
Geothermal 1.9 0.1%Solar thermal 11.1 0.7%Biomass 814.4 48.4%Solid biomass 755.1 44.9%Biogas 23.5 1.4%Bioliquids 36.4 2.2%Renewable energy from heat pumps 11.4 0.7%Aerothermal heat pumps 0 0.0%Geothermal heat pumps 11.4 0.7%Hydrothermal heat pumps 0 0.0%Total 838.8 49.8%Total district hea ng 18.3 1.1%Total biomass in households 220.4 13.1%
Renewable Transport ktoe % Comment
Bioethanol / bio-ETBE 30.8 1.8%Bioethanol / bio-ETBE Ar cle 21.2 0 0.0%Bioethanol / bio-ETBE imported 15.4 0.9%Biodiesel 195.5 11.6%Biodiesel Ar cle 21.2 0 0.0%Biodiesel imported 183.3 10.9%Hydrogen from renewables 0 0.0%Renewable electricity 1.9 0.1%Renewable electricity road transport 0 0.0%Renewable electricity non-road transport 1.9 0.1%Other biofuels 0 0.0%Other biofuels Ar cle 21.2 0 0.0%Total 228.2 13.6%
Table 13: Belgian PR Table 1b,Table 1c and Table 1d: Total actual
contribu on (installed capacity,gross electricity genera on, finalenergy consump on) from eachrenewable energy technology in
Belgium for 2009 to meet thebinding 2020 targets and the
indica ve interim trajectory forthe shares of energy from
renewable resources in electricity(see Table 10a of the NREAP),
hea ng and cooling (see Table 11of the NREAP) and in the
transport sector (see Table 12 ofthe NREAP)
24
2010
Capacity Energy Comment
Renewable Electricity MW GWh ktoe %
Hydropower 1428.6 1720.9 148 8.8%Hydropower (non pumped) 118.6 372.4 32 1.9%Hydropower <1 MW (non pumped) 8.7 26.1 2 0.1%Hydropower 1 MW - 10 MW (non pumped) 54.6 194.5 17 1.0%Hydropower >10 MW (non pumped) 55.4 151.8 13 0.8%Hydropower pumped storage 1310 1348.5 116 6.9%Hydropower mixed (normalised) 0 0 0 0.0%Geothermal 0 0 0 0.0%Solar 660.7 557.5 48 2.8%Solar photovoltaic 660.7 557.5 48 2.8%Concentrated solar power 0 0 0 0.0%Tidal, wave and ocean energy 0 0 0 0.0%Wind power 919.5 1589.3 137 8.1%Onshore wind 723 1399.7 120 7.1%Offshore wind 196.5 189.6 16 1.0%Biomass 1010.7 4413.8 380 22.5%Solid biomass 726.8 3575.9 307 18.3%Biogas 123.6 568.2 49 2.9%Bioliquids 160.2 269.6 23 1.4%Total 4019.5 8281.4 712 42.3%Total CHP 271.4 1511.6 130 7.7%
Renewable Hea ng and Cooling ktoe % Comment
Geothermal 1.9 0.1%Solar thermal 12 0.7%Biomass 957.5 56.9%Solid biomass 890.4 52.9%Biogas 26.2 1.6%Bioliquids 41.6 2.5%Renewable energy from heat pumps 13.4 0.8%Aerothermal heat pumps 26.1 1.6%Geothermal heat pumps 29 1.7%Hydrothermal heat pumps 5.2 0.3%Total 984.8 58.5%Total district hea ng 19.8 1.2%Total biomass in households 248.9 14.8%
Renewable Transport ktoe % Comment
Bioethanol / bio-ETBE 38.2 2.3%Bioethanol / bio-ETBE Ar cle 21.2 0 0.0%Bioethanol / bio-ETBE imported 19.1 1.1%Biodiesel 304.6 18.1%Biodiesel Ar cle 21.2 0 0.0%Biodiesel imported 292.4 17.4%Hydrogen from renewables 0 0.0%Renewable electricity 2.4 0.1%Renewable electricity road transport 0 0.0%Renewable electricity non-road transport 2.4 0.1%Other biofuels 0 0.0%Other biofuels Ar cle 21.2 0 0.0%Total 345.3 20.5%
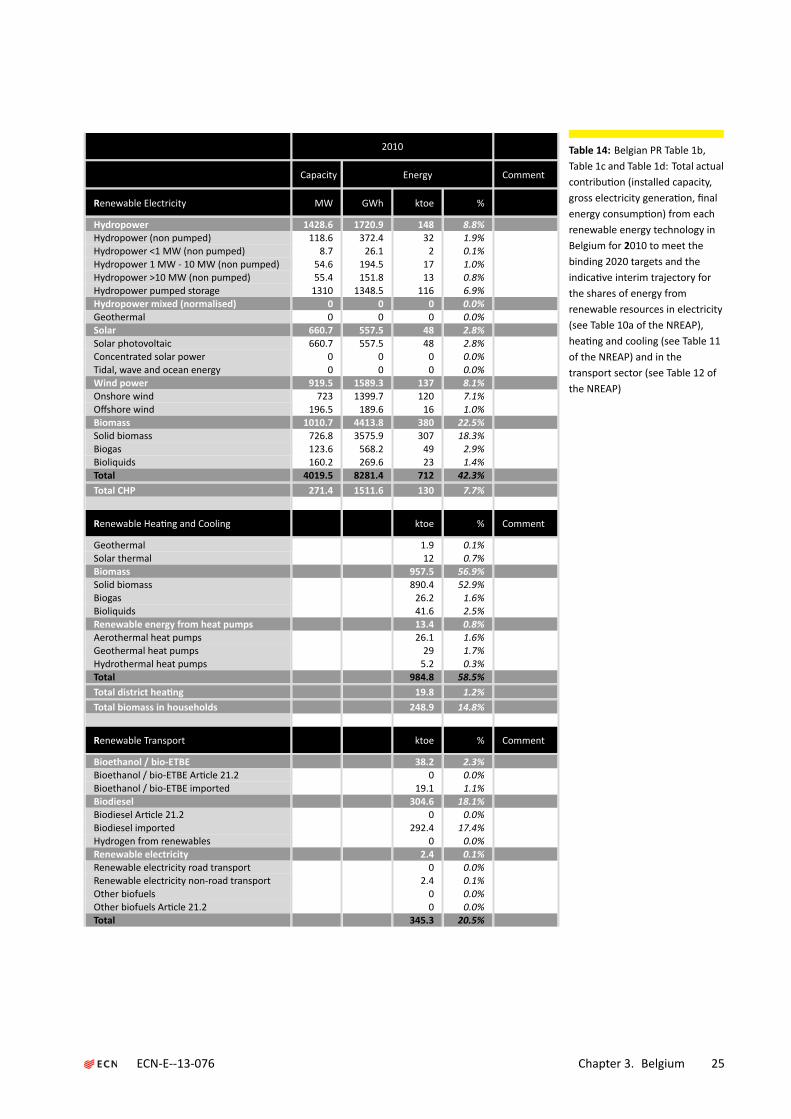
Table 14: Belgian PR Table 1b,Table 1c and Table 1d: Total actualcontribu on (installed capacity,gross electricity genera on, finalenergy consump on) from eachrenewable energy technology inBelgium for 2010 to meet thebinding 2020 targets and theindica ve interim trajectory forthe shares of energy fromrenewable resources in electricity(see Table 10a of the NREAP),hea ng and cooling (see Table 11of the NREAP) and in thetransport sector (see Table 12 ofthe NREAP)
ECN-E--13-076 Chapter 3. Belgium 25

Biomass supply for hea ng and electricity Domes c raw material
Unit 2009 2010 Comment
Direct supply of wood biomass from forests and otherwooded land energy genera on
ktoe 267 244
Indirect supply of wood biomass ktoe 381 545Energy crops ktoe 4 4 1 (p.28)Agricultural by-products / processed residues and fisheryby-products
ktoe 175 210
Biomass from waste ktoe 360.7 493.7Others ktoe 110 99 2 (p.28)Total biomass for hea ng and electricity* ktoe 1297.7 1595.7
Biomass supply for transport Unit 2009 2010 Comment
Common arable crops for biofuels ktoe 0 303Energy crops and short rota on trees for biofuels ktoe 0 0Others ktoe 0 0Total biomass for transport* ktoe 0 303
Total biomass for all sectors* ktoe 1297.7 1898.7
Biomass supply for hea ng and electricity Raw material imported from EU
Unit 2009 2010 CommentDirect supply of wood biomass from forests and otherwooded land energy genera on
ktoe 0 0
Indirect supply of wood biomass ktoe 248 241Energy crops ktoe 0.1 0.1 1 (p.28)Agricultural by-products / processed residues and fisheryby-products
ktoe 13.6 10
Biomass from waste ktoe 0 0Others ktoe 0 0 2 (p.28)Total biomass for hea ng and electricity* ktoe 261.7 251.1
Biomass supply for transport Unit 2009 2010 Comment
Common arable crops for biofuels ktoe 190.6 303Energy crops and short rota on trees for biofuels ktoe 0 0Others ktoe 0 0Total biomass for transport* ktoe 190.6 303
Total biomass for all sectors* ktoe 452.3 554.1
Biomass supply for hea ng and electricity Raw material imported from non-EU
Unit 2009 2010 CommentDirect supply of wood biomass from forests and otherwooded land energy genera on
ktoe 0 0
Indirect supply of wood biomass ktoe 238 161Energy crops ktoe 40 20 1 (p.28)Agricultural by-products / processed residues and fisheryby-products
ktoe 6 4
Biomass from waste ktoe 0 0Others ktoe 0 0 2 (p.28)Total biomass for hea ng and electricity* ktoe 284 185
Biomass supply for transport Unit 2009 2010 Comment
Common arable crops for biofuels ktoe 190.6 303Energy crops and short rota on trees for biofuels ktoe 0 0Others ktoe 0 0Total biomass for transport* ktoe 190.6 303
Total biomass for all sectors* ktoe 474.6 488
* The values indicated with ‘*’ are calculated values and have not been men oned in the Progress Reportsas such.
Table 15: Belgian PR Table 4:Biomass supply for hea ng and
electricity (see Table 7 of theNREAP)
26

Unit 2009 2010 Comment
Land used for common arable crops and oil seeds ha 18936 25921 3 (p.28)Land used for short rota on trees ha 77.9 139 4 (p.28)Land used for other energy crops such as grasses ha 81 82 5 (p.28)
Table 16: Belgian PR Table 4a:Current domes c agriculturalland use for produc on of cropsdedicated to energy produc on(see Table 8 of the NREAP)
Unit 2009 2010 Comment
Produc on - Fuel type X ktoe n.a. n.a.Consump on - Fuel type X ktoe n.a. n.a.Total produc on Art.21.2.biofuels ktoe n.a. n.a.Total consump on Art.21.2. biofuels ktoe n.a. n.a.Share of 21(2) fuels from total RES-T % n.a. n.a.
Table 17: Belgian PR Table 5:Produc on and consump on ofAr cle 21(2) biofuels (ktoe)
Unit 2009 2010 Comment
Total es mated net GHG emission saving from RES t CO2-eq 6018891 7440702Es mated net GHG saving from the use of RES-E t CO2-eq 3234185 3911810Es mated net GHG saving from the use of RES-H/C t CO2-eq 2127645 2514273Es mated net GHG saving from the use of RES-T t CO2-eq 657062 1014620
Table 18: Belgian PR Table 6:Es mated GHG emission savingsfrom the use of renewable energy
Actual/es matedexcess produc on
Actual/es mateddeficit produc on
Comment
Renewable energy n.a. n.a.Origin/des na on n.a. n.a.Unit ktoe ktoe2010 n.a. -2807.72011 n.a. n.a.2012 n.a. n.a.2013 n.a. n.a.2014 n.a. n.a.2015 n.a. n.a.2016 n.a. n.a.2017 n.a. n.a.2018 n.a. n.a.2019 n.a. n.a.2020 n.a. n.a.
Table 19: Belgian PR Table 7:Actual and es mated excessand/or deficit (-) produc on ofrenewable energy compared tothe indica ve trajectory whichcould be transferred to/fromother Member States and/orthird countries in Belgium (ktoe)(see Table 9 of the NREAP)
ECN-E--13-076 Chapter 3. Belgium 27

Comments for Belgium
1: Entry for ’Amount of raw material imported from the EU’ (zero) does not correspondto equivalent entry in ktoe. Value in database is ’n.a.’.2: This category regards for example alterna ve fuels in cement.3: For 2009 main contribu ons from wheat (6605.6 ha) and beet (550.8), for 2010 no val-ues specified.4: Main contribu on from willow (69.9 ha in 2009 and 111.0 ha for 2010).5: Main contribu on from miscanthus (80/0 ha in both 2009 and 2010).
28

4Bulgaria
Unit 2009 2010 Comment
Renewable hea ng and cooling % 17.4 20.1Renewable electricity % 11.4 12Renewable Transport % 0.3 0.6Overall renewable energy share % 11 12.6Renewables through coopera on mechanism % 0 0Surplus for coopera on mechanism % 0 0
Table 20: Bulgarian PR Table 1:The sectoral (electricity, hea ngand cooling, and transport) andoverall shares of energy fromrenewable sources in Bulgaria(see Table 3 and Table 4a of theNREAP)
Unit 2009 2010 Comment
Gross final consump on of RES for hea ng and cooling ktoe 772 923Gross final consump on of electricity from RES ktoe 345 384Gross final consump on of energy from RES in transport ktoe 8 17Gross total RES consump on ktoe 1125 1324Transfer of RES to other Member States ktoe 0 0Transfer of RES from other Member States and 3rd countries ktoe 0 0RES consump on adjusted for target ktoe 1125 1324
Table 21: Bulgarian PR Table 1a:Calcula on table for therenewable energy contribu on inBulgaria of each sector to finalenergy consump on (ktoe) (seeTable 4a of the NREAP)
ECN-E--13-076 Chapter 4. Bulgaria 29

2009
Capacity Energy Comment
Renewable Electricity MW GWh ktoe %
Hydropower 2156 3598 309 27.3%Hydropower (non pumped) 1621 2957 254 22.5%Hydropower <1 MW (non pumped) 44 137 12 1.0%Hydropower 1 MW - 10 MW (non pumped) 204 614 53 4.7%Hydropower >10 MW (non pumped) 1373 2206 190 16.8%Hydropower pumped storage 788 852 73 6.5%Hydropower mixed (normalised) 535 462 40 3.5%Geothermal 0 0 0 0.0%Solar 2 3 0 0.0%Solar photovoltaic 2 3 0 0.0%Concentrated solar power 0 0 0 0.0%Tidal, wave and ocean energy 0 0 0 0.0%Wind power 333 412 35 3.1% 1 (p.34)Onshore wind 333 237 20 1.8%Offshore wind 0 0 0 0.0%Biomass 3 4 0 0.0%Solid biomass 0 0 0 0.0%Biogas 3 4 0 0.0%Bioliquids 0 0 0 0.0%Total 2494 4017 345 30.5%Total CHP 0 0 0 0.0%
Renewable Hea ng and Cooling ktoe % Comment
Geothermal 33 2.9%Solar thermal 0 0.0%Biomass 746 65.9%Solid biomass 742 65.6%Biogas 0 0.0%Bioliquids 4 0.4%Renewable energy from heat pumps 0 0.0%Aerothermal heat pumps 0 0.0%Geothermal heat pumps 0 0.0%Hydrothermal heat pumps 0 0.0%Total 779 68.9%Total district hea ng 1 0.1%Total biomass in households 672 59.4%
Renewable Transport ktoe % Comment
Bioethanol / bio-ETBE 0 0.0%Bioethanol / bio-ETBE Ar cle 21.2 0 0.0%Bioethanol / bio-ETBE imported 0 0.0%Biodiesel 4 0.4%Biodiesel Ar cle 21.2 0 0.0%Biodiesel imported 0 0.0%Hydrogen from renewables 0 0.0%Renewable electricity 3 0.3%Renewable electricity road transport 0 0.0%Renewable electricity non-road transport 3 0.3%Other biofuels 0 0.0%Other biofuels Ar cle 21.2 0 0.0%Total 7 0.6%
Table 22: Bulgarian PR Table 1b,Table 1c and Table 1d: Total actual
contribu on (installed capacity,gross electricity genera on, finalenergy consump on) from eachrenewable energy technology in
Bulgaria for 2009 to meet thebinding 2020 targets and the
indica ve interim trajectory forthe shares of energy from
renewable resources in electricity(see Table 10a of the NREAP),
hea ng and cooling (see Table 11of the NREAP) and in the
transport sector (see Table 12 ofthe NREAP)
30

2010
Capacity Energy Comment
Renewable Electricity MW GWh ktoe %
Hydropower 2188 3709 319 28.2%Hydropower (non pumped) 1653 4330 372 32.9%Hydropower <1 MW (non pumped) 47 187 16 1.4%Hydropower 1 MW - 10 MW (non pumped) 216 815 70 6.2%Hydropower >10 MW (non pumped) 1390 3328 286 25.3%Hydropower pumped storage 788 929 80 7.1%Hydropower mixed (normalised) 535 769 66 5.8%Geothermal 0 0 0 0.0%Solar 25 15 1 0.1%Solar photovoltaic 25 15 1 0.1%Concentrated solar power 0 0 0 0.0%Tidal, wave and ocean energy 0 0 0 0.0%Wind power 488 722 62 5.5% 1 (p.34)Onshore wind 488 681 59 5.2%Offshore wind 0 0 0 0.0%Biomass 3 16 1 0.1%Solid biomass 0 0 0 0.0%Biogas 3 16 1 0.1%Bioliquids 0 0 0 0.0%Total 2704 4461 384 33.9%Total CHP 0 0 0 0.0%
Renewable Hea ng and Cooling ktoe % Comment
Geothermal 33 2.9%Solar thermal 10 0.9%Biomass 899 79.5%Solid biomass 883 78.0%Biogas 3 0.3%Bioliquids 13 1.1%Renewable energy from heat pumps 0 0.0%Aerothermal heat pumps 0 0.0%Geothermal heat pumps 0 0.0%Hydrothermal heat pumps 0 0.0%Total 942 83.3%Total district hea ng 2 0.2%Total biomass in households 710 62.8%
Renewable Transport ktoe % Comment
Bioethanol / bio-ETBE 0 0.0%Bioethanol / bio-ETBE Ar cle 21.2 0 0.0%Bioethanol / bio-ETBE imported 0 0.0%Biodiesel 11 1.0%Biodiesel Ar cle 21.2 0 0.0%Biodiesel imported 0 0.0%Hydrogen from renewables 0 0.0%Renewable electricity 3 0.3%Renewable electricity road transport 0 0.0%Renewable electricity non-road transport 3 0.3%Other biofuels 0 0.0%Other biofuels Ar cle 21.2 0 0.0%Total 14 1.2%
Table 23: Bulgarian PR Table 1b,Table 1c and Table 1d: Total actualcontribu on (installed capacity,gross electricity genera on, finalenergy consump on) from eachrenewable energy technology inBulgaria for 2010 to meet thebinding 2020 targets and theindica ve interim trajectory forthe shares of energy fromrenewable resources in electricity(see Table 10a of the NREAP),hea ng and cooling (see Table 11of the NREAP) and in thetransport sector (see Table 12 ofthe NREAP)
ECN-E--13-076 Chapter 4. Bulgaria 31

Biomass supply for hea ng and electricity Domes c raw material
Unit 2009 2010 Comment
Direct supply of wood biomass from forests and otherwooded land energy genera on
ktoe 697 756
Indirect supply of wood biomass ktoe 60 160Energy crops ktoe 0 0 2 (p.34)Agricultural by-products / processed residues and fisheryby-products
ktoe 0 0
Biomass from waste ktoe 0 0Others ktoe 9 9 3 (p.34)Total biomass for hea ng and electricity* ktoe 766 925
Biomass supply for transport Unit 2009 2010 Comment
Common arable crops for biofuels ktoe 7 0Energy crops and short rota on trees for biofuels ktoe 0 0Others ktoe 0 0Total biomass for transport* ktoe 7 0
Total biomass for all sectors* ktoe 773 925
Biomass supply for hea ng and electricity Raw material imported from EU
Unit 2009 2010 CommentDirect supply of wood biomass from forests and otherwooded land energy genera on
ktoe 0 0
Indirect supply of wood biomass ktoe 0 0Energy crops ktoe 0 0 2 (p.34)Agricultural by-products / processed residues and fisheryby-products
ktoe 0 0
Biomass from waste ktoe 0 0Others ktoe 0 0 3 (p.34)Total biomass for hea ng and electricity* ktoe 0 0
Biomass supply for transport Unit 2009 2010 Comment
Common arable crops for biofuels ktoe 0 0Energy crops and short rota on trees for biofuels ktoe 0 0Others ktoe 0 0Total biomass for transport* ktoe 0 0
Total biomass for all sectors* ktoe 0 0
Biomass supply for hea ng and electricity Raw material imported from non-EU
Unit 2009 2010 CommentDirect supply of wood biomass from forests and otherwooded land energy genera on
ktoe 0 0
Indirect supply of wood biomass ktoe 0 0Energy crops ktoe 0 0 2 (p.34)Agricultural by-products / processed residues and fisheryby-products
ktoe 0 0
Biomass from waste ktoe 0 0Others ktoe 0 0 3 (p.34)Total biomass for hea ng and electricity* ktoe 0 0
Biomass supply for transport Unit 2009 2010 Comment
Common arable crops for biofuels ktoe 0 0Energy crops and short rota on trees for biofuels ktoe 0 0Others ktoe 0 0Total biomass for transport* ktoe 0 0
Total biomass for all sectors* ktoe 0 0
* The values indicated with ‘*’ are calculated values and have not been men oned in the Progress Reportsas such.
Table 24: Bulgarian PR Table 4:Biomass supply for hea ng and
electricity (see Table 7 of theNREAP)
32

Unit 2009 2010 Comment
Land used for common arable crops and oil seeds ha 3122516 3162526 4 (p.34)Land used for short rota on trees ha n.a. 15350 5 (p.34)Land used for other energy crops such as grasses ha n.a. n.a.
Table 25: Bulgarian PR Table 4a:Current domes c agriculturalland use for produc on of cropsdedicated to energy produc on(see Table 8 of the NREAP)
Unit 2009 2010 Comment
Produc on - Fuel type X ktoe 0 0 6 (p.34)Consump on - Fuel type X ktoe 0 0 7 (p.34)Total produc on Art.21.2.biofuels ktoe 0 0 8 (p.34)Total consump on Art.21.2. biofuels ktoe 0 0 9 (p.34)Share of 21(2) fuels from total RES-T % 0 0 10 (p.34)
Table 26: Bulgarian PR Table 5:Produc on and consump on ofAr cle 21(2) biofuels (ktoe)
Unit 2009 2010 Comment
Total es mated net GHG emission saving from RES t CO2-eq 5124705 6167301Es mated net GHG saving from the use of RES-E t CO2-eq 2333148 2819460Es mated net GHG saving from the use of RES-H/C t CO2-eq 2779700 3323398Es mated net GHG saving from the use of RES-T t CO2-eq 11857 24443
Table 27: Bulgarian PR Table 6:Es mated GHG emission savingsfrom the use of renewable energy
Actual/es matedexcess produc on
Actual/es mateddeficit produc on
Comment
Renewable energy n.a. n.a. 11 (p.34)Origin/des na on n.a. n.a. 11 (p.34)Unit ktoe ktoe 11 (p.34)2010 n.a. n.a. 11 (p.34)2011 n.a. n.a. 11 (p.34)2012 n.a. n.a. 11 (p.34)2013 n.a. n.a. 11 (p.34)2014 n.a. n.a. 11 (p.34)2015 n.a. n.a. 11 (p.34)2016 n.a. n.a. 11 (p.34)2017 n.a. n.a. 11 (p.34)2018 n.a. n.a. 11 (p.34)2019 n.a. n.a. 11 (p.34)2020 n.a. n.a. 11 (p.34)
Table 28: Bulgarian PR Table 7:Actual and es mated excessand/or deficit (-) produc on ofrenewable energy compared tothe indica ve trajectory whichcould be transferred to/fromother Member States and/orthird countries in Bulgaria (ktoe)(see Table 9 of the NREAP)
ECN-E--13-076 Chapter 4. Bulgaria 33

Comments for Bulgaria
1: Total wind power energy does not match onshore energy.2: Entry for ’Amount of raw material imported from the EU’ (zero) does not correspondto equivalent entry in ktoe. Value in database is ’n.a.’.3: No specifica ons have been given for this category.4: Data include areas sown under cereals (wheat, barley, rye, tri cale, oats, maize, rice,etc.), industrial crops (sunflower (most important contribu on, see table on page 49 of theBulgarian Progress Report), rapeseed, tobacco, etc.), vegetables (potatoes, beans, peas,len ls, fresh vegetables, etc.), crops (annual crops, perennial legumes and grasses, etc.)and fallow land.5: Preliminary data from the census of agricultural holdings in 2010.6: Approximate value.7: Approximate value.8: Approximate value.9: Approximate value.10: Approximate value.11: Table 7 in Bulgarian Progress Report presents ’Total energy from renewable sources’without specifying excess or deficit.
34

5Cyprus
Unit 2009 2010 Comment
Renewable hea ng and cooling % 15.6 17.7Renewable electricity % 0.6 1.4Renewable Transport % 2 2Overall renewable energy share % 5.4 5.8 1 (p.40)Renewables through coopera on mechanism % 0 0Surplus for coopera on mechanism % 0 0
Table 29: Cyprio c PR Table 1:The sectoral (electricity, hea ngand cooling, and transport) andoverall shares of energy fromrenewable sources in Cyprus (seeTable 3 and Table 4a of theNREAP)
Unit 2009 2010 Comment
Gross final consump on of RES for hea ng and cooling ktoe 77.24 81.25Gross final consump on of electricity from RES ktoe 2.61 6.27Gross final consump on of energy from RES in transport ktoe 15.13 15.05Gross total RES consump on ktoe 94.98 102.57Transfer of RES to other Member States ktoe 0 0Transfer of RES from other Member States and 3rd countries ktoe 0 0RES consump on adjusted for target ktoe 94.98 102.57
Table 30: Cyprio c PR Table 1a:Calcula on table for therenewable energy contribu on inCyprus of each sector to finalenergy consump on (ktoe) (seeTable 4a of the NREAP)
ECN-E--13-076 Chapter 5. Cyprus 35
2009
Capacity Energy Comment
Renewable Electricity MW GWh ktoe %
Hydropower 0 0 0 0.0%Hydropower (non pumped) 0 0 0 0.0%Hydropower <1 MW (non pumped) 0 0 0 0.0%Hydropower 1 MW - 10 MW (non pumped) 0 0 0 0.0%Hydropower >10 MW (non pumped) 0 0 0 0.0%Hydropower pumped storage 0 0 0 0.0%Hydropower mixed (normalised) 0 0 0 0.0%Geothermal 0 0 0 0.0%Solar 3.35 3.83 0 0.3%Solar photovoltaic 3.35 3.83 0 0.3%Concentrated solar power 0 0 0 0.0%Tidal, wave and ocean energy 0 0 0 0.0%Wind power 0 0 0 0.0%Onshore wind 0 0 0 0.0%Offshore wind 0 0 0 0.0%Biomass 4.25 26.52 2 2.4%Solid biomass 0 0 0 0.0%Biogas 4.25 26.52 2 2.4%Bioliquids 0 0 0 0.0%Total 7.6 30.35 3 2.8%Total CHP 3.08 7.63 1 0.7%
Renewable Hea ng and Cooling ktoe % Comment
Geothermal 0 0.0%Solar thermal 58.2 61.4%Biomass 18.69 19.7%Solid biomass 17.73 18.7%Biogas 0.96 1.0%Bioliquids 0 0.0%Renewable energy from heat pumps 0.35 0.4%Aerothermal heat pumps n.a. n.a.Geothermal heat pumps n.a. n.a.Hydrothermal heat pumps n.a. n.a.Total 77.24 81.5%Total district hea ng 0 0.0%Total biomass in households 7.19 7.6%
Renewable Transport ktoe % Comment
Bioethanol / bio-ETBE 0 0.0%Bioethanol / bio-ETBE Ar cle 21.2 0 0.0%Bioethanol / bio-ETBE imported 0 0.0%Biodiesel 14.87 15.7%Biodiesel Ar cle 21.2 0.18 0.2%Biodiesel imported 8.75 9.2%Hydrogen from renewables 0 0.0%Renewable electricity 0 0.0%Renewable electricity road transport 0 0.0%Renewable electricity non-road transport 0 0.0%Other biofuels 0 0.0%Other biofuels Ar cle 21.2 0 0.0%Total 14.87 15.7%
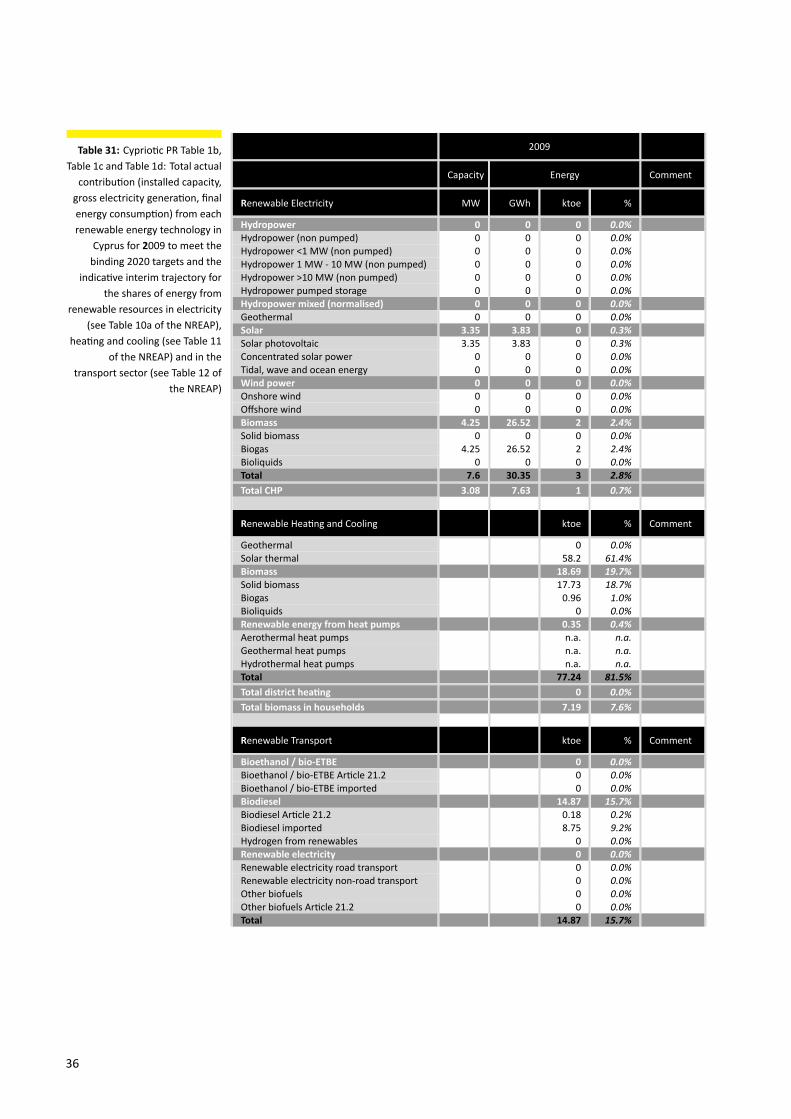
Table 31: Cyprio c PR Table 1b,Table 1c and Table 1d: Total actual
contribu on (installed capacity,gross electricity genera on, finalenergy consump on) from eachrenewable energy technology in
Cyprus for 2009 to meet thebinding 2020 targets and the
indica ve interim trajectory forthe shares of energy from
renewable resources in electricity(see Table 10a of the NREAP),
hea ng and cooling (see Table 11of the NREAP) and in the
transport sector (see Table 12 ofthe NREAP)
36

2010
Capacity Energy Comment
Renewable Electricity MW GWh ktoe %
Hydropower 0 0 0 0.0%Hydropower (non pumped) 0 0 0 0.0%Hydropower <1 MW (non pumped) 0 0 0 0.0%Hydropower 1 MW - 10 MW (non pumped) 0 0 0 0.0%Hydropower >10 MW (non pumped) 0 0 0 0.0%Hydropower pumped storage 0 0 0 0.0%Hydropower mixed (normalised) 0 0 0 0.0%Geothermal 0 0 0 0.0%Solar 6.6 6.39 1 0.6%Solar photovoltaic 6.6 6.39 1 0.6%Concentrated solar power 0 0 0 0.0%Tidal, wave and ocean energy 0 0 0 0.0%Wind power 82 31.37 3 2.8%Onshore wind 82 31.37 3 2.8%Offshore wind 0 0 0 0.0%Biomass 7.9 35.13 3 3.2%Solid biomass 0 0 0 0.0%Biogas 7.9 35.13 3 3.2%Bioliquids 0 0 0 0.0%Total 96.5 72.89 6 6.6%Total CHP 3.58 11.63 1 1.1%
Renewable Hea ng and Cooling ktoe % Comment
Geothermal 0 0.0%Solar thermal 61.07 64.5%Biomass 19.43 20.5%Solid biomass 17.04 18.0%Biogas 2.39 2.5%Bioliquids 0 0.0%Renewable energy from heat pumps 0.75 0.8%Aerothermal heat pumps n.a. n.a.Geothermal heat pumps n.a. n.a.Hydrothermal heat pumps n.a. n.a.Total 81.25 85.8%Total district hea ng 0 0.0%Total biomass in households 4.81 5.1%
Renewable Transport ktoe % Comment
Bioethanol / bio-ETBE 0 0.0%Bioethanol / bio-ETBE Ar cle 21.2 0 0.0%Bioethanol / bio-ETBE imported 0 0.0%Biodiesel 14.96 15.8%Biodiesel Ar cle 21.2 0.09 0.1%Biodiesel imported 10.22 10.8%Hydrogen from renewables 0 0.0%Renewable electricity 0 0.0%Renewable electricity road transport 0 0.0%Renewable electricity non-road transport 0 0.0%Other biofuels 0 0.0%Other biofuels Ar cle 21.2 0 0.0%Total 14.96 15.8%
Table 32: Cyprio c PR Table 1b,Table 1c and Table 1d: Total actualcontribu on (installed capacity,gross electricity genera on, finalenergy consump on) from eachrenewable energy technology inCyprus for 2010 to meet thebinding 2020 targets and theindica ve interim trajectory forthe shares of energy fromrenewable resources in electricity(see Table 10a of the NREAP),hea ng and cooling (see Table 11of the NREAP) and in thetransport sector (see Table 12 ofthe NREAP)
ECN-E--13-076 Chapter 5. Cyprus 37

Biomass supply for hea ng and electricity Domes c raw material
Unit 2009 2010 Comment
Direct supply of wood biomass from forests and otherwooded land energy genera on
ktoe 1.15 1.87 2 (p.40)
Indirect supply of wood biomass ktoe 3.74 2.36 3 (p.40)Energy crops ktoe 0 0 4 (p.40)Agricultural by-products / processed residues and fisheryby-products
ktoe 1.68 1.33 5 (p.40)
Biomass from waste ktoe 0.26 0.66 6 (p.40)Others ktoe 3.24 5.41 7 (p.40)Total biomass for hea ng and electricity* ktoe 10.07 11.63
Biomass supply for transport Unit 2009 2010 Comment
Common arable crops for biofuels ktoe n.a. 14.96 8 (p.40)Energy crops and short rota on trees for biofuels ktoe 0 0 9 (p.40)Others ktoe 0.19 0 10 (p.40)Total biomass for transport* ktoe 0.19 14.96
Total biomass for all sectors* ktoe 10.26 26.59
Biomass supply for hea ng and electricity Raw material imported from EU
Unit 2009 2010 CommentDirect supply of wood biomass from forests and otherwooded land energy genera on
ktoe 0.16 0.08 2 (p.40)
Indirect supply of wood biomass ktoe 3.54 3.44 3 (p.40)Energy crops ktoe 0 0 4 (p.40)Agricultural by-products / processed residues and fisheryby-products
ktoe 2.33 0 5 (p.40)
Biomass from waste ktoe 4.85 7.3 6 (p.40)Others ktoe 0 0 7 (p.40)Total biomass for hea ng and electricity* ktoe 10.88 10.82
Biomass supply for transport Unit 2009 2010 Comment
Common arable crops for biofuels ktoe 14.87 14.96 8 (p.40)Energy crops and short rota on trees for biofuels ktoe 0 0 9 (p.40)Others ktoe 0 0 10 (p.40)Total biomass for transport* ktoe 14.87 14.96
Total biomass for all sectors* ktoe 25.75 25.78
Biomass supply for hea ng and electricity Raw material imported from non-EU
Unit 2009 2010 CommentDirect supply of wood biomass from forests and otherwooded land energy genera on
ktoe n.a. n.a. 2 (p.40)
Indirect supply of wood biomass ktoe n.a. n.a. 3 (p.40)Energy crops ktoe n.a. n.a. 4 (p.40)Agricultural by-products / processed residues and fisheryby-products
ktoe n.a. n.a. 5 (p.40)
Biomass from waste ktoe n.a. n.a. 6 (p.40)Others ktoe n.a. n.a. 7 (p.40)Total biomass for hea ng and electricity* ktoe n.a. n.a.
Biomass supply for transport Unit 2009 2010 Comment
Common arable crops for biofuels ktoe 14.87 14.96 8 (p.40)Energy crops and short rota on trees for biofuels ktoe 0 0 9 (p.40)Others ktoe 0 0 10 (p.40)Total biomass for transport* ktoe 14.87 14.96
Total biomass for all sectors* ktoe 14.87 14.96
* The values indicated with ‘*’ are calculated values and have not been men oned in the Progress Reportsas such.
Table 33: Cyprio c PR Table 4:Biomass supply for hea ng and
electricity (see Table 7 of theNREAP)
38

Unit 2009 2010 Comment
Land used for common arable crops and oil seeds ha 0 0 11 (p.40)Land used for short rota on trees ha 0 0 12 (p.40)Land used for other energy crops such as grasses ha 0 0 13 (p.40)
Table 34: Cyprio c PR Table 4a:Current domes c agriculturalland use for produc on of cropsdedicated to energy produc on(see Table 8 of the NREAP)
Unit 2009 2010 Comment
Produc on - Fuel type X ktoe 0.26 0.09 14 (p.40)Consump on - Fuel type X ktoe 0.26 0.09 15 (p.40)Total produc on Art.21.2.biofuels ktoe 0.26 0.09Total consump on Art.21.2. biofuels ktoe 0.26 0.09Share of 21(2) fuels from total RES-T % 1.7 0.6
Table 35: Cyprio c PR Table 5:Produc on and consump on ofAr cle 21(2) biofuels (ktoe)
Unit 2009 2010 Comment
Total es mated net GHG emission saving from RES t CO2-eq 280795 309844Es mated net GHG saving from the use of RES-E t CO2-eq 8521 20548Es mated net GHG saving from the use of RES-H/C t CO2-eq 253898 268640Es mated net GHG saving from the use of RES-T t CO2-eq 18376 20656
Table 36: Cyprio c PR Table 6:Es mated GHG emission savingsfrom the use of renewable energy
Actual/es matedexcess produc on
Actual/es mateddeficit produc on
Comment
Renewable energy n.a. n.a.Origin/des na on n.a. n.a.Unit ktoe ktoe2010 n.a. -11.432011 33 n.a.2012 39 n.a.2013 34 n.a.2014 46 n.a.2015 30 n.a.2016 42 n.a.2017 57 n.a.2018 34 n.a.2019 21 n.a.2020 0 n.a.
Table 37: Cyprio c PR Table 7:Actual and es mated excessand/or deficit (-) produc on ofrenewable energy compared tothe indica ve trajectory whichcould be transferred to/fromother Member States and/orthird countries in Cyprus (ktoe)(see Table 9 of the NREAP)
ECN-E--13-076 Chapter 5. Cyprus 39

Comments for Cyprus
1: Table 1 in Progress Report also provides overall RES share without taking account of thecivil avia on limit reduc on.2: Category ’Imported from EU’ aggregates both EU and non-EU imports. See Table 4 inCyprus’ Progress Report for details on biomass products.3: Category ’Imported from EU’ aggregates both EU and non-EU imports. See Table 4 inCyprus’ Progress Report for details on biomass products.4: Category ’Imported from EU’ aggregates both EU and non-EU imports. See Table 4 inCyprus’ Progress Report for details on biomass products.5: Category ’Imported from EU’ aggregates both EU and non-EU imports. See Table 4 inCyprus’ Progress Report for details on biomass products.6: Category ’Imported from EU’ aggregates both EU and non-EU imports. See Table 4 inCyprus’ Progress Report for details on biomass products.7: Category ’Imported from EU’ aggregates both EU and non-EU imports. Category ’Oth-ers’ in Table 4 of the Cyprus’ Progress Report refers to Biogas fromanimal and urbanwaste.8: Category ’Imported from EU’ aggregates both EU and non-EU imports. See Table 4 inCyprus’ Progress Report for details on biomass products.9: Category ’Imported from EU’ aggregates both EU and non-EU imports. See Table 4 inCyprus’ Progress Report for details on biomass products.10: Category ’Imported from EU’ aggregates both EU and non-EU imports. See Table 4 inCyprus’ Progress Report for details on biomass products.11: In Cyprus agricultural land was not used for dedicated energy produc on in 2009 and2010.12: In Cyprus agricultural land was not used for dedicated energy produc on in 2009 and2010.13: In Cyprus agricultural land was not used for dedicated energy produc on in 2009 and2010.14: This regards biofuels from waste vegetable oils15: This regards biofuels from waste vegetable oils
40
6Czech Republic
Unit 2009 2010 Comment
Renewable hea ng and cooling % n.a. n.a.Renewable electricity % n.a. n.a.Renewable Transport % n.a. n.a.Overall renewable energy share % 7.4 n.a.Renewables through coopera on mechanism % n.a. n.a.Surplus for coopera on mechanism % n.a. n.a.
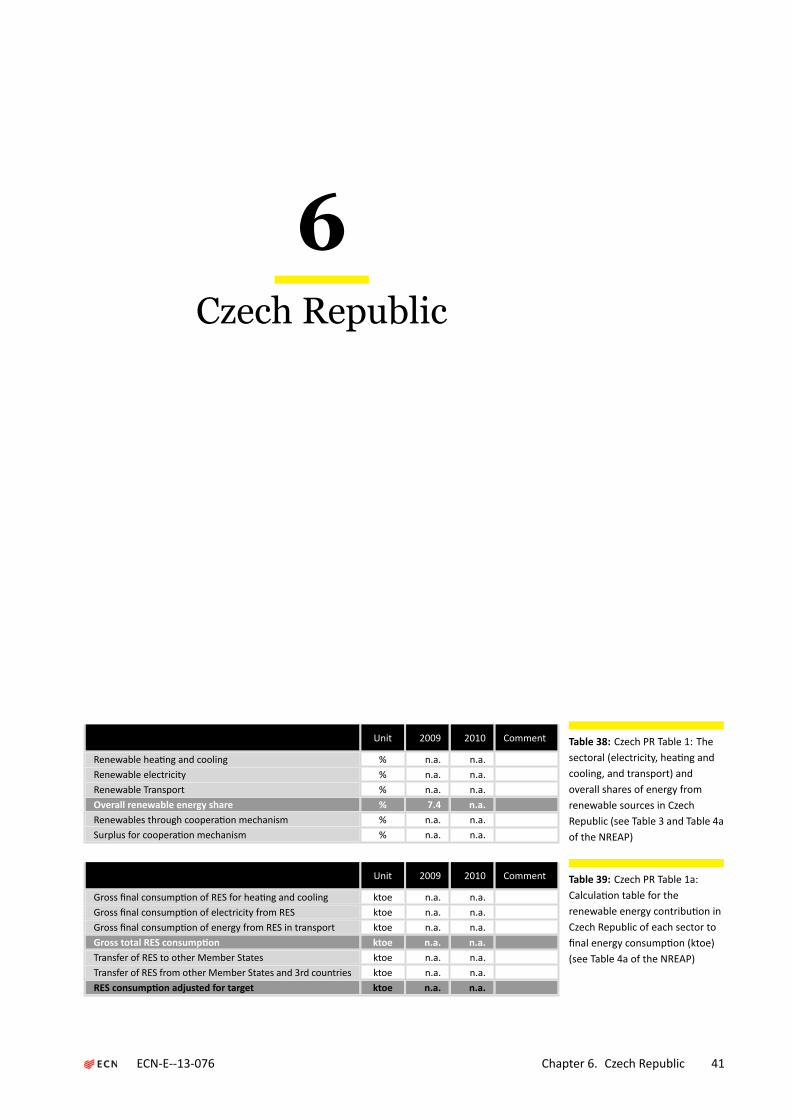
Table 38: Czech PR Table 1: Thesectoral (electricity, hea ng andcooling, and transport) andoverall shares of energy fromrenewable sources in CzechRepublic (see Table 3 and Table 4aof the NREAP)
Unit 2009 2010 Comment
Gross final consump on of RES for hea ng and cooling ktoe n.a. n.a.Gross final consump on of electricity from RES ktoe n.a. n.a.Gross final consump on of energy from RES in transport ktoe n.a. n.a.Gross total RES consump on ktoe n.a. n.a.Transfer of RES to other Member States ktoe n.a. n.a.Transfer of RES from other Member States and 3rd countries ktoe n.a. n.a.RES consump on adjusted for target ktoe n.a. n.a.
Table 39: Czech PR Table 1a:Calcula on table for therenewable energy contribu on inCzech Republic of each sector tofinal energy consump on (ktoe)(see Table 4a of the NREAP)
ECN-E--13-076 Chapter 6. Czech Republic 41

2009
Capacity Energy Comment
Renewable Electricity MW GWh ktoe %
Hydropower n.a. n.a. n.a. n.a.Hydropower (non pumped) n.a. n.a. n.a. n.a.Hydropower <1 MW (non pumped) n.a. n.a. n.a. n.a.Hydropower 1 MW - 10 MW (non pumped) n.a. n.a. n.a. n.a.Hydropower >10 MW (non pumped) n.a. n.a. n.a. n.a.Hydropower pumped storage n.a. n.a. n.a. n.a.Hydropower mixed (normalised) n.a. n.a. n.a. n.a.Geothermal n.a. n.a. n.a. n.a.Solar n.a. n.a. n.a. n.a.Solar photovoltaic n.a. n.a. n.a. n.a.Concentrated solar power n.a. n.a. n.a. n.a.Tidal, wave and ocean energy n.a. n.a. n.a. n.a.Wind power n.a. n.a. n.a. n.a.Onshore wind n.a. n.a. n.a. n.a.Offshore wind n.a. n.a. n.a. n.a.Biomass n.a. n.a. n.a. n.a.Solid biomass n.a. n.a. n.a. n.a.Biogas n.a. n.a. n.a. n.a.Bioliquids n.a. n.a. n.a. n.a.Total n.a. n.a. n.a. n.a.Total CHP n.a. n.a. n.a. n.a.
Renewable Hea ng and Cooling ktoe % Comment
Geothermal n.a. n.a.Solar thermal n.a. n.a.Biomass n.a. n.a.Solid biomass n.a. n.a.Biogas n.a. n.a.Bioliquids n.a. n.a.Renewable energy from heat pumps n.a. n.a.Aerothermal heat pumps n.a. n.a.Geothermal heat pumps n.a. n.a.Hydrothermal heat pumps n.a. n.a.Total n.a. n.a.Total district hea ng n.a. n.a.Total biomass in households n.a. n.a.
Renewable Transport ktoe % Comment
Bioethanol / bio-ETBE n.a. n.a.Bioethanol / bio-ETBE Ar cle 21.2 n.a. n.a.Bioethanol / bio-ETBE imported n.a. n.a.Biodiesel n.a. n.a.Biodiesel Ar cle 21.2 n.a. n.a.Biodiesel imported n.a. n.a.Hydrogen from renewables n.a. n.a.Renewable electricity n.a. n.a.Renewable electricity road transport n.a. n.a.Renewable electricity non-road transport n.a. n.a.Other biofuels n.a. n.a.Other biofuels Ar cle 21.2 n.a. n.a.Total n.a. n.a.
Table 40: Czech PR Table 1b, Table1c and Table 1d: Total actual
contribu on (installed capacity,gross electricity genera on, finalenergy consump on) from eachrenewable energy technology inCzech Republic for 2009 to meetthe binding 2020 targets and theindica ve interim trajectory for
the shares of energy fromrenewable resources in electricity
(see Table 10a of the NREAP),hea ng and cooling (see Table 11
of the NREAP) and in thetransport sector (see Table 12 of
the NREAP)
42

2010
Capacity Energy Comment
Renewable Electricity MW GWh ktoe %
Hydropower n.a. n.a. n.a. n.a.Hydropower (non pumped) n.a. n.a. n.a. n.a.Hydropower <1 MW (non pumped) n.a. n.a. n.a. n.a.Hydropower 1 MW - 10 MW (non pumped) n.a. n.a. n.a. n.a.Hydropower >10 MW (non pumped) n.a. n.a. n.a. n.a.Hydropower pumped storage n.a. n.a. n.a. n.a.Hydropower mixed (normalised) n.a. n.a. n.a. n.a.Geothermal n.a. n.a. n.a. n.a.Solar n.a. n.a. n.a. n.a.Solar photovoltaic n.a. n.a. n.a. n.a.Concentrated solar power n.a. n.a. n.a. n.a.Tidal, wave and ocean energy n.a. n.a. n.a. n.a.Wind power n.a. n.a. n.a. n.a.Onshore wind n.a. n.a. n.a. n.a.Offshore wind n.a. n.a. n.a. n.a.Biomass n.a. n.a. n.a. n.a.Solid biomass n.a. n.a. n.a. n.a.Biogas n.a. n.a. n.a. n.a.Bioliquids n.a. n.a. n.a. n.a.Total n.a. n.a. n.a. n.a.Total CHP n.a. n.a. n.a. n.a.
Renewable Hea ng and Cooling ktoe % Comment
Geothermal n.a. n.a.Solar thermal n.a. n.a.Biomass n.a. n.a.Solid biomass n.a. n.a.Biogas n.a. n.a.Bioliquids n.a. n.a.Renewable energy from heat pumps n.a. n.a.Aerothermal heat pumps n.a. n.a.Geothermal heat pumps n.a. n.a.Hydrothermal heat pumps n.a. n.a.Total n.a. n.a.Total district hea ng n.a. n.a.Total biomass in households n.a. n.a.
Renewable Transport ktoe % Comment
Bioethanol / bio-ETBE n.a. n.a.Bioethanol / bio-ETBE Ar cle 21.2 n.a. n.a.Bioethanol / bio-ETBE imported n.a. n.a.Biodiesel n.a. n.a.Biodiesel Ar cle 21.2 n.a. n.a.Biodiesel imported n.a. n.a.Hydrogen from renewables n.a. n.a.Renewable electricity n.a. n.a.Renewable electricity road transport n.a. n.a.Renewable electricity non-road transport n.a. n.a.Other biofuels n.a. n.a.Other biofuels Ar cle 21.2 n.a. n.a.Total n.a. n.a.
Table 41: Czech PR Table 1b, Table1c and Table 1d: Total actualcontribu on (installed capacity,gross electricity genera on, finalenergy consump on) from eachrenewable energy technology inCzech Republic for 2010 to meetthe binding 2020 targets and theindica ve interim trajectory forthe shares of energy fromrenewable resources in electricity(see Table 10a of the NREAP),hea ng and cooling (see Table 11of the NREAP) and in thetransport sector (see Table 12 ofthe NREAP)
ECN-E--13-076 Chapter 6. Czech Republic 43

Biomass supply for hea ng and electricity Domes c raw material
Unit 2009 2010 Comment
Direct supply of wood biomass from forests and otherwooded land energy genera on
ktoe n.a. n.a.
Indirect supply of wood biomass ktoe n.a. n.a.Energy crops ktoe n.a. n.a.Agricultural by-products / processed residues and fisheryby-products
ktoe n.a. n.a.
Biomass from waste ktoe n.a. n.a.Others ktoe n.a. n.a.Total biomass for hea ng and electricity* ktoe n.a. n.a.
Biomass supply for transport Unit 2009 2010 Comment
Common arable crops for biofuels ktoe n.a. n.a.Energy crops and short rota on trees for biofuels ktoe n.a. n.a.Others ktoe n.a. n.a.Total biomass for transport* ktoe n.a. n.a.
Total biomass for all sectors* ktoe 0 0
Biomass supply for hea ng and electricity Raw material imported from EU
Unit 2009 2010 CommentDirect supply of wood biomass from forests and otherwooded land energy genera on
ktoe n.a. n.a.
Indirect supply of wood biomass ktoe n.a. n.a.Energy crops ktoe n.a. n.a.Agricultural by-products / processed residues and fisheryby-products
ktoe n.a. n.a.
Biomass from waste ktoe n.a. n.a.Others ktoe n.a. n.a.Total biomass for hea ng and electricity* ktoe n.a. n.a.
Biomass supply for transport Unit 2009 2010 Comment
Common arable crops for biofuels ktoe n.a. n.a.Energy crops and short rota on trees for biofuels ktoe n.a. n.a.Others ktoe n.a. n.a.Total biomass for transport* ktoe n.a. n.a.
Total biomass for all sectors* ktoe 0 0
Biomass supply for hea ng and electricity Raw material imported from non-EU
Unit 2009 2010 CommentDirect supply of wood biomass from forests and otherwooded land energy genera on
ktoe n.a. n.a.
Indirect supply of wood biomass ktoe n.a. n.a.Energy crops ktoe n.a. n.a.Agricultural by-products / processed residues and fisheryby-products
ktoe n.a. n.a.
Biomass from waste ktoe n.a. n.a.Others ktoe n.a. n.a.Total biomass for hea ng and electricity* ktoe n.a. n.a.
Biomass supply for transport Unit 2009 2010 Comment
Common arable crops for biofuels ktoe n.a. n.a.Energy crops and short rota on trees for biofuels ktoe n.a. n.a.Others ktoe n.a. n.a.Total biomass for transport* ktoe n.a. n.a.
Total biomass for all sectors* ktoe 0 0
* The values indicated with ‘*’ are calculated values and have not been men oned in the Progress Reportsas such.
Table 42: Czech PR Table 4:Biomass supply for hea ng and
electricity (see Table 7 of theNREAP)
44

Unit 2009 2010 Comment
Land used for common arable crops and oil seeds ha n.a. n.a.Land used for short rota on trees ha n.a. n.a.Land used for other energy crops such as grasses ha n.a. n.a.
Table 43: Czech PR Table 4a:Current domes c agriculturalland use for produc on of cropsdedicated to energy produc on(see Table 8 of the NREAP)
Unit 2009 2010 Comment
Produc on - Fuel type X ktoe n.a. n.a.Consump on - Fuel type X ktoe n.a. n.a.Total produc on Art.21.2.biofuels ktoe n.a. n.a.Total consump on Art.21.2. biofuels ktoe n.a. n.a.Share of 21(2) fuels from total RES-T % n.a. n.a.
Table 44: Czech PR Table 5:Produc on and consump on ofAr cle 21(2) biofuels (ktoe)
Unit 2009 2010 Comment
Total es mated net GHG emission saving from RES t CO2-eq n.a. n.a.Es mated net GHG saving from the use of RES-E t CO2-eq n.a. n.a.Es mated net GHG saving from the use of RES-H/C t CO2-eq n.a. n.a.Es mated net GHG saving from the use of RES-T t CO2-eq n.a. n.a.
Table 45: Czech PR Table 6:Es mated GHG emission savingsfrom the use of renewable energy
Actual/es matedexcess produc on
Actual/es mateddeficit produc on
Comment
Renewable energy n.a. n.a.Origin/des na on n.a. n.a.Unit ktoe ktoe2010 n.a. n.a.2011 n.a. n.a.2012 n.a. n.a.2013 n.a. n.a.2014 n.a. n.a.2015 n.a. n.a.2016 n.a. n.a.2017 n.a. n.a.2018 n.a. n.a.2019 n.a. n.a.2020 n.a. n.a.
Table 46: Czech PR Table 7:Actual and es mated excessand/or deficit (-) produc on ofrenewable energy compared tothe indica ve trajectory whichcould be transferred to/fromother Member States and/orthird countries in Czech Republic(ktoe) (see Table 9 of the NREAP)
ECN-E--13-076 Chapter 6. Czech Republic 45

46
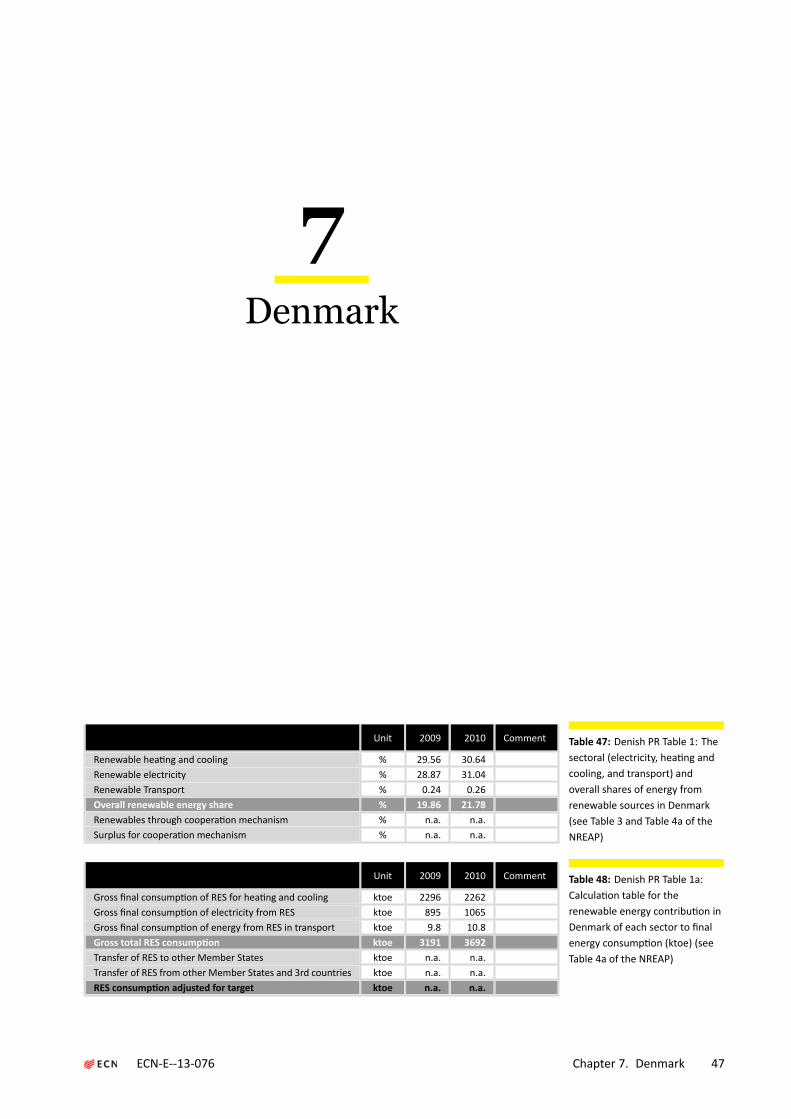
7Denmark
Unit 2009 2010 Comment
Renewable hea ng and cooling % 29.56 30.64Renewable electricity % 28.87 31.04Renewable Transport % 0.24 0.26Overall renewable energy share % 19.86 21.78Renewables through coopera on mechanism % n.a. n.a.Surplus for coopera on mechanism % n.a. n.a.
Table 47: Denish PR Table 1: Thesectoral (electricity, hea ng andcooling, and transport) andoverall shares of energy fromrenewable sources in Denmark(see Table 3 and Table 4a of theNREAP)
Unit 2009 2010 Comment
Gross final consump on of RES for hea ng and cooling ktoe 2296 2262Gross final consump on of electricity from RES ktoe 895 1065Gross final consump on of energy from RES in transport ktoe 9.8 10.8Gross total RES consump on ktoe 3191 3692Transfer of RES to other Member States ktoe n.a. n.a.Transfer of RES from other Member States and 3rd countries ktoe n.a. n.a.RES consump on adjusted for target ktoe n.a. n.a.
Table 48: Denish PR Table 1a:Calcula on table for therenewable energy contribu on inDenmark of each sector to finalenergy consump on (ktoe) (seeTable 4a of the NREAP)
ECN-E--13-076 Chapter 7. Denmark 47

2009
Capacity Energy Comment
Renewable Electricity MW GWh ktoe %
Hydropower 9 22 2 0.1%Hydropower (non pumped) 9 22 2 0.1%Hydropower <1 MW (non pumped) 5 13 1 0.0%Hydropower 1 MW - 10 MW (non pumped) 4 10 1 0.0%Hydropower >10 MW (non pumped) 0 0 0 0.0%Hydropower pumped storage 0 0 0 0.0%Hydropower mixed (normalised) 0 0 0 0.0%Geothermal 0 0 0 0.0%Solar 5 4 0 0.0%Solar photovoltaic 5 4 0 0.0%Concentrated solar power 0 0 0 0.0%Tidal, wave and ocean energy 0 0 0 0.0%Wind power 3322 7029 604 18.9%Onshore wind 2780 5883 506 15.8%Offshore wind 542 1147 99 3.1%Biomass 1094 3352 288 9.0%Solid biomass 1017 3031 261 8.1%Biogas 77 320 28 0.9%Bioliquids 0 0 0 0.0%Total 4430 10407 895 28.0%Total CHP 1094 3352 288 9.0%
Renewable Hea ng and Cooling ktoe % Comment
Geothermal 6 0.2%Solar thermal 14 0.4%Biomass 2123 66.3%Solid biomass 2075 64.8%Biogas 48 1.5%Bioliquids 0 0.0%Renewable energy from heat pumps 153 4.8%Aerothermal heat pumps n.a. n.a.Geothermal heat pumps n.a. n.a.Hydrothermal heat pumps n.a. n.a.Total 2296 71.7%Total district hea ng 967 30.2%Total biomass in households 1625 50.8%
Renewable Transport ktoe % Comment
Bioethanol / bio-ETBE 0 0.0%Bioethanol / bio-ETBE Ar cle 21.2 0 0.0%Bioethanol / bio-ETBE imported 0 0.0%Biodiesel 0 0.0%Biodiesel Ar cle 21.2 0 0.0%Biodiesel imported 0 0.0%Hydrogen from renewables 0 0.0%Renewable electricity 9.8 0.3%Renewable electricity road transport 0 0.0%Renewable electricity non-road transport 9.8 0.3%Other biofuels 0 0.0%Other biofuels Ar cle 21.2 0 0.0%Total 9.8 0.3%
Table 49: Denish PR Table 1b,Table 1c and Table 1d: Total actual
contribu on (installed capacity,gross electricity genera on, finalenergy consump on) from eachrenewable energy technology inDenmark for 2009 to meet thebinding 2020 targets and the
indica ve interim trajectory forthe shares of energy from
renewable resources in electricity(see Table 10a of the NREAP),
hea ng and cooling (see Table 11of the NREAP) and in the
transport sector (see Table 12 ofthe NREAP)
48

2010
Capacity Energy Comment
Renewable Electricity MW GWh ktoe %
Hydropower 9 22 2 0.1%Hydropower (non pumped) 9 22 2 0.1%Hydropower <1 MW (non pumped) 5 13 1 0.0%Hydropower 1 MW - 10 MW (non pumped) 4 10 1 0.0%Hydropower >10 MW (non pumped) 0 0 0 0.0%Hydropower pumped storage 0 0 0 0.0%Hydropower mixed (normalised) 0 0 0 0.0%Geothermal 0 0 0 0.0%Solar 7 6 1 0.0%Solar photovoltaic 7 6 1 0.0%Concentrated solar power 0 0 0 0.0%Tidal, wave and ocean energy 0 0 0 0.0%Wind power 3642 7729 665 20.8%Onshore wind 2877 6106 525 16.4%Offshore wind 765 1622 139 4.4%Biomass 1248 4632 398 12.4%Solid biomass 1168 4299 370 11.5%Biogas 80 333 29 0.9%Bioliquids 0 0 0 0.0%Total 4906 12389 1065 33.3%Total CHP 1248 4632 398 12.4%
Renewable Hea ng and Cooling ktoe % Comment
Geothermal 5 0.2%Solar thermal 15 0.5%Biomass 2436 76.1%Solid biomass 2387 74.6%Biogas 49 1.5%Bioliquids 0 0.0%Renewable energy from heat pumps 170 5.3%Aerothermal heat pumps n.a. n.a.Geothermal heat pumps n.a. n.a.Hydrothermal heat pumps n.a. n.a.Total 2626 82.0%Total district hea ng 1217 38.0%Total biomass in households 1867 58.3%
Renewable Transport ktoe % Comment
Bioethanol / bio-ETBE 0 0.0%Bioethanol / bio-ETBE Ar cle 21.2 0 0.0%Bioethanol / bio-ETBE imported 0 0.0%Biodiesel 0 0.0%Biodiesel Ar cle 21.2 0 0.0%Biodiesel imported 0 0.0%Hydrogen from renewables 0 0.0%Renewable electricity 10.8 0.3%Renewable electricity road transport 0 0.0%Renewable electricity non-road transport 10.8 0.3%Other biofuels 0 0.0%Other biofuels Ar cle 21.2 0 0.0%Total 10.8 0.3%
Table 50: Denish PR Table 1b,Table 1c and Table 1d: Total actualcontribu on (installed capacity,gross electricity genera on, finalenergy consump on) from eachrenewable energy technology inDenmark for 2010 to meet thebinding 2020 targets and theindica ve interim trajectory forthe shares of energy fromrenewable resources in electricity(see Table 10a of the NREAP),hea ng and cooling (see Table 11of the NREAP) and in thetransport sector (see Table 12 ofthe NREAP)
ECN-E--13-076 Chapter 7. Denmark 49

Biomass supply for hea ng and electricity Domes c raw material
Unit 2009 2010 Comment
Direct supply of wood biomass from forests and otherwooded land energy genera on
ktoe 785 854
Indirect supply of wood biomass ktoe 223 239Energy crops ktoe n.a. n.a.Agricultural by-products / processed residues and fisheryby-products
ktoe n.a. n.a.
Biomass from waste ktoe 414 563Others ktoe 552 534Total biomass for hea ng and electricity* ktoe 1974 2190
Biomass supply for transport Unit 2009 2010 Comment
Common arable crops for biofuels ktoe n.a. n.a.Energy crops and short rota on trees for biofuels ktoe n.a. n.a.Others ktoe n.a. n.a.Total biomass for transport* ktoe n.a. n.a.
Total biomass for all sectors* ktoe 1974 2190
Biomass supply for hea ng and electricity Raw material imported from EU
Unit 2009 2010 CommentDirect supply of wood biomass from forests and otherwooded land energy genera on
ktoe 372 510
Indirect supply of wood biomass ktoe 126 194Energy crops ktoe n.a. n.a.Agricultural by-products / processed residues and fisheryby-products
ktoe n.a. n.a.
Biomass from waste ktoe n.a. n.a.Others ktoe n.a. n.a.Total biomass for hea ng and electricity* ktoe 498 704
Biomass supply for transport Unit 2009 2010 Comment
Common arable crops for biofuels ktoe n.a. n.a.Energy crops and short rota on trees for biofuels ktoe n.a. n.a.Others ktoe n.a. n.a.Total biomass for transport* ktoe n.a. n.a.
Total biomass for all sectors* ktoe 498 704
Biomass supply for hea ng and electricity Raw material imported from non-EU
Unit 2009 2010 CommentDirect supply of wood biomass from forests and otherwooded land energy genera on
ktoe 51 78
Indirect supply of wood biomass ktoe 29 44Energy crops ktoe n.a. n.a.Agricultural by-products / processed residues and fisheryby-products
ktoe n.a. n.a.
Biomass from waste ktoe n.a. n.a.Others ktoe n.a. n.a.Total biomass for hea ng and electricity* ktoe 80 122
Biomass supply for transport Unit 2009 2010 Comment
Common arable crops for biofuels ktoe n.a. n.a.Energy crops and short rota on trees for biofuels ktoe n.a. n.a.Others ktoe n.a. n.a.Total biomass for transport* ktoe n.a. n.a.
Total biomass for all sectors* ktoe 80 122
* The values indicated with ‘*’ are calculated values and have not been men oned in the Progress Reportsas such.
Table 51: Denish PR Table 4:Biomass supply for hea ng and
electricity (see Table 7 of theNREAP)
50

Unit 2009 2010 Comment
Land used for common arable crops and oil seeds ha 70000 70000 1 (p.52)Land used for short rota on trees ha 4000 4000 2 (p.52)Land used for other energy crops such as grasses ha 50 50 3 (p.52)
Table 52: Denish PR Table 4a:Current domes c agriculturalland use for produc on of cropsdedicated to energy produc on(see Table 8 of the NREAP)
Unit 2009 2010 Comment
Produc on - Fuel type X ktoe 0 0Consump on - Fuel type X ktoe 0 0Total produc on Art.21.2.biofuels ktoe 0 0Total consump on Art.21.2. biofuels ktoe 0 0Share of 21(2) fuels from total RES-T % 0 0
Table 53: Denish PR Table 5:Produc on and consump on ofAr cle 21(2) biofuels (ktoe)
Unit 2009 2010 Comment
Total es mated net GHG emission saving from RES t CO2-eq n.a. n.a.Es mated net GHG saving from the use of RES-E t CO2-eq 5800000 6700000Es mated net GHG saving from the use of RES-H/C t CO2-eq 6200000 7100000Es mated net GHG saving from the use of RES-T t CO2-eq 0 0
Table 54: Denish PR Table 6:Es mated GHG emission savingsfrom the use of renewable energy
Actual/es matedexcess produc on
Actual/es mateddeficit produc on
Comment
Renewable energy n.a. n.a.Origin/des na on n.a. n.a.Unit ktoe ktoe2010 n.a. n.a.2011 n.a. n.a.2012 n.a. n.a.2013 n.a. n.a.2014 n.a. n.a.2015 n.a. n.a.2016 n.a. n.a.2017 n.a. n.a.2018 n.a. n.a.2019 n.a. n.a.2020 n.a. n.a.
Table 55: Denish PR Table 7:Actual and es mated excessand/or deficit (-) produc on ofrenewable energy compared tothe indica ve trajectory whichcould be transferred to/fromother Member States and/orthird countries in Denmark (ktoe)(see Table 9 of the NREAP)
ECN-E--13-076 Chapter 7. Denmark 51

Comments for Denmark
1: Approximate value2: Approximate value3: Maximum value
52

8Estonia
Unit 2009 2010 Comment
Renewable hea ng and cooling % 41.4 42.6Renewable electricity % 6.1 10.4Renewable Transport % 0.2 0.2Overall renewable energy share % 22.7 24Renewables through coopera on mechanism % 0 0Surplus for coopera on mechanism % 0 0
Table 56: Estonian PR Table 1:The sectoral (electricity, hea ngand cooling, and transport) andoverall shares of energy fromrenewable sources in Estonia (seeTable 3 and Table 4a of theNREAP)
Unit 2009 2010 Comment
Gross final consump on of RES for hea ng and cooling ktoe 643 682Gross final consump on of electricity from RES ktoe 47 87Gross final consump on of energy from RES in transport ktoe 1 1Gross total RES consump on ktoe 691 770Transfer of RES to other Member States ktoe 0 0Transfer of RES from other Member States and 3rd countries ktoe 0 0RES consump on adjusted for target ktoe 691 770 1 (p.58)
Table 57: Estonian PR Table 1a:Calcula on table for therenewable energy contribu on inEstonia of each sector to finalenergy consump on (ktoe) (seeTable 4a of the NREAP)
ECN-E--13-076 Chapter 8. Estonia 53

2009
Capacity Energy Comment
Renewable Electricity MW GWh ktoe %
Hydropower 7 25 2 0.3%Hydropower (non pumped) 7 25 2 0.3%Hydropower <1 MW (non pumped) 7 25 2 0.3%Hydropower 1 MW - 10 MW (non pumped) 0 0 0 0.0%Hydropower >10 MW (non pumped) 0 0 0 0.0%Hydropower pumped storage 0 0 0 0.0%Hydropower mixed (normalised) 0 0 0 0.0%Geothermal 0 0 0 0.0%Solar 0 0 0 0.0%Solar photovoltaic 0 0 0 0.0%Concentrated solar power 0 0 0 0.0%Tidal, wave and ocean energy 0 0 0 0.0%Wind power 104 204 18 2.5%Onshore wind 104 204 18 2.5%Offshore wind 0 0 0 0.0%Biomass 37 313 27 3.9%Solid biomass 35 306 26 3.8%Biogas 2 7 1 0.1%Bioliquids 0 0 0 0.0%Total 148 542 47 6.7%Total CHP n.a. 229 20 2.9%
Renewable Hea ng and Cooling ktoe % Comment
Geothermal 0 0.0%Solar thermal 0 0.0%Biomass 643 93.1%Solid biomass 643 93.1%Biogas 0 0.0%Bioliquids 0 0.0%Renewable energy from heat pumps 29 4.2% 2 (p.58)Aerothermal heat pumps 0 0.0%Geothermal heat pumps 0 0.0%Hydrothermal heat pumps 0 0.0%Total 643 93.1%Total district hea ng 127 18.4%Total biomass in households 411 59.5%
Renewable Transport ktoe % Comment
Bioethanol / bio-ETBE 0 0.0% 3 (p.58)Bioethanol / bio-ETBE Ar cle 21.2 0 0.0%Bioethanol / bio-ETBE imported 0 0.0%Biodiesel 0 0.0% 4 (p.58)Biodiesel Ar cle 21.2 0 0.0%Biodiesel imported 0 0.0%Hydrogen from renewables 0 0.0%Renewable electricity 0.91 0.1%Renewable electricity road transport 0.33 0.0%Renewable electricity non-road transport 0.57 0.1%Other biofuels 0 0.0%Other biofuels Ar cle 21.2 0 0.0%Total 0.91 0.1%
Table 58: Estonian PR Table 1b,Table 1c and Table 1d: Total actual
contribu on (installed capacity,gross electricity genera on, finalenergy consump on) from eachrenewable energy technology in
Estonia for 2009 to meet thebinding 2020 targets and the
indica ve interim trajectory forthe shares of energy from
renewable resources in electricity(see Table 10a of the NREAP),
hea ng and cooling (see Table 11of the NREAP) and in the
transport sector (see Table 12 ofthe NREAP)
54

2010
Capacity Energy Comment
Renewable Electricity MW GWh ktoe %
Hydropower 6 22 2 0.3%Hydropower (non pumped) 6 22 2 0.3%Hydropower <1 MW (non pumped) 6 22 2 0.3%Hydropower 1 MW - 10 MW (non pumped) 0 0 0 0.0%Hydropower >10 MW (non pumped) 0 0 0 0.0%Hydropower pumped storage 0 0 0 0.0%Hydropower mixed (normalised) 0 0 0 0.0%Geothermal 0 0 0 0.0%Solar 0 0 0 0.0%Solar photovoltaic 0 0 0 0.0%Concentrated solar power 0 0 0 0.0%Tidal, wave and ocean energy 0 0 0 0.0%Wind power 108 247 21 3.1%Onshore wind 108 247 21 3.1%Offshore wind 0 0 0 0.0%Biomass 67 740 64 9.2%Solid biomass 63 730 63 9.1%Biogas 4 10 1 0.1%Bioliquids 0 0 0 0.0%Total 181 1009 87 12.6%Total CHP n.a. 485 42 6.0%
Renewable Hea ng and Cooling ktoe % Comment
Geothermal 0 0.0%Solar thermal 0 0.0%Biomass 682 98.8%Solid biomass 680 98.5%Biogas 2 0.3%Bioliquids 0 0.0%Renewable energy from heat pumps 37 5.4% 2 (p.58)Aerothermal heat pumps 0 0.0%Geothermal heat pumps 0 0.0%Hydrothermal heat pumps 0 0.0%Total 682 98.8%Total district hea ng 142 20.6%Total biomass in households 423 61.3%
Renewable Transport ktoe % Comment
Bioethanol / bio-ETBE 0 0.0% 3 (p.58)Bioethanol / bio-ETBE Ar cle 21.2 0 0.0%Bioethanol / bio-ETBE imported 0 0.0%Biodiesel 0 0.0% 4 (p.58)Biodiesel Ar cle 21.2 0 0.0%Biodiesel imported 0 0.0%Hydrogen from renewables 0 0.0%Renewable electricity 0.76 0.1%Renewable electricity road transport 0.31 0.0%Renewable electricity non-road transport 0.45 0.1%Other biofuels 0 0.0%Other biofuels Ar cle 21.2 0 0.0%Total 0.76 0.1%
Table 59: Estonian PR Table 1b,Table 1c and Table 1d: Total actualcontribu on (installed capacity,gross electricity genera on, finalenergy consump on) from eachrenewable energy technology inEstonia for 2010 to meet thebinding 2020 targets and theindica ve interim trajectory forthe shares of energy fromrenewable resources in electricity(see Table 10a of the NREAP),hea ng and cooling (see Table 11of the NREAP) and in thetransport sector (see Table 12 ofthe NREAP)
ECN-E--13-076 Chapter 8. Estonia 55

Biomass supply for hea ng and electricity Domes c raw material
Unit 2009 2010 Comment
Direct supply of wood biomass from forests and otherwooded land energy genera on
ktoe 314 330
Indirect supply of wood biomass ktoe 339 433Energy crops ktoe n.a. n.a.Agricultural by-products / processed residues and fisheryby-products
ktoe n.a. n.a.
Biomass from waste ktoe n.a. n.a.Others ktoe n.a. n.a.Total biomass for hea ng and electricity* ktoe 653 763
Biomass supply for transport Unit 2009 2010 Comment
Common arable crops for biofuels ktoe 0 0Energy crops and short rota on trees for biofuels ktoe 0 0Others ktoe 0 0Total biomass for transport* ktoe 0 0
Total biomass for all sectors* ktoe 653 763
Biomass supply for hea ng and electricity Raw material imported from EU
Unit 2009 2010 CommentDirect supply of wood biomass from forests and otherwooded land energy genera on
ktoe n.a. n.a.
Indirect supply of wood biomass ktoe n.a. n.a.Energy crops ktoe n.a. n.a.Agricultural by-products / processed residues and fisheryby-products
ktoe n.a. n.a.
Biomass from waste ktoe n.a. n.a.Others ktoe n.a. n.a.Total biomass for hea ng and electricity* ktoe n.a. n.a.
Biomass supply for transport Unit 2009 2010 Comment
Common arable crops for biofuels ktoe 0 0Energy crops and short rota on trees for biofuels ktoe 0 0Others ktoe 0 0Total biomass for transport* ktoe 0 0
Total biomass for all sectors* ktoe 0 0
Biomass supply for hea ng and electricity Raw material imported from non-EU
Unit 2009 2010 CommentDirect supply of wood biomass from forests and otherwooded land energy genera on
ktoe n.a. n.a.
Indirect supply of wood biomass ktoe n.a. n.a.Energy crops ktoe n.a. n.a.Agricultural by-products / processed residues and fisheryby-products
ktoe n.a. n.a.
Biomass from waste ktoe n.a. n.a.Others ktoe n.a. n.a.Total biomass for hea ng and electricity* ktoe n.a. n.a.
Biomass supply for transport Unit 2009 2010 Comment
Common arable crops for biofuels ktoe 0 0Energy crops and short rota on trees for biofuels ktoe 0 0Others ktoe 0 0Total biomass for transport* ktoe 0 0
Total biomass for all sectors* ktoe 0 0
* The values indicated with ‘*’ are calculated values and have not been men oned in the Progress Reportsas such.
Table 60: Estonian PR Table 4:Biomass supply for hea ng and
electricity (see Table 7 of theNREAP)
56

Unit 2009 2010 Comment
Land used for common arable crops and oil seeds ha 23827 50 to70
5 (p.58)
Land used for short rota on trees ha 2 2.4 6 (p.58)Land used for other energy crops such as grasses ha 135 135 7 (p.58)
Table 61: Estonian PR Table 4a:Current domes c agriculturalland use for produc on of cropsdedicated to energy produc on(see Table 8 of the NREAP)
Unit 2009 2010 Comment
Produc on - Fuel type X ktoe 0 0Consump on - Fuel type X ktoe 0 0Total produc on Art.21.2.biofuels ktoe 0 0Total consump on Art.21.2. biofuels ktoe 0 0Share of 21(2) fuels from total RES-T % 0 0
Table 62: Estonian PR Table 5:Produc on and consump on ofAr cle 21(2) biofuels (ktoe)
Unit 2009 2010 Comment
Total es mated net GHG emission saving from RES t CO2-eq 2812 3281Es mated net GHG saving from the use of RES-E t CO2-eq 525 1113Es mated net GHG saving from the use of RES-H/C t CO2-eq 2287 2168Es mated net GHG saving from the use of RES-T t CO2-eq 0 0
Table 63: Estonian PR Table 6:Es mated GHG emission savingsfrom the use of renewable energy
Actual/es matedexcess produc on
Actual/es mateddeficit produc on
Comment
Renewable energy n.a. n.a.Origin/des na on n.a. n.a.Unit ktoe ktoe2010 104 n.a.2011 n.a. n.a.2012 n.a. n.a.2013 n.a. n.a.2014 n.a. n.a.2015 n.a. n.a.2016 n.a. n.a.2017 n.a. n.a.2018 n.a. n.a.2019 n.a. n.a.2020 n.a. n.a.
Table 64: Estonian PR Table 7:Actual and es mated excessand/or deficit (-) produc on ofrenewable energy compared tothe indica ve trajectory whichcould be transferred to/fromother Member States and/orthird countries in Estonia (ktoe)(see Table 9 of the NREAP)
ECN-E--13-076 Chapter 8. Estonia 57
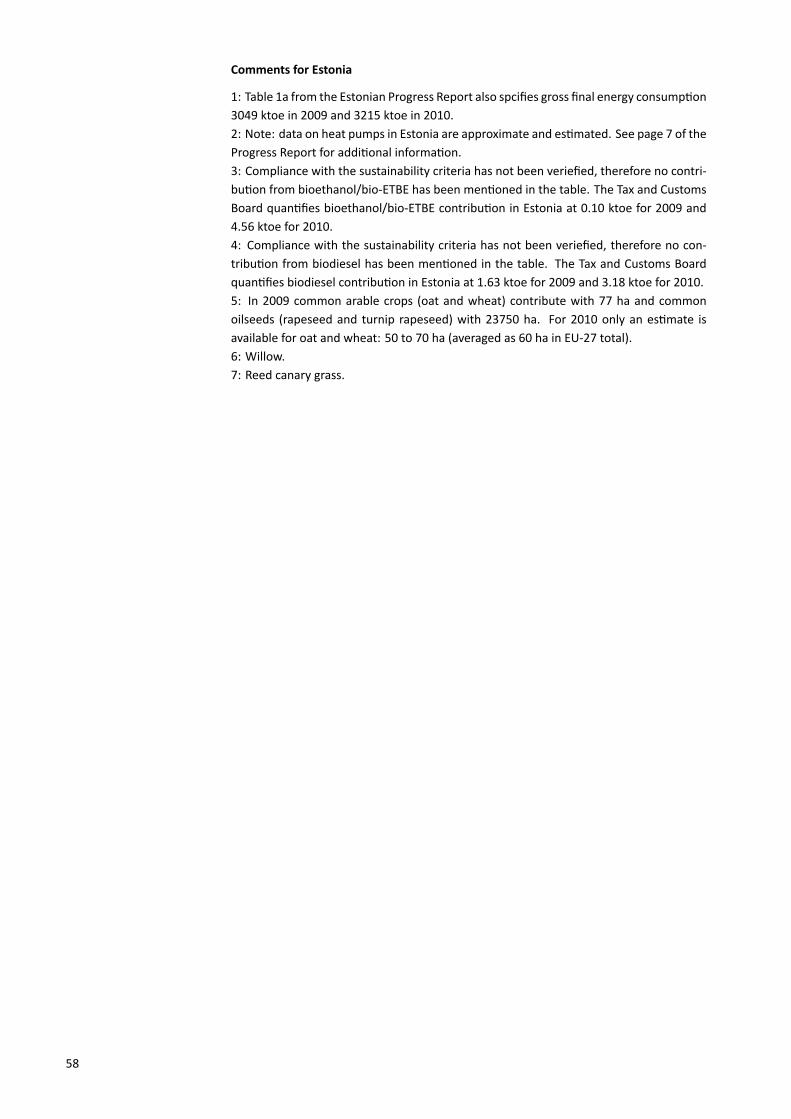
Comments for Estonia
1: Table 1a from the Estonian Progress Report also spcifies gross final energy consump on3049 ktoe in 2009 and 3215 ktoe in 2010.2: Note: data on heat pumps in Estonia are approximate and es mated. See page 7 of theProgress Report for addi onal informa on.3: Compliance with the sustainability criteria has not been veriefied, therefore no contri-bu on from bioethanol/bio-ETBE has been men oned in the table. The Tax and CustomsBoard quan fies bioethanol/bio-ETBE contribu on in Estonia at 0.10 ktoe for 2009 and4.56 ktoe for 2010.4: Compliance with the sustainability criteria has not been veriefied, therefore no con-tribu on from biodiesel has been men oned in the table. The Tax and Customs Boardquan fies biodiesel contribu on in Estonia at 1.63 ktoe for 2009 and 3.18 ktoe for 2010.5: In 2009 common arable crops (oat and wheat) contribute with 77 ha and commonoilseeds (rapeseed and turnip rapeseed) with 23750 ha. For 2010 only an es mate isavailable for oat and wheat: 50 to 70 ha (averaged as 60 ha in EU-27 total).6: Willow.7: Reed canary grass.
58

9Finland
Unit 2009 2010 Comment
Renewable hea ng and cooling % 45.2 46.4Renewable electricity % 27.2 27.6Renewable Transport % 4 3.8Overall renewable energy share % 32 33.1Renewables through coopera on mechanism % 0 0Surplus for coopera on mechanism % 0 0
Table 65: Finnish PR Table 1: Thesectoral (electricity, hea ng andcooling, and transport) andoverall shares of energy fromrenewable sources in Finland (seeTable 3 and Table 4a of theNREAP)
Unit 2009 2010 Comment
Gross final consump on of RES for hea ng and cooling ktoe 5623 6480Gross final consump on of electricity from RES ktoe 1969 2162 1 (p.64)Gross final consump on of energy from RES in transport ktoe 166 167 2 (p.64)Gross total RES consump on ktoe 7741 8788 3 (p.64)Transfer of RES to other Member States ktoe 0 0Transfer of RES from other Member States and 3rd countries ktoe 0 0RES consump on adjusted for target ktoe 7741 8788 4 (p.64)
Table 66: Finnish PR Table 1a:Calcula on table for therenewable energy contribu on inFinland of each sector to finalenergy consump on (ktoe) (seeTable 4a of the NREAP)
ECN-E--13-076 Chapter 9. Finland 59

2009
Capacity Energy Comment
Renewable Electricity MW GWh ktoe %
Hydropower n.a. n.a. n.a. n.a.Hydropower (non pumped) 3120 13898 1195 15.4%Hydropower <1 MW (non pumped) 31 138 12 0.2%Hydropower 1 MW - 10 MW (non pumped) 285 1269 109 1.4%Hydropower >10 MW (non pumped) 2804 12490 1074 13.9%Hydropower pumped storage 0 0 0 0.0%Hydropower mixed (normalised) 0 0 0 0.0%Geothermal 0 0 0 0.0%Solar 6 4 0 0.0%Solar photovoltaic 6 4 0 0.0%Concentrated solar power 0 0 0 0.0%Tidal, wave and ocean energy 0 0 0 0.0%Wind power 147 279 24 0.3%Onshore wind 147 279 24 0.3%Offshore wind 0 0 0 0.0%Biomass 1807 10718 922 11.9%Solid biomass 1807 10686 919 11.9%Biogas 0 32 3 0.0%Bioliquids 0 n.a. n.a. n.a.Total 5080 22899 1969 25.4%Total CHP n.a. 7949 683 8.8%
Renewable Hea ng and Cooling ktoe % Comment
Geothermal 0 0.0%Solar thermal 0 0.0%Biomass 5423 70.0%Solid biomass 5387 69.6%Biogas 20 0.3%Bioliquids 25 0.3%Renewable energy from heat pumps 200 2.6%Aerothermal heat pumps n.a. n.a.Geothermal heat pumps n.a. n.a.Hydrothermal heat pumps n.a. n.a.Total 5623 72.6%Total district hea ng 3574 46.2%Total biomass in households 1288 16.6%
Renewable Transport ktoe % Comment
Bioethanol / bio-ETBE 75.3 1.0%Bioethanol / bio-ETBE Ar cle 21.2 n.a. n.a.Bioethanol / bio-ETBE imported 75.3 1.0%Biodiesel 56.2 0.7%Biodiesel Ar cle 21.2 n.a. n.a.Biodiesel imported 1.7 0.0%Hydrogen from renewables n.a. n.a.Renewable electricity n.a. n.a.Renewable electricity road transport n.a. n.a.Renewable electricity non-road transport 16 0.2%Other biofuels n.a. n.a.Other biofuels Ar cle 21.2 n.a. n.a.Total 150 1.9%
Table 67: Finnish PR Table 1b,Table 1c and Table 1d: Total actual
contribu on (installed capacity,gross electricity genera on, finalenergy consump on) from eachrenewable energy technology in
Finland for 2009 to meet thebinding 2020 targets and the
indica ve interim trajectory forthe shares of energy from
renewable resources in electricity(see Table 10a of the NREAP),
hea ng and cooling (see Table 11of the NREAP) and in the
transport sector (see Table 12 ofthe NREAP)
60

2010
Capacity Energy Comment
Renewable Electricity MW GWh ktoe %
Hydropower n.a. n.a. n.a. n.a.Hydropower (non pumped) 3140 13877 1193 15.4%Hydropower <1 MW (non pumped) 31 137 12 0.2%Hydropower 1 MW - 10 MW (non pumped) 305 1354 116 1.5%Hydropower >10 MW (non pumped) 2804 12392 1066 13.8%Hydropower pumped storage 0 0 0 0.0%Hydropower mixed (normalised) 0 0 0 0.0%Geothermal 0 0 0 0.0%Solar 7 5 0 0.0%Solar photovoltaic 7 5 0 0.0%Concentrated solar power 0 0 0 0.0%Tidal, wave and ocean energy 0 0 0 0.0%Wind power 188 314 27 0.3%Onshore wind 188 314 27 0.3%Offshore wind 0 0 0 0.0%Biomass 1910 10948 941 12.2%Solid biomass 1910 10859 934 12.1%Biogas 0 89 8 0.1%Bioliquids 0 n.a. n.a. n.a.Total 5245 25144 2162 27.9%Total CHP n.a. 9288 799 10.3%
Renewable Hea ng and Cooling ktoe % Comment
Geothermal 0 0.0%Solar thermal 0 0.0%Biomass 6251 80.7%Solid biomass 6203 80.1%Biogas 8 0.1%Bioliquids 40 0.5%Renewable energy from heat pumps 229 3.0%Aerothermal heat pumps n.a. n.a.Geothermal heat pumps n.a. n.a.Hydrothermal heat pumps n.a. n.a.Total 6480 83.7%Total district hea ng 4348 56.2%Total biomass in households 1434 18.5%
Renewable Transport ktoe % Comment
Bioethanol / bio-ETBE 71.5 0.9%Bioethanol / bio-ETBE Ar cle 21.2 n.a. n.a.Bioethanol / bio-ETBE imported 71.5 0.9%Biodiesel 60 0.8%Biodiesel Ar cle 21.2 n.a. n.a.Biodiesel imported 3.7 0.0%Hydrogen from renewables n.a. n.a.Renewable electricity n.a. n.a.Renewable electricity road transport n.a. n.a.Renewable electricity non-road transport 17.2 0.2%Other biofuels n.a. n.a.Other biofuels Ar cle 21.2 n.a. n.a.Total 151.1 2.0%
Table 68: Finnish PR Table 1b,Table 1c and Table 1d: Total actualcontribu on (installed capacity,gross electricity genera on, finalenergy consump on) from eachrenewable energy technology inFinland for 2010 to meet thebinding 2020 targets and theindica ve interim trajectory forthe shares of energy fromrenewable resources in electricity(see Table 10a of the NREAP),hea ng and cooling (see Table 11of the NREAP) and in thetransport sector (see Table 12 ofthe NREAP)
ECN-E--13-076 Chapter 9. Finland 61

Biomass supply for hea ng and electricity Domes c raw material
Unit 2009 2010 Comment
Direct supply of wood biomass from forests and otherwooded land energy genera on
ktoe 2071.9 2271.4 5 (p.64)
Indirect supply of wood biomass ktoe 1603.1 1869.5 6 (p.64)Energy crops ktoe 22 n.a.Agricultural by-products / processed residues and fisheryby-products
ktoe n.a. n.a.
Biomass from waste ktoe n.a. n.a.Others ktoe n.a. n.a.Total biomass for hea ng and electricity* ktoe 3697 4140.9
Biomass supply for transport Unit 2009 2010 Comment
Common arable crops for biofuels ktoe 0.092 n.a.Energy crops and short rota on trees for biofuels ktoe n.a. n.a.Others ktoe n.a. n.a.Total biomass for transport* ktoe 0.092 n.a.
Total biomass for all sectors* ktoe 3697.092 4140.9
Biomass supply for hea ng and electricity Raw material imported from EU
Unit 2009 2010 CommentDirect supply of wood biomass from forests and otherwooded land energy genera on
ktoe n.a. n.a. 5 (p.64)
Indirect supply of wood biomass ktoe n.a. n.a. 6 (p.64)Energy crops ktoe n.a. n.a.Agricultural by-products / processed residues and fisheryby-products
ktoe n.a. n.a.
Biomass from waste ktoe n.a. n.a.Others ktoe n.a. n.a.Total biomass for hea ng and electricity* ktoe n.a. n.a.
Biomass supply for transport Unit 2009 2010 Comment
Common arable crops for biofuels ktoe n.a. n.a.Energy crops and short rota on trees for biofuels ktoe n.a. n.a.Others ktoe n.a. n.a.Total biomass for transport* ktoe n.a. n.a.
Total biomass for all sectors* ktoe 0 0
Biomass supply for hea ng and electricity Raw material imported from non-EU
Unit 2009 2010 CommentDirect supply of wood biomass from forests and otherwooded land energy genera on
ktoe n.a. n.a. 5 (p.64)
Indirect supply of wood biomass ktoe n.a. n.a. 6 (p.64)Energy crops ktoe n.a. n.a.Agricultural by-products / processed residues and fisheryby-products
ktoe n.a. n.a.
Biomass from waste ktoe n.a. n.a.Others ktoe n.a. n.a.Total biomass for hea ng and electricity* ktoe n.a. n.a.
Biomass supply for transport Unit 2009 2010 Comment
Common arable crops for biofuels ktoe n.a. n.a.Energy crops and short rota on trees for biofuels ktoe n.a. n.a.Others ktoe n.a. n.a.Total biomass for transport* ktoe n.a. n.a.
Total biomass for all sectors* ktoe 0 0
* The values indicated with ‘*’ are calculated values and have not been men oned in the Progress Reportsas such.
Table 69: Finnish PR Table 4:Biomass supply for hea ng and
electricity (see Table 7 of theNREAP)
62

Unit 2009 2010 Comment
Land used for common arable crops and oil seeds ha n.a. 332 7 (p.64)Land used for short rota on trees ha 30 18 8 (p.64)Land used for other energy crops such as grasses ha 16640 16894 9 (p.64)
Table 70: Finnish PR Table 4a:Current domes c agriculturalland use for produc on of cropsdedicated to energy produc on(see Table 8 of the NREAP)
Unit 2009 2010 Comment
Produc on - Fuel type X ktoe n.a. n.a.Consump on - Fuel type X ktoe n.a. n.a.Total produc on Art.21.2.biofuels ktoe n.a. n.a.Total consump on Art.21.2. biofuels ktoe n.a. n.a. 10 (p.64)Share of 21(2) fuels from total RES-T % n.a. n.a.
Table 71: Finnish PR Table 5:Produc on and consump on ofAr cle 21(2) biofuels (ktoe)
Unit 2009 2010 Comment
Total es mated net GHG emission saving from RES t CO2-eq n.a. n.a.Es mated net GHG saving from the use of RES-E t CO2-eq 16500000 16000000Es mated net GHG saving from the use of RES-H/C t CO2-eq 20400000 23500000Es mated net GHG saving from the use of RES-T t CO2-eq 300000 300000
Table 72: Finnish PR Table 6:Es mated GHG emission savingsfrom the use of renewable energy
Actual/es matedexcess produc on
Actual/es mateddeficit produc on
Comment
Renewable energy n.a. n.a.Origin/des na on n.a. n.a.Unit ktoe ktoe2010 0 02011 0 02012 0 02013 0 02014 0 02015 0 02016 0 02017 0 02018 0 02019 0 02020 0 0
Table 73: Finnish PR Table 7:Actual and es mated excessand/or deficit (-) produc on ofrenewable energy compared tothe indica ve trajectory whichcould be transferred to/fromother Member States and/orthird countries in Finland (ktoe)(see Table 9 of the NREAP)
ECN-E--13-076 Chapter 9. Finland 63

Comments for Finland
1: The figures contain the renewable electricity of trains (17 ktoe in 2009 and 18 ktoe in2009).2: The figures contain the renewable electricity of trains (17 ktoe in 2009 and 18 ktoe in2009).3: The figures only contain the renewable electricity of trains once.4: The figures only contain the renewable electricity of trains once.5: Coverswoodchips usedbyheat andpower plants and rawfirewood for detachedhouses.Also includes imported wood.6: Covers the forest industry coproductwoodused in heat andpower plants (wood residuechips, sawdust, bark), wood pellets and brique es and recycled wood, as well as wastefirewood for detached houses. Also includes imported wood.7: Main types: rapeseed and oat.8: Main type: willow9: Main type: reed canary grass.10: The produc on and use of biofuels according to Ar cle 21(2) of the RES Direc ve wasnot significant before 2011, and the biofuels in ques on had not been defined at a na-onal level.
64
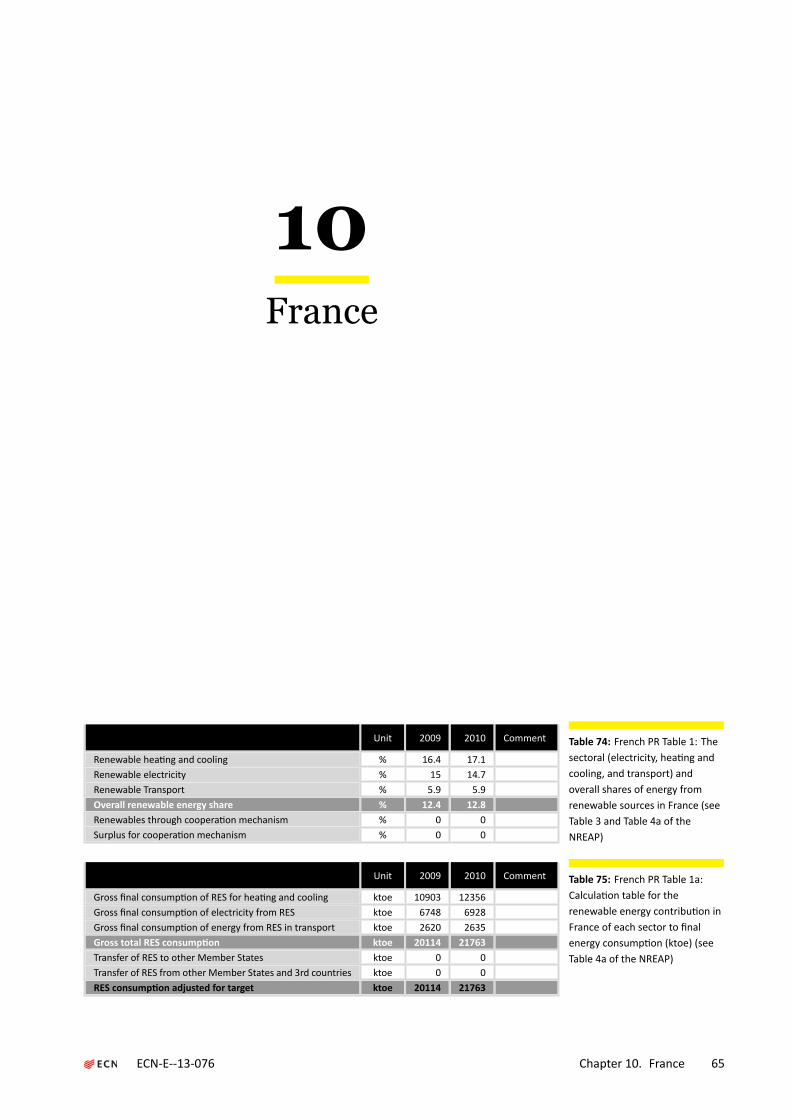
10France
Unit 2009 2010 Comment
Renewable hea ng and cooling % 16.4 17.1Renewable electricity % 15 14.7Renewable Transport % 5.9 5.9Overall renewable energy share % 12.4 12.8Renewables through coopera on mechanism % 0 0Surplus for coopera on mechanism % 0 0
Table 74: French PR Table 1: Thesectoral (electricity, hea ng andcooling, and transport) andoverall shares of energy fromrenewable sources in France (seeTable 3 and Table 4a of theNREAP)
Unit 2009 2010 Comment
Gross final consump on of RES for hea ng and cooling ktoe 10903 12356Gross final consump on of electricity from RES ktoe 6748 6928Gross final consump on of energy from RES in transport ktoe 2620 2635Gross total RES consump on ktoe 20114 21763Transfer of RES to other Member States ktoe 0 0Transfer of RES from other Member States and 3rd countries ktoe 0 0RES consump on adjusted for target ktoe 20114 21763
Table 75: French PR Table 1a:Calcula on table for therenewable energy contribu on inFrance of each sector to finalenergy consump on (ktoe) (seeTable 4a of the NREAP)
ECN-E--13-076 Chapter 10. France 65

2009
Capacity Energy Comment
Renewable Electricity MW GWh ktoe %
Hydropower 25449 69597 5984 29.0% 1 (p.70)Hydropower (non pumped) 18464 61135 5257 25.5%Hydropower <1 MW (non pumped) 446 1651 142 0.7%Hydropower 1 MW - 10 MW (non pumped) 1655 5754 495 2.4%Hydropower >10 MW (non pumped) 16363 53730 4620 22.4%Hydropower pumped storage 1808 4923 423 2.0%Hydropower mixed (normalised) 5177 3539 304 1.5% 2 (p.70)Geothermal 15 50 4 0.0%Solar 348 220 19 0.1%Solar photovoltaic 348 220 19 0.1%Concentrated solar power 0 0 0 0.0%Tidal, wave and ocean energy 240 448 39 0.2%Wind power 4621 8087 695 3.4%Onshore wind 4621 8087 695 3.4%Offshore wind 0 0 0 0.0%Biomass 914 4539 390 1.9% 3 (p.70)Solid biomass 753 3654 314 1.5%Biogas 161 885 76 0.4%Bioliquids 0 0 0 0.0%Total 31587 82941 7132 34.5% 4 (p.70)Total CHP 303 2283 196 1.0%
Renewable Hea ng and Cooling ktoe % Comment
Geothermal 88 0.4%Solar thermal 78 0.4%Biomass 9722 47.1%Solid biomass 9604 46.5%Biogas 118 0.6%Bioliquids 0 0.0%Renewable energy from heat pumps 750 3.6%Aerothermal heat pumps 639 3.1%Geothermal heat pumps 376 1.8%Hydrothermal heat pumps 0 0.0%Total 10903 52.8%Total district hea ng 356 1.7%Total biomass in households 6650 32.2%
Renewable Transport ktoe % Comment
Bioethanol / bio-ETBE 406 2.0% 5 (p.70)Bioethanol / bio-ETBE Ar cle 21.2 0 0.0%Bioethanol / bio-ETBE imported 119 0.6%Biodiesel 2057 10.0% 6 (p.70)Biodiesel Ar cle 21.2 0 0.0%Biodiesel imported 294 1.4%Hydrogen from renewables 0 0.0%Renewable electricity 157 0.8%Renewable electricity road transport 0 0.0%Renewable electricity non-road transport 157 0.8%Other biofuels 0 0.0%Other biofuels Ar cle 21.2 0 0.0%Total 2620 12.7%
Table 76: French PR Table 1b,Table 1c and Table 1d: Total actual
contribu on (installed capacity,gross electricity genera on, finalenergy consump on) from eachrenewable energy technology in
France for 2009 to meet thebinding 2020 targets and the
indica ve interim trajectory forthe shares of energy from
renewable resources in electricity(see Table 10a of the NREAP),
hea ng and cooling (see Table 11of the NREAP) and in the
transport sector (see Table 12 ofthe NREAP)
66

2010
Capacity Energy Comment
Renewable Electricity MW GWh ktoe %
Hydropower 25449 68643 5902 28.6% 1 (p.70)Hydropower (non pumped) 18464 60427 5196 25.2%Hydropower <1 MW (non pumped) 446 1601 138 0.7%Hydropower 1 MW - 10 MW (non pumped) 1655 5640 485 2.3%Hydropower >10 MW (non pumped) 16363 53186 4573 22.1%Hydropower pumped storage 1808 4759 409 2.0%Hydropower mixed (normalised) 5177 3457 297 1.4% 2 (p.70)Geothermal 15 15 1 0.0%Solar 1072 676 58 0.3%Solar photovoltaic 1072 676 58 0.3%Concentrated solar power 0 0 0 0.0%Tidal, wave and ocean energy 240 476 41 0.2%Wind power 5729 10499 903 4.4%Onshore wind 5729 10499 903 4.4%Offshore wind 0 0 0 0.0%Biomass 949 4876 419 2.0% 3 (p.70)Solid biomass 774 3863 332 1.6%Biogas 175 1013 87 0.4%Bioliquids 0 0 0 0.0%Total 33454 85185 7325 35.5% 4 (p.70)Total CHP n.a. n.a. n.a. n.a.
Renewable Hea ng and Cooling ktoe % Comment
Geothermal 90 0.4%Solar thermal 89 0.4%Biomass 10840 52.5%Solid biomass 10711 51.9%Biogas 129 0.6%Bioliquids 0 0.0%Renewable energy from heat pumps 1008 4.9%Aerothermal heat pumps 875 4.2%Geothermal heat pumps 462 2.2%Hydrothermal heat pumps 0 0.0%Total 12356 59.8%Total district hea ng n.a. n.a.Total biomass in households 7581 36.7%
Renewable Transport ktoe % Comment
Bioethanol / bio-ETBE 394 1.9% 5 (p.70)Bioethanol / bio-ETBE Ar cle 21.2 0 0.0%Bioethanol / bio-ETBE imported 109 0.5%Biodiesel 2086 10.1% 6 (p.70)Biodiesel Ar cle 21.2 63 0.3%Biodiesel imported 254 1.2%Hydrogen from renewables 0 0.0%Renewable electricity 155 0.8%Renewable electricity road transport 0 0.0%Renewable electricity non-road transport 155 0.8%Other biofuels 0 0.0%Other biofuels Ar cle 21.2 0 0.0%Total 2635 12.8%
Table 77: French PR Table 1b,Table 1c and Table 1d: Total actualcontribu on (installed capacity,gross electricity genera on, finalenergy consump on) from eachrenewable energy technology inFrance for 2010 to meet thebinding 2020 targets and theindica ve interim trajectory forthe shares of energy fromrenewable resources in electricity(see Table 10a of the NREAP),hea ng and cooling (see Table 11of the NREAP) and in thetransport sector (see Table 12 ofthe NREAP)
ECN-E--13-076 Chapter 10. France 67

Biomass supply for hea ng and electricity Domes c raw material
Unit 2009 2010 Comment
Direct supply of wood biomass from forests and otherwooded land energy genera on
ktoe 6650 7581
Indirect supply of wood biomass ktoe 2348 2524Energy crops ktoe 8.7 n.a. 7 (p.70)Agricultural by-products / processed residues and fisheryby-products
ktoe n.a. n.a.
Biomass from waste ktoe n.a. n.a.Others ktoe n.a. n.a.Total biomass for hea ng and electricity* ktoe 9006.7 10105
Biomass supply for transport Unit 2009 2010 Comment
Common arable crops for biofuels ktoe 2050 363 8 (p.70)Energy crops and short rota on trees for biofuels ktoe n.a. n.a.Others ktoe n.a. n.a.Total biomass for transport* ktoe 2050 363
Total biomass for all sectors* ktoe 11056.7 10468
Biomass supply for hea ng and electricity Raw material imported from EU
Unit 2009 2010 CommentDirect supply of wood biomass from forests and otherwooded land energy genera on
ktoe n.a. n.a.
Indirect supply of wood biomass ktoe n.a. n.a.Energy crops ktoe n.a. n.a. 7 (p.70)Agricultural by-products / processed residues and fisheryby-products
ktoe n.a. n.a.
Biomass from waste ktoe n.a. n.a.Others ktoe n.a. n.a.Total biomass for hea ng and electricity* ktoe n.a. n.a.
Biomass supply for transport Unit 2009 2010 Comment
Common arable crops for biofuels ktoe 413 363 8 (p.70)Energy crops and short rota on trees for biofuels ktoe n.a. n.a.Others ktoe n.a. n.a.Total biomass for transport* ktoe 413 363
Total biomass for all sectors* ktoe 413 363
Biomass supply for hea ng and electricity Raw material imported from non-EU
Unit 2009 2010 CommentDirect supply of wood biomass from forests and otherwooded land energy genera on
ktoe n.a. n.a.
Indirect supply of wood biomass ktoe n.a. n.a.Energy crops ktoe n.a. n.a. 7 (p.70)Agricultural by-products / processed residues and fisheryby-products
ktoe n.a. n.a.
Biomass from waste ktoe n.a. n.a.Others ktoe n.a. n.a.Total biomass for hea ng and electricity* ktoe n.a. n.a.
Biomass supply for transport Unit 2009 2010 Comment
Common arable crops for biofuels ktoe 413 363 8 (p.70)Energy crops and short rota on trees for biofuels ktoe n.a. n.a.Others ktoe n.a. n.a.Total biomass for transport* ktoe 413 363
Total biomass for all sectors* ktoe 413 363
* The values indicated with ‘*’ are calculated values and have not been men oned in the Progress Reportsas such.
Table 78: French PR Table 4:Biomass supply for hea ng and
electricity (see Table 7 of theNREAP)
68
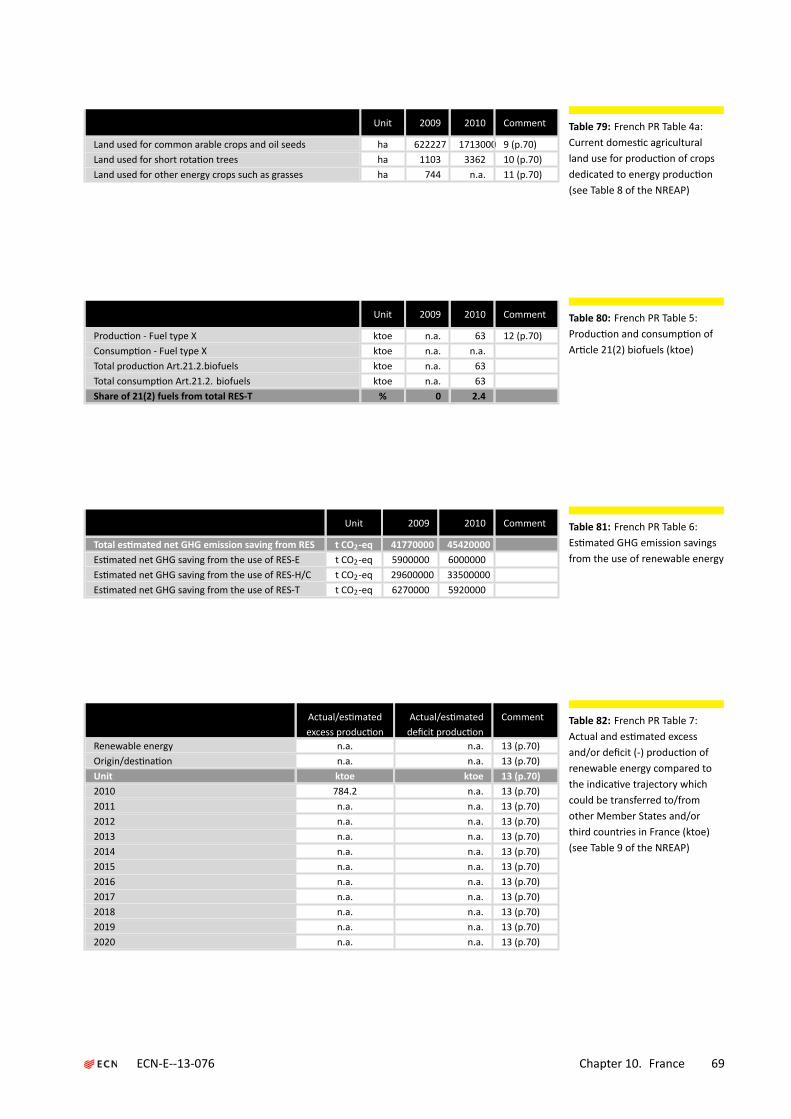
Unit 2009 2010 Comment
Land used for common arable crops and oil seeds ha 622227 1713000 9 (p.70)Land used for short rota on trees ha 1103 3362 10 (p.70)Land used for other energy crops such as grasses ha 744 n.a. 11 (p.70)
Table 79: French PR Table 4a:Current domes c agriculturalland use for produc on of cropsdedicated to energy produc on(see Table 8 of the NREAP)
Unit 2009 2010 Comment
Produc on - Fuel type X ktoe n.a. 63 12 (p.70)Consump on - Fuel type X ktoe n.a. n.a.Total produc on Art.21.2.biofuels ktoe n.a. 63Total consump on Art.21.2. biofuels ktoe n.a. 63Share of 21(2) fuels from total RES-T % 0 2.4
Table 80: French PR Table 5:Produc on and consump on ofAr cle 21(2) biofuels (ktoe)
Unit 2009 2010 Comment
Total es mated net GHG emission saving from RES t CO2-eq 41770000 45420000Es mated net GHG saving from the use of RES-E t CO2-eq 5900000 6000000Es mated net GHG saving from the use of RES-H/C t CO2-eq 29600000 33500000Es mated net GHG saving from the use of RES-T t CO2-eq 6270000 5920000
Table 81: French PR Table 6:Es mated GHG emission savingsfrom the use of renewable energy
Actual/es matedexcess produc on
Actual/es mateddeficit produc on
Comment
Renewable energy n.a. n.a. 13 (p.70)Origin/des na on n.a. n.a. 13 (p.70)Unit ktoe ktoe 13 (p.70)2010 784.2 n.a. 13 (p.70)2011 n.a. n.a. 13 (p.70)2012 n.a. n.a. 13 (p.70)2013 n.a. n.a. 13 (p.70)2014 n.a. n.a. 13 (p.70)2015 n.a. n.a. 13 (p.70)2016 n.a. n.a. 13 (p.70)2017 n.a. n.a. 13 (p.70)2018 n.a. n.a. 13 (p.70)2019 n.a. n.a. 13 (p.70)2020 n.a. n.a. 13 (p.70)
Table 82: French PR Table 7:Actual and es mated excessand/or deficit (-) produc on ofrenewable energy compared tothe indica ve trajectory whichcould be transferred to/fromother Member States and/orthird countries in France (ktoe)(see Table 9 of the NREAP)
ECN-E--13-076 Chapter 10. France 69

Comments for France
1: The figure indicated for total hydropower produc on is equal to the sum of renewablehydraulic produc on and nonrenewable hydraulic produc on.2: The figure indicated corresponds to the share of renewable hydropower (i.e. withoutpumping) from mixed power plants.3: Power outputs from biomass plants withmixed equipment have been calculated in pro-por on to the fuel used4: To obtain the total renewable produc on, deduct hydroelectric produc on with pump-ing from this value.5: Due to social trends in the last quarter of 2010, it has been necessary to temporarily lithe obliga on to incorporate biofuel for a period of 30-days. This temporary suspensionhas led to a decrease in the consump on of biofuel for 2010, which does reflect the actualsitua on for the sector.6: Due to social trends in the last quarter of 2010, it has been necessary to temporarily lithe obliga on to incorporate biofuel for a period of 30-days. This temporary suspensionhas led to a decrease in the consump on of biofuel for 2010, which does reflect the actualsitua on for the sector.7: 1103 ha of short rota on coppice (as a hypothesis for calcula ons, short rota on cop-pice from poplars) 744 ha of miscanthus8: Origin of imported rawmaterial has not been specified in French Progress Report, pos-sibly the value refers to both import from EU and non-EU.9: For 2009: wheat 84689 ha, sugar beets 6800 ha and rapeseed 530738 ha. For 2010:wheat/corn: 223000 ha, sugar beets 40000 ha and rapeseed/sunflowers1450000 ha. Upun l 2009, industrial land in fallow and assisted surface areas with energy crops were alsocounted. These data allowed for an evalua on of surface areas dedicated to energy crops.Fallow obliga ons have ceased in 2009, for 2010 these data are not available.10: Main types: Poplar, eucalyptus and willows logged before 20 years and rejec ngstumps, pine excluded. Data have been drawn from the declara ons of farmers; theydo not integrate surface areas planted by industry or the forestry sector.11: Main types: false canary reed, switchgrass, miscanthus, sorghum. Up un l 2009, in-dustrial land in fallow and supported surface areas with energy crops were also counted.These data allowed for an evalua on of surface areas dedicated to energy crops. Fallowobliga ons have ceased in 2009, for 2010 these data are not available.12: Refers to animal oils and used oils.13: Table 7 on pages 38-39 of the French Progress Report specifies in detail the excessproduc on per technology.
70

11Germany
Unit 2009 2010 Comment
Renewable hea ng and cooling % 9.6 11Renewable electricity % 17.4 18.4Renewable Transport % 5.8 6.2Overall renewable energy share % 10.2 11.3Renewables through coopera on mechanism % n.a. n.a.Surplus for coopera on mechanism % n.a. n.a.
Table 83: German PR Table 1: Thesectoral (electricity, hea ng andcooling, and transport) andoverall shares of energy fromrenewable sources in Germany(see Table 3 and Table 4a of theNREAP)
Unit 2009 2010 Comment
Gross final consump on of RES for hea ng and cooling ktoe 10222 12441Gross final consump on of electricity from RES ktoe 8653 9642Gross final consump on of energy from RES in transport ktoe 2964 3209Gross total RES consump on ktoe 21696 25130Transfer of RES to other Member States ktoe 0 0Transfer of RES from other Member States and 3rd countries ktoe 0 0RES consump on adjusted for target ktoe 21696 25130
Table 84: German PR Table 1a:Calcula on table for therenewable energy contribu on inGermany of each sector to finalenergy consump on (ktoe) (seeTable 4a of the NREAP)
ECN-E--13-076 Chapter 11. Germany 71

2009
Capacity Energy Comment
Renewable Electricity MW GWh ktoe %
Hydropower 4150 22400 1926 8.8%Hydropower (non pumped) 0 0 0 0.0%Hydropower <1 MW (non pumped) 680 2500 215 1.0%Hydropower 1 MW - 10 MW (non pumped) 1010 5400 464 2.1%Hydropower >10 MW (non pumped) 2460 14400 1238 5.7%Hydropower pumped storage 110 400 34 0.2%Hydropower mixed (normalised) n.a. n.a. n.a. n.a.Geothermal 8 20 2 0.0%Solar 9910 6600 567 2.6%Solar photovoltaic 9910 6600 567 2.6%Concentrated solar power 0 0 0 0.0%Tidal, wave and ocean energy 0 0 0 0.0%Wind power 25720 41300 3551 16.3%Onshore wind 25640 41200 3543 16.2%Offshore wind 70 40 3 0.0%Biomass 6070 30300 2605 11.9%Solid biomass 3590 15700 1350 6.2%Biogas 2150 12600 1083 5.0%Bioliquids 330 2000 172 0.8%Total 45860 100600 8650 39.6%Total CHP n.a. 5700 490 2.2%
Renewable Hea ng and Cooling ktoe % Comment
Geothermal 25 0.1%Solar thermal 407 1.9%Biomass 9392 43.0%Solid biomass 8158 37.4%Biogas 863 4.0%Bioliquids 371 1.7%Renewable energy from heat pumps 399 1.8%Aerothermal heat pumps 133 0.6%Geothermal heat pumps 214 1.0%Hydrothermal heat pumps 52 0.2%Total 10222 46.8%Total district hea ng n.a. n.a.Total biomass in households 5332 24.4%
Renewable Transport ktoe % Comment
Bioethanol / bio-ETBE 574 2.6%Bioethanol / bio-ETBE Ar cle 21.2 0 0.0%Bioethanol / bio-ETBE imported n.a. n.a.Biodiesel 2157 9.9%Biodiesel Ar cle 21.2 17 0.1%Biodiesel imported n.a. n.a.Hydrogen from renewables 0 0.0%Renewable electricity 143 0.7%Renewable electricity road transport 0 0.0%Renewable electricity non-road transport 143 0.7%Other biofuels 90 0.4% 1 (p.76)Other biofuels Ar cle 21.2 0 0.0%Total 2964 13.6%
Table 85: German PR Table 1b,Table 1c and Table 1d: Total actual
contribu on (installed capacity,gross electricity genera on, finalenergy consump on) from eachrenewable energy technology inGermany for 2009 to meet thebinding 2020 targets and the
indica ve interim trajectory forthe shares of energy from
renewable resources in electricity(see Table 10a of the NREAP),
hea ng and cooling (see Table 11of the NREAP) and in the
transport sector (see Table 12 ofthe NREAP)
72

2010
Capacity Energy Comment
Renewable Electricity MW GWh ktoe %
Hydropower 4390 23500 2021 9.3%Hydropower (non pumped) 0 0 0 0.0%Hydropower <1 MW (non pumped) 700 2400 206 0.9%Hydropower 1 MW - 10 MW (non pumped) 1040 5500 473 2.2%Hydropower >10 MW (non pumped) 2660 15500 1333 6.1%Hydropower pumped storage 150 500 43 0.2%Hydropower mixed (normalised) n.a. n.a. n.a. n.a.Geothermal 8 30 3 0.0%Solar 17320 11700 1006 4.6%Solar photovoltaic 17320 11700 1006 4.6%Concentrated solar power 0 0 0 0.0%Tidal, wave and ocean energy 0 0 0 0.0%Wind power 27210 43100 3706 17.0%Onshore wind 27030 42900 3689 16.9%Offshore wind 180 210 18 0.1%Biomass 6650 33900 2915 13.3%Solid biomass 3650 16000 1376 6.3%Biogas 2730 16200 1393 6.4%Bioliquids 280 1700 146 0.7%Total 55580 112100 9639 44.1%Total CHP n.a. 6200 533 2.4%
Renewable Hea ng and Cooling ktoe % Comment
Geothermal 25 0.1%Solar thermal 447 2.0%Biomass 11513 52.7%Solid biomass 9537 43.7%Biogas 1293 5.9%Bioliquids 683 3.1%Renewable energy from heat pumps 456 2.1%Aerothermal heat pumps 163 0.7%Geothermal heat pumps 237 1.1%Hydrothermal heat pumps 56 0.3%Total 12441 57.0%Total district hea ng n.a. n.a.Total biomass in households 6251 28.6%
Renewable Transport ktoe % Comment
Bioethanol / bio-ETBE 749 3.4%Bioethanol / bio-ETBE Ar cle 21.2 0 0.0%Bioethanol / bio-ETBE imported n.a. n.a.Biodiesel 2244 10.3%Biodiesel Ar cle 21.2 0 0.0%Biodiesel imported n.a. n.a.Hydrogen from renewables 0 0.0%Renewable electricity 162 0.7%Renewable electricity road transport 0 0.0%Renewable electricity non-road transport 162 0.7%Other biofuels 55 0.3% 1 (p.76)Other biofuels Ar cle 21.2 0 0.0%Total 3209 14.7%
Table 86: German PR Table 1b,Table 1c and Table 1d: Total actualcontribu on (installed capacity,gross electricity genera on, finalenergy consump on) from eachrenewable energy technology inGermany for 2010 to meet thebinding 2020 targets and theindica ve interim trajectory forthe shares of energy fromrenewable resources in electricity(see Table 10a of the NREAP),hea ng and cooling (see Table 11of the NREAP) and in thetransport sector (see Table 12 ofthe NREAP)
ECN-E--13-076 Chapter 11. Germany 73
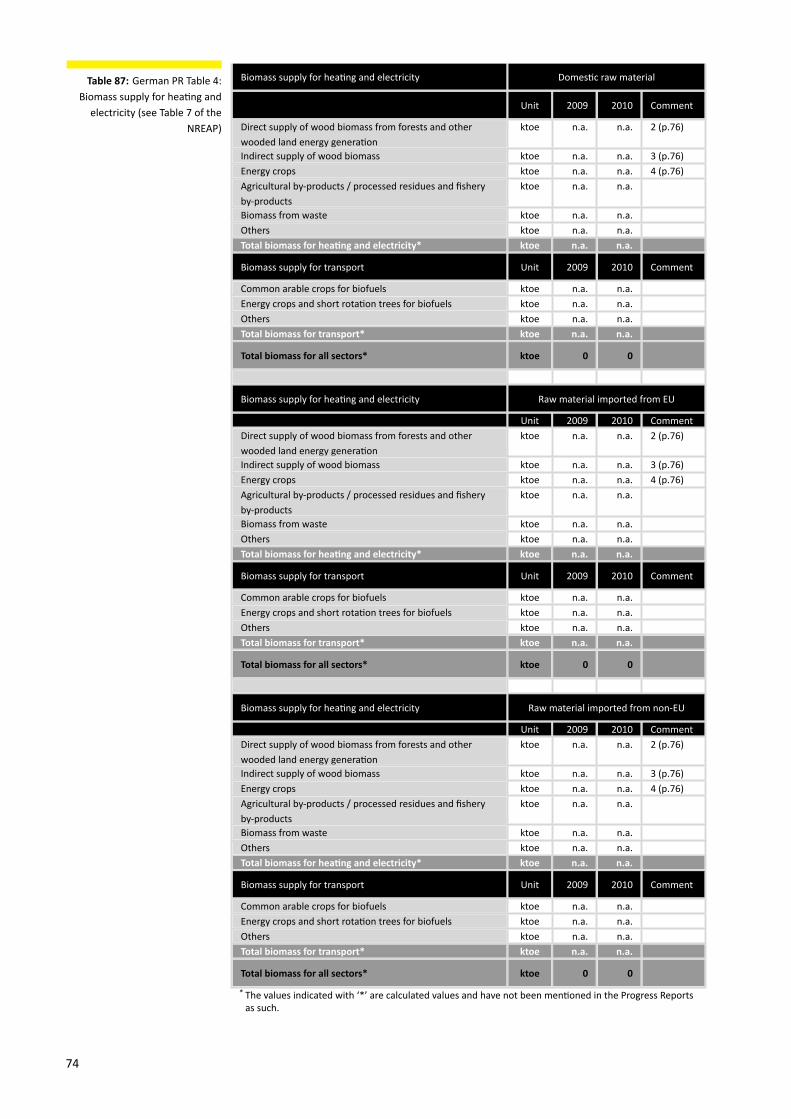
Biomass supply for hea ng and electricity Domes c raw material
Unit 2009 2010 Comment
Direct supply of wood biomass from forests and otherwooded land energy genera on
ktoe n.a. n.a. 2 (p.76)
Indirect supply of wood biomass ktoe n.a. n.a. 3 (p.76)Energy crops ktoe n.a. n.a. 4 (p.76)Agricultural by-products / processed residues and fisheryby-products
ktoe n.a. n.a.
Biomass from waste ktoe n.a. n.a.Others ktoe n.a. n.a.Total biomass for hea ng and electricity* ktoe n.a. n.a.
Biomass supply for transport Unit 2009 2010 Comment
Common arable crops for biofuels ktoe n.a. n.a.Energy crops and short rota on trees for biofuels ktoe n.a. n.a.Others ktoe n.a. n.a.Total biomass for transport* ktoe n.a. n.a.
Total biomass for all sectors* ktoe 0 0
Biomass supply for hea ng and electricity Raw material imported from EU
Unit 2009 2010 CommentDirect supply of wood biomass from forests and otherwooded land energy genera on
ktoe n.a. n.a. 2 (p.76)
Indirect supply of wood biomass ktoe n.a. n.a. 3 (p.76)Energy crops ktoe n.a. n.a. 4 (p.76)Agricultural by-products / processed residues and fisheryby-products
ktoe n.a. n.a.
Biomass from waste ktoe n.a. n.a.Others ktoe n.a. n.a.Total biomass for hea ng and electricity* ktoe n.a. n.a.
Biomass supply for transport Unit 2009 2010 Comment
Common arable crops for biofuels ktoe n.a. n.a.Energy crops and short rota on trees for biofuels ktoe n.a. n.a.Others ktoe n.a. n.a.Total biomass for transport* ktoe n.a. n.a.
Total biomass for all sectors* ktoe 0 0
Biomass supply for hea ng and electricity Raw material imported from non-EU
Unit 2009 2010 CommentDirect supply of wood biomass from forests and otherwooded land energy genera on
ktoe n.a. n.a. 2 (p.76)
Indirect supply of wood biomass ktoe n.a. n.a. 3 (p.76)Energy crops ktoe n.a. n.a. 4 (p.76)Agricultural by-products / processed residues and fisheryby-products
ktoe n.a. n.a.
Biomass from waste ktoe n.a. n.a.Others ktoe n.a. n.a.Total biomass for hea ng and electricity* ktoe n.a. n.a.
Biomass supply for transport Unit 2009 2010 Comment
Common arable crops for biofuels ktoe n.a. n.a.Energy crops and short rota on trees for biofuels ktoe n.a. n.a.Others ktoe n.a. n.a.Total biomass for transport* ktoe n.a. n.a.
Total biomass for all sectors* ktoe 0 0
* The values indicated with ‘*’ are calculated values and have not been men oned in the Progress Reportsas such.
Table 87: German PR Table 4:Biomass supply for hea ng and
electricity (see Table 7 of theNREAP)
74

Unit 2009 2010 Comment
Land used for common arable crops and oil seeds ha 1698000 1830000Land used for short rota on trees ha 2300 3600Land used for other energy crops such as grasses ha 1800 2100
Table 88: German PR Table 4a:Current domes c agriculturalland use for produc on of cropsdedicated to energy produc on(see Table 8 of the NREAP)
Unit 2009 2010 Comment
Produc on - Fuel type X ktoe 43 86Consump on - Fuel type X ktoe 17 0Total produc on Art.21.2.biofuels ktoe 43 86Total consump on Art.21.2. biofuels ktoe 17 0Share of 21(2) fuels from total RES-T % 0.6 0 5 (p.76)
Table 89: German PR Table 5:Produc on and consump on ofAr cle 21(2) biofuels (ktoe)
Unit 2009 2010 Comment
Total es mated net GHG emission saving from RES t CO2-eq 106000000 1.2E+08Es mated net GHG saving from the use of RES-E t CO2-eq 69000000 75000000Es mated net GHG saving from the use of RES-H/C t CO2-eq 33000000 40000000Es mated net GHG saving from the use of RES-T t CO2-eq 5000000 5000000
Table 90: German PR Table 6:Es mated GHG emission savingsfrom the use of renewable energy
Actual/es matedexcess produc on
Actual/es mateddeficit produc on
Comment
Renewable energy n.a. n.a.Origin/des na on n.a. n.a.Unit ktoe ktoe2010 n.a. n.a.2011 5703 n.a.2012 7065 n.a.2013 5507 n.a.2014 7105 n.a.2015 4761 n.a.2016 6453 n.a.2017 4130 n.a.2018 5976 n.a.2019 0 n.a.2020 3065 n.a.
Table 91: German PR Table 7:Actual and es mated excessand/or deficit (-) produc on ofrenewable energy compared tothe indica ve trajectory whichcould be transferred to/fromother Member States and/orthird countries in Germany (ktoe)(see Table 9 of the NREAP)
ECN-E--13-076 Chapter 11. Germany 75

Comments for Germany
1: Biogas, BtL, vegetable oil.2: There has been no substan al change to the availability of biomass in Germany in 2009and 2010 in comparison to the detailed informa on provided in the NREAP for 2006 and2007. Wood biomass from forests and other areas for direct use for genera ng energyincreased marginally in comparison to the reference year 2006 and totalled 29.75 millioncubic metres in 2010. The amount of residual ma er from mber logging has increasedin accordance to the percentual increase in felling. The produc on of waste ma er fromlandscape management has remained constant.3: There has been no substan al change to the availability of biomass in Germany in 2009and 2010 in comparison to the detailed informa on provided in the NREAP for 2006 and2007.4: The available agricultural crops used directly for electricity genera on have increaseddue to the marked increase in land area. This is primarily the result of the increase inthe area under cul va on for biogas substrates, in par cular maize. There was no growthworth no ng in the area under cul va on with oilseed. The total produc on quan esof arable crops to generate energy (cereals, oilseed, sugar beet, silage maize and others)reached roughly 32 million tonnes (FM) for 2010. Palm oil imports also increased signif-icantly in comparison to 2006 to 2.5 million tonnes per year. However, due to the risingprice, increasingly less palm oil is used for power and heat genera on. The areas undercul va on with short-rota on trees and other energy crops have increased slightly since2006, providing approximately 52000 t in 2010. Cul va on of short-rota on tree andgrass species con nues to serve research purposes primarily. The availability of agricul-tural by-products (straw and animal excrement) has also risen slightly and accounted for162 million tonnes in 2010. The produc on of animal fats and other by-products can beseen as constant.5: Denominator includes consump on of electricity from renewable sources in transport.
76

12Greece
Unit 2009 2010 Comment
Renewable hea ng and cooling % 16.38 17.17Renewable electricity % 11.04 12.38Renewable Transport % 1.13 1.97Overall renewable energy share % 8.43 9.73Renewables through coopera on mechanism % 0 0Surplus for coopera on mechanism % 0 0
Table 92: Greek PR Table 1: Thesectoral (electricity, hea ng andcooling, and transport) andoverall shares of energy fromrenewable sources in Greece (seeTable 3 and Table 4a of theNREAP)
Unit 2009 2010 Comment
Gross final consump on of RES for hea ng and cooling ktoe 1098 1160Gross final consump on of electricity from RES ktoe 703 909Gross final consump on of energy from RES in transport ktoe 78 128Gross total RES consump on ktoe 1879 2197Transfer of RES to other Member States ktoe 0 0Transfer of RES from other Member States and 3rd countries ktoe 0 0RES consump on adjusted for target ktoe 1879 2197
Table 93: Greek PR Table 1a:Calcula on table for therenewable energy contribu on inGreece of each sector to finalenergy consump on (ktoe) (seeTable 4a of the NREAP)
ECN-E--13-076 Chapter 12. Greece 77

2009
Capacity Energy Comment
Renewable Electricity MW GWh ktoe %
Hydropower 3201 4287 369 19.6% 1 (p.82)Hydropower (non pumped) 2502 4714 405 21.5%Hydropower <1 MW (non pumped) 32 115 10 0.5%Hydropower 1 MW - 10 MW (non pumped) 151 543 47 2.5%Hydropower >10 MW (non pumped) 2319 4056 349 18.5%Hydropower pumped storage 0 0 0 0.0%Hydropower mixed (normalised) 699 907 78 4.1% 2 (p.82)Geothermal 0 0 0 0.0%Solar 53 54 5 0.2%Solar photovoltaic 53 54 5 0.2%Concentrated solar power 0 0 0 0.0%Tidal, wave and ocean energy 0 0 0 0.0%Wind power 1171 2671 230 12.2% 3 (p.82)Onshore wind 1171 2547 219 11.6%Offshore wind 0 0 0 0.0%Biomass 41 218 19 1.0%Solid biomass 0 0 0 0.0%Biogas 41 218 19 1.0%Bioliquids 0 0 0 0.0%Total 4466 8172 703 37.3%Total CHP 0 0 0 0.0%
Renewable Hea ng and Cooling ktoe % Comment
Geothermal 16 0.9%Solar thermal 182 9.7%Biomass 844 44.9%Solid biomass 843 44.8%Biogas 1.3 0.1%Bioliquids 0 0.0%Renewable energy from heat pumps 56 3.0%Aerothermal heat pumps 51 2.7%Geothermal heat pumps 5 0.3%Hydrothermal heat pumps n.a. n.a.Total 1098 58.4%Total district hea ng 0 0.0%Total biomass in households 554 29.4%
Renewable Transport ktoe % Comment
Bioethanol / bio-ETBE 0 0.0%Bioethanol / bio-ETBE Ar cle 21.2 0 0.0%Bioethanol / bio-ETBE imported 0 0.0%Biodiesel 78 4.1%Biodiesel Ar cle 21.2 5 0.3%Biodiesel imported 7 0.4%Hydrogen from renewables 0 0.0%Renewable electricity 3 0.2%Renewable electricity road transport 2 0.1%Renewable electricity non-road transport 1 0.1%Other biofuels 0 0.0%Other biofuels Ar cle 21.2 0 0.0%Total 81 4.3%
Table 94: Greek PR Table 1b,Table 1c and Table 1d: Total actual
contribu on (installed capacity,gross electricity genera on, finalenergy consump on) from eachrenewable energy technology in
Greece for 2009 to meet thebinding 2020 targets and the
indica ve interim trajectory forthe shares of energy from
renewable resources in electricity(see Table 10a of the NREAP),
hea ng and cooling (see Table 11of the NREAP) and in the
transport sector (see Table 12 ofthe NREAP)
78

2010
Capacity Energy Comment
Renewable Electricity MW GWh ktoe %
Hydropower 3215 4525 389 20.7% 1 (p.82)Hydropower (non pumped) 2516 6597 567 30.1%Hydropower <1 MW (non pumped) 34 130 11 0.6%Hydropower 1 MW - 10 MW (non pumped) 163 624 54 2.9%Hydropower >10 MW (non pumped) 2319 5843 502 26.7%Hydropower pumped storage 0 0 0 0.0%Hydropower mixed (normalised) 699 901 77 4.1% 2 (p.82)Geothermal 0 0 0 0.0%Solar 203 167 14 0.8%Solar photovoltaic 203 167 14 0.8%Concentrated solar power 0 0 0 0.0%Tidal, wave and ocean energy 0 0 0 0.0%Wind power 1298 2905 250 13.3% 3 (p.82)Onshore wind 1298 2714 233 12.4%Offshore wind 0 0 0 0.0%Biomass 43 216 19 1.0%Solid biomass 0 0 0 0.0%Biogas 43 216 19 1.0%Bioliquids 0 0 0 0.0%Total 4760 10572 909 48.3%Total CHP 0 0 0 0.0%
Renewable Hea ng and Cooling ktoe % Comment
Geothermal 16 0.9%Solar thermal 183 9.7%Biomass 892 47.4%Solid biomass 890 47.3%Biogas 2 0.1%Bioliquids 0 0.0%Renewable energy from heat pumps 69 3.7%Aerothermal heat pumps 63 3.3%Geothermal heat pumps 6 0.3%Hydrothermal heat pumps n.a. n.a.Total 1160 61.6%Total district hea ng 0 0.0%Total biomass in households 597 31.7%
Renewable Transport ktoe % Comment
Bioethanol / bio-ETBE 0 0.0%Bioethanol / bio-ETBE Ar cle 21.2 0 0.0%Bioethanol / bio-ETBE imported 0 0.0%Biodiesel 128 6.8%Biodiesel Ar cle 21.2 12 0.6%Biodiesel imported 15 0.8%Hydrogen from renewables 0 0.0%Renewable electricity 3 0.2%Renewable electricity road transport 2 0.1%Renewable electricity non-road transport 1 0.1%Other biofuels 0 0.0%Other biofuels Ar cle 21.2 0 0.0%Total 131 7.0%
Table 95: Greek PR Table 1b,Table 1c and Table 1d: Total actualcontribu on (installed capacity,gross electricity genera on, finalenergy consump on) from eachrenewable energy technology inGreece for 2010 to meet thebinding 2020 targets and theindica ve interim trajectory forthe shares of energy fromrenewable resources in electricity(see Table 10a of the NREAP),hea ng and cooling (see Table 11of the NREAP) and in thetransport sector (see Table 12 ofthe NREAP)
ECN-E--13-076 Chapter 12. Greece 79

Biomass supply for hea ng and electricity Domes c raw material
Unit 2009 2010 Comment
Direct supply of wood biomass from forests and otherwooded land energy genera on
ktoe 251 268 4 (p.82)
Indirect supply of wood biomass ktoe 26 33Energy crops ktoe n.a. n.a.Agricultural by-products / processed residues and fisheryby-products
ktoe 447 447 5 (p.82)
Biomass from waste ktoe 56 49Others ktoe 0.21 0.64 6 (p.82)Total biomass for hea ng and electricity* ktoe 780.21 797.64
Biomass supply for transport Unit 2009 2010 Comment
Common arable crops for biofuels ktoe n.a. n.a.Energy crops and short rota on trees for biofuels ktoe n.a. n.a.Others ktoe 6.1 n.a.Total biomass for transport* ktoe 6.1 n.a.
Total biomass for all sectors* ktoe 786.31 797.64
Biomass supply for hea ng and electricity Raw material imported from EU
Unit 2009 2010 CommentDirect supply of wood biomass from forests and otherwooded land energy genera on
ktoe 68 99 4 (p.82)
Indirect supply of wood biomass ktoe n.a. n.a.Energy crops ktoe n.a. n.a.Agricultural by-products / processed residues and fisheryby-products
ktoe n.a. n.a. 5 (p.82)
Biomass from waste ktoe n.a. n.a.Others ktoe n.a. n.a. 6 (p.82)Total biomass for hea ng and electricity* ktoe 68 99
Biomass supply for transport Unit 2009 2010 Comment
Common arable crops for biofuels ktoe n.a. n.a.Energy crops and short rota on trees for biofuels ktoe n.a. n.a.Others ktoe n.a. n.a.Total biomass for transport* ktoe n.a. n.a.
Total biomass for all sectors* ktoe 68 99
Biomass supply for hea ng and electricity Raw material imported from non-EU
Unit 2009 2010 CommentDirect supply of wood biomass from forests and otherwooded land energy genera on
ktoe 0.6 0.8 4 (p.82)
Indirect supply of wood biomass ktoe n.a. n.a.Energy crops ktoe n.a. n.a.Agricultural by-products / processed residues and fisheryby-products
ktoe n.a. n.a. 5 (p.82)
Biomass from waste ktoe n.a. n.a.Others ktoe n.a. n.a. 6 (p.82)Total biomass for hea ng and electricity* ktoe 0.6 0.8
Biomass supply for transport Unit 2009 2010 Comment
Common arable crops for biofuels ktoe n.a. n.a.Energy crops and short rota on trees for biofuels ktoe n.a. n.a.Others ktoe n.a. n.a.Total biomass for transport* ktoe n.a. n.a.
Total biomass for all sectors* ktoe 0.6 0.8
* The values indicated with ‘*’ are calculated values and have not been men oned in the Progress Reportsas such.
Table 96: Greek PR Table 4:Biomass supply for hea ng and
electricity (see Table 7 of theNREAP)
80
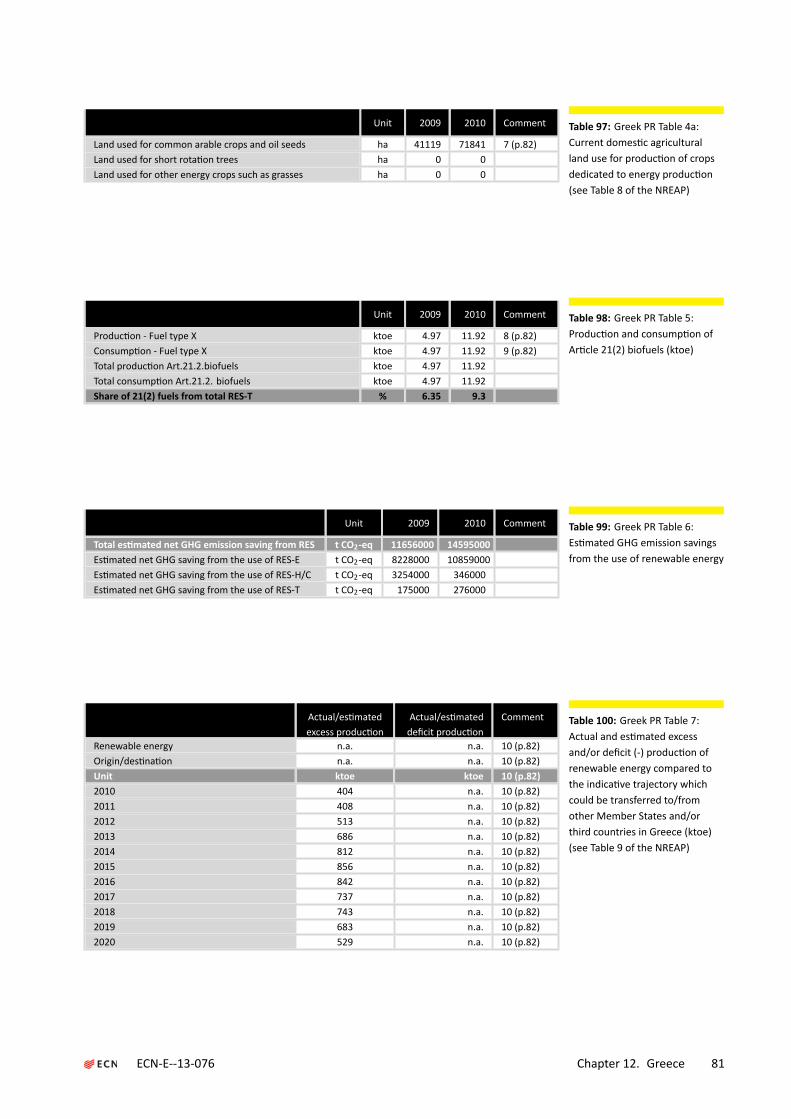
Unit 2009 2010 Comment
Land used for common arable crops and oil seeds ha 41119 71841 7 (p.82)Land used for short rota on trees ha 0 0Land used for other energy crops such as grasses ha 0 0
Table 97: Greek PR Table 4a:Current domes c agriculturalland use for produc on of cropsdedicated to energy produc on(see Table 8 of the NREAP)
Unit 2009 2010 Comment
Produc on - Fuel type X ktoe 4.97 11.92 8 (p.82)Consump on - Fuel type X ktoe 4.97 11.92 9 (p.82)Total produc on Art.21.2.biofuels ktoe 4.97 11.92Total consump on Art.21.2. biofuels ktoe 4.97 11.92Share of 21(2) fuels from total RES-T % 6.35 9.3
Table 98: Greek PR Table 5:Produc on and consump on ofAr cle 21(2) biofuels (ktoe)
Unit 2009 2010 Comment
Total es mated net GHG emission saving from RES t CO2-eq 11656000 14595000Es mated net GHG saving from the use of RES-E t CO2-eq 8228000 10859000Es mated net GHG saving from the use of RES-H/C t CO2-eq 3254000 346000Es mated net GHG saving from the use of RES-T t CO2-eq 175000 276000
Table 99: Greek PR Table 6:Es mated GHG emission savingsfrom the use of renewable energy
Actual/es matedexcess produc on
Actual/es mateddeficit produc on
Comment
Renewable energy n.a. n.a. 10 (p.82)Origin/des na on n.a. n.a. 10 (p.82)Unit ktoe ktoe 10 (p.82)2010 404 n.a. 10 (p.82)2011 408 n.a. 10 (p.82)2012 513 n.a. 10 (p.82)2013 686 n.a. 10 (p.82)2014 812 n.a. 10 (p.82)2015 856 n.a. 10 (p.82)2016 842 n.a. 10 (p.82)2017 737 n.a. 10 (p.82)2018 743 n.a. 10 (p.82)2019 683 n.a. 10 (p.82)2020 529 n.a. 10 (p.82)
Table 100: Greek PR Table 7:Actual and es mated excessand/or deficit (-) produc on ofrenewable energy compared tothe indica ve trajectory whichcould be transferred to/fromother Member States and/orthird countries in Greece (ktoe)(see Table 9 of the NREAP)
ECN-E--13-076 Chapter 12. Greece 81
Comments for Greece
1: Data values refer to normalised hydropower produc on. Actual produc on for 2009was 5621 GWh and for 2010 it was 7498 GWh.2: The electricity produced from water previously pumped uphill has been specified sep-arately : for 2009 this amounted to 268 GWh and for 2010 to 23 GWh.3: Data values refer to normalised wind power produc on. Actual produc on for 2009was 2547 GWh and for 2010 it was 2714 GWh.4: Figure for ’Amount of domes c rawmaterial’ excludes the exported quan ty. Includingexports the values are 636708 ton for 2009 and 664382 ton for 2010.5: The 2010 quan ty is very close to the 2009 quan ty due to fluctua ons (increasesand reduc ons) of the quan es in the subcategories that cons tute the agricultural by-products/processed residues and fishery by-products category (namely exhausted olivecake, kernels and agricultural firewood)6: This regards the primary produc on of biogas from agricultural industry. The value for2009 is an es mate.7: Main types: sunflower seed, rape seed, soya seed.8: Refers to biodiesel from waste oils.9: Refers to biodiesel from waste oils.10: From 2011 onwards the figures are the es mates presented in the Greek NREAP. TheNREAP value for 2010 was 257 ktoe.
82

13Hungary
Unit 2009 2010 Comment
Renewable hea ng and cooling % 10.53 11.08Renewable electricity % 6.96 7.09Renewable Transport % 4.19 4.72Overall renewable energy share % 8.18 8.79Renewables through coopera on mechanism % 0 0 1 (p.88)Surplus for coopera on mechanism % 0 0 2 (p.88)
Table 101: Hungarian PR Table 1:The sectoral (electricity, hea ngand cooling, and transport) andoverall shares of energy fromrenewable sources in Hungary(see Table 3 and Table 4a of theNREAP)
Unit 2009 2010 Comment
Gross final consump on of RES for hea ng and cooling ktoe 945 1055Gross final consump on of electricity from RES ktoe 248 259Gross final consump on of energy from RES in transport ktoe 185 191Gross total RES consump on ktoe 1361 1491Transfer of RES to other Member States ktoe 0 0Transfer of RES from other Member States and 3rd countries ktoe 0 0RES consump on adjusted for target ktoe 1361 1491
Table 102: Hungarian PR Table1a: Calcula on table for therenewable energy contribu on inHungary of each sector to finalenergy consump on (ktoe) (seeTable 4a of the NREAP)
ECN-E--13-076 Chapter 13. Hungary 83
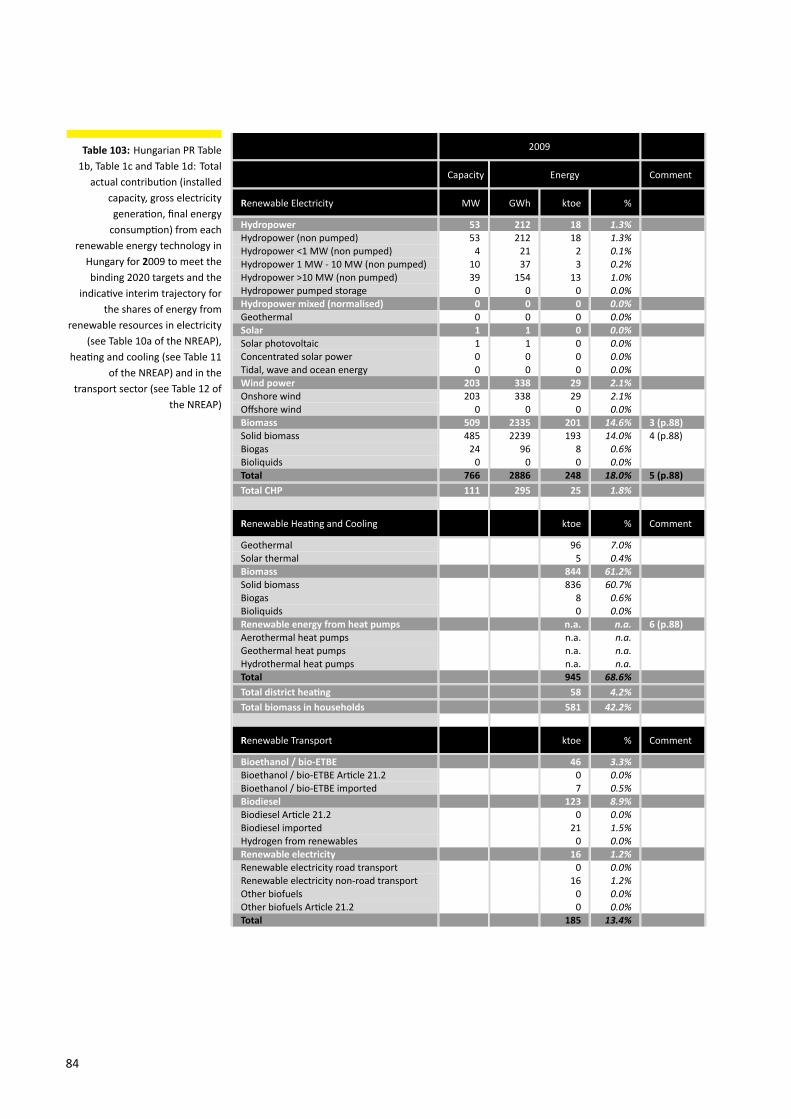
2009
Capacity Energy Comment
Renewable Electricity MW GWh ktoe %
Hydropower 53 212 18 1.3%Hydropower (non pumped) 53 212 18 1.3%Hydropower <1 MW (non pumped) 4 21 2 0.1%Hydropower 1 MW - 10 MW (non pumped) 10 37 3 0.2%Hydropower >10 MW (non pumped) 39 154 13 1.0%Hydropower pumped storage 0 0 0 0.0%Hydropower mixed (normalised) 0 0 0 0.0%Geothermal 0 0 0 0.0%Solar 1 1 0 0.0%Solar photovoltaic 1 1 0 0.0%Concentrated solar power 0 0 0 0.0%Tidal, wave and ocean energy 0 0 0 0.0%Wind power 203 338 29 2.1%Onshore wind 203 338 29 2.1%Offshore wind 0 0 0 0.0%Biomass 509 2335 201 14.6% 3 (p.88)Solid biomass 485 2239 193 14.0% 4 (p.88)Biogas 24 96 8 0.6%Bioliquids 0 0 0 0.0%Total 766 2886 248 18.0% 5 (p.88)Total CHP 111 295 25 1.8%
Renewable Hea ng and Cooling ktoe % Comment
Geothermal 96 7.0%Solar thermal 5 0.4%Biomass 844 61.2%Solid biomass 836 60.7%Biogas 8 0.6%Bioliquids 0 0.0%Renewable energy from heat pumps n.a. n.a. 6 (p.88)Aerothermal heat pumps n.a. n.a.Geothermal heat pumps n.a. n.a.Hydrothermal heat pumps n.a. n.a.Total 945 68.6%Total district hea ng 58 4.2%Total biomass in households 581 42.2%
Renewable Transport ktoe % Comment
Bioethanol / bio-ETBE 46 3.3%Bioethanol / bio-ETBE Ar cle 21.2 0 0.0%Bioethanol / bio-ETBE imported 7 0.5%Biodiesel 123 8.9%Biodiesel Ar cle 21.2 0 0.0%Biodiesel imported 21 1.5%Hydrogen from renewables 0 0.0%Renewable electricity 16 1.2%Renewable electricity road transport 0 0.0%Renewable electricity non-road transport 16 1.2%Other biofuels 0 0.0%Other biofuels Ar cle 21.2 0 0.0%Total 185 13.4%
Table 103: Hungarian PR Table1b, Table 1c and Table 1d: Total
actual contribu on (installedcapacity, gross electricitygenera on, final energyconsump on) from each
renewable energy technology inHungary for 2009 to meet thebinding 2020 targets and the
indica ve interim trajectory forthe shares of energy from
renewable resources in electricity(see Table 10a of the NREAP),
hea ng and cooling (see Table 11of the NREAP) and in the
transport sector (see Table 12 ofthe NREAP)
84

2010
Capacity Energy Comment
Renewable Electricity MW GWh ktoe %
Hydropower 53 211 18 1.3%Hydropower (non pumped) 53 211 18 1.3%Hydropower <1 MW (non pumped) 4 20 2 0.1%Hydropower 1 MW - 10 MW (non pumped) 10 38 3 0.2%Hydropower >10 MW (non pumped) 39 153 13 1.0%Hydropower pumped storage 0 0 0 0.0%Hydropower mixed (normalised) 0 0 0 0.0%Geothermal 0 0 0 0.0%Solar 2 1 0 0.0%Solar photovoltaic 2 1 0 0.0%Concentrated solar power 0 0 0 0.0%Tidal, wave and ocean energy 0 0 0 0.0%Wind power 293 518 45 3.2%Onshore wind 293 518 45 3.2%Offshore wind 0 0 0 0.0%Biomass 513.5 2291 197 14.3% 3 (p.88)Solid biomass 489.5 2179 187 13.6% 4 (p.88)Biogas 24 112 10 0.7%Bioliquids 0 0 0 0.0%Total 861.5 3021 260 18.8% 5 (p.88)Total CHP 136 320 28 2.0%
Renewable Hea ng and Cooling ktoe % Comment
Geothermal 99 7.2%Solar thermal 5 0.4%Biomass 951 69.0%Solid biomass 942 68.4%Biogas 9 0.7%Bioliquids 0 0.0%Renewable energy from heat pumps n.a. n.a. 6 (p.88)Aerothermal heat pumps n.a. n.a.Geothermal heat pumps n.a. n.a.Hydrothermal heat pumps n.a. n.a.Total 1055 76.6%Total district hea ng 66 4.8%Total biomass in households 658 47.7%
Renewable Transport ktoe % Comment
Bioethanol / bio-ETBE 57 4.1%Bioethanol / bio-ETBE Ar cle 21.2 0 0.0%Bioethanol / bio-ETBE imported 44 3.2%Biodiesel 119 8.6%Biodiesel Ar cle 21.2 0 0.0%Biodiesel imported 21 1.5%Hydrogen from renewables 0 0.0%Renewable electricity 15 1.1%Renewable electricity road transport 0 0.0%Renewable electricity non-road transport 15 1.1%Other biofuels 0 0.0%Other biofuels Ar cle 21.2 0 0.0%Total 191 13.9%
Table 104: Hungarian PR Table1b, Table 1c and Table 1d: Totalactual contribu on (installedcapacity, gross electricitygenera on, final energyconsump on) from eachrenewable energy technology inHungary for 2010 to meet thebinding 2020 targets and theindica ve interim trajectory forthe shares of energy fromrenewable resources in electricity(see Table 10a of the NREAP),hea ng and cooling (see Table 11of the NREAP) and in thetransport sector (see Table 12 ofthe NREAP)
ECN-E--13-076 Chapter 13. Hungary 85

Biomass supply for hea ng and electricity Domes c raw material
Unit 2009 2010 Comment
Direct supply of wood biomass from forests and otherwooded land energy genera on
ktoe 635.2 660.1 7 (p.88)
Indirect supply of wood biomass ktoe 14 25 8 (p.88)Energy crops ktoe n.a. n.a.Agricultural by-products / processed residues and fisheryby-products
ktoe n.a. n.a.
Biomass from waste ktoe n.a. n.a.Others ktoe n.a. n.a.Total biomass for hea ng and electricity* ktoe 649.2 685.1
Biomass supply for transport Unit 2009 2010 Comment
Common arable crops for biofuels ktoe n.a. n.a. 9 (p.88)Energy crops and short rota on trees for biofuels ktoe n.a. n.a.Others ktoe n.a. n.a.Total biomass for transport* ktoe n.a. n.a.
Total biomass for all sectors* ktoe 649.2 685.1
Biomass supply for hea ng and electricity Raw material imported from EU
Unit 2009 2010 CommentDirect supply of wood biomass from forests and otherwooded land energy genera on
ktoe 22.4 63.9 7 (p.88)
Indirect supply of wood biomass ktoe 8 26.2 8 (p.88)Energy crops ktoe n.a. n.a.Agricultural by-products / processed residues and fisheryby-products
ktoe n.a. n.a.
Biomass from waste ktoe n.a. n.a.Others ktoe n.a. n.a.Total biomass for hea ng and electricity* ktoe 30.4 90.1
Biomass supply for transport Unit 2009 2010 Comment
Common arable crops for biofuels ktoe n.a. n.a. 9 (p.88)Energy crops and short rota on trees for biofuels ktoe n.a. n.a.Others ktoe n.a. n.a.Total biomass for transport* ktoe n.a. n.a.
Total biomass for all sectors* ktoe 30.4 90.1
Biomass supply for hea ng and electricity Raw material imported from non-EU
Unit 2009 2010 CommentDirect supply of wood biomass from forests and otherwooded land energy genera on
ktoe 13.2 44.3 7 (p.88)
Indirect supply of wood biomass ktoe 2.3 3.9 8 (p.88)Energy crops ktoe n.a. n.a.Agricultural by-products / processed residues and fisheryby-products
ktoe n.a. n.a.
Biomass from waste ktoe n.a. n.a.Others ktoe n.a. n.a.Total biomass for hea ng and electricity* ktoe 15.5 48.2
Biomass supply for transport Unit 2009 2010 Comment
Common arable crops for biofuels ktoe n.a. n.a. 9 (p.88)Energy crops and short rota on trees for biofuels ktoe n.a. n.a.Others ktoe n.a. n.a.Total biomass for transport* ktoe n.a. n.a.
Total biomass for all sectors* ktoe 15.5 48.2
* The values indicated with ‘*’ are calculated values and have not been men oned in the Progress Reportsas such.
Table 105: Hungarian PR Table 4:Biomass supply for hea ng and
electricity (see Table 7 of theNREAP)
86

Unit 2009 2010 Comment
Land used for common arable crops and oil seeds ha 378681 337634 10 (p.88)Land used for short rota on trees ha 2562 4268Land used for other energy crops such as grasses ha 4981 807669
Table 106: Hungarian PR Table4a: Current domes c agriculturalland use for produc on of cropsdedicated to energy produc on(see Table 8 of the NREAP)
Unit 2009 2010 Comment
Produc on - Fuel type X ktoe 0 0Consump on - Fuel type X ktoe 0 0Total produc on Art.21.2.biofuels ktoe 0 0Total consump on Art.21.2. biofuels ktoe 0 0Share of 21(2) fuels from total RES-T % 0 0
Table 107: Hungarian PR Table 5:Produc on and consump on ofAr cle 21(2) biofuels (ktoe)
Unit 2009 2010 Comment
Total es mated net GHG emission saving from RES t CO2-eq 4053698 4348242Es mated net GHG saving from the use of RES-E t CO2-eq 1323768 1272501Es mated net GHG saving from the use of RES-H/C t CO2-eq 2458113 2792998Es mated net GHG saving from the use of RES-T t CO2-eq 271817 282743
Table 108: Hungarian PR Table 6:Es mated GHG emission savingsfrom the use of renewable energy
Actual/es matedexcess produc on
Actual/es mateddeficit produc on
Comment
Renewable energy n.a. n.a. 11 (p.88)Origin/des na on n.a. n.a. 11 (p.88)Unit ktoe ktoe 11 (p.88)2010 0 n.a. 11 (p.88)2011 547 n.a. 11 (p.88)2012 283 n.a. 11 (p.88)2013 323 n.a. 11 (p.88)2014 267 n.a. 11 (p.88)2015 280 n.a. 11 (p.88)2016 274 n.a. 11 (p.88)2017 516 n.a. 11 (p.88)2018 464 n.a. 11 (p.88)2019 679 n.a. 11 (p.88)2020 325 n.a. 11 (p.88)
Table 109: Hungarian PR Table 7:Actual and es mated excessand/or deficit (-) produc on ofrenewable energy compared tothe indica ve trajectory whichcould be transferred to/fromother Member States and/orthird countries in Hungary (ktoe)(see Table 9 of the NREAP)
ECN-E--13-076 Chapter 13. Hungary 87

Comments for Hungary
1: Hungary has not entered into partnership agreements with other Member States yet,but is open to transferring the surplus under a partnership agreement.2: Hungary has not entered into partnership agreements with other Member States yet,but is open to transferring the surplus under a partnership agreement.3: Capacity for biomass in 2010: 513.5 MW (value has been rounded in table).4: Capacity for solid biomass in 2010: 489.5 MW (value has been rounded in table).5: Total capacity in 2010: 861.5 MW (value has been rounded in table).6: Taking into account that in the interest of reducing administra ve burden, the estab-lishment of heat pumps is not always subject to a licence, reliable data is not yet availablefor the whole volume.7: Table 4 on page 29 of the Hungarian Progress Report provides more detail on theamount of raw material: firewood [m3], pellets [tonnes] and wood brique es [tonnes].8: Refers to waste from wood industry for energy purposes.9: For the year 2009 the amount of corn is 400000 tonnes and rapeseed is 550000 tonnes.For the year 2010 corn increased to 430000 tonnes and rapeseed remained stable at550000 tonnes.10: Data are es mates and represent the size of the land that may serve energy purposeswithin the total cul va on area of arable crops. Main types are wheat, sugar beet, rape-seed and sunflower.11: In accordance with the values specified in Hungary’s Renewable Energy U lisa on Ac-on Plan; actual values may differ.
88

14Ireland
Unit 2009 2010 Comment
Renewable hea ng and cooling % 4.3 4.4Renewable electricity % 13.7 14.8Renewable Transport % 1.8 2.4Overall renewable energy share % 5 5.5Renewables through coopera on mechanism % n.a. n.a.Surplus for coopera on mechanism % n.a. n.a.
Table 110: Irish PR Table 1: Thesectoral (electricity, hea ng andcooling, and transport) andoverall shares of energy fromrenewable sources in Ireland (seeTable 3 and Table 4a of theNREAP)
Unit 2009 2010 Comment
Gross final consump on of RES for hea ng and cooling ktoe 212 229Gross final consump on of electricity from RES ktoe 339 369Gross final consump on of energy from RES in transport ktoe 78 93Gross total RES consump on ktoe 628 690Transfer of RES to other Member States ktoe n.a. n.a.Transfer of RES from other Member States and 3rd countries ktoe n.a. n.a.RES consump on adjusted for target ktoe 628 690
Table 111: Irish PR Table 1a:Calcula on table for therenewable energy contribu on inIreland of each sector to finalenergy consump on (ktoe) (seeTable 4a of the NREAP)
ECN-E--13-076 Chapter 14. Ireland 89

2009
Capacity Energy Comment
Renewable Electricity MW GWh ktoe %
Hydropower 526 1109 95 14.9%Hydropower (non pumped) 234 754 65 10.1%Hydropower <1 MW (non pumped) 18 53 5 0.7%Hydropower 1 MW - 10 MW (non pumped) 20 64 6 0.9%Hydropower >10 MW (non pumped) 196 633 54 8.5%Hydropower pumped storage 292 355 31 4.8%Hydropower mixed (normalised) n.a. n.a. n.a. n.a.Geothermal n.a. n.a. n.a. n.a.Solar n.a. n.a. n.a. n.a.Solar photovoltaic 0.61 0.42 0 0.0%Concentrated solar power n.a. n.a. n.a. n.a.Tidal, wave and ocean energy n.a. n.a. n.a. n.a.Wind power 1264 2936 252 39.5%Onshore wind 1239 n.a. n.a. n.a.Offshore wind 25 n.a. n.a. n.a.Biomass n.a. 22 2 0.3%Solid biomass n.a. 6 1 0.1%Biogas n.a. 16 1 0.2%Bioliquids n.a. n.a. n.a. n.a.Total 0 4067.42 350 54.7%Total CHP 5.3 0.016 0 0.0%
Renewable Hea ng and Cooling ktoe % Comment
Geothermal n.a. n.a.Solar thermal 4.4 0.7%Biomass n.a. n.a.Solid biomass 178 27.8%Biogas 7 1.1%Bioliquids n.a. n.a.Renewable energy from heat pumps 22 3.4%Aerothermal heat pumps n.a. n.a.Geothermal heat pumps 22 3.4%Hydrothermal heat pumps n.a. n.a.Total 212 33.1%Total district hea ng n.a. n.a.Total biomass in households 28 4.4%
Renewable Transport ktoe % Comment
Bioethanol / bio-ETBE 23 3.6%Bioethanol / bio-ETBE Ar cle 21.2 23 3.6%Bioethanol / bio-ETBE imported 20 3.1%Biodiesel 53 8.3%Biodiesel Ar cle 21.2 53 8.3%Biodiesel imported 29 4.5%Hydrogen from renewables 0 0.0%Renewable electricity 0.57 0.1%Renewable electricity road transport n.a. n.a.Renewable electricity non-road transport 0.57 0.1%Other biofuels 1 0.2%Other biofuels Ar cle 21.2 1 0.2%Total 78 12.2%
Table 112: Irish PR Table 1b, Table1c and Table 1d: Total actual
contribu on (installed capacity,gross electricity genera on, finalenergy consump on) from eachrenewable energy technology in
Ireland for 2009 to meet thebinding 2020 targets and the
indica ve interim trajectory forthe shares of energy from
renewable resources in electricity(see Table 10a of the NREAP),
hea ng and cooling (see Table 11of the NREAP) and in the
transport sector (see Table 12 ofthe NREAP)
90

2010
Capacity Energy Comment
Renewable Electricity MW GWh ktoe %
Hydropower 529 931 80 12.5%Hydropower (non pumped) 237 754 65 10.1%Hydropower <1 MW (non pumped) 20 57 5 0.8%Hydropower 1 MW - 10 MW (non pumped) 21 67 6 0.9%Hydropower >10 MW (non pumped) 196 625 54 8.4%Hydropower pumped storage 292 177 15 2.4%Hydropower mixed (normalised) n.a. n.a. n.a. n.a.Geothermal n.a. n.a. n.a. n.a.Solar n.a. n.a. n.a. n.a.Solar photovoltaic 0.65 0.45 0 0.0%Concentrated solar power n.a. n.a. n.a. n.a.Tidal, wave and ocean energy n.a. n.a. n.a. n.a.Wind power 1389 3228 278 43.4%Onshore wind 1364 n.a. n.a. n.a.Offshore wind 25 n.a. n.a. n.a.Biomass n.a. 27 2 0.4%Solid biomass n.a. 9 1 0.1%Biogas n.a. 18 2 0.2%Bioliquids n.a. n.a. n.a. n.a.Total 0 4186.45 360 56.3%Total CHP 5.3 0.019 0 0.0%
Renewable Hea ng and Cooling ktoe % Comment
Geothermal n.a. n.a.Solar thermal 5.5 0.9%Biomass n.a. n.a.Solid biomass 193 30.2%Biogas 7.6 1.2%Bioliquids n.a. n.a.Renewable energy from heat pumps 23 3.6%Aerothermal heat pumps n.a. n.a.Geothermal heat pumps 23 3.6%Hydrothermal heat pumps n.a. n.a.Total 229 35.8%Total district hea ng n.a. n.a.Total biomass in households 32 5.0%
Renewable Transport ktoe % Comment
Bioethanol / bio-ETBE 30 4.7%Bioethanol / bio-ETBE Ar cle 21.2 30 4.7%Bioethanol / bio-ETBE imported 25 3.9%Biodiesel 60 9.4%Biodiesel Ar cle 21.2 60 9.4%Biodiesel imported 10 1.6%Hydrogen from renewables 0 0.0%Renewable electricity 0.57 0.1%Renewable electricity road transport n.a. n.a.Renewable electricity non-road transport 0.57 0.1%Other biofuels 2 0.3%Other biofuels Ar cle 21.2 2 0.3%Total 93 14.5%
Table 113: Irish PR Table 1b, Table1c and Table 1d: Total actualcontribu on (installed capacity,gross electricity genera on, finalenergy consump on) from eachrenewable energy technology inIreland for 2010 to meet thebinding 2020 targets and theindica ve interim trajectory forthe shares of energy fromrenewable resources in electricity(see Table 10a of the NREAP),hea ng and cooling (see Table 11of the NREAP) and in thetransport sector (see Table 12 ofthe NREAP)
ECN-E--13-076 Chapter 14. Ireland 91

Biomass supply for hea ng and electricity Domes c raw material
Unit 2009 2010 Comment
Direct supply of wood biomass from forests and otherwooded land energy genera on
ktoe 43 45
Indirect supply of wood biomass ktoe 106 114Energy crops ktoe 0.7 0.2Agricultural by-products / processed residues and fisheryby-products
ktoe 4.5 4.1
Biomass from waste ktoe 60 64Others ktoe n.a. n.a.Total biomass for hea ng and electricity* ktoe 214.2 227.3
Biomass supply for transport Unit 2009 2010 Comment
Common arable crops for biofuels ktoe n.a. n.a.Energy crops and short rota on trees for biofuels ktoe n.a. n.a.Others ktoe n.a. n.a.Total biomass for transport* ktoe n.a. n.a.
Total biomass for all sectors* ktoe 214.2 227.3
Biomass supply for hea ng and electricity Raw material imported from EU
Unit 2009 2010 CommentDirect supply of wood biomass from forests and otherwooded land energy genera on
ktoe 0.33 0.66
Indirect supply of wood biomass ktoe n.a. n.a.Energy crops ktoe n.a. n.a.Agricultural by-products / processed residues and fisheryby-products
ktoe n.a. n.a.
Biomass from waste ktoe n.a. n.a.Others ktoe n.a. n.a.Total biomass for hea ng and electricity* ktoe 0.33 0.66
Biomass supply for transport Unit 2009 2010 Comment
Common arable crops for biofuels ktoe n.a. n.a.Energy crops and short rota on trees for biofuels ktoe n.a. n.a.Others ktoe n.a. n.a.Total biomass for transport* ktoe n.a. n.a.
Total biomass for all sectors* ktoe 0.33 0.66
Biomass supply for hea ng and electricity Raw material imported from non-EU
Unit 2009 2010 CommentDirect supply of wood biomass from forests and otherwooded land energy genera on
ktoe 0 0
Indirect supply of wood biomass ktoe 0 0Energy crops ktoe n.a. n.a.Agricultural by-products / processed residues and fisheryby-products
ktoe n.a. n.a.
Biomass from waste ktoe n.a. n.a.Others ktoe n.a. n.a.Total biomass for hea ng and electricity* ktoe 0 0
Biomass supply for transport Unit 2009 2010 Comment
Common arable crops for biofuels ktoe n.a. n.a.Energy crops and short rota on trees for biofuels ktoe n.a. n.a.Others ktoe n.a. n.a.Total biomass for transport* ktoe n.a. n.a.
Total biomass for all sectors* ktoe 0 0
* The values indicated with ‘*’ are calculated values and have not been men oned in the Progress Reportsas such.
Table 114: Irish PR Table 4:Biomass supply for hea ng and
electricity (see Table 7 of theNREAP)
92
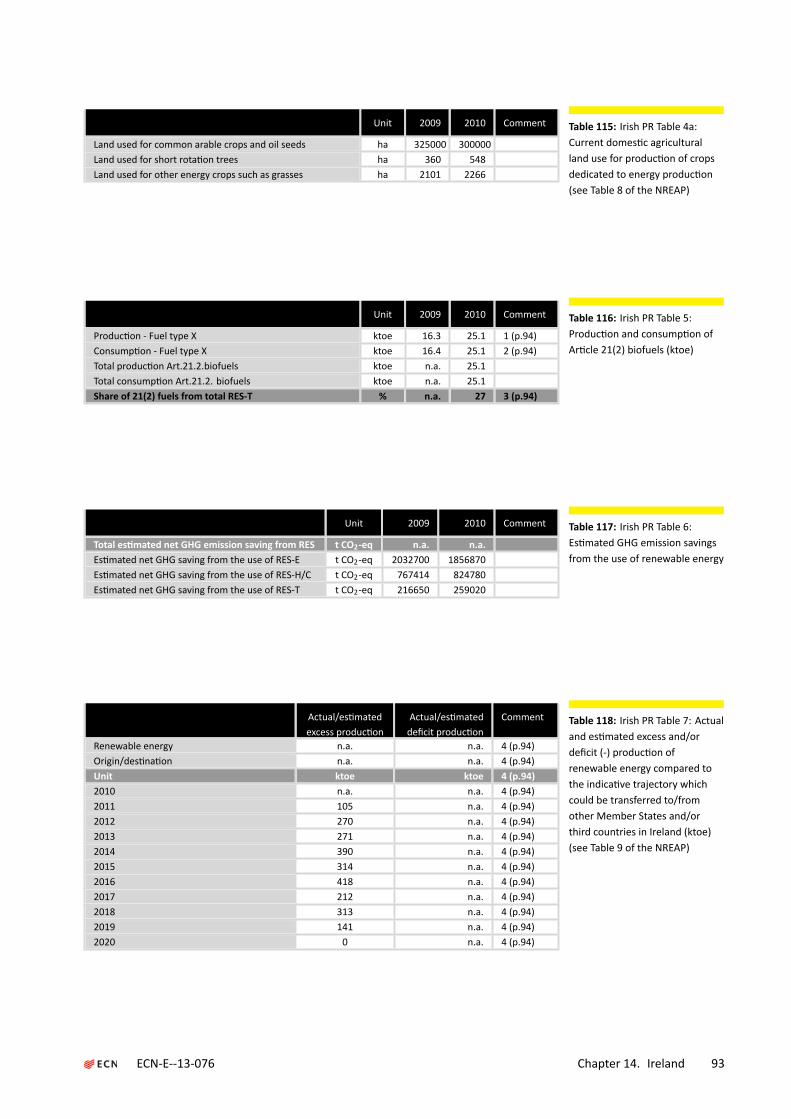
Unit 2009 2010 Comment
Land used for common arable crops and oil seeds ha 325000 300000Land used for short rota on trees ha 360 548Land used for other energy crops such as grasses ha 2101 2266
Table 115: Irish PR Table 4a:Current domes c agriculturalland use for produc on of cropsdedicated to energy produc on(see Table 8 of the NREAP)
Unit 2009 2010 Comment
Produc on - Fuel type X ktoe 16.3 25.1 1 (p.94)Consump on - Fuel type X ktoe 16.4 25.1 2 (p.94)Total produc on Art.21.2.biofuels ktoe n.a. 25.1Total consump on Art.21.2. biofuels ktoe n.a. 25.1Share of 21(2) fuels from total RES-T % n.a. 27 3 (p.94)
Table 116: Irish PR Table 5:Produc on and consump on ofAr cle 21(2) biofuels (ktoe)
Unit 2009 2010 Comment
Total es mated net GHG emission saving from RES t CO2-eq n.a. n.a.Es mated net GHG saving from the use of RES-E t CO2-eq 2032700 1856870Es mated net GHG saving from the use of RES-H/C t CO2-eq 767414 824780Es mated net GHG saving from the use of RES-T t CO2-eq 216650 259020
Table 117: Irish PR Table 6:Es mated GHG emission savingsfrom the use of renewable energy
Actual/es matedexcess produc on
Actual/es mateddeficit produc on
Comment
Renewable energy n.a. n.a. 4 (p.94)Origin/des na on n.a. n.a. 4 (p.94)Unit ktoe ktoe 4 (p.94)2010 n.a. n.a. 4 (p.94)2011 105 n.a. 4 (p.94)2012 270 n.a. 4 (p.94)2013 271 n.a. 4 (p.94)2014 390 n.a. 4 (p.94)2015 314 n.a. 4 (p.94)2016 418 n.a. 4 (p.94)2017 212 n.a. 4 (p.94)2018 313 n.a. 4 (p.94)2019 141 n.a. 4 (p.94)2020 0 n.a. 4 (p.94)
Table 118: Irish PR Table 7: Actualand es mated excess and/ordeficit (-) produc on ofrenewable energy compared tothe indica ve trajectory whichcould be transferred to/fromother Member States and/orthird countries in Ireland (ktoe)(see Table 9 of the NREAP)
ECN-E--13-076 Chapter 14. Ireland 93

Comments for Ireland
1: For the year 2009 the data regard biodiesel only (16.3 ktoe). For 2010 the data refer tobiodiesel (22.6 ktoe) and bioethanol (2.5 ktoe).2: For the year 2009 the data regard biodiesel only (16.4 ktoe). For 2010 the data refer tobiodiesel (22.6 ktoe) and bioethanol (2.5 ktoe).3: Total biofuels consumed were 77 ktoe in 2009 and 92 ktoe in 2010.4: Table 7 on page 25 in the Irish Progress Report provides the underlying calcula on.
94

15Italy
Unit 2009 2010 Comment
Renewable hea ng and cooling % 8.2 9.46Renewable electricity % 18.81 20.09Renewable Transport % 3.83 4.81Overall renewable energy share % 8.86 10.11Renewables through coopera on mechanism % 0 0Surplus for coopera on mechanism % 0 0
Table 119: Italian PR Table 1: Thesectoral (electricity, hea ng andcooling, and transport) andoverall shares of energy fromrenewable sources in Italy (seeTable 3 and Table 4a of theNREAP)
Unit 2009 2010 Comment
Gross final consump on of RES for hea ng and cooling ktoe 4500 5497Gross final consump on of electricity from RES ktoe 5390 5924Gross final consump on of energy from RES in transport ktoe 1180 1466Gross total RES consump on ktoe 11070 12887Transfer of RES to other Member States ktoe 0 0Transfer of RES from other Member States and 3rd countries ktoe 0 0RES consump on adjusted for target ktoe 11070 12887
Table 120: Italian PR Table 1a:Calcula on table for therenewable energy contribu on inItaly of each sector to final energyconsump on (ktoe) (see Table 4aof the NREAP)
ECN-E--13-076 Chapter 15. Italy 95

2009
Capacity Energy Comment
Renewable Electricity MW GWh ktoe %
Hydropower 16458 42279 3635 32.3% 1 (p.100)Hydropower (non pumped) 14079 40207 3457 30.8% 2 (p.100)Hydropower <1 MW (non pumped) 466 1699 146 1.3% 3 (p.100)Hydropower 1 MW - 10 MW (non pumped) 2187 7298 628 5.6% 4 (p.100)Hydropower >10 MW (non pumped) 11427 31210 2684 23.9% 5 (p.100)Hydropower pumped storage 2378 2072 178 1.6% 6 (p.100)Hydropower mixed (normalised) 2378 2072 178 1.6% 7 (p.100)Geothermal 737 5342 459 4.1%Solar 1144 676 58 0.5%Solar photovoltaic 1144 676 58 0.5%Concentrated solar power 0 0 0 0.0%Tidal, wave and ocean energy 0 0 0 0.0%Wind power 4898 6830 587 5.2%Onshore wind 4898 6830 587 5.2%Offshore wind 0 0 0 0.0%Biomass 1728 7557 650 5.8% 8 (p.100)Solid biomass 964 4444 382 3.4% 9 (p.100)Biogas 378 1665 143 1.3% 10 (p.100)Bioliquids 385 1448 125 1.1% 11 (p.100)Total 24964 62684 5390 48.0% 12 (p.100)Total CHP 581 2379 205 1.8%
Renewable Hea ng and Cooling ktoe % Comment
Geothermal 213 1.9%Solar thermal 85 0.8%Biomass 3033 27.0%Solid biomass 2763 24.6%Biogas 19 0.2%Bioliquids 250 2.2%Renewable energy from heat pumps 1170 10.4%Aerothermal heat pumps 1136 10.1%Geothermal heat pumps 31 0.3%Hydrothermal heat pumps 3 0.0%Total 4500 40.0%Total district hea ng 137 1.2%Total biomass in households 2003 17.8%
Renewable Transport ktoe % Comment
Bioethanol / bio-ETBE 117 1.0%Bioethanol / bio-ETBE Ar cle 21.2 0 0.0%Bioethanol / bio-ETBE imported 0 0.0%Biodiesel 1063 9.5%Biodiesel Ar cle 21.2 38 0.3%Biodiesel imported 415 3.7%Hydrogen from renewables 0 0.0%Renewable electricity 170 1.5%Renewable electricity road transport 0 0.0%Renewable electricity non-road transport 170 1.5%Other biofuels 0 0.0%Other biofuels Ar cle 21.2 0 0.0%Total 1350 12.0%
Table 121: Italian PR Table 1b,Table 1c and Table 1d: Total actual
contribu on (installed capacity,gross electricity genera on, finalenergy consump on) from eachrenewable energy technology in
Italy for 2009 to meet the binding2020 targets and the indica veinterim trajectory for the shares
of energy from renewableresources in electricity (see Table10a of the NREAP), hea ng and
cooling (see Table 11 of theNREAP) and in the transportsector (see Table 12 of the
NREAP)
96

2010
Capacity Energy Comment
Renewable Electricity MW GWh ktoe %
Hydropower 16806 43393 3731 33.2% 1 (p.100)Hydropower (non pumped) 14234 41255 3547 31.6% 2 (p.100)Hydropower <1 MW (non pumped) 523 1910 164 1.5% 3 (p.100)Hydropower 1 MW - 10 MW (non pumped) 2208 7411 637 5.7% 4 (p.100)Hydropower >10 MW (non pumped) 11503 31935 2746 24.4% 5 (p.100)Hydropower pumped storage 2572 2138 184 1.6% 6 (p.100)Hydropower mixed (normalised) 2572 2138 184 1.6% 7 (p.100)Geothermal 772 5376 462 4.1%Solar 3470 1906 164 1.5%Solar photovoltaic 3470 1906 164 1.5%Concentrated solar power 0 0 0 0.0%Tidal, wave and ocean energy 0 0 0 0.0%Wind power 5814 8787 756 6.7%Onshore wind 5814 8787 756 6.7%Offshore wind 0 0 0 0.0%Biomass 2053 9440 812 7.2% 8 (p.100)Solid biomass 944 4308 370 3.3% 9 (p.100)Biogas 508 2054 177 1.6% 10 (p.100)Bioliquids 601 3078 265 2.4% 11 (p.100)Total 28915 68902 5925 52.7% 12 (p.100)Total CHP 745 3251 280 2.5%
Renewable Hea ng and Cooling ktoe % Comment
Geothermal 139 1.2%Solar thermal 134 1.2%Biomass 4028 35.8%Solid biomass 3721 33.1%Biogas 26 0.2%Bioliquids 281 2.5%Renewable energy from heat pumps 1195 10.6%Aerothermal heat pumps 1158 10.3%Geothermal heat pumps 33 0.3%Hydrothermal heat pumps 4 0.0%Total 5497 48.9%Total district hea ng 144 1.3%Total biomass in households 3164 28.1%
Renewable Transport ktoe % Comment
Bioethanol / bio-ETBE 155 1.4%Bioethanol / bio-ETBE Ar cle 21.2 0 0.0%Bioethanol / bio-ETBE imported 0 0.0%Biodiesel 1311 11.7%Biodiesel Ar cle 21.2 38 0.3%Biodiesel imported 713 6.3%Hydrogen from renewables 0 0.0%Renewable electricity 184 1.6%Renewable electricity road transport 0 0.0%Renewable electricity non-road transport 184 1.6%Other biofuels 0 0.0%Other biofuels Ar cle 21.2 0 0.0%Total 1650 14.7%
Table 122: Italian PR Table 1b,Table 1c and Table 1d: Total actualcontribu on (installed capacity,gross electricity genera on, finalenergy consump on) from eachrenewable energy technology inItaly for 2010 to meet the binding2020 targets and the indica veinterim trajectory for the sharesof energy from renewableresources in electricity (see Table10a of the NREAP), hea ng andcooling (see Table 11 of theNREAP) and in the transportsector (see Table 12 of theNREAP)
ECN-E--13-076 Chapter 15. Italy 97

Biomass supply for hea ng and electricity Domes c raw material
Unit 2009 2010 Comment
Direct supply of wood biomass from forests and otherwooded land energy genera on
ktoe 1612 2225 13 (p.100)
Indirect supply of wood biomass ktoe 513 486 14 (p.100)Energy crops ktoe 187 228 15 (p.100)Agricultural by-products / processed residues and fisheryby-products
ktoe 595 600 16 (p.100)
Biomass from waste ktoe 1108 1207 17 (p.100)Others ktoe n.a. n.a.Total biomass for hea ng and electricity* ktoe 4015 4746
Biomass supply for transport Unit 2009 2010 Comment
Common arable crops for biofuels ktoe 77 113 18 (p.101)Energy crops and short rota on trees for biofuels ktoe 0 0Others ktoe 111 77 19 (p.101)Total biomass for transport* ktoe 188 190
Total biomass for all sectors* ktoe 4203 4936
Biomass supply for hea ng and electricity Raw material imported from EU
Unit 2009 2010 CommentDirect supply of wood biomass from forests and otherwooded land energy genera on
ktoe 259 306 13 (p.100)
Indirect supply of wood biomass ktoe 353 515 14 (p.100)Energy crops ktoe 0 0 15 (p.100)Agricultural by-products / processed residues and fisheryby-products
ktoe 0 0 16 (p.100)
Biomass from waste ktoe 0 0 17 (p.100)Others ktoe n.a. n.a.Total biomass for hea ng and electricity* ktoe 612 821
Biomass supply for transport Unit 2009 2010 Comment
Common arable crops for biofuels ktoe 196 113 18 (p.101)Energy crops and short rota on trees for biofuels ktoe 0 0Others ktoe 32 77 19 (p.101)Total biomass for transport* ktoe 228 190
Total biomass for all sectors* ktoe 840 1011
Biomass supply for hea ng and electricity Raw material imported from non-EU
Unit 2009 2010 CommentDirect supply of wood biomass from forests and otherwooded land energy genera on
ktoe 219 196 13 (p.100)
Indirect supply of wood biomass ktoe 100 125 14 (p.100)Energy crops ktoe 0 0 15 (p.100)Agricultural by-products / processed residues and fisheryby-products
ktoe 0 0 16 (p.100)
Biomass from waste ktoe 0 0 17 (p.100)Others ktoe n.a. n.a.Total biomass for hea ng and electricity* ktoe 319 321
Biomass supply for transport Unit 2009 2010 Comment
Common arable crops for biofuels ktoe 196 113 18 (p.101)Energy crops and short rota on trees for biofuels ktoe 0 0Others ktoe 32 77 19 (p.101)Total biomass for transport* ktoe 228 190
Total biomass for all sectors* ktoe 547 511
* The values indicated with ‘*’ are calculated values and have not been men oned in the Progress Reportsas such.
Table 123: Italian PR Table 4:Biomass supply for hea ng and
electricity (see Table 7 of theNREAP)
98

Unit 2009 2010 Comment
Land used for common arable crops and oil seeds ha 3122327 3139850 20 (p.101)Land used for short rota on trees ha 6000 10000 21 (p.101)Land used for other energy crops such as grasses ha n.a. n.a.
Table 124: Italian PR Table 4a:Current domes c agriculturalland use for produc on of cropsdedicated to energy produc on(see Table 8 of the NREAP)
Unit 2009 2010 Comment
Produc on - Fuel type X ktoe 38 38 22 (p.101)Consump on - Fuel type X ktoe 38 38 23 (p.101)Total produc on Art.21.2.biofuels ktoe 38 38 24 (p.101)Total consump on Art.21.2. biofuels ktoe 38 38 25 (p.101)Share of 21(2) fuels from total RES-T % 3.21 2.59
Table 125: Italian PR Table 5:Produc on and consump on ofAr cle 21(2) biofuels (ktoe)
Unit 2009 2010 Comment
Total es mated net GHG emission saving from RES t CO2-eq 55302118 61431068Es mated net GHG saving from the use of RES-E t CO2-eq 42402274 46195825Es mated net GHG saving from the use of RES-H/C t CO2-eq 11270901 13257410Es mated net GHG saving from the use of RES-T t CO2-eq 1628944 1977833
Table 126: Italian PR Table 6:Es mated GHG emission savingsfrom the use of renewable energy
Actual/es matedexcess produc on
Actual/es mateddeficit produc on
Comment
Renewable energy n.a. n.a.Origin/des na on n.a. n.a.Unit ktoe ktoe2010 4234 n.a.2011 5320 n.a.2012 5797 n.a.2013 6128 n.a.2014 5853 n.a.2015 5654 n.a.2016 4733 n.a.2017 4236 n.a.2018 2837 n.a.2019 1582 n.a.2020 513 n.a.
Table 127: Italian PR Table 7:Actual and es mated excessand/or deficit (-) produc on ofrenewable energy compared tothe indica ve trajectory whichcould be transferred to/fromother Member States and/orthird countries in Italy (ktoe) (seeTable 9 of the NREAP)
ECN-E--13-076 Chapter 15. Italy 99

Comments for Italy
1: For hydroelectric sources, the power referred to is the actual power for plants whichproduce only from natural sources.2: For hydroelectric sources, the power referred to is the actual power for plants whichproduce only from natural sources.3: For hydroelectric sources, the power referred to is the actual power for plants whichproduce only from natural sources.4: For hydroelectric sources, the power referred to is the actual power for plants whichproduce only from natural sources.5: For hydroelectric sources, the power referred to is the actual power for plants whichproduce only from natural sources.6: For hydroelectric sources, the power referred to is the actual power for plants whichproduce only from natural sources.7: For mixed systems, the virtual power has been calculated as a frac on of the power ofthe pumping plants, virtually a ributable to only natural components.8: Produc on by solid biomass, biogas and bioliquid thermoelectric plants include renew-able produc on of cofiring plants and produc on rela ve only to the biodegradable partfor waste-fuelled plants.9: Produc on by solid biomass, biogas and bioliquid thermoelectric plants include renew-able produc on of cofiring plants and produc on rela ve only to the biodegradable partfor waste-fuelled plants. The power from solid biomass plants includes the parts whichare virtually a ributable to renewable produc on from co-firing plants and produc onrela ve only to the biodegradable part for waste-fuelled plants.10: Produc on by solid biomass, biogas and bioliquid thermoelectric plants include re-newable produc on of cofiring plants and produc on rela ve only to the biodegradablepart for waste-fuelled plants.11: Produc on by solid biomass, biogas and bioliquid thermoelectric plants include re-newable produc on of cofiring plants and produc on rela ve only to the biodegradablepart for waste-fuelled plants.12: General comment for Table 1b in the Italian Progress Report: the power indicated isgross power efficiency.13: For the amounts data have been expressed in tonne/year tq (as is) or tonne/year sv.(vola le substance) for materials des ned for anaerobic diges on. The data rela ve toliquid biofuels are expressed in tonne/year oil equivalent.14: This item also relates to pellets, also including the quan ty of pellets imported evenif these are not strictly raw materials. For the amounts data have been expressed intonne/year tq (as is) or tonne/year sv. (vola le substance) for materials des ned foranaerobic diges on. The data rela ve to liquid biofuels are expressed in tonne/year oilequivalent.15: For the amounts data have been expressed in tonne/year tq (as is) or tonne/year sv.(vola le substance) for materials des ned for anaerobic diges on. The data rela ve toliquid biofuels are expressed in tonne/year oil equivalent.16: For the amounts data have been expressed in tonne/year tq (as is) or tonne/year sv.(vola le substance) for materials des ned for anaerobic diges on. The data rela ve toliquid biofuels are expressed in tonne/year oil equivalent.17: For the amounts data have been expressed in tonne/year tq (as is) or tonne/year sv.(vola le substance) for materials des ned for anaerobic diges on. The data rela ve toliquid biofuels are expressed in tonne/year oil equivalent.18: For the amounts data have been expressed in tonne/year tq (as is) or tonne/year sv.(vola le substance) for materials des ned for anaerobic diges on. The data rela ve to
100

liquid biofuels are expressed in tonne/year oil equivalent.19: For the amounts data have been expressed in tonne/year tq (as is) or tonne/year sv.(vola le substance) for materials des ned for anaerobic diges on. The data rela ve toliquid biofuels are expressed in tonne/year oil equivalent.20: Table 4a on page 41 of the Italian Progress Report specifies the crops in more detail.21: Poplar and short rota on forestry.22: Refers to biodiesel.23: Refers to biodiesel.24: Refers to biodiesel.25: Refers to biodiesel.
ECN-E--13-076 Chapter 15. Italy 101

102

16Latvia
Unit 2009 2010 Comment
Renewable hea ng and cooling % 47.9 43.8Renewable electricity % 4 42.1Renewable Transport % 1.1 3.3Overall renewable energy share % 34.3 32.5Renewables through coopera on mechanism % 0 0Surplus for coopera on mechanism % n.a. n.a.
Table 128: Latvian PR Table 1:The sectoral (electricity, hea ngand cooling, and transport) andoverall shares of energy fromrenewable sources in Latvia (seeTable 3 and Table 4a of theNREAP)
Unit 2009 2010 Comment
Gross final consump on of RES for hea ng and cooling ktoe 1190 1158Gross final consump on of electricity from RES ktoe 261 271Gross final consump on of energy from RES in transport ktoe 12 35Gross total RES consump on ktoe 1454 1456Transfer of RES to other Member States ktoe 0 0Transfer of RES from other Member States and 3rd countries ktoe 0 0RES consump on adjusted for target ktoe 1454 1456
Table 129: Latvian PR Table 1a:Calcula on table for therenewable energy contribu on inLatvia of each sector to finalenergy consump on (ktoe) (seeTable 4a of the NREAP)
ECN-E--13-076 Chapter 16. Latvia 103

2009
Capacity Energy Comment
Renewable Electricity MW GWh ktoe %
Hydropower 1536 2927 252 17.3% 1 (p.108)Hydropower (non pumped) 1536 3457 297 20.4%Hydropower <1 MW (non pumped) 24 60 5 0.4%Hydropower 1 MW - 10 MW (non pumped) 1 6 1 0.0%Hydropower >10 MW (non pumped) 1511 3391 292 20.0%Hydropower pumped storage 0 0 0 0.0%Hydropower mixed (normalised) 0 0 0 0.0%Geothermal 0 0 0 0.0%Solar 0 0 0 0.0%Solar photovoltaic 0 0 0 0.0%Concentrated solar power 0 0 0 0.0%Tidal, wave and ocean energy 0 0 0 0.0%Wind power 29 54 5 0.3% 2 (p.108)Onshore wind 29 50 4 0.3%Offshore wind 0 0 0 0.0%Biomass 10 49 4 0.3%Solid biomass 2 4 0 0.0%Biogas 8 45 4 0.3%Bioliquids 0 0 0 0.0%Total 1575 3030 261 17.9%Total CHP 7 46 4 0.3%
Renewable Hea ng and Cooling ktoe % Comment
Geothermal 0 0.0%Solar thermal 0 0.0%Biomass 1190 81.6%Solid biomass 1186 81.3%Biogas 3 0.2%Bioliquids 0 0.0%Renewable energy from heat pumps n.a. n.a.Aerothermal heat pumps n.a. n.a.Geothermal heat pumps n.a. n.a.Hydrothermal heat pumps n.a. n.a.Total 1190 81.6%Total district hea ng 96 6.6%Total biomass in households 805 55.2%
Renewable Transport ktoe % Comment
Bioethanol / bio-ETBE 3 0.2%Bioethanol / bio-ETBE Ar cle 21.2 0 0.0%Bioethanol / bio-ETBE imported 0 0.0%Biodiesel 2 0.1%Biodiesel Ar cle 21.2 0 0.0%Biodiesel imported 0 0.0%Hydrogen from renewables 0 0.0%Renewable electricity 4 0.3% 3 (p.108)Renewable electricity road transport 2 0.1%Renewable electricity non-road transport 2 0.1%Other biofuels 0 0.0%Other biofuels Ar cle 21.2 0 0.0%Total 8 0.5% 4 (p.108)
Table 130: Latvian PR Table 1b,Table 1c and Table 1d: Total actual
contribu on (installed capacity,gross electricity genera on, finalenergy consump on) from eachrenewable energy technology in
Latvia for 2009 to meet thebinding 2020 targets and the
indica ve interim trajectory forthe shares of energy from
renewable resources in electricity(see Table 10a of the NREAP),
hea ng and cooling (see Table 11of the NREAP) and in the
transport sector (see Table 12 ofthe NREAP)
104

2010
Capacity Energy Comment
Renewable Electricity MW GWh ktoe %
Hydropower 1576 3033 261 17.9% 1 (p.108)Hydropower (non pumped) 1576 3520 303 20.8%Hydropower <1 MW (non pumped) 25 69 6 0.4%Hydropower 1 MW - 10 MW (non pumped) 1 6 1 0.0%Hydropower >10 MW (non pumped) 1550 3445 296 20.3%Hydropower pumped storage 0 0 0 0.0%Hydropower mixed (normalised) 0 0 0 0.0%Geothermal 0 0 0 0.0%Solar 0 0 0 0.0%Solar photovoltaic 0 0 0 0.0%Concentrated solar power 0 0 0 0.0%Tidal, wave and ocean energy 0 0 0 0.0%Wind power 30 55 5 0.3% 2 (p.108)Onshore wind 30 49 4 0.3%Offshore wind 0 0 0 0.0%Biomass 16 66 6 0.4%Solid biomass 5 9 1 0.1%Biogas 11 57 5 0.3%Bioliquids 0 0 0 0.0%Total 1622 3154 271 18.6%Total CHP 13 58 5 0.3%
Renewable Hea ng and Cooling ktoe % Comment
Geothermal 0 0.0%Solar thermal 0 0.0%Biomass 1158 79.4%Solid biomass 1153 79.1%Biogas 4 0.3%Bioliquids 0 0.0%Renewable energy from heat pumps n.a. n.a.Aerothermal heat pumps n.a. n.a.Geothermal heat pumps n.a. n.a.Hydrothermal heat pumps n.a. n.a.Total 1158 79.4%Total district hea ng 103 7.1%Total biomass in households 735 50.4%
Renewable Transport ktoe % Comment
Bioethanol / bio-ETBE 8 0.5%Bioethanol / bio-ETBE Ar cle 21.2 0 0.0%Bioethanol / bio-ETBE imported 0 0.0%Biodiesel 19 1.3%Biodiesel Ar cle 21.2 0 0.0%Biodiesel imported 0 0.0%Hydrogen from renewables 0 0.0%Renewable electricity 4 0.3% 3 (p.108)Renewable electricity road transport 2 0.1%Renewable electricity non-road transport 2 0.1%Other biofuels 0 0.0%Other biofuels Ar cle 21.2 0 0.0%Total 31 2.1% 4 (p.108)
Table 131: Latvian PR Table 1b,Table 1c and Table 1d: Total actualcontribu on (installed capacity,gross electricity genera on, finalenergy consump on) from eachrenewable energy technology inLatvia for 2010 to meet thebinding 2020 targets and theindica ve interim trajectory forthe shares of energy fromrenewable resources in electricity(see Table 10a of the NREAP),hea ng and cooling (see Table 11of the NREAP) and in thetransport sector (see Table 12 ofthe NREAP)
ECN-E--13-076 Chapter 16. Latvia 105
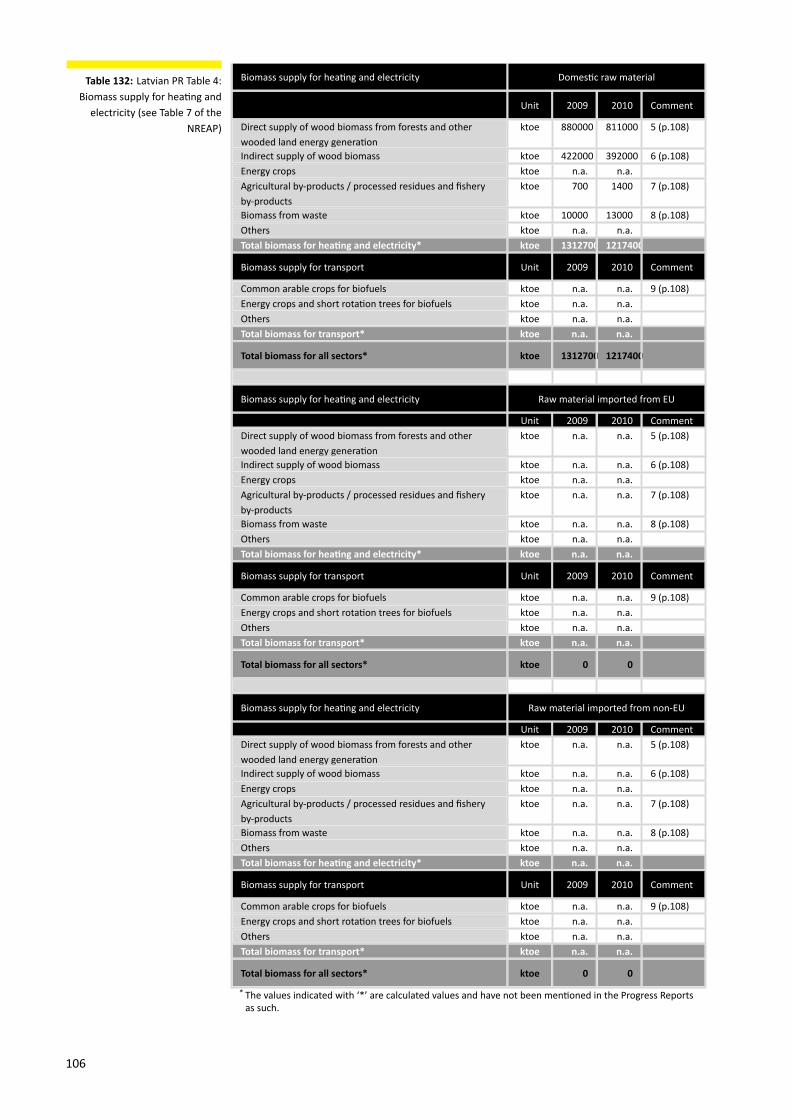
Biomass supply for hea ng and electricity Domes c raw material
Unit 2009 2010 Comment
Direct supply of wood biomass from forests and otherwooded land energy genera on
ktoe 880000 811000 5 (p.108)
Indirect supply of wood biomass ktoe 422000 392000 6 (p.108)Energy crops ktoe n.a. n.a.Agricultural by-products / processed residues and fisheryby-products
ktoe 700 1400 7 (p.108)
Biomass from waste ktoe 10000 13000 8 (p.108)Others ktoe n.a. n.a.Total biomass for hea ng and electricity* ktoe 1312700 1217400
Biomass supply for transport Unit 2009 2010 Comment
Common arable crops for biofuels ktoe n.a. n.a. 9 (p.108)Energy crops and short rota on trees for biofuels ktoe n.a. n.a.Others ktoe n.a. n.a.Total biomass for transport* ktoe n.a. n.a.
Total biomass for all sectors* ktoe 1312700 1217400
Biomass supply for hea ng and electricity Raw material imported from EU
Unit 2009 2010 CommentDirect supply of wood biomass from forests and otherwooded land energy genera on
ktoe n.a. n.a. 5 (p.108)
Indirect supply of wood biomass ktoe n.a. n.a. 6 (p.108)Energy crops ktoe n.a. n.a.Agricultural by-products / processed residues and fisheryby-products
ktoe n.a. n.a. 7 (p.108)
Biomass from waste ktoe n.a. n.a. 8 (p.108)Others ktoe n.a. n.a.Total biomass for hea ng and electricity* ktoe n.a. n.a.
Biomass supply for transport Unit 2009 2010 Comment
Common arable crops for biofuels ktoe n.a. n.a. 9 (p.108)Energy crops and short rota on trees for biofuels ktoe n.a. n.a.Others ktoe n.a. n.a.Total biomass for transport* ktoe n.a. n.a.
Total biomass for all sectors* ktoe 0 0
Biomass supply for hea ng and electricity Raw material imported from non-EU
Unit 2009 2010 CommentDirect supply of wood biomass from forests and otherwooded land energy genera on
ktoe n.a. n.a. 5 (p.108)
Indirect supply of wood biomass ktoe n.a. n.a. 6 (p.108)Energy crops ktoe n.a. n.a.Agricultural by-products / processed residues and fisheryby-products
ktoe n.a. n.a. 7 (p.108)
Biomass from waste ktoe n.a. n.a. 8 (p.108)Others ktoe n.a. n.a.Total biomass for hea ng and electricity* ktoe n.a. n.a.
Biomass supply for transport Unit 2009 2010 Comment
Common arable crops for biofuels ktoe n.a. n.a. 9 (p.108)Energy crops and short rota on trees for biofuels ktoe n.a. n.a.Others ktoe n.a. n.a.Total biomass for transport* ktoe n.a. n.a.
Total biomass for all sectors* ktoe 0 0
* The values indicated with ‘*’ are calculated values and have not been men oned in the Progress Reportsas such.
Table 132: Latvian PR Table 4:Biomass supply for hea ng and
electricity (see Table 7 of theNREAP)
106

Unit 2009 2010 Comment
Land used for common arable crops and oil seeds ha 461.6 472 10 (p.108)Land used for short rota on trees ha n.a. 5.3 11 (p.108)Land used for other energy crops such as grasses ha n.a. n.a.
Table 133: Latvian PR Table 4a:Current domes c agriculturalland use for produc on of cropsdedicated to energy produc on(see Table 8 of the NREAP)
Unit 2009 2010 Comment
Produc on - Fuel type X ktoe n.a. n.a.Consump on - Fuel type X ktoe n.a. n.a.Total produc on Art.21.2.biofuels ktoe 0 0Total consump on Art.21.2. biofuels ktoe 0 0Share of 21(2) fuels from total RES-T % 0 0
Table 134: Latvian PR Table 5:Produc on and consump on ofAr cle 21(2) biofuels (ktoe)
Unit 2009 2010 Comment
Total es mated net GHG emission saving from RES t CO2-eq 5047388 4989773Es mated net GHG saving from the use of RES-E t CO2-eq 691682 720626Es mated net GHG saving from the use of RES-H/C t CO2-eq 4329990 4214280Es mated net GHG saving from the use of RES-T t CO2-eq 25716 54867
Table 135: Latvian PR Table 6:Es mated GHG emission savingsfrom the use of renewable energy
Actual/es matedexcess produc on
Actual/es mateddeficit produc on
Comment
Renewable energy n.a. n.a. 12 (p.108)Origin/des na on n.a. n.a. 12 (p.108)Unit ktoe ktoe 12 (p.108)2010 136 n.a. 12 (p.108)2011 n.a. n.a. 12 (p.108)2012 n.a. n.a. 12 (p.108)2013 n.a. n.a. 12 (p.108)2014 n.a. n.a. 12 (p.108)2015 n.a. n.a. 12 (p.108)2016 n.a. n.a. 12 (p.108)2017 n.a. n.a. 12 (p.108)2018 n.a. n.a. 12 (p.108)2019 n.a. n.a. 12 (p.108)2020 n.a. n.a. 12 (p.108)
Table 136: Latvian PR Table 7:Actual and es mated excessand/or deficit (-) produc on ofrenewable energy compared tothe indica ve trajectory whichcould be transferred to/fromother Member States and/orthird countries in Latvia (ktoe)(see Table 9 of the NREAP)
ECN-E--13-076 Chapter 16. Latvia 107

Comments for Latvia
1: Data values refer to normalised hydropower produc on. Actual produc on for 2009was 3457 GWh and for 2010 it was 3520 GWh.2: Data values refer to normalised wind power produc on. Actual produc on for 2009was 50 GWh and for 2010 it was 49 GWh.3: The amount of renewable electricity in accordance with Ar cle 3(4)(c) of Direc ve2009/28/EC is 7 ktoe for 2009 and 8 ktoe for 2010.4: The total amount of energy for renewable transport in accordance with Ar cle 3(4)(c)of Direc ve 2009/28/EC is 12 ktoe for 2009 and 35 ktoe for 2010.5: The value for primary energy in domes c raw material refers to the amount includingimport and excluding export. Table 4 on page 36 of the Latvian Progress Report also re-ports on biomass exports.6: The value for primary energy in domes c raw material refers to the amount includ-ing import and excluding export. Table 4 on page 36 of the Latvian Progress Report alsoreports on biomass exports. Moreover, the table provides a breakdown into wood bri-que es, wood granules and wood residues.7: Regards straw and other biomass.8: Regards gas from waste deposit areas and other biogas (15 million m3 in 2009 and 21million m3 in 2010) and sludge gas from sewage (5 million m3 in 2009 and 6 million m3 in2010).9: Data refer to the amount of raw materials purchased by Latvian biofuel producers forthe produc on of biofuels. Main types are cereals (wheat, rye, tri cale), rape and rape-seed oil. Data source: Latvian Biofuel and Bioenergy Associa on.10: Contribu ons for 2009 were: wheat (285.7 ha), rye (59 ha), tri cale (13.8 ha), rape(93.3 ha) and corn (9.8 ha). Contribu ons for 2010 were: wheat (307.6 ha), rye (34.6 ha),tri cale (12.1 ha), rape (110.6 ha) and corn (7.1 ha).11: Provisional results of agricultural census in 2010. Main types: willow, aspens, greyalders.12: Table 7 on page 48 in the Latvian Progress Report provides a breakdown of the excessproduc on in renewable electricity, renewable hea ng and cooling and renewable trans-port.
108

17Lithuania
Unit 2009 2010 Comment
Renewable hea ng and cooling % 34.46 33Renewable electricity % 5.9 7.4Renewable Transport % 4.22 3.59Overall renewable energy share % 19.96 19.72Renewables through coopera on mechanism % 0 0Surplus for coopera on mechanism % n.a. n.a.
Table 137: Lithuanian PR Table 1:The sectoral (electricity, hea ngand cooling, and transport) andoverall shares of energy fromrenewable sources in Lithuania(see Table 3 and Table 4a of theNREAP)
Unit 2009 2010 Comment
Gross final consump on of RES for hea ng and cooling ktoe 876 881Gross final consump on of electricity from RES ktoe 59 70Gross final consump on of energy from RES in transport ktoe 52 45Gross total RES consump on ktoe 987 996Transfer of RES to other Member States ktoe 0 0Transfer of RES from other Member States and 3rd countries ktoe 0 0RES consump on adjusted for target ktoe 987 996
Table 138: Lithuanian PR Table1a: Calcula on table for therenewable energy contribu on inLithuania of each sector to finalenergy consump on (ktoe) (seeTable 4a of the NREAP)
ECN-E--13-076 Chapter 17. Lithuania 109

2009
Capacity Energy Comment
Renewable Electricity MW GWh ktoe %
Hydropower 116 419 36 3.6% 1 (p.114)Hydropower (non pumped) 116 419 36 3.6%Hydropower <1 MW (non pumped) 17 61 5 0.5%Hydropower 1 MW - 10 MW (non pumped) 9 33 3 0.3%Hydropower >10 MW (non pumped) 90 325 28 2.8%Hydropower pumped storage 760 715 61 6.2%Hydropower mixed (normalised) 0 0 0 0.0%Geothermal 0 0 0 0.0%Solar 0 0 0 0.0%Solar photovoltaic 0 0 0 0.0%Concentrated solar power 0 0 0 0.0%Tidal, wave and ocean energy 0 0 0 0.0%Wind power 98 174 15 1.5% 2 (p.114)Onshore wind 98 174 15 1.5%Offshore wind 0 0 0 0.0%Biomass 24 102 9 0.9%Solid biomass 16 87 7 0.8%Biogas 8 15 1 0.1%Bioliquids 0 0 0 0.0%Total 238 695 60 6.0%Total CHP 24 102 9 0.9%
Renewable Hea ng and Cooling ktoe % Comment
Geothermal 3 0.3%Solar thermal 0 0.0%Biomass 873 88.3%Solid biomass 870 88.0%Biogas 3 0.3%Bioliquids 0 0.0%Renewable energy from heat pumps 0 0.0%Aerothermal heat pumps 0 0.0%Geothermal heat pumps 0 0.0%Hydrothermal heat pumps 0 0.0%Total 876 88.6%Total district hea ng n.a. n.a. 3 (p.114)Total biomass in households n.a. n.a. 4 (p.114)
Renewable Transport ktoe % Comment
Bioethanol / bio-ETBE 14 1.4%Bioethanol / bio-ETBE Ar cle 21.2 0 0.0%Bioethanol / bio-ETBE imported 2 0.2%Biodiesel 38 3.8%Biodiesel Ar cle 21.2 0 0.0%Biodiesel imported 29 2.9%Hydrogen from renewables 0 0.0%Renewable electricity 1 0.1%Renewable electricity road transport 1 0.1%Renewable electricity non-road transport 0 0.0%Other biofuels 0 0.0%Other biofuels Ar cle 21.2 0 0.0%Total 53 5.4%
Table 139: Lithuanian PR Table1b, Table 1c and Table 1d: Total
actual contribu on (installedcapacity, gross electricitygenera on, final energyconsump on) from each
renewable energy technology inLithuania for 2009 to meet thebinding 2020 targets and the
indica ve interim trajectory forthe shares of energy from
renewable resources in electricity(see Table 10a of the NREAP),
hea ng and cooling (see Table 11of the NREAP) and in the
transport sector (see Table 12 ofthe NREAP)
110

2010
Capacity Energy Comment
Renewable Electricity MW GWh ktoe %
Hydropower 116 419 36 3.6% 1 (p.114)Hydropower (non pumped) 116 419 36 3.6%Hydropower <1 MW (non pumped) 17 61 5 0.5%Hydropower 1 MW - 10 MW (non pumped) 9 33 3 0.3%Hydropower >10 MW (non pumped) 90 325 28 2.8%Hydropower pumped storage 760 755 65 6.6%Hydropower mixed (normalised) 0 0 0 0.0%Geothermal 0 0 0 0.0%Solar 0 0 0 0.0%Solar photovoltaic 0 0 0 0.0%Concentrated solar power 0 0 0 0.0%Tidal, wave and ocean energy 0 0 0 0.0%Wind power 133 244 21 2.1% 2 (p.114)Onshore wind 133 244 21 2.1%Offshore wind 0 0 0 0.0%Biomass 29 147 13 1.3%Solid biomass 16 116 10 1.0%Biogas 13 31 3 0.3%Bioliquids 0 0 0 0.0%Total 278 810 70 7.0%Total CHP 29 147 13 1.3%
Renewable Hea ng and Cooling ktoe % Comment
Geothermal 2 0.2%Solar thermal 0 0.0%Biomass 879 88.9%Solid biomass 874 88.4%Biogas 5 0.5%Bioliquids 0 0.0%Renewable energy from heat pumps 0 0.0%Aerothermal heat pumps 0 0.0%Geothermal heat pumps 0 0.0%Hydrothermal heat pumps 0 0.0%Total 881 89.1%Total district hea ng n.a. n.a. 3 (p.114)Total biomass in households n.a. n.a. 4 (p.114)
Renewable Transport ktoe % Comment
Bioethanol / bio-ETBE 10 1.0%Bioethanol / bio-ETBE Ar cle 21.2 0 0.0%Bioethanol / bio-ETBE imported 2 0.2%Biodiesel 35 3.5%Biodiesel Ar cle 21.2 0 0.0%Biodiesel imported 13 1.3%Hydrogen from renewables 0 0.0%Renewable electricity 1 0.1%Renewable electricity road transport 1 0.1%Renewable electricity non-road transport 0 0.0%Other biofuels 0 0.0%Other biofuels Ar cle 21.2 0 0.0%Total 46 4.7%
Table 140: Lithuanian PR Table1b, Table 1c and Table 1d: Totalactual contribu on (installedcapacity, gross electricitygenera on, final energyconsump on) from eachrenewable energy technology inLithuania for 2010 to meet thebinding 2020 targets and theindica ve interim trajectory forthe shares of energy fromrenewable resources in electricity(see Table 10a of the NREAP),hea ng and cooling (see Table 11of the NREAP) and in thetransport sector (see Table 12 ofthe NREAP)
ECN-E--13-076 Chapter 17. Lithuania 111

Biomass supply for hea ng and electricity Domes c raw material
Unit 2009 2010 Comment
Direct supply of wood biomass from forests and otherwooded land energy genera on
ktoe 941 951 5 (p.114)
Indirect supply of wood biomass ktoe 56.8 51 6 (p.114)Energy crops ktoe 4.2 6.3 7 (p.114)Agricultural by-products / processed residues and fisheryby-products
ktoe 4.2 5.7 8 (p.114)
Biomass from waste ktoe 4.2 9.5 9 (p.114)Others ktoe 0.4 0.5 10 (p.114)Total biomass for hea ng and electricity* ktoe 1010.8 1024
Biomass supply for transport Unit 2009 2010 Comment
Common arable crops for biofuels ktoe 104.9 15.1 11 (p.114)Energy crops and short rota on trees for biofuels ktoe n.a. n.a.Others ktoe n.a. n.a.Total biomass for transport* ktoe 104.9 15.1
Total biomass for all sectors* ktoe 1115.7 1039.1
Biomass supply for hea ng and electricity Raw material imported from EU
Unit 2009 2010 CommentDirect supply of wood biomass from forests and otherwooded land energy genera on
ktoe 29 26 5 (p.114)
Indirect supply of wood biomass ktoe 1 4.3 6 (p.114)Energy crops ktoe n.a. n.a. 7 (p.114)Agricultural by-products / processed residues and fisheryby-products
ktoe n.a. n.a. 8 (p.114)
Biomass from waste ktoe n.a. n.a. 9 (p.114)Others ktoe n.a. n.a. 10 (p.114)Total biomass for hea ng and electricity* ktoe 30 30.3
Biomass supply for transport Unit 2009 2010 Comment
Common arable crops for biofuels ktoe 31.4 15.1 11 (p.114)Energy crops and short rota on trees for biofuels ktoe n.a. n.a.Others ktoe n.a. n.a.Total biomass for transport* ktoe 31.4 15.1
Total biomass for all sectors* ktoe 61.4 45.4
Biomass supply for hea ng and electricity Raw material imported from non-EU
Unit 2009 2010 CommentDirect supply of wood biomass from forests and otherwooded land energy genera on
ktoe 17 17 5 (p.114)
Indirect supply of wood biomass ktoe 0.012 0.008 6 (p.114)Energy crops ktoe n.a. n.a. 7 (p.114)Agricultural by-products / processed residues and fisheryby-products
ktoe n.a. n.a. 8 (p.114)
Biomass from waste ktoe n.a. n.a. 9 (p.114)Others ktoe n.a. n.a. 10 (p.114)Total biomass for hea ng and electricity* ktoe 17.012 17.008
Biomass supply for transport Unit 2009 2010 Comment
Common arable crops for biofuels ktoe 31.4 15.1 11 (p.114)Energy crops and short rota on trees for biofuels ktoe n.a. n.a.Others ktoe n.a. n.a.Total biomass for transport* ktoe 31.4 15.1
Total biomass for all sectors* ktoe 48.412 32.108
* The values indicated with ‘*’ are calculated values and have not been men oned in the Progress Reportsas such.
Table 141: Lithuanian PR Table 4:Biomass supply for hea ng and
electricity (see Table 7 of theNREAP)
112

Unit 2009 2010 Comment
Land used for common arable crops and oil seeds ha 190100 190000 12 (p.114)Land used for short rota on trees ha 600 900 13 (p.114)Land used for other energy crops such as grasses ha n.a. n.a.
Table 142: Lithuanian PR Table4a: Current domes c agriculturalland use for produc on of cropsdedicated to energy produc on(see Table 8 of the NREAP)
Unit 2009 2010 Comment
Produc on - Fuel type X ktoe 0 0Consump on - Fuel type X ktoe 0 0Total produc on Art.21.2.biofuels ktoe 0 0Total consump on Art.21.2. biofuels ktoe 0 0Share of 21(2) fuels from total RES-T % 0 0
Table 143: Lithuanian PR Table 5:Produc on and consump on ofAr cle 21(2) biofuels (ktoe)
Unit 2009 2010 Comment
Total es mated net GHG emission saving from RES t CO2-eq 4283148 4273842Es mated net GHG saving from the use of RES-E t CO2-eq 1092008 1101308Es mated net GHG saving from the use of RES-H/C t CO2-eq 3153290 3138924Es mated net GHG saving from the use of RES-T t CO2-eq 37850 33610
Table 144: Lithuanian PR Table 6:Es mated GHG emission savingsfrom the use of renewable energy
Actual/es matedexcess produc on
Actual/es mateddeficit produc on
Comment
Renewable energy n.a. n.a. 14 (p.114)Origin/des na on n.a. n.a. 14 (p.114)Unit ktoe ktoe 14 (p.114)2010 n.a. n.a. 14 (p.114)2011 n.a. n.a. 14 (p.114)2012 n.a. n.a. 14 (p.114)2013 n.a. n.a. 14 (p.114)2014 n.a. n.a. 14 (p.114)2015 n.a. n.a. 14 (p.114)2016 n.a. n.a. 14 (p.114)2017 n.a. n.a. 14 (p.114)2018 n.a. n.a. 14 (p.114)2019 n.a. n.a. 14 (p.114)2020 n.a. n.a. 14 (p.114)
Table 145: Lithuanian PR Table 7:Actual and es mated excessand/or deficit (-) produc on ofrenewable energy compared tothe indica ve trajectory whichcould be transferred to/fromother Member States and/orthird countries in Lithuania (ktoe)(see Table 9 of the NREAP)
ECN-E--13-076 Chapter 17. Lithuania 113

Comments for Lithuania
1: Normalised electricity genera on.2: Normalised electricity genera on.3: For 2009 and 2010 a share of 21% regards district hea ng.4: For 2009 a share of 67% regards biomass in households. For 2010 this share is 65%.5: Regards fellings.6: Regards residues and coproducts from wood industry etc., sawdust brique es, gran-ules.7: Regards short rota on trees.8: Regards straw.9: Regards biogas from manure, waste of vegetable and animal origin and treatment fa-cility sludge.10: Regards landfill gas.Unit for amount of raw material is unclear from the LithuanianProgress Report.11: Regards cerals and rape, breakdown provided in Table 5 (pages 32-33) of the Lithua-nian Progress Report.12: Regards rape and cereals. Breakdown is provided in Table 5a (page 34) of the Lithua-nian Progress Report.13: Regards willow14: By 2020, a sta s cal excess of the amount of renewable energy sources is expected inLithuania. The excess forecasts remain unchanged from those presented in the Na onalRenewable Energy Ac on Plan. The survey ‘Evalua on of interna onal coopera on in pro-mo ng the use of energy from renewable sources’ (2011), ordered by the Ministry of En-ergy of the Republic of Lithuania, found that the largest poten al for the implementa onof joint projects in Lithuania is in the systems of district hea ng, where the annual heatdemand does not exceed 50 GWh. On 28 February 2011 Lithuania signed amemorandumof understanding with Luxembourg concerning coopera on in the sphere of energy fromrenewable sources, including the opportuni es for sta s cal transfers and joint projects.
114

18Luxembourg
Unit 2009 2010 Comment
Renewable hea ng and cooling % 4.6 4.97Renewable electricity % 4.1 3.8Renewable Transport % 2.15 2.04Overall renewable energy share % 2.93 2.95Renewables through coopera on mechanism % n.a. n.a.Surplus for coopera on mechanism % n.a. n.a.
Table 146: Luxembourg PR Table1: The sectoral (electricity,hea ng and cooling, andtransport) and overall shares ofenergy from renewable sources inLuxembourg (see Table 3 andTable 4a of the NREAP)
Unit 2009 2010 Comment
Gross final consump on of RES for hea ng and cooling ktoe 48 56Gross final consump on of electricity from RES ktoe 23 24Gross final consump on of energy from RES in transport ktoe 43 42Gross total RES consump on ktoe 114 122Transfer of RES to other Member States ktoe 0 0Transfer of RES from other Member States and 3rd countries ktoe 0 0RES consump on adjusted for target ktoe 114 122
Table 147: Luxembourg PR Table1a: Calcula on table for therenewable energy contribu on inLuxembourg of each sector tofinal energy consump on (ktoe)(see Table 4a of the NREAP)
ECN-E--13-076 Chapter 18. Luxembourg 115

2009
Capacity Energy Comment
Renewable Electricity MW GWh ktoe %
Hydropower 34 106 9 8.0%Hydropower (non pumped) 34 106 9 8.0%Hydropower <1 MW (non pumped) 2 6 1 0.5%Hydropower 1 MW - 10 MW (non pumped) 32 100 9 7.5%Hydropower >10 MW (non pumped) 0 0 0 0.0%Hydropower pumped storage 1134 834 72 62.6% 1 (p.120)Hydropower mixed (normalised) 0 0 0 0.0%Geothermal 0 0 0 0.0%Solar 26 20 2 1.5%Solar photovoltaic 26 20 2 1.5%Concentrated solar power 0 0 0 0.0%Tidal, wave and ocean energy 0 0 0 0.0%Wind power 43 63 5 4.7%Onshore wind 43 63 5 4.7%Offshore wind 0 0 0 0.0%Biomass 17 78 7 5.9%Solid biomass 8 25 2 1.9%Biogas 9 53 5 4.0%Bioliquids 0 0 0 0.0%Total 120 267 23 20.0% 2 (p.120)Total CHP 9 53 5 4.0%
Renewable Hea ng and Cooling ktoe % Comment
Geothermal 0 0.0%Solar thermal 0.7 0.6%Biomass 46.1 40.2%Solid biomass 39.9 34.8%Biogas 6.2 5.4%Bioliquids 0 0.0%Renewable energy from heat pumps 0.8 0.7%Aerothermal heat pumps n.a. n.a.Geothermal heat pumps n.a. n.a.Hydrothermal heat pumps n.a. n.a.Total 47.6 41.6%Total district hea ng 0.9 0.8%Total biomass in households 15.1 13.2%
Renewable Transport ktoe % Comment
Bioethanol / bio-ETBE 1 0.9%Bioethanol / bio-ETBE Ar cle 21.2 0 0.0%Bioethanol / bio-ETBE imported 1 0.9%Biodiesel 41 35.8%Biodiesel Ar cle 21.2 0 0.0%Biodiesel imported 41 35.8%Hydrogen from renewables 0 0.0%Renewable electricity 2 1.7%Renewable electricity road transport 0 0.0%Renewable electricity non-road transport 2 1.7%Other biofuels 0 0.0%Other biofuels Ar cle 21.2 0 0.0%Total 44 38.4%
Table 148: Luxembourg PR Table1b, Table 1c and Table 1d: Total
actual contribu on (installedcapacity, gross electricitygenera on, final energyconsump on) from each
renewable energy technology inLuxembourg for 2009 to meet the
binding 2020 targets and theindica ve interim trajectory for
the shares of energy fromrenewable resources in electricity
(see Table 10a of the NREAP),hea ng and cooling (see Table 11
of the NREAP) and in thetransport sector (see Table 12 of
the NREAP)
116

2010
Capacity Energy Comment
Renewable Electricity MW GWh ktoe %
Hydropower 34 108 9 8.1%Hydropower (non pumped) 34 108 9 8.1%Hydropower <1 MW (non pumped) 2 8 1 0.6%Hydropower 1 MW - 10 MW (non pumped) 32 100 9 7.5%Hydropower >10 MW (non pumped) 0 0 0 0.0%Hydropower pumped storage 1134 1468 126 110.2% 1 (p.120)Hydropower mixed (normalised) 0 0 0 0.0%Geothermal 0 0 0 0.0%Solar 29 21 2 1.6%Solar photovoltaic 29 21 2 1.6%Concentrated solar power 0 0 0 0.0%Tidal, wave and ocean energy 0 0 0 0.0%Wind power 44 55 5 4.1%Onshore wind 44 55 5 4.1%Offshore wind 0 0 0 0.0%Biomass 17 84 7 6.3%Solid biomass 8 28 2 2.1%Biogas 9 56 5 4.2%Bioliquids 0 0 0 0.0%Total 124 269 23 20.2% 2 (p.120)Total CHP 9 56 5 4.2%
Renewable Hea ng and Cooling ktoe % Comment
Geothermal 0 0.0%Solar thermal 0.9 0.8%Biomass 54.4 47.5%Solid biomass 47.9 41.8%Biogas 6.5 5.7%Bioliquids 0 0.0%Renewable energy from heat pumps 1 0.9%Aerothermal heat pumps n.a. n.a.Geothermal heat pumps n.a. n.a.Hydrothermal heat pumps n.a. n.a.Total 56.3 49.1%Total district hea ng 0.9 0.8%Total biomass in households 18.9 16.5%
Renewable Transport ktoe % Comment
Bioethanol / bio-ETBE 1 0.9%Bioethanol / bio-ETBE Ar cle 21.2 0 0.0%Bioethanol / bio-ETBE imported 1 0.9%Biodiesel 41 35.8%Biodiesel Ar cle 21.2 0 0.0%Biodiesel imported 41 35.8%Hydrogen from renewables 0 0.0%Renewable electricity 2 1.7%Renewable electricity road transport 0 0.0%Renewable electricity non-road transport 2 1.7%Other biofuels 0 0.0%Other biofuels Ar cle 21.2 0 0.0%Total 44 38.4%
Table 149: Luxembourg PR Table1b, Table 1c and Table 1d: Totalactual contribu on (installedcapacity, gross electricitygenera on, final energyconsump on) from eachrenewable energy technology inLuxembourg for 2010 to meet thebinding 2020 targets and theindica ve interim trajectory forthe shares of energy fromrenewable resources in electricity(see Table 10a of the NREAP),hea ng and cooling (see Table 11of the NREAP) and in thetransport sector (see Table 12 ofthe NREAP)
ECN-E--13-076 Chapter 18. Luxembourg 117

Biomass supply for hea ng and electricity Domes c raw material
Unit 2009 2010 Comment
Direct supply of wood biomass from forests and otherwooded land energy genera on
ktoe n.a. n.a.
Indirect supply of wood biomass ktoe n.a. n.a.Energy crops ktoe 2.9 0.3 3 (p.120)Agricultural by-products / processed residues and fisheryby-products
ktoe n.a. n.a.
Biomass from waste ktoe n.a. n.a.Others ktoe n.a. n.a.Total biomass for hea ng and electricity* ktoe 2.9 0.3
Biomass supply for transport Unit 2009 2010 Comment
Common arable crops for biofuels ktoe n.a. n.a. 4 (p.120)Energy crops and short rota on trees for biofuels ktoe n.a. n.a.Others ktoe n.a. n.a.Total biomass for transport* ktoe n.a. n.a.
Total biomass for all sectors* ktoe 2.9 0.3
Biomass supply for hea ng and electricity Raw material imported from EU
Unit 2009 2010 CommentDirect supply of wood biomass from forests and otherwooded land energy genera on
ktoe n.a. n.a.
Indirect supply of wood biomass ktoe n.a. n.a.Energy crops ktoe 0 0 3 (p.120)Agricultural by-products / processed residues and fisheryby-products
ktoe n.a. n.a.
Biomass from waste ktoe n.a. n.a.Others ktoe n.a. n.a.Total biomass for hea ng and electricity* ktoe 0 0
Biomass supply for transport Unit 2009 2010 Comment
Common arable crops for biofuels ktoe n.a. n.a. 4 (p.120)Energy crops and short rota on trees for biofuels ktoe n.a. n.a.Others ktoe n.a. n.a.Total biomass for transport* ktoe n.a. n.a.
Total biomass for all sectors* ktoe 0 0
Biomass supply for hea ng and electricity Raw material imported from non-EU
Unit 2009 2010 CommentDirect supply of wood biomass from forests and otherwooded land energy genera on
ktoe n.a. n.a.
Indirect supply of wood biomass ktoe n.a. n.a.Energy crops ktoe 0 0 3 (p.120)Agricultural by-products / processed residues and fisheryby-products
ktoe n.a. n.a.
Biomass from waste ktoe n.a. n.a.Others ktoe n.a. n.a.Total biomass for hea ng and electricity* ktoe 0 0
Biomass supply for transport Unit 2009 2010 Comment
Common arable crops for biofuels ktoe n.a. n.a. 4 (p.120)Energy crops and short rota on trees for biofuels ktoe n.a. n.a.Others ktoe n.a. n.a.Total biomass for transport* ktoe n.a. n.a.
Total biomass for all sectors* ktoe 0 0
* The values indicated with ‘*’ are calculated values and have not been men oned in the Progress Reportsas such.
Table 150: Luxembourg PR Table4: Biomass supply for hea ng and
electricity (see Table 7 of theNREAP)
118

Unit 2009 2010 Comment
Land used for common arable crops and oil seeds ha n.a. 731 5 (p.120)Land used for short rota on trees ha n.a. n.a.Land used for other energy crops such as grasses ha 50 0 6 (p.120)
Table 151: Luxembourg PR Table4a: Current domes c agriculturalland use for produc on of cropsdedicated to energy produc on(see Table 8 of the NREAP)
Unit 2009 2010 Comment
Produc on - Fuel type X ktoe 0 0Consump on - Fuel type X ktoe n.a. n.a.Total produc on Art.21.2.biofuels ktoe n.a. n.a.Total consump on Art.21.2. biofuels ktoe n.a. n.a.Share of 21(2) fuels from total RES-T % n.a. n.a.
Table 152: Luxembourg PR Table5: Produc on and consump onof Ar cle 21(2) biofuels (ktoe)
Unit 2009 2010 Comment
Total es mated net GHG emission saving from RES t CO2-eq n.a. 141900Es mated net GHG saving from the use of RES-E t CO2-eq n.a. n.a.Es mated net GHG saving from the use of RES-H/C t CO2-eq n.a. 900Es mated net GHG saving from the use of RES-T t CO2-eq n.a. 141000
Table 153: Luxembourg PR Table6: Es mated GHG emissionsavings from the use ofrenewable energy
Actual/es matedexcess produc on
Actual/es mateddeficit produc on
Comment
Renewable energy n.a. n.a. 7 (p.120)Origin/des na on n.a. n.a. 7 (p.120)Unit ktoe ktoe 7 (p.120)2010 n.a. 0 7 (p.120)2011 n.a. -44.8 7 (p.120)2012 n.a. -22.8 7 (p.120)2013 n.a. -37.8 7 (p.120)2014 n.a. -9.8 7 (p.120)2015 n.a. -45 7 (p.120)2016 n.a. -21.6 7 (p.120)2017 n.a. -74.5 7 (p.120)2018 n.a. -39.2 7 (p.120)2019 n.a. -66.1 7 (p.120)2020 n.a. -92.9 7 (p.120)
Table 154: Luxembourg PR Table7: Actual and es mated excessand/or deficit (-) produc on ofrenewable energy compared tothe indica ve trajectory whichcould be transferred to/fromother Member States and/orthird countries in Luxembourg(ktoe) (see Table 9 of the NREAP)
ECN-E--13-076 Chapter 18. Luxembourg 119

Comments for Luxembourg
1: Compared to the NREAP, these values also include the non-pumped capacity.2: Without pumping electricity.3: Main types for 2009: silage maize, miscanthus, sudan grass. No data for industrialrapeseed. Main types for 2010: miscanthus, sudan grass. No data for silage maize andindustrial rapeseed. Unit not explicitly men oned.4: Main type: industrial rapeseed.5: Main type: silage maize.6: Main types: miscanthus, sudan grass.7: The figures provided in Table 7 are iden cal to those of Table 9 of the NREAP. Luxem-bourg has made various efforts to engage in talks with countries willing to cooperate, aswell as to explore and advance poten al coopera on op ons.
120

19Malta
Unit 2009 2010 Comment
Renewable hea ng and cooling % 9.1 9.5Renewable electricity % 0.02 0.08Renewable Transport % 0.83 0.66Overall renewable energy share % 0.88 0.9Renewables through coopera on mechanism % 0 0Surplus for coopera on mechanism % 0 0
Table 155: Maltese PR Table 1:The sectoral (electricity, hea ngand cooling, and transport) andoverall shares of energy fromrenewable sources in Malta (seeTable 3 and Table 4a of theNREAP)
Unit 2009 2010 Comment
Gross final consump on of RES for hea ng and cooling ktoe 2.91 3.04Gross final consump on of electricity from RES ktoe 0.05 0.15Gross final consump on of energy from RES in transport ktoe 0.66 0.55Gross total RES consump on ktoe 3.61 3.73Transfer of RES to other Member States ktoe 0 0Transfer of RES from other Member States and 3rd countries ktoe 0 0RES consump on adjusted for target ktoe 3.61 3.73
Table 156: Maltese PR Table 1a:Calcula on table for therenewable energy contribu on inMalta of each sector to finalenergy consump on (ktoe) (seeTable 4a of the NREAP)
ECN-E--13-076 Chapter 19. Malta 121

2009
Capacity Energy Comment
Renewable Electricity MW GWh ktoe %
Hydropower 0 0 0 n.a.Hydropower (non pumped) n.a. n.a. n.a. n.a.Hydropower <1 MW (non pumped) n.a. n.a. n.a. n.a.Hydropower 1 MW - 10 MW (non pumped) n.a. n.a. n.a. n.a.Hydropower >10 MW (non pumped) n.a. n.a. n.a. n.a.Hydropower pumped storage n.a. n.a. n.a. n.a.Hydropower mixed (normalised) n.a. n.a. n.a. n.a.Geothermal 0 0 0 n.a.Solar n.a. n.a. n.a. n.a.Solar photovoltaic 1.53 0.53 0 n.a.Concentrated solar power n.a. n.a. n.a. n.a.Tidal, wave and ocean energy 0 0 0 n.a.Wind power n.a. n.a. n.a. n.a.Onshore wind n.a. 0 0 n.a.Offshore wind n.a. 0 0 n.a.Biomass n.a. n.a. n.a. n.a.Solid biomass n.a. 0 0 n.a.Biogas n.a. 0 0 n.a.Bioliquids n.a. n.a. n.a. n.a.Total n.a. n.a. n.a. n.a.Total CHP n.a. 0.5318 0 n.a.
Renewable Hea ng and Cooling ktoe % Comment
Geothermal 0 n.a.Solar thermal 2.3 n.a.Biomass n.a. n.a.Solid biomass 0.5 n.a.Biogas 0 n.a.Bioliquids 0.1 n.a.Renewable energy from heat pumps n.a. n.a.Aerothermal heat pumps n.a. n.a.Geothermal heat pumps n.a. n.a.Hydrothermal heat pumps n.a. n.a.Total 2.91 n.a.Total district hea ng 0 n.a.Total biomass in households n.a. n.a.
Renewable Transport ktoe % Comment
Bioethanol / bio-ETBE 0 n.a.Bioethanol / bio-ETBE Ar cle 21.2 0 n.a.Bioethanol / bio-ETBE imported 0 n.a.Biodiesel 0.657 n.a.Biodiesel Ar cle 21.2 0.657 n.a.Biodiesel imported 0 n.a.Hydrogen from renewables 0 n.a.Renewable electricity 0 n.a.Renewable electricity road transport 0 n.a.Renewable electricity non-road transport 0 n.a.Other biofuels 0 n.a.Other biofuels Ar cle 21.2 0 n.a.Total 0.66 n.a.
Table 157: Maltese PR Table 1b,Table 1c and Table 1d: Total actual
contribu on (installed capacity,gross electricity genera on, finalenergy consump on) from eachrenewable energy technology in
Malta for 2009 to meet thebinding 2020 targets and the
indica ve interim trajectory forthe shares of energy from
renewable resources in electricity(see Table 10a of the NREAP),
hea ng and cooling (see Table 11of the NREAP) and in the
transport sector (see Table 12 ofthe NREAP)
122

2010
Capacity Energy Comment
Renewable Electricity MW GWh ktoe %
Hydropower 0 0 0 n.a.Hydropower (non pumped) n.a. n.a. n.a. n.a.Hydropower <1 MW (non pumped) n.a. n.a. n.a. n.a.Hydropower 1 MW - 10 MW (non pumped) n.a. n.a. n.a. n.a.Hydropower >10 MW (non pumped) n.a. n.a. n.a. n.a.Hydropower pumped storage n.a. n.a. n.a. n.a.Hydropower mixed (normalised) n.a. n.a. n.a. n.a.Geothermal 0 0 0 n.a.Solar n.a. n.a. n.a. n.a.Solar photovoltaic 1.67 1.73 0 n.a.Concentrated solar power n.a. n.a. n.a. n.a.Tidal, wave and ocean energy 0 0 0 n.a.Wind power n.a. n.a. n.a. n.a.Onshore wind n.a. 0 0 n.a.Offshore wind n.a. 0 0 n.a.Biomass n.a. n.a. n.a. n.a.Solid biomass n.a. 0 0 n.a.Biogas n.a. 0 0 n.a.Bioliquids n.a. n.a. n.a. n.a.Total n.a. n.a. n.a. n.a.Total CHP n.a. 1.731 0 n.a.
Renewable Hea ng and Cooling ktoe % Comment
Geothermal 0 n.a.Solar thermal 2.47 n.a.Biomass n.a. n.a.Solid biomass 0.33 n.a.Biogas 0.15 n.a.Bioliquids 0.08 n.a.Renewable energy from heat pumps n.a. n.a.Aerothermal heat pumps n.a. n.a.Geothermal heat pumps n.a. n.a.Hydrothermal heat pumps n.a. n.a.Total 3.04 n.a.Total district hea ng 0 n.a.Total biomass in households n.a. n.a.
Renewable Transport ktoe % Comment
Bioethanol / bio-ETBE 0 n.a.Bioethanol / bio-ETBE Ar cle 21.2 0 n.a.Bioethanol / bio-ETBE imported 0 n.a.Biodiesel 0.546 n.a.Biodiesel Ar cle 21.2 0.546 n.a.Biodiesel imported 0 n.a.Hydrogen from renewables 0 n.a.Renewable electricity 0 n.a.Renewable electricity road transport 0 n.a.Renewable electricity non-road transport 0 n.a.Other biofuels 0 n.a.Other biofuels Ar cle 21.2 0 n.a.Total 0.55 n.a.
Table 158: Maltese PR Table 1b,Table 1c and Table 1d: Total actualcontribu on (installed capacity,gross electricity genera on, finalenergy consump on) from eachrenewable energy technology inMalta for 2010 to meet thebinding 2020 targets and theindica ve interim trajectory forthe shares of energy fromrenewable resources in electricity(see Table 10a of the NREAP),hea ng and cooling (see Table 11of the NREAP) and in thetransport sector (see Table 12 ofthe NREAP)
ECN-E--13-076 Chapter 19. Malta 123

Biomass supply for hea ng and electricity Domes c raw material
Unit 2009 2010 Comment
Direct supply of wood biomass from forests and otherwooded land energy genera on
ktoe n.a. n.a.
Indirect supply of wood biomass ktoe n.a. n.a.Energy crops ktoe n.a. n.a.Agricultural by-products / processed residues and fisheryby-products
ktoe 3.97 3.97 1 (p.126)
Biomass from waste ktoe 24.33 23.67 2 (p.126)Others ktoe n.a. n.a.Total biomass for hea ng and electricity* ktoe 28.3 27.64
Biomass supply for transport Unit 2009 2010 Comment
Common arable crops for biofuels ktoe n.a. n.a.Energy crops and short rota on trees for biofuels ktoe n.a. n.a.Others ktoe n.a. n.a.Total biomass for transport* ktoe n.a. n.a.
Total biomass for all sectors* ktoe 28.3 27.64
Biomass supply for hea ng and electricity Raw material imported from EU
Unit 2009 2010 CommentDirect supply of wood biomass from forests and otherwooded land energy genera on
ktoe n.a. n.a.
Indirect supply of wood biomass ktoe n.a. n.a.Energy crops ktoe n.a. n.a.Agricultural by-products / processed residues and fisheryby-products
ktoe n.a. n.a. 1 (p.126)
Biomass from waste ktoe n.a. n.a. 2 (p.126)Others ktoe n.a. n.a.Total biomass for hea ng and electricity* ktoe n.a. n.a.
Biomass supply for transport Unit 2009 2010 Comment
Common arable crops for biofuels ktoe n.a. n.a.Energy crops and short rota on trees for biofuels ktoe n.a. n.a.Others ktoe n.a. n.a.Total biomass for transport* ktoe n.a. n.a.
Total biomass for all sectors* ktoe 0 0
Biomass supply for hea ng and electricity Raw material imported from non-EU
Unit 2009 2010 CommentDirect supply of wood biomass from forests and otherwooded land energy genera on
ktoe n.a. n.a.
Indirect supply of wood biomass ktoe n.a. n.a.Energy crops ktoe n.a. n.a.Agricultural by-products / processed residues and fisheryby-products
ktoe n.a. n.a. 1 (p.126)
Biomass from waste ktoe n.a. n.a. 2 (p.126)Others ktoe n.a. n.a.Total biomass for hea ng and electricity* ktoe n.a. n.a.
Biomass supply for transport Unit 2009 2010 Comment
Common arable crops for biofuels ktoe n.a. n.a.Energy crops and short rota on trees for biofuels ktoe n.a. n.a.Others ktoe n.a. n.a.Total biomass for transport* ktoe n.a. n.a.
Total biomass for all sectors* ktoe 0 0
* The values indicated with ‘*’ are calculated values and have not been men oned in the Progress Reportsas such.
Table 159: Maltese PR Table 4:Biomass supply for hea ng and
electricity (see Table 7 of theNREAP)
124

Unit 2009 2010 Comment
Land used for common arable crops and oil seeds ha 0 0Land used for short rota on trees ha 0 0Land used for other energy crops such as grasses ha 0 0
Table 160: Maltese PR Table 4a:Current domes c agriculturalland use for produc on of cropsdedicated to energy produc on(see Table 8 of the NREAP)
Unit 2009 2010 Comment
Produc on - Fuel type X ktoe 0.76 0.63Consump on - Fuel type X ktoe 0.76 0.63Total produc on Art.21.2.biofuels ktoe 0.76 0.63Total consump on Art.21.2. biofuels ktoe 0.76 0.63Share of 21(2) fuels from total RES-T % 100 100
Table 161: Maltese PR Table 5:Produc on and consump on ofAr cle 21(2) biofuels (ktoe)
Unit 2009 2010 Comment
Total es mated net GHG emission saving from RES t CO2-eq 11714.87 12747.85Es mated net GHG saving from the use of RES-E t CO2-eq 508.93 1550.69Es mated net GHG saving from the use of RES-H/C t CO2-eq 9531.83 9805.89Es mated net GHG saving from the use of RES-T t CO2-eq 1674.11 1391.27
Table 162: Maltese PR Table 6:Es mated GHG emission savingsfrom the use of renewable energy
Actual/es matedexcess produc on
Actual/es mateddeficit produc on
Comment
Renewable energy n.a. n.a. 3 (p.126)Origin/des na on n.a. n.a. 3 (p.126)Unit ktoe ktoe 3 (p.126)2010 n.a. n.a. 3 (p.126)2011 n.a. n.a. 3 (p.126)2012 2.05 n.a. 3 (p.126)2013 n.a. n.a. 3 (p.126)2014 7.6 n.a. 3 (p.126)2015 n.a. n.a. 3 (p.126)2016 8.34 n.a. 3 (p.126)2017 n.a. n.a. 3 (p.126)2018 16.08 n.a. 3 (p.126)2019 n.a. n.a. 3 (p.126)2020 1.07 n.a. 3 (p.126)
Table 163: Maltese PR Table 7:Actual and es mated excessand/or deficit (-) produc on ofrenewable energy compared tothe indica ve trajectory whichcould be transferred to/fromother Member States and/orthird countries in Malta (ktoe)(see Table 9 of the NREAP)
ECN-E--13-076 Chapter 19. Malta 125
Comments for Malta
1: Not u lised since no genera on facili es available.2: Not u lised since no genera on facili es available.3: The indicated trend suggests that Malta, though ini ally ght to the first interim targetdue to delayed measures implementa on will s ll recover by 2020 and does not have anysubstan al sustainable excess which can be marketed in the long term.
126
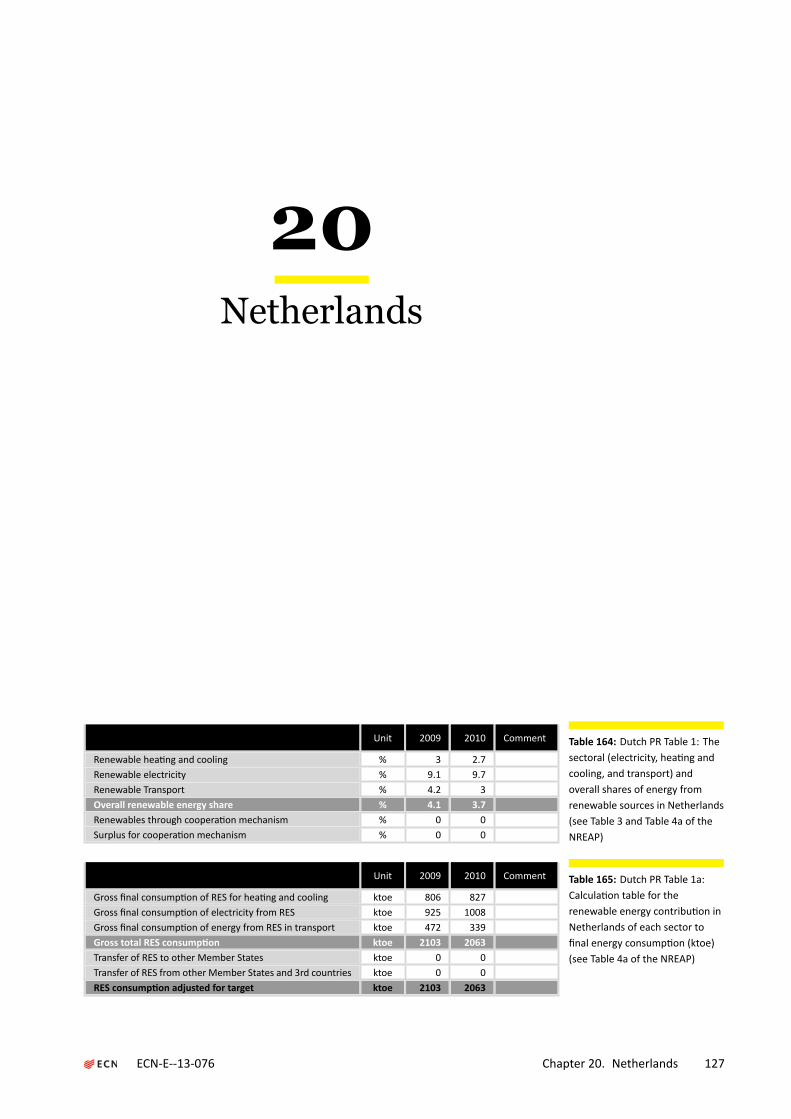
20Netherlands
Unit 2009 2010 Comment
Renewable hea ng and cooling % 3 2.7Renewable electricity % 9.1 9.7Renewable Transport % 4.2 3Overall renewable energy share % 4.1 3.7Renewables through coopera on mechanism % 0 0Surplus for coopera on mechanism % 0 0
Table 164: Dutch PR Table 1: Thesectoral (electricity, hea ng andcooling, and transport) andoverall shares of energy fromrenewable sources in Netherlands(see Table 3 and Table 4a of theNREAP)
Unit 2009 2010 Comment
Gross final consump on of RES for hea ng and cooling ktoe 806 827Gross final consump on of electricity from RES ktoe 925 1008Gross final consump on of energy from RES in transport ktoe 472 339Gross total RES consump on ktoe 2103 2063Transfer of RES to other Member States ktoe 0 0Transfer of RES from other Member States and 3rd countries ktoe 0 0RES consump on adjusted for target ktoe 2103 2063
Table 165: Dutch PR Table 1a:Calcula on table for therenewable energy contribu on inNetherlands of each sector tofinal energy consump on (ktoe)(see Table 4a of the NREAP)
ECN-E--13-076 Chapter 20. Netherlands 127

2009
Capacity Energy Comment
Renewable Electricity MW GWh ktoe %
Hydropower 37 100 9 0.4%Hydropower (non pumped) n.a. n.a. n.a. n.a.Hydropower <1 MW (non pumped) 0 0 0 0.0% 1 (p.132)Hydropower 1 MW - 10 MW (non pumped) 2 5 0 0.0% 2 (p.132)Hydropower >10 MW (non pumped) 35 95 8 0.4% 3 (p.132)Hydropower pumped storage 0 0 0 0.0%Hydropower mixed (normalised) n.a. n.a. n.a. n.a.Geothermal 0 0 0 0.0%Solar n.a. n.a. n.a. n.a.Solar photovoltaic 68 46 4 0.2%Concentrated solar power 0 0 0 0.0%Tidal, wave and ocean energy 0 0 0 0.0%Wind power 2222 4481 385 17.5%Onshore wind 1994 3762 323 14.7%Offshore wind 228 719 62 2.8%Biomass 1028 6129 527 23.9%Solid biomass 825 5122 440 20.0%Biogas 186 934 80 3.6%Bioliquids 17 74 6 0.3%Total 3355 10756 925 42.0%Total CHP 667 3742 322 14.6%
Renewable Hea ng and Cooling ktoe % Comment
Geothermal 3 0.1%Solar thermal 22 1.0%Biomass 699 31.7%Solid biomass 565 25.6%Biogas 103 4.7%Bioliquids 31 1.4%Renewable energy from heat pumps 81 3.7%Aerothermal heat pumps 38 1.7%Geothermal heat pumps 43 2.0%Hydrothermal heat pumps n.a. n.a.Total 806 36.6%Total district hea ng 160 7.3%Total biomass in households 292 13.3%
Renewable Transport ktoe % Comment
Bioethanol / bio-ETBE 138 6.3%Bioethanol / bio-ETBE Ar cle 21.2 0 0.0%Bioethanol / bio-ETBE imported n.a. n.a.Biodiesel 235 10.7%Biodiesel Ar cle 21.2 77 3.5%Biodiesel imported n.a. n.a.Hydrogen from renewables 0 0.0%Renewable electricity 23 1.0%Renewable electricity road transport 0 0.0%Renewable electricity non-road transport 23 1.0%Other biofuels 0 0.0%Other biofuels Ar cle 21.2 0 0.0%Total 472 21.4%
Table 166: Dutch PR Table 1b,Table 1c and Table 1d: Total actual
contribu on (installed capacity,gross electricity genera on, finalenergy consump on) from eachrenewable energy technology in
Netherlands for 2009 to meet thebinding 2020 targets and the
indica ve interim trajectory forthe shares of energy from
renewable resources in electricity(see Table 10a of the NREAP),
hea ng and cooling (see Table 11of the NREAP) and in the
transport sector (see Table 12 ofthe NREAP)
128

2010
Capacity Energy Comment
Renewable Electricity MW GWh ktoe %
Hydropower 37 101 9 0.4%Hydropower (non pumped) n.a. n.a. n.a. n.a.Hydropower <1 MW (non pumped) 0 0 0 0.0% 1 (p.132)Hydropower 1 MW - 10 MW (non pumped) 2 5 0 0.0% 2 (p.132)Hydropower >10 MW (non pumped) 35 96 8 0.4% 3 (p.132)Hydropower pumped storage 0 0 0 0.0%Hydropower mixed (normalised) n.a. n.a. n.a. n.a.Geothermal 0 0 0 0.0%Solar n.a. n.a. n.a. n.a.Solar photovoltaic 88 60 5 0.2%Concentrated solar power 0 0 0 0.0%Tidal, wave and ocean energy 0 0 0 0.0%Wind power 2237 4503 387 17.6%Onshore wind 2009 3737 321 14.6%Offshore wind 228 765 66 3.0%Biomass 1205 7059 607 27.6%Solid biomass 992 5961 513 23.3%Biogas 196 1044 90 4.1%Bioliquids 17 54 5 0.2%Total 3567 11722 1008 45.8%Total CHP 743 4075 350 15.9%
Renewable Hea ng and Cooling ktoe % Comment
Geothermal 8 0.4%Solar thermal 24 1.1%Biomass 698 31.7%Solid biomass 569 25.8%Biogas 116 5.3%Bioliquids 14 0.6%Renewable energy from heat pumps 97 4.4%Aerothermal heat pumps 46 2.1%Geothermal heat pumps 51 2.3%Hydrothermal heat pumps n.a. n.a.Total 827 37.5%Total district hea ng 170 7.7%Total biomass in households 295 13.4%
Renewable Transport ktoe % Comment
Bioethanol / bio-ETBE 134 6.1%Bioethanol / bio-ETBE Ar cle 21.2 4 0.2%Bioethanol / bio-ETBE imported n.a. n.a.Biodiesel 95 4.3%Biodiesel Ar cle 21.2 82 3.7%Biodiesel imported n.a. n.a.Hydrogen from renewables 0 0.0%Renewable electricity 25 1.1%Renewable electricity road transport 0 0.0%Renewable electricity non-road transport 25 1.1%Other biofuels 0 0.0%Other biofuels Ar cle 21.2 0 0.0%Total 339 15.4%
Table 167: Dutch PR Table 1b,Table 1c and Table 1d: Total actualcontribu on (installed capacity,gross electricity genera on, finalenergy consump on) from eachrenewable energy technology inNetherlands for 2010 to meet thebinding 2020 targets and theindica ve interim trajectory forthe shares of energy fromrenewable resources in electricity(see Table 10a of the NREAP),hea ng and cooling (see Table 11of the NREAP) and in thetransport sector (see Table 12 ofthe NREAP)
ECN-E--13-076 Chapter 20. Netherlands 129

Biomass supply for hea ng and electricity Domes c raw material
Unit 2009 2010 Comment
Direct supply of wood biomass from forests and otherwooded land energy genera on
ktoe 243 256
Indirect supply of wood biomass ktoe 585 552 4 (p.132)Energy crops ktoe 37 54Agricultural by-products / processed residues and fisheryby-products
ktoe 192 358
Biomass from waste ktoe 1157 1168Others ktoe n.a. n.a.Total biomass for hea ng and electricity* ktoe 2214 2388
Biomass supply for transport Unit 2009 2010 Comment
Common arable crops for biofuels ktoe n.a. n.a.Energy crops and short rota on trees for biofuels ktoe n.a. n.a.Others ktoe n.a. n.a.Total biomass for transport* ktoe n.a. n.a.
Total biomass for all sectors* ktoe 2214 2388
Biomass supply for hea ng and electricity Raw material imported from EU
Unit 2009 2010 CommentDirect supply of wood biomass from forests and otherwooded land energy genera on
ktoe n.a. n.a.
Indirect supply of wood biomass ktoe 0 19 4 (p.132)Energy crops ktoe n.a. n.a.Agricultural by-products / processed residues and fisheryby-products
ktoe 16 0
Biomass from waste ktoe n.a. n.a.Others ktoe n.a. n.a.Total biomass for hea ng and electricity* ktoe 16 19
Biomass supply for transport Unit 2009 2010 Comment
Common arable crops for biofuels ktoe n.a. n.a.Energy crops and short rota on trees for biofuels ktoe n.a. n.a.Others ktoe n.a. n.a.Total biomass for transport* ktoe n.a. n.a.
Total biomass for all sectors* ktoe 16 19
Biomass supply for hea ng and electricity Raw material imported from non-EU
Unit 2009 2010 CommentDirect supply of wood biomass from forests and otherwooded land energy genera on
ktoe n.a. n.a.
Indirect supply of wood biomass ktoe n.a. n.a. 4 (p.132)Energy crops ktoe n.a. n.a.Agricultural by-products / processed residues and fisheryby-products
ktoe n.a. n.a.
Biomass from waste ktoe n.a. n.a.Others ktoe n.a. n.a.Total biomass for hea ng and electricity* ktoe n.a. n.a.
Biomass supply for transport Unit 2009 2010 Comment
Common arable crops for biofuels ktoe n.a. n.a.Energy crops and short rota on trees for biofuels ktoe n.a. n.a.Others ktoe n.a. n.a.Total biomass for transport* ktoe n.a. n.a.
Total biomass for all sectors* ktoe 0 0
* The values indicated with ‘*’ are calculated values and have not been men oned in the Progress Reportsas such.
Table 168: Dutch PR Table 4:Biomass supply for hea ng and
electricity (see Table 7 of theNREAP)
130

Unit 2009 2010 Comment
Land used for common arable crops and oil seeds ha 8135 10632 5 (p.132)Land used for short rota on trees ha 12 8Land used for other energy crops such as grasses ha 58 83 6 (p.132)
Table 169: Dutch PR Table 4a:Current domes c agriculturalland use for produc on of cropsdedicated to energy produc on(see Table 8 of the NREAP)
Unit 2009 2010 Comment
Produc on - Fuel type X ktoe 242 338 7 (p.132)Consump on - Fuel type X ktoe 373 229 8 (p.132)Total produc on Art.21.2.biofuels ktoe n.a. n.a.Total consump on Art.21.2. biofuels ktoe 77 85Share of 21(2) fuels from total RES-T % 33 50
Table 170: Dutch PR Table 5:Produc on and consump on ofAr cle 21(2) biofuels (ktoe)
Unit 2009 2010 Comment
Total es mated net GHG emission saving from RES t CO2-eq 8547 8912Es mated net GHG saving from the use of RES-E t CO2-eq 6359 6883Es mated net GHG saving from the use of RES-H/C t CO2-eq 1458 1511Es mated net GHG saving from the use of RES-T t CO2-eq 730 518
Table 171: Dutch PR Table 6:Es mated GHG emission savingsfrom the use of renewable energy
Actual/es matedexcess produc on
Actual/es mateddeficit produc on
Comment
Renewable energy 0 n.a. 9 (p.132)Origin/des na on 0 n.a. 9 (p.132)Unit ktoe ktoe 9 (p.132)2010 0 n.a. 9 (p.132)2011 0 n.a. 9 (p.132)2012 0 n.a. 9 (p.132)2013 0 n.a. 9 (p.132)2014 0 n.a. 9 (p.132)2015 0 n.a. 9 (p.132)2016 0 n.a. 9 (p.132)2017 0 n.a. 9 (p.132)2018 0 n.a. 9 (p.132)2019 0 n.a. 9 (p.132)2020 0 n.a. 9 (p.132)
Table 172: Dutch PR Table 7:Actual and es mated excessand/or deficit (-) produc on ofrenewable energy compared tothe indica ve trajectory whichcould be transferred to/fromother Member States and/orthird countries in Netherlands(ktoe) (see Table 9 of the NREAP)
ECN-E--13-076 Chapter 20. Netherlands 131

Comments for the Netherlands
1: As a result of data confiden ality the breakdown provided here is based on data fromthe Dutch NREAP, not on es mates from Sta s cs Netherlands (CBS).2: As a result of data confiden ality the breakdown provided here is based on data fromthe Dutch NREAP, not on es mates from Sta s cs Netherlands (CBS).3: As a result of data confiden ality the breakdown provided here is based on data fromthe Dutch NREAP, not on es mates from Sta s cs Netherlands (CBS).4: Addi onally, the Dutch Progess report provides data on import of processed biomass.From EU countries this amounts to 155250 ton (65 ktoe) for 2009 and 229921 ton (96ktoe) for 2010. Import of processed biomass from non-EU countries amounts to 953679ton (399 ktoe) for 2009 and 1047417 ton (438 ktoe) for 2010.5: Regards energy maize (5500 ha for 2009 and 8000 ha for 2010) and rape (2635 ha for2009 and 2632 ha for 2010).6: Regards miscanthus.7: Regards biodiesel only, data on bioethanol are confiden al.8: Regards biodiesel (235 ktoe in 2009 and 95 ktoe in 2010) and bioethanol (138 ktoe in2009 and 134 ktoe in 2010).9: There are not yet any sta s cal transfers, joint projects or joint support scheme deci-sion rules. The use of collabora ve mechanisms may be considered during the evalua onof policy in 2014.
132

21Poland
Unit 2009 2010 Comment
Renewable hea ng and cooling % 11.9 12Renewable electricity % 5.9 6.7Renewable Transport % 4.8 5.9Overall renewable energy share % 8.9 9.5Renewables through coopera on mechanism % 0 0Surplus for coopera on mechanism % 0 0
Table 173: Polish PR Table 1: Thesectoral (electricity, hea ng andcooling, and transport) andoverall shares of energy fromrenewable sources in Poland (seeTable 3 and Table 4a of theNREAP)
Unit 2009 2010 Comment
Gross final consump on of RES for hea ng and cooling ktoe 4199 4636Gross final consump on of electricity from RES ktoe 752 894Gross final consump on of energy from RES in transport ktoe 662 887Gross total RES consump on ktoe 5613 6417Transfer of RES to other Member States ktoe 0 0Transfer of RES from other Member States and 3rd countries ktoe 0 0RES consump on adjusted for target ktoe 5613 6417
Table 174: Polish PR Table 1a:Calcula on table for therenewable energy contribu on inPoland of each sector to finalenergy consump on (ktoe) (seeTable 4a of the NREAP)
ECN-E--13-076 Chapter 21. Poland 133

2009
Capacity Energy Comment
Renewable Electricity MW GWh ktoe %
Hydropower 945.21 2355.574 203 3.6%Hydropower (non pumped) n.a. n.a. n.a. n.a.Hydropower <1 MW (non pumped) 88.077 n.a. n.a. n.a. 1 (p.138)Hydropower 1 MW - 10 MW (non pumped) 184.653 n.a. n.a. n.a. 2 (p.138)Hydropower >10 MW (non pumped) 672.48 n.a. n.a. n.a. 3 (p.138)Hydropower pumped storage n.a. n.a. n.a. n.a.Hydropower mixed (normalised) n.a. n.a. n.a. n.a.Geothermal 0 0 0 0.0%Solar 0.001 1.328 0 0.0%Solar photovoltaic 0.001 1.328 0 0.0%Concentrated solar power 0 0 0 0.0%Tidal, wave and ocean energy 0 0 0 0.0%Wind power 724.657 1164.18 100 1.8%Onshore wind 724.657 1164.18 100 1.8%Offshore wind 0 0 0 0.0%Biomass 323.378 5223.353 449 8.0%Solid biomass 252.49 4904.113 422 7.5% 4 (p.138)Biogas 70.888 319.24 27 0.5%Bioliquids 0 2967 255 4.5% 5 (p.138)Total 1993.246 8747.402 752 13.4%Total CHP n.a. 4663.807 401 7.1%
Renewable Hea ng and Cooling ktoe % Comment
Geothermal 14.3 0.3%Solar thermal 2 0.0%Biomass 4164.6 74.0%Solid biomass 4121.6 73.2%Biogas 42.9 0.8%Bioliquids 0.1 0.0%Renewable energy from heat pumps 18.1 0.3%Aerothermal heat pumps 0.3 0.0%Geothermal heat pumps 12.6 0.2%Hydrothermal heat pumps 5.2 0.1%Total 4199 74.6%Total district hea ng 0 0.0%Total biomass in households 2488.2 44.2%
Renewable Transport ktoe % Comment
Bioethanol / bio-ETBE 195 3.5%Bioethanol / bio-ETBE Ar cle 21.2 0 0.0%Bioethanol / bio-ETBE imported 103 1.8%Biodiesel 468 8.3% 6 (p.138)Biodiesel Ar cle 21.2 0 0.0%Biodiesel imported 139 2.5%Hydrogen from renewables 0 0.0%Renewable electricity 16 0.3%Renewable electricity road transport 0 0.0%Renewable electricity non-road transport 16 0.3%Other biofuels 0 0.0%Other biofuels Ar cle 21.2 0 0.0%Total 679 12.1%
Table 175: Polish PR Table 1b,Table 1c and Table 1d: Total actual
contribu on (installed capacity,gross electricity genera on, finalenergy consump on) from eachrenewable energy technology in
Poland for 2009 to meet thebinding 2020 targets and the
indica ve interim trajectory forthe shares of energy from
renewable resources in electricity(see Table 10a of the NREAP),
hea ng and cooling (see Table 11of the NREAP) and in the
transport sector (see Table 12 ofthe NREAP)
134

2010
Capacity Energy Comment
Renewable Electricity MW GWh ktoe %
Hydropower 937.042 2390.262 206 3.7%Hydropower (non pumped) n.a. n.a. n.a. n.a.Hydropower <1 MW (non pumped) 90.119 n.a. n.a. n.a. 1 (p.138)Hydropower 1 MW - 10 MW (non pumped) 174.443 n.a. n.a. n.a. 2 (p.138)Hydropower >10 MW (non pumped) 672.48 n.a. n.a. n.a. 3 (p.138)Hydropower pumped storage n.a. n.a. n.a. n.a.Hydropower mixed (normalised) n.a. n.a. n.a. n.a.Geothermal 0 0 0 0.0%Solar 0.033 1.672 0 0.0%Solar photovoltaic 0.033 1.672 0 0.0%Concentrated solar power 0 0 0 0.0%Tidal, wave and ocean energy 0 0 0 0.0%Wind power 1180.272 1700.29 146 2.6%Onshore wind 1180.272 1700.29 146 2.6%Offshore wind 0 0 0 0.0%Biomass 439.074 6303.59 542 9.6%Solid biomass 356.19 5905.21 508 9.0% 4 (p.138)Biogas 82.884 398.38 34 0.6%Bioliquids 0 0.9 0 0.0% 5 (p.138)Total 2556.421 10396.71 894 15.9%Total CHP n.a. 5592.5 481 8.5%
Renewable Hea ng and Cooling ktoe % Comment
Geothermal 13.4 0.2%Solar thermal 2.4 0.0%Biomass 4599.5 81.7%Solid biomass 4554.2 80.9%Biogas 45.3 0.8%Bioliquids 0 0.0%Renewable energy from heat pumps 21.2 0.4%Aerothermal heat pumps 0.8 0.0%Geothermal heat pumps 13.4 0.2%Hydrothermal heat pumps 7 0.1%Total 4636.5 82.4%Total district hea ng 0 0.0%Total biomass in households 2692.9 47.8%
Renewable Transport ktoe % Comment
Bioethanol / bio-ETBE 189 3.4%Bioethanol / bio-ETBE Ar cle 21.2 0 0.0%Bioethanol / bio-ETBE imported 84 1.5%Biodiesel 698 12.4% 6 (p.138)Biodiesel Ar cle 21.2 0 0.0%Biodiesel imported 365 6.5%Hydrogen from renewables 0 0.0%Renewable electricity 19 0.3%Renewable electricity road transport 0 0.0%Renewable electricity non-road transport 19 0.3%Other biofuels 0 0.0%Other biofuels Ar cle 21.2 0 0.0%Total 906 16.1%
Table 176: Polish PR Table 1b,Table 1c and Table 1d: Total actualcontribu on (installed capacity,gross electricity genera on, finalenergy consump on) from eachrenewable energy technology inPoland for 2010 to meet thebinding 2020 targets and theindica ve interim trajectory forthe shares of energy fromrenewable resources in electricity(see Table 10a of the NREAP),hea ng and cooling (see Table 11of the NREAP) and in thetransport sector (see Table 12 ofthe NREAP)
ECN-E--13-076 Chapter 21. Poland 135

Biomass supply for hea ng and electricity Domes c raw material
Unit 2009 2010 Comment
Direct supply of wood biomass from forests and otherwooded land energy genera on
ktoe 3994 4304 7 (p.138)
Indirect supply of wood biomass ktoe n.a. n.a. 8 (p.138)Energy crops ktoe 30 24Agricultural by-products / processed residues and fisheryby-products
ktoe 307 440
Biomass from waste ktoe 859 1096Others ktoe n.a. n.a.Total biomass for hea ng and electricity* ktoe 5190 5864
Biomass supply for transport Unit 2009 2010 Comment
Common arable crops for biofuels ktoe 411 n.a. 9 (p.138)Energy crops and short rota on trees for biofuels ktoe n.a. n.a.Others ktoe n.a. n.a.Total biomass for transport* ktoe 411 n.a.
Total biomass for all sectors* ktoe 5601 5864
Biomass supply for hea ng and electricity Raw material imported from EU
Unit 2009 2010 CommentDirect supply of wood biomass from forests and otherwooded land energy genera on
ktoe n.a. n.a. 7 (p.138)
Indirect supply of wood biomass ktoe n.a. n.a. 8 (p.138)Energy crops ktoe n.a. n.a.Agricultural by-products / processed residues and fisheryby-products
ktoe n.a. n.a.
Biomass from waste ktoe n.a. n.a.Others ktoe n.a. n.a.Total biomass for hea ng and electricity* ktoe n.a. n.a.
Biomass supply for transport Unit 2009 2010 Comment
Common arable crops for biofuels ktoe n.a. n.a. 9 (p.138)Energy crops and short rota on trees for biofuels ktoe n.a. n.a.Others ktoe n.a. n.a.Total biomass for transport* ktoe n.a. n.a.
Total biomass for all sectors* ktoe 0 0
Biomass supply for hea ng and electricity Raw material imported from non-EU
Unit 2009 2010 CommentDirect supply of wood biomass from forests and otherwooded land energy genera on
ktoe n.a. n.a. 7 (p.138)
Indirect supply of wood biomass ktoe n.a. n.a. 8 (p.138)Energy crops ktoe n.a. n.a.Agricultural by-products / processed residues and fisheryby-products
ktoe n.a. n.a.
Biomass from waste ktoe n.a. n.a.Others ktoe n.a. n.a.Total biomass for hea ng and electricity* ktoe n.a. n.a.
Biomass supply for transport Unit 2009 2010 Comment
Common arable crops for biofuels ktoe n.a. n.a. 9 (p.138)Energy crops and short rota on trees for biofuels ktoe n.a. n.a.Others ktoe n.a. n.a.Total biomass for transport* ktoe n.a. n.a.
Total biomass for all sectors* ktoe 0 0
* The values indicated with ‘*’ are calculated values and have not been men oned in the Progress Reportsas such.
Table 177: Polish PR Table 4:Biomass supply for hea ng and
electricity (see Table 7 of theNREAP)
136
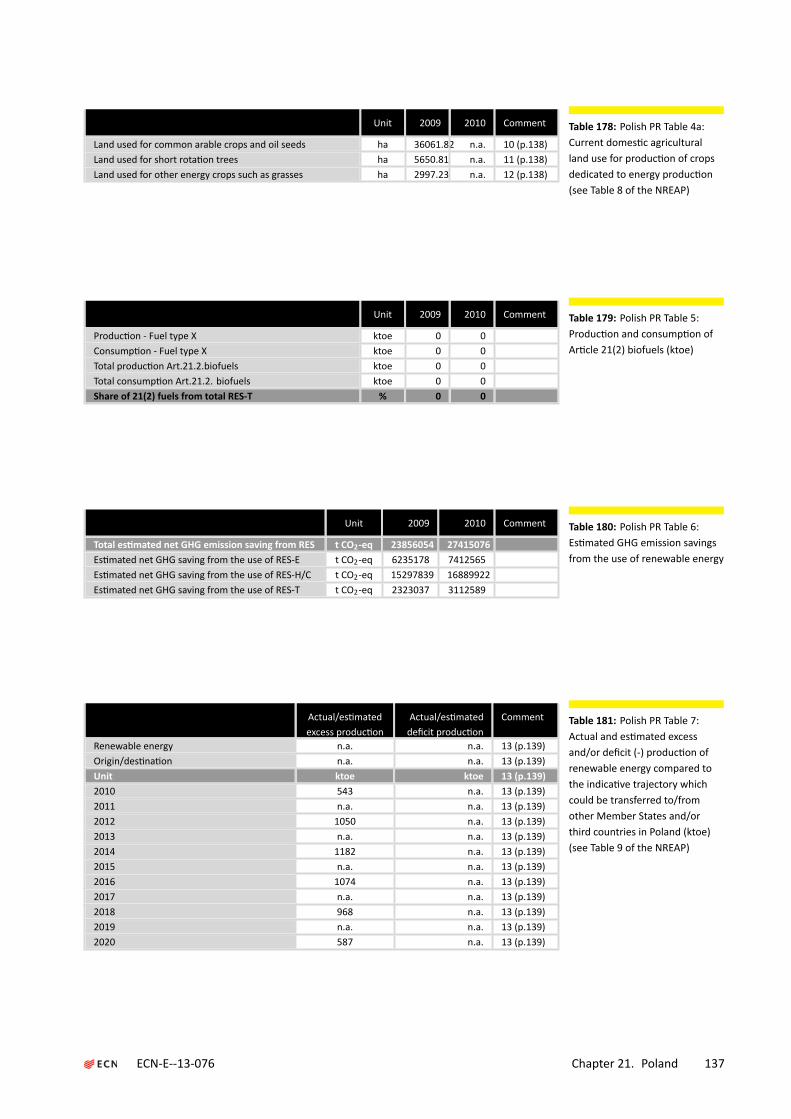
Unit 2009 2010 Comment
Land used for common arable crops and oil seeds ha 36061.82 n.a. 10 (p.138)Land used for short rota on trees ha 5650.81 n.a. 11 (p.138)Land used for other energy crops such as grasses ha 2997.23 n.a. 12 (p.138)
Table 178: Polish PR Table 4a:Current domes c agriculturalland use for produc on of cropsdedicated to energy produc on(see Table 8 of the NREAP)
Unit 2009 2010 Comment
Produc on - Fuel type X ktoe 0 0Consump on - Fuel type X ktoe 0 0Total produc on Art.21.2.biofuels ktoe 0 0Total consump on Art.21.2. biofuels ktoe 0 0Share of 21(2) fuels from total RES-T % 0 0
Table 179: Polish PR Table 5:Produc on and consump on ofAr cle 21(2) biofuels (ktoe)
Unit 2009 2010 Comment
Total es mated net GHG emission saving from RES t CO2-eq 23856054 27415076Es mated net GHG saving from the use of RES-E t CO2-eq 6235178 7412565Es mated net GHG saving from the use of RES-H/C t CO2-eq 15297839 16889922Es mated net GHG saving from the use of RES-T t CO2-eq 2323037 3112589
Table 180: Polish PR Table 6:Es mated GHG emission savingsfrom the use of renewable energy
Actual/es matedexcess produc on
Actual/es mateddeficit produc on
Comment
Renewable energy n.a. n.a. 13 (p.139)Origin/des na on n.a. n.a. 13 (p.139)Unit ktoe ktoe 13 (p.139)2010 543 n.a. 13 (p.139)2011 n.a. n.a. 13 (p.139)2012 1050 n.a. 13 (p.139)2013 n.a. n.a. 13 (p.139)2014 1182 n.a. 13 (p.139)2015 n.a. n.a. 13 (p.139)2016 1074 n.a. 13 (p.139)2017 n.a. n.a. 13 (p.139)2018 968 n.a. 13 (p.139)2019 n.a. n.a. 13 (p.139)2020 587 n.a. 13 (p.139)
Table 181: Polish PR Table 7:Actual and es mated excessand/or deficit (-) produc on ofrenewable energy compared tothe indica ve trajectory whichcould be transferred to/fromother Member States and/orthird countries in Poland (ktoe)(see Table 9 of the NREAP)
ECN-E--13-076 Chapter 21. Poland 137

Comments for Poland
1: Given standardisa on calcula ons, it is currently not possible to provide more detaileddata concerning hydropower.2: Given standardisa on calcula ons, it is currently not possible to provide more detaileddata concerning hydropower.3: Given standardisa on calcula ons, it is currently not possible to provide more detaileddata concerning hydropower.4: Installed capacity for solid biomass concern only units genera ng electricity using ex-clusively biomass as fuel. Such cases enable to determine the installed capacity of a givensource. In Poland, apart from electricity genera on in units dedicated exclusively to in-cinera on of biomass, there are large systemic installa ons genera ng electricity in theprocess of co-firing of biomass with other fossil fuels, e.g. coal. In this case, in accor-dance with applicable regula on of the Minister of Economy of 14 August 2008 on thedetailed scope of obliga ons in respect to obtaining cer ficates of origin and submi ngthem for redemp on, payment of a subs tute fee, purchase of electricity and heat fromrenewable energy sources, as well as the obliga on to confirm the data on the amount ofelectricity produced from a renewable energy source (Journal of Laws No 156, item 969and 2010 No 34, item 182), energy produced from renewable energy sources includes apor on of electricity or heat corresponding to the share of chemical energy of biomassor biogas in chemical energy of the fuel used to generate energy, calculated on the basisof real calorific values of these fuels. Since the composi on of the mixture of biomassand another fuel differs in individual installa ons and can vary in different periods, it isimpossible to calculate and provide the rated installed capacity for such units.5: No dedicated bioliquid installa ons (0 MW and 0 GWh for both 2009 and 2010). Forthe year 2009 an amount of 2.967 GWh was generated using bioliquids in co-firing. Forthe year 2010 this amount was 0.9 GWh.6: In the year 2009 an amount of 80 ktoe consisted of B100 and in the year 2010 theamount of B100 was 212 ktoe.7: It is not possible to specify whether the supply of this biomass type is direct or indirect:the value men oned under ’direct supply’ includes ’indirect supply’.8: It is not possible to specify whether the supply of this biomass type is direct or indirect:the value men oned under ’direct supply’ includes ’indirect supply’.9: Data originate from quarterly reports only (DPE - 4.1 form) submi ed by producersto the Agricultural Market Agency in 2009-2010. Producers do not differen ate in thereports between rawmaterials in terms of their origin (domes c, intra-Community acqui-si on, import), and therefore the data refer to all raw materials used by the producersfor the produc on of biocomponents. Included are: maize, rye, wheat, tri cale, barley,cereals, molasses, ethyl alcohol, dis llate of agricultural origin, residual frac ons from al-cohol rec fica on, fusel oils, alcohol slops, dis lla on forerunnings, rapeseed, rapeseedoil, vegetable fats, animal fats, esters for processing, biocomponents, free fa y acids andREM. See Polish Progress Report Table 4 on pages 20-21 for all detail.10: Regards rapeseed, maize, rye, tri cale, oats, Wheat, cereal blends and barley. All de-tail for 2009 available in Table 4a of the Polish Progress Report (page 22).11: Regards willow, birch, alder, black locust, poplar and mul flora rose. All detail for2009 available in Table 4a of the Polish Progress Report (page 22).12: Regards perennial and annual grasses, miscanthus sinensis, sida hermaphrodita rusby,reed canary grass, cordgrass and jerusalem ar choke. All detail for 2009 available in Table4a of the Polish Progress Report (page 22).13: For the year 2010 a breakdown is men oned in the Polish Progress Report into re-newable hea ng and cooling (+656 ktoe), renewable electricity (-19 ktoe) and renewable
138

transport (-94 ktoe). The data value for 2012 refers to the period 2011 - 2012 in the PolishProgress Report. The value for 2014 refers to the period 2013 - 2014, the value for 2016refers to the period 2015 - 2016 and the value for 2018 refers to the period 2017 - 2018.
ECN-E--13-076 Chapter 21. Poland 139

140
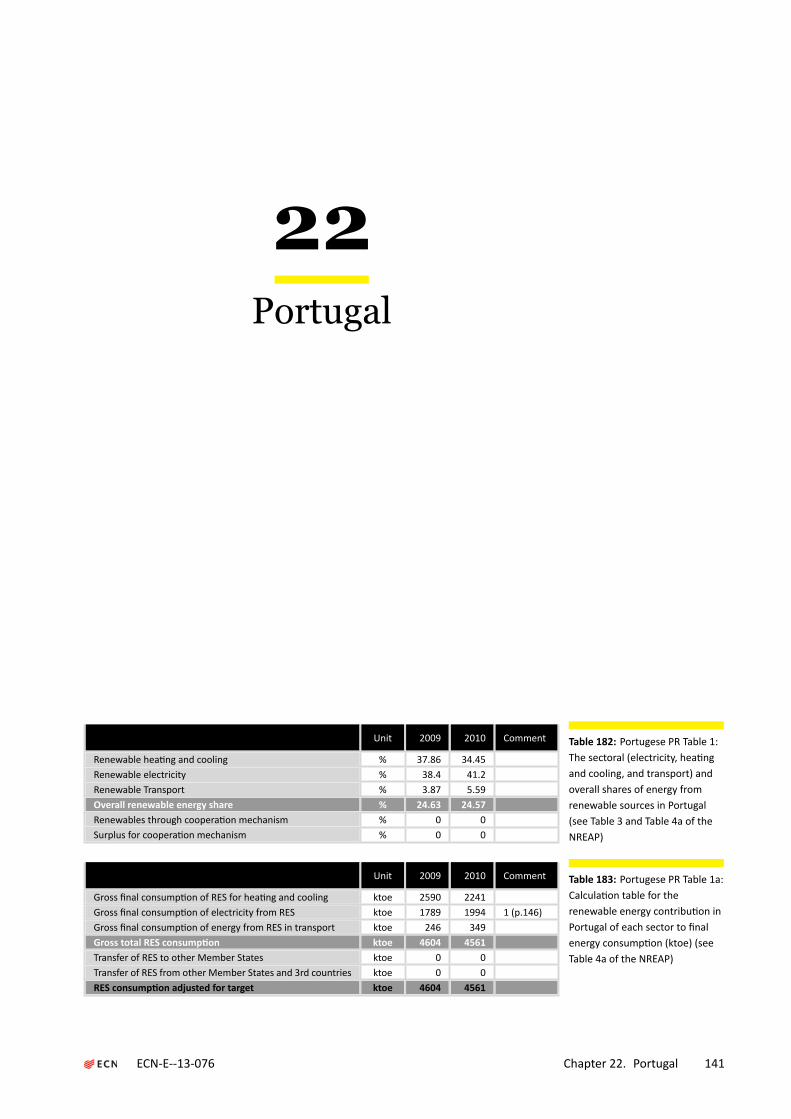
22Portugal
Unit 2009 2010 Comment
Renewable hea ng and cooling % 37.86 34.45Renewable electricity % 38.4 41.2Renewable Transport % 3.87 5.59Overall renewable energy share % 24.63 24.57Renewables through coopera on mechanism % 0 0Surplus for coopera on mechanism % 0 0
Table 182: Portugese PR Table 1:The sectoral (electricity, hea ngand cooling, and transport) andoverall shares of energy fromrenewable sources in Portugal(see Table 3 and Table 4a of theNREAP)
Unit 2009 2010 Comment
Gross final consump on of RES for hea ng and cooling ktoe 2590 2241Gross final consump on of electricity from RES ktoe 1789 1994 1 (p.146)Gross final consump on of energy from RES in transport ktoe 246 349Gross total RES consump on ktoe 4604 4561Transfer of RES to other Member States ktoe 0 0Transfer of RES from other Member States and 3rd countries ktoe 0 0RES consump on adjusted for target ktoe 4604 4561
Table 183: Portugese PR Table 1a:Calcula on table for therenewable energy contribu on inPortugal of each sector to finalenergy consump on (ktoe) (seeTable 4a of the NREAP)
ECN-E--13-076 Chapter 22. Portugal 141

2009
Capacity Energy Comment
Renewable Electricity MW GWh ktoe %
Hydropower 5080 11270 969 21.0%Hydropower (non pumped) 3991 10127 871 18.9%Hydropower <1 MW (non pumped) 35 89 8 0.2%Hydropower 1 MW - 10 MW (non pumped) 351 891 77 1.7%Hydropower >10 MW (non pumped) 3605 9147 787 17.1%Hydropower pumped storage 1089 1143 98 2.1%Hydropower mixed (normalised) 1089 1143 98 2.1%Geothermal 25 184 16 0.3%Solar 115 160 14 0.3%Solar photovoltaic 115 160 14 0.3%Concentrated solar power 0 0 0 0.0%Tidal, wave and ocean energy 0 0 0 0.0%Wind power 3326 7000 602 13.1%Onshore wind 3326 7000 602 13.1%Offshore wind 0 0 0 0.0%Biomass 442 2384 205 4.5%Solid biomass 422 2301 198 4.3%Biogas 20 83 7 0.2%Bioliquids 0 0 0 0.0%Total 8988 20998 1806 39.2%Total CHP 272 1370 118 2.6%
Renewable Hea ng and Cooling ktoe % Comment
Geothermal 10 0.2%Solar thermal 35 0.8%Biomass 2508 54.5%Solid biomass 1658 36.0%Biogas 25 0.5%Bioliquids 825 17.9%Renewable energy from heat pumps n.a. n.a.Aerothermal heat pumps n.a. n.a.Geothermal heat pumps n.a. n.a.Hydrothermal heat pumps n.a. n.a.Total 2553 55.4%Total district hea ng 1206 26.2%Total biomass in households 1161 25.2%
Renewable Transport ktoe % Comment
Bioethanol / bio-ETBE 0 0.0%Bioethanol / bio-ETBE Ar cle 21.2 0 0.0%Bioethanol / bio-ETBE imported 0 0.0%Biodiesel 226 4.9%Biodiesel Ar cle 21.2 1.3 0.0%Biodiesel imported 12.3 0.3%Hydrogen from renewables 0 0.0%Renewable electricity 15 0.3%Renewable electricity road transport 0 0.0%Renewable electricity non-road transport 15 0.3%Other biofuels 4.5 0.1%Other biofuels Ar cle 21.2 4.5 0.1%Total 246 5.3%
Table 184: Portugese PR Table 1b,Table 1c and Table 1d: Total actual
contribu on (installed capacity,gross electricity genera on, finalenergy consump on) from eachrenewable energy technology inPortugal for 2009 to meet thebinding 2020 targets and the
indica ve interim trajectory forthe shares of energy from
renewable resources in electricity(see Table 10a of the NREAP),
hea ng and cooling (see Table 11of the NREAP) and in the
transport sector (see Table 12 ofthe NREAP)
142

2010
Capacity Energy Comment
Renewable Electricity MW GWh ktoe %
Hydropower 5102 11775 1012 22.0%Hydropower (non pumped) 4013 10584 910 19.8%Hydropower <1 MW (non pumped) 35 92 8 0.2%Hydropower 1 MW - 10 MW (non pumped) 343 905 78 1.7%Hydropower >10 MW (non pumped) 3635 9587 824 17.9%Hydropower pumped storage 1089 1192 102 2.2%Hydropower mixed (normalised) 1089 1192 102 2.2%Geothermal 25 197 17 0.4%Solar 132 201 17 0.4%Solar photovoltaic 132 201 17 0.4%Concentrated solar power 0 0 0 0.0%Tidal, wave and ocean energy 0 0 0 0.0%Wind power 3796 8395 722 15.7%Onshore wind 3796 8395 722 15.7%Offshore wind 0 0 0 0.0%Biomass 587 2904 250 5.4%Solid biomass 562 2804 241 5.2%Biogas 25 100 9 0.2%Bioliquids 0 0 0 0.0%Total 9642 23472 2018 43.8%Total CHP 456 1604 138 3.0%
Renewable Hea ng and Cooling ktoe % Comment
Geothermal 10 0.2%Solar thermal 48 1.0%Biomass 2609 56.7%Solid biomass 1699 36.9%Biogas 32 0.7%Bioliquids 878 19.1%Renewable energy from heat pumps n.a. n.a.Aerothermal heat pumps n.a. n.a.Geothermal heat pumps n.a. n.a.Hydrothermal heat pumps n.a. n.a.Total 2667 57.9%Total district hea ng 764 16.6%Total biomass in households 706 15.3%
Renewable Transport ktoe % Comment
Bioethanol / bio-ETBE 0 0.0%Bioethanol / bio-ETBE Ar cle 21.2 0 0.0%Bioethanol / bio-ETBE imported 0 0.0%Biodiesel 326 7.1%Biodiesel Ar cle 21.2 0.3 0.0%Biodiesel imported 16.8 0.4%Hydrogen from renewables 0 0.0%Renewable electricity 19 0.4%Renewable electricity road transport 1 0.0%Renewable electricity non-road transport 18 0.4%Other biofuels 3.6 0.1%Other biofuels Ar cle 21.2 3.6 0.1%Total 349 7.6%
Table 185: Portugese PR Table 1b,Table 1c and Table 1d: Total actualcontribu on (installed capacity,gross electricity genera on, finalenergy consump on) from eachrenewable energy technology inPortugal for 2010 to meet thebinding 2020 targets and theindica ve interim trajectory forthe shares of energy fromrenewable resources in electricity(see Table 10a of the NREAP),hea ng and cooling (see Table 11of the NREAP) and in thetransport sector (see Table 12 ofthe NREAP)
ECN-E--13-076 Chapter 22. Portugal 143

Biomass supply for hea ng and electricity Domes c raw material
Unit 2009 2010 Comment
Direct supply of wood biomass from forests and otherwooded land energy genera on
ktoe 89 208
Indirect supply of wood biomass ktoe 205 207Energy crops ktoe 0 0Agricultural by-products / processed residues and fisheryby-products
ktoe 18 18
Biomass from waste ktoe 198 192Others ktoe n.a. n.a.Total biomass for hea ng and electricity* ktoe 510 625
Biomass supply for transport Unit 2009 2010 Comment
Common arable crops for biofuels ktoe n.a. n.a. 2 (p.146)Energy crops and short rota on trees for biofuels ktoe 4.6 n.a. 3 (p.146)Others ktoe 4.4 n.a. 4 (p.146)Total biomass for transport* ktoe 9 n.a.
Total biomass for all sectors* ktoe 519 625
Biomass supply for hea ng and electricity Raw material imported from EU
Unit 2009 2010 CommentDirect supply of wood biomass from forests and otherwooded land energy genera on
ktoe n.a. n.a.
Indirect supply of wood biomass ktoe n.a. n.a.Energy crops ktoe n.a. n.a.Agricultural by-products / processed residues and fisheryby-products
ktoe n.a. n.a.
Biomass from waste ktoe n.a. n.a.Others ktoe n.a. n.a.Total biomass for hea ng and electricity* ktoe n.a. n.a.
Biomass supply for transport Unit 2009 2010 Comment
Common arable crops for biofuels ktoe n.a. n.a. 2 (p.146)Energy crops and short rota on trees for biofuels ktoe n.a. n.a. 3 (p.146)Others ktoe 1.4 n.a. 4 (p.146)Total biomass for transport* ktoe 1.4 n.a.
Total biomass for all sectors* ktoe 1.4 0
Biomass supply for hea ng and electricity Raw material imported from non-EU
Unit 2009 2010 CommentDirect supply of wood biomass from forests and otherwooded land energy genera on
ktoe n.a. n.a.
Indirect supply of wood biomass ktoe n.a. n.a.Energy crops ktoe n.a. n.a.Agricultural by-products / processed residues and fisheryby-products
ktoe n.a. n.a.
Biomass from waste ktoe n.a. n.a.Others ktoe n.a. n.a.Total biomass for hea ng and electricity* ktoe n.a. n.a.
Biomass supply for transport Unit 2009 2010 Comment
Common arable crops for biofuels ktoe n.a. n.a. 2 (p.146)Energy crops and short rota on trees for biofuels ktoe n.a. n.a. 3 (p.146)Others ktoe 1.4 n.a. 4 (p.146)Total biomass for transport* ktoe 1.4 n.a.
Total biomass for all sectors* ktoe 1.4 0
* The values indicated with ‘*’ are calculated values and have not been men oned in the Progress Reportsas such.
Table 186: Portugese PR Table 4:Biomass supply for hea ng and
electricity (see Table 7 of theNREAP)
144

Unit 2009 2010 Comment
Land used for common arable crops and oil seeds ha 426 4357Land used for short rota on trees ha n.a. n.a.Land used for other energy crops such as grasses ha n.a. n.a.
Table 187: Portugese PR Table 4a:Current domes c agriculturalland use for produc on of cropsdedicated to energy produc on(see Table 8 of the NREAP)
Unit 2009 2010 Comment
Produc on - Fuel type X ktoe 5.8 3.9 5 (p.146)Consump on - Fuel type X ktoe 5.8 3.9 6 (p.146)Total produc on Art.21.2.biofuels ktoe 5.8 3.9Total consump on Art.21.2. biofuels ktoe 5.8 3.9Share of 21(2) fuels from total RES-T % 2.38 1.16
Table 188: Portugese PR Table 5:Produc on and consump on ofAr cle 21(2) biofuels (ktoe)
Unit 2009 2010 Comment
Total es mated net GHG emission saving from RES t CO2-eq 8094 8877Es mated net GHG saving from the use of RES-E t CO2-eq 2390 2744 7 (p.146)Es mated net GHG saving from the use of RES-H/C t CO2-eq 5288 5525 8 (p.146)Es mated net GHG saving from the use of RES-T t CO2-eq 416 609 9 (p.146)
Table 189: Portugese PR Table 6:Es mated GHG emission savingsfrom the use of renewable energy
Actual/es matedexcess produc on
Actual/es mateddeficit produc on
Comment
Renewable energy n.a. n.a. 10 (p.146)Origin/des na on n.a. n.a. 10 (p.146)Unit ktoe ktoe 10 (p.146)2010 n.a. n.a. 10 (p.146)2011 n.a. n.a. 10 (p.146)2012 n.a. n.a. 10 (p.146)2013 n.a. n.a. 10 (p.146)2014 n.a. n.a. 10 (p.146)2015 n.a. n.a. 10 (p.146)2016 n.a. n.a. 10 (p.146)2017 n.a. n.a. 10 (p.146)2018 n.a. n.a. 10 (p.146)2019 n.a. n.a. 10 (p.146)2020 n.a. n.a. 10 (p.146)
Table 190: Portugese PR Table 7:Actual and es mated excessand/or deficit (-) produc on ofrenewable energy compared tothe indica ve trajectory whichcould be transferred to/fromother Member States and/orthird countries in Portugal (ktoe)(see Table 9 of the NREAP)
ECN-E--13-076 Chapter 22. Portugal 145

Comments for Portugal
1: Electricity produc on from RES harmonising hydro and wind power in accordance withDirec ve 2009/28/EC.2: It should be noted that oilseeds grown on agricultural land in Portugal, as set out intable 4, is not intended exclusively for the produc on of biofuels. The main purpose ofagriculture on this land is the produc on of protein meal for the animal feed industry, oroils (such as sunflower oil) for the food industry, which commonly ends up being used forbiofuel produc on. (Comment may also refer to Table 4a on domes c agricultural landuse.)3: Unit for ’imported raw material from non-EU’ not explicitly men oned.4: Refers to used oils.5: For 2009 this refers to 1.3 ktoe biodiesel and 4.5 ktoe biodiesel pour point depressant(PPD, which corresponds to the sterifica on of cooking oil and animal fat). For 2010 thisrefers to 0.3 ktoe biodiesel and 3.6 ktoe biodiesel PPD.6: For 2009 this refers to 1.3 ktoe biodiesel and 4.5 ktoe biodiesel pour point depressant(PPD, which corresponds to the sterifica on of cooking oil and animal fat). For 2010 thisrefers to 0.3 ktoe biodiesel and 3.6 ktoe biodiesel PPD.7: The GN conversion factor was used rather than that recommended by the Commission(56.1 g CO2-eq/MJ)8: The conversion factor recommended by the Commission was used (87 g CO2-eq/MJ)9: The diesel conversion factor was used (74.1 g CO2-eq/MJ)10: Portugal thus argues that flexibility mechanisms should be backed up by the physi-cal transfer of the energy involved in these mechanisms. The necessary investments aretherefore required to remove the bo leneck in the Pyrenees and so create an effec veandworkable connec on between the Iberian Peninsula and the French electricity grid. Inthe absence of these investments it is unlikely that Portugal will make use of these mech-anisms in the near future.
146

23Romania
Unit 2009 2010 Comment
Renewable hea ng and cooling % 23.46 24.22Renewable electricity % 33.46 32.06Renewable Transport % 0.67 0.68Overall renewable energy share % 21.75 22.36 1 (p.152)Renewables through coopera on mechanism % 0 0Surplus for coopera on mechanism % 0 0
Table 191: Romanian PR Table 1:The sectoral (electricity, hea ngand cooling, and transport) andoverall shares of energy fromrenewable sources in Romania(see Table 3 and Table 4a of theNREAP)
Unit 2009 2010 Comment
Gross final consump on of RES for hea ng and cooling ktoe 3789.123 3975.4Gross final consump on of electricity from RES ktoe 1469.446 1522.595Gross final consump on of energy from RES in transport ktoe 33.54 33.13Gross total RES consump on ktoe 5258.051 5498.349 2 (p.152)Transfer of RES to other Member States ktoe 0 0Transfer of RES from other Member States and 3rd countries ktoe 0 0RES consump on adjusted for target ktoe 5258.051 5498.349
Table 192: Romanian PR Table 1a:Calcula on table for therenewable energy contribu on inRomania of each sector to finalenergy consump on (ktoe) (seeTable 4a of the NREAP)
ECN-E--13-076 Chapter 23. Romania 147

2009
Capacity Energy Comment
Renewable Electricity MW GWh ktoe %
Hydropower 6450 17360 1493 27.0%Hydropower (non pumped) 6358 17060 1467 26.6%Hydropower <1 MW (non pumped) 70 115 10 0.2%Hydropower 1 MW - 10 MW (non pumped) 297 711 61 1.1%Hydropower >10 MW (non pumped) 5991 16235 1396 25.3%Hydropower pumped storage 92 300 26 0.5%Hydropower mixed (normalised) n.a. n.a. n.a. n.a.Geothermal 0 0 0 0.0%Solar 0.05 0.003 0 0.0%Solar photovoltaic 0.05 0.003 0 0.0%Concentrated solar power 0 0 0 0.0%Tidal, wave and ocean energy 0 0 0 0.0%Wind power 14.548 9.753 1 0.0%Onshore wind 14.548 9.753 1 0.0%Offshore wind 0 0 0 0.0%Biomass n.a. 5.206 0 0.0%Solid biomass n.a. 4.959 0 0.0%Biogas 0 0.247 0 0.0%Bioliquids 0 0 0 0.0%Total n.a. 17074.962 1468 26.6% 3 (p.152)Total CHP n.a. 5.206 0 0.0%
Renewable Hea ng and Cooling ktoe % Comment
Geothermal 25.485 0.5%Solar thermal 0 0.0%Biomass 3763.637 68.2%Solid biomass 3762.996 68.1%Biogas 0.641 0.0%Bioliquids 0 0.0%Renewable energy from heat pumps 0 0.0%Aerothermal heat pumps n.a. n.a.Geothermal heat pumps n.a. n.a.Hydrothermal heat pumps n.a. n.a.Total 3789.122 68.6% 4 (p.152)Total district hea ng 28.929 0.5%Total biomass in households 3394.425 61.5%
Renewable Transport ktoe % Comment
Bioethanol / bio-ETBE 82.61 1.5%Bioethanol / bio-ETBE Ar cle 21.2 0 0.0% 5 (p.152)Bioethanol / bio-ETBE imported 73.58 1.3%Biodiesel 148.6 2.7%Biodiesel Ar cle 21.2 0 0.0% 6 (p.152)Biodiesel imported 79.43 1.4%Hydrogen from renewables 0 0.0%Renewable electricity 33.54 0.6%Renewable electricity road transport n.a. n.a.Renewable electricity non-road transport n.a. n.a.Other biofuels 0 0.0%Other biofuels Ar cle 21.2 0 0.0%Total 264.76 4.8% 7 (p.152)
Table 193: Romanian PR Table 1b,Table 1c and Table 1d: Total actual
contribu on (installed capacity,gross electricity genera on, finalenergy consump on) from eachrenewable energy technology inRomania for 2009 to meet thebinding 2020 targets and the
indica ve interim trajectory forthe shares of energy from
renewable resources in electricity(see Table 10a of the NREAP),
hea ng and cooling (see Table 11of the NREAP) and in the
transport sector (see Table 12 ofthe NREAP)
148

2010
Capacity Energy Comment
Renewable Electricity MW GWh ktoe %
Hydropower 6474 17573 1511 27.4%Hydropower (non pumped) 6382 17324 1490 27.0%Hydropower <1 MW (non pumped) 76 126 11 0.2%Hydropower 1 MW - 10 MW (non pumped) 315 754 65 1.2%Hydropower >10 MW (non pumped) 5991 16444 1414 25.6%Hydropower pumped storage 92 250 21 0.4%Hydropower mixed (normalised) n.a. n.a. n.a. n.a.Geothermal 0 0 0 0.0%Solar 0.2 0.02 0 0.0%Solar photovoltaic 0.2 0.02 0 0.0%Concentrated solar power 0 0 0 0.0%Tidal, wave and ocean energy 0 0 0 0.0%Wind power 388.608 299.061 26 0.5%Onshore wind 388.608 299.061 26 0.5%Offshore wind 0 0 0 0.0%Biomass n.a. 69.472 6 0.1%Solid biomass n.a. 69.227 6 0.1%Biogas 0 0.245 0 0.0%Bioliquids 0 0 0 0.0%Total n.a. 17692.553 1521 27.5% 3 (p.152)Total CHP n.a. 69.472 6 0.1%
Renewable Hea ng and Cooling ktoe % Comment
Geothermal 24.351 0.4%Solar thermal 0 0.0%Biomass 3951.021 71.5%Solid biomass 3950.162 71.5%Biogas 0.859 0.0%Bioliquids 0 0.0%Renewable energy from heat pumps 0 0.0%Aerothermal heat pumps n.a. n.a.Geothermal heat pumps n.a. n.a.Hydrothermal heat pumps n.a. n.a.Total 3975.372 72.0% 4 (p.152)Total district hea ng 44.577 0.8%Total biomass in households 3526.063 63.9%
Renewable Transport ktoe % Comment
Bioethanol / bio-ETBE 110.9 2.0%Bioethanol / bio-ETBE Ar cle 21.2 0 0.0% 5 (p.152)Bioethanol / bio-ETBE imported 57.6 1.0%Biodiesel 142.43 2.6%Biodiesel Ar cle 21.2 0 0.0% 6 (p.152)Biodiesel imported 58.87 1.1%Hydrogen from renewables 0 0.0%Renewable electricity 33.13 0.6%Renewable electricity road transport n.a. n.a.Renewable electricity non-road transport n.a. n.a.Other biofuels 0 0.0%Other biofuels Ar cle 21.2 0 0.0%Total 286.46 5.2% 7 (p.152)
Table 194: Romanian PR Table 1b,Table 1c and Table 1d: Total actualcontribu on (installed capacity,gross electricity genera on, finalenergy consump on) from eachrenewable energy technology inRomania for 2010 to meet thebinding 2020 targets and theindica ve interim trajectory forthe shares of energy fromrenewable resources in electricity(see Table 10a of the NREAP),hea ng and cooling (see Table 11of the NREAP) and in thetransport sector (see Table 12 ofthe NREAP)
ECN-E--13-076 Chapter 23. Romania 149
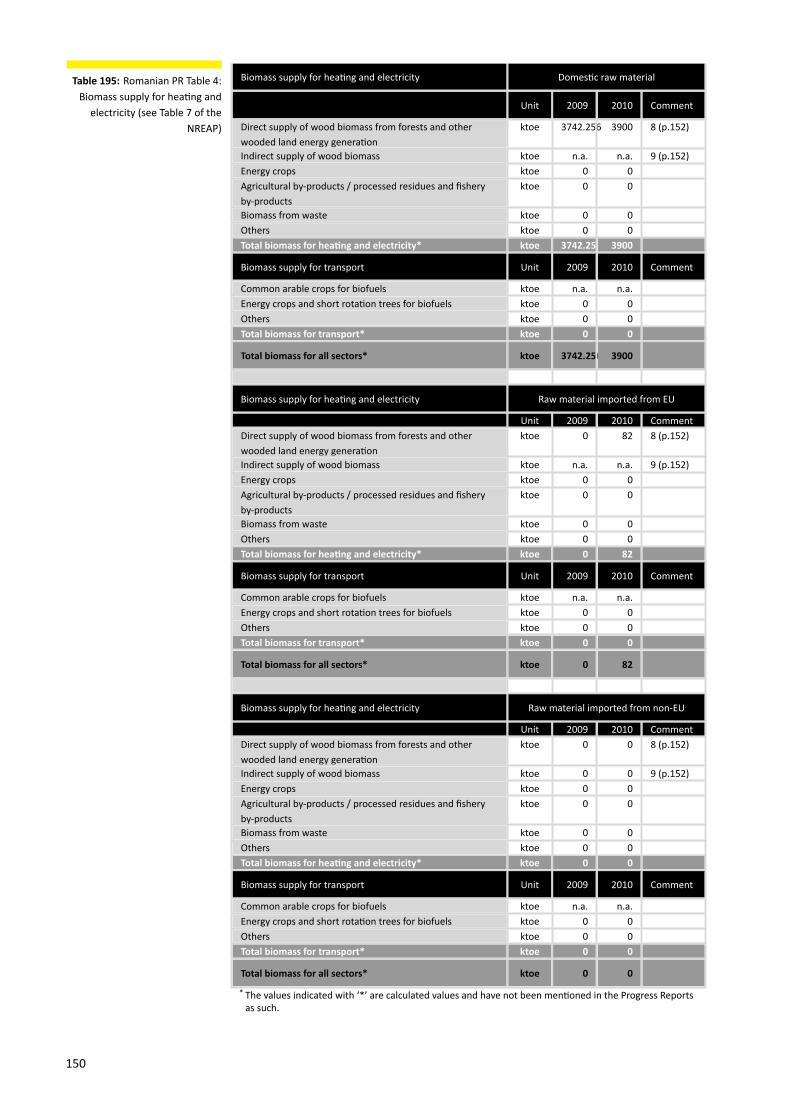
Biomass supply for hea ng and electricity Domes c raw material
Unit 2009 2010 Comment
Direct supply of wood biomass from forests and otherwooded land energy genera on
ktoe 3742.256 3900 8 (p.152)
Indirect supply of wood biomass ktoe n.a. n.a. 9 (p.152)Energy crops ktoe 0 0Agricultural by-products / processed residues and fisheryby-products
ktoe 0 0
Biomass from waste ktoe 0 0Others ktoe 0 0Total biomass for hea ng and electricity* ktoe 3742.256 3900
Biomass supply for transport Unit 2009 2010 Comment
Common arable crops for biofuels ktoe n.a. n.a.Energy crops and short rota on trees for biofuels ktoe 0 0Others ktoe 0 0Total biomass for transport* ktoe 0 0
Total biomass for all sectors* ktoe 3742.256 3900
Biomass supply for hea ng and electricity Raw material imported from EU
Unit 2009 2010 CommentDirect supply of wood biomass from forests and otherwooded land energy genera on
ktoe 0 82 8 (p.152)
Indirect supply of wood biomass ktoe n.a. n.a. 9 (p.152)Energy crops ktoe 0 0Agricultural by-products / processed residues and fisheryby-products
ktoe 0 0
Biomass from waste ktoe 0 0Others ktoe 0 0Total biomass for hea ng and electricity* ktoe 0 82
Biomass supply for transport Unit 2009 2010 Comment
Common arable crops for biofuels ktoe n.a. n.a.Energy crops and short rota on trees for biofuels ktoe 0 0Others ktoe 0 0Total biomass for transport* ktoe 0 0
Total biomass for all sectors* ktoe 0 82
Biomass supply for hea ng and electricity Raw material imported from non-EU
Unit 2009 2010 CommentDirect supply of wood biomass from forests and otherwooded land energy genera on
ktoe 0 0 8 (p.152)
Indirect supply of wood biomass ktoe 0 0 9 (p.152)Energy crops ktoe 0 0Agricultural by-products / processed residues and fisheryby-products
ktoe 0 0
Biomass from waste ktoe 0 0Others ktoe 0 0Total biomass for hea ng and electricity* ktoe 0 0
Biomass supply for transport Unit 2009 2010 Comment
Common arable crops for biofuels ktoe n.a. n.a.Energy crops and short rota on trees for biofuels ktoe 0 0Others ktoe 0 0Total biomass for transport* ktoe 0 0
Total biomass for all sectors* ktoe 0 0
* The values indicated with ‘*’ are calculated values and have not been men oned in the Progress Reportsas such.
Table 195: Romanian PR Table 4:Biomass supply for hea ng and
electricity (see Table 7 of theNREAP)
150

Unit 2009 2010 Comment
Land used for common arable crops and oil seeds ha 5929 3660.9 10 (p.152)Land used for short rota on trees ha n.a. n.a.Land used for other energy crops such as grasses ha n.a. n.a.
Table 196: Romanian PR Table 4a:Current domes c agriculturalland use for produc on of cropsdedicated to energy produc on(see Table 8 of the NREAP)
Unit 2009 2010 Comment
Produc on - Fuel type X ktoe 0 0Consump on - Fuel type X ktoe 0 0Total produc on Art.21.2.biofuels ktoe 0 0Total consump on Art.21.2. biofuels ktoe 0 0Share of 21(2) fuels from total RES-T % 0 0
Table 197: Romanian PR Table 5:Produc on and consump on ofAr cle 21(2) biofuels (ktoe)
Unit 2009 2010 Comment
Total es mated net GHG emission saving from RES t CO2-eq 26156 27345Es mated net GHG saving from the use of RES-E t CO2-eq 15392 15891 11 (p.152)Es mated net GHG saving from the use of RES-H/C t CO2-eq 10764 11454 12 (p.152)Es mated net GHG saving from the use of RES-T t CO2-eq 0 0
Table 198: Romanian PR Table 6:Es mated GHG emission savingsfrom the use of renewable energy
Actual/es matedexcess produc on
Actual/es mateddeficit produc on
Comment
Renewable energy n.a. n.a. 13 (p.152)Origin/des na on n.a. n.a. 13 (p.152)Unit ktoe ktoe 13 (p.152)2010 982.097 n.a. 13 (p.152)2011 812.9 n.a. 13 (p.152)2012 700 n.a. 13 (p.152)2013 731 n.a. 13 (p.152)2014 775 n.a. 13 (p.152)2015 700 n.a. 13 (p.152)2016 642 n.a. 13 (p.152)2017 480 n.a. 13 (p.152)2018 310 n.a. 13 (p.152)2019 0 n.a. 13 (p.152)2020 0 n.a. 13 (p.152)
Table 199: Romanian PR Table 7:Actual and es mated excessand/or deficit (-) produc on ofrenewable energy compared tothe indica ve trajectory whichcould be transferred to/fromother Member States and/orthird countries in Romania (ktoe)(see Table 9 of the NREAP)
ECN-E--13-076 Chapter 23. Romania 151
Comments for Romania
1: Calcula on details are shown in Annex 4 on page 48 of the Romanian Progress Report.2: The gross final consump on of energy from RES in transport (row C) comes exclusivelyfrom the consump on of electricity from RES in transport, included in row B. Therefore,row D = row A + row B.3: Excluding pumped. Calcula on details are shown in Annex 1 on page 37 of the Roma-nian Progress Report.4: Calcula on details are shown in Annex 3 on page 44 of the Romanian Progress Report.5: In the period under examina on, biofuels were actually used in transport, in accor-dance with the na onal reports sent to the Commission, but no legisla ve frameworkwas available with respect to the compliance with the sustainability criteria and the veri-fica on of such compliance.6: In the period under examina on, biofuels were actually used in transport, in accor-dance with the na onal reports sent to the Commission, but no legisla ve frameworkwas available with respect to the compliance with the sustainability criteria and the veri-fica on of such compliance.7: Calcula on details are shown in Annex 2 on page 41 of the Romanian Progress Report.8: Units not clearly men oned, differs from report text. The values men oned under ’di-rect supply’ possibly include ’indirect supply’.9: The values men oned under ’direct supply’ possibly include ’indirect supply’.10: Refers to corn grains, wheat, potatoes, sunflower and rapeseed. See Table 4a on page28 of he Romanian Progress Report for more detailed informa on.11: Excludes GHG emission savings from biomass-based electricity genera on.12: Refers to GHG emission savings from both electricity genera on from biomass andbiomass-based hea ng.13: A breakdown into renewable electricity, hea ng and cooling and renewable transporthas been presented in Table 7 on page 33 of the Romanian Progress Report.
152

24Slovakia
Unit 2009 2010 Comment
Renewable hea ng and cooling % 9.1 9.2Renewable electricity % 18.9 18.6Renewable Transport % 4 4Overall renewable energy share % 10.3 10.2Renewables through coopera on mechanism % 0 0Surplus for coopera on mechanism % 0 0
Table 200: Slovakian PR Table 1:The sectoral (electricity, hea ngand cooling, and transport) andoverall shares of energy fromrenewable sources in Slovakia(see Table 3 and Table 4a of theNREAP)
Unit 2009 2010 Comment
Gross final consump on of RES for hea ng and cooling ktoe 530 548Gross final consump on of electricity from RES ktoe 442 455Gross final consump on of energy from RES in transport ktoe 77 89Gross total RES consump on ktoe 1048 1092Transfer of RES to other Member States ktoe 0 0Transfer of RES from other Member States and 3rd countries ktoe 0 0RES consump on adjusted for target ktoe 1048 1092
Table 201: Slovakian PR Table 1a:Calcula on table for therenewable energy contribu on inSlovakia of each sector to finalenergy consump on (ktoe) (seeTable 4a of the NREAP)
ECN-E--13-076 Chapter 24. Slovakia 153

2009
Capacity Energy Comment
Renewable Electricity MW GWh ktoe %
Hydropower n.a. n.a. n.a. n.a.Hydropower (non pumped) 1597 4600 396 37.7%Hydropower <1 MW (non pumped) 26 75 6 0.6%Hydropower 1 MW - 10 MW (non pumped) 63 181 16 1.5%Hydropower >10 MW (non pumped) 1508 4344 374 35.6%Hydropower pumped storage 916 236 20 1.9%Hydropower mixed (normalised) n.a. n.a. n.a. n.a.Geothermal 0 0 0 0.0%Solar 0 0 0 0.0%Solar photovoltaic 0 0 0 0.0% 1 (p.158)Concentrated solar power 0 n.a. n.a. n.a.Tidal, wave and ocean energy 0 n.a. n.a. n.a.Wind power n.a. n.a. n.a. n.a.Onshore wind 3 6 1 0.0%Offshore wind 0 n.a. n.a. n.a.Biomass n.a. n.a. n.a. n.a.Solid biomass 160 515 44 4.2%Biogas 4 22 2 0.2%Bioliquids 0 0 0 0.0%Total 2680 5143 442 42.2%Total CHP 164 537 46 4.4%
Renewable Hea ng and Cooling ktoe % Comment
Geothermal 9 0.9%Solar thermal 0 0.0%Biomass 0 0.0% 2 (p.158)Solid biomass 511 48.7%Biogas 10 1.0%Bioliquids 0 0.0%Renewable energy from heat pumps 0 0.0%Aerothermal heat pumps 0 0.0%Geothermal heat pumps 0 0.0%Hydrothermal heat pumps 0 0.0%Total 530 50.5%Total district hea ng 68 6.5%Total biomass in households 39 3.7%
Renewable Transport ktoe % Comment
Bioethanol / bio-ETBE 14.5 1.4%Bioethanol / bio-ETBE Ar cle 21.2 0 0.0%Bioethanol / bio-ETBE imported 0 0.0%Biodiesel 54.9 5.2%Biodiesel Ar cle 21.2 0 0.0%Biodiesel imported 0 0.0%Hydrogen from renewables 0 0.0%Renewable electricity 7.4 0.7%Renewable electricity road transport 0 0.0%Renewable electricity non-road transport 7.4 0.7%Other biofuels 0 0.0%Other biofuels Ar cle 21.2 0 0.0%Total 76.8 7.3%
Table 202: Slovakian PR Table 1b,Table 1c and Table 1d: Total actual
contribu on (installed capacity,gross electricity genera on, finalenergy consump on) from eachrenewable energy technology in
Slovakia for 2009 to meet thebinding 2020 targets and the
indica ve interim trajectory forthe shares of energy from
renewable resources in electricity(see Table 10a of the NREAP),
hea ng and cooling (see Table 11of the NREAP) and in the
transport sector (see Table 12 ofthe NREAP)
154

2010
Capacity Energy Comment
Renewable Electricity MW GWh ktoe %
Hydropower n.a. n.a. n.a. n.a.Hydropower (non pumped) 1600 4612 397 37.8%Hydropower <1 MW (non pumped) 26 75 6 0.6%Hydropower 1 MW - 10 MW (non pumped) 66 190 16 1.6%Hydropower >10 MW (non pumped) 1508 4347 374 35.6%Hydropower pumped storage 916 394 34 3.2%Hydropower mixed (normalised) n.a. n.a. n.a. n.a.Geothermal 0 0 0 0.0%Solar n.a. n.a. n.a. n.a.Solar photovoltaic 186 11 1 0.1% 1 (p.158)Concentrated solar power 0 n.a. n.a. n.a.Tidal, wave and ocean energy 0 n.a. n.a. n.a.Wind power n.a. n.a. n.a. n.a.Onshore wind 3 6 1 0.0%Offshore wind 0 n.a. n.a. n.a.Biomass n.a. n.a. n.a. n.a.Solid biomass 169 636 55 5.2%Biogas 9 32 3 0.3%Bioliquids 0 0 0 0.0%Total 2883 5297 455 43.4%Total CHP 178 668 57 5.5%
Renewable Hea ng and Cooling ktoe % Comment
Geothermal 8 0.8%Solar thermal 0 0.0%Biomass 0 0.0% 2 (p.158)Solid biomass 533 50.8%Biogas 7 0.7%Bioliquids 0 0.0%Renewable energy from heat pumps 0 0.0%Aerothermal heat pumps 0 0.0%Geothermal heat pumps 0 0.0%Hydrothermal heat pumps 0 0.0%Total 548 52.2%Total district hea ng 103 9.8%Total biomass in households 43 4.1%
Renewable Transport ktoe % Comment
Bioethanol / bio-ETBE 15.1 1.4%Bioethanol / bio-ETBE Ar cle 21.2 0 0.0%Bioethanol / bio-ETBE imported 0 0.0%Biodiesel 66 6.3%Biodiesel Ar cle 21.2 0 0.0%Biodiesel imported 0 0.0%Hydrogen from renewables 0 0.0%Renewable electricity 7.9 0.8%Renewable electricity road transport 0 0.0%Renewable electricity non-road transport 7.9 0.8%Other biofuels 0 0.0%Other biofuels Ar cle 21.2 0 0.0%Total 89 8.5%
Table 203: Slovakian PR Table 1b,Table 1c and Table 1d: Total actualcontribu on (installed capacity,gross electricity genera on, finalenergy consump on) from eachrenewable energy technology inSlovakia for 2010 to meet thebinding 2020 targets and theindica ve interim trajectory forthe shares of energy fromrenewable resources in electricity(see Table 10a of the NREAP),hea ng and cooling (see Table 11of the NREAP) and in thetransport sector (see Table 12 ofthe NREAP)
ECN-E--13-076 Chapter 24. Slovakia 155

Biomass supply for hea ng and electricity Domes c raw material
Unit 2009 2010 Comment
Direct supply of wood biomass from forests and otherwooded land energy genera on
ktoe 218.5 228.1
Indirect supply of wood biomass ktoe 417 510Energy crops ktoe 6.1 7.2Agricultural by-products / processed residues and fisheryby-products
ktoe 0 0
Biomass from waste ktoe 8.2 9Others ktoe n.a. n.a.Total biomass for hea ng and electricity* ktoe 649.8 754.3
Biomass supply for transport Unit 2009 2010 Comment
Common arable crops for biofuels ktoe 84.8 n.a. 3 (p.158)Energy crops and short rota on trees for biofuels ktoe 0 0Others ktoe n.a. n.a.Total biomass for transport* ktoe 84.8 0
Total biomass for all sectors* ktoe 734.6 754.3
Biomass supply for hea ng and electricity Raw material imported from EU
Unit 2009 2010 CommentDirect supply of wood biomass from forests and otherwooded land energy genera on
ktoe 0 0
Indirect supply of wood biomass ktoe 0 0Energy crops ktoe 0 0Agricultural by-products / processed residues and fisheryby-products
ktoe 0 0
Biomass from waste ktoe 0 0Others ktoe 0 0Total biomass for hea ng and electricity* ktoe 0 0
Biomass supply for transport Unit 2009 2010 Comment
Common arable crops for biofuels ktoe n.a. n.a. 3 (p.158)Energy crops and short rota on trees for biofuels ktoe 0 0Others ktoe n.a. n.a.Total biomass for transport* ktoe 0 0
Total biomass for all sectors* ktoe 0 0
Biomass supply for hea ng and electricity Raw material imported from non-EU
Unit 2009 2010 CommentDirect supply of wood biomass from forests and otherwooded land energy genera on
ktoe 4.8 6
Indirect supply of wood biomass ktoe n.a. n.a.Energy crops ktoe n.a. n.a.Agricultural by-products / processed residues and fisheryby-products
ktoe n.a. n.a.
Biomass from waste ktoe n.a. n.a.Others ktoe n.a. n.a.Total biomass for hea ng and electricity* ktoe 4.8 6
Biomass supply for transport Unit 2009 2010 Comment
Common arable crops for biofuels ktoe n.a. n.a. 3 (p.158)Energy crops and short rota on trees for biofuels ktoe 0 0Others ktoe n.a. n.a.Total biomass for transport* ktoe 0 0
Total biomass for all sectors* ktoe 4.8 6
* The values indicated with ‘*’ are calculated values and have not been men oned in the Progress Reportsas such.
Table 204: Slovakian PR Table 4:Biomass supply for hea ng and
electricity (see Table 7 of theNREAP)
156

Unit 2009 2010 Comment
Land used for common arable crops and oil seeds ha 653000 714000 4 (p.158)Land used for short rota on trees ha 100 120Land used for other energy crops such as grasses ha 20 n.a. 5 (p.158)
Table 205: Slovakian PR Table 4a:Current domes c agriculturalland use for produc on of cropsdedicated to energy produc on(see Table 8 of the NREAP)
Unit 2009 2010 Comment
Produc on - Fuel type X ktoe 0 0Consump on - Fuel type X ktoe 0 0Total produc on Art.21.2.biofuels ktoe 0 0Total consump on Art.21.2. biofuels ktoe 0 0Share of 21(2) fuels from total RES-T % 0 0
Table 206: Slovakian PR Table 5:Produc on and consump on ofAr cle 21(2) biofuels (ktoe)
Unit 2009 2010 Comment
Total es mated net GHG emission saving from RES t CO2-eq 5715000 5951000Es mated net GHG saving from the use of RES-E t CO2-eq 3663000 3772000Es mated net GHG saving from the use of RES-H/C t CO2-eq 1863000 1927000Es mated net GHG saving from the use of RES-T t CO2-eq 189000 252000
Table 207: Slovakian PR Table 6:Es mated GHG emission savingsfrom the use of renewable energy
Actual/es matedexcess produc on
Actual/es mateddeficit produc on
Comment
Renewable energy n.a. n.a. 6 (p.158)Origin/des na on n.a. n.a. 6 (p.158)Unit ktoe ktoe 6 (p.158)2010 80 n.a. 6 (p.158)2011 181 n.a. 6 (p.158)2012 240 n.a. 6 (p.158)2013 228 n.a. 6 (p.158)2014 313 n.a. 6 (p.158)2015 305 n.a. 6 (p.158)2016 364 n.a. 6 (p.158)2017 269 n.a. 6 (p.158)2018 349 n.a. 6 (p.158)2019 190 n.a. 6 (p.158)2020 143 n.a. 6 (p.158)
Table 208: Slovakian PR Table 7:Actual and es mated excessand/or deficit (-) produc on ofrenewable energy compared tothe indica ve trajectory whichcould be transferred to/fromother Member States and/orthird countries in Slovakia (ktoe)(see Table 9 of the NREAP)
ECN-E--13-076 Chapter 24. Slovakia 157
Comments for Slovakia
1: Electricity genera on by photovoltaics in 2010 is extremely low. This might be an errorin the Slovak Progress Report.2: A value of zero ktoe is reported here while the breakdown is non-zero. Possibly this isbecause the fuel does not comply with applicable sustainability criteria.3: For the year 2009 the amount of rapeseed was 180000 ton (56 ktoe) and the amount ofmaize was 300000 ton (28.8 ktoe). For the year 2010 the amount of rapeseed was 170652ton (53 ktoe) and the amount of maize was 300000 ton (28.8 ktoe). The tables on pages10-11 in the Slovak Progress report detail the balance sheet for rapeseed and maize for aseries of years.4: For 2009 the total amount of dedicated energy crops amounted to 122000 ha (totalsurface 653000 ha for rapeseed, maize and wheat). The amount of rapeseed for energypurpose in that year amounted to 78000ha (total surface 167000ha), the amount ofmaizefor energy purpose to 44000 ha (total surface 144000 ha) and the amount of wheat forenergy purpose to 0 ha (total surface 342000 ha). For 2010 the total amount of dedicatedenergy crops amounted to 141000 ha (total surface 714000 ha for rapeseed, maize andwheat). The amount of rapeseed for energy purpose amounted to 87000 ha (total surface168000 ha), the amount of maize for energy purpose to 54000 ha (total surface 167000ha) and the amount of wheat for energy purpose amounted to 0 ha (total surface 379000ha).5: Regards miscanthus.6: The Ministry of the Economy is holding talks with other Member States on sta s caltransfers of energy from renewable sources. The rules, condi ons and instruc ons relat-ing to sta s cal transfers and planned par cipa on in joint projects will be published onthe Ministry’s website. Slovakia is not currently an cipa ng any joint projects within itsterritory. Slovakia does not favour joint support schemes.
158

25Slovenia
Unit 2009 2010 Comment
Renewable hea ng and cooling % 24.9 26.62Renewable electricity % 33.8 32.2Renewable Transport % 2.01 2.87Overall renewable energy share % 18.99 19.9Renewables through coopera on mechanism % 0 0Surplus for coopera on mechanism % 0 0
Table 209: Slovenian PR Table 1:The sectoral (electricity, hea ngand cooling, and transport) andoverall shares of energy fromrenewable sources in Slovenia(see Table 3 and Table 4a of theNREAP)
Unit 2009 2010 Comment
Gross final consump on of RES for hea ng and cooling ktoe 524 586Gross final consump on of electricity from RES ktoe 387 391Gross final consump on of energy from RES in transport ktoe 34.94 50.52Gross total RES consump on ktoe 942 1023Transfer of RES to other Member States ktoe 0 0Transfer of RES from other Member States and 3rd countries ktoe 0 0RES consump on adjusted for target ktoe 942 1023
Table 210: Slovenian PR Table 1a:Calcula on table for therenewable energy contribu on inSlovenia of each sector to finalenergy consump on (ktoe) (seeTable 4a of the NREAP)
ECN-E--13-076 Chapter 25. Slovenia 159

2009
Capacity Energy Comment
Renewable Electricity MW GWh ktoe %
Hydropower 1070 4315 371 n.a.Hydropower (non pumped) n.a. n.a. n.a. n.a.Hydropower <1 MW (non pumped) 118 160 14 n.a.Hydropower 1 MW - 10 MW (non pumped) 40 218 19 n.a.Hydropower >10 MW (non pumped) 912 4335 373 n.a.Hydropower pumped storage n.a. 0 0 n.a.Hydropower mixed (normalised) n.a. n.a. n.a. n.a.Geothermal n.a. n.a. n.a. n.a.Solar 4 4 0 n.a.Solar photovoltaic 4 4 0 n.a.Concentrated solar power n.a. n.a. n.a. n.a.Tidal, wave and ocean energy n.a. n.a. n.a. n.a.Wind power n.a. n.a. n.a. n.a.Onshore wind n.a. n.a. n.a. n.a.Offshore wind n.a. n.a. n.a. n.a.Biomass 52 193 17 n.a.Solid biomass 40 124 11 n.a.Biogas 12 69 6 n.a.Bioliquids n.a. n.a. n.a. n.a.Total 1126 4909 422 n.a.Total CHP n.a. 176 15 n.a.
Renewable Hea ng and Cooling ktoe % Comment
Geothermal 6 n.a.Solar thermal 4 n.a.Biomass 547 n.a.Solid biomass 512 n.a.Biogas 4 n.a.Bioliquids 30 n.a.Renewable energy from heat pumps n.a. n.a.Aerothermal heat pumps n.a. n.a.Geothermal heat pumps n.a. n.a.Hydrothermal heat pumps n.a. n.a.Total 557 n.a.Total district hea ng n.a. n.a.Total biomass in households 432 n.a.
Renewable Transport ktoe % Comment
Bioethanol / bio-ETBE n.a. n.a.Bioethanol / bio-ETBE Ar cle 21.2 n.a. n.a.Bioethanol / bio-ETBE imported n.a. n.a.Biodiesel n.a. n.a.Biodiesel Ar cle 21.2 n.a. n.a.Biodiesel imported n.a. n.a.Hydrogen from renewables n.a. n.a.Renewable electricity n.a. n.a.Renewable electricity road transport n.a. n.a.Renewable electricity non-road transport n.a. n.a.Other biofuels n.a. n.a.Other biofuels Ar cle 21.2 n.a. n.a.Total n.a. n.a. 1 (p.164)
Table 211: Slovenian PR Table 1b,Table 1c and Table 1d: Total actual
contribu on (installed capacity,gross electricity genera on, finalenergy consump on) from eachrenewable energy technology inSlovenia for 2009 to meet thebinding 2020 targets and the
indica ve interim trajectory forthe shares of energy from
renewable resources in electricity(see Table 10a of the NREAP),
hea ng and cooling (see Table 11of the NREAP) and in the
transport sector (see Table 12 ofthe NREAP)
160

2010
Capacity Energy Comment
Renewable Electricity MW GWh ktoe %
Hydropower 1254 4326 372 n.a.Hydropower (non pumped) n.a. n.a. n.a. n.a.Hydropower <1 MW (non pumped) 118 175 15 n.a.Hydropower 1 MW - 10 MW (non pumped) 42 214 18 n.a.Hydropower >10 MW (non pumped) 914 4122 354 n.a.Hydropower pumped storage 180 185 16 n.a.Hydropower mixed (normalised) n.a. n.a. n.a. n.a.Geothermal n.a. n.a. n.a. n.a.Solar 12 13 1 n.a.Solar photovoltaic 12 13 1 n.a.Concentrated solar power n.a. n.a. n.a. n.a.Tidal, wave and ocean energy n.a. n.a. n.a. n.a.Wind power n.a. n.a. n.a. n.a.Onshore wind n.a. n.a. n.a. n.a.Offshore wind n.a. n.a. n.a. n.a.Biomass 49 222 19 n.a.Solid biomass 35 125 11 n.a.Biogas 14 97 8 n.a.Bioliquids n.a. n.a. n.a. n.a.Total 1315 4930 424 n.a.Total CHP n.a. 214 18 n.a.
Renewable Hea ng and Cooling ktoe % Comment
Geothermal 26 n.a.Solar thermal 5 n.a.Biomass 603 n.a.Solid biomass 552 n.a.Biogas 5 n.a.Bioliquids 46 n.a.Renewable energy from heat pumps n.a. n.a.Aerothermal heat pumps n.a. n.a.Geothermal heat pumps n.a. n.a.Hydrothermal heat pumps n.a. n.a.Total 643 n.a.Total district hea ng n.a. n.a.Total biomass in households 461 n.a.
Renewable Transport ktoe % Comment
Bioethanol / bio-ETBE n.a. n.a.Bioethanol / bio-ETBE Ar cle 21.2 n.a. n.a.Bioethanol / bio-ETBE imported n.a. n.a.Biodiesel n.a. n.a.Biodiesel Ar cle 21.2 n.a. n.a.Biodiesel imported n.a. n.a.Hydrogen from renewables n.a. n.a.Renewable electricity n.a. n.a.Renewable electricity road transport n.a. n.a.Renewable electricity non-road transport n.a. n.a.Other biofuels n.a. n.a.Other biofuels Ar cle 21.2 n.a. n.a.Total n.a. n.a. 1 (p.164)
Table 212: Slovenian PR Table 1b,Table 1c and Table 1d: Total actualcontribu on (installed capacity,gross electricity genera on, finalenergy consump on) from eachrenewable energy technology inSlovenia for 2010 to meet thebinding 2020 targets and theindica ve interim trajectory forthe shares of energy fromrenewable resources in electricity(see Table 10a of the NREAP),hea ng and cooling (see Table 11of the NREAP) and in thetransport sector (see Table 12 ofthe NREAP)
ECN-E--13-076 Chapter 25. Slovenia 161

Biomass supply for hea ng and electricity Domes c raw material
Unit 2009 2010 Comment
Direct supply of wood biomass from forests and otherwooded land energy genera on
ktoe n.a. n.a. 2 (p.164)
Indirect supply of wood biomass ktoe n.a. n.a. 3 (p.164)Energy crops ktoe n.a. n.a.Agricultural by-products / processed residues and fisheryby-products
ktoe n.a. n.a.
Biomass from waste ktoe n.a. n.a. 4 (p.164)Others ktoe n.a. n.a.Total biomass for hea ng and electricity* ktoe n.a. n.a.
Biomass supply for transport Unit 2009 2010 Comment
Common arable crops for biofuels ktoe n.a. n.a.Energy crops and short rota on trees for biofuels ktoe n.a. n.a.Others ktoe n.a. n.a.Total biomass for transport* ktoe n.a. n.a.
Total biomass for all sectors* ktoe 0 0
Biomass supply for hea ng and electricity Raw material imported from EU
Unit 2009 2010 CommentDirect supply of wood biomass from forests and otherwooded land energy genera on
ktoe n.a. n.a. 2 (p.164)
Indirect supply of wood biomass ktoe n.a. n.a. 3 (p.164)Energy crops ktoe n.a. n.a.Agricultural by-products / processed residues and fisheryby-products
ktoe n.a. n.a.
Biomass from waste ktoe n.a. n.a. 4 (p.164)Others ktoe n.a. n.a.Total biomass for hea ng and electricity* ktoe n.a. n.a.
Biomass supply for transport Unit 2009 2010 Comment
Common arable crops for biofuels ktoe n.a. n.a.Energy crops and short rota on trees for biofuels ktoe n.a. n.a.Others ktoe n.a. n.a.Total biomass for transport* ktoe n.a. n.a.
Total biomass for all sectors* ktoe 0 0
Biomass supply for hea ng and electricity Raw material imported from non-EU
Unit 2009 2010 CommentDirect supply of wood biomass from forests and otherwooded land energy genera on
ktoe n.a. n.a. 2 (p.164)
Indirect supply of wood biomass ktoe n.a. n.a. 3 (p.164)Energy crops ktoe n.a. n.a.Agricultural by-products / processed residues and fisheryby-products
ktoe n.a. n.a.
Biomass from waste ktoe n.a. n.a. 4 (p.164)Others ktoe n.a. n.a.Total biomass for hea ng and electricity* ktoe n.a. n.a.
Biomass supply for transport Unit 2009 2010 Comment
Common arable crops for biofuels ktoe n.a. n.a.Energy crops and short rota on trees for biofuels ktoe n.a. n.a.Others ktoe n.a. n.a.Total biomass for transport* ktoe n.a. n.a.
Total biomass for all sectors* ktoe 0 0
* The values indicated with ‘*’ are calculated values and have not been men oned in the Progress Reportsas such.
Table 213: Slovenian PR Table 4:Biomass supply for hea ng and
electricity (see Table 7 of theNREAP)
162

Unit 2009 2010 Comment
Land used for common arable crops and oil seeds ha 4424 6464 5 (p.164)Land used for short rota on trees ha 4 4 6 (p.164)Land used for other energy crops such as grasses ha n.a. n.a.
Table 214: Slovenian PR Table 4a:Current domes c agriculturalland use for produc on of cropsdedicated to energy produc on(see Table 8 of the NREAP)
Unit 2009 2010 Comment
Produc on - Fuel type X ktoe n.a. n.a.Consump on - Fuel type X ktoe n.a. n.a.Total produc on Art.21.2.biofuels ktoe n.a. n.a.Total consump on Art.21.2. biofuels ktoe n.a. n.a.Share of 21(2) fuels from total RES-T % n.a. n.a.
Table 215: Slovenian PR Table 5:Produc on and consump on ofAr cle 21(2) biofuels (ktoe)
Unit 2009 2010 Comment
Total es mated net GHG emission saving from RES t CO2-eq 1308000 1505000Es mated net GHG saving from the use of RES-E t CO2-eq 1560 1580Es mated net GHG saving from the use of RES-H/C t CO2-eq 1200000 1350000Es mated net GHG saving from the use of RES-T t CO2-eq 107000 154100
Table 216: Slovenian PR Table 6:Es mated GHG emission savingsfrom the use of renewable energy
Actual/es matedexcess produc on
Actual/es mateddeficit produc on
Comment
Renewable energy n.a. n.a. 7 (p.164)Origin/des na on n.a. n.a. 7 (p.164)Unit ktoe ktoe 7 (p.164)2010 149 n.a. 7 (p.164)2011 0 n.a. 7 (p.164)2012 0 n.a. 7 (p.164)2013 0 n.a. 7 (p.164)2014 0 n.a. 7 (p.164)2015 0 n.a. 7 (p.164)2016 0 n.a. 7 (p.164)2017 0 n.a. 7 (p.164)2018 0 n.a. 7 (p.164)2019 0 n.a. 7 (p.164)2020 0 n.a. 7 (p.164)
Table 217: Slovenian PR Table 7:Actual and es mated excessand/or deficit (-) produc on ofrenewable energy compared tothe indica ve trajectory whichcould be transferred to/fromother Member States and/orthird countries in Slovenia (ktoe)(see Table 9 of the NREAP)
ECN-E--13-076 Chapter 25. Slovenia 163
Comments for Slovenia
1: Slovenia has no oil refineries. We import all liquid fuels, for transport as well as forhea ng. The liquid fuels for transport which we import frequently contain a small propor-on of biofuel.
2: For the amount of domes c rawmaterial the values include the quan ty of forest woodproduced for hea ng.3: The quan es of wood waste from the wood industry are included under the categoryof biomass from waste (municipal, industrial, etc.). We refer to waste and not to residuesand by-products.4: We have taken the biodegradable waste referred to in Annex 1 of the Decree on theTreatment of Biodegradable Waste (OGRS, No 62/2008) as waste from biomass. Direc-ve 2009/28/EC lays down that biomass also includes biodegradable waste. [Footnote e
(unclear what value it refers to) to Table 4 on page 16 of the Slovenian Progress Reportmen ons:] The value includes quan es of biomass from municipal and industrial wasteprocessed in 2009 and 2010 using the R1 process (use principally as fuel or for obtainingenergy, Annex 5 of the Decree on Waste Management (OGRS, No 34/2008)). The valuesalso include the quan es of waste imported (from EU and non-EU countries); however,the Sta s cal Office of the Republic of Slovenia does not handle precise data on the shareof imported biomass in the share of waste processed using the R1 process.5: Data for rapeseed.6: Test planta on of willow clones.7: Sta s cal transfers were not performed.
164

26Spain
Unit 2009 2010 Comment
Renewable hea ng and cooling % 12 11.9Renewable electricity % 27.2 29.2Renewable Transport % 3.5 4.8Overall renewable energy share % 12.5 13.5Renewables through coopera on mechanism % n.a. n.a.Surplus for coopera on mechanism % n.a. n.a.
Table 218: Spanish PR Table 1:The sectoral (electricity, hea ngand cooling, and transport) andoverall shares of energy fromrenewable sources in Spain (seeTable 3 and Table 4a of theNREAP)
Unit 2009 2010 Comment
Gross final consump on of RES for hea ng and cooling ktoe 3957 4258Gross final consump on of electricity from RES ktoe 6729 7334Gross final consump on of energy from RES in transport ktoe 1105 1466Gross total RES consump on ktoe 11741 13005Transfer of RES to other Member States ktoe n.a. n.a.Transfer of RES from other Member States and 3rd countries ktoe n.a. n.a.RES consump on adjusted for target ktoe 11741 13005
Table 219: Spanish PR Table 1a:Calcula on table for therenewable energy contribu on inSpain of each sector to finalenergy consump on (ktoe) (seeTable 4a of the NREAP)
ECN-E--13-076 Chapter 26. Spain 165

2009
Capacity Energy Comment
Renewable Electricity MW GWh ktoe %
Hydropower n.a. n.a. n.a. n.a.Hydropower (non pumped) 13158 30395 2613 22.2%Hydropower <1 MW (non pumped) 269 1181 102 0.9%Hydropower 1 MW - 10 MW (non pumped) 1640 3171 273 2.3%Hydropower >10 MW (non pumped) 11249 26043 2239 19.0%Hydropower pumped storage 5347 2831 243 2.1% 1 (p.170)Hydropower mixed (normalised) n.a. n.a. n.a. n.a.Geothermal 0 0 0 0.0%Solar 3770 6064 521 4.4%Solar photovoltaic 3488 5961 513 4.3%Concentrated solar power 282 103 9 0.1%Tidal, wave and ocean energy 0 0 0 0.0%Wind power 19176 38295 3293 27.9%Onshore wind 19176 38295 3293 27.9%Offshore wind 0 0 0 0.0%Biomass 774 3488 300 2.5%Solid biomass 597 2958 254 2.2%Biogas 177 530 46 0.4%Bioliquids 0 0 0 0.0%Total 36878 78242 6728 57.1%Total CHP 0 0 0 0.0%
Renewable Hea ng and Cooling ktoe % Comment
Geothermal 4 0.0%Solar thermal 156 1.3%Biomass 3782 32.1%Solid biomass 3750 31.8%Biogas 32 0.3%Bioliquids 0 0.0%Renewable energy from heat pumps 15 0.1%Aerothermal heat pumps 5 0.0%Geothermal heat pumps 10 0.1%Hydrothermal heat pumps 0 0.0%Total 3957 33.6%Total district hea ng 0 0.0%Total biomass in households 0 0.0%
Renewable Transport ktoe % Comment
Bioethanol / bio-ETBE 151 1.3%Bioethanol / bio-ETBE Ar cle 21.2 0 0.0%Bioethanol / bio-ETBE imported 0 0.0%Biodiesel 905 7.7%Biodiesel Ar cle 21.2 0 0.0%Biodiesel imported 0 0.0%Hydrogen from renewables 0 0.0%Renewable electricity 50 0.4%Renewable electricity road transport 0 0.0%Renewable electricity non-road transport 50 0.4%Other biofuels 0 0.0%Other biofuels Ar cle 21.2 0 0.0%Total 1105 9.4%
Table 220: Spanish PR Table 1b,Table 1c and Table 1d: Total actual
contribu on (installed capacity,gross electricity genera on, finalenergy consump on) from eachrenewable energy technology in
Spain for 2009 to meet thebinding 2020 targets and the
indica ve interim trajectory forthe shares of energy from
renewable resources in electricity(see Table 10a of the NREAP),
hea ng and cooling (see Table 11of the NREAP) and in the
transport sector (see Table 12 ofthe NREAP)
166

2010
Capacity Energy Comment
Renewable Electricity MW GWh ktoe %
Hydropower n.a. n.a. n.a. n.a.Hydropower (non pumped) 13188 31545 2712 23.0%Hydropower <1 MW (non pumped) 273 371 32 0.3%Hydropower 1 MW - 10 MW (non pumped) 1653 2944 253 2.1%Hydropower >10 MW (non pumped) 11262 28230 2427 20.6%Hydropower pumped storage 5347 3210 276 2.3% 1 (p.170)Hydropower mixed (normalised) n.a. n.a. n.a. n.a.Geothermal 0 0 0 0.0%Solar 4598 7105 611 5.2%Solar photovoltaic 3916 6413 551 4.7%Concentrated solar power 682 692 60 0.5%Tidal, wave and ocean energy 0 0 0 0.0%Wind power 20759 42732 3674 31.2%Onshore wind 20759 42732 3674 31.2%Offshore wind 0 0 0 0.0%Biomass 846 3894 335 2.8%Solid biomass 657 3241 279 2.4%Biogas 189 653 56 0.5%Bioliquids 0 0 0 0.0%Total 39391 85275 7332 62.2%Total CHP 246 1462 126 1.1%
Renewable Hea ng and Cooling ktoe % Comment
Geothermal 4 0.0%Solar thermal 183 1.6%Biomass 4054 34.4%Solid biomass 4015 34.1%Biogas 39 0.3%Bioliquids 0 0.0%Renewable energy from heat pumps 17 0.1%Aerothermal heat pumps 5 0.0%Geothermal heat pumps 12 0.1%Hydrothermal heat pumps 0 0.0%Total 4258 36.1%Total district hea ng 3 0.0%Total biomass in households 2055 17.4%
Renewable Transport ktoe % Comment
Bioethanol / bio-ETBE 231 2.0%Bioethanol / bio-ETBE Ar cle 21.2 0 0.0%Bioethanol / bio-ETBE imported 25 0.2%Biodiesel 1183 10.0%Biodiesel Ar cle 21.2 5 0.0%Biodiesel imported 748 6.3%Hydrogen from renewables 0 0.0%Renewable electricity 53 0.4%Renewable electricity road transport 0 0.0%Renewable electricity non-road transport 53 0.4%Other biofuels 0 0.0%Other biofuels Ar cle 21.2 0 0.0%Total 1466 12.4%
Table 221: Spanish PR Table 1b,Table 1c and Table 1d: Total actualcontribu on (installed capacity,gross electricity genera on, finalenergy consump on) from eachrenewable energy technology inSpain for 2010 to meet thebinding 2020 targets and theindica ve interim trajectory forthe shares of energy fromrenewable resources in electricity(see Table 10a of the NREAP),hea ng and cooling (see Table 11of the NREAP) and in thetransport sector (see Table 12 ofthe NREAP)
ECN-E--13-076 Chapter 26. Spain 167

Biomass supply for hea ng and electricity Domes c raw material
Unit 2009 2010 Comment
Direct supply of wood biomass from forests and otherwooded land energy genera on
ktoe 1238 1264
Indirect supply of wood biomass ktoe 1571 1632Energy crops ktoe 102 144Agricultural by-products / processed residues and fisheryby-products
ktoe 1561 1659
Biomass from waste ktoe 416 447Others ktoe n.a. n.a.Total biomass for hea ng and electricity* ktoe 4888 5146
Biomass supply for transport Unit 2009 2010 Comment
Common arable crops for biofuels ktoe 107 112 2 (p.170)Energy crops and short rota on trees for biofuels ktoe 0 0Others ktoe n.a. n.a.Total biomass for transport* ktoe 107 112
Total biomass for all sectors* ktoe 4995 5258
Biomass supply for hea ng and electricity Raw material imported from EU
Unit 2009 2010 CommentDirect supply of wood biomass from forests and otherwooded land energy genera on
ktoe 0 0
Indirect supply of wood biomass ktoe 0 0Energy crops ktoe 0 0Agricultural by-products / processed residues and fisheryby-products
ktoe 0 0
Biomass from waste ktoe 0 0Others ktoe n.a. n.a.Total biomass for hea ng and electricity* ktoe 0 0
Biomass supply for transport Unit 2009 2010 Comment
Common arable crops for biofuels ktoe 129 112 2 (p.170)Energy crops and short rota on trees for biofuels ktoe 0 0Others ktoe n.a. n.a.Total biomass for transport* ktoe 129 112
Total biomass for all sectors* ktoe 129 112
Biomass supply for hea ng and electricity Raw material imported from non-EU
Unit 2009 2010 CommentDirect supply of wood biomass from forests and otherwooded land energy genera on
ktoe 0 0
Indirect supply of wood biomass ktoe 0 0Energy crops ktoe 0 0Agricultural by-products / processed residues and fisheryby-products
ktoe 0 0
Biomass from waste ktoe 0 0Others ktoe n.a. n.a.Total biomass for hea ng and electricity* ktoe 0 0
Biomass supply for transport Unit 2009 2010 Comment
Common arable crops for biofuels ktoe 129 112 2 (p.170)Energy crops and short rota on trees for biofuels ktoe 0 0Others ktoe n.a. n.a.Total biomass for transport* ktoe 129 112
Total biomass for all sectors* ktoe 129 112
* The values indicated with ‘*’ are calculated values and have not been men oned in the Progress Reportsas such.
Table 222: Spanish PR Table 4:Biomass supply for hea ng and
electricity (see Table 7 of theNREAP)
168

Unit 2009 2010 Comment
Land used for common arable crops and oil seeds ha 2696600 2697000 3 (p.170)Land used for short rota on trees ha n.a. n.a. 4 (p.170)Land used for other energy crops such as grasses ha 7500 7300 5 (p.170)
Table 223: Spanish PR Table 4a:Current domes c agriculturalland use for produc on of cropsdedicated to energy produc on(see Table 8 of the NREAP)
Unit 2009 2010 Comment
Produc on - Fuel type X ktoe 117304 189472 6 (p.170)Consump on - Fuel type X ktoe 131232 153706 7 (p.170)Total produc on Art.21.2.biofuels ktoe 117304 189472Total consump on Art.21.2. biofuels ktoe 131232 153706Share of 21(2) fuels from total RES-T % n.a. n.a.
Table 224: Spanish PR Table 5:Produc on and consump on ofAr cle 21(2) biofuels (ktoe)
Unit 2009 2010 Comment
Total es mated net GHG emission saving from RES t CO2-eq 46470021 59774399 8 (p.170)Es mated net GHG saving from the use of RES-E t CO2-eq 29565872 39004622 9 (p.170)Es mated net GHG saving from the use of RES-H/C t CO2-eq 13324365 15984022 10 (p.170)Es mated net GHG saving from the use of RES-T t CO2-eq 3579784 4785755 11 (p.170)
Table 225: Spanish PR Table 6:Es mated GHG emission savingsfrom the use of renewable energy
Actual/es matedexcess produc on
Actual/es mateddeficit produc on
Comment
Renewable energy n.a. n.a. 12 (p.170)Origin/des na on n.a. n.a. 12 (p.170)Unit ktoe ktoe 12 (p.170)2010 n.a. n.a. 12 (p.170)2011 3337 n.a. 12 (p.170)2012 3956 n.a. 12 (p.170)2013 3388 n.a. 12 (p.170)2014 3878 n.a. 12 (p.170)2015 2804 n.a. 12 (p.170)2016 3469 n.a. 12 (p.170)2017 2049 n.a. 12 (p.170)2018 2793 n.a. 12 (p.170)2019 n.a. n.a. 12 (p.170)2020 839 n.a. 12 (p.170)
Table 226: Spanish PR Table 7:Actual and es mated excessand/or deficit (-) produc on ofrenewable energy compared tothe indica ve trajectory whichcould be transferred to/fromother Member States and/orthird countries in Spain (ktoe)(see Table 9 of the NREAP)
ECN-E--13-076 Chapter 26. Spain 169

Comments for Spain
1: Refers to both pure pumped hydropower and mixed plants.2: The considered crops are: wheat, barley, corn, soy, rape-seed, sunflower, palm andolive. Unit not explicitly men oned.3: Regards wheat (so and hard), sugar Beet, sunflower, rapeseed and soy. Detauiled sur-face areas per crop are available from Table 4a on page 51 (PDF page 55) of the SpanishProgress Report). Data for 2010 are provisional.4: Regards willow, poplar and black poplar.5: Regards sorghum. Data for 2010 are provisional.6: Regards biodiesel. On produc on of bioethanol according to Ar cle 21(2) no data areavailable.7: Regards biodiesel. On consump on of bioethanol according to Ar cle 21(2) no data areavailable.8: Es mate.9: Es mate. Calculated from actual renewable produc ons without adjustment, in rela-on to the emissions from a combined cycle natural gas plant.
10: Es mate.11: Es mate.12: No procedure has been established as of yet.
170
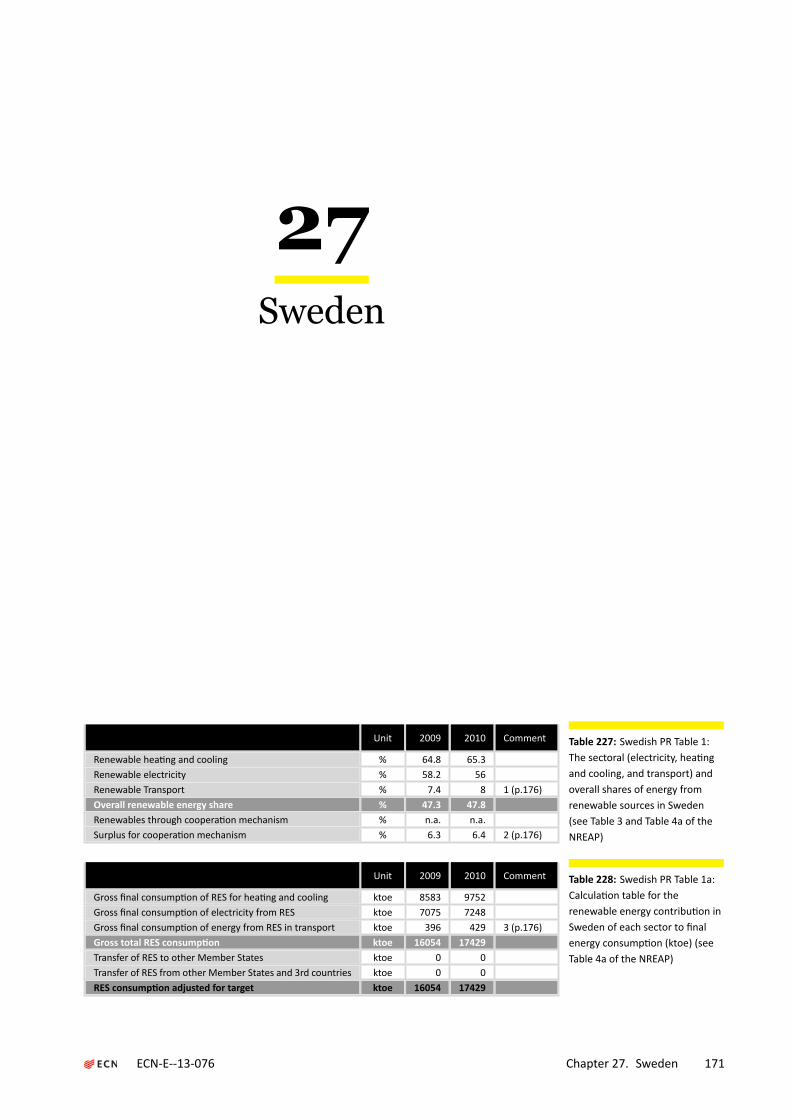
27Sweden
Unit 2009 2010 Comment
Renewable hea ng and cooling % 64.8 65.3Renewable electricity % 58.2 56Renewable Transport % 7.4 8 1 (p.176)Overall renewable energy share % 47.3 47.8Renewables through coopera on mechanism % n.a. n.a.Surplus for coopera on mechanism % 6.3 6.4 2 (p.176)
Table 227: Swedish PR Table 1:The sectoral (electricity, hea ngand cooling, and transport) andoverall shares of energy fromrenewable sources in Sweden(see Table 3 and Table 4a of theNREAP)
Unit 2009 2010 Comment
Gross final consump on of RES for hea ng and cooling ktoe 8583 9752Gross final consump on of electricity from RES ktoe 7075 7248Gross final consump on of energy from RES in transport ktoe 396 429 3 (p.176)Gross total RES consump on ktoe 16054 17429Transfer of RES to other Member States ktoe 0 0Transfer of RES from other Member States and 3rd countries ktoe 0 0RES consump on adjusted for target ktoe 16054 17429
Table 228: Swedish PR Table 1a:Calcula on table for therenewable energy contribu on inSweden of each sector to finalenergy consump on (ktoe) (seeTable 4a of the NREAP)
ECN-E--13-076 Chapter 27. Sweden 171

2009
Capacity Energy Comment
Renewable Electricity MW GWh ktoe %
Hydropower 16544 68326 5875 36.4% 4 (p.176)Hydropower (non pumped) 16544 65852 5662 35.0% 5 (p.176)Hydropower <1 MW (non pumped) 135 496 43 0.3% 6 (p.176)Hydropower 1 MW - 10 MW (non pumped) 788 3114 268 1.7% 7 (p.176)Hydropower >10 MW (non pumped) 15621 62242 5352 33.1% 8 (p.176)Hydropower pumped storage 108 125 11 0.1% 9 (p.176)Hydropower mixed (normalised) n.a. n.a. n.a. n.a.Geothermal n.a. n.a. n.a. n.a.Solar 9 7 1 0.0%Solar photovoltaic 9 7 1 0.0%Concentrated solar power n.a. n.a. n.a. n.a.Tidal, wave and ocean energy n.a. n.a. n.a. n.a.Wind power 1448 2485 214 1.3% 10 (p.176)Onshore wind 1285 2219 191 1.2%Offshore wind 163 266 23 0.1%Biomass 3813 11411 981 6.1% 11 (p.176)Solid biomass 3796 11105 955 5.9% 12 (p.176)Biogas 17 34 3 0.0%Bioliquids n.a. 272 23 0.1%Total 21814 82229 7070 43.8% 13 (p.176)Total CHP 3813 11411 981 6.1% 14 (p.176)
Renewable Hea ng and Cooling ktoe % Comment
Geothermal n.a. n.a.Solar thermal 10 0.1%Biomass 7780 48.1%Solid biomass 7557 46.8%Biogas 82 0.5%Bioliquids 142 0.9%Renewable energy from heat pumps 793 4.9% 15 (p.176)Aerothermal heat pumps n.a. n.a.Geothermal heat pumps n.a. n.a.Hydrothermal heat pumps n.a. n.a.Total 8583 53.1%Total district hea ng 2567 15.9%Total biomass in households 1046 6.5%
Renewable Transport ktoe % Comment
Bioethanol / bio-ETBE 198 1.2%Bioethanol / bio-ETBE Ar cle 21.2 1 0.0% 16 (p.176)Bioethanol / bio-ETBE imported 138.6 0.9% 17 (p.177)Biodiesel 162 1.0%Biodiesel Ar cle 21.2 0 0.0% 18 (p.177)Biodiesel imported 72.9 0.5% 19 (p.177)Hydrogen from renewables 0 0.0%Renewable electricity 110 0.7%Renewable electricity road transport 0 0.0% 20 (p.177)Renewable electricity non-road transport 110 0.7%Other biofuels 36 0.2% 21 (p.177)Other biofuels Ar cle 21.2 36 0.2% 22 (p.177)Total 506 3.1%
Table 229: Swedish PR Table 1b,Table 1c and Table 1d: Total actual
contribu on (installed capacity,gross electricity genera on, finalenergy consump on) from eachrenewable energy technology in
Sweden for 2009 to meet thebinding 2020 targets and the
indica ve interim trajectory forthe shares of energy from
renewable resources in electricity(see Table 10a of the NREAP),
hea ng and cooling (see Table 11of the NREAP) and in the
transport sector (see Table 12 ofthe NREAP)
172

2010
Capacity Energy Comment
Renewable Electricity MW GWh ktoe %
Hydropower 16624 68294 5872 36.3% 4 (p.176)Hydropower (non pumped) 16624 66398 5709 35.3% 5 (p.176)Hydropower <1 MW (non pumped) 143 545 47 0.3% 6 (p.176)Hydropower 1 MW - 10 MW (non pumped) 798 3253 280 1.7% 7 (p.176)Hydropower >10 MW (non pumped) 15683 62600 5383 33.3% 8 (p.176)Hydropower pumped storage 108 103 9 0.1% 9 (p.176)Hydropower mixed (normalised) n.a. n.a. n.a. n.a.Geothermal n.a. n.a. n.a. n.a.Solar 9 9 1 0.0%Solar photovoltaic 9 9 1 0.0%Concentrated solar power n.a. n.a. n.a. n.a.Tidal, wave and ocean energy n.a. n.a. n.a. n.a.Wind power 2018 3502 301 1.9% 10 (p.176)Onshore wind 1855 3052 262 1.6%Offshore wind 163 450 39 0.2%Biomass 3854 12191 1048 6.5% 11 (p.176)Solid biomass 3832 11976 1030 6.4% 12 (p.176)Biogas 22 36 3 0.0%Bioliquids n.a. 17 1 0.0%Total 22506 83996 7222 44.7% 13 (p.176)Total CHP 3854 12191 1048 6.5% 14 (p.176)
Renewable Hea ng and Cooling ktoe % Comment
Geothermal n.a. n.a.Solar thermal 10 0.1%Biomass 8949 55.4%Solid biomass 8713 53.9%Biogas 83 0.5%Bioliquids 153 0.9%Renewable energy from heat pumps 793 4.9% 15 (p.176)Aerothermal heat pumps n.a. n.a.Geothermal heat pumps n.a. n.a.Hydrothermal heat pumps n.a. n.a.Total 9752 60.3%Total district hea ng 3261 20.2%Total biomass in households 1046 6.5%
Renewable Transport ktoe % Comment
Bioethanol / bio-ETBE 203 1.3%Bioethanol / bio-ETBE Ar cle 21.2 2 0.0% 16 (p.176)Bioethanol / bio-ETBE imported 152.25 0.9% 17 (p.177)Biodiesel 178 1.1%Biodiesel Ar cle 21.2 4 0.0% 18 (p.177)Biodiesel imported 80.1 0.5% 19 (p.177)Hydrogen from renewables 0 0.0%Renewable electricity 140 0.9%Renewable electricity road transport 0 0.0% 20 (p.177)Renewable electricity non-road transport 140 0.9%Other biofuels 49 0.3% 21 (p.177)Other biofuels Ar cle 21.2 49 0.3% 22 (p.177)Total 569 3.5%
Table 230: Swedish PR Table 1b,Table 1c and Table 1d: Total actualcontribu on (installed capacity,gross electricity genera on, finalenergy consump on) from eachrenewable energy technology inSweden for 2010 to meet thebinding 2020 targets and theindica ve interim trajectory forthe shares of energy fromrenewable resources in electricity(see Table 10a of the NREAP),hea ng and cooling (see Table 11of the NREAP) and in thetransport sector (see Table 12 ofthe NREAP)
ECN-E--13-076 Chapter 27. Sweden 173

Biomass supply for hea ng and electricity Domes c raw material
Unit 2009 2010 Comment
Direct supply of wood biomass from forests and otherwooded land energy genera on
ktoe 2790 3780 23 (p.177)
Indirect supply of wood biomass ktoe 6030 6230 24 (p.177)Energy crops ktoe 20 20 25 (p.178)Agricultural by-products / processed residues and fisheryby-products
ktoe 130 140 26 (p.178)
Biomass from waste ktoe 820 1000 27 (p.178)Others ktoe 70 60Total biomass for hea ng and electricity* ktoe 9860 11230
Biomass supply for transport Unit 2009 2010 Comment
Common arable crops for biofuels ktoe 140 530 28 (p.178)Energy crops and short rota on trees for biofuels ktoe 0 0 29 (p.178)Others ktoe 41 n.a. 30 (p.178)Total biomass for transport* ktoe 181 530
Total biomass for all sectors* ktoe 10041 11760
Biomass supply for hea ng and electricity Raw material imported from EU
Unit 2009 2010 CommentDirect supply of wood biomass from forests and otherwooded land energy genera on
ktoe 130 130 23 (p.177)
Indirect supply of wood biomass ktoe 130 150 24 (p.177)Energy crops ktoe n.a. n.a. 25 (p.178)Agricultural by-products / processed residues and fisheryby-products
ktoe 70 70 26 (p.178)
Biomass from waste ktoe n.a. n.a. 27 (p.178)Others ktoe n.a. n.a.Total biomass for hea ng and electricity* ktoe 330 350
Biomass supply for transport Unit 2009 2010 Comment
Common arable crops for biofuels ktoe 390 530 28 (p.178)Energy crops and short rota on trees for biofuels ktoe 0 0 29 (p.178)Others ktoe n.a. n.a. 30 (p.178)Total biomass for transport* ktoe 390 530
Total biomass for all sectors* ktoe 720 880
Biomass supply for hea ng and electricity Raw material imported from non-EU
Unit 2009 2010 CommentDirect supply of wood biomass from forests and otherwooded land energy genera on
ktoe 85 95 23 (p.177)
Indirect supply of wood biomass ktoe 115 130 24 (p.177)Energy crops ktoe n.a. n.a. 25 (p.178)Agricultural by-products / processed residues and fisheryby-products
ktoe n.a. n.a. 26 (p.178)
Biomass from waste ktoe n.a. n.a. 27 (p.178)Others ktoe n.a. n.a.Total biomass for hea ng and electricity* ktoe 200 225
Biomass supply for transport Unit 2009 2010 Comment
Common arable crops for biofuels ktoe 390 530 28 (p.178)Energy crops and short rota on trees for biofuels ktoe 0 0 29 (p.178)Others ktoe n.a. n.a. 30 (p.178)Total biomass for transport* ktoe 390 530
Total biomass for all sectors* ktoe 590 755
* The values indicated with ‘*’ are calculated values and have not been men oned in the Progress Reportsas such.
Table 231: Swedish PR Table 4:Biomass supply for hea ng and
electricity (see Table 7 of theNREAP)
174

Unit 2009 2010 Comment
Land used for common arable crops and oil seeds ha 77000 85000 31 (p.178)Land used for short rota on trees ha 13000 12000 32 (p.178)Land used for other energy crops such as grasses ha 800 800 33 (p.178)
Table 232: Swedish PR Table 4a:Current domes c agriculturalland use for produc on of cropsdedicated to energy produc on(see Table 8 of the NREAP)
Unit 2009 2010 Comment
Produc on - Fuel type X ktoe 37 55 34 (p.178)Consump on - Fuel type X ktoe 37 55 35 (p.178)Total produc on Art.21.2.biofuels ktoe 37 55Total consump on Art.21.2. biofuels ktoe 37 55 36 (p.178)Share of 21(2) fuels from total RES-T % 7 10 37 (p.178)
Table 233: Swedish PR Table 5:Produc on and consump on ofAr cle 21(2) biofuels (ktoe)
Unit 2009 2010 Comment
Total es mated net GHG emission saving from RES t CO2-eq 84000000 89000000 38 (p.179)Es mated net GHG saving from the use of RES-E t CO2-eq 54000000 57000000 39 (p.179)Es mated net GHG saving from the use of RES-H/C t CO2-eq 29000000 31000000 40 (p.179)Es mated net GHG saving from the use of RES-T t CO2-eq 800000 900000 41 (p.179)
Table 234: Swedish PR Table 6:Es mated GHG emission savingsfrom the use of renewable energy
Actual/es matedexcess produc on
Actual/es mateddeficit produc on
Comment
Renewable energy n.a. n.a. 42 (p.179)Origin/des na on n.a. n.a. 42 (p.179)Unit ktoe ktoe 42 (p.179)2010 2450 n.a. 42 (p.179)2011 2430 n.a. 42 (p.179)2012 2530 n.a. 42 (p.179)2013 2280 n.a. 42 (p.179)2014 2380 n.a. 42 (p.179)2015 1940 n.a. 42 (p.179)2016 2040 n.a. 42 (p.179)2017 1430 n.a. 42 (p.179)2018 1530 n.a. 42 (p.179)2019 1000 n.a. 42 (p.179)2020 470 n.a. 42 (p.179)
Table 235: Swedish PR Table 7:Actual and es mated excessand/or deficit (-) produc on ofrenewable energy compared tothe indica ve trajectory whichcould be transferred to/fromother Member States and/orthird countries in Sweden (ktoe)(see Table 9 of the NREAP)
ECN-E--13-076 Chapter 27. Sweden 175
Comments for Sweden
1: Values include double-coun ng of biofuels made from wastes, residues, non-food cel-lulosic material and lignocellulosic material. Note however that only biofuels produced inSweden from the listed rawmaterials have been double-counted here (which includes bio-gas, HVO (hydrogenated vegetable oils) from crude tall oil and ethanol from residues fromsulphite pulp produc on (see Table 1d with footnotes on page 8 of the Swedish ProgressReport). It is therefore possible that this is an underes ma on. Actual values, withoutmul plica on factors: for 2009 the actual value is 6.9%, for 2010 it is 7.3%.2: For the indica ve trajectory, there are values in the Direc ve for the base year (2005)and then only for 2011-2012. In reality there are no values to compare with for 2009and 2010. The figures for 2005 and 2011 have been interpolated to determine the valuesin the table (these have been used to calculate the values in Table 7 on page 53 of theSwedish Progress Report).3: Note that this is the actual contribu on, not double-coun ng, and that renewable elec-tricity for forms of transport (see Table 1d on page 8 of the Swedish Progress Report) isnot included here but under ’B’, ’Gross final consump on of electricity from RES’).4: Values for electricity genera on have been normalised and exclude pumped storage.5: Values for electricity genera on have not been normalised.6: Values for electricity genera on have not been normalised.7: Values for electricity genera on have not been normalised.8: Values for electricity genera on have not been normalised.9: Values for electricity genera on have not been normalised.10: Normalised in accordance with Direc ve 2009/28/EG and Eurostat methodology thiscorresponds to 2544 GWh for 2009 and 3800 GWh for 2010.11: Includes renewable waste. The capacity figure [MW] reported here includes the totalcapacity for household refuse (municipal waste), even though only half is assumed to becomprised of renewables, which is the share reported as the contribu on to electricityproduc on.12: Includes renewable waste. The capacity figure [MW] reported here includes the totalcapacity for household refuse (municipal waste), even though only half is assumed to becomprised of renewables, which is the share reported as the contribu on to electricityproduc on.13: The capacity figure [MW] includes the total capacity for household refuse (municipalwaste), even though only half is assumed to be comprised of renewables, which is theshare reported as the contribu on to electricity produc on. For hydropower the valuesfor electricity genera on have been normalised and for wind power they have not beennormalised.14: The capacity figure [MW] includes the total capacity for household refuse (municipalwaste), even though only half is assumed to be comprised of renewables, which is theshare reported as the contribu on to electricity produc on.15: As a result of lacking data, for the year 2010 the same value has been used as for 2009,which is probably a conserva ve es mate as the trend has been a rising one.16: Note that the informa on (’at least 1’ for 2009 and ’at least 2’ for 2010) refers onlyto ethanol from sugar-rich liquor sourced from sulphite pulp produc on. (source: SEKAB,2011). Ethanol produced from residues from wine produc on is also used in Sweden, butits total contribu on is unknown, as is the origin of the raw materials (SEKAB howeverreports a figure for 2010 corresponding to 7 ktoe).17: Calcutated data, based on rela ve data in the Swedish Progress Report: ’around 70%’for 2009 and ’around 75%’ for 2010. Source: Swedish Energy Agency, 2010. Surveillancereport on tax exemp on for biofuels for 2009, Swedish Energy Agency, 2011. Surveillance
176

report on tax exemp on for biofuels for 2010, Swedish Energy Agency, 2011.18: Diesel from crude tall oil (termed HVO, hydrogenated vegetable oil). Source: PREEM,2011.19: Calcutated data, based on rela ve data in the Swedish Progress Report: ’around 45%’for both 2009 and 2010. Source: Swedish Energy Agency, 2010. Surveillance report ontax exemp on for biofuels for 2009, Swedish Energy Agency, 2011. Surveillance report ontax exemp on for biofuels for 2010, Swedish Energy Agency, 2011.20: Note that there is a small number of electric vehicles for road transport in Sweden. Atthe turn of the year 2010/2011 there were barely 200 electric vehicles, a small number ofelectric buses and approximately 130 electric lorries.21: Refers to biogas, see comment below,22: All biogas for transport is assumed to be produced from waste. The biogas used fortransport comes from sewage treatment plants and co-diges on plants that use cateringwaste, food waste, slaughterhouse waste, manure, slurry and to a lesser extent energycrops. For 2009, there is no reliable informa on on the amount of crops used for bio-gas produc on. The es mate that exists is approximately 3000 tonnes wet weight of en-ergy crops, which comprises 0.2% of the total amount of substrate used in biogas produc-on in sewage treatment plants and co-diges on plants (Swedish Energy Agency 2010,
Produc on and use of biogas in 2009 [Produk on och användning av biogas år 2009],ES2010:05). For 2010, the corresponding figures are around 39000 tonnes wet weightand 0.6% (Swedish Energy Agency 2010, Produc on and use of biogas in 2010 [Produk-on och användning av biogas år], ES2011:07), and the same assump ons were made for
that year.23: The following forest fuels are included in the repor ng: round mber and fuel wood,residues from tree felling such as branches, tops and stumps, forestry industry’s solidresidues such as shavings and bark, etc., forestry industry’s liquid residues such as blackliquors, crude tall oil, and tall oil pitch, recovered (recycled)wood such as packingmaterial,old furniture and demoli on mber and processed fuel wood such as pellets, brique esand wood powder. A variety of forest biofuel raw materials are some mes imported (in-cluding pellets, wood waste and shavings/sawdust). In such cases, the quan es are re-ported separately. Indirect imports also occur, that is, that the forest industry importsround mber for forestry purposes. When processing round mber, whether this is donemechanically in a sawmill or processed into pulp, residues are generated that can be usedfor energy purposes. Reliable sta s cs on this are lacking. Domes c and imported bio-fuel and biofuel rawmaterials are specified uniformly in thousands of tonnes of total solids(1000 tonnes TS). In Tables 7 and 7a in Sweden’s Ac on Plan, tonnes of TS (or dry ma er)and ktoe are also used as units of measurement.24: The following forest fuels are included in the repor ng: round mber and fuel wood,residues from tree felling such as branches, tops and stumps, forestry industry’s solidresidues such as shavings and bark, etc., forestry industry’s liquid residues such as blackliquors, crude tall oil, and tall oil pitch, recovered (recycled)wood such as packingmaterial,old furniture and demoli on mber and processed fuel wood such as pellets, brique esand wood powder. A variety of forest biofuel raw materials are some mes imported (in-cluding pellets, wood waste and shavings/sawdust). In such cases, the quan es are re-ported separately. Indirect imports also occur, that is, that the forest industry importsround mber for forestry purposes. When processing round mber, whether this is donemechanically in a sawmill or processed into pulp, residues are generated that can be usedfor energy purposes. Reliable sta s cs on this are lacking.25: The biofuels and biofuel raw materials included are: cereals, straw, short rota ontrees (salix), bio-oils (animal and/or vegetable oils and fats) and olive pits, sunflower pel-
ECN-E--13-076 Chapter 27. Sweden 177

lets, bean pods/husks, etc.26: The biofuels and biofuel raw materials included are: cereals, straw, short rota ontrees (salix), bio-oils (animal and/or vegetable oils and fats) and olive pits, sunflower pel-lets, bean pods/husks, etc.27: The informa on about refuse derived fuel (RDF) and biogas comes from the follow-ing sources: Swedish Energy Agency and Avfall Sverige AB. The renewable frac on of thewaste has been consistently assumed to be 50% (for reference and reasoning, see infor-ma on provided under ’point 12’ according to the Progress Report template, page 55 ofthe Swedish Progress Report). This propor on may be corrected once the basic data hasbeen analysedmore thoroughly and sta s cs in the area have been improved. The renew-able frac on of solid municipal waste, including bio-waste and the biodegradable frac onof industrial waste is specified in tonnes of total solids.28: The quan es specified are an es mate of the amounts of raw material used for theproduc on of various biofuels. The following raw materials are included in the repor ng:cereals, maize, sugar cane, oil plants, catering waste sorted at source, waste from food-stuffs, slaughterhouse waste, sewage sludge, industrial waste, tall oil and sulphite liquor.29: Neither energy crops nor short rota on trees are used for the produc on of biofuelin Sweden30: Amount of domes c rawmaterial: for the year 2009 this refers to 130 kton dry ma erof biomass-based waste for biogas and 20 kton dry ma er of residues/byproducts fromthe pulp and paper industry (sulphite liquor and tall oil), totalling 150 kton dry ma er.For the year 2010 this refers to 180 kton dry ma er of biomass-based waste for biogasand 50 kton dry ma er of residues/byproducts from the pulp and paper industry (sul-phite liquor and tall oil), totalling 230 kton dry ma er. Primary energy in domes c rawmaterial: for the year 2009 this refers to 40 ktoe of biomass-based waste for biogas and1 ktoe of residues/byproducts from the pulp and paper industry (sulphite liquor and talloil), totalling 41 ktoe. For the year 2010 this refers to 50 ktoe of biomass-based wastefor biogas and 6 ktoe of residues/byproducts from the pulp and paper industry (sulphiteliquor and tall oil), totalling 56 ktoe.31: For 2009 at least around 77000 ha (of which 72000 is wheat, tri cale, barley and rye,and at least 5000 is rape seed). For 2010 at least around 85000 ha (of which 83000 iswheat, tri cale, barley and rye, and at least 2000 is rape seed).32: For 2009 around 13000 ha (of which salix 12000, poplars 400, hybrid aspen 200). For2010 around 12000 ha (of which salix 11500, poplars 500, hybrid aspen 200).33: Both for 2009 and 2010 around 800 ha (Reed canary grass).34: For the year 2009 this refers to 36 ktoe of biogas and 1 ktoe of ethanol, totalling 37ktoe. For the year 2010 this refers to 49 ktoe of biogas, 2 ktoe of ethanol and 4 ktoe ofHVO (hydrogenated vegetable oils), totalling 55 ktoe. The ethanol originates from sugar-rich liquor sourced from sulphite pulp produc on (source: SEKAB, 2011). HVO has beenbased on crude tall oil (source: PREEM, 2011).35: For a breakdown into fuel types see informa on on produc on. Ethanol producedfrom residues from wine produc on is also used in Sweden, but complete informa onabout the origins of imported biofuels is lacking and its total contribu on is unknown(SEKAB however reports a figure for 2010 corresponding to 7 ktoe). In the next progressreport, therewill be informa on about the quan es of fuel produced from residues, etc.,via the system for sustainability criteria.36: For 2009 at least 37, for 2010 at least 55, see comment on consump on.37: For 2009 at least 7%, for 2010 at least 10%, see comment on consump on.38: The Swedish Progress Report provides two es mates for the theore cal net reduc onof greenhouse gases. According to the method using the Commission’s recommended
178

fossil comparators the value for 2009 is 84 Mt CO2-eq and for 2010 it is 89 Mt CO2-eq.Based on fossil comparators represented by the emission factors for the Swedish electric-ity and district hea ng mix the value for 2009 is 13 Mt CO2-eq and for 2010 it is 14 MtCO2-eq.39: According to the method using the Commission’s recommended fossil comparatorsthe value for 2009 is 54 Mt CO2-eq and for 2010 it is 57 Mt CO2-eq. Based on fossil com-parators represented by the emission factors for the Swedish electricity and district heat-ing mix the value for 2009 is 1.5 Mt CO2- eq and for 2010 it is 1.3 Mt CO2-eq.40: According to the method using the Commission’s recommended fossil comparatorsthe value for 2009 is 29 Mt CO2-eq and for 2010 it is 31 Mt CO2-eq. Based on fossil com-parators represented by the emission factors for the Swedish electricity and district heat-ing mix the value for 2009 is 11 Mt CO2- eq and for 2010 it is 12 Mt CO2-eq.41: Renewable electricity for transport is not included in this item but is instead includedin the es ma on of the net greenhouse gas emissions savings from the use of renewableelectricity.42: The Commission has asked for this informa on to be ‘dis nguished per type of re-newable energy and per origin/des na on of import/export’, which we have disregardedin this report because the data on which this report is based does not present the excessproduc on per type of renewable energy. For the year 2009 a value of 2130 ktoe has beenspecified.
ECN-E--13-076 Chapter 27. Sweden 179

180

28United Kingdom
Unit 2009 2010 Comment
Renewable hea ng and cooling % 1.7 1.8Renewable electricity % 6.6 7.4Renewable Transport % 2.5 2.9Overall renewable energy share % 3 3.3Renewables through coopera on mechanism % 0 0Surplus for coopera on mechanism % 0 0
Table 236: UK’s PR Table 1: Thesectoral (electricity, hea ng andcooling, and transport) andoverall shares of energy fromrenewable sources in UnitedKingdom (see Table 3 and Table4a of the NREAP)
Unit 2009 2010 Comment
Gross final consump on of RES for hea ng and cooling ktoe 961 1115Gross final consump on of electricity from RES ktoe 2138 2406Gross final consump on of energy from RES in transport ktoe 1041 1203Gross total RES consump on ktoe 4087 4668Transfer of RES to other Member States ktoe 0 0Transfer of RES from other Member States and 3rd countries ktoe 0 0RES consump on adjusted for target ktoe 4087 4668
Table 237: UK’s PR Table 1a:Calcula on table for therenewable energy contribu on inUnited Kingdom of each sector tofinal energy consump on (ktoe)(see Table 4a of the NREAP)
ECN-E--13-076 Chapter 28. United Kingdom 181

2009
Capacity Energy Comment
Renewable Electricity MW GWh ktoe %
Hydropower 1645 4910 422 10.2% 1 (p.186)Hydropower (non pumped) n.a. n.a. n.a. n.a.Hydropower <1 MW (non pumped) 72 223 19 0.5%Hydropower 1 MW - 10 MW (non pumped) 187 546 47 1.1%Hydropower >10 MW (non pumped) 1386 4142 356 8.6%Hydropower pumped storage 0 0 0 0.0% 2 (p.186)Hydropower mixed (normalised) 0 0 0 0.0%Geothermal 0 0 0 0.0%Solar n.a. n.a. n.a. n.a.Solar photovoltaic 27 20 2 0.0%Concentrated solar power 0 0 0 0.0%Tidal, wave and ocean energy 2.5 0.6 0 0.0%Wind power 4424 9333 802 19.4%Onshore wind 3483 7497 645 15.6%Offshore wind 941 1836 158 3.8%Biomass 1932 10596 911 22.0% 3 (p.186)Solid biomass 1932 10596 911 22.0% 4 (p.186)Biogas 0 0 0 0.0%Bioliquids 0 0 0 0.0%Total 8030 24861 2138 51.6% 5 (p.186)Total CHP n.a. n.a. n.a. n.a.
Renewable Hea ng and Cooling ktoe % Comment
Geothermal 0.8 0.0%Solar thermal 70 1.7%Biomass 863 20.8%Solid biomass n.a. n.a.Biogas n.a. n.a.Bioliquids n.a. n.a.Renewable energy from heat pumps 29 0.7%Aerothermal heat pumps n.a. n.a.Geothermal heat pumps n.a. n.a.Hydrothermal heat pumps n.a. n.a.Total 962 23.2%Total district hea ng n.a. n.a.Total biomass in households 322 7.8%
Renewable Transport ktoe % Comment
Bioethanol / bio-ETBE 163 3.9% 6 (p.186)Bioethanol / bio-ETBE Ar cle 21.2 0 0.0% 7 (p.186)Bioethanol / bio-ETBE imported 124 3.0%Biodiesel 826 19.9% 8 (p.186)Biodiesel Ar cle 21.2 0 0.0% 9 (p.186)Biodiesel imported 649 15.7%Hydrogen from renewables 0 0.0%Renewable electricity 52 1.3%Renewable electricity road transport 0.2 0.0%Renewable electricity non-road transport 52 1.3%Other biofuels 0 0.0%Other biofuels Ar cle 21.2 0 0.0%Total 1041 25.1%
Table 238: UK’s PR Table 1b, Table1c and Table 1d: Total actual
contribu on (installed capacity,gross electricity genera on, finalenergy consump on) from eachrenewable energy technology in
United Kingdom for 2009 to meetthe binding 2020 targets and theindica ve interim trajectory for
the shares of energy fromrenewable resources in electricity
(see Table 10a of the NREAP),hea ng and cooling (see Table 11
of the NREAP) and in thetransport sector (see Table 12 of
the NREAP)
182
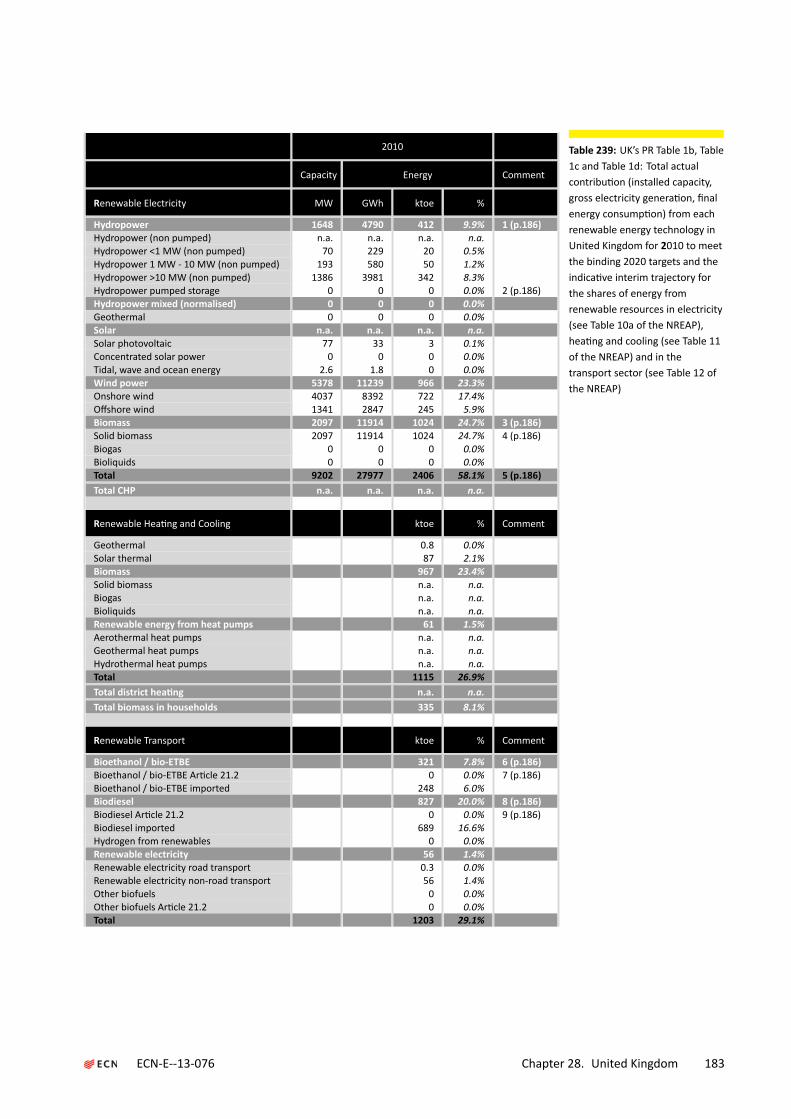
2010
Capacity Energy Comment
Renewable Electricity MW GWh ktoe %
Hydropower 1648 4790 412 9.9% 1 (p.186)Hydropower (non pumped) n.a. n.a. n.a. n.a.Hydropower <1 MW (non pumped) 70 229 20 0.5%Hydropower 1 MW - 10 MW (non pumped) 193 580 50 1.2%Hydropower >10 MW (non pumped) 1386 3981 342 8.3%Hydropower pumped storage 0 0 0 0.0% 2 (p.186)Hydropower mixed (normalised) 0 0 0 0.0%Geothermal 0 0 0 0.0%Solar n.a. n.a. n.a. n.a.Solar photovoltaic 77 33 3 0.1%Concentrated solar power 0 0 0 0.0%Tidal, wave and ocean energy 2.6 1.8 0 0.0%Wind power 5378 11239 966 23.3%Onshore wind 4037 8392 722 17.4%Offshore wind 1341 2847 245 5.9%Biomass 2097 11914 1024 24.7% 3 (p.186)Solid biomass 2097 11914 1024 24.7% 4 (p.186)Biogas 0 0 0 0.0%Bioliquids 0 0 0 0.0%Total 9202 27977 2406 58.1% 5 (p.186)Total CHP n.a. n.a. n.a. n.a.
Renewable Hea ng and Cooling ktoe % Comment
Geothermal 0.8 0.0%Solar thermal 87 2.1%Biomass 967 23.4%Solid biomass n.a. n.a.Biogas n.a. n.a.Bioliquids n.a. n.a.Renewable energy from heat pumps 61 1.5%Aerothermal heat pumps n.a. n.a.Geothermal heat pumps n.a. n.a.Hydrothermal heat pumps n.a. n.a.Total 1115 26.9%Total district hea ng n.a. n.a.Total biomass in households 335 8.1%
Renewable Transport ktoe % Comment
Bioethanol / bio-ETBE 321 7.8% 6 (p.186)Bioethanol / bio-ETBE Ar cle 21.2 0 0.0% 7 (p.186)Bioethanol / bio-ETBE imported 248 6.0%Biodiesel 827 20.0% 8 (p.186)Biodiesel Ar cle 21.2 0 0.0% 9 (p.186)Biodiesel imported 689 16.6%Hydrogen from renewables 0 0.0%Renewable electricity 56 1.4%Renewable electricity road transport 0.3 0.0%Renewable electricity non-road transport 56 1.4%Other biofuels 0 0.0%Other biofuels Ar cle 21.2 0 0.0%Total 1203 29.1%
Table 239: UK’s PR Table 1b, Table1c and Table 1d: Total actualcontribu on (installed capacity,gross electricity genera on, finalenergy consump on) from eachrenewable energy technology inUnited Kingdom for 2010 to meetthe binding 2020 targets and theindica ve interim trajectory forthe shares of energy fromrenewable resources in electricity(see Table 10a of the NREAP),hea ng and cooling (see Table 11of the NREAP) and in thetransport sector (see Table 12 ofthe NREAP)
ECN-E--13-076 Chapter 28. United Kingdom 183

Biomass supply for hea ng and electricity Domes c raw material
Unit 2009 2010 Comment
Direct supply of wood biomass from forests and otherwooded land energy genera on
ktoe 485.5 500.7
Indirect supply of wood biomass ktoe 601.9 723.5Energy crops ktoe n.a. n.a.Agricultural by-products / processed residues and fisheryby-products
ktoe 476.7 438.7
Biomass from waste ktoe 4029 4138.7Others ktoe n.a. n.a.Total biomass for hea ng and electricity* ktoe 5593.1 5801.6
Biomass supply for transport Unit 2009 2010 Comment
Common arable crops for biofuels ktoe n.a. n.a. 10 (p.186)Energy crops and short rota on trees for biofuels ktoe n.a. n.a.Others ktoe n.a. n.a.Total biomass for transport* ktoe n.a. n.a.
Total biomass for all sectors* ktoe 5593.1 5801.6
Biomass supply for hea ng and electricity Raw material imported from EU
Unit 2009 2010 CommentDirect supply of wood biomass from forests and otherwooded land energy genera on
ktoe n.a. n.a.
Indirect supply of wood biomass ktoe 309.1 244Energy crops ktoe 6.3 n.a.Agricultural by-products / processed residues and fisheryby-products
ktoe 99.2 69.2
Biomass from waste ktoe n.a. n.a.Others ktoe n.a. n.a.Total biomass for hea ng and electricity* ktoe 414.6 313.2
Biomass supply for transport Unit 2009 2010 Comment
Common arable crops for biofuels ktoe n.a. n.a. 10 (p.186)Energy crops and short rota on trees for biofuels ktoe n.a. n.a.Others ktoe n.a. n.a.Total biomass for transport* ktoe n.a. n.a.
Total biomass for all sectors* ktoe 414.6 313.2
Biomass supply for hea ng and electricity Raw material imported from non-EU
Unit 2009 2010 CommentDirect supply of wood biomass from forests and otherwooded land energy genera on
ktoe n.a. n.a.
Indirect supply of wood biomass ktoe n.a. 203Energy crops ktoe n.a. n.a.Agricultural by-products / processed residues and fisheryby-products
ktoe n.a. n.a.
Biomass from waste ktoe n.a. n.a.Others ktoe n.a. n.a.Total biomass for hea ng and electricity* ktoe n.a. 203
Biomass supply for transport Unit 2009 2010 Comment
Common arable crops for biofuels ktoe n.a. n.a. 10 (p.186)Energy crops and short rota on trees for biofuels ktoe n.a. n.a.Others ktoe n.a. n.a.Total biomass for transport* ktoe n.a. n.a.
Total biomass for all sectors* ktoe 0 203
* The values indicated with ‘*’ are calculated values and have not been men oned in the Progress Reportsas such.
Table 240: UK’s PR Table 4:Biomass supply for hea ng and
electricity (see Table 7 of theNREAP)
184

Unit 2009 2010 Comment
Land used for common arable crops and oil seeds ha 29560 72918 11 (p.186)Land used for short rota on trees ha n.a. n.a.Land used for other energy crops such as grasses ha n.a. n.a.
Table 241: UK’s PR Table 4a:Current domes c agriculturalland use for produc on of cropsdedicated to energy produc on(see Table 8 of the NREAP)
Unit 2009 2010 Comment
Produc on - Fuel type X ktoe n.a. n.a.Consump on - Fuel type X ktoe 165 298 12 (p.186)Total produc on Art.21.2.biofuels ktoe n.a. n.a.Total consump on Art.21.2. biofuels ktoe n.a. n.a.Share of 21(2) fuels from total RES-T % 17 26 13 (p.186)
Table 242: UK’s PR Table 5:Produc on and consump on ofAr cle 21(2) biofuels (ktoe)
Unit 2009 2010 Comment
Total es mated net GHG emission saving from RES t CO2-eq n.a. n.a.Es mated net GHG saving from the use of RES-E t CO2-eq 9300535 10449675Es mated net GHG saving from the use of RES-H/C t CO2-eq n.a. n.a.Es mated net GHG saving from the use of RES-T t CO2-eq 1823690 1917385
Table 243: UK’s PR Table 6:Es mated GHG emission savingsfrom the use of renewable energy
Actual/es matedexcess produc on
Actual/es mateddeficit produc on
Comment
Renewable energy n.a. n.a. 14 (p.187)Origin/des na on n.a. n.a. 14 (p.187)Unit ktoe ktoe 14 (p.187)2010 n.a. n.a. 14 (p.187)2011 n.a. n.a. 14 (p.187)2012 0 n.a. 14 (p.187)2013 n.a. n.a. 14 (p.187)2014 946 n.a. 14 (p.187)2015 n.a. n.a. 14 (p.187)2016 1290 n.a. 14 (p.187)2017 n.a. n.a. 14 (p.187)2018 1118 n.a. 14 (p.187)2019 n.a. n.a. 14 (p.187)2020 946 n.a. 14 (p.187)
Table 244: UK’s PR Table 7: Actualand es mated excess and/ordeficit (-) produc on ofrenewable energy compared tothe indica ve trajectory whichcould be transferred to/fromother Member States and/orthird countries in United Kingdom(ktoe) (see Table 9 of the NREAP)
ECN-E--13-076 Chapter 28. United Kingdom 185

Comments for the United Kingdom
1: Pumped storage hydropower has been included in the table but is not included in thehydropower or overall totals, as it is not a renewable resource.2: Pumped storage hydropower has been included in the table but is not included in thehydropower or overall totals, as it is not a renewable resource.3: The biofuel sustainability criteria (as set out in Ar cle 17(2) to (6) of the Direc ve werenot established at the me that biofuel reported in this table were supplied. As such, wehave reported all amounts of biofuel supplied in 2009 and 2010. During these years, theUK did have voluntary sustain ability criteria in place – known as the ‘qualifying standard’,which was broadly similar to the direc ve’s sustainability criteria.4: The biofuel sustainability criteria (as set out in Ar cle 17(2) to (6) of the Direc ve werenot established at the me that biofuel reported in this table were supplied. As such, wehave reported all amounts of biofuel supplied in 2009 and 2010. During these years, theUK did have voluntary sustain ability criteria in place – known as the ‘qualifying standard’,which was broadly similar to the direc ve’s sustainability criteria.5: Pumped storage hydropower has been included in the table but is not included in thehydropower or overall totals, as it is not a renewable resource.6: The biofuel sustainability criteria (as set out in Ar cle 17(2) to (6) of the Direc ve werenot established at the me that biofuel reported in this table were supplied. As such, wehave reported all amounts of biofuel supplied in 2009 and 2010. During these years, theUK did have voluntary sustainability criteria in place, known as the ‘qualifying standard’,which was broadly similar to the direc ve’s sustainability criteria.7: Double coun ng measures were not implemented in the UK in 2009 or 2010.8: The biofuel sustainability criteria (as set out in Ar cle 17(2) to (6) of the Direc ve werenot established at the me that biofuel reported in this table were supplied. As such, wehave reported all amounts of biofuel supplied in 2009 and 2010. During these years, theUK did have voluntary sustain ability criteria in place, known as the ’qualifying standard’,which was broadly similar to the direc ve’s sustainability criteria.9: Double coun ng measures were not implemented in the UK in 2009 or 2010.10: Refers to barley, cassava, corn, oilseed rape, palm, rye, soy, sugar beet, sugar cane,sunflower, tri cale, wheat, corn oil, molasses, municipal solid waste, sulphite, tallow,used cooking oil and other types. Detailed data have been provided in Table 4 on pages25-26 of the United Kingdom Progress Report.11: For the year 2009 this refers to 21536 ha of oilseed rape and 8024 ha of sugar beet,totalling 29560 ha. For the year 2010 this refers to 23020 ha of oilseed rape, 11332 ha ofsugar beet and 38566 ha of wheat, totalling 72918 ha. These figures represent es mateddomes c agriculture for biofuels supplied in the UK and do not include any agriculturerela ng to fuels which were exported.12: Refers to biofuels from by-products. Ar cle 21(2) of the Renewable Energy Direc vedid not have an equivalent in UK law during 2009 and 2010. However, there were mea-sures in place to dis nguish a similar class of materials – ‘by-products’. By-products aredefined as feedstocks that represent less than 10% of the farm or factory gate value.13: Refers to by-products, defined as feedstocks that represent less than 10% of the farmor factory gate value14: The data value for 2012 (0 ktoe) refers to the period 2011 - 2012 in the United King-dom Progress Report. The value for 2014 (11 TWh or 946 ktoe) refers to the period 2013- 2014, the value for 2016 (15 TWh or 1290 ktoe) refers to the period 2015 - 2016 and thevalue for 2018 (13 TWh or 1118 ktoe) refers to the period 2017 - 2018. For the year 2020the excess in the United Kingdom has been es mated at 11 TWh or 946 ktoe. No proce-dures have yet been established for sta s cal transfers, joint projects and joint support
186

scheme decision rules.
ECN-E--13-076 Chapter 28. United Kingdom 187

188

29All 27 Member States
Unit 2009 2010 Comment
Renewable hea ng and cooling % n.a. n.a.Renewable electricity % n.a. n.a.Renewable Transport % n.a. n.a.Overall renewable energy share % n.a. n.a.Renewables through coopera on mechanism % n.a. n.a.Surplus for coopera on mechanism % n.a. n.a.
Table 245: All 27 Member StatesPR Table 1: The sectoral(electricity, hea ng and cooling,and transport) and overall sharesof energy from renewablesources in all 27 Member States
Unit 2009 2010 Comment
Gross final consump on of RES for hea ng and cooling ktoe 69865 78260Gross final consump on of electricity from RES ktoe 51769 55897Gross final consump on of energy from RES in transport ktoe 12437 13963Gross total RES consump on ktoe 133262 147637Transfer of RES to other Member States ktoe 0 0Transfer of RES from other Member States and 3rd countries ktoe 0 0RES consump on adjusted for target ktoe 128509 142016
Table 246: All 27 Member StatesPR Table 1a: Calcula on table forthe renewable energycontribu on in all 27 MemberStates of each sector to finalenergy consump on (ktoe)
ECN-E--13-076 Chapter 29. All 27 Member States 189

2009
Capacity Energy Comment
Renewable Electricity MW GWh ktoe %
Hydropower 97546 296176 25467 18.8%Hydropower (non pumped) 91370 290965 25018 18.5%Hydropower <1 MW (non pumped) 2820 10453 899 0.7%Hydropower 1 MW - 10 MW (non pumped) 9805 33414 2873 2.1%Hydropower >10 MW (non pumped) 86593 279120 24000 17.8%Hydropower pumped storage 18955 20319 1747 1.3%Hydropower mixed (normalised) 20529 46880 4031 3.0%Geothermal 786 5598 481 0.4%Solar 15666 14041 1207 0.9%Solar photovoltaic 15481 14005 1204 0.9%Concentrated solar power 282 103 9 0.0%Tidal, wave and ocean energy 243 449 39 0.0%Wind power 74869 136262 11716 8.7%Onshore wind 72861 128880 11082 8.2%Offshore wind 2001 4090 352 0.3%Biomass 22673 107517 9245 6.8%Solid biomass 18023 83679 7195 5.3%Biogas 3625 19047 1638 1.2%Bioliquids 1188 8295 713 0.5%Total 224443 608566 52327 38.7%Total CHP 7797 47414 4077 3.0%
Renewable Hea ng and Cooling ktoe % Comment
Geothermal 573 0.4%Solar thermal 1270 0.9%Biomass 63240 46.8%Solid biomass 59924 44.4%Biogas 1448 1.1%Bioliquids 1721 1.3%Renewable energy from heat pumps 3843 2.8%Aerothermal heat pumps 2002 1.5%Geothermal heat pumps 725 0.5%Hydrothermal heat pumps 60 0.0%Total 69868 51.7%Total district hea ng 9979 7.4%Total biomass in households 30870 22.8%
Renewable Transport ktoe % Comment
Bioethanol / bio-ETBE 2295 1.7%Bioethanol / bio-ETBE Ar cle 21.2 24 0.0%Bioethanol / bio-ETBE imported 713 0.5%Biodiesel 9264 6.9%Biodiesel Ar cle 21.2 192 0.1%Biodiesel imported 2260 1.7%Hydrogen from renewables 0 0.0%Renewable electricity 1012 0.7%Renewable electricity road transport 6 0.0%Renewable electricity non-road transport 989 0.7%Other biofuels 246 0.2%Other biofuels Ar cle 21.2 42 0.0%Total 12913 9.6%
Table 247: All 27 Member StatesPR Table 1b, Table 1c and Table
1d: Total actual contribu on(installed capacity, gross
electricity genera on, finalenergy consump on) from eachrenewable energy technology inAll 27 Member States for 2009 to
meet the binding 2020 targetsand the indica ve interimtrajectory for the shares of
energy from renewable resourcesin electricity (see Table 10a of theNREAP), hea ng and cooling (seeTable 11 of the NREAP) and in thetransport sector (see Table 12 of
the NREAP)
190

2010
Capacity Energy Comment
Renewable Electricity MW GWh ktoe %
Hydropower 98476 298723 25686 19.0%Hydropower (non pumped) 91807 297024 25540 18.9%Hydropower <1 MW (non pumped) 2834 9931 854 0.6%Hydropower 1 MW - 10 MW (non pumped) 10067 33981 2922 2.2%Hydropower >10 MW (non pumped) 87003 285918 24585 18.2%Hydropower pumped storage 19303 21999 1892 1.4%Hydropower mixed (normalised) 20672 47694 4101 3.0%Geothermal 821 5619 483 0.4%Solar 27647 22480 1933 1.4%Solar photovoltaic 27318 21894 1883 1.4%Concentrated solar power 682 692 60 0.0%Tidal, wave and ocean energy 243 478 41 0.0%Wind power 84101 154429 13279 9.8%Onshore wind 81223 144893 12459 9.2%Offshore wind 2899 6084 523 0.4%Biomass 24792 120943 10399 7.7%Solid biomass 19158 91281 7849 5.8%Biogas 4440 23818 2048 1.5%Bioliquids 1382 6352 546 0.4%Total 248780 656231 56426 41.8%Total CHP 8553 54177 4658 3.4%
Renewable Hea ng and Cooling ktoe % Comment
Geothermal 525 0.4%Solar thermal 1488 1.1%Biomass 71758 53.1%Solid biomass 67449 49.9%Biogas 1929 1.4%Bioliquids 2154 1.6%Renewable energy from heat pumps 4310 3.2%Aerothermal heat pumps 2337 1.7%Geothermal heat pumps 866 0.6%Hydrothermal heat pumps 72 0.1%Total 79124 58.6%Total district hea ng 11115 8.2%Total biomass in households 36566 27.1%
Renewable Transport ktoe % Comment
Bioethanol / bio-ETBE 2786 2.1%Bioethanol / bio-ETBE Ar cle 21.2 36 0.0%Bioethanol / bio-ETBE imported 877 0.6%Biodiesel 10324 7.6%Biodiesel Ar cle 21.2 265 0.2%Biodiesel imported 3653 2.7%Hydrogen from renewables 0 0.0%Renewable electricity 1091 0.8%Renewable electricity road transport 7 0.0%Renewable electricity non-road transport 1068 0.8%Other biofuels 187 0.1%Other biofuels Ar cle 21.2 55 0.0%Total 14495 10.7%
Table 248: All 27 Member StatesPR Table 1b, Table 1c and Table1d: Total actual contribu on(installed capacity, grosselectricity genera on, finalenergy consump on) from eachrenewable energy technology inAll 27 Member States for 2010 tomeet the binding 2020 targetsand the indica ve interimtrajectory for the shares ofenergy from renewable resourcesin electricity (see Table 10a of theNREAP), hea ng and cooling (seeTable 11 of the NREAP) and in thetransport sector (see Table 12 ofthe NREAP)
ECN-E--13-076 Chapter 29. All 27 Member States 191
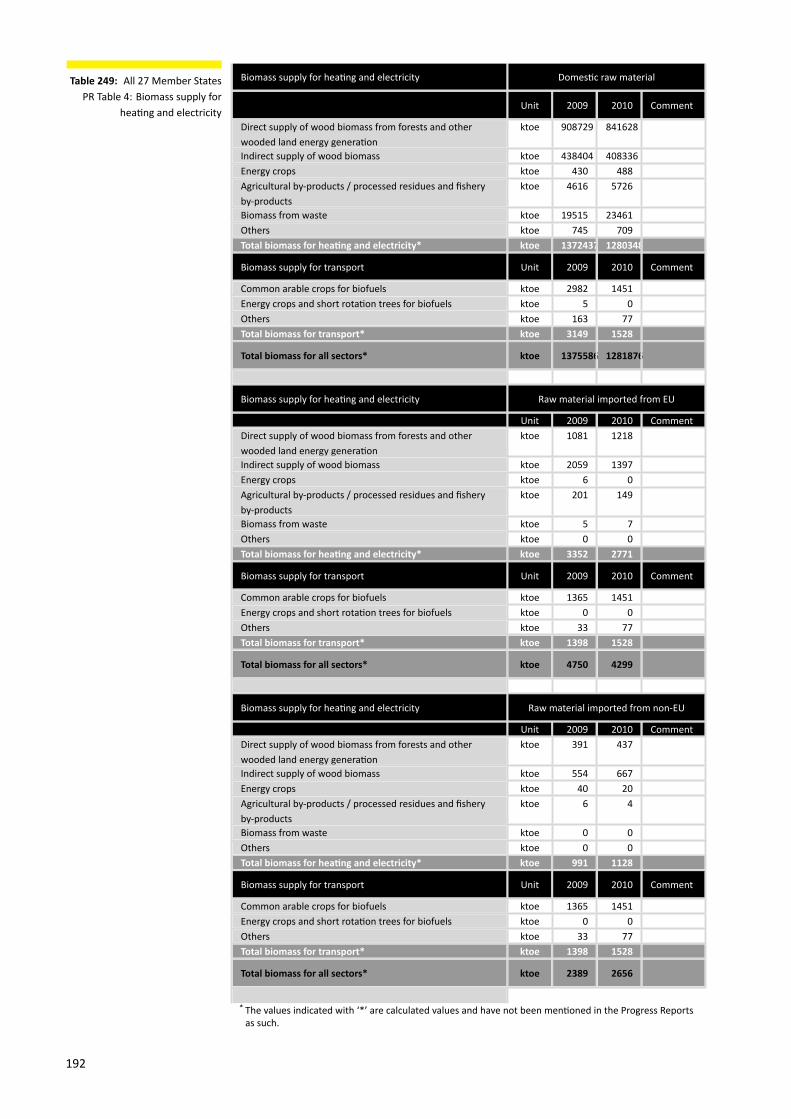
Biomass supply for hea ng and electricity Domes c raw material
Unit 2009 2010 Comment
Direct supply of wood biomass from forests and otherwooded land energy genera on
ktoe 908729 841628
Indirect supply of wood biomass ktoe 438404 408336Energy crops ktoe 430 488Agricultural by-products / processed residues and fisheryby-products
ktoe 4616 5726
Biomass from waste ktoe 19515 23461Others ktoe 745 709Total biomass for hea ng and electricity* ktoe 1372437 1280348
Biomass supply for transport Unit 2009 2010 Comment
Common arable crops for biofuels ktoe 2982 1451Energy crops and short rota on trees for biofuels ktoe 5 0Others ktoe 163 77Total biomass for transport* ktoe 3149 1528
Total biomass for all sectors* ktoe 1375586 1281876
Biomass supply for hea ng and electricity Raw material imported from EU
Unit 2009 2010 CommentDirect supply of wood biomass from forests and otherwooded land energy genera on
ktoe 1081 1218
Indirect supply of wood biomass ktoe 2059 1397Energy crops ktoe 6 0Agricultural by-products / processed residues and fisheryby-products
ktoe 201 149
Biomass from waste ktoe 5 7Others ktoe 0 0Total biomass for hea ng and electricity* ktoe 3352 2771
Biomass supply for transport Unit 2009 2010 Comment
Common arable crops for biofuels ktoe 1365 1451Energy crops and short rota on trees for biofuels ktoe 0 0Others ktoe 33 77Total biomass for transport* ktoe 1398 1528
Total biomass for all sectors* ktoe 4750 4299
Biomass supply for hea ng and electricity Raw material imported from non-EU
Unit 2009 2010 CommentDirect supply of wood biomass from forests and otherwooded land energy genera on
ktoe 391 437
Indirect supply of wood biomass ktoe 554 667Energy crops ktoe 40 20Agricultural by-products / processed residues and fisheryby-products
ktoe 6 4
Biomass from waste ktoe 0 0Others ktoe 0 0Total biomass for hea ng and electricity* ktoe 991 1128
Biomass supply for transport Unit 2009 2010 Comment
Common arable crops for biofuels ktoe 1365 1451Energy crops and short rota on trees for biofuels ktoe 0 0Others ktoe 33 77Total biomass for transport* ktoe 1398 1528
Total biomass for all sectors* ktoe 2389 2656
* The values indicated with ‘*’ are calculated values and have not been men oned in the Progress Reportsas such.
Table 249: All 27 Member StatesPR Table 4: Biomass supply for
hea ng and electricity
192

Unit 2009 2010 Comment
Land used for common arable crops and oil seeds ha 13174330 14486399 1 (p.194)Land used for short rota on trees ha 36702 55425Land used for other energy crops such as grasses ha 39407 838699
Table 250: All 27 Member StatesPR Table 4a: Current domes cagricultural land use forproduc on of crops dedicated toenergy produc on
Unit 2009 2010 Comment
Produc on - Fuel type X ktoe 117692 190094Consump on - Fuel type X ktoe 131890 154368Total produc on Art.21.2.biofuels ktoe 117434 189756Total consump on Art.21.2. biofuels ktoe 131413 153989Share of 21(2) fuels from total RES-T % n.a. n.a.
Table 251: All 27 Member StatesPR Table 5: Produc on andconsump on of Ar cle 21(2)biofuels (ktoe)
Unit 2009 2010 Comment
Total es mated net GHG emission saving from RES t CO2-eq 400943171 452824340Es mated net GHG saving from the use of RES-E t CO2-eq 261337624 290126590Es mated net GHG saving from the use of RES-H/C t CO2-eq 180309495 201963023Es mated net GHG saving from the use of RES-T t CO2-eq 23438603 26429139
Table 252: All 27 Member StatesPR Table 6: Es mated GHGemission savings from the use ofrenewable energy
Actual/es matedexcess produc on
Actual/es mateddeficit produc on
Comment
Renewable energy n.a. n.a.Origin/des na on n.a. n.a.Unit ktoe ktoe2010 9866 -28192011 18877 -452012 22445 -232013 19576 -382014 23955 -102015 17644 -452016 21649 -222017 14116 -752018 17451 -392019 4296 -662020 7418 -93
Table 253: All 27 Member StatesPR Table 7: Actual and es matedexcess and/or deficit (-)produc on of renewable energycompared to the indica vetrajectory which could betransferred to/from otherMember States and/or thirdcountries in all 27 Member States(ktoe)
ECN-E--13-076 Chapter 29. All 27 Member States 193

Comments for all 27 Member States
1: For Estonia in 2010 an average value of 60 ha has been assumed.
194

30Table 1: the sectoral and
overall RES shares
Unit 2009 2010 Comment
Austria % 32.3 32.2Belgium % 4.35 4.51Bulgaria % 17.4 20.1Cyprus % 15.6 17.7Czech Republic % n.a. n.a.Denmark % 29.56 30.64Estonia % 41.4 42.6Finland % 45.2 46.4France % 16.4 17.1Germany % 9.6 11Greece % 16.38 17.17Hungary % 10.53 11.08Ireland % 4.3 4.4Italy % 8.2 9.46Latvia % 47.9 43.8Lithuania % 34.46 33Luxembourg % 4.6 4.97Malta % 9.1 9.5Netherlands % 3 2.7Poland % 11.9 12Portugal % 37.86 34.45Romania % 23.46 24.22Slovakia % 9.1 9.2Slovenia % 24.9 26.62Spain % 12 11.9Sweden % 64.8 65.3United Kingdom % 1.7 1.8All 27 Member States % n.a. n.a.
Table 254: PR Table 1:Renewable hea ng and cooling(%)
ECN-E--13-076 Chapter 30. Table 1: the sectoral and overall RES shares 195

Unit 2009 2010 Comment
Austria % 67.4 65.3Belgium % 6.33 6.97Bulgaria % 11.4 12Cyprus % 0.6 1.4Czech Republic % n.a. n.a.Denmark % 28.87 31.04Estonia % 6.1 10.4Finland % 27.2 27.6France % 15 14.7Germany % 17.4 18.4Greece % 11.04 12.38Hungary % 6.96 7.09Ireland % 13.7 14.8Italy % 18.81 20.09Latvia % 4 42.1Lithuania % 5.9 7.4Luxembourg % 4.1 3.8Malta % 0.02 0.08Netherlands % 9.1 9.7Poland % 5.9 6.7Portugal % 38.4 41.2Romania % 33.46 32.06Slovakia % 18.9 18.6Slovenia % 33.8 32.2Spain % 27.2 29.2Sweden % 58.2 56United Kingdom % 6.6 7.4All 27 Member States % n.a. n.a.
Table 255: PR Table 1:Renewable electricity (%)
Unit 2009 2010 Comment
Austria % 8 7.9Belgium % 3.03 4.46Bulgaria % 0.3 0.6Cyprus % 2 2Czech Republic % n.a. n.a.Denmark % 0.24 0.26Estonia % 0.2 0.2Finland % 4 3.8France % 5.9 5.9Germany % 5.8 6.2Greece % 1.13 1.97Hungary % 4.19 4.72Ireland % 1.8 2.4Italy % 3.83 4.81Latvia % 1.1 3.3Lithuania % 4.22 3.59Luxembourg % 2.15 2.04Malta % 0.83 0.66Netherlands % 4.2 3Poland % 4.8 5.9Portugal % 3.87 5.59Romania % 0.67 0.68Slovakia % 4 4Slovenia % 2.01 2.87Spain % 3.5 4.8Sweden % 7.4 8 1 (p.176)United Kingdom % 2.5 2.9All 27 Member States % n.a. n.a.
Table 256: PR Table 1:Renewable Transport (%)
196

Unit 2009 2010 Comment
Austria % 30.9 30.8Belgium % 4.51 5.05Bulgaria % 11 12.6Cyprus % 5.4 5.8 1 (p.40)Czech Republic % 7.4 n.a.Denmark % 19.86 21.78Estonia % 22.7 24Finland % 32 33.1France % 12.4 12.8Germany % 10.2 11.3Greece % 8.43 9.73Hungary % 8.18 8.79Ireland % 5 5.5Italy % 8.86 10.11Latvia % 34.3 32.5Lithuania % 19.96 19.72Luxembourg % 2.93 2.95Malta % 0.88 0.9Netherlands % 4.1 3.7Poland % 8.9 9.5Portugal % 24.63 24.57Romania % 21.75 22.36 1 (p.152)Slovakia % 10.3 10.2Slovenia % 18.99 19.9Spain % 12.5 13.5Sweden % 47.3 47.8United Kingdom % 3 3.3All 27 Member States % n.a. n.a.
Table 257: PR Table 1: Overallrenewable energy share (%)
Unit 2009 2010 Comment
Austria % 0 0Belgium % 0 0Bulgaria % 0 0Cyprus % 0 0Czech Republic % n.a. n.a.Denmark % n.a. n.a.Estonia % 0 0Finland % 0 0France % 0 0Germany % n.a. n.a.Greece % 0 0Hungary % 0 0 1 (p.88)Ireland % n.a. n.a.Italy % 0 0Latvia % 0 0Lithuania % 0 0Luxembourg % n.a. n.a.Malta % 0 0Netherlands % 0 0Poland % 0 0Portugal % 0 0Romania % 0 0Slovakia % 0 0Slovenia % 0 0Spain % n.a. n.a.Sweden % n.a. n.a.United Kingdom % 0 0All 27 Member States % n.a. n.a.
Table 258: PR Table 1:Renewables through coopera onmechanism (%)
ECN-E--13-076 Chapter 30. Table 1: the sectoral and overall RES shares 197

Unit 2009 2010 Comment
Austria % 0 0Belgium % 0 0Bulgaria % 0 0Cyprus % 0 0Czech Republic % n.a. n.a.Denmark % n.a. n.a.Estonia % 0 0Finland % 0 0France % 0 0Germany % n.a. n.a.Greece % 0 0Hungary % 0 0 2 (p.88)Ireland % n.a. n.a.Italy % 0 0Latvia % n.a. n.a.Lithuania % n.a. n.a.Luxembourg % n.a. n.a.Malta % 0 0Netherlands % 0 0Poland % 0 0Portugal % 0 0Romania % 0 0Slovakia % 0 0Slovenia % 0 0Spain % n.a. n.a.Sweden % 6.3 6.4 2 (p.176)United Kingdom % 0 0All 27 Member States % n.a. n.a.
Table 259: PR Table 1: Surplusfor coopera on mechanism (%)
198

31Table 1a: RES consumption
in all sectors
Unit 2009 2010 Comment
Austria ktoe 3678 4070Belgium ktoe 839.48 987.48Bulgaria ktoe 772 923Cyprus ktoe 77.24 81.25Czech Republic ktoe n.a. n.a.Denmark ktoe 2296 2262Estonia ktoe 643 682Finland ktoe 5623 6480France ktoe 10903 12356Germany ktoe 10222 12441Greece ktoe 1098 1160Hungary ktoe 945 1055Ireland ktoe 212 229Italy ktoe 4500 5497Latvia ktoe 1190 1158Lithuania ktoe 876 881Luxembourg ktoe 48 56Malta ktoe 2.91 3.04Netherlands ktoe 806 827Poland ktoe 4199 4636Portugal ktoe 2590 2241Romania ktoe 3789.123 3975.4Slovakia ktoe 530 548Slovenia ktoe 524 586Spain ktoe 3957 4258Sweden ktoe 8583 9752United Kingdom ktoe 961 1115All 27 Member States ktoe 69864.753 78260.17
Table 260: PR Table 1a: Grossfinal consump on of RES forhea ng and cooling (ktoe)
ECN-E--13-076 Chapter 31. Table 1a: RES consump on in all sectors 199

Unit 2009 2010 Comment
Austria ktoe 3886 3948Belgium ktoe 493.98 596.23Bulgaria ktoe 345 384Cyprus ktoe 2.61 6.27Czech Republic ktoe n.a. n.a.Denmark ktoe 895 1065Estonia ktoe 47 87Finland ktoe 1969 2162 1 (p.64)France ktoe 6748 6928Germany ktoe 8653 9642Greece ktoe 703 909Hungary ktoe 248 259Ireland ktoe 339 369Italy ktoe 5390 5924Latvia ktoe 261 271Lithuania ktoe 59 70Luxembourg ktoe 23 24Malta ktoe 0.05 0.15Netherlands ktoe 925 1008Poland ktoe 752 894Portugal ktoe 1789 1994 1 (p.146)Romania ktoe 1469.446 1522.595Slovakia ktoe 442 455Slovenia ktoe 387 391Spain ktoe 6729 7334Sweden ktoe 7075 7248United Kingdom ktoe 2138 2406All 27 Member States ktoe 51769.086 55897.245
Table 261: PR Table 1a: Grossfinal consump on of electricity
from RES (ktoe)
Unit 2009 2010 Comment
Austria ktoe 728 716Belgium ktoe 228.49 345.49Bulgaria ktoe 8 17Cyprus ktoe 15.13 15.05Czech Republic ktoe n.a. n.a.Denmark ktoe 9.8 10.8Estonia ktoe 1 1Finland ktoe 166 167 2 (p.64)France ktoe 2620 2635Germany ktoe 2964 3209Greece ktoe 78 128Hungary ktoe 185 191Ireland ktoe 78 93Italy ktoe 1180 1466Latvia ktoe 12 35Lithuania ktoe 52 45Luxembourg ktoe 43 42Malta ktoe 0.66 0.55Netherlands ktoe 472 339Poland ktoe 662 887Portugal ktoe 246 349Romania ktoe 33.54 33.13Slovakia ktoe 77 89Slovenia ktoe 34.94 50.52Spain ktoe 1105 1466Sweden ktoe 396 429 3 (p.176)United Kingdom ktoe 1041 1203All 27 Member States ktoe 12436.56 13962.54
Table 262: PR Table 1a: Grossfinal consump on of energy from
RES in transport (ktoe)
200

Unit 2009 2010 Comment
Austria ktoe 8100 8539Belgium ktoe 1561.95 1929.21Bulgaria ktoe 1125 1324Cyprus ktoe 94.98 102.57Czech Republic ktoe n.a. n.a.Denmark ktoe 3191 3692Estonia ktoe 691 770Finland ktoe 7741 8788 3 (p.64)France ktoe 20114 21763Germany ktoe 21696 25130Greece ktoe 1879 2197Hungary ktoe 1361 1491Ireland ktoe 628 690Italy ktoe 11070 12887Latvia ktoe 1454 1456Lithuania ktoe 987 996Luxembourg ktoe 114 122Malta ktoe 3.61 3.73Netherlands ktoe 2103 2063Poland ktoe 5613 6417Portugal ktoe 4604 4561Romania ktoe 5258.051 5498.349 2 (p.152)Slovakia ktoe 1048 1092Slovenia ktoe 942 1023Spain ktoe 11741 13005Sweden ktoe 16054 17429United Kingdom ktoe 4087 4668All 27 Member States ktoe 133261.591 147636.859
Table 263: PR Table 1a: Grosstotal RES consump on (ktoe)
Unit 2009 2010 Comment
Austria ktoe 0 0Belgium ktoe n.a. n.a.Bulgaria ktoe 0 0Cyprus ktoe 0 0Czech Republic ktoe n.a. n.a.Denmark ktoe n.a. n.a.Estonia ktoe 0 0Finland ktoe 0 0France ktoe 0 0Germany ktoe 0 0Greece ktoe 0 0Hungary ktoe 0 0Ireland ktoe n.a. n.a.Italy ktoe 0 0Latvia ktoe 0 0Lithuania ktoe 0 0Luxembourg ktoe 0 0Malta ktoe 0 0Netherlands ktoe 0 0Poland ktoe 0 0Portugal ktoe 0 0Romania ktoe 0 0Slovakia ktoe 0 0Slovenia ktoe 0 0Spain ktoe n.a. n.a.Sweden ktoe 0 0United Kingdom ktoe 0 0All 27 Member States ktoe 0 0
Table 264: PR Table 1a: Transferof RES to other Member States(ktoe)
ECN-E--13-076 Chapter 31. Table 1a: RES consump on in all sectors 201

Unit 2009 2010 Comment
Austria ktoe 0 0Belgium ktoe n.a. n.a.Bulgaria ktoe 0 0Cyprus ktoe 0 0Czech Republic ktoe n.a. n.a.Denmark ktoe n.a. n.a.Estonia ktoe 0 0Finland ktoe 0 0France ktoe 0 0Germany ktoe 0 0Greece ktoe 0 0Hungary ktoe 0 0Ireland ktoe n.a. n.a.Italy ktoe 0 0Latvia ktoe 0 0Lithuania ktoe 0 0Luxembourg ktoe 0 0Malta ktoe 0 0Netherlands ktoe 0 0Poland ktoe 0 0Portugal ktoe 0 0Romania ktoe 0 0Slovakia ktoe 0 0Slovenia ktoe 0 0Spain ktoe n.a. n.a.Sweden ktoe 0 0United Kingdom ktoe 0 0All 27 Member States ktoe 0 0
Table 265: PR Table 1a: Transferof RES from other Member States
and 3rd countries (ktoe)
Unit 2009 2010 Comment
Austria ktoe 8100 8539Belgium ktoe n.a. n.a.Bulgaria ktoe 1125 1324Cyprus ktoe 94.98 102.57Czech Republic ktoe n.a. n.a.Denmark ktoe n.a. n.a.Estonia ktoe 691 770 1 (p.58)Finland ktoe 7741 8788 4 (p.64)France ktoe 20114 21763Germany ktoe 21696 25130Greece ktoe 1879 2197Hungary ktoe 1361 1491Ireland ktoe 628 690Italy ktoe 11070 12887Latvia ktoe 1454 1456Lithuania ktoe 987 996Luxembourg ktoe 114 122Malta ktoe 3.61 3.73Netherlands ktoe 2103 2063Poland ktoe 5613 6417Portugal ktoe 4604 4561Romania ktoe 5258.051 5498.349Slovakia ktoe 1048 1092Slovenia ktoe 942 1023Spain ktoe 11741 13005Sweden ktoe 16054 17429United Kingdom ktoe 4087 4668All 27 Member States ktoe 128508.641 142015.649
Table 266: PR Table 1a: RESconsump on adjusted for target
(ktoe)
202

32Table 1b: Actual RES-E
contributions
ECN-E--13-076 Chapter 32. Table 1b: Actual RES-E contribu ons 203

2009 2010
Capacity Energy Capacity Energy Comment
MW GWh MW GWh
Austria 10651 38757 10600 39237Belgium 1428.9 1801.3 1428.6 1720.9Bulgaria 2156 3598 2188 3709Cyprus 0 0 0 0Czech Republic n.a. n.a. n.a. n.a.Denmark 9 22 9 22Estonia 7 25 6 22Finland n.a. n.a. n.a. n.a.France 25449 69597 25449 68643 1 (p.70)Germany 4150 22400 4390 23500Greece 3201 4287 3215 4525 1 (p.82)Hungary 53 212 53 211Ireland 526 1109 529 931Italy 16458 42279 16806 43393 1 (p.100)Latvia 1536 2927 1576 3033 1 (p.108)Lithuania 116 419 116 419 1 (p.114)Luxembourg 34 106 34 108Malta 0 0 0 0Netherlands 37 100 37 101Poland 945.21 2355.574 937.042 2390.262Portugal 5080 11270 5102 11775Romania 6450 17360 6474 17573Slovakia n.a. n.a. n.a. n.a.Slovenia 1070 4315 1254 4326Spain n.a. n.a. n.a. n.a.Sweden 16544 68326 16624 68294 4 (p.176)United Kingdom 1645 4910 1648 4790 1 (p.186)All 27 Member States 97546.11 296175.874 98475.642 298723.162
Table 267: PR Table 1b:Hydropower (MW, GWh)
204

2009 2010
Capacity Energy Capacity Energy Comment
MW GWh MW GWh
Austria 7828 34653 7843 34647Belgium 118.9 372.1 118.6 372.4Bulgaria 1621 2957 1653 4330Cyprus 0 0 0 0Czech Republic n.a. n.a. n.a. n.a.Denmark 9 22 9 22Estonia 7 25 6 22Finland 3120 13898 3140 13877France 18464 61135 18464 60427Germany 0 0 0 0Greece 2502 4714 2516 6597Hungary 53 212 53 211Ireland 234 754 237 754Italy 14079 40207 14234 41255 2 (p.100)Latvia 1536 3457 1576 3520Lithuania 116 419 116 419Luxembourg 34 106 34 108Malta n.a. n.a. n.a. n.a.Netherlands n.a. n.a. n.a. n.a.Poland n.a. n.a. n.a. n.a.Portugal 3991 10127 4013 10584Romania 6358 17060 6382 17324Slovakia 1597 4600 1600 4612Slovenia n.a. n.a. n.a. n.a.Spain 13158 30395 13188 31545Sweden 16544 65852 16624 66398 5 (p.176)United Kingdom n.a. n.a. n.a. n.a.All 27 Member States 91369.9 290965.1 91806.6 297024.4
Table 268: PR Table 1b:Hydropower (non pumped) (MW,GWh)
ECN-E--13-076 Chapter 32. Table 1b: Actual RES-E contribu ons 205

2009 2010
Capacity Energy Capacity Energy Comment
MW GWh MW GWh
Austria 222 1610 134 1677Belgium 8.8 24.7 8.7 26.1Bulgaria 44 137 47 187Cyprus 0 0 0 0Czech Republic n.a. n.a. n.a. n.a.Denmark 5 13 5 13Estonia 7 25 6 22Finland 31 138 31 137France 446 1651 446 1601Germany 680 2500 700 2400Greece 32 115 34 130Hungary 4 21 4 20Ireland 18 53 20 57Italy 466 1699 523 1910 3 (p.100)Latvia 24 60 25 69Lithuania 17 61 17 61Luxembourg 2 6 2 8Malta n.a. n.a. n.a. n.a.Netherlands 0 0 0 0 1 (p.132)Poland 88.077 n.a. 90.119 n.a. 1 (p.138)Portugal 35 89 35 92Romania 70 115 76 126Slovakia 26 75 26 75Slovenia 118 160 118 175Spain 269 1181 273 371Sweden 135 496 143 545 6 (p.176)United Kingdom 72 223 70 229All 27 Member States 2819.877 10452.7 2833.819 9931.1
Table 269: PR Table 1b:Hydropower <1 MW (non
pumped) (MW, GWh)
206
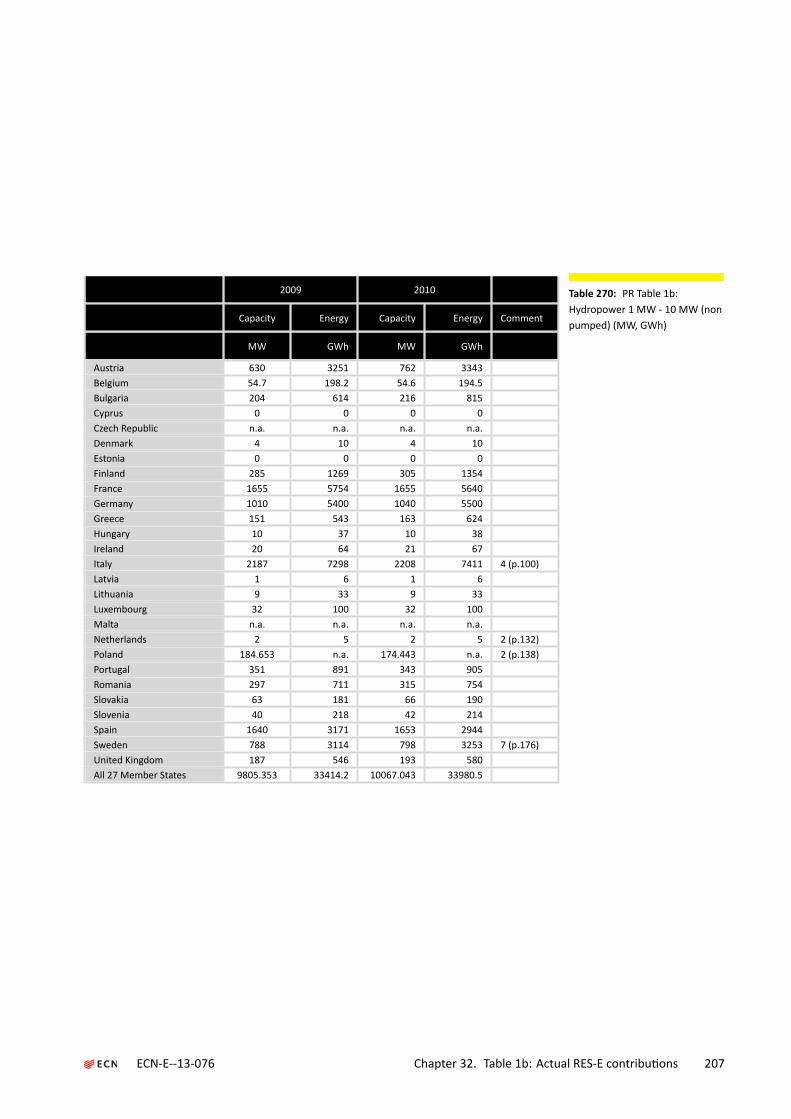
2009 2010
Capacity Energy Capacity Energy Comment
MW GWh MW GWh
Austria 630 3251 762 3343Belgium 54.7 198.2 54.6 194.5Bulgaria 204 614 216 815Cyprus 0 0 0 0Czech Republic n.a. n.a. n.a. n.a.Denmark 4 10 4 10Estonia 0 0 0 0Finland 285 1269 305 1354France 1655 5754 1655 5640Germany 1010 5400 1040 5500Greece 151 543 163 624Hungary 10 37 10 38Ireland 20 64 21 67Italy 2187 7298 2208 7411 4 (p.100)Latvia 1 6 1 6Lithuania 9 33 9 33Luxembourg 32 100 32 100Malta n.a. n.a. n.a. n.a.Netherlands 2 5 2 5 2 (p.132)Poland 184.653 n.a. 174.443 n.a. 2 (p.138)Portugal 351 891 343 905Romania 297 711 315 754Slovakia 63 181 66 190Slovenia 40 218 42 214Spain 1640 3171 1653 2944Sweden 788 3114 798 3253 7 (p.176)United Kingdom 187 546 193 580All 27 Member States 9805.353 33414.2 10067.043 33980.5
Table 270: PR Table 1b:Hydropower 1 MW - 10 MW (nonpumped) (MW, GWh)
ECN-E--13-076 Chapter 32. Table 1b: Actual RES-E contribu ons 207

2009 2010
Capacity Energy Capacity Energy Comment
MW GWh MW GWh
Austria 6976 29793 6947 29627Belgium 55.3 149.1 55.4 151.8Bulgaria 1373 2206 1390 3328Cyprus 0 0 0 0Czech Republic n.a. n.a. n.a. n.a.Denmark 0 0 0 0Estonia 0 0 0 0Finland 2804 12490 2804 12392France 16363 53730 16363 53186Germany 2460 14400 2660 15500Greece 2319 4056 2319 5843Hungary 39 154 39 153Ireland 196 633 196 625Italy 11427 31210 11503 31935 5 (p.100)Latvia 1511 3391 1550 3445Lithuania 90 325 90 325Luxembourg 0 0 0 0Malta n.a. n.a. n.a. n.a.Netherlands 35 95 35 96 3 (p.132)Poland 672.48 n.a. 672.48 n.a. 3 (p.138)Portugal 3605 9147 3635 9587Romania 5991 16235 5991 16444Slovakia 1508 4344 1508 4347Slovenia 912 4335 914 4122Spain 11249 26043 11262 28230Sweden 15621 62242 15683 62600 8 (p.176)United Kingdom 1386 4142 1386 3981All 27 Member States 86592.78 279120.1 87002.88 285917.8
Table 271: PR Table 1b:Hydropower >10 MW (non
pumped) (MW, GWh)
208

2009 2010
Capacity Energy Capacity Energy Comment
MW GWh MW GWh
Austria 2823 4104 2757 4590Belgium 1310 1429.3 1310 1348.5Bulgaria 788 852 788 929Cyprus 0 0 0 0Czech Republic n.a. n.a. n.a. n.a.Denmark 0 0 0 0Estonia 0 0 0 0Finland 0 0 0 0France 1808 4923 1808 4759Germany 110 400 150 500Greece 0 0 0 0Hungary 0 0 0 0Ireland 292 355 292 177Italy 2378 2072 2572 2138 6 (p.100)Latvia 0 0 0 0Lithuania 760 715 760 755Luxembourg 1134 834 1134 1468 1 (p.120)Malta n.a. n.a. n.a. n.a.Netherlands 0 0 0 0Poland n.a. n.a. n.a. n.a.Portugal 1089 1143 1089 1192Romania 92 300 92 250Slovakia 916 236 916 394Slovenia n.a. 0 180 185Spain 5347 2831 5347 3210 1 (p.170)Sweden 108 125 108 103 9 (p.176)United Kingdom 0 0 0 0 2 (p.186)All 27 Member States 18955 20319.3 19303 21998.5
Table 272: PR Table 1b:Hydropower pumped storage(MW, GWh)
ECN-E--13-076 Chapter 32. Table 1b: Actual RES-E contribu ons 209
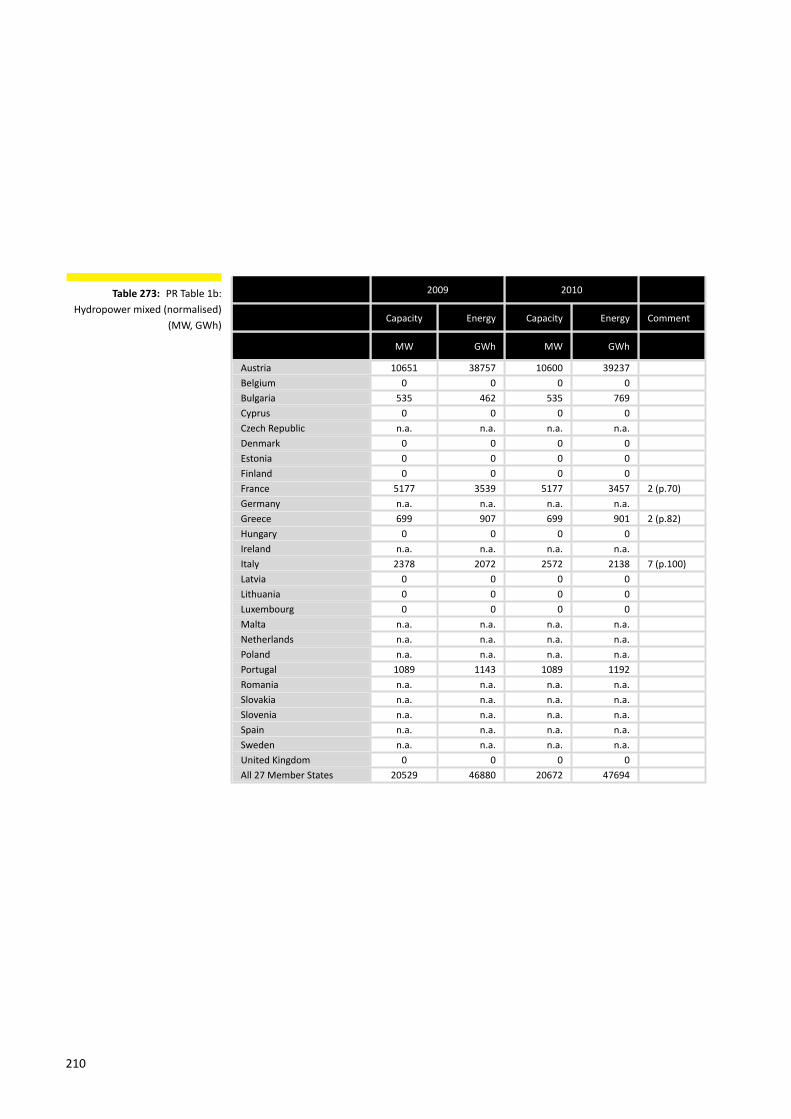
2009 2010
Capacity Energy Capacity Energy Comment
MW GWh MW GWh
Austria 10651 38757 10600 39237Belgium 0 0 0 0Bulgaria 535 462 535 769Cyprus 0 0 0 0Czech Republic n.a. n.a. n.a. n.a.Denmark 0 0 0 0Estonia 0 0 0 0Finland 0 0 0 0France 5177 3539 5177 3457 2 (p.70)Germany n.a. n.a. n.a. n.a.Greece 699 907 699 901 2 (p.82)Hungary 0 0 0 0Ireland n.a. n.a. n.a. n.a.Italy 2378 2072 2572 2138 7 (p.100)Latvia 0 0 0 0Lithuania 0 0 0 0Luxembourg 0 0 0 0Malta n.a. n.a. n.a. n.a.Netherlands n.a. n.a. n.a. n.a.Poland n.a. n.a. n.a. n.a.Portugal 1089 1143 1089 1192Romania n.a. n.a. n.a. n.a.Slovakia n.a. n.a. n.a. n.a.Slovenia n.a. n.a. n.a. n.a.Spain n.a. n.a. n.a. n.a.Sweden n.a. n.a. n.a. n.a.United Kingdom 0 0 0 0All 27 Member States 20529 46880 20672 47694
Table 273: PR Table 1b:Hydropower mixed (normalised)
(MW, GWh)
210

2009 2010
Capacity Energy Capacity Energy Comment
MW GWh MW GWh
Austria 1 2 1 1Belgium 0 0 0 0Bulgaria 0 0 0 0Cyprus 0 0 0 0Czech Republic n.a. n.a. n.a. n.a.Denmark 0 0 0 0Estonia 0 0 0 0Finland 0 0 0 0France 15 50 15 15Germany 8 20 8 30Greece 0 0 0 0Hungary 0 0 0 0Ireland n.a. n.a. n.a. n.a.Italy 737 5342 772 5376Latvia 0 0 0 0Lithuania 0 0 0 0Luxembourg 0 0 0 0Malta 0 0 0 0Netherlands 0 0 0 0Poland 0 0 0 0Portugal 25 184 25 197Romania 0 0 0 0Slovakia 0 0 0 0Slovenia n.a. n.a. n.a. n.a.Spain 0 0 0 0Sweden n.a. n.a. n.a. n.a.United Kingdom 0 0 0 0All 27 Member States 786 5598 821 5619
Table 274: PR Table 1b:Geothermal electricity (MW,GWh)
ECN-E--13-076 Chapter 32. Table 1b: Actual RES-E contribu ons 211

2009 2010
Capacity Energy Capacity Energy Comment
MW GWh MW GWh
Austria 51 49 93 89Belgium 218.4 169.4 660.7 557.5Bulgaria 2 3 25 15Cyprus 3.35 3.83 6.6 6.39Czech Republic n.a. n.a. n.a. n.a.Denmark 5 4 7 6Estonia 0 0 0 0Finland 6 4 7 5France 348 220 1072 676Germany 9910 6600 17320 11700Greece 53 54 203 167Hungary 1 1 2 1Ireland n.a. n.a. n.a. n.a.Italy 1144 676 3470 1906Latvia 0 0 0 0Lithuania 0 0 0 0Luxembourg 26 20 29 21Malta n.a. n.a. n.a. n.a.Netherlands n.a. n.a. n.a. n.a.Poland 0.001 1.328 0.033 1.672Portugal 115 160 132 201Romania 0.05 0.003 0.2 0.02Slovakia 0 0 n.a. n.a.Slovenia 4 4 12 13Spain 3770 6064 4598 7105Sweden 9 7 9 9United Kingdom n.a. n.a. n.a. n.a.All 27 Member States 15665.801 14040.561 27646.533 22479.582
Table 275: PR Table 1b: Solarelectricity (PV and CSP) (MW,
GWh)
212

2009 2010
Capacity Energy Capacity Energy Comment
MW GWh MW GWh
Austria 51 49 93 89Belgium 218.4 169.4 660.7 557.5Bulgaria 2 3 25 15Cyprus 3.35 3.83 6.6 6.39Czech Republic n.a. n.a. n.a. n.a.Denmark 5 4 7 6Estonia 0 0 0 0Finland 6 4 7 5France 348 220 1072 676Germany 9910 6600 17320 11700Greece 53 54 203 167Hungary 1 1 2 1Ireland 0.61 0.42 0.65 0.45Italy 1144 676 3470 1906Latvia 0 0 0 0Lithuania 0 0 0 0Luxembourg 26 20 29 21Malta 1.53 0.53 1.67 1.73Netherlands 68 46 88 60Poland 0.001 1.328 0.033 1.672Portugal 115 160 132 201Romania 0.05 0.003 0.2 0.02Slovakia 0 0 186 11 1 (p.158)Slovenia 4 4 12 13Spain 3488 5961 3916 6413Sweden 9 7 9 9United Kingdom 27 20 77 33All 27 Member States 15480.941 14004.511 27317.853 21893.762
Table 276: PR Table 1b: Solarphotovoltaic (PV) (MW, GWh)
ECN-E--13-076 Chapter 32. Table 1b: Actual RES-E contribu ons 213

2009 2010
Capacity Energy Capacity Energy Comment
MW GWh MW GWh
Austria 0 0 0 0Belgium 0 0 0 0Bulgaria 0 0 0 0Cyprus 0 0 0 0Czech Republic n.a. n.a. n.a. n.a.Denmark 0 0 0 0Estonia 0 0 0 0Finland 0 0 0 0France 0 0 0 0Germany 0 0 0 0Greece 0 0 0 0Hungary 0 0 0 0Ireland n.a. n.a. n.a. n.a.Italy 0 0 0 0Latvia 0 0 0 0Lithuania 0 0 0 0Luxembourg 0 0 0 0Malta n.a. n.a. n.a. n.a.Netherlands 0 0 0 0Poland 0 0 0 0Portugal 0 0 0 0Romania 0 0 0 0Slovakia 0 n.a. 0 n.a.Slovenia n.a. n.a. n.a. n.a.Spain 282 103 682 692Sweden n.a. n.a. n.a. n.a.United Kingdom 0 0 0 0All 27 Member States 282 103 682 692
Table 277: PR Table 1b:Concentrated solar power (CSP)
(MW, GWh)
214

2009 2010
Capacity Energy Capacity Energy Comment
MW GWh MW GWh
Austria 0 0 0 0Belgium 0 0 0 0Bulgaria 0 0 0 0Cyprus 0 0 0 0Czech Republic n.a. n.a. n.a. n.a.Denmark 0 0 0 0Estonia 0 0 0 0Finland 0 0 0 0France 240 448 240 476Germany 0 0 0 0Greece 0 0 0 0Hungary 0 0 0 0Ireland n.a. n.a. n.a. n.a.Italy 0 0 0 0Latvia 0 0 0 0Lithuania 0 0 0 0Luxembourg 0 0 0 0Malta 0 0 0 0Netherlands 0 0 0 0Poland 0 0 0 0Portugal 0 0 0 0Romania 0 0 0 0Slovakia 0 n.a. 0 n.a.Slovenia n.a. n.a. n.a. n.a.Spain 0 0 0 0Sweden n.a. n.a. n.a. n.a.United Kingdom 2.5 0.6 2.6 1.8All 27 Member States 242.5 448.6 242.6 477.8
Table 278: PR Table 1b: Tidal,wave and ocean energy(electricity) (MW, GWh)
ECN-E--13-076 Chapter 32. Table 1b: Actual RES-E contribu ons 215

2009 2010
Capacity Energy Capacity Energy Comment
MW GWh MW GWh
Austria 994 2024 977 2035Belgium 586.4 1092.7 919.5 1589.3Bulgaria 333 412 488 722 1 (p.34)Cyprus 0 0 82 31.37Czech Republic n.a. n.a. n.a. n.a.Denmark 3322 7029 3642 7729Estonia 104 204 108 247Finland 147 279 188 314France 4621 8087 5729 10499Germany 25720 41300 27210 43100Greece 1171 2671 1298 2905 3 (p.82)Hungary 203 338 293 518Ireland 1264 2936 1389 3228Italy 4898 6830 5814 8787Latvia 29 54 30 55 2 (p.108)Lithuania 98 174 133 244 2 (p.114)Luxembourg 43 63 44 55Malta n.a. n.a. n.a. n.a.Netherlands 2222 4481 2237 4503Poland 724.657 1164.18 1180.272 1700.29Portugal 3326 7000 3796 8395Romania 14.548 9.753 388.608 299.061Slovakia n.a. n.a. n.a. n.a.Slovenia n.a. n.a. n.a. n.a.Spain 19176 38295 20759 42732Sweden 1448 2485 2018 3502 10 (p.176)United Kingdom 4424 9333 5378 11239All 27 Member States 74868.605 136261.633 84101.38 154429.021
Table 279: PR Table 1b: Windpower (onshore and offshore)
(MW, GWh)
216

2009 2010
Capacity Energy Capacity Energy Comment
MW GWh MW GWh
Austria 994 2024 994 2035Belgium 554.9 1010.8 723 1399.7Bulgaria 333 237 488 681Cyprus 0 0 82 31.37Czech Republic n.a. n.a. n.a. n.a.Denmark 2780 5883 2877 6106Estonia 104 204 108 247Finland 147 279 188 314France 4621 8087 5729 10499Germany 25640 41200 27030 42900Greece 1171 2547 1298 2714Hungary 203 338 293 518Ireland 1239 n.a. 1364 n.a.Italy 4898 6830 5814 8787Latvia 29 50 30 49Lithuania 98 174 133 244Luxembourg 43 63 44 55Malta n.a. 0 n.a. 0Netherlands 1994 3762 2009 3737Poland 724.657 1164.18 1180.272 1700.29Portugal 3326 7000 3796 8395Romania 14.548 9.753 388.608 299.061Slovakia 3 6 3 6Slovenia n.a. n.a. n.a. n.a.Spain 19176 38295 20759 42732Sweden 1285 2219 1855 3052United Kingdom 3483 7497 4037 8392All 27 Member States 72861.105 128879.733 81222.88 144893.421
Table 280: PR Table 1b: Onshorewind (MW, GWh)
ECN-E--13-076 Chapter 32. Table 1b: Actual RES-E contribu ons 217

2009 2010
Capacity Energy Capacity Energy Comment
MW GWh MW GWh
Austria 0 0 0 0Belgium 31.5 82 196.5 189.6Bulgaria 0 0 0 0Cyprus 0 0 0 0Czech Republic n.a. n.a. n.a. n.a.Denmark 542 1147 765 1622Estonia 0 0 0 0Finland 0 0 0 0France 0 0 0 0Germany 70 40 180 210Greece 0 0 0 0Hungary 0 0 0 0Ireland 25 n.a. 25 n.a.Italy 0 0 0 0Latvia 0 0 0 0Lithuania 0 0 0 0Luxembourg 0 0 0 0Malta n.a. 0 n.a. 0Netherlands 228 719 228 765Poland 0 0 0 0Portugal 0 0 0 0Romania 0 0 0 0Slovakia 0 n.a. 0 n.a.Slovenia n.a. n.a. n.a. n.a.Spain 0 0 0 0Sweden 163 266 163 450United Kingdom 941 1836 1341 2847All 27 Member States 2000.5 4090 2898.5 6083.6
Table 281: PR Table 1b: Offshorewind (MW, GWh)
218

2009 2010
Capacity Energy Capacity Energy Comment
MW GWh MW GWh
Austria 1150 4370 1198 4554Belgium 900.7 4103.8 1010.7 4413.8Bulgaria 3 4 3 16Cyprus 4.25 26.52 7.9 35.13Czech Republic n.a. n.a. n.a. n.a.Denmark 1094 3352 1248 4632Estonia 37 313 67 740Finland 1807 10718 1910 10948France 914 4539 949 4876 3 (p.70)Germany 6070 30300 6650 33900Greece 41 218 43 216Hungary 509 2335 513.5 2291 3 (p.88)Ireland n.a. 22 n.a. 27Italy 1728 7557 2053 9440 8 (p.100)Latvia 10 49 16 66Lithuania 24 102 29 147Luxembourg 17 78 17 84Malta n.a. n.a. n.a. n.a.Netherlands 1028 6129 1205 7059Poland 323.378 5223.353 439.074 6303.59Portugal 442 2384 587 2904Romania n.a. 5.206 n.a. 69.472Slovakia n.a. n.a. n.a. n.a.Slovenia 52 193 49 222Spain 774 3488 846 3894Sweden 3813 11411 3854 12191 11 (p.176)United Kingdom 1932 10596 2097 11914 3 (p.186)All 27 Member States 22673.328 107516.879 24792.174 120942.992
Table 282: PR Table 1b: Biomassfor electricity (MW, GWh)
ECN-E--13-076 Chapter 32. Table 1b: Actual RES-E contribu ons 219

2009 2010
Capacity Energy Capacity Energy Comment
MW GWh MW GWh
Austria 684 2599 704 2674Belgium 638 3268.1 726.8 3575.9Bulgaria 0 0 0 0Cyprus 0 0 0 0Czech Republic n.a. n.a. n.a. n.a.Denmark 1017 3031 1168 4299Estonia 35 306 63 730Finland 1807 10686 1910 10859France 753 3654 774 3863Germany 3590 15700 3650 16000Greece 0 0 0 0Hungary 485 2239 489.5 2179 4 (p.88)Ireland n.a. 6 n.a. 9Italy 964 4444 944 4308 9 (p.100)Latvia 2 4 5 9Lithuania 16 87 16 116Luxembourg 8 25 8 28Malta n.a. 0 n.a. 0Netherlands 825 5122 992 5961Poland 252.49 4904.113 356.19 5905.21 4 (p.138)Portugal 422 2301 562 2804Romania n.a. 4.959 n.a. 69.227Slovakia 160 515 169 636Slovenia 40 124 35 125Spain 597 2958 657 3241Sweden 3796 11105 3832 11976 12 (p.176)United Kingdom 1932 10596 2097 11914 4 (p.186)All 27 Member States 18023.49 83679.172 19158.49 91281.337
Table 283: PR Table 1b: Solidbiomass for electricity (MW,
GWh)
220

2009 2010
Capacity Energy Capacity Energy Comment
MW GWh MW GWh
Austria 161 611 171 649Belgium 111.8 462.2 123.6 568.2Bulgaria 3 4 3 16Cyprus 4.25 26.52 7.9 35.13Czech Republic n.a. n.a. n.a. n.a.Denmark 77 320 80 333Estonia 2 7 4 10Finland 0 32 0 89France 161 885 175 1013Germany 2150 12600 2730 16200Greece 41 218 43 216Hungary 24 96 24 112Ireland n.a. 16 n.a. 18Italy 378 1665 508 2054 10 (p.100)Latvia 8 45 11 57Lithuania 8 15 13 31Luxembourg 9 53 9 56Malta n.a. 0 n.a. 0Netherlands 186 934 196 1044Poland 70.888 319.24 82.884 398.38Portugal 20 83 25 100Romania 0 0.247 0 0.245Slovakia 4 22 9 32Slovenia 12 69 14 97Spain 177 530 189 653Sweden 17 34 22 36United Kingdom 0 0 0 0All 27 Member States 3624.938 19047.207 4440.384 23817.955
Table 284: PR Table 1b: Biogasfor electricity (MW, GWh)
ECN-E--13-076 Chapter 32. Table 1b: Actual RES-E contribu ons 221

2009 2010
Capacity Energy Capacity Energy Comment
MW GWh MW GWh
Austria 305 1160 324 1232Belgium 150.9 373.5 160.2 269.6Bulgaria 0 0 0 0Cyprus 0 0 0 0Czech Republic n.a. n.a. n.a. n.a.Denmark 0 0 0 0Estonia 0 0 0 0Finland 0 n.a. 0 n.a.France 0 0 0 0Germany 330 2000 280 1700Greece 0 0 0 0Hungary 0 0 0 0Ireland n.a. n.a. n.a. n.a.Italy 385 1448 601 3078 11 (p.100)Latvia 0 0 0 0Lithuania 0 0 0 0Luxembourg 0 0 0 0Malta n.a. n.a. n.a. n.a.Netherlands 17 74 17 54Poland 0 2967 0 0.9 5 (p.138)Portugal 0 0 0 0Romania 0 0 0 0Slovakia 0 0 0 0Slovenia n.a. n.a. n.a. n.a.Spain 0 0 0 0Sweden n.a. 272 n.a. 17United Kingdom 0 0 0 0All 27 Member States 1187.9 8294.5 1382.2 6351.5
Table 285: PR Table 1b:Bioliquids for electricity (MW,
GWh)
222

2009 2010
Capacity Energy Capacity Energy Comment
MW GWh MW GWh
Austria 14709 45201 14971 45916Belgium 3134.3 7167.3 4019.5 8281.4Bulgaria 2494 4017 2704 4461Cyprus 7.6 30.35 96.5 72.89Czech Republic n.a. n.a. n.a. n.a.Denmark 4430 10407 4906 12389Estonia 148 542 181 1009Finland 5080 22899 5245 25144France 31587 82941 33454 85185 4 (p.70)Germany 45860 100600 55580 112100Greece 4466 8172 4760 10572Hungary 766 2886 861.5 3021 5 (p.88)Ireland 0 4067.42 0 4186.45Italy 24964 62684 28915 68902 12 (p.100)Latvia 1575 3030 1622 3154Lithuania 238 695 278 810Luxembourg 120 267 124 269 2 (p.120)Malta n.a. n.a. n.a. n.a.Netherlands 3355 10756 3567 11722Poland 1993.246 8747.402 2556.421 10396.71Portugal 8988 20998 9642 23472Romania n.a. 17074.962 n.a. 17692.553 3 (p.152)Slovakia 2680 5143 2883 5297Slovenia 1126 4909 1315 4930Spain 36878 78242 39391 85275Sweden 21814 82229 22506 83996 13 (p.176)United Kingdom 8030 24861 9202 27977 5 (p.186)All 27 Member States 224443.146 608566.434 248779.921 656231.003
Table 286: PR Table 1b: Total forelectricity (MW, GWh)
ECN-E--13-076 Chapter 32. Table 1b: Actual RES-E contribu ons 223

2009 2010
Capacity Energy Capacity Energy Comment
MW GWh MW GWh
Austria 563 2141 616 2339Belgium 181 971.5 271.4 1511.6Bulgaria 0 0 0 0Cyprus 3.08 7.63 3.58 11.63Czech Republic n.a. n.a. n.a. n.a.Denmark 1094 3352 1248 4632Estonia n.a. 229 n.a. 485Finland n.a. 7949 n.a. 9288France 303 2283 n.a. n.a.Germany n.a. 5700 n.a. 6200Greece 0 0 0 0Hungary 111 295 136 320Ireland 5.3 0.016 5.3 0.019Italy 581 2379 745 3251Latvia 7 46 13 58Lithuania 24 102 29 147Luxembourg 9 53 9 56Malta n.a. 0.5318 n.a. 1.731Netherlands 667 3742 743 4075Poland n.a. 4663.807 n.a. 5592.5Portugal 272 1370 456 1604Romania n.a. 5.206 n.a. 69.472Slovakia 164 537 178 668Slovenia n.a. 176 n.a. 214Spain 0 0 246 1462Sweden 3813 11411 3854 12191 14 (p.176)United Kingdom n.a. n.a. n.a. n.a.All 27 Member States 7797.38 47413.6908 8553.28 54176.952
Table 287: PR Table 1b: TotalCHP (electric) (MW, GWh)
224

33Table 1c: Actual RES-H/C
contributions
Unit 2009 2010 Comment
Austria ktoe 19 20Belgium ktoe 1.9 1.9Bulgaria ktoe 33 33Cyprus ktoe 0 0Czech Republic ktoe n.a. n.a.Denmark ktoe 6 5Estonia ktoe 0 0Finland ktoe 0 0France ktoe 88 90Germany ktoe 25 25Greece ktoe 16 16Hungary ktoe 96 99Ireland ktoe n.a. n.a.Italy ktoe 213 139Latvia ktoe 0 0Lithuania ktoe 3 2Luxembourg ktoe 0 0Malta ktoe 0 0Netherlands ktoe 3 8Poland ktoe 14.3 13.4Portugal ktoe 10 10Romania ktoe 25.485 24.351Slovakia ktoe 9 8Slovenia ktoe 6 26Spain ktoe 4 4Sweden ktoe n.a. n.a.United Kingdom ktoe 0.8 0.8All 27 Member States ktoe 573.485 525.451
Table 288: PR Table 1c:Geothermal heat (ktoe)
ECN-E--13-076 Chapter 33. Table 1c: Actual RES-H/C contribu ons 225

Unit 2009 2010 Comment
Austria ktoe 123 164Belgium ktoe 11.1 12Bulgaria ktoe 0 10Cyprus ktoe 58.2 61.07Czech Republic ktoe n.a. n.a.Denmark ktoe 14 15Estonia ktoe 0 0Finland ktoe 0 0France ktoe 78 89Germany ktoe 407 447Greece ktoe 182 183Hungary ktoe 5 5Ireland ktoe 4.4 5.5Italy ktoe 85 134Latvia ktoe 0 0Lithuania ktoe 0 0Luxembourg ktoe 0.7 0.9Malta ktoe 2.3 2.47Netherlands ktoe 22 24Poland ktoe 2 2.4Portugal ktoe 35 48Romania ktoe 0 0Slovakia ktoe 0 0Slovenia ktoe 4 5Spain ktoe 156 183Sweden ktoe 10 10United Kingdom ktoe 70 87All 27 Member States ktoe 1269.7 1488.34
Table 289: PR Table 1c: Solarthermal heat (ktoe)
226

Unit 2009 2010 Comment
Austria ktoe 3421 3767Belgium ktoe 814.4 957.5Bulgaria ktoe 746 899Cyprus ktoe 18.69 19.43Czech Republic ktoe n.a. n.a.Denmark ktoe 2123 2436Estonia ktoe 643 682Finland ktoe 5423 6251France ktoe 9722 10840Germany ktoe 9392 11513Greece ktoe 844 892Hungary ktoe 844 951Ireland ktoe n.a. n.a.Italy ktoe 3033 4028Latvia ktoe 1190 1158Lithuania ktoe 873 879Luxembourg ktoe 46.1 54.4Malta ktoe n.a. n.a.Netherlands ktoe 699 698Poland ktoe 4164.6 4599.5Portugal ktoe 2508 2609Romania ktoe 3763.637 3951.021Slovakia ktoe 0 0 2 (p.158)Slovenia ktoe 547 603Spain ktoe 3782 4054Sweden ktoe 7780 8949United Kingdom ktoe 863 967All 27 Member States ktoe 63240.427 71757.851
Table 290: PR Table 1c: Biomassheat (ktoe)
Unit 2009 2010 Comment
Austria ktoe 3388 3734Belgium ktoe 755.1 890.4Bulgaria ktoe 742 883Cyprus ktoe 17.73 17.04Czech Republic ktoe n.a. n.a.Denmark ktoe 2075 2387Estonia ktoe 643 680Finland ktoe 5387 6203France ktoe 9604 10711Germany ktoe 8158 9537Greece ktoe 843 890Hungary ktoe 836 942Ireland ktoe 178 193Italy ktoe 2763 3721Latvia ktoe 1186 1153Lithuania ktoe 870 874Luxembourg ktoe 39.9 47.9Malta ktoe 0.5 0.33Netherlands ktoe 565 569Poland ktoe 4121.6 4554.2Portugal ktoe 1658 1699Romania ktoe 3762.996 3950.162Slovakia ktoe 511 533Slovenia ktoe 512 552Spain ktoe 3750 4015Sweden ktoe 7557 8713United Kingdom ktoe n.a. n.a.All 27 Member States ktoe 59923.826 67449.032
Table 291: PR Table 1c: Solidbiomass heat (ktoe)
ECN-E--13-076 Chapter 33. Table 1c: Actual RES-H/C contribu ons 227

Unit 2009 2010 Comment
Austria ktoe 27 28Belgium ktoe 23.5 26.2Bulgaria ktoe 0 3Cyprus ktoe 0.96 2.39Czech Republic ktoe n.a. n.a.Denmark ktoe 48 49Estonia ktoe 0 2Finland ktoe 20 8France ktoe 118 129Germany ktoe 863 1293Greece ktoe 1.3 2Hungary ktoe 8 9Ireland ktoe 7 7.6Italy ktoe 19 26Latvia ktoe 3 4Lithuania ktoe 3 5Luxembourg ktoe 6.2 6.5Malta ktoe 0 0.15Netherlands ktoe 103 116Poland ktoe 42.9 45.3Portugal ktoe 25 32Romania ktoe 0.641 0.859Slovakia ktoe 10 7Slovenia ktoe 4 5Spain ktoe 32 39Sweden ktoe 82 83United Kingdom ktoe n.a. n.a.All 27 Member States ktoe 1447.501 1928.999
Table 292: PR Table 1c: Biogasheat (ktoe)
Unit 2009 2010 Comment
Austria ktoe 6 4Belgium ktoe 36.4 41.6Bulgaria ktoe 4 13Cyprus ktoe 0 0Czech Republic ktoe n.a. n.a.Denmark ktoe 0 0Estonia ktoe 0 0Finland ktoe 25 40France ktoe 0 0Germany ktoe 371 683Greece ktoe 0 0Hungary ktoe 0 0Ireland ktoe n.a. n.a.Italy ktoe 250 281Latvia ktoe 0 0Lithuania ktoe 0 0Luxembourg ktoe 0 0Malta ktoe 0.1 0.08Netherlands ktoe 31 14Poland ktoe 0.1 0Portugal ktoe 825 878Romania ktoe 0 0Slovakia ktoe 0 0Slovenia ktoe 30 46Spain ktoe 0 0Sweden ktoe 142 153United Kingdom ktoe n.a. n.a.All 27 Member States ktoe 1720.6 2153.68
Table 293: PR Table 1c:Bioliquids heat (ktoe)
228

ktoe 6 4 0
Austria ktoe 115 119Belgium ktoe 11.4 13.4Bulgaria ktoe 0 0Cyprus ktoe 0.35 0.75Czech Republic ktoe n.a. n.a.Denmark ktoe 153 170Estonia ktoe 29 37 2 (p.58)Finland ktoe 200 229France ktoe 750 1008Germany ktoe 399 456Greece ktoe 56 69Hungary ktoe n.a. n.a. 6 (p.88)Ireland ktoe 22 23Italy ktoe 1170 1195Latvia ktoe n.a. n.a.Lithuania ktoe 0 0Luxembourg ktoe 0.8 1Malta ktoe n.a. n.a.Netherlands ktoe 81 97Poland ktoe 18.1 21.2Portugal ktoe n.a. n.a.Romania ktoe 0 0Slovakia ktoe 0 0Slovenia ktoe n.a. n.a.Spain ktoe 15 17Sweden ktoe 793 793 15 (p.176)United Kingdom ktoe 29 61All 27 Member States ktoe 3842.65 4310.35
Table 294: PR Table 1c:Renewable energy from heatpumps (ktoe)
Unit 2009 2010 Comment
Austria ktoe n.a. n.a.Belgium ktoe 0 26.1Bulgaria ktoe 0 0Cyprus ktoe n.a. n.a.Czech Republic ktoe n.a. n.a.Denmark ktoe n.a. n.a.Estonia ktoe 0 0Finland ktoe n.a. n.a.France ktoe 639 875Germany ktoe 133 163Greece ktoe 51 63Hungary ktoe n.a. n.a.Ireland ktoe n.a. n.a.Italy ktoe 1136 1158Latvia ktoe n.a. n.a.Lithuania ktoe 0 0Luxembourg ktoe n.a. n.a.Malta ktoe n.a. n.a.Netherlands ktoe 38 46Poland ktoe 0.3 0.8Portugal ktoe n.a. n.a.Romania ktoe n.a. n.a.Slovakia ktoe 0 0Slovenia ktoe n.a. n.a.Spain ktoe 5 5Sweden ktoe n.a. n.a.United Kingdom ktoe n.a. n.a.All 27 Member States ktoe 2002.3 2336.9
Table 295: PR Table 1c:Aerothermal heat pumps (ktoe)
ECN-E--13-076 Chapter 33. Table 1c: Actual RES-H/C contribu ons 229

Unit 2009 2010 Comment
Austria ktoe n.a. n.a.Belgium ktoe 11.4 29Bulgaria ktoe 0 0Cyprus ktoe n.a. n.a.Czech Republic ktoe n.a. n.a.Denmark ktoe n.a. n.a.Estonia ktoe 0 0Finland ktoe n.a. n.a.France ktoe 376 462Germany ktoe 214 237Greece ktoe 5 6Hungary ktoe n.a. n.a.Ireland ktoe 22 23Italy ktoe 31 33Latvia ktoe n.a. n.a.Lithuania ktoe 0 0Luxembourg ktoe n.a. n.a.Malta ktoe n.a. n.a.Netherlands ktoe 43 51Poland ktoe 12.6 13.4Portugal ktoe n.a. n.a.Romania ktoe n.a. n.a.Slovakia ktoe 0 0Slovenia ktoe n.a. n.a.Spain ktoe 10 12Sweden ktoe n.a. n.a.United Kingdom ktoe n.a. n.a.All 27 Member States ktoe 725 866.4
Table 296: PR Table 1c:Geothermal heat pumps (ktoe)
Unit 2009 2010 Comment
Austria ktoe n.a. n.a.Belgium ktoe 0 5.2Bulgaria ktoe 0 0Cyprus ktoe n.a. n.a.Czech Republic ktoe n.a. n.a.Denmark ktoe n.a. n.a.Estonia ktoe 0 0Finland ktoe n.a. n.a.France ktoe 0 0Germany ktoe 52 56Greece ktoe n.a. n.a.Hungary ktoe n.a. n.a.Ireland ktoe n.a. n.a.Italy ktoe 3 4Latvia ktoe n.a. n.a.Lithuania ktoe 0 0Luxembourg ktoe n.a. n.a.Malta ktoe n.a. n.a.Netherlands ktoe n.a. n.a.Poland ktoe 5.2 7Portugal ktoe n.a. n.a.Romania ktoe n.a. n.a.Slovakia ktoe 0 0Slovenia ktoe n.a. n.a.Spain ktoe 0 0Sweden ktoe n.a. n.a.United Kingdom ktoe n.a. n.a.All 27 Member States ktoe 60.2 72.2
Table 297: PR Table 1c:Hydrothermal heat pumps (ktoe)
230

Unit 2009 2010 Comment
Austria ktoe 3678 4070Belgium ktoe 838.8 984.8Bulgaria ktoe 779 942Cyprus ktoe 77.24 81.25Czech Republic ktoe n.a. n.a.Denmark ktoe 2296 2626Estonia ktoe 643 682Finland ktoe 5623 6480France ktoe 10903 12356Germany ktoe 10222 12441Greece ktoe 1098 1160Hungary ktoe 945 1055Ireland ktoe 212 229Italy ktoe 4500 5497Latvia ktoe 1190 1158Lithuania ktoe 876 881Luxembourg ktoe 47.6 56.3Malta ktoe 2.91 3.04Netherlands ktoe 806 827Poland ktoe 4199 4636.5Portugal ktoe 2553 2667Romania ktoe 3789.122 3975.372 4 (p.152)Slovakia ktoe 530 548Slovenia ktoe 557 643Spain ktoe 3957 4258Sweden ktoe 8583 9752United Kingdom ktoe 962 1115All 27 Member States ktoe 69867.672 79124.262
Table 298: PR Table 1c: Totalheat (ktoe)
Unit 2009 2010 Comment
Austria ktoe 614 727Belgium ktoe 18.3 19.8Bulgaria ktoe 1 2Cyprus ktoe 0 0Czech Republic ktoe n.a. n.a.Denmark ktoe 967 1217Estonia ktoe 127 142Finland ktoe 3574 4348France ktoe 356 n.a.Germany ktoe n.a. n.a.Greece ktoe 0 0Hungary ktoe 58 66Ireland ktoe n.a. n.a.Italy ktoe 137 144Latvia ktoe 96 103Lithuania ktoe n.a. n.a. 3 (p.114)Luxembourg ktoe 0.9 0.9Malta ktoe 0 0Netherlands ktoe 160 170Poland ktoe 0 0Portugal ktoe 1206 764Romania ktoe 28.929 44.577Slovakia ktoe 68 103Slovenia ktoe n.a. n.a.Spain ktoe 0 3Sweden ktoe 2567 3261United Kingdom ktoe n.a. n.a.All 27 Member States ktoe 9979.129 11115.277
Table 299: PR Table 1c: Totaldistrict hea ng (heat) (ktoe)
ECN-E--13-076 Chapter 33. Table 1c: Actual RES-H/C contribu ons 231

Unit 2009 2010 Comment
Austria ktoe 1504 1681Belgium ktoe 220.4 248.9Bulgaria ktoe 672 710Cyprus ktoe 7.19 4.81Czech Republic ktoe n.a. n.a.Denmark ktoe 1625 1867Estonia ktoe 411 423Finland ktoe 1288 1434France ktoe 6650 7581Germany ktoe 5332 6251Greece ktoe 554 597Hungary ktoe 581 658Ireland ktoe 28 32Italy ktoe 2003 3164Latvia ktoe 805 735Lithuania ktoe n.a. n.a. 4 (p.114)Luxembourg ktoe 15.1 18.9Malta ktoe n.a. n.a.Netherlands ktoe 292 295Poland ktoe 2488.2 2692.9Portugal ktoe 1161 706Romania ktoe 3394.425 3526.063Slovakia ktoe 39 43Slovenia ktoe 432 461Spain ktoe 0 2055Sweden ktoe 1046 1046United Kingdom ktoe 322 335All 27 Member States ktoe 30870.315 36565.573
Table 300: PR Table 1c: Totalbiomass in households (heat)
(ktoe)
232

34Table 1d: Actual RES-T
contributions
Unit 2009 2010 Comment
Austria ktoe 63 68Belgium ktoe 30.8 38.2Bulgaria ktoe 0 0Cyprus ktoe 0 0Czech Republic ktoe n.a. n.a.Denmark ktoe 0 0Estonia ktoe 0 0 3 (p.58)Finland ktoe 75.3 71.5France ktoe 406 394 5 (p.70)Germany ktoe 574 749Greece ktoe 0 0Hungary ktoe 46 57Ireland ktoe 23 30Italy ktoe 117 155Latvia ktoe 3 8Lithuania ktoe 14 10Luxembourg ktoe 1 1Malta ktoe 0 0Netherlands ktoe 138 134Poland ktoe 195 189Portugal ktoe 0 0Romania ktoe 82.61 110.9Slovakia ktoe 14.5 15.1Slovenia ktoe n.a. n.a.Spain ktoe 151 231Sweden ktoe 198 203United Kingdom ktoe 163 321 6 (p.186)All 27 Member States ktoe 2295.21 2785.7
Table 301: PR Table 1d:Bioethanol / bio-ETBE (ktoe)
ECN-E--13-076 Chapter 34. Table 1d: Actual RES-T contribu ons 233

Unit 2009 2010 Comment
Austria ktoe n.a. n.a.Belgium ktoe 0 0Bulgaria ktoe 0 0Cyprus ktoe 0 0Czech Republic ktoe n.a. n.a.Denmark ktoe 0 0Estonia ktoe 0 0Finland ktoe n.a. n.a.France ktoe 0 0Germany ktoe 0 0Greece ktoe 0 0Hungary ktoe 0 0Ireland ktoe 23 30Italy ktoe 0 0Latvia ktoe 0 0Lithuania ktoe 0 0Luxembourg ktoe 0 0Malta ktoe 0 0Netherlands ktoe 0 4Poland ktoe 0 0Portugal ktoe 0 0Romania ktoe 0 0 5 (p.152)Slovakia ktoe 0 0Slovenia ktoe n.a. n.a.Spain ktoe 0 0Sweden ktoe 1 2 16 (p.176)United Kingdom ktoe 0 0 7 (p.186)All 27 Member States ktoe 24 36
Table 302: PR Table 1d:Bioethanol / bio-ETBE Ar cle 21.2
(ktoe)
234

Unit 2009 2010 Comment
Austria ktoe 34 39Belgium ktoe 15.4 19.1Bulgaria ktoe 0 0Cyprus ktoe 0 0Czech Republic ktoe n.a. n.a.Denmark ktoe 0 0Estonia ktoe 0 0Finland ktoe 75.3 71.5France ktoe 119 109Germany ktoe n.a. n.a.Greece ktoe 0 0Hungary ktoe 7 44Ireland ktoe 20 25Italy ktoe 0 0Latvia ktoe 0 0Lithuania ktoe 2 2Luxembourg ktoe 1 1Malta ktoe 0 0Netherlands ktoe n.a. n.a.Poland ktoe 103 84Portugal ktoe 0 0Romania ktoe 73.58 57.6Slovakia ktoe 0 0Slovenia ktoe n.a. n.a.Spain ktoe 0 25Sweden ktoe 138.6 152.25 17 (p.177)United Kingdom ktoe 124 248All 27 Member States ktoe 712.88 877.45
Table 303: PR Table 1d:Bioethanol / bio-ETBE imported(ktoe)
Unit 2009 2010 Comment
Austria ktoe 355 374Belgium ktoe 195.5 304.6Bulgaria ktoe 4 11Cyprus ktoe 14.87 14.96Czech Republic ktoe n.a. n.a.Denmark ktoe 0 0Estonia ktoe 0 0 4 (p.58)Finland ktoe 56.2 60France ktoe 2057 2086 6 (p.70)Germany ktoe 2157 2244Greece ktoe 78 128Hungary ktoe 123 119Ireland ktoe 53 60Italy ktoe 1063 1311Latvia ktoe 2 19Lithuania ktoe 38 35Luxembourg ktoe 41 41Malta ktoe 0.657 0.546Netherlands ktoe 235 95Poland ktoe 468 698 6 (p.138)Portugal ktoe 226 326Romania ktoe 148.6 142.43Slovakia ktoe 54.9 66Slovenia ktoe n.a. n.a.Spain ktoe 905 1183Sweden ktoe 162 178United Kingdom ktoe 826 827 8 (p.186)All 27 Member States ktoe 9263.727 10323.536
Table 304: PR Table 1d: Biodiesel(ktoe)
ECN-E--13-076 Chapter 34. Table 1d: Actual RES-T contribu ons 235

Unit 2009 2010 Comment
Austria ktoe n.a. n.a.Belgium ktoe 0 0Bulgaria ktoe 0 0Cyprus ktoe 0.18 0.09Czech Republic ktoe n.a. n.a.Denmark ktoe 0 0Estonia ktoe 0 0Finland ktoe n.a. n.a.France ktoe 0 63Germany ktoe 17 0Greece ktoe 5 12Hungary ktoe 0 0Ireland ktoe 53 60Italy ktoe 38 38Latvia ktoe 0 0Lithuania ktoe 0 0Luxembourg ktoe 0 0Malta ktoe 0.657 0.546Netherlands ktoe 77 82Poland ktoe 0 0Portugal ktoe 1.3 0.3Romania ktoe 0 0 6 (p.152)Slovakia ktoe 0 0Slovenia ktoe n.a. n.a.Spain ktoe 0 5Sweden ktoe 0 4 18 (p.177)United Kingdom ktoe 0 0 9 (p.186)All 27 Member States ktoe 192.137 264.936
Table 305: PR Table 1d: BiodieselAr cle 21.2 (ktoe)
Unit 2009 2010 Comment
Austria ktoe 278 322Belgium ktoe 183.3 292.4Bulgaria ktoe 0 0Cyprus ktoe 8.75 10.22Czech Republic ktoe n.a. n.a.Denmark ktoe 0 0Estonia ktoe 0 0Finland ktoe 1.7 3.7France ktoe 294 254Germany ktoe n.a. n.a.Greece ktoe 7 15Hungary ktoe 21 21Ireland ktoe 29 10Italy ktoe 415 713Latvia ktoe 0 0Lithuania ktoe 29 13Luxembourg ktoe 41 41Malta ktoe 0 0Netherlands ktoe n.a. n.a.Poland ktoe 139 365Portugal ktoe 12.3 16.8Romania ktoe 79.43 58.87Slovakia ktoe 0 0Slovenia ktoe n.a. n.a.Spain ktoe 0 748Sweden ktoe 72.9 80.1 19 (p.177)United Kingdom ktoe 649 689All 27 Member States ktoe 2260.38 3653.09
Table 306: PR Table 1d: Biodieselimported (ktoe)
236

ktoe 278 322 0
Austria ktoe 0 0Belgium ktoe 0 0Bulgaria ktoe 0 0Cyprus ktoe 0 0Czech Republic ktoe n.a. n.a.Denmark ktoe 0 0Estonia ktoe 0 0Finland ktoe n.a. n.a.France ktoe 0 0Germany ktoe 0 0Greece ktoe 0 0Hungary ktoe 0 0Ireland ktoe 0 0Italy ktoe 0 0Latvia ktoe 0 0Lithuania ktoe 0 0Luxembourg ktoe 0 0Malta ktoe 0 0Netherlands ktoe 0 0Poland ktoe 0 0Portugal ktoe 0 0Romania ktoe 0 0Slovakia ktoe 0 0Slovenia ktoe n.a. n.a.Spain ktoe 0 0Sweden ktoe 0 0United Kingdom ktoe 0 0All 27 Member States ktoe 0 0
Table 307: PR Table 1d:Hydrogen from renewables (ktoe)
Unit 2009 2010 Comment
Austria ktoe 193 194Belgium ktoe 1.9 2.4Bulgaria ktoe 3 3Cyprus ktoe 0 0Czech Republic ktoe n.a. n.a.Denmark ktoe 9.8 10.8Estonia ktoe 0.91 0.76Finland ktoe n.a. n.a.France ktoe 157 155Germany ktoe 143 162Greece ktoe 3 3Hungary ktoe 16 15Ireland ktoe 0.57 0.57Italy ktoe 170 184Latvia ktoe 4 4 3 (p.108)Lithuania ktoe 1 1Luxembourg ktoe 2 2Malta ktoe 0 0Netherlands ktoe 23 25Poland ktoe 16 19Portugal ktoe 15 19Romania ktoe 33.54 33.13Slovakia ktoe 7.4 7.9Slovenia ktoe n.a. n.a.Spain ktoe 50 53Sweden ktoe 110 140United Kingdom ktoe 52 56All 27 Member States ktoe 1012.12 1090.56
Table 308: PR Table 1d:Renewable electricity in (roadand non-road) transport (ktoe)
ECN-E--13-076 Chapter 34. Table 1d: Actual RES-T contribu ons 237

Unit 2009 2010 Comment
Austria ktoe 0 0Belgium ktoe 0 0Bulgaria ktoe 0 0Cyprus ktoe 0 0Czech Republic ktoe n.a. n.a.Denmark ktoe 0 0Estonia ktoe 0.33 0.31Finland ktoe n.a. n.a.France ktoe 0 0Germany ktoe 0 0Greece ktoe 2 2Hungary ktoe 0 0Ireland ktoe n.a. n.a.Italy ktoe 0 0Latvia ktoe 2 2Lithuania ktoe 1 1Luxembourg ktoe 0 0Malta ktoe 0 0Netherlands ktoe 0 0Poland ktoe 0 0Portugal ktoe 0 1Romania ktoe n.a. n.a.Slovakia ktoe 0 0Slovenia ktoe n.a. n.a.Spain ktoe 0 0Sweden ktoe 0 0 20 (p.177)United Kingdom ktoe 0.2 0.3All 27 Member States ktoe 5.53 6.61
Table 309: PR Table 1d:Renewable electricity road
transport (ktoe)
Unit 2009 2010 Comment
Austria ktoe 193 194Belgium ktoe 1.9 2.4Bulgaria ktoe 3 3Cyprus ktoe 0 0Czech Republic ktoe n.a. n.a.Denmark ktoe 9.8 10.8Estonia ktoe 0.57 0.45Finland ktoe 16 17.2France ktoe 157 155Germany ktoe 143 162Greece ktoe 1 1Hungary ktoe 16 15Ireland ktoe 0.57 0.57Italy ktoe 170 184Latvia ktoe 2 2Lithuania ktoe 0 0Luxembourg ktoe 2 2Malta ktoe 0 0Netherlands ktoe 23 25Poland ktoe 16 19Portugal ktoe 15 18Romania ktoe n.a. n.a.Slovakia ktoe 7.4 7.9Slovenia ktoe n.a. n.a.Spain ktoe 50 53Sweden ktoe 110 140United Kingdom ktoe 52 56All 27 Member States ktoe 989.24 1068.32
Table 310: PR Table 1d:Renewable electricity non-road
transport (ktoe)
238
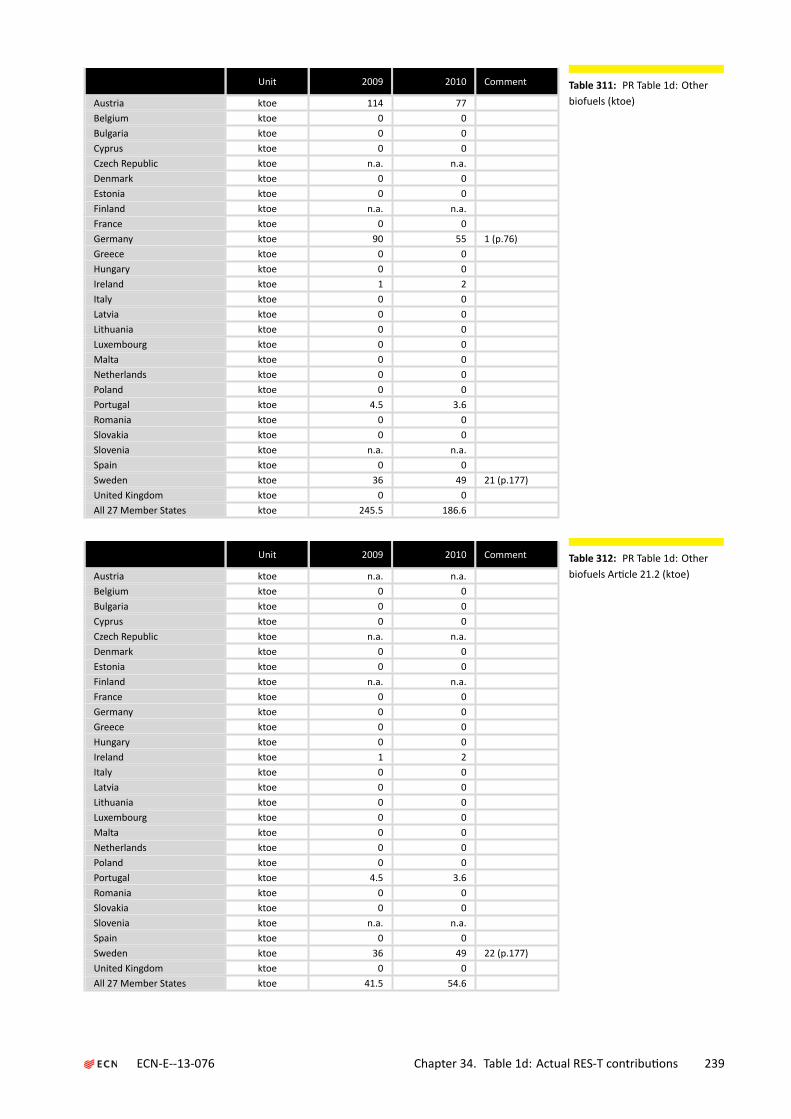
Unit 2009 2010 Comment
Austria ktoe 114 77Belgium ktoe 0 0Bulgaria ktoe 0 0Cyprus ktoe 0 0Czech Republic ktoe n.a. n.a.Denmark ktoe 0 0Estonia ktoe 0 0Finland ktoe n.a. n.a.France ktoe 0 0Germany ktoe 90 55 1 (p.76)Greece ktoe 0 0Hungary ktoe 0 0Ireland ktoe 1 2Italy ktoe 0 0Latvia ktoe 0 0Lithuania ktoe 0 0Luxembourg ktoe 0 0Malta ktoe 0 0Netherlands ktoe 0 0Poland ktoe 0 0Portugal ktoe 4.5 3.6Romania ktoe 0 0Slovakia ktoe 0 0Slovenia ktoe n.a. n.a.Spain ktoe 0 0Sweden ktoe 36 49 21 (p.177)United Kingdom ktoe 0 0All 27 Member States ktoe 245.5 186.6
Table 311: PR Table 1d: Otherbiofuels (ktoe)
Unit 2009 2010 Comment
Austria ktoe n.a. n.a.Belgium ktoe 0 0Bulgaria ktoe 0 0Cyprus ktoe 0 0Czech Republic ktoe n.a. n.a.Denmark ktoe 0 0Estonia ktoe 0 0Finland ktoe n.a. n.a.France ktoe 0 0Germany ktoe 0 0Greece ktoe 0 0Hungary ktoe 0 0Ireland ktoe 1 2Italy ktoe 0 0Latvia ktoe 0 0Lithuania ktoe 0 0Luxembourg ktoe 0 0Malta ktoe 0 0Netherlands ktoe 0 0Poland ktoe 0 0Portugal ktoe 4.5 3.6Romania ktoe 0 0Slovakia ktoe 0 0Slovenia ktoe n.a. n.a.Spain ktoe 0 0Sweden ktoe 36 49 22 (p.177)United Kingdom ktoe 0 0All 27 Member States ktoe 41.5 54.6
Table 312: PR Table 1d: Otherbiofuels Ar cle 21.2 (ktoe)
ECN-E--13-076 Chapter 34. Table 1d: Actual RES-T contribu ons 239
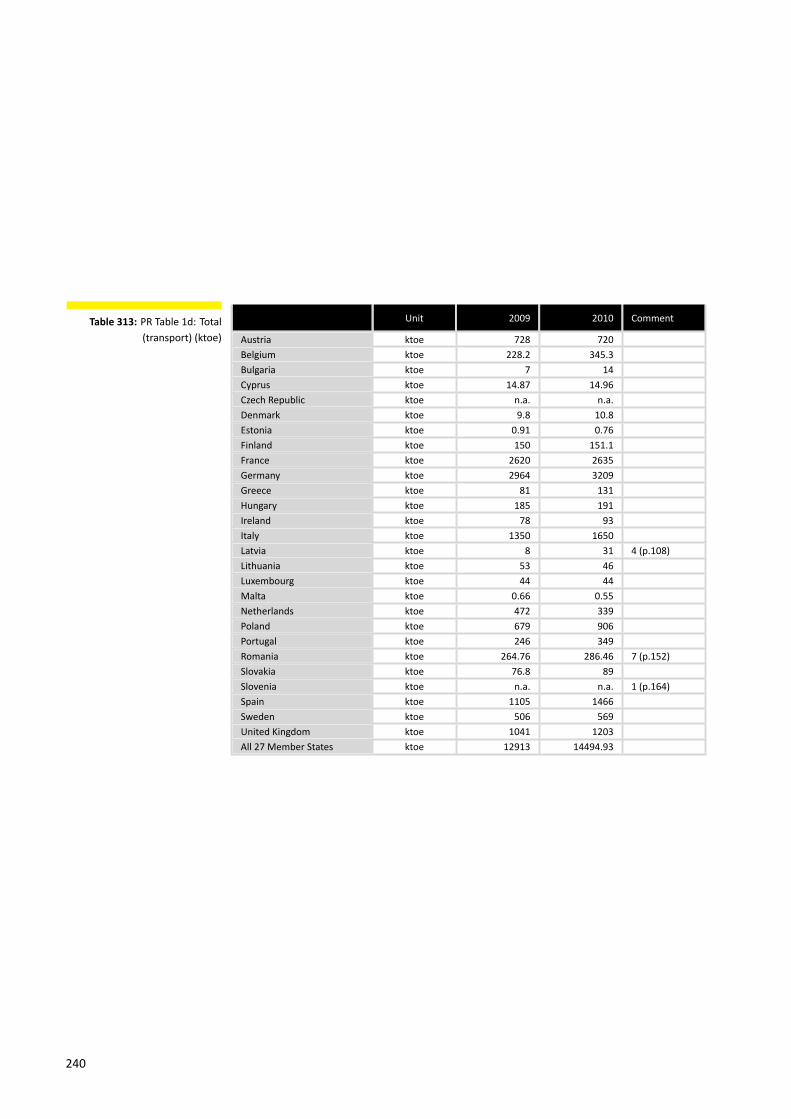
Unit 2009 2010 Comment
Austria ktoe 728 720Belgium ktoe 228.2 345.3Bulgaria ktoe 7 14Cyprus ktoe 14.87 14.96Czech Republic ktoe n.a. n.a.Denmark ktoe 9.8 10.8Estonia ktoe 0.91 0.76Finland ktoe 150 151.1France ktoe 2620 2635Germany ktoe 2964 3209Greece ktoe 81 131Hungary ktoe 185 191Ireland ktoe 78 93Italy ktoe 1350 1650Latvia ktoe 8 31 4 (p.108)Lithuania ktoe 53 46Luxembourg ktoe 44 44Malta ktoe 0.66 0.55Netherlands ktoe 472 339Poland ktoe 679 906Portugal ktoe 246 349Romania ktoe 264.76 286.46 7 (p.152)Slovakia ktoe 76.8 89Slovenia ktoe n.a. n.a. 1 (p.164)Spain ktoe 1105 1466Sweden ktoe 506 569United Kingdom ktoe 1041 1203All 27 Member States ktoe 12913 14494.93
Table 313: PR Table 1d: Total(transport) (ktoe)
240

Index
All 27 Member StatesBio-ETBE, 190, 191Biodiesel, 190, 191Bioethanol, 190, 191Biofuel consump on, 193Biofuel produc on, 193Biofuels for transport, 190, 191Biogas for electricity, 190, 191Biogas for heat, 190, 191Bioliquids for electricity, 190, 191Bioliquids for heat, 190, 191Biomass for electricity, 190, 191Biomass for heat, 190, 191Biomass heat in households, 190, 191Biomass supply for H and E (ktoe),
192Biomass supply for T (ktoe), 192CHP, 190, 191Concentrated solar power, 190, 191Coopera on Mechanism (%), 189Coopera onMechanism (ktoe), 189,
193CSP, 190, 191District hea ng, 190, 191Geothermal electricity, 190, 191Geothermal heat, 190, 191GHG emission saving from RES, 193GHGemission saving fromRES-E,193GHGemission saving fromRES-H/C,
193GHGemission saving fromRES-T,193Heat pumps, 190Hydrogen from renewables, 190, 191Hydropower, 190, 191Land use (ha), 193Offshore wind, 190, 191Onshore wind, 190, 191Renewable energy fromheat pumps,
190, 191
RES Overall Share (%), 189RES Total Consump on (ktoe), 189–
191RES-E Capacity (MW), 190, 191RES-E Consump on (GWh), 190, 191RES-E Consump on (ktoe), 189–191RES-E in non-road transport, 191RES-E in road transport, 191RES-E in transport, 191RES-E non-road transport, 190RES-E road transport, 190RES-E Share (%), 189RES-H/C Consump on (ktoe), 189–
191RES-H/C Share (%), 189RES-T Consump on (ktoe), 189–191RES-T Share (%), 189Solar photovoltaic, 190, 191Solar PV, 190, 191Solar thermal, 190, 191Solid biomass for electricity, 190, 191Solid biomass for heat, 190, 191Tidal, wave and ocean energy, 190,
191Wind power, 190, 191
AustriaBio-ETBE, 18, 19Biodiesel, 18, 19Bioethanol, 18, 19Biofuel consump on, 21Biofuel produc on, 21Biofuels for transport, 18, 19Biogas for electricity, 18, 19Biogas for heat, 18, 19Bioliquids for electricity, 18, 19Bioliquids for heat, 18, 19Biomass for electricity, 18, 19Biomass for heat, 18, 19Biomass heat in households, 18, 19
ECN-E--13-076 Index 241

Biomass supply for H and E (ktoe),20
Biomass supply for T (ktoe), 20CHP, 18, 19Concentrated solar power, 18, 19Coopera on Mechanism (%), 17Coopera on Mechanism (ktoe), 17,
21CSP, 18, 19District hea ng, 18, 19Geothermal electricity, 18, 19Geothermal heat, 18, 19GHG emission saving from RES, 21GHGemission saving fromRES-E,21GHGemission saving fromRES-H/C,
21GHGemission saving fromRES-T,21Heat pumps, 18Hydrogen from renewables, 18, 19Hydropower, 18, 19Land use (ha), 21Offshore wind, 18, 19Onshore wind, 18, 19Renewable energy fromheat pumps,
18, 19RES Overall Share (%), 17RES Total Consump on (ktoe), 17–
19RES-E Capacity (MW), 18, 19RES-E Consump on (GWh), 18, 19RES-E Consump on (ktoe), 17–19RES-E in non-road transport, 19RES-E in road transport, 19RES-E in transport, 19RES-E non-road transport, 18RES-E road transport, 18RES-E Share (%), 17RES-H/CConsump on (ktoe), 17–19RES-H/C Share (%), 17RES-T Consump on (ktoe), 17–19RES-T Share (%), 17Solar photovoltaic, 18, 19Solar PV, 18, 19Solar thermal, 18, 19Solid biomass for electricity, 18, 19Solid biomass for heat, 18, 19Tidal, wave and ocean energy, 18,
19Wind power, 18, 19
Belgium
Bio-ETBE, 24, 25Biodiesel, 24, 25Bioethanol, 24, 25Biofuel consump on, 27Biofuel produc on, 27Biofuels for transport, 24, 25Biogas for electricity, 24, 25Biogas for heat, 24, 25Bioliquids for electricity, 24, 25Bioliquids for heat, 24, 25Biomass for electricity, 24, 25Biomass for heat, 24, 25Biomass heat in households, 24, 25Biomass supply for H and E (ktoe),
26Biomass supply for T (ktoe), 26CHP, 24, 25Concentrated solar power, 24, 25Coopera on Mechanism (%), 23Coopera on Mechanism (ktoe), 23,
27CSP, 24, 25District hea ng, 24, 25Geothermal electricity, 24, 25Geothermal heat, 24, 25GHG emission saving from RES, 27GHGemission saving fromRES-E,27GHGemission saving fromRES-H/C,
27GHGemission saving fromRES-T,27Heat pumps, 24Hydrogen from renewables, 24, 25Hydropower, 24, 25Land use (ha), 27Offshore wind, 24, 25Onshore wind, 24, 25Renewable energy fromheat pumps,
24, 25RES Overall Share (%), 23RES Total Consump on (ktoe), 23–
25RES-E Capacity (MW), 24, 25RES-E Consump on (GWh), 24, 25RES-E Consump on (ktoe), 23–25RES-E in non-road transport, 25RES-E in road transport, 25RES-E in transport, 25RES-E non-road transport, 24RES-E road transport, 24RES-E Share (%), 23
242

RES-H/CConsump on (ktoe), 23–25RES-H/C Share (%), 23RES-T Consump on (ktoe), 23–25RES-T Share (%), 23Solar photovoltaic, 24, 25Solar PV, 24, 25Solar thermal, 24, 25Solid biomass for electricity, 24, 25Solid biomass for heat, 24, 25Tidal, wave and ocean energy, 24,
25Wind power, 24, 25
Bio-ETBEAll 27 Member States, 190, 191Austria, 18, 19Belgium, 24, 25Bulgaria, 30, 31Cyprus, 36, 37Czech Republic, 42, 43Denmark, 48, 49Estonia, 54, 55Finland, 60, 61France, 66, 67Germany, 72, 73Greece, 78, 79Hungary, 84, 85Ireland, 90, 91Italy, 96, 97Latvia, 104, 105Lithuania, 110, 111Luxembourg, 116, 117Malta, 122, 123Netherlands, 128, 129Poland, 134, 135Portugal, 142, 143Romania, 148, 149Slovakia, 154, 155Slovenia, 160, 161Spain, 166, 167Sweden, 172, 173United Kingdom, 182, 183
BiodieselAll 27 Member States, 190, 191Austria, 18, 19Belgium, 24, 25Bulgaria, 30, 31Cyprus, 36, 37Czech Republic, 42, 43Denmark, 48, 49Estonia, 54, 55
Finland, 60, 61France, 66, 67Germany, 72, 73Greece, 78, 79Hungary, 84, 85Ireland, 90, 91Italy, 96, 97Latvia, 104, 105Lithuania, 110, 111Luxembourg, 116, 117Malta, 122, 123Netherlands, 128, 129Poland, 134, 135Portugal, 142, 143Romania, 148, 149Slovakia, 154, 155Slovenia, 160, 161Spain, 166, 167Sweden, 172, 173United Kingdom, 182, 183
Biodiesel (ktoe)All 27 Member States, 235, 236Austria, 235, 236Belgium, 235, 236Bulgaria, 235, 236Cyprus, 235, 236Czech Republic, 235, 236Denmark, 235, 236Estonia, 235, 236Finland, 235, 236France, 235, 236Germany, 235, 236Greece, 235, 236Hungary, 235, 236Ireland, 235, 236Italy, 235, 236Latvia, 235, 236Lithuania, 235, 236Luxembourg, 235, 236Malta, 235, 236Netherlands, 235, 236Poland, 235, 236Portugal, 235, 236Romania, 235, 236Slovakia, 235, 236Slovenia, 235, 236Spain, 235, 236Sweden, 235, 236United Kingdom, 235, 236
Bioethanol
ECN-E--13-076 Index 243

All 27 Member States, 190, 191Austria, 18, 19Belgium, 24, 25Bulgaria, 30, 31Cyprus, 36, 37Czech Republic, 42, 43Denmark, 48, 49Estonia, 54, 55Finland, 60, 61France, 66, 67Germany, 72, 73Greece, 78, 79Hungary, 84, 85Ireland, 90, 91Italy, 96, 97Latvia, 104, 105Lithuania, 110, 111Luxembourg, 116, 117Malta, 122, 123Netherlands, 128, 129Poland, 134, 135Portugal, 142, 143Romania, 148, 149Slovakia, 154, 155Slovenia, 160, 161Spain, 166, 167Sweden, 172, 173United Kingdom, 182, 183
Bioethanol / bio-ETBE (ktoe)All 27 Member States, 233–235Austria, 233–235Belgium, 233–235Bulgaria, 233–235Cyprus, 233–235Czech Republic, 233–235Denmark, 233–235Estonia, 233–235Finland, 233–235France, 233–235Germany, 233–235Greece, 233–235Hungary, 233–235Ireland, 233–235Italy, 233–235Latvia, 233–235Lithuania, 233–235Luxembourg, 233–235Malta, 233–235Netherlands, 233–235Poland, 233–235
Portugal, 233–235Romania, 233–235Slovakia, 233–235Slovenia, 233–235Spain, 233–235Sweden, 233–235United Kingdom, 233–235
Biofuel consump onAll 27 Member States, 193Austria, 21Belgium, 27Bulgaria, 33Cyprus, 39Czech Republic, 45Denmark, 51Estonia, 57Finland, 63France, 69Germany, 75Greece, 81Hungary, 87Ireland, 93Italy, 99Latvia, 107Lithuania, 113Luxembourg, 119Malta, 125Netherlands, 131Poland, 137Portugal, 145Romania, 151Slovakia, 157Slovenia, 163Spain, 169Sweden, 175United Kingdom, 185
Biofuel produc onAll 27 Member States, 193Austria, 21Belgium, 27Bulgaria, 33Cyprus, 39Czech Republic, 45Denmark, 51Estonia, 57Finland, 63France, 69Germany, 75Greece, 81Hungary, 87
244
Ireland, 93Italy, 99Latvia, 107Lithuania, 113Luxembourg, 119Malta, 125Netherlands, 131Poland, 137Portugal, 145Romania, 151Slovakia, 157Slovenia, 163Spain, 169Sweden, 175United Kingdom, 185
Biofuels for transportAll 27 Member States, 190, 191Austria, 18, 19Belgium, 24, 25Bulgaria, 30, 31Cyprus, 36, 37Czech Republic, 42, 43Denmark, 48, 49Estonia, 54, 55Finland, 60, 61France, 66, 67Germany, 72, 73Greece, 78, 79Hungary, 84, 85Ireland, 90, 91Italy, 96, 97Latvia, 104, 105Lithuania, 110, 111Luxembourg, 116, 117Malta, 122, 123Netherlands, 128, 129Poland, 134, 135Portugal, 142, 143Romania, 148, 149Slovakia, 154, 155Slovenia, 160, 161Spain, 166, 167Sweden, 172, 173United Kingdom, 182, 183
Biofuels for transport (ktoe)All 27 Member States, 239Austria, 239Belgium, 239Bulgaria, 239Cyprus, 239
Czech Republic, 239Denmark, 239Estonia, 239Finland, 239France, 239Germany, 239Greece, 239Hungary, 239Ireland, 239Italy, 239Latvia, 239Lithuania, 239Luxembourg, 239Malta, 239Netherlands, 239Poland, 239Portugal, 239Romania, 239Slovakia, 239Slovenia, 239Spain, 239Sweden, 239United Kingdom, 239
Biogas for electricityAll 27Member States, 190, 191, 221Austria, 18, 19, 221Belgium, 24, 25, 221Bulgaria, 30, 31, 221Cyprus, 36, 37, 221Czech Republic, 42, 43, 221Denmark, 48, 49, 221Estonia, 54, 55, 221Finland, 60, 61, 221France, 66, 67, 221Germany, 72, 73, 221Greece, 78, 79, 221Hungary, 84, 85, 221Ireland, 90, 91, 221Italy, 96, 97, 221Latvia, 104, 105, 221Lithuania, 110, 111, 221Luxembourg, 116, 117, 221Malta, 122, 123, 221Netherlands, 128, 129, 221Poland, 134, 135, 221Portugal, 142, 143, 221Romania, 148, 149, 221Slovakia, 154, 155, 221Slovenia, 160, 161, 221Spain, 166, 167, 221
ECN-E--13-076 Index 245

Sweden, 172, 173, 221United Kingdom, 182, 183, 221
Biogas for heatAll 27 Member States, 190, 191Austria, 18, 19Belgium, 24, 25Bulgaria, 30, 31Cyprus, 36, 37Czech Republic, 42, 43Denmark, 48, 49Estonia, 54, 55Finland, 60, 61France, 66, 67Germany, 72, 73Greece, 78, 79Hungary, 84, 85Ireland, 90, 91Italy, 96, 97Latvia, 104, 105Lithuania, 110, 111Luxembourg, 116, 117Malta, 122, 123Netherlands, 128, 129Poland, 134, 135Portugal, 142, 143Romania, 148, 149Slovakia, 154, 155Slovenia, 160, 161Spain, 166, 167Sweden, 172, 173United Kingdom, 182, 183
Biogas heat (ktoe)All 27 Member States, 228Austria, 228Belgium, 228Bulgaria, 228Cyprus, 228Czech Republic, 228Denmark, 228Estonia, 228Finland, 228France, 228Germany, 228Greece, 228Hungary, 228Ireland, 228Italy, 228Latvia, 228Lithuania, 228Luxembourg, 228
Malta, 228Netherlands, 228Poland, 228Portugal, 228Romania, 228Slovakia, 228Slovenia, 228Spain, 228Sweden, 228United Kingdom, 228
Bioliquids for electricityAll 27Member States, 190, 191, 222Austria, 18, 19, 222Belgium, 24, 25, 222Bulgaria, 30, 31, 222Cyprus, 36, 37, 222Czech Republic, 42, 43, 222Denmark, 48, 49, 222Estonia, 54, 55, 222Finland, 60, 61, 222France, 66, 67, 222Germany, 72, 73, 222Greece, 78, 79, 222Hungary, 84, 85, 222Ireland, 90, 91, 222Italy, 96, 97, 222Latvia, 104, 105, 222Lithuania, 110, 111, 222Luxembourg, 116, 117, 222Malta, 122, 123, 222Netherlands, 128, 129, 222Poland, 134, 135, 222Portugal, 142, 143, 222Romania, 148, 149, 222Slovakia, 154, 155, 222Slovenia, 160, 161, 222Spain, 166, 167, 222Sweden, 172, 173, 222United Kingdom, 182, 183, 222
Bioliquids for heatAll 27 Member States, 190, 191Austria, 18, 19Belgium, 24, 25Bulgaria, 30, 31Cyprus, 36, 37Czech Republic, 42, 43Denmark, 48, 49Estonia, 54, 55Finland, 60, 61France, 66, 67
246

Germany, 72, 73Greece, 78, 79Hungary, 84, 85Ireland, 90, 91Italy, 96, 97Latvia, 104, 105Lithuania, 110, 111Luxembourg, 116, 117Malta, 122, 123Netherlands, 128, 129Poland, 134, 135Portugal, 142, 143Romania, 148, 149Slovakia, 154, 155Slovenia, 160, 161Spain, 166, 167Sweden, 172, 173United Kingdom, 182, 183
Bioliquids heat (ktoe)All 27 Member States, 228Austria, 228Belgium, 228Bulgaria, 228Cyprus, 228Czech Republic, 228Denmark, 228Estonia, 228Finland, 228France, 228Germany, 228Greece, 228Hungary, 228Ireland, 228Italy, 228Latvia, 228Lithuania, 228Luxembourg, 228Malta, 228Netherlands, 228Poland, 228Portugal, 228Romania, 228Slovakia, 228Slovenia, 228Spain, 228Sweden, 228United Kingdom, 228
Biomass for electricityAll 27Member States, 190, 191, 219Austria, 18, 19, 219
Belgium, 24, 25, 219Bulgaria, 30, 31, 219Cyprus, 36, 37, 219Czech Republic, 42, 43, 219Denmark, 48, 49, 219Estonia, 54, 55, 219Finland, 60, 61, 219France, 66, 67, 219Germany, 72, 73, 219Greece, 78, 79, 219Hungary, 84, 85, 219Ireland, 90, 91, 219Italy, 96, 97, 219Latvia, 104, 105, 219Lithuania, 110, 111, 219Luxembourg, 116, 117, 219Malta, 122, 123, 219Netherlands, 128, 129, 219Poland, 134, 135, 219Portugal, 142, 143, 219Romania, 148, 149, 219Slovakia, 154, 155, 219Slovenia, 160, 161, 219Spain, 166, 167, 219Sweden, 172, 173, 219United Kingdom, 182, 183, 219
Biomass for heatAll 27 Member States, 190, 191Austria, 18, 19Belgium, 24, 25Bulgaria, 30, 31Cyprus, 36, 37Czech Republic, 42, 43Denmark, 48, 49Estonia, 54, 55Finland, 60, 61France, 66, 67Germany, 72, 73Greece, 78, 79Hungary, 84, 85Ireland, 90, 91Italy, 96, 97Latvia, 104, 105Lithuania, 110, 111Luxembourg, 116, 117Malta, 122, 123Netherlands, 128, 129Poland, 134, 135Portugal, 142, 143Romania, 148, 149
ECN-E--13-076 Index 247

Slovakia, 154, 155Slovenia, 160, 161Spain, 166, 167Sweden, 172, 173United Kingdom, 182, 183
Biomass heat (ktoe)All 27 Member States, 227Austria, 227Belgium, 227Bulgaria, 227Cyprus, 227Czech Republic, 227Denmark, 227Estonia, 227Finland, 227France, 227Germany, 227Greece, 227Hungary, 227Ireland, 227Italy, 227Latvia, 227Lithuania, 227Luxembourg, 227Malta, 227Netherlands, 227Poland, 227Portugal, 227Romania, 227Slovakia, 227Slovenia, 227Spain, 227Sweden, 227United Kingdom, 227
Biomass heat in householdsAll 27 Member States, 190, 191Austria, 18, 19Belgium, 24, 25Bulgaria, 30, 31Cyprus, 36, 37Czech Republic, 42, 43Denmark, 48, 49Estonia, 54, 55Finland, 60, 61France, 66, 67Germany, 72, 73Greece, 78, 79Hungary, 84, 85Ireland, 90, 91Italy, 96, 97
Latvia, 104, 105Lithuania, 110, 111Luxembourg, 116, 117Malta, 122, 123Netherlands, 128, 129Poland, 134, 135Portugal, 142, 143Romania, 148, 149Slovakia, 154, 155Slovenia, 160, 161Spain, 166, 167Sweden, 172, 173United Kingdom, 182, 183
Biomass in households (heat) (ktoe)All 27 Member States, 232Austria, 232Belgium, 232Bulgaria, 232Cyprus, 232Czech Republic, 232Denmark, 232Estonia, 232Finland, 232France, 232Germany, 232Greece, 232Hungary, 232Ireland, 232Italy, 232Latvia, 232Lithuania, 232Luxembourg, 232Malta, 232Netherlands, 232Poland, 232Portugal, 232Romania, 232Slovakia, 232Slovenia, 232Spain, 232Sweden, 232United Kingdom, 232
Biomass supply for H and E (ktoe)All 27 Member States, 192Austria, 20Belgium, 26Bulgaria, 32Cyprus, 38Czech Republic, 44Denmark, 50
248
Estonia, 56Finland, 62France, 68Germany, 74Greece, 80Hungary, 86Ireland, 92Italy, 98Latvia, 106Lithuania, 112Luxembourg, 118Malta, 124Netherlands, 130Poland, 136Portugal, 144Romania, 150Slovakia, 156Slovenia, 162Spain, 168Sweden, 174United Kingdom, 184
Biomass supply for T (ktoe)All 27 Member States, 192Austria, 20Belgium, 26Bulgaria, 32Cyprus, 38Czech Republic, 44Denmark, 50Estonia, 56Finland, 62France, 68Germany, 74Greece, 80Hungary, 86Ireland, 92Italy, 98Latvia, 106Lithuania, 112Luxembourg, 118Malta, 124Netherlands, 130Poland, 136Portugal, 144Romania, 150Slovakia, 156Slovenia, 162Spain, 168Sweden, 174United Kingdom, 184
BulgariaBio-ETBE, 30, 31Biodiesel, 30, 31Bioethanol, 30, 31Biofuel consump on, 33Biofuel produc on, 33Biofuels for transport, 30, 31Biogas for electricity, 30, 31Biogas for heat, 30, 31Bioliquids for electricity, 30, 31Bioliquids for heat, 30, 31Biomass for electricity, 30, 31Biomass for heat, 30, 31Biomass heat in households, 30, 31Biomass supply for H and E (ktoe),
32Biomass supply for T (ktoe), 32CHP, 30, 31Concentrated solar power, 30, 31Coopera on Mechanism (%), 29Coopera on Mechanism (ktoe), 29,
33CSP, 30, 31District hea ng, 30, 31Geothermal electricity, 30, 31Geothermal heat, 30, 31GHG emission saving from RES, 33GHGemission saving fromRES-E,33GHGemission saving fromRES-H/C,
33GHGemission saving fromRES-T,33Heat pumps, 30Hydrogen from renewables, 30, 31Hydropower, 30, 31Land use (ha), 33Offshore wind, 30, 31Onshore wind, 30, 31Renewable energy fromheat pumps,
30, 31RES Overall Share (%), 29RES Total Consump on (ktoe), 29–
31RES-E Capacity (MW), 30, 31RES-E Consump on (GWh), 30, 31RES-E Consump on (ktoe), 29–31RES-E in non-road transport, 31RES-E in road transport, 31RES-E in transport, 31RES-E non-road transport, 30RES-E road transport, 30
ECN-E--13-076 Index 249

RES-E Share (%), 29RES-H/CConsump on (ktoe), 29–31RES-H/C Share (%), 29RES-T Consump on (ktoe), 29–31RES-T Share (%), 29Solar photovoltaic, 30, 31Solar PV, 30, 31Solar thermal, 30, 31Solid biomass for electricity, 30, 31Solid biomass for heat, 30, 31Tidal, wave and ocean energy, 30,
31Wind power, 30, 31
CHPAll 27 Member States, 190, 191Austria, 18, 19Belgium, 24, 25Bulgaria, 30, 31Cyprus, 36, 37Czech Republic, 42, 43Denmark, 48, 49Estonia, 54, 55Finland, 60, 61France, 66, 67Germany, 72, 73Greece, 78, 79Hungary, 84, 85Ireland, 90, 91Italy, 96, 97Latvia, 104, 105Lithuania, 110, 111Luxembourg, 116, 117Malta, 122, 123Netherlands, 128, 129Poland, 134, 135Portugal, 142, 143Romania, 148, 149Slovakia, 154, 155Slovenia, 160, 161Spain, 166, 167Sweden, 172, 173United Kingdom, 182, 183
Concentrated solar powerAll 27 Member States, 190, 191Austria, 18, 19Belgium, 24, 25Bulgaria, 30, 31Cyprus, 36, 37Czech Republic, 42, 43Denmark, 48, 49
Estonia, 54, 55Finland, 60, 61France, 66, 67Germany, 72, 73Greece, 78, 79Hungary, 84, 85Ireland, 90, 91Italy, 96, 97Latvia, 104, 105Lithuania, 110, 111Luxembourg, 116, 117Malta, 122, 123Netherlands, 128, 129Poland, 134, 135Portugal, 142, 143Romania, 148, 149Slovakia, 154, 155Slovenia, 160, 161Spain, 166, 167Sweden, 172, 173United Kingdom, 182, 183
Coopera on Mechanism (%)All 27 Member States, 189, 197Austria, 17, 197Belgium, 23, 197Bulgaria, 29, 197Cyprus, 35, 197Czech Republic, 41, 197Denmark, 47, 197Estonia, 53, 197Finland, 59, 197France, 65, 197Germany, 71, 197Greece, 77, 197Hungary, 83, 197Ireland, 89, 197Italy, 95, 197Latvia, 103, 197Lithuania, 109, 197Luxembourg, 115, 197Malta, 121, 197Netherlands, 127, 197Poland, 133, 197Portugal, 141, 197Romania, 147, 197Slovakia, 153, 197Slovenia, 159, 197Spain, 165, 197Sweden, 171, 197United Kingdom, 181, 197
250

Coopera on Mechanism (ktoe)All 27 Member States, 193, 201Austria, 21, 201Belgium, 27, 201Bulgaria, 33, 201Cyprus, 39, 201Czech Republic, 45, 201Denmark, 51, 201Estonia, 57, 201Finland, 63, 201France, 69, 201Germany, 75, 201Greece, 81, 201Hungary, 87, 201Ireland, 93, 201Italy, 99, 201Latvia, 107, 201Lithuania, 113, 201Luxembourg, 119, 201Malta, 125, 201Netherlands, 131, 201Poland, 137, 201Portugal, 145, 201Romania, 151, 201Slovakia, 157, 201Slovenia, 163, 201Spain, 169, 201Sweden, 175, 201United Kingdom, 185, 201
CSPAll 27 Member States, 190, 191Austria, 18, 19Belgium, 24, 25Bulgaria, 30, 31Cyprus, 36, 37Czech Republic, 42, 43Denmark, 48, 49Estonia, 54, 55Finland, 60, 61France, 66, 67Germany, 72, 73Greece, 78, 79Hungary, 84, 85Ireland, 90, 91Italy, 96, 97Latvia, 104, 105Lithuania, 110, 111Luxembourg, 116, 117Malta, 122, 123Netherlands, 128, 129
Poland, 134, 135Portugal, 142, 143Romania, 148, 149Slovakia, 154, 155Slovenia, 160, 161Spain, 166, 167Sweden, 172, 173United Kingdom, 182, 183
CyprusBio-ETBE, 36, 37Biodiesel, 36, 37Bioethanol, 36, 37Biofuel consump on, 39Biofuel produc on, 39Biofuels for transport, 36, 37Biogas for electricity, 36, 37Biogas for heat, 36, 37Bioliquids for electricity, 36, 37Bioliquids for heat, 36, 37Biomass for electricity, 36, 37Biomass for heat, 36, 37Biomass heat in households, 36, 37Biomass supply for H and E (ktoe),
38Biomass supply for T (ktoe), 38CHP, 36, 37Concentrated solar power, 36, 37Coopera on Mechanism (%), 35Coopera on Mechanism (ktoe), 35,
39CSP, 36, 37District hea ng, 36, 37Geothermal electricity, 36, 37Geothermal heat, 36, 37GHG emission saving from RES, 39GHGemission saving fromRES-E,39GHGemission saving fromRES-H/C,
39GHGemission saving fromRES-T,39Heat pumps, 36Hydrogen from renewables, 36, 37Hydropower, 36, 37Land use (ha), 39Offshore wind, 36, 37Onshore wind, 36, 37Renewable energy fromheat pumps,
36, 37RES Overall Share (%), 35RES Total Consump on (ktoe), 35–
37
ECN-E--13-076 Index 251

RES-E Capacity (MW), 36, 37RES-E Consump on (GWh), 36, 37RES-E Consump on (ktoe), 35–37RES-E in non-road transport, 37RES-E in road transport, 37RES-E in transport, 37RES-E non-road transport, 36RES-E road transport, 36RES-E Share (%), 35RES-H/CConsump on (ktoe), 35–37RES-H/C Share (%), 35RES-T Consump on (ktoe), 35–37RES-T Share (%), 35Solar photovoltaic, 36, 37Solar PV, 36, 37Solar thermal, 36, 37Solid biomass for electricity, 36, 37Solid biomass for heat, 36, 37Tidal, wave and ocean energy, 36,
37Wind power, 36, 37
Czech RepublicBio-ETBE, 42, 43Biodiesel, 42, 43Bioethanol, 42, 43Biofuel consump on, 45Biofuel produc on, 45Biofuels for transport, 42, 43Biogas for electricity, 42, 43Biogas for heat, 42, 43Bioliquids for electricity, 42, 43Bioliquids for heat, 42, 43Biomass for electricity, 42, 43Biomass for heat, 42, 43Biomass heat in households, 42, 43Biomass supply for H and E (ktoe),
44Biomass supply for T (ktoe), 44CHP, 42, 43Concentrated solar power, 42, 43Coopera on Mechanism (%), 41Coopera on Mechanism (ktoe), 41,
45CSP, 42, 43District hea ng, 42, 43Geothermal electricity, 42, 43Geothermal heat, 42, 43GHG emission saving from RES, 45GHGemission saving fromRES-E,45
GHGemission saving fromRES-H/C,45
GHGemission saving fromRES-T,45Heat pumps, 42Hydrogen from renewables, 42, 43Hydropower, 42, 43Land use (ha), 45Offshore wind, 42, 43Onshore wind, 42, 43Renewable energy fromheat pumps,
42, 43RES Overall Share (%), 41RES Total Consump on (ktoe), 41–
43RES-E Capacity (MW), 42, 43RES-E Consump on (GWh), 42, 43RES-E Consump on (ktoe), 41–43RES-E in non-road transport, 43RES-E in road transport, 43RES-E in transport, 43RES-E non-road transport, 42RES-E road transport, 42RES-E Share (%), 41RES-H/CConsump on (ktoe), 41–43RES-H/C Share (%), 41RES-T Consump on (ktoe), 41–43RES-T Share (%), 41Solar photovoltaic, 42, 43Solar PV, 42, 43Solar thermal, 42, 43Solid biomass for electricity, 42, 43Solid biomass for heat, 42, 43Tidal, wave and ocean energy, 42,
43Wind power, 42, 43
DenmarkBio-ETBE, 48, 49Biodiesel, 48, 49Bioethanol, 48, 49Biofuel consump on, 51Biofuel produc on, 51Biofuels for transport, 48, 49Biogas for electricity, 48, 49Biogas for heat, 48, 49Bioliquids for electricity, 48, 49Bioliquids for heat, 48, 49Biomass for electricity, 48, 49Biomass for heat, 48, 49Biomass heat in households, 48, 49
252

Biomass supply for H and E (ktoe),50
Biomass supply for T (ktoe), 50CHP, 48, 49Concentrated solar power, 48, 49Coopera on Mechanism (%), 47Coopera on Mechanism (ktoe), 47,
51CSP, 48, 49District hea ng, 48, 49Geothermal electricity, 48, 49Geothermal heat, 48, 49GHG emission saving from RES, 51GHGemission saving fromRES-E,51GHGemission saving fromRES-H/C,
51GHGemission saving fromRES-T,51Heat pumps, 48Hydrogen from renewables, 48, 49Hydropower, 48, 49Land use (ha), 51Offshore wind, 48, 49Onshore wind, 48, 49Renewable energy fromheat pumps,
48, 49RES Overall Share (%), 47RES Total Consump on (ktoe), 47–
49RES-E Capacity (MW), 48, 49RES-E Consump on (GWh), 48, 49RES-E Consump on (ktoe), 47–49RES-E in non-road transport, 49RES-E in road transport, 49RES-E in transport, 49RES-E non-road transport, 48RES-E road transport, 48RES-E Share (%), 47RES-H/CConsump on (ktoe), 47–49RES-H/C Share (%), 47RES-T Consump on (ktoe), 47–49RES-T Share (%), 47Solar photovoltaic, 48, 49Solar PV, 48, 49Solar thermal, 48, 49Solid biomass for electricity, 48, 49Solid biomass for heat, 48, 49Tidal, wave and ocean energy, 48,
49Wind power, 48, 49
District hea ng
All 27 Member States, 190, 191Austria, 18, 19Belgium, 24, 25Bulgaria, 30, 31Cyprus, 36, 37Czech Republic, 42, 43Denmark, 48, 49Estonia, 54, 55Finland, 60, 61France, 66, 67Germany, 72, 73Greece, 78, 79Hungary, 84, 85Ireland, 90, 91Italy, 96, 97Latvia, 104, 105Lithuania, 110, 111Luxembourg, 116, 117Malta, 122, 123Netherlands, 128, 129Poland, 134, 135Portugal, 142, 143Romania, 148, 149Slovakia, 154, 155Slovenia, 160, 161Spain, 166, 167Sweden, 172, 173United Kingdom, 182, 183
District hea ng (heat) (ktoe)All 27 Member States, 231Austria, 231Belgium, 231Bulgaria, 231Cyprus, 231Czech Republic, 231Denmark, 231Estonia, 231Finland, 231France, 231Germany, 231Greece, 231Hungary, 231Ireland, 231Italy, 231Latvia, 231Lithuania, 231Luxembourg, 231Malta, 231Netherlands, 231Poland, 231
ECN-E--13-076 Index 253

Portugal, 231Romania, 231Slovakia, 231Slovenia, 231Spain, 231Sweden, 231United Kingdom, 231
EstoniaBio-ETBE, 54, 55Biodiesel, 54, 55Bioethanol, 54, 55Biofuel consump on, 57Biofuel produc on, 57Biofuels for transport, 54, 55Biogas for electricity, 54, 55Biogas for heat, 54, 55Bioliquids for electricity, 54, 55Bioliquids for heat, 54, 55Biomass for electricity, 54, 55Biomass for heat, 54, 55Biomass heat in households, 54, 55Biomass supply for H and E (ktoe),
56Biomass supply for T (ktoe), 56CHP, 54, 55Concentrated solar power, 54, 55Coopera on Mechanism (%), 53Coopera on Mechanism (ktoe), 53,
57CSP, 54, 55District hea ng, 54, 55Geothermal electricity, 54, 55Geothermal heat, 54, 55GHG emission saving from RES, 57GHGemission saving fromRES-E,57GHGemission saving fromRES-H/C,
57GHGemission saving fromRES-T,57Heat pumps, 54Hydrogen from renewables, 54, 55Hydropower, 54, 55Land use (ha), 57Offshore wind, 54, 55Onshore wind, 54, 55Renewable energy fromheat pumps,
54, 55RES Overall Share (%), 53RES Total Consump on (ktoe), 53–
55RES-E Capacity (MW), 54, 55
RES-E Consump on (GWh), 54, 55RES-E Consump on (ktoe), 53–55RES-E in non-road transport, 55RES-E in road transport, 55RES-E in transport, 55RES-E non-road transport, 54RES-E road transport, 54RES-E Share (%), 53RES-H/CConsump on (ktoe), 53–55RES-H/C Share (%), 53RES-T Consump on (ktoe), 53–55RES-T Share (%), 53Solar photovoltaic, 54, 55Solar PV, 54, 55Solar thermal, 54, 55Solid biomass for electricity, 54, 55Solid biomass for heat, 54, 55Tidal, wave and ocean energy, 54,
55Wind power, 54, 55
FinlandBio-ETBE, 60, 61Biodiesel, 60, 61Bioethanol, 60, 61Biofuel consump on, 63Biofuel produc on, 63Biofuels for transport, 60, 61Biogas for electricity, 60, 61Biogas for heat, 60, 61Bioliquids for electricity, 60, 61Bioliquids for heat, 60, 61Biomass for electricity, 60, 61Biomass for heat, 60, 61Biomass heat in households, 60, 61Biomass supply for H and E (ktoe),
62Biomass supply for T (ktoe), 62CHP, 60, 61Concentrated solar power, 60, 61Coopera on Mechanism (%), 59Coopera on Mechanism (ktoe), 59,
63CSP, 60, 61District hea ng, 60, 61Geothermal electricity, 60, 61Geothermal heat, 60, 61GHG emission saving from RES, 63GHGemission saving fromRES-E,63GHGemission saving fromRES-H/C,
63
254

GHGemission saving fromRES-T,63Heat pumps, 60Hydrogen from renewables, 60, 61Hydropower, 60, 61Land use (ha), 63Offshore wind, 60, 61Onshore wind, 60, 61Renewable energy fromheat pumps,
60, 61RES Overall Share (%), 59RES Total Consump on (ktoe), 59–
61RES-E Capacity (MW), 60, 61RES-E Consump on (GWh), 60, 61RES-E Consump on (ktoe), 59–61RES-E in non-road transport, 61RES-E in road transport, 61RES-E in transport, 61RES-E non-road transport, 60RES-E road transport, 60RES-E Share (%), 59RES-H/CConsump on (ktoe), 59–61RES-H/C Share (%), 59RES-T Consump on (ktoe), 59–61RES-T Share (%), 59Solar photovoltaic, 60, 61Solar PV, 60, 61Solar thermal, 60, 61Solid biomass for electricity, 60, 61Solid biomass for heat, 60, 61Tidal, wave and ocean energy, 60,
61Wind power, 60, 61
FranceBio-ETBE, 66, 67Biodiesel, 66, 67Bioethanol, 66, 67Biofuel consump on, 69Biofuel produc on, 69Biofuels for transport, 66, 67Biogas for electricity, 66, 67Biogas for heat, 66, 67Bioliquids for electricity, 66, 67Bioliquids for heat, 66, 67Biomass for electricity, 66, 67Biomass for heat, 66, 67Biomass heat in households, 66, 67Biomass supply for H and E (ktoe),
68Biomass supply for T (ktoe), 68
CHP, 66, 67Concentrated solar power, 66, 67Coopera on Mechanism (%), 65Coopera on Mechanism (ktoe), 65,
69CSP, 66, 67District hea ng, 66, 67Geothermal electricity, 66, 67Geothermal heat, 66, 67GHG emission saving from RES, 69GHGemission saving fromRES-E,69GHGemission saving fromRES-H/C,
69GHGemission saving fromRES-T,69Heat pumps, 66Hydrogen from renewables, 66, 67Hydropower, 66, 67Land use (ha), 69Offshore wind, 66, 67Onshore wind, 66, 67Renewable energy fromheat pumps,
66, 67RES Overall Share (%), 65RES Total Consump on (ktoe), 65–
67RES-E Capacity (MW), 66, 67RES-E Consump on (GWh), 66, 67RES-E Consump on (ktoe), 65–67RES-E in non-road transport, 67RES-E in road transport, 67RES-E in transport, 67RES-E non-road transport, 66RES-E road transport, 66RES-E Share (%), 65RES-H/CConsump on (ktoe), 65–67RES-H/C Share (%), 65RES-T Consump on (ktoe), 65–67RES-T Share (%), 65Solar photovoltaic, 66, 67Solar PV, 66, 67Solar thermal, 66, 67Solid biomass for electricity, 66, 67Solid biomass for heat, 66, 67Tidal, wave and ocean energy, 66,
67Wind power, 66, 67
Geothermal electricityAll 27Member States, 190, 191, 211Austria, 18, 19, 211Belgium, 24, 25, 211
ECN-E--13-076 Index 255

Bulgaria, 30, 31, 211Cyprus, 36, 37, 211Czech Republic, 42, 43, 211Denmark, 48, 49, 211Estonia, 54, 55, 211Finland, 60, 61, 211France, 66, 67, 211Germany, 72, 73, 211Greece, 78, 79, 211Hungary, 84, 85, 211Ireland, 90, 91, 211Italy, 96, 97, 211Latvia, 104, 105, 211Lithuania, 110, 111, 211Luxembourg, 116, 117, 211Malta, 122, 123, 211Netherlands, 128, 129, 211Poland, 134, 135, 211Portugal, 142, 143, 211Romania, 148, 149, 211Slovakia, 154, 155, 211Slovenia, 160, 161, 211Spain, 166, 167, 211Sweden, 172, 173, 211United Kingdom, 182, 183, 211
Geothermal heatAll 27 Member States, 190, 191Austria, 18, 19Belgium, 24, 25Bulgaria, 30, 31Cyprus, 36, 37Czech Republic, 42, 43Denmark, 48, 49Estonia, 54, 55Finland, 60, 61France, 66, 67Germany, 72, 73Greece, 78, 79Hungary, 84, 85Ireland, 90, 91Italy, 96, 97Latvia, 104, 105Lithuania, 110, 111Luxembourg, 116, 117Malta, 122, 123Netherlands, 128, 129Poland, 134, 135Portugal, 142, 143Romania, 148, 149Slovakia, 154, 155
Slovenia, 160, 161Spain, 166, 167Sweden, 172, 173United Kingdom, 182, 183
Geothermal heat (ktoe)All 27 Member States, 225Austria, 225Belgium, 225Bulgaria, 225Cyprus, 225Czech Republic, 225Denmark, 225Estonia, 225Finland, 225France, 225Germany, 225Greece, 225Hungary, 225Ireland, 225Italy, 225Latvia, 225Lithuania, 225Luxembourg, 225Malta, 225Netherlands, 225Poland, 225Portugal, 225Romania, 225Slovakia, 225Slovenia, 225Spain, 225Sweden, 225United Kingdom, 225
GermanyBio-ETBE, 72, 73Biodiesel, 72, 73Bioethanol, 72, 73Biofuel consump on, 75Biofuel produc on, 75Biofuels for transport, 72, 73Biogas for electricity, 72, 73Biogas for heat, 72, 73Bioliquids for electricity, 72, 73Bioliquids for heat, 72, 73Biomass for electricity, 72, 73Biomass for heat, 72, 73Biomass heat in households, 72, 73Biomass supply for H and E (ktoe),
74Biomass supply for T (ktoe), 74
256

CHP, 72, 73Concentrated solar power, 72, 73Coopera on Mechanism (%), 71Coopera on Mechanism (ktoe), 71,
75CSP, 72, 73District hea ng, 72, 73Geothermal electricity, 72, 73Geothermal heat, 72, 73GHG emission saving from RES, 75GHGemission saving fromRES-E,75GHGemission saving fromRES-H/C,
75GHGemission saving fromRES-T,75Heat pumps, 72Hydrogen from renewables, 72, 73Hydropower, 72, 73Land use (ha), 75Offshore wind, 72, 73Onshore wind, 72, 73Renewable energy fromheat pumps,
72, 73RES Overall Share (%), 71RES Total Consump on (ktoe), 71–
73RES-E Capacity (MW), 72, 73RES-E Consump on (GWh), 72, 73RES-E Consump on (ktoe), 71–73RES-E in non-road transport, 73RES-E in road transport, 73RES-E in transport, 73RES-E non-road transport, 72RES-E road transport, 72RES-E Share (%), 71RES-H/CConsump on (ktoe), 71–73RES-H/C Share (%), 71RES-T Consump on (ktoe), 71–73RES-T Share (%), 71Solar photovoltaic, 72, 73Solar PV, 72, 73Solar thermal, 72, 73Solid biomass for electricity, 72, 73Solid biomass for heat, 72, 73Tidal, wave and ocean energy, 72,
73Wind power, 72, 73
GHG emission saving from RESAll 27 Member States, 193Austria, 21Belgium, 27
Bulgaria, 33Cyprus, 39Czech Republic, 45Denmark, 51Estonia, 57Finland, 63France, 69Germany, 75Greece, 81Hungary, 87Ireland, 93Italy, 99Latvia, 107Lithuania, 113Luxembourg, 119Malta, 125Netherlands, 131Poland, 137Portugal, 145Romania, 151Slovakia, 157Slovenia, 163Spain, 169Sweden, 175United Kingdom, 185
GHG emission saving from RES-EAll 27 Member States, 193Austria, 21Belgium, 27Bulgaria, 33Cyprus, 39Czech Republic, 45Denmark, 51Estonia, 57Finland, 63France, 69Germany, 75Greece, 81Hungary, 87Ireland, 93Italy, 99Latvia, 107Lithuania, 113Luxembourg, 119Malta, 125Netherlands, 131Poland, 137Portugal, 145Romania, 151Slovakia, 157
ECN-E--13-076 Index 257

Slovenia, 163Spain, 169Sweden, 175United Kingdom, 185
GHG emission saving from RES-H/CAll 27 Member States, 193Austria, 21Belgium, 27Bulgaria, 33Cyprus, 39Czech Republic, 45Denmark, 51Estonia, 57Finland, 63France, 69Germany, 75Greece, 81Hungary, 87Ireland, 93Italy, 99Latvia, 107Lithuania, 113Luxembourg, 119Malta, 125Netherlands, 131Poland, 137Portugal, 145Romania, 151Slovakia, 157Slovenia, 163Spain, 169Sweden, 175United Kingdom, 185
GHG emission saving from RES-TAll 27 Member States, 193Austria, 21Belgium, 27Bulgaria, 33Cyprus, 39Czech Republic, 45Denmark, 51Estonia, 57Finland, 63France, 69Germany, 75Greece, 81Hungary, 87Ireland, 93Italy, 99Latvia, 107
Lithuania, 113Luxembourg, 119Malta, 125Netherlands, 131Poland, 137Portugal, 145Romania, 151Slovakia, 157Slovenia, 163Spain, 169Sweden, 175United Kingdom, 185
GreeceBio-ETBE, 78, 79Biodiesel, 78, 79Bioethanol, 78, 79Biofuel consump on, 81Biofuel produc on, 81Biofuels for transport, 78, 79Biogas for electricity, 78, 79Biogas for heat, 78, 79Bioliquids for electricity, 78, 79Bioliquids for heat, 78, 79Biomass for electricity, 78, 79Biomass for heat, 78, 79Biomass heat in households, 78, 79Biomass supply for H and E (ktoe),
80Biomass supply for T (ktoe), 80CHP, 78, 79Concentrated solar power, 78, 79Coopera on Mechanism (%), 77Coopera on Mechanism (ktoe), 77,
81CSP, 78, 79District hea ng, 78, 79Geothermal electricity, 78, 79Geothermal heat, 78, 79GHG emission saving from RES, 81GHGemission saving fromRES-E,81GHGemission saving fromRES-H/C,
81GHGemission saving fromRES-T,81Heat pumps, 78Hydrogen from renewables, 78, 79Hydropower, 78, 79Land use (ha), 81Offshore wind, 78, 79Onshore wind, 78, 79
258

Renewable energy fromheat pumps,78, 79
RES Overall Share (%), 77RES Total Consump on (ktoe), 77–
79RES-E Capacity (MW), 78, 79RES-E Consump on (GWh), 78, 79RES-E Consump on (ktoe), 77–79RES-E in non-road transport, 79RES-E in road transport, 79RES-E in transport, 79RES-E non-road transport, 78RES-E road transport, 78RES-E Share (%), 77RES-H/CConsump on (ktoe), 77–79RES-H/C Share (%), 77RES-T Consump on (ktoe), 77–79RES-T Share (%), 77Solar photovoltaic, 78, 79Solar PV, 78, 79Solar thermal, 78, 79Solid biomass for electricity, 78, 79Solid biomass for heat, 78, 79Tidal, wave and ocean energy, 78,
79Wind power, 78, 79
Heat pumpsAll 27 Member States, 190Austria, 18Belgium, 24Bulgaria, 30Cyprus, 36Czech Republic, 42Denmark, 48Estonia, 54Finland, 60France, 66Germany, 72Greece, 78Hungary, 84Ireland, 90Italy, 96Latvia, 104Lithuania, 110Luxembourg, 116Malta, 122Netherlands, 128Poland, 134Portugal, 142Romania, 148
Slovakia, 154Slovenia, 160Spain, 166Sweden, 172United Kingdom, 182
HungaryBio-ETBE, 84, 85Biodiesel, 84, 85Bioethanol, 84, 85Biofuel consump on, 87Biofuel produc on, 87Biofuels for transport, 84, 85Biogas for electricity, 84, 85Biogas for heat, 84, 85Bioliquids for electricity, 84, 85Bioliquids for heat, 84, 85Biomass for electricity, 84, 85Biomass for heat, 84, 85Biomass heat in households, 84, 85Biomass supply for H and E (ktoe),
86Biomass supply for T (ktoe), 86CHP, 84, 85Concentrated solar power, 84, 85Coopera on Mechanism (%), 83Coopera on Mechanism (ktoe), 83,
87CSP, 84, 85District hea ng, 84, 85Geothermal electricity, 84, 85Geothermal heat, 84, 85GHG emission saving from RES, 87GHGemission saving fromRES-E,87GHGemission saving fromRES-H/C,
87GHGemission saving fromRES-T,87Heat pumps, 84Hydrogen from renewables, 84, 85Hydropower, 84, 85Land use (ha), 87Offshore wind, 84, 85Onshore wind, 84, 85Renewable energy fromheat pumps,
84, 85RES Overall Share (%), 83RES Total Consump on (ktoe), 83–
85RES-E Capacity (MW), 84, 85RES-E Consump on (GWh), 84, 85RES-E Consump on (ktoe), 83–85
ECN-E--13-076 Index 259

RES-E in non-road transport, 85RES-E in road transport, 85RES-E in transport, 85RES-E non-road transport, 84RES-E road transport, 84RES-E Share (%), 83RES-H/CConsump on (ktoe), 83–85RES-H/C Share (%), 83RES-T Consump on (ktoe), 83–85RES-T Share (%), 83Solar photovoltaic, 84, 85Solar PV, 84, 85Solar thermal, 84, 85Solid biomass for electricity, 84, 85Solid biomass for heat, 84, 85Tidal, wave and ocean energy, 84,
85Wind power, 84, 85
Hydrogen from renewablesAll 27 Member States, 190, 191Austria, 18, 19Belgium, 24, 25Bulgaria, 30, 31Cyprus, 36, 37Czech Republic, 42, 43Denmark, 48, 49Estonia, 54, 55Finland, 60, 61France, 66, 67Germany, 72, 73Greece, 78, 79Hungary, 84, 85Ireland, 90, 91Italy, 96, 97Latvia, 104, 105Lithuania, 110, 111Luxembourg, 116, 117Malta, 122, 123Netherlands, 128, 129Poland, 134, 135Portugal, 142, 143Romania, 148, 149Slovakia, 154, 155Slovenia, 160, 161Spain, 166, 167Sweden, 172, 173United Kingdom, 182, 183
Hydrogen from renewables (ktoe)All 27 Member States, 237Austria, 237
Belgium, 237Bulgaria, 237Cyprus, 237Czech Republic, 237Denmark, 237Estonia, 237Finland, 237France, 237Germany, 237Greece, 237Hungary, 237Ireland, 237Italy, 237Latvia, 237Lithuania, 237Luxembourg, 237Malta, 237Netherlands, 237Poland, 237Portugal, 237Romania, 237Slovakia, 237Slovenia, 237Spain, 237Sweden, 237United Kingdom, 237
HydropowerAll 27Member States, 190, 191, 204–
210Austria, 18, 19, 204–210Belgium, 24, 25, 204–210Bulgaria, 30, 31, 204–210Cyprus, 36, 37, 204–210Czech Republic, 42, 43, 204–210Denmark, 48, 49, 204–210Estonia, 54, 55, 204–210Finland, 60, 61, 204–210France, 66, 67, 204–210Germany, 72, 73, 204–210Greece, 78, 79, 204–210Hungary, 84, 85, 204–210Ireland, 90, 91, 204–210Italy, 96, 97, 204–210Latvia, 104, 105, 204–210Lithuania, 110, 111, 204–210Luxembourg, 116, 117, 204–210Malta, 122, 123, 204–210Netherlands, 128, 129, 204–210Poland, 134, 135, 204–210Portugal, 142, 143, 204–210
260

Romania, 148, 149, 204–210Slovakia, 154, 155, 204–210Slovenia, 160, 161, 204–210Spain, 166, 167, 204–210Sweden, 172, 173, 204–210United Kingdom, 182, 183, 204–210
IrelandBio-ETBE, 90, 91Biodiesel, 90, 91Bioethanol, 90, 91Biofuel consump on, 93Biofuel produc on, 93Biofuels for transport, 90, 91Biogas for electricity, 90, 91Biogas for heat, 90, 91Bioliquids for electricity, 90, 91Bioliquids for heat, 90, 91Biomass for electricity, 90, 91Biomass for heat, 90, 91Biomass heat in households, 90, 91Biomass supply for H and E (ktoe),
92Biomass supply for T (ktoe), 92CHP, 90, 91Concentrated solar power, 90, 91Coopera on Mechanism (%), 89Coopera on Mechanism (ktoe), 89,
93CSP, 90, 91District hea ng, 90, 91Geothermal electricity, 90, 91Geothermal heat, 90, 91GHG emission saving from RES, 93GHGemission saving fromRES-E,93GHGemission saving fromRES-H/C,
93GHGemission saving fromRES-T,93Heat pumps, 90Hydrogen from renewables, 90, 91Hydropower, 90, 91Land use (ha), 93Offshore wind, 90, 91Onshore wind, 90, 91Renewable energy fromheat pumps,
90, 91RES Overall Share (%), 89RES Total Consump on (ktoe), 89–
91RES-E Capacity (MW), 90, 91RES-E Consump on (GWh), 90, 91
RES-E Consump on (ktoe), 89–91RES-E in non-road transport, 91RES-E in road transport, 91RES-E in transport, 91RES-E non-road transport, 90RES-E road transport, 90RES-E Share (%), 89RES-H/CConsump on (ktoe), 89–91RES-H/C Share (%), 89RES-T Consump on (ktoe), 89–91RES-T Share (%), 89Solar photovoltaic, 90, 91Solar PV, 90, 91Solar thermal, 90, 91Solid biomass for electricity, 90, 91Solid biomass for heat, 90, 91Tidal, wave and ocean energy, 90,
91Wind power, 90, 91
ItalyBio-ETBE, 96, 97Biodiesel, 96, 97Bioethanol, 96, 97Biofuel consump on, 99Biofuel produc on, 99Biofuels for transport, 96, 97Biogas for electricity, 96, 97Biogas for heat, 96, 97Bioliquids for electricity, 96, 97Bioliquids for heat, 96, 97Biomass for electricity, 96, 97Biomass for heat, 96, 97Biomass heat in households, 96, 97Biomass supply for H and E (ktoe),
98Biomass supply for T (ktoe), 98CHP, 96, 97Concentrated solar power, 96, 97Coopera on Mechanism (%), 95Coopera on Mechanism (ktoe), 95,
99CSP, 96, 97District hea ng, 96, 97Geothermal electricity, 96, 97Geothermal heat, 96, 97GHG emission saving from RES, 99GHGemission saving fromRES-E,99GHGemission saving fromRES-H/C,
99GHGemission saving fromRES-T,99
ECN-E--13-076 Index 261

Heat pumps, 96Hydrogen from renewables, 96, 97Hydropower, 96, 97Land use (ha), 99Offshore wind, 96, 97Onshore wind, 96, 97Renewable energy fromheat pumps,
96, 97RES Overall Share (%), 95RES Total Consump on (ktoe), 95–
97RES-E Capacity (MW), 96, 97RES-E Consump on (GWh), 96, 97RES-E Consump on (ktoe), 95–97RES-E in non-road transport, 97RES-E in road transport, 97RES-E in transport, 97RES-E non-road transport, 96RES-E road transport, 96RES-E Share (%), 95RES-H/CConsump on (ktoe), 95–97RES-H/C Share (%), 95RES-T Consump on (ktoe), 95–97RES-T Share (%), 95Solar photovoltaic, 96, 97Solar PV, 96, 97Solar thermal, 96, 97Solid biomass for electricity, 96, 97Solid biomass for heat, 96, 97Tidal, wave and ocean energy, 96,
97Wind power, 96, 97
Land use (ha)All 27 Member States, 193Austria, 21Belgium, 27Bulgaria, 33Cyprus, 39Czech Republic, 45Denmark, 51Estonia, 57Finland, 63France, 69Germany, 75Greece, 81Hungary, 87Ireland, 93Italy, 99Latvia, 107Lithuania, 113
Luxembourg, 119Malta, 125Netherlands, 131Poland, 137Portugal, 145Romania, 151Slovakia, 157Slovenia, 163Spain, 169Sweden, 175United Kingdom, 185
LatviaBio-ETBE, 104, 105Biodiesel, 104, 105Bioethanol, 104, 105Biofuel consump on, 107Biofuel produc on, 107Biofuels for transport, 104, 105Biogas for electricity, 104, 105Biogas for heat, 104, 105Bioliquids for electricity, 104, 105Bioliquids for heat, 104, 105Biomass for electricity, 104, 105Biomass for heat, 104, 105Biomass heat in households, 104, 105Biomass supply for H and E (ktoe),
106Biomass supply for T (ktoe), 106CHP, 104, 105Concentrated solar power, 104, 105Coopera on Mechanism (%), 103Coopera onMechanism (ktoe), 103,
107CSP, 104, 105District hea ng, 104, 105Geothermal electricity, 104, 105Geothermal heat, 104, 105GHG emission saving from RES, 107GHGemission saving fromRES-E,107GHGemission saving fromRES-H/C,
107GHGemission saving fromRES-T,107Heat pumps, 104Hydrogen from renewables, 104, 105Hydropower, 104, 105Land use (ha), 107Offshore wind, 104, 105Onshore wind, 104, 105Renewable energy fromheat pumps,
104, 105
262
RES Overall Share (%), 103RES Total Consump on (ktoe), 103–
105RES-E Capacity (MW), 104, 105RES-E Consump on (GWh), 104, 105RES-E Consump on (ktoe), 103–105RES-E in non-road transport, 105RES-E in road transport, 105RES-E in transport, 105RES-E non-road transport, 104RES-E road transport, 104RES-E Share (%), 103RES-H/C Consump on (ktoe), 103–
105RES-H/C Share (%), 103RES-T Consump on (ktoe), 103–105RES-T Share (%), 103Solar photovoltaic, 104, 105Solar PV, 104, 105Solar thermal, 104, 105Solid biomass for electricity, 104, 105Solid biomass for heat, 104, 105Tidal, wave and ocean energy, 104,
105Wind power, 104, 105
LithuaniaBio-ETBE, 110, 111Biodiesel, 110, 111Bioethanol, 110, 111Biofuel consump on, 113Biofuel produc on, 113Biofuels for transport, 110, 111Biogas for electricity, 110, 111Biogas for heat, 110, 111Bioliquids for electricity, 110, 111Bioliquids for heat, 110, 111Biomass for electricity, 110, 111Biomass for heat, 110, 111Biomass heat in households, 110, 111Biomass supply for H and E (ktoe),
112Biomass supply for T (ktoe), 112CHP, 110, 111Concentrated solar power, 110, 111Coopera on Mechanism (%), 109Coopera onMechanism (ktoe), 109,
113CSP, 110, 111District hea ng, 110, 111Geothermal electricity, 110, 111
Geothermal heat, 110, 111GHG emission saving from RES, 113GHGemission saving fromRES-E,113GHGemission saving fromRES-H/C,
113GHGemission saving fromRES-T,113Heat pumps, 110Hydrogen from renewables, 110, 111Hydropower, 110, 111Land use (ha), 113Offshore wind, 110, 111Onshore wind, 110, 111Renewable energy fromheat pumps,
110, 111RES Overall Share (%), 109RES Total Consump on (ktoe), 109–
111RES-E Capacity (MW), 110, 111RES-E Consump on (GWh), 110, 111RES-E Consump on (ktoe), 109–111RES-E in non-road transport, 111RES-E in road transport, 111RES-E in transport, 111RES-E non-road transport, 110RES-E road transport, 110RES-E Share (%), 109RES-H/C Consump on (ktoe), 109–
111RES-H/C Share (%), 109RES-T Consump on (ktoe), 109–111RES-T Share (%), 109Solar photovoltaic, 110, 111Solar PV, 110, 111Solar thermal, 110, 111Solid biomass for electricity, 110, 111Solid biomass for heat, 110, 111Tidal, wave and ocean energy, 110,
111Wind power, 110, 111
LuxembourgBio-ETBE, 116, 117Biodiesel, 116, 117Bioethanol, 116, 117Biofuel consump on, 119Biofuel produc on, 119Biofuels for transport, 116, 117Biogas for electricity, 116, 117Biogas for heat, 116, 117Bioliquids for electricity, 116, 117Bioliquids for heat, 116, 117
ECN-E--13-076 Index 263

Biomass for electricity, 116, 117Biomass for heat, 116, 117Biomass heat in households, 116, 117Biomass supply for H and E (ktoe),
118Biomass supply for T (ktoe), 118CHP, 116, 117Concentrated solar power, 116, 117Coopera on Mechanism (%), 115Coopera onMechanism (ktoe), 115,
119CSP, 116, 117District hea ng, 116, 117Geothermal electricity, 116, 117Geothermal heat, 116, 117GHG emission saving from RES, 119GHGemission saving fromRES-E,119GHGemission saving fromRES-H/C,
119GHGemission saving fromRES-T,119Heat pumps, 116Hydrogen from renewables, 116, 117Hydropower, 116, 117Land use (ha), 119Offshore wind, 116, 117Onshore wind, 116, 117Renewable energy fromheat pumps,
116, 117RES Overall Share (%), 115RES Total Consump on (ktoe), 115–
117RES-E Capacity (MW), 116, 117RES-E Consump on (GWh), 116, 117RES-E Consump on (ktoe), 115–117RES-E in non-road transport, 117RES-E in road transport, 117RES-E in transport, 117RES-E non-road transport, 116RES-E road transport, 116RES-E Share (%), 115RES-H/C Consump on (ktoe), 115–
117RES-H/C Share (%), 115RES-T Consump on (ktoe), 115–117RES-T Share (%), 115Solar photovoltaic, 116, 117Solar PV, 116, 117Solar thermal, 116, 117Solid biomass for electricity, 116, 117Solid biomass for heat, 116, 117
Tidal, wave and ocean energy, 116,117
Wind power, 116, 117
MaltaBio-ETBE, 122, 123Biodiesel, 122, 123Bioethanol, 122, 123Biofuel consump on, 125Biofuel produc on, 125Biofuels for transport, 122, 123Biogas for electricity, 122, 123Biogas for heat, 122, 123Bioliquids for electricity, 122, 123Bioliquids for heat, 122, 123Biomass for electricity, 122, 123Biomass for heat, 122, 123Biomass heat in households, 122, 123Biomass supply for H and E (ktoe),
124Biomass supply for T (ktoe), 124CHP, 122, 123Concentrated solar power, 122, 123Coopera on Mechanism (%), 121Coopera onMechanism (ktoe), 121,
125CSP, 122, 123District hea ng, 122, 123Geothermal electricity, 122, 123Geothermal heat, 122, 123GHG emission saving from RES, 125GHGemission saving fromRES-E,125GHGemission saving fromRES-H/C,
125GHGemission saving fromRES-T,125Heat pumps, 122Hydrogen from renewables, 122, 123Hydropower, 122, 123Land use (ha), 125Offshore wind, 122, 123Onshore wind, 122, 123Renewable energy fromheat pumps,
122, 123RES Overall Share (%), 121RES Total Consump on (ktoe), 121–
123RES-E Capacity (MW), 122, 123RES-E Consump on (GWh), 122, 123RES-E Consump on (ktoe), 121–123RES-E in non-road transport, 123RES-E in road transport, 123
264
RES-E in transport, 123RES-E non-road transport, 122RES-E road transport, 122RES-E Share (%), 121RES-H/C Consump on (ktoe), 121–
123RES-H/C Share (%), 121RES-T Consump on (ktoe), 121–123RES-T Share (%), 121Solar photovoltaic, 122, 123Solar PV, 122, 123Solar thermal, 122, 123Solid biomass for electricity, 122, 123Solid biomass for heat, 122, 123Tidal, wave and ocean energy, 122,
123Wind power, 122, 123
NetherlandsBio-ETBE, 128, 129Biodiesel, 128, 129Bioethanol, 128, 129Biofuel consump on, 131Biofuel produc on, 131Biofuels for transport, 128, 129Biogas for electricity, 128, 129Biogas for heat, 128, 129Bioliquids for electricity, 128, 129Bioliquids for heat, 128, 129Biomass for electricity, 128, 129Biomass for heat, 128, 129Biomass heat in households, 128, 129Biomass supply for H and E (ktoe),
130Biomass supply for T (ktoe), 130CHP, 128, 129Concentrated solar power, 128, 129Coopera on Mechanism (%), 127Coopera onMechanism (ktoe), 127,
131CSP, 128, 129District hea ng, 128, 129Geothermal electricity, 128, 129Geothermal heat, 128, 129GHG emission saving from RES, 131GHGemission saving fromRES-E,131GHGemission saving fromRES-H/C,
131GHGemission saving fromRES-T,131Heat pumps, 128Hydrogen from renewables, 128, 129
Hydropower, 128, 129Land use (ha), 131Offshore wind, 128, 129Onshore wind, 128, 129Renewable energy fromheat pumps,
128, 129RES Overall Share (%), 127RES Total Consump on (ktoe), 127–
129RES-E Capacity (MW), 128, 129RES-E Consump on (GWh), 128, 129RES-E Consump on (ktoe), 127–129RES-E in non-road transport, 129RES-E in road transport, 129RES-E in transport, 129RES-E non-road transport, 128RES-E road transport, 128RES-E Share (%), 127RES-H/C Consump on (ktoe), 127–
129RES-H/C Share (%), 127RES-T Consump on (ktoe), 127–129RES-T Share (%), 127Solar photovoltaic, 128, 129Solar PV, 128, 129Solar thermal, 128, 129Solid biomass for electricity, 128, 129Solid biomass for heat, 128, 129Tidal, wave and ocean energy, 128,
129Wind power, 128, 129
Offshore windAll 27Member States, 190, 191, 218Austria, 18, 19, 218Belgium, 24, 25, 218Bulgaria, 30, 31, 218Cyprus, 36, 37, 218Czech Republic, 42, 43, 218Denmark, 48, 49, 218Estonia, 54, 55, 218Finland, 60, 61, 218France, 66, 67, 218Germany, 72, 73, 218Greece, 78, 79, 218Hungary, 84, 85, 218Ireland, 90, 91, 218Italy, 96, 97, 218Latvia, 104, 105, 218Lithuania, 110, 111, 218Luxembourg, 116, 117, 218
ECN-E--13-076 Index 265

Malta, 122, 123, 218Netherlands, 128, 129, 218Poland, 134, 135, 218Portugal, 142, 143, 218Romania, 148, 149, 218Slovakia, 154, 155, 218Slovenia, 160, 161, 218Spain, 166, 167, 218Sweden, 172, 173, 218United Kingdom, 182, 183, 218
Onshore windAll 27Member States, 190, 191, 217Austria, 18, 19, 217Belgium, 24, 25, 217Bulgaria, 30, 31, 217Cyprus, 36, 37, 217Czech Republic, 42, 43, 217Denmark, 48, 49, 217Estonia, 54, 55, 217Finland, 60, 61, 217France, 66, 67, 217Germany, 72, 73, 217Greece, 78, 79, 217Hungary, 84, 85, 217Ireland, 90, 91, 217Italy, 96, 97, 217Latvia, 104, 105, 217Lithuania, 110, 111, 217Luxembourg, 116, 117, 217Malta, 122, 123, 217Netherlands, 128, 129, 217Poland, 134, 135, 217Portugal, 142, 143, 217Romania, 148, 149, 217Slovakia, 154, 155, 217Slovenia, 160, 161, 217Spain, 166, 167, 217Sweden, 172, 173, 217United Kingdom, 182, 183, 217
PolandBio-ETBE, 134, 135Biodiesel, 134, 135Bioethanol, 134, 135Biofuel consump on, 137Biofuel produc on, 137Biofuels for transport, 134, 135Biogas for electricity, 134, 135Biogas for heat, 134, 135Bioliquids for electricity, 134, 135Bioliquids for heat, 134, 135
Biomass for electricity, 134, 135Biomass for heat, 134, 135Biomass heat in households, 134, 135Biomass supply for H and E (ktoe),
136Biomass supply for T (ktoe), 136CHP, 134, 135Concentrated solar power, 134, 135Coopera on Mechanism (%), 133Coopera onMechanism (ktoe), 133,
137CSP, 134, 135District hea ng, 134, 135Geothermal electricity, 134, 135Geothermal heat, 134, 135GHG emission saving from RES, 137GHGemission saving fromRES-E,137GHGemission saving fromRES-H/C,
137GHGemission saving fromRES-T,137Heat pumps, 134Hydrogen from renewables, 134, 135Hydropower, 134, 135Land use (ha), 137Offshore wind, 134, 135Onshore wind, 134, 135Renewable energy fromheat pumps,
134, 135RES Overall Share (%), 133RES Total Consump on (ktoe), 133–
135RES-E Capacity (MW), 134, 135RES-E Consump on (GWh), 134, 135RES-E Consump on (ktoe), 133–135RES-E in non-road transport, 135RES-E in road transport, 135RES-E in transport, 135RES-E non-road transport, 134RES-E road transport, 134RES-E Share (%), 133RES-H/C Consump on (ktoe), 133–
135RES-H/C Share (%), 133RES-T Consump on (ktoe), 133–135RES-T Share (%), 133Solar photovoltaic, 134, 135Solar PV, 134, 135Solar thermal, 134, 135Solid biomass for electricity, 134, 135Solid biomass for heat, 134, 135
266
Tidal, wave and ocean energy, 134,135
Wind power, 134, 135Portugal
Bio-ETBE, 142, 143Biodiesel, 142, 143Bioethanol, 142, 143Biofuel consump on, 145Biofuel produc on, 145Biofuels for transport, 142, 143Biogas for electricity, 142, 143Biogas for heat, 142, 143Bioliquids for electricity, 142, 143Bioliquids for heat, 142, 143Biomass for electricity, 142, 143Biomass for heat, 142, 143Biomass heat in households, 142, 143Biomass supply for H and E (ktoe),
144Biomass supply for T (ktoe), 144CHP, 142, 143Concentrated solar power, 142, 143Coopera on Mechanism (%), 141Coopera onMechanism (ktoe), 141,
145CSP, 142, 143District hea ng, 142, 143Geothermal electricity, 142, 143Geothermal heat, 142, 143GHG emission saving from RES, 145GHGemission saving fromRES-E,145GHGemission saving fromRES-H/C,
145GHGemission saving fromRES-T,145Heat pumps, 142Hydrogen from renewables, 142, 143Hydropower, 142, 143Land use (ha), 145Offshore wind, 142, 143Onshore wind, 142, 143Renewable energy fromheat pumps,
142, 143RES Overall Share (%), 141RES Total Consump on (ktoe), 141–
143RES-E Capacity (MW), 142, 143RES-E Consump on (GWh), 142, 143RES-E Consump on (ktoe), 141–143RES-E in non-road transport, 143RES-E in road transport, 143
RES-E in transport, 143RES-E non-road transport, 142RES-E road transport, 142RES-E Share (%), 141RES-H/C Consump on (ktoe), 141–
143RES-H/C Share (%), 141RES-T Consump on (ktoe), 141–143RES-T Share (%), 141Solar photovoltaic, 142, 143Solar PV, 142, 143Solar thermal, 142, 143Solid biomass for electricity, 142, 143Solid biomass for heat, 142, 143Tidal, wave and ocean energy, 142,
143Wind power, 142, 143
Renewable energy from heat pumpsAll 27 Member States, 190, 191Austria, 18, 19Belgium, 24, 25Bulgaria, 30, 31Cyprus, 36, 37Czech Republic, 42, 43Denmark, 48, 49Estonia, 54, 55Finland, 60, 61France, 66, 67Germany, 72, 73Greece, 78, 79Hungary, 84, 85Ireland, 90, 91Italy, 96, 97Latvia, 104, 105Lithuania, 110, 111Luxembourg, 116, 117Malta, 122, 123Netherlands, 128, 129Poland, 134, 135Portugal, 142, 143Romania, 148, 149Slovakia, 154, 155Slovenia, 160, 161Spain, 166, 167Sweden, 172, 173United Kingdom, 182, 183
Renewable energy fromheat pumps (ktoe)All 27 Member States, 229, 230Austria, 229, 230Belgium, 229, 230
ECN-E--13-076 Index 267

Bulgaria, 229, 230Cyprus, 229, 230Czech Republic, 229, 230Denmark, 229, 230Estonia, 229, 230Finland, 229, 230France, 229, 230Germany, 229, 230Greece, 229, 230Hungary, 229, 230Ireland, 229, 230Italy, 229, 230Latvia, 229, 230Lithuania, 229, 230Luxembourg, 229, 230Malta, 229, 230Netherlands, 229, 230Poland, 229, 230Portugal, 229, 230Romania, 229, 230Slovakia, 229, 230Slovenia, 229, 230Spain, 229, 230Sweden, 229, 230United Kingdom, 229, 230
RES (%)All 27 Member States, 197Austria, 197Belgium, 197Bulgaria, 197Cyprus, 197Czech Republic, 197Denmark, 197Estonia, 197Finland, 197France, 197Germany, 197Greece, 197Hungary, 197Ireland, 197Italy, 197Latvia, 197Lithuania, 197Luxembourg, 197Malta, 197Netherlands, 197Poland, 197Portugal, 197Romania, 197Slovakia, 197
Slovenia, 197Spain, 197Sweden, 197United Kingdom, 197
RES (ktoe)All 27 Member States, 201, 202Austria, 201, 202Belgium, 201, 202Bulgaria, 201, 202Cyprus, 201, 202Czech Republic, 201, 202Denmark, 201, 202Estonia, 201, 202Finland, 201, 202France, 201, 202Germany, 201, 202Greece, 201, 202Hungary, 201, 202Ireland, 201, 202Italy, 201, 202Latvia, 201, 202Lithuania, 201, 202Luxembourg, 201, 202Malta, 201, 202Netherlands, 201, 202Poland, 201, 202Portugal, 201, 202Romania, 201, 202Slovakia, 201, 202Slovenia, 201, 202Spain, 201, 202Sweden, 201, 202United Kingdom, 201, 202
RES Overall Share (%)All 27 Member States, 189Austria, 17Belgium, 23Bulgaria, 29Cyprus, 35Czech Republic, 41Denmark, 47Estonia, 53Finland, 59France, 65Germany, 71Greece, 77Hungary, 83Ireland, 89Italy, 95Latvia, 103
268

Lithuania, 109Luxembourg, 115Malta, 121Netherlands, 127Poland, 133Portugal, 141Romania, 147Slovakia, 153Slovenia, 159Spain, 165Sweden, 171United Kingdom, 181
RES Total Consump on (ktoe)All 27 Member States, 190, 191Austria, 18, 19Belgium, 24, 25Bulgaria, 30, 31Cyprus, 36, 37Czech Republic, 42, 43Denmark, 48, 49Estonia, 54, 55Finland, 60, 61France, 66, 67Germany, 72, 73Greece, 78, 79Hungary, 84, 85Ireland, 90, 91Italy, 96, 97Latvia, 104, 105Lithuania, 110, 111Luxembourg, 116, 117Malta, 122, 123Netherlands, 128, 129Poland, 134, 135Portugal, 142, 143Romania, 148, 149Slovakia, 154, 155Slovenia, 160, 161Spain, 166, 167Sweden, 172, 173United Kingdom, 182, 183
RES-EAll 27 Member States, 223Austria, 223Belgium, 223Bulgaria, 223Cyprus, 223Czech Republic, 223Denmark, 223Estonia, 223
Finland, 223France, 223Germany, 223Greece, 223Hungary, 223Ireland, 223Italy, 223Latvia, 223Lithuania, 223Luxembourg, 223Malta, 223Netherlands, 223Poland, 223Portugal, 223Romania, 223Slovakia, 223Slovenia, 223Spain, 223Sweden, 223United Kingdom, 223
RES-E (%)All 27 Member States, 196Austria, 196Belgium, 196Bulgaria, 196Cyprus, 196Czech Republic, 196Denmark, 196Estonia, 196Finland, 196France, 196Germany, 196Greece, 196Hungary, 196Ireland, 196Italy, 196Latvia, 196Lithuania, 196Luxembourg, 196Malta, 196Netherlands, 196Poland, 196Portugal, 196Romania, 196Slovakia, 196Slovenia, 196Spain, 196Sweden, 196United Kingdom, 196
RES-E (ktoe)
ECN-E--13-076 Index 269
All 27 Member States, 200Austria, 200Belgium, 200Bulgaria, 200Cyprus, 200Czech Republic, 200Denmark, 200Estonia, 200Finland, 200France, 200Germany, 200Greece, 200Hungary, 200Ireland, 200Italy, 200Latvia, 200Lithuania, 200Luxembourg, 200Malta, 200Netherlands, 200Poland, 200Portugal, 200Romania, 200Slovakia, 200Slovenia, 200Spain, 200Sweden, 200United Kingdom, 200
RES-E Capacity (MW)All 27 Member States, 190, 191Austria, 18, 19Belgium, 24, 25Bulgaria, 30, 31Cyprus, 36, 37Czech Republic, 42, 43Denmark, 48, 49Estonia, 54, 55Finland, 60, 61France, 66, 67Germany, 72, 73Greece, 78, 79Hungary, 84, 85Ireland, 90, 91Italy, 96, 97Latvia, 104, 105Lithuania, 110, 111Luxembourg, 116, 117Malta, 122, 123Netherlands, 128, 129Poland, 134, 135
Portugal, 142, 143Romania, 148, 149Slovakia, 154, 155Slovenia, 160, 161Spain, 166, 167Sweden, 172, 173United Kingdom, 182, 183
RES-E Consump on (GWh)All 27 Member States, 190, 191Austria, 18, 19Belgium, 24, 25Bulgaria, 30, 31Cyprus, 36, 37Czech Republic, 42, 43Denmark, 48, 49Estonia, 54, 55Finland, 60, 61France, 66, 67Germany, 72, 73Greece, 78, 79Hungary, 84, 85Ireland, 90, 91Italy, 96, 97Latvia, 104, 105Lithuania, 110, 111Luxembourg, 116, 117Malta, 122, 123Netherlands, 128, 129Poland, 134, 135Portugal, 142, 143Romania, 148, 149Slovakia, 154, 155Slovenia, 160, 161Spain, 166, 167Sweden, 172, 173United Kingdom, 182, 183
RES-E Consump on (ktoe)All 27 Member States, 190, 191Austria, 18, 19Belgium, 24, 25Bulgaria, 30, 31Cyprus, 36, 37Czech Republic, 42, 43Denmark, 48, 49Estonia, 54, 55Finland, 60, 61France, 66, 67Germany, 72, 73Greece, 78, 79Hungary, 84, 85
270
Ireland, 90, 91Italy, 96, 97Latvia, 104, 105Lithuania, 110, 111Luxembourg, 116, 117Malta, 122, 123Netherlands, 128, 129Poland, 134, 135Portugal, 142, 143Romania, 148, 149Slovakia, 154, 155Slovenia, 160, 161Spain, 166, 167Sweden, 172, 173United Kingdom, 182, 183
RES-E in non-road transportAll 27 Member States, 191Austria, 19Belgium, 25Bulgaria, 31Cyprus, 37Czech Republic, 43Denmark, 49Estonia, 55Finland, 61France, 67Germany, 73Greece, 79Hungary, 85Ireland, 91Italy, 97Latvia, 105Lithuania, 111Luxembourg, 117Malta, 123Netherlands, 129Poland, 135Portugal, 143Romania, 149Slovakia, 155Slovenia, 161Spain, 167Sweden, 173United Kingdom, 183
RES-E in non-road transport (ktoe)All 27 Member States, 238Austria, 238Belgium, 238Bulgaria, 238Cyprus, 238
Czech Republic, 238Denmark, 238Estonia, 238Finland, 238France, 238Germany, 238Greece, 238Hungary, 238Ireland, 238Italy, 238Latvia, 238Lithuania, 238Luxembourg, 238Malta, 238Netherlands, 238Poland, 238Portugal, 238Romania, 238Slovakia, 238Slovenia, 238Spain, 238Sweden, 238United Kingdom, 238
RES-E in road transportAll 27 Member States, 191Austria, 19Belgium, 25Bulgaria, 31Cyprus, 37Czech Republic, 43Denmark, 49Estonia, 55Finland, 61France, 67Germany, 73Greece, 79Hungary, 85Ireland, 91Italy, 97Latvia, 105Lithuania, 111Luxembourg, 117Malta, 123Netherlands, 129Poland, 135Portugal, 143Romania, 149Slovakia, 155Slovenia, 161Spain, 167
ECN-E--13-076 Index 271

Sweden, 173United Kingdom, 183
RES-E in road transport (ktoe)All 27 Member States, 238Austria, 238Belgium, 238Bulgaria, 238Cyprus, 238Czech Republic, 238Denmark, 238Estonia, 238Finland, 238France, 238Germany, 238Greece, 238Hungary, 238Ireland, 238Italy, 238Latvia, 238Lithuania, 238Luxembourg, 238Malta, 238Netherlands, 238Poland, 238Portugal, 238Romania, 238Slovakia, 238Slovenia, 238Spain, 238Sweden, 238United Kingdom, 238
RES-E in transportAll 27 Member States, 191Austria, 19Belgium, 25Bulgaria, 31Cyprus, 37Czech Republic, 43Denmark, 49Estonia, 55Finland, 61France, 67Germany, 73Greece, 79Hungary, 85Ireland, 91Italy, 97Latvia, 105Lithuania, 111Luxembourg, 117
Malta, 123Netherlands, 129Poland, 135Portugal, 143Romania, 149Slovakia, 155Slovenia, 161Spain, 167Sweden, 173United Kingdom, 183
RES-E in transport (ktoe)All 27 Member States, 237Austria, 237Belgium, 237Bulgaria, 237Cyprus, 237Czech Republic, 237Denmark, 237Estonia, 237Finland, 237France, 237Germany, 237Greece, 237Hungary, 237Ireland, 237Italy, 237Latvia, 237Lithuania, 237Luxembourg, 237Malta, 237Netherlands, 237Poland, 237Portugal, 237Romania, 237Slovakia, 237Slovenia, 237Spain, 237Sweden, 237United Kingdom, 237
RES-E non-road transportAll 27 Member States, 190Austria, 18Belgium, 24Bulgaria, 30Cyprus, 36Czech Republic, 42Denmark, 48Estonia, 54Finland, 60France, 66
272

Germany, 72Greece, 78Hungary, 84Ireland, 90Italy, 96Latvia, 104Lithuania, 110Luxembourg, 116Malta, 122Netherlands, 128Poland, 134Portugal, 142Romania, 148Slovakia, 154Slovenia, 160Spain, 166Sweden, 172United Kingdom, 182
RES-E road transportAll 27 Member States, 190Austria, 18Belgium, 24Bulgaria, 30Cyprus, 36Czech Republic, 42Denmark, 48Estonia, 54Finland, 60France, 66Germany, 72Greece, 78Hungary, 84Ireland, 90Italy, 96Latvia, 104Lithuania, 110Luxembourg, 116Malta, 122Netherlands, 128Poland, 134Portugal, 142Romania, 148Slovakia, 154Slovenia, 160Spain, 166Sweden, 172United Kingdom, 182
RES-E Share (%)All 27 Member States, 189Austria, 17
Belgium, 23Bulgaria, 29Cyprus, 35Czech Republic, 41Denmark, 47Estonia, 53Finland, 59France, 65Germany, 71Greece, 77Hungary, 83Ireland, 89Italy, 95Latvia, 103Lithuania, 109Luxembourg, 115Malta, 121Netherlands, 127Poland, 133Portugal, 141Romania, 147Slovakia, 153Slovenia, 159Spain, 165Sweden, 171United Kingdom, 181
RES-H/C (%)All 27 Member States, 195Austria, 195Belgium, 195Bulgaria, 195Cyprus, 195Czech Republic, 195Denmark, 195Estonia, 195Finland, 195France, 195Germany, 195Greece, 195Hungary, 195Ireland, 195Italy, 195Latvia, 195Lithuania, 195Luxembourg, 195Malta, 195Netherlands, 195Poland, 195Portugal, 195Romania, 195
ECN-E--13-076 Index 273

Slovakia, 195Slovenia, 195Spain, 195Sweden, 195United Kingdom, 195
RES-H/C (ktoe)All 27 Member States, 199, 231Austria, 199, 231Belgium, 199, 231Bulgaria, 199, 231Cyprus, 199, 231Czech Republic, 199, 231Denmark, 199, 231Estonia, 199, 231Finland, 199, 231France, 199, 231Germany, 199, 231Greece, 199, 231Hungary, 199, 231Ireland, 199, 231Italy, 199, 231Latvia, 199, 231Lithuania, 199, 231Luxembourg, 199, 231Malta, 199, 231Netherlands, 199, 231Poland, 199, 231Portugal, 199, 231Romania, 199, 231Slovakia, 199, 231Slovenia, 199, 231Spain, 199, 231Sweden, 199, 231United Kingdom, 199, 231
RES-H/C Consump on (ktoe)All 27 Member States, 189–191Austria, 17–19Belgium, 23–25Bulgaria, 29–31Coopera on Mechanism (ktoe), 17,
23, 29, 35, 41, 47, 53, 59, 65,71, 77, 83, 89, 95, 103, 109,115, 121, 127, 133, 141, 147,153, 159, 165, 171, 181, 189
Cyprus, 35–37Czech Republic, 41–43Denmark, 47–49Estonia, 53–55Finland, 59–61France, 65–67
Germany, 71–73Greece, 77–79Hungary, 83–85Ireland, 89–91Italy, 95–97Latvia, 103–105Lithuania, 109–111Luxembourg, 115–117Malta, 121–123Netherlands, 127–129Poland, 133–135Portugal, 141–143RES Total Consump on (ktoe), 17, 23,
29, 35, 41, 47, 53, 59, 65, 71,77, 83, 89, 95, 103, 109, 115,121, 127, 133, 141, 147, 153,159, 165, 171, 181, 189
RES-E Consump on (ktoe), 17, 23,29, 35, 41, 47, 53, 59, 65, 71,77, 83, 89, 95, 103, 109, 115,121, 127, 133, 141, 147, 153,159, 165, 171, 181, 189
RES-H/CConsump on (ktoe), 17, 23,29, 35, 41, 47, 53, 59, 65, 71,77, 83, 89, 95, 103, 109, 115,121, 127, 133, 141, 147, 153,159, 165, 171, 181, 189
RES-T Consump on (ktoe), 17, 23,29, 35, 41, 47, 53, 59, 65, 71,77, 83, 89, 95, 103, 109, 115,121, 127, 133, 141, 147, 153,159, 165, 171, 181, 189
Romania, 147–149Slovakia, 153–155Slovenia, 159–161Spain, 165–167Sweden, 171–173United Kingdom, 181–183
RES-T (%)All 27 Member States, 196Austria, 196Belgium, 196Bulgaria, 196Cyprus, 196Czech Republic, 196Denmark, 196Estonia, 196Finland, 196France, 196Germany, 196
274

Greece, 196Hungary, 196Ireland, 196Italy, 196Latvia, 196Lithuania, 196Luxembourg, 196Malta, 196Netherlands, 196Poland, 196Portugal, 196Romania, 196Slovakia, 196Slovenia, 196Spain, 196Sweden, 196United Kingdom, 196
RES-T (ktoe)All 27 Member States, 200, 240Austria, 200, 240Belgium, 200, 240Bulgaria, 200, 240Cyprus, 200, 240Czech Republic, 200, 240Denmark, 200, 240Estonia, 200, 240Finland, 200, 240France, 200, 240Germany, 200, 240Greece, 200, 240Hungary, 200, 240Ireland, 200, 240Italy, 200, 240Latvia, 200, 240Lithuania, 200, 240Luxembourg, 200, 240Malta, 200, 240Netherlands, 200, 240Poland, 200, 240Portugal, 200, 240Romania, 200, 240Slovakia, 200, 240Slovenia, 200, 240Spain, 200, 240Sweden, 200, 240United Kingdom, 200, 240
RES-T Consump on (ktoe)All 27 Member States, 190, 191Austria, 18, 19Belgium, 24, 25
Bulgaria, 30, 31Cyprus, 36, 37Czech Republic, 42, 43Denmark, 48, 49Estonia, 54, 55Finland, 60, 61France, 66, 67Germany, 72, 73Greece, 78, 79Hungary, 84, 85Ireland, 90, 91Italy, 96, 97Latvia, 104, 105Lithuania, 110, 111Luxembourg, 116, 117Malta, 122, 123Netherlands, 128, 129Poland, 134, 135Portugal, 142, 143Romania, 148, 149Slovakia, 154, 155Slovenia, 160, 161Spain, 166, 167Sweden, 172, 173United Kingdom, 182, 183
RES-T Share (%)All 27 Member States, 189Austria, 17Belgium, 23Bulgaria, 29Cyprus, 35Czech Republic, 41Denmark, 47Estonia, 53Finland, 59France, 65Germany, 71Greece, 77Hungary, 83Ireland, 89Italy, 95Latvia, 103Lithuania, 109Luxembourg, 115Malta, 121Netherlands, 127Poland, 133Portugal, 141Romania, 147Slovakia, 153
ECN-E--13-076 Index 275

Slovenia, 159Spain, 165Sweden, 171United Kingdom, 181
RomaniaBio-ETBE, 148, 149Biodiesel, 148, 149Bioethanol, 148, 149Biofuel consump on, 151Biofuel produc on, 151Biofuels for transport, 148, 149Biogas for electricity, 148, 149Biogas for heat, 148, 149Bioliquids for electricity, 148, 149Bioliquids for heat, 148, 149Biomass for electricity, 148, 149Biomass for heat, 148, 149Biomass heat in households, 148, 149Biomass supply for H and E (ktoe),
150Biomass supply for T (ktoe), 150CHP, 148, 149Concentrated solar power, 148, 149Coopera on Mechanism (%), 147Coopera onMechanism (ktoe), 147,
151CSP, 148, 149District hea ng, 148, 149Geothermal electricity, 148, 149Geothermal heat, 148, 149GHG emission saving from RES, 151GHGemission saving fromRES-E,151GHGemission saving fromRES-H/C,
151GHGemission saving fromRES-T,151Heat pumps, 148Hydrogen from renewables, 148, 149Hydropower, 148, 149Land use (ha), 151Offshore wind, 148, 149Onshore wind, 148, 149Renewable energy fromheat pumps,
148, 149RES Overall Share (%), 147RES Total Consump on (ktoe), 147–
149RES-E Capacity (MW), 148, 149RES-E Consump on (GWh), 148, 149RES-E Consump on (ktoe), 147–149RES-E in non-road transport, 149
RES-E in road transport, 149RES-E in transport, 149RES-E non-road transport, 148RES-E road transport, 148RES-E Share (%), 147RES-H/C Consump on (ktoe), 147–
149RES-H/C Share (%), 147RES-T Consump on (ktoe), 147–149RES-T Share (%), 147Solar photovoltaic, 148, 149Solar PV, 148, 149Solar thermal, 148, 149Solid biomass for electricity, 148, 149Solid biomass for heat, 148, 149Tidal, wave and ocean energy, 148,
149Wind power, 148, 149
SlovakiaBio-ETBE, 154, 155Biodiesel, 154, 155Bioethanol, 154, 155Biofuel consump on, 157Biofuel produc on, 157Biofuels for transport, 154, 155Biogas for electricity, 154, 155Biogas for heat, 154, 155Bioliquids for electricity, 154, 155Bioliquids for heat, 154, 155Biomass for electricity, 154, 155Biomass for heat, 154, 155Biomass heat in households, 154, 155Biomass supply for H and E (ktoe),
156Biomass supply for T (ktoe), 156CHP, 154, 155Concentrated solar power, 154, 155Coopera on Mechanism (%), 153Coopera onMechanism (ktoe), 153,
157CSP, 154, 155District hea ng, 154, 155Geothermal electricity, 154, 155Geothermal heat, 154, 155GHG emission saving from RES, 157GHGemission saving fromRES-E,157GHGemission saving fromRES-H/C,
157GHGemission saving fromRES-T,157Heat pumps, 154
276
Hydrogen from renewables, 154, 155Hydropower, 154, 155Land use (ha), 157Offshore wind, 154, 155Onshore wind, 154, 155Renewable energy fromheat pumps,
154, 155RES Overall Share (%), 153RES Total Consump on (ktoe), 153–
155RES-E Capacity (MW), 154, 155RES-E Consump on (GWh), 154, 155RES-E Consump on (ktoe), 153–155RES-E in non-road transport, 155RES-E in road transport, 155RES-E in transport, 155RES-E non-road transport, 154RES-E road transport, 154RES-E Share (%), 153RES-H/C Consump on (ktoe), 153–
155RES-H/C Share (%), 153RES-T Consump on (ktoe), 153–155RES-T Share (%), 153Solar photovoltaic, 154, 155Solar PV, 154, 155Solar thermal, 154, 155Solid biomass for electricity, 154, 155Solid biomass for heat, 154, 155Tidal, wave and ocean energy, 154,
155Wind power, 154, 155
SloveniaBio-ETBE, 160, 161Biodiesel, 160, 161Bioethanol, 160, 161Biofuel consump on, 163Biofuel produc on, 163Biofuels for transport, 160, 161Biogas for electricity, 160, 161Biogas for heat, 160, 161Bioliquids for electricity, 160, 161Bioliquids for heat, 160, 161Biomass for electricity, 160, 161Biomass for heat, 160, 161Biomass heat in households, 160, 161Biomass supply for H and E (ktoe),
162Biomass supply for T (ktoe), 162CHP, 160, 161
Concentrated solar power, 160, 161Coopera on Mechanism (%), 159Coopera onMechanism (ktoe), 159,
163CSP, 160, 161District hea ng, 160, 161Geothermal electricity, 160, 161Geothermal heat, 160, 161GHG emission saving from RES, 163GHGemission saving fromRES-E,163GHGemission saving fromRES-H/C,
163GHGemission saving fromRES-T,163Heat pumps, 160Hydrogen from renewables, 160, 161Hydropower, 160, 161Land use (ha), 163Offshore wind, 160, 161Onshore wind, 160, 161Renewable energy fromheat pumps,
160, 161RES Overall Share (%), 159RES Total Consump on (ktoe), 159–
161RES-E Capacity (MW), 160, 161RES-E Consump on (GWh), 160, 161RES-E Consump on (ktoe), 159–161RES-E in non-road transport, 161RES-E in road transport, 161RES-E in transport, 161RES-E non-road transport, 160RES-E road transport, 160RES-E Share (%), 159RES-H/C Consump on (ktoe), 159–
161RES-H/C Share (%), 159RES-T Consump on (ktoe), 159–161RES-T Share (%), 159Solar photovoltaic, 160, 161Solar PV, 160, 161Solar thermal, 160, 161Solid biomass for electricity, 160, 161Solid biomass for heat, 160, 161Tidal, wave and ocean energy, 160,
161Wind power, 160, 161
Solar CSPAll 27 Member States, 214Austria, 214Belgium, 214
ECN-E--13-076 Index 277

Bulgaria, 214Cyprus, 214Czech Republic, 214Denmark, 214Estonia, 214Finland, 214France, 214Germany, 214Greece, 214Hungary, 214Ireland, 214Italy, 214Latvia, 214Lithuania, 214Luxembourg, 214Malta, 214Netherlands, 214Poland, 214Portugal, 214Romania, 214Slovakia, 214Slovenia, 214Spain, 214Sweden, 214United Kingdom, 214
Solar electricity (PV and CSP)All 27 Member States, 212Austria, 212Belgium, 212Bulgaria, 212Cyprus, 212Czech Republic, 212Denmark, 212Estonia, 212Finland, 212France, 212Germany, 212Greece, 212Hungary, 212Ireland, 212Italy, 212Latvia, 212Lithuania, 212Luxembourg, 212Malta, 212Netherlands, 212Poland, 212Portugal, 212Romania, 212Slovakia, 212
Slovenia, 212Spain, 212Sweden, 212United Kingdom, 212
Solar photovoltaicAll 27 Member States, 190, 191Austria, 18, 19Belgium, 24, 25Bulgaria, 30, 31Cyprus, 36, 37Czech Republic, 42, 43Denmark, 48, 49Estonia, 54, 55Finland, 60, 61France, 66, 67Germany, 72, 73Greece, 78, 79Hungary, 84, 85Ireland, 90, 91Italy, 96, 97Latvia, 104, 105Lithuania, 110, 111Luxembourg, 116, 117Malta, 122, 123Netherlands, 128, 129Poland, 134, 135Portugal, 142, 143Romania, 148, 149Slovakia, 154, 155Slovenia, 160, 161Spain, 166, 167Sweden, 172, 173United Kingdom, 182, 183
Solar PVAll 27Member States, 190, 191, 213Austria, 18, 19, 213Belgium, 24, 25, 213Bulgaria, 30, 31, 213Cyprus, 36, 37, 213Czech Republic, 42, 43, 213Denmark, 48, 49, 213Estonia, 54, 55, 213Finland, 60, 61, 213France, 66, 67, 213Germany, 72, 73, 213Greece, 78, 79, 213Hungary, 84, 85, 213Ireland, 90, 91, 213Italy, 96, 97, 213Latvia, 104, 105, 213
278

Lithuania, 110, 111, 213Luxembourg, 116, 117, 213Malta, 122, 123, 213Netherlands, 128, 129, 213Poland, 134, 135, 213Portugal, 142, 143, 213Romania, 148, 149, 213Slovakia, 154, 155, 213Slovenia, 160, 161, 213Spain, 166, 167, 213Sweden, 172, 173, 213United Kingdom, 182, 183, 213
Solar thermalAll 27 Member States, 190, 191Austria, 18, 19Belgium, 24, 25Bulgaria, 30, 31Cyprus, 36, 37Czech Republic, 42, 43Denmark, 48, 49Estonia, 54, 55Finland, 60, 61France, 66, 67Germany, 72, 73Greece, 78, 79Hungary, 84, 85Ireland, 90, 91Italy, 96, 97Latvia, 104, 105Lithuania, 110, 111Luxembourg, 116, 117Malta, 122, 123Netherlands, 128, 129Poland, 134, 135Portugal, 142, 143Romania, 148, 149Slovakia, 154, 155Slovenia, 160, 161Spain, 166, 167Sweden, 172, 173United Kingdom, 182, 183
Solar thermal heat (ktoe)All 27 Member States, 226Austria, 226Belgium, 226Bulgaria, 226Cyprus, 226Czech Republic, 226Denmark, 226Estonia, 226
Finland, 226France, 226Germany, 226Greece, 226Hungary, 226Ireland, 226Italy, 226Latvia, 226Lithuania, 226Luxembourg, 226Malta, 226Netherlands, 226Poland, 226Portugal, 226Romania, 226Slovakia, 226Slovenia, 226Spain, 226Sweden, 226United Kingdom, 226
Solid biomass for electricityAll 27Member States, 190, 191, 220Austria, 18, 19, 220Belgium, 24, 25, 220Bulgaria, 30, 31, 220Cyprus, 36, 37, 220Czech Republic, 42, 43, 220Denmark, 48, 49, 220Estonia, 54, 55, 220Finland, 60, 61, 220France, 66, 67, 220Germany, 72, 73, 220Greece, 78, 79, 220Hungary, 84, 85, 220Ireland, 90, 91, 220Italy, 96, 97, 220Latvia, 104, 105, 220Lithuania, 110, 111, 220Luxembourg, 116, 117, 220Malta, 122, 123, 220Netherlands, 128, 129, 220Poland, 134, 135, 220Portugal, 142, 143, 220Romania, 148, 149, 220Slovakia, 154, 155, 220Slovenia, 160, 161, 220Spain, 166, 167, 220Sweden, 172, 173, 220United Kingdom, 182, 183, 220
Solid biomass for heat
ECN-E--13-076 Index 279

All 27 Member States, 190, 191Austria, 18, 19Belgium, 24, 25Bulgaria, 30, 31Cyprus, 36, 37Czech Republic, 42, 43Denmark, 48, 49Estonia, 54, 55Finland, 60, 61France, 66, 67Germany, 72, 73Greece, 78, 79Hungary, 84, 85Ireland, 90, 91Italy, 96, 97Latvia, 104, 105Lithuania, 110, 111Luxembourg, 116, 117Malta, 122, 123Netherlands, 128, 129Poland, 134, 135Portugal, 142, 143Romania, 148, 149Slovakia, 154, 155Slovenia, 160, 161Spain, 166, 167Sweden, 172, 173United Kingdom, 182, 183
Solid biomass heat (ktoe)All 27 Member States, 227Austria, 227Belgium, 227Bulgaria, 227Cyprus, 227Czech Republic, 227Denmark, 227Estonia, 227Finland, 227France, 227Germany, 227Greece, 227Hungary, 227Ireland, 227Italy, 227Latvia, 227Lithuania, 227Luxembourg, 227Malta, 227Netherlands, 227Poland, 227
Portugal, 227Romania, 227Slovakia, 227Slovenia, 227Spain, 227Sweden, 227United Kingdom, 227
SpainBio-ETBE, 166, 167Biodiesel, 166, 167Bioethanol, 166, 167Biofuel consump on, 169Biofuel produc on, 169Biofuels for transport, 166, 167Biogas for electricity, 166, 167Biogas for heat, 166, 167Bioliquids for electricity, 166, 167Bioliquids for heat, 166, 167Biomass for electricity, 166, 167Biomass for heat, 166, 167Biomass heat in households, 166, 167Biomass supply for H and E (ktoe),
168Biomass supply for T (ktoe), 168CHP, 166, 167Concentrated solar power, 166, 167Coopera on Mechanism (%), 165Coopera onMechanism (ktoe), 165,
169CSP, 166, 167District hea ng, 166, 167Geothermal electricity, 166, 167Geothermal heat, 166, 167GHG emission saving from RES, 169GHGemission saving fromRES-E,169GHGemission saving fromRES-H/C,
169GHGemission saving fromRES-T,169Heat pumps, 166Hydrogen from renewables, 166, 167Hydropower, 166, 167Land use (ha), 169Offshore wind, 166, 167Onshore wind, 166, 167Renewable energy fromheat pumps,
166, 167RES Overall Share (%), 165RES Total Consump on (ktoe), 165–
167RES-E Capacity (MW), 166, 167
280
RES-E Consump on (GWh), 166, 167RES-E Consump on (ktoe), 165–167RES-E in non-road transport, 167RES-E in road transport, 167RES-E in transport, 167RES-E non-road transport, 166RES-E road transport, 166RES-E Share (%), 165RES-H/C Consump on (ktoe), 165–
167RES-H/C Share (%), 165RES-T Consump on (ktoe), 165–167RES-T Share (%), 165Solar photovoltaic, 166, 167Solar PV, 166, 167Solar thermal, 166, 167Solid biomass for electricity, 166, 167Solid biomass for heat, 166, 167Tidal, wave and ocean energy, 166,
167Wind power, 166, 167
SwedenBio-ETBE, 172, 173Biodiesel, 172, 173Bioethanol, 172, 173Biofuel consump on, 175Biofuel produc on, 175Biofuels for transport, 172, 173Biogas for electricity, 172, 173Biogas for heat, 172, 173Bioliquids for electricity, 172, 173Bioliquids for heat, 172, 173Biomass for electricity, 172, 173Biomass for heat, 172, 173Biomass heat in households, 172, 173Biomass supply for H and E (ktoe),
174Biomass supply for T (ktoe), 174CHP, 172, 173Concentrated solar power, 172, 173Coopera on Mechanism (%), 171Coopera onMechanism (ktoe), 171,
175CSP, 172, 173District hea ng, 172, 173Geothermal electricity, 172, 173Geothermal heat, 172, 173GHG emission saving from RES, 175GHGemission saving fromRES-E,175
GHGemission saving fromRES-H/C,175
GHGemission saving fromRES-T,175Heat pumps, 172Hydrogen from renewables, 172, 173Hydropower, 172, 173Land use (ha), 175Offshore wind, 172, 173Onshore wind, 172, 173Renewable energy fromheat pumps,
172, 173RES Overall Share (%), 171RES Total Consump on (ktoe), 171–
173RES-E Capacity (MW), 172, 173RES-E Consump on (GWh), 172, 173RES-E Consump on (ktoe), 171–173RES-E in non-road transport, 173RES-E in road transport, 173RES-E in transport, 173RES-E non-road transport, 172RES-E road transport, 172RES-E Share (%), 171RES-H/C Consump on (ktoe), 171–
173RES-H/C Share (%), 171RES-T Consump on (ktoe), 171–173RES-T Share (%), 171Solar photovoltaic, 172, 173Solar PV, 172, 173Solar thermal, 172, 173Solid biomass for electricity, 172, 173Solid biomass for heat, 172, 173Tidal, wave and ocean energy, 172,
173Wind power, 172, 173
Tidal, wave and ocean energyAll 27 Member States, 190, 191Austria, 18, 19Belgium, 24, 25Bulgaria, 30, 31Cyprus, 36, 37Czech Republic, 42, 43Denmark, 48, 49Estonia, 54, 55Finland, 60, 61France, 66, 67Germany, 72, 73Greece, 78, 79Hungary, 84, 85
ECN-E--13-076 Index 281

Ireland, 90, 91Italy, 96, 97Latvia, 104, 105Lithuania, 110, 111Luxembourg, 116, 117Malta, 122, 123Netherlands, 128, 129Poland, 134, 135Portugal, 142, 143Romania, 148, 149Slovakia, 154, 155Slovenia, 160, 161Spain, 166, 167Sweden, 172, 173United Kingdom, 182, 183
Tidal, wave and ocean energy (electric-ity)
All 27 Member States, 215Austria, 215Belgium, 215Bulgaria, 215Cyprus, 215Czech Republic, 215Denmark, 215Estonia, 215Finland, 215France, 215Germany, 215Greece, 215Hungary, 215Ireland, 215Italy, 215Latvia, 215Lithuania, 215Luxembourg, 215Malta, 215Netherlands, 215Poland, 215Portugal, 215Romania, 215Slovakia, 215Slovenia, 215Spain, 215Sweden, 215United Kingdom, 215
Total CHP (electric)All 27 Member States, 224Austria, 224Belgium, 224Bulgaria, 224
Cyprus, 224Czech Republic, 224Denmark, 224Estonia, 224Finland, 224France, 224Germany, 224Greece, 224Hungary, 224Ireland, 224Italy, 224Latvia, 224Lithuania, 224Luxembourg, 224Malta, 224Netherlands, 224Poland, 224Portugal, 224Romania, 224Slovakia, 224Slovenia, 224Spain, 224Sweden, 224United Kingdom, 224
United KingdomBio-ETBE, 182, 183Biodiesel, 182, 183Bioethanol, 182, 183Biofuel consump on, 185Biofuel produc on, 185Biofuels for transport, 182, 183Biogas for electricity, 182, 183Biogas for heat, 182, 183Bioliquids for electricity, 182, 183Bioliquids for heat, 182, 183Biomass for electricity, 182, 183Biomass for heat, 182, 183Biomass heat in households, 182, 183Biomass supply for H and E (ktoe),
184Biomass supply for T (ktoe), 184CHP, 182, 183Concentrated solar power, 182, 183Coopera on Mechanism (%), 181Coopera onMechanism (ktoe), 181,
185CSP, 182, 183District hea ng, 182, 183Geothermal electricity, 182, 183Geothermal heat, 182, 183
282

GHG emission saving from RES, 185GHGemission saving fromRES-E,185GHGemission saving fromRES-H/C,
185GHGemission saving fromRES-T,185Heat pumps, 182Hydrogen from renewables, 182, 183Hydropower, 182, 183Land use (ha), 185Offshore wind, 182, 183Onshore wind, 182, 183Renewable energy fromheat pumps,
182, 183RES Overall Share (%), 181RES Total Consump on (ktoe), 181–
183RES-E Capacity (MW), 182, 183RES-E Consump on (GWh), 182, 183RES-E Consump on (ktoe), 181–183RES-E in non-road transport, 183RES-E in road transport, 183RES-E in transport, 183RES-E non-road transport, 182RES-E road transport, 182RES-E Share (%), 181RES-H/C Consump on (ktoe), 181–
183RES-H/C Share (%), 181RES-T Consump on (ktoe), 181–183RES-T Share (%), 181Solar photovoltaic, 182, 183Solar PV, 182, 183Solar thermal, 182, 183Solid biomass for electricity, 182, 183Solid biomass for heat, 182, 183Tidal, wave and ocean energy, 182,
183Wind power, 182, 183
Wind powerAll 27Member States, 190, 191, 216Austria, 18, 19, 216Belgium, 24, 25, 216Bulgaria, 30, 31, 216Cyprus, 36, 37, 216Czech Republic, 42, 43, 216Denmark, 48, 49, 216Estonia, 54, 55, 216Finland, 60, 61, 216France, 66, 67, 216Germany, 72, 73, 216
Greece, 78, 79, 216Hungary, 84, 85, 216Ireland, 90, 91, 216Italy, 96, 97, 216Latvia, 104, 105, 216Lithuania, 110, 111, 216Luxembourg, 116, 117, 216Malta, 122, 123, 216Netherlands, 128, 129, 216Poland, 134, 135, 216Portugal, 142, 143, 216Romania, 148, 149, 216Slovakia, 154, 155, 216Slovenia, 160, 161, 216Spain, 166, 167, 216Sweden, 172, 173, 216United Kingdom, 182, 183, 216
ECN-E--13-076 Index 283

284
ECNWesterduinweg 3 P.O. Box 11755 LE Pe en 1755 ZG Pe enThe Netherlands The Netherlands
T +31 88 5154949F +31 88 [email protected]