Embed Size (px)
Citation preview
Bioresource Technology 216 (2016) 352–361
Contents lists available at ScienceDirect
Bioresource Technology
journal homepage: www.elsevier .com/locate /bior tech
Removal and biodegradation of naphthenic acids by biochar andattached environmental biofilms in the presence of co-contaminatingmetals
http://dx.doi.org/10.1016/j.biortech.2016.05.0840960-8524/� 2016 The Author(s). Published by Elsevier Ltd.This is an open access article under the CC BY-NC-ND license (http://creativecommons.org/licenses/by-nc-nd/4.0/).
Abbreviations: AC, activated carbon; OSPW, oil sands process water; NAs, naphthenic acids; ECM, extracellular matrix; CBD, Calgary Biofilm Device; MBBR, mobiofilm reactor; BH, Bushnell-Haas media; BHG, BH amended with 1 g L�1 glucose; BH8v or 8vNA, BH amended with 200 mg L�1 NAs; HA, hexanoic acid; CPCA, cyclocarboxylic acid; mCHCA, 3-methyl-1-cyclohexane carboxylic acid cis and trans stereoisomers; CHCA, cyclohexane carboxylic acid; CHAA, cyclohexane acetic adecanoic acid; CHBA, cyclohexane butyric acid; ACA, 1-adamantane carboxylic acid; BHM+ or Model OSPW, 8vNA amended with 17 metals; TSA, tryptic soy agar; BHor BHM+o, experiments inoculated with amended media (i.e. BHG, BH8v, or BHM+) and incubated without amended media (i.e. BH); CLSM, confocal laser scanning micEDX, energy dispersive X-ray spectroscopy; GC-FID, gas chromatography coupled with flame ionization detection; BRE, biological removal efficiency; SEM, standardthe mean.⇑ Corresponding author at: BI478 Biological Sciences Building, 2500 University Drive NW, Calgary, AB T2N 1N4, Canada.
E-mail address: [email protected] (R.J. Turner).
Mathew L. Frankel a, Tazul I. Bhuiyan b, Andrei Veksha b, Marc A. Demeter a, David B. Layzell a,Robert J. Helleur c, Josephine M. Hill b, Raymond J. Turner a,⇑aDepartment of Biological Sciences, University of Calgary, Calgary, AB, CanadabDepartment of Chemical and Petroleum Engineering, University of Calgary, Calgary, AB, CanadacDepartment of Chemistry, Memorial University of Newfoundland, St. John’s, NL, Canada
h i g h l i g h t s
� A combined biofilm-biochar approachfor contaminant removal wasevaluated.
� Biotic-biochar was more effective atremoving naphthenic acids vs. sterilebiochar.
� Evidence for enhanced organicsremoval by biotic-biochar in thepresence of metals.
� Greater metal sorption evident withbiofilm-attached biochar.
� This combined approach was moreeffective at removal than eitherindependently.
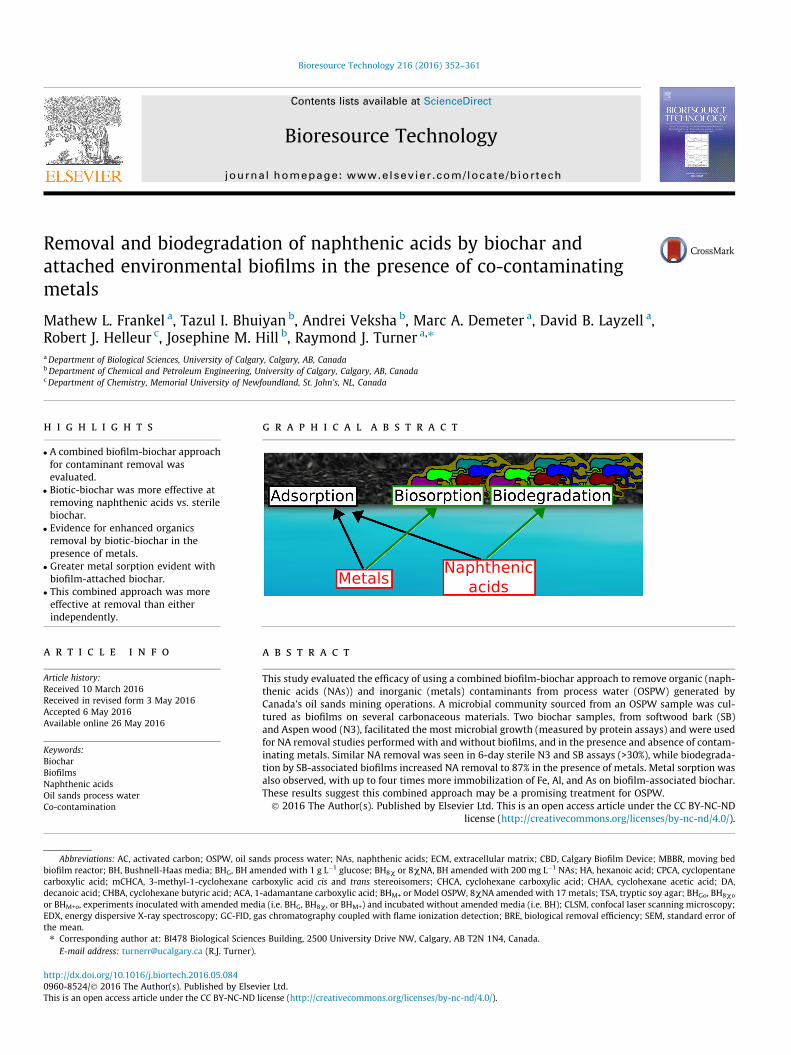
g r a p h i c a l a b s t r a c t
a r t i c l e i n f o
Article history:Received 10 March 2016Received in revised form 3 May 2016Accepted 6 May 2016Available online 26 May 2016
Keywords:BiocharBiofilmsNaphthenic acidsOil sands process waterCo-contamination
a b s t r a c t
This study evaluated the efficacy of using a combined biofilm-biochar approach to remove organic (naph-thenic acids (NAs)) and inorganic (metals) contaminants from process water (OSPW) generated byCanada’s oil sands mining operations. A microbial community sourced from an OSPW sample was cul-tured as biofilms on several carbonaceous materials. Two biochar samples, from softwood bark (SB)and Aspen wood (N3), facilitated the most microbial growth (measured by protein assays) and were usedfor NA removal studies performed with and without biofilms, and in the presence and absence of contam-inating metals. Similar NA removal was seen in 6-day sterile N3 and SB assays (>30%), while biodegrada-tion by SB-associated biofilms increased NA removal to 87% in the presence of metals. Metal sorption wasalso observed, with up to four times more immobilization of Fe, Al, and As on biofilm-associated biochar.These results suggest this combined approach may be a promising treatment for OSPW.� 2016 The Author(s). Published by Elsevier Ltd. This is an open access article under the CC BY-NC-ND
license (http://creativecommons.org/licenses/by-nc-nd/4.0/).
ving bedpentanecid; DA,
Go, BH8vo
roscopy;error of

M.L. Frankel et al. / Bioresource Technology 216 (2016) 352–361 353
1. Introduction
Historically, adsorbents have been used to treat wastewaterchallenges. Activated carbon (AC) has a long history being usedas an adsorbent, but its cost is restrictive to widespread use. ACcan be made from biochar, which are produced by pyrolyzing(i.e. thermal degradation in the absence of O2) biomass from a widerange of feedstocks (e.g. wood, bark). Biochar, while having lowerporosity and surface areas than AC, can effectively adsorb diverseorganic and inorganic contaminants from soil and water (Ahmadet al., 2014) for a fraction of the price. One context where such con-taminants have become an issue is Canada’s oil sands operations.Oil sands surface mining operations are water intensive (Suncor,2014), generating what is referred to as oil sands process water(OSPW). These liquid tailings have become an issue of environmen-tal concern due to their large volumes and toxicity (Allen, 2008),the latter of which has them subject to a ‘‘zero discharge” policy(Brown and Ulrich, 2015). Naphthenic acids (NAs), a broadlydefined group of acyclic and cycloaliphatic carboxylic acids, con-tribute to the acute toxicity associated with OSPW (Lo et al.,2006) and thus have been the focus of OSPW remediation research.Tailings ponds have been reported to contain an average NA con-centration of 110 mg L�1, as compared to <1 mg L�1 is found inregional rivers; OSPW reclamation currently relies on natural pro-cesses to remove NA contaminants, however, some have NAs pro-ven to be refractory and thus the timeframe for this remediation islengthy (i.e. decades) and uncertain (Allen, 2008; Brown andUlrich, 2015). To date, experimental tailings ponds and nutrientenriched simulated wetlands, which utilized the natural attenua-tion of these tailings ponds, continued to exhibit chronic toxiceffects in bioassays after 20 years and 1 year, respectively (Brownand Ulrich, 2015). The purpose of this study was to investigatethe potential use of biochar, in concert with environmental micro-bial populations, as an inexpensive and passive means to expeditereclamation efforts.
Recent biochar research has explored its ability as a microbialinoculum carrier (Hale et al., 2015). To attach and adhere to a sur-face (e.g. biochar), living cells excrete a variety of polymers used toanchor themselves to the substrate, developing an extracellularmatrix (ECM)-enclosed microbial biofilm (Hall-Stoodley et al.,2004). The close proximity biofilm-embedded cells may allow forgenetic or metabolite exchanges that can facilitate the degradationof xenobiotic substrates (Singh et al., 2006). Biofilms are also resis-tant to mechanical stress and retain microbial biomass whenattached to solid carriers (Nicolella et al., 2000). Due to these qual-ities, some researchers have investigated the utilization of biofilmsin ex situ bioreactors for NA degradation (McKenzie et al., 2014).
Using the Calgary Biofilm Device (CBD), a high throughputmethod of growing biofilms, microbial communities indigenousto the oil sands tailings environment have been successfullycultured as biofilms. Notably, this method was able to maintain70–80% of the microbial community from the original tailings sam-ple (Golby et al., 2012), outperforming traditional in vitro methodsof culturing microbes from an environmental inoculum. Using thesame method, the OSPW environmental community has demon-strated the capacity to aerobically degrade model NAs of variedrecalcitrance to below detectable limits (Demeter et al., 2015). Fur-thermore, these bench-scale experiments were translated towastewater treatment techniques by harnessing OSPW microbialbiofilms on moving bed biofilm reactor (MBBR) carriers; reactorsinoculated in this manner retained the previously observed abilityto degrade select model NAs (Lemire et al., 2015). In response tothe oil sands industry’s indication of the need for a passive OSPWtreatment system (i.e. requiring little to no energy input ormaintenance), the work herein aimed to transfer this concept to
a passive approach, using biochar as the biofilm support material.The complexity of the system was increased to include inorganics,to be more reflective of the tailings pond environment (Allen,2008), as well as to assess the effects of metals on NA degradationby the native OSPW microbiota. While metals are known to inhibitthe microbial degradation of organic pollutants (Sandrin andMaier, 2003), the indigenous OSPWmicrobial community has beenshown to be tolerant to metal concentrations multiple orders ofmagnitude higher than those reported in tailings ponds (Frankelet al., 2016).
Alberta’s oil sands were used as a case study to investigate thecombined potential of biochar and environmental microbes tofacilitate contaminant removal from industrial wastewater. Thegoal was to evaluate the hypothesis that a combined biofilm-biochar approach would remove organic and inorganic contami-nants more effectively than either approach could independently.This approach combines the inherent adsorptive capacity of bio-char with the biodegradative ability of native OSPW microbes,and has potential to enhance oil sands and other industrialwastewater treatment operations.
2. Methods and materials
2.1. Carbon support materials
A range of support materials was screened and will be referredto interchangeably as support materials, biochar, or biochar sam-ples. Eight types of biochar were evaluated, all of which derivedfrom woody biomass feedstocks native to northern Alberta. Themicrobial attachment efficacies of biochar samples were comparedto that of two commercially available non-biochar alternatives:ColorSorb G5, a steam activated carbon from Jacobi Carbons AB(Kalmar, Sweden), and Carbon Black (CBb), a solid amorphous car-bon produced from natural gas using the CarbonSaver� process(Atlantic Hydrogen Inc., Fredericton, NB, Canada). Feedstocks andphysical descriptions of support materials can be found in Table 1;refer to Veksha et al. (2014) for methods used for characterization.
2.2. Media
An adapted Bushnell-Haas (BH) minimal salts media (Bushnelland Haas, 1941) (pH 6.6, 1.0 g KH2PO4, 1.0 g Na2HPO4, 0.5 g NH4-NO3, 0.5 g (NH4)2SO4, 0.2 g MgSO4�7H2O, 0.02 g CaCl2�2H2O,0.002 g FeCl3, 0.002 g MnSO4�2H2O, per liter of double distilledwater (ddH2O)) was used in all experiments; stocks were made2X the concentration of working solutions, and stored at roomtemperature. BH has been used in previous work evaluating themicrobial utilization of hydrocarbons by indigenous OSPWmicroorganisms (Herman et al., 1994; Wyndham and Costerton,1981). Different amendments were added to BH, depending onthe assay. Initial support material screens used 1 g L�1 of glucose(BHG). NA assays were performed with a synthetic mixture of 8commercially available model NAs previously described byDemeter et al. (2015), prepared to a total NA working concentra-tion of 200 mg L�1 (vs. 110 mg L�1 reported in average tailingsponds (Brown and Ulrich, 2015)) with 0.1 g L�1 glucose in BH(BH8v or 8vNA, following previous nomenclature); NA stocks weremade as salt naphthenates (Sigma Aldrich) at 10X-working con-centration and stored at room temperature. The mixture containsequimolar (1.7 mM) amounts of each of the following NAs: hex-anoic acid (HA), cyclopentane carboxylic acid (CPCA), 3-Methyl-1-cyclohexane carboxylic acid cis and trans stereoisomers(mCHCA), cyclohexane carboxylic acid (CHCA), cyclohexane aceticacid (CHAA), decanoic acid (DA), cyclohexane butyric acid (CHBA),
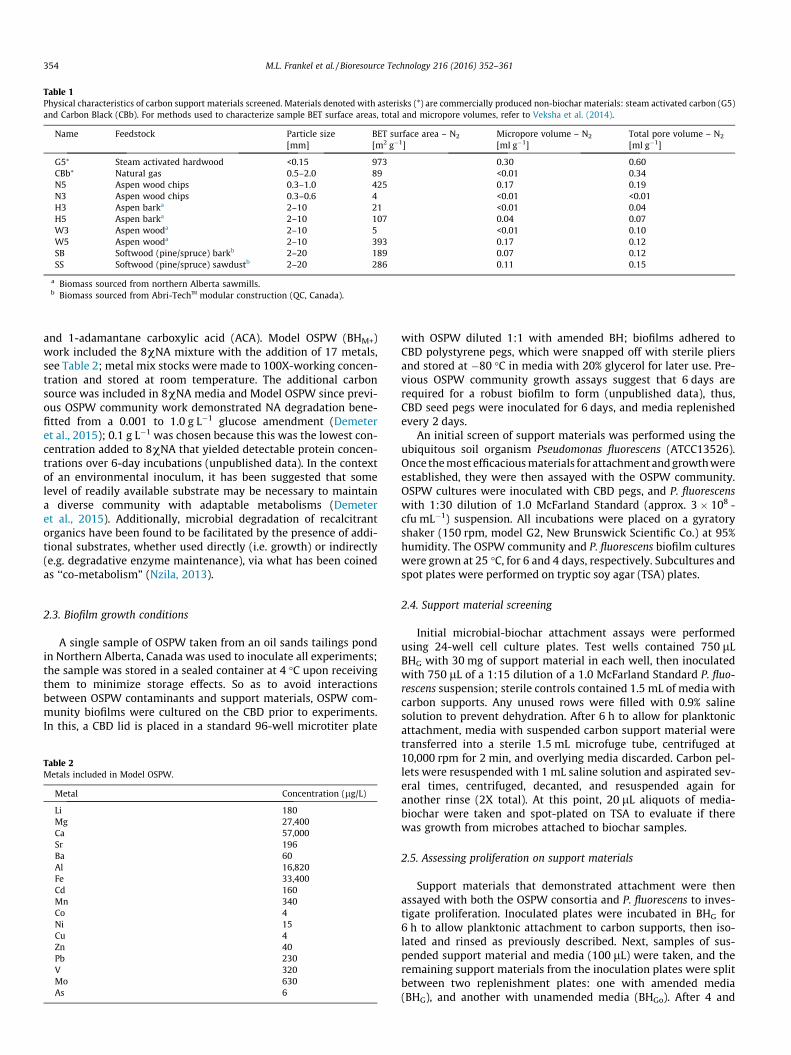
Table 1Physical characteristics of carbon support materials screened. Materials denoted with asterisks (*) are commercially produced non-biochar materials: steam activated carbon (G5)and Carbon Black (CBb). For methods used to characterize sample BET surface areas, total and micropore volumes, refer to Veksha et al. (2014).
Name Feedstock Particle size BET surface area – N2 Micropore volume – N2 Total pore volume – N2
[mm] [m2 g�1] [ml g�1] [ml g�1]
G5⁄ Steam activated hardwood <0.15 973 0.30 0.60CBb⁄ Natural gas 0.5–2.0 89 <0.01 0.34N5 Aspen wood chips 0.3–1.0 425 0.17 0.19N3 Aspen wood chips 0.3–0.6 4 <0.01 <0.01H3 Aspen barka 2–10 21 <0.01 0.04H5 Aspen barka 2–10 107 0.04 0.07W3 Aspen wooda 2–10 5 <0.01 0.10W5 Aspen wooda 2–10 393 0.17 0.12SB Softwood (pine/spruce) barkb 2–20 189 0.07 0.12SS Softwood (pine/spruce) sawdustb 2–20 286 0.11 0.15
a Biomass sourced from northern Alberta sawmills.b Biomass sourced from Abri-TechTM modular construction (QC, Canada).
354 M.L. Frankel et al. / Bioresource Technology 216 (2016) 352–361
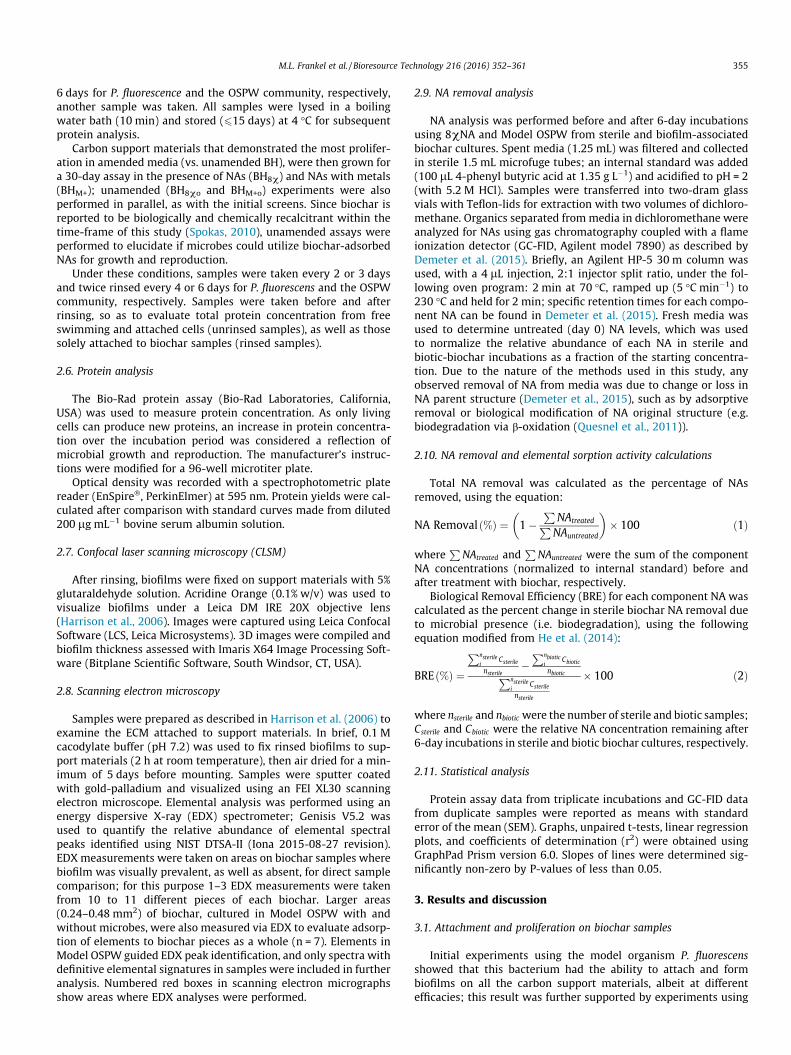
and 1-adamantane carboxylic acid (ACA). Model OSPW (BHM+)work included the 8vNA mixture with the addition of 17 metals,see Table 2; metal mix stocks were made to 100X-working concen-tration and stored at room temperature. The additional carbonsource was included in 8vNA media and Model OSPW since previ-ous OSPW community work demonstrated NA degradation bene-fitted from a 0.001 to 1.0 g L�1 glucose amendment (Demeteret al., 2015); 0.1 g L�1 was chosen because this was the lowest con-centration added to 8vNA that yielded detectable protein concen-trations over 6-day incubations (unpublished data). In the contextof an environmental inoculum, it has been suggested that somelevel of readily available substrate may be necessary to maintaina diverse community with adaptable metabolisms (Demeteret al., 2015). Additionally, microbial degradation of recalcitrantorganics have been found to be facilitated by the presence of addi-tional substrates, whether used directly (i.e. growth) or indirectly(e.g. degradative enzyme maintenance), via what has been coinedas ‘‘co-metabolism” (Nzila, 2013).
2.3. Biofilm growth conditions
A single sample of OSPW taken from an oil sands tailings pondin Northern Alberta, Canada was used to inoculate all experiments;the sample was stored in a sealed container at 4 �C upon receivingthem to minimize storage effects. So as to avoid interactionsbetween OSPW contaminants and support materials, OSPW com-munity biofilms were cultured on the CBD prior to experiments.In this, a CBD lid is placed in a standard 96-well microtiter plate
Table 2Metals included in Model OSPW.
Metal Concentration (lg/L)
Li 180Mg 27,400Ca 57,000Sr 196Ba 60Al 16,820Fe 33,400Cd 160Mn 340Co 4Ni 15Cu 4Zn 40Pb 230V 320Mo 630As 6
with OSPW diluted 1:1 with amended BH; biofilms adhered toCBD polystyrene pegs, which were snapped off with sterile pliersand stored at �80 �C in media with 20% glycerol for later use. Pre-vious OSPW community growth assays suggest that 6 days arerequired for a robust biofilm to form (unpublished data), thus,CBD seed pegs were inoculated for 6 days, and media replenishedevery 2 days.
An initial screen of support materials was performed using theubiquitous soil organism Pseudomonas fluorescens (ATCC13526).Once themost efficaciousmaterials for attachmentandgrowthwereestablished, they were then assayed with the OSPW community.OSPW cultures were inoculated with CBD pegs, and P. fluorescenswith 1:30 dilution of 1.0 McFarland Standard (approx. 3 � 108 -cfu mL�1) suspension. All incubations were placed on a gyratoryshaker (150 rpm, model G2, New Brunswick Scientific Co.) at 95%humidity. The OSPW community and P. fluorescens biofilm cultureswere grown at 25 �C, for 6 and 4 days, respectively. Subcultures andspot plates were performed on tryptic soy agar (TSA) plates.
2.4. Support material screening
Initial microbial-biochar attachment assays were performedusing 24-well cell culture plates. Test wells contained 750 lLBHG with 30 mg of support material in each well, then inoculatedwith 750 lL of a 1:15 dilution of a 1.0 McFarland Standard P. fluo-rescens suspension; sterile controls contained 1.5 mL of media withcarbon supports. Any unused rows were filled with 0.9% salinesolution to prevent dehydration. After 6 h to allow for planktonicattachment, media with suspended carbon support material weretransferred into a sterile 1.5 mL microfuge tube, centrifuged at10,000 rpm for 2 min, and overlying media discarded. Carbon pel-lets were resuspended with 1 mL saline solution and aspirated sev-eral times, centrifuged, decanted, and resuspended again foranother rinse (2X total). At this point, 20 lL aliquots of media-biochar were taken and spot-plated on TSA to evaluate if therewas growth from microbes attached to biochar samples.
2.5. Assessing proliferation on support materials
Support materials that demonstrated attachment were thenassayed with both the OSPW consortia and P. fluorescens to inves-tigate proliferation. Inoculated plates were incubated in BHG for6 h to allow planktonic attachment to carbon supports, then iso-lated and rinsed as previously described. Next, samples of sus-pended support material and media (100 lL) were taken, and theremaining support materials from the inoculation plates were splitbetween two replenishment plates: one with amended media(BHG), and another with unamended media (BHGo). After 4 and
M.L. Frankel et al. / Bioresource Technology 216 (2016) 352–361 355
6 days for P. fluorescence and the OSPW community, respectively,another sample was taken. All samples were lysed in a boilingwater bath (10 min) and stored (615 days) at 4 �C for subsequentprotein analysis.
Carbon support materials that demonstrated the most prolifer-ation in amended media (vs. unamended BH), were then grown fora 30-day assay in the presence of NAs (BH8v) and NAs with metals(BHM+); unamended (BH8vo and BHM+o) experiments were alsoperformed in parallel, as with the initial screens. Since biochar isreported to be biologically and chemically recalcitrant within thetime-frame of this study (Spokas, 2010), unamended assays wereperformed to elucidate if microbes could utilize biochar-adsorbedNAs for growth and reproduction.
Under these conditions, samples were taken every 2 or 3 daysand twice rinsed every 4 or 6 days for P. fluorescens and the OSPWcommunity, respectively. Samples were taken before and afterrinsing, so as to evaluate total protein concentration from freeswimming and attached cells (unrinsed samples), as well as thosesolely attached to biochar samples (rinsed samples).
2.6. Protein analysis
The Bio-Rad protein assay (Bio-Rad Laboratories, California,USA) was used to measure protein concentration. As only livingcells can produce new proteins, an increase in protein concentra-tion over the incubation period was considered a reflection ofmicrobial growth and reproduction. The manufacturer’s instruc-tions were modified for a 96-well microtiter plate.
Optical density was recorded with a spectrophotometric platereader (EnSpire�, PerkinElmer) at 595 nm. Protein yields were cal-culated after comparison with standard curves made from diluted200 lg mL�1 bovine serum albumin solution.
2.7. Confocal laser scanning microscopy (CLSM)
After rinsing, biofilms were fixed on support materials with 5%glutaraldehyde solution. Acridine Orange (0.1% w/v) was used tovisualize biofilms under a Leica DM IRE 20X objective lens(Harrison et al., 2006). Images were captured using Leica ConfocalSoftware (LCS, Leica Microsystems). 3D images were compiled andbiofilm thickness assessed with Imaris X64 Image Processing Soft-ware (Bitplane Scientific Software, South Windsor, CT, USA).
2.8. Scanning electron microscopy
Samples were prepared as described in Harrison et al. (2006) toexamine the ECM attached to support materials. In brief, 0.1 Mcacodylate buffer (pH 7.2) was used to fix rinsed biofilms to sup-port materials (2 h at room temperature), then air dried for a min-imum of 5 days before mounting. Samples were sputter coatedwith gold-palladium and visualized using an FEI XL30 scanningelectron microscope. Elemental analysis was performed using anenergy dispersive X-ray (EDX) spectrometer; Genisis V5.2 wasused to quantify the relative abundance of elemental spectralpeaks identified using NIST DTSA-II (Iona 2015-08-27 revision).EDX measurements were taken on areas on biochar samples wherebiofilm was visually prevalent, as well as absent, for direct samplecomparison; for this purpose 1–3 EDX measurements were takenfrom 10 to 11 different pieces of each biochar. Larger areas(0.24–0.48 mm2) of biochar, cultured in Model OSPW with andwithout microbes, were also measured via EDX to evaluate adsorp-tion of elements to biochar pieces as a whole (n = 7). Elements inModel OSPW guided EDX peak identification, and only spectra withdefinitive elemental signatures in samples were included in furtheranalysis. Numbered red boxes in scanning electron micrographsshow areas where EDX analyses were performed.
2.9. NA removal analysis
NA analysis was performed before and after 6-day incubationsusing 8vNA and Model OSPW from sterile and biofilm-associatedbiochar cultures. Spent media (1.25 mL) was filtered and collectedin sterile 1.5 mL microfuge tubes; an internal standard was added(100 lL 4-phenyl butyric acid at 1.35 g L�1) and acidified to pH = 2(with 5.2 M HCl). Samples were transferred into two-dram glassvials with Teflon-lids for extraction with two volumes of dichloro-methane. Organics separated frommedia in dichloromethane wereanalyzed for NAs using gas chromatography coupled with a flameionization detector (GC-FID, Agilent model 7890) as described byDemeter et al. (2015). Briefly, an Agilent HP-5 30 m column wasused, with a 4 lL injection, 2:1 injector split ratio, under the fol-lowing oven program: 2 min at 70 �C, ramped up (5 �C min�1) to230 �C and held for 2 min; specific retention times for each compo-nent NA can be found in Demeter et al. (2015). Fresh media wasused to determine untreated (day 0) NA levels, which was usedto normalize the relative abundance of each NA in sterile andbiotic-biochar incubations as a fraction of the starting concentra-tion. Due to the nature of the methods used in this study, anyobserved removal of NA from media was due to change or loss inNA parent structure (Demeter et al., 2015), such as by adsorptiveremoval or biological modification of NA original structure (e.g.biodegradation via b-oxidation (Quesnel et al., 2011)).
2.10. NA removal and elemental sorption activity calculations
Total NA removal was calculated as the percentage of NAsremoved, using the equation:
NA Removal ð%Þ ¼ 1�P
NAtreatedPNAuntreated
� �� 100 ð1Þ
whereP
NAtreated andP
NAuntreated were the sum of the componentNA concentrations (normalized to internal standard) before andafter treatment with biochar, respectively.
Biological Removal Efficiency (BRE) for each component NA wascalculated as the percent change in sterile biochar NA removal dueto microbial presence (i.e. biodegradation), using the followingequation modified from He et al. (2014):
BREð%Þ ¼
Pnsterilei
Csterile
nsterile�Pnbiotic
iCbiotic
nbioticPnsterilei
Csterile
nsterile
� 100 ð2Þ
where nsterile and nbiotic were the number of sterile and biotic samples;Csterile and Cbiotic were the relative NA concentration remaining after6-day incubations in sterile and biotic biochar cultures, respectively.
2.11. Statistical analysis
Protein assay data from triplicate incubations and GC-FID datafrom duplicate samples were reported as means with standarderror of the mean (SEM). Graphs, unpaired t-tests, linear regressionplots, and coefficients of determination (r2) were obtained usingGraphPad Prism version 6.0. Slopes of lines were determined sig-nificantly non-zero by P-values of less than 0.05.
3. Results and discussion
3.1. Attachment and proliferation on biochar samples
Initial experiments using the model organism P. fluorescensshowed that this bacterium had the ability to attach and formbiofilms on all the carbon support materials, albeit at differentefficacies; this result was further supported by experiments using

356 M.L. Frankel et al. / Bioresource Technology 216 (2016) 352–361
OSPW derived cultures. Fig. 1 shows that SB, N3, and SS were theonly samples to demonstrate statistically significant increases inprotein concentration, as measured by unpaired t tests (P-valuesof 0.003, 0.028, 0.009 respectively). Subsequent screens withBH8v determined SB and N3 to be the only support materials toconsistently show significant differences in growth betweencarbon-amended and unamended cultures and were thus usedfor the 30-day assays in the presence of naphthenic acids (BH8v)and metals (BHM+).
30-day BH8v assays suggest OSPW community proliferation inthe presence of NAs on N3 and SB (Fig. 2). Linear regression anal-yses of attached as well as total (attached and planktonic freeswimming cells) protein vs. time demonstrated significant positiveslopes on both biochar N3 and SB (Table 3). N3 had the steepestslope and strongest relationship for total protein from cells(r2 = 0.61, P-value < 0.001), and SB having the strongest relation-ship with regards to attached protein over the 30 days (r2 = 0.45,P-value = 0.002).
Model OSPW (BHM+) cultures only demonstrated a significantrelationship with total protein measurements in N3 incubations(Table 4). While SB protein accumulation (total and attached) didnot show significant relationships, their measured protein concen-trations were within the same range as sterile 30-day incubations(1.2–1.8 lg 20 lL�1). Analogous protein ranges in biotic and sterileexperiments suggests that concentrations (and associatedmicrobial
Fig. 1. Protein concentration (lg/20 lL sample) of biochar-OSPW community cultures aamendments to media. Each bar represents the mean (±SEM) of three to nine trials.concentrations, as measured by unpaired t-tests with P-values (*) <0.05 and (**) <0.01.
0 3 6 9 12 15 18 21 24 27 300
1
2
3
4
5
Prot
ein
Con
cent
ratio
n(µ
g/20
µ L m
edia
-cha
r sam
ple)
Time (days)
0 3 6 9 12 15 18 21 24 27 300
1
2
3
4
5
Prot
ein
Con
cent
ratio
n(µ
g/20
µ L m
edia
-cha
r sam
ple)
Time (days)
(A)
Fig. 2. Protein concentrations (lg/20 lL sample) measured from OSPW-biochar cultureattached (checkered bars) and total (white bars) on (A) biochar N3 and (B) SB. Each bar
growth) may have been below the detectable limits of the assay.CLSM measurements of biofilm thickness demonstrate that, whilethere was no apparent increase in protein, there was indeed anincrease in biofilm thickness over the 30-day period (Fig. 3).
Differences in microbial-biochar interactions have been attribu-ted to the physical and chemical properties of materials (Hale et al.,2015), which are known to vary by feedstock and pyrolysistemperature, and contribute to different effects on attachedmicroorganisms (Lehmann et al., 2011) (i.e. attachment and prolif-eration). As described by others (Xie et al., 2015), there was anincrease in biochar porosity and surface area with increased prepa-ration temperature. Some have posited that increased surface area,alone, is not enough for a material to be an effective inoculant car-rier (Lehmann et al., 2011). These results suggest this can beexpanded to the suitability of a material for microbial proliferationas well, as there was no correlative relationship between biocharsurface area (or other physical properties measured) and accumu-lated biomass as evaluated by final protein concentrations after 6-day incubations in BHG.
3.2. NA removal
Recentwork has shown thatmodel NAs can be both biodegradedby the native OSPW community (Demeter et al., 2015), andadsorbed by biochar (Alessi et al., 2014) in aqueous environments.
fter inoculation (1G) and 6 days of incubation with (6G) and without (6GO) glucoseAsterisked bars indicate significant differences between 6G and 6GO final protein
0 3 6 9 12 15 18 21 24 27 300
1
2
3
4
5
Time (days)
0 3 6 9 12 15 18 21 24 27 300
1
2
3
4
5
Time (days)
(B)
s grown in the presence of naphthenic acids (BH8v), over 30-day incubations forrepresents the mean (±SEM) of measurements taken in triplicate.

Table 3Linear regression analysis of protein measurements from 30-day naphthenic acid (BH8v) experiments, with biochar N3 and SB. Protein accumulations are the lines of best fit(±SEM) from samples taken in triplicate, made every three or six days (for total or attached protein, respectively). BH8xo denotes experimental control where, after 6 h ofinoculation in BH8v, cultures were incubated in unamended BH media.
Treatment Protein measured N3 SB
Protein accumulation(ng protein/20 lL sample�day)
r2 P-value Protein accumulation(ng protein/20 lL sample�day)
r2 P-value
BH8v Total 78.4 ± 11 0.61 <0.001 43.6 ± 12 0.29 0.001Attached 24 ± 7 0.42 0.004 37.6 ± 10 0.45 0.002
BH8vo Total 8.8 ± 2 0.30 0.001 �6.8 ± 3 0.12 0.050Attached 6.3 ± 3 0.18 0.079 �8.4 ± 5 0.18 0.077
Values in bold denote significant correlation (P < 0.05).
Table 4Linear regression analysis of protein measurements from 30-day model OSPW (BHM+) experiments, with biochar N3 and SB. Protein accumulations are the lines of best fit (±SEM)from samples taken in triplicate, made every three or six days (for total or attached protein, respectively). BHM+o denotes experimental control where, after 6 h of inoculation inBHM+, cultures were incubated in unamended BH media.
Treatment Protein measured N3 SB
Protein accumulation(ng protein/20 lL sample�day)
r2 P-value Protein accumulation(ng protein/20 lL sample�day)
r2 P-value
BHM+ Total 5.8 ± 3 0.13 0.038 �3.1 ± 3 0.03 0.320Attached �3.5 ± 4 0.04 0.402 �7.2 ± 4 0.16 0.096
BHM+o Total �13.1 ± 3 0.36 <0.001 �9.5 ± 5 0.11 0.055Attached �15.8 ± 3 0.66 <0.001 �8.5 ± 6 0.10 0.194
Values in bold denote significant correlation (P < 0.05).
BHM+o BHM+
0
5
10
15
20
Bio
film
thic
knes
s (µ
m)
****
BHM+o BHM+
0
5
10
15
20
****
(B)(A)
Fig. 3. Measurements of biofilm thickness of OSPW microbial cultures on (A) biochar N3 and (B) SB after 30 days. BHM+o denotes an experimental control where, after 6 h ofinoculation in the presence of Model OSPW (BHM+) cultures were incubated in unamended BH media (i.e. no supplemental carbon source); BHM+ cultures were inoculated,and then further grown in the presence of Model OSPW for the entirety of the 30-day incubation. Each bar represents the mean (±SEM) of triplicate samples. Asterisked barsindicate significant differences between BHM+o and BHM+ final biofilm thicknesses, as measured by unpaired t-tests with P-values (⁄⁄⁄⁄) <0.0001.
Table 5Removal (%) of total NAs in growth media after 6-day incubations in 8vNA Media andModel OSPW, calculated by Eq. (1). Sterile and OSPW cultures were incubated for 6-days with 20 g L�1 biochar SB or N3. Values are the average (±SEM) of duplicatesamples.
8vNA media Model OSPW
SB (%) N3 (%) SB (%) N3 (%)
Sterile 22 ± 2.3 25 ± 8.6 28 ± 1.3 19 ± 2.4OSPW cultures 72 ± 8.1 42 ± 3.9 87 ± 2.7 34 ± 0.2
M.L. Frankel et al. / Bioresource Technology 216 (2016) 352–361 357
As such, the ability of a combined microbial-biochar approach forNA removal was investigated.
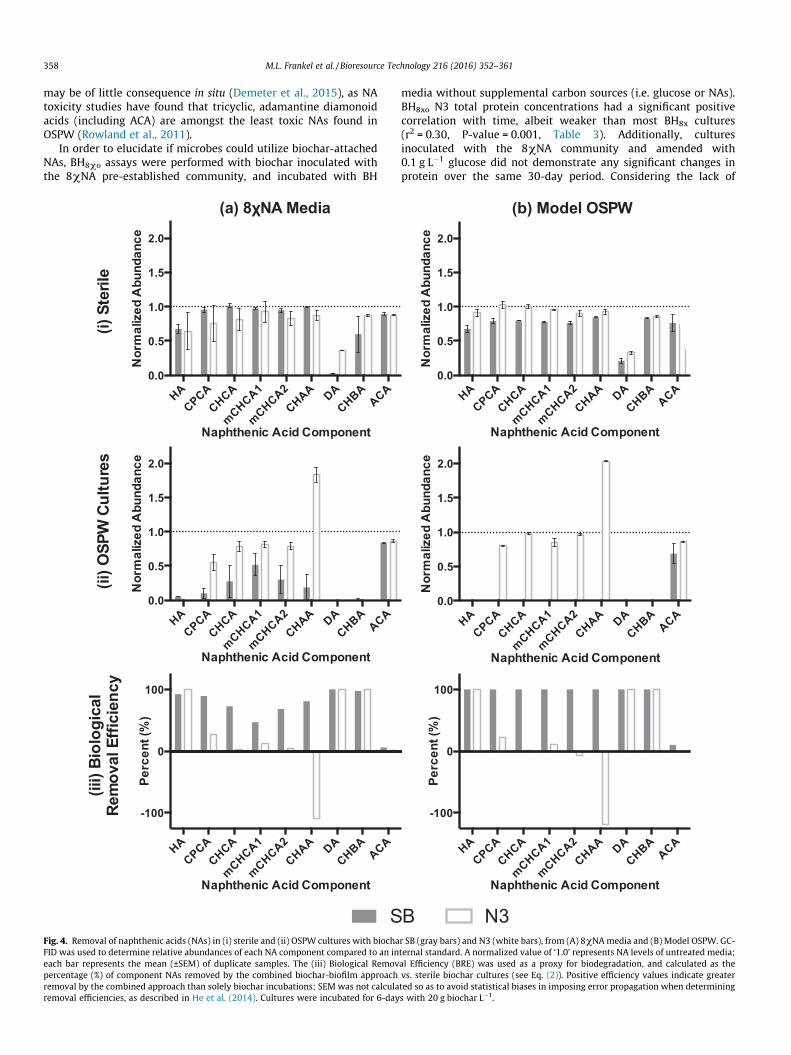
GC-FID analysis of media showed that while there was 22–25%total NA removal from the initial 200 mg L�1 concentration by ster-ile biochar, biofilm-biochar experiments demonstrated greaterremoval over the same 6-day period (42–72%, Table 5). Theseremoval trends were also evident in the removal profiles of thecomponent NAs: while there was some abiotic removal in sterilebiochar (Fig. 4ai), OSPW microbes contributed to near-completedegradation of HA, DA, and CHBA (Fig. 4aii). Biotic and sterilemedia pH measurements were similar (7.3 ± 0.1) after 6-day incu-bations, suggesting that differences in NA removal were due to bio-logical degradation rather than microbially influenced changes inmedia chemistry. In experiments with N3, there was an increasein abundance with regards to CHAA, suggesting a buildup of thisNA, consistent with previous OSPW microbial-8vNA work byDemeter et al. (2015). The researchers attributed this buildup toan incomplete biodegradation of CHBA to produce acetate and
CHAA via b-oxidation, a reaction described in other CHBA degrada-tion studies (Quesnel et al., 2011); this incomplete catabolism ofCHBA leads to a production of CHAA that builds up in the media,resulting in a the negative removal ratios seen on Fig. 4aiii. ACAproved to be the most recalcitrant NA, with limited removal,mostly due to biochar sorption as evidenced by low biologicalremoval efficiencies (610%, Fig. 4aiii). This observed recalcitrance
358 M.L. Frankel et al. / Bioresource Technology 216 (2016) 352–361
may be of little consequence in situ (Demeter et al., 2015), as NAtoxicity studies have found that tricyclic, adamantine diamonoidacids (including ACA) are amongst the least toxic NAs found inOSPW (Rowland et al., 2011).
In order to elucidate if microbes could utilize biochar-attachedNAs, BH8vo assays were performed with biochar inoculated withthe 8vNA pre-established community, and incubated with BH
Fig. 4. Removal of naphthenic acids (NAs) in (i) sterile and (ii) OSPW cultures with biochaFID was used to determine relative abundances of each NA component compared to an ineach bar represents the mean (±SEM) of duplicate samples. The (iii) Biological Removpercentage (%) of component NAs removed by the combined biochar-biofilm approachremoval by the combined approach than solely biochar incubations; SEM was not calcularemoval efficiencies, as described in He et al. (2014). Cultures were incubated for 6-day
media without supplemental carbon sources (i.e. glucose or NAs).BH8xo N3 total protein concentrations had a significant positivecorrelation with time, albeit weaker than most BH8x cultures(r2 = 0.30, P-value = 0.001, Table 3). Additionally, culturesinoculated with the 8vNA community and amended with0.1 g L�1 glucose did not demonstrate any significant changes inprotein over the same 30-day period. Considering the lack of
r SB (gray bars) and N3 (white bars), from (A) 8vNAmedia and (B) Model OSPW. GC-ternal standard. A normalized value of ‘1.0’ represents NA levels of untreated media;al Efficiency (BRE) was used as a proxy for biodegradation, and calculated as thevs. sterile biochar cultures (see Eq. (2)). Positive efficiency values indicate greaterted so as to avoid statistical biases in imposing error propagation when determinings with 20 g biochar L�1.
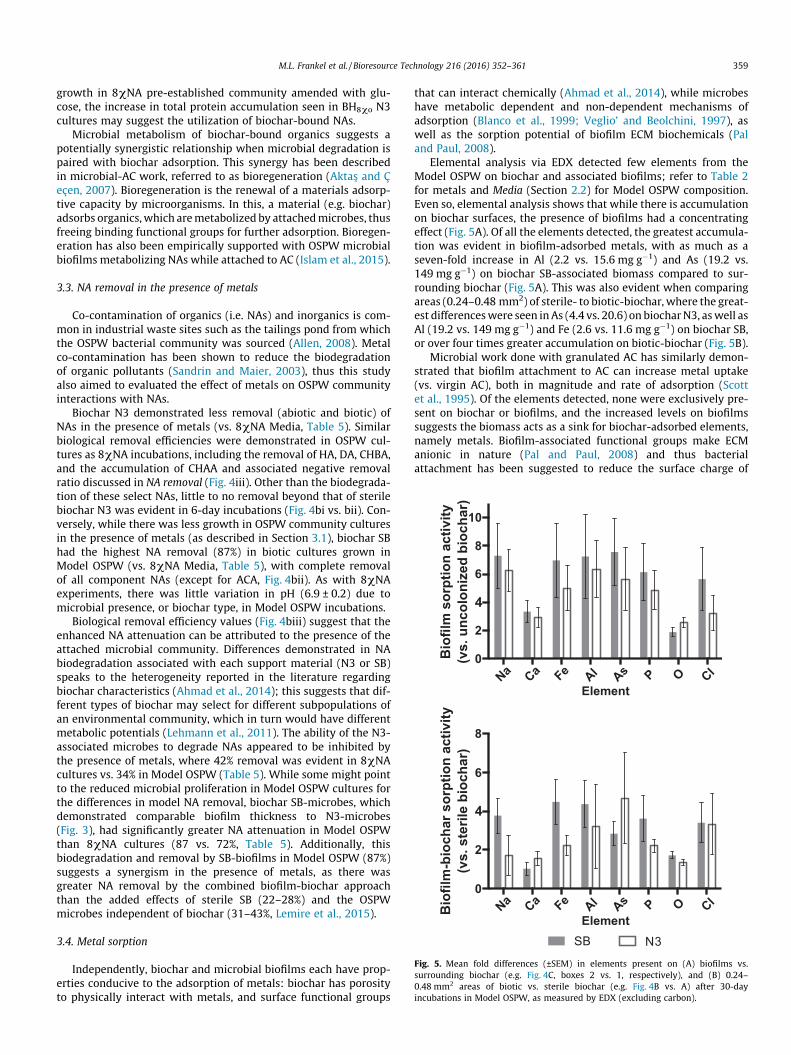
Fig. 5. Mean fold differences (±SEM) in elements present on (A) biofilms vs.surrounding biochar (e.g. Fig. 4C, boxes 2 vs. 1, respectively), and (B) 0.24–0.48 mm2 areas of biotic vs. sterile biochar (e.g. Fig. 4B vs. A) after 30-dayincubations in Model OSPW, as measured by EDX (excluding carbon).
M.L. Frankel et al. / Bioresource Technology 216 (2016) 352–361 359
growth in 8vNA pre-established community amended with glu-cose, the increase in total protein accumulation seen in BH8vo N3cultures may suggest the utilization of biochar-bound NAs.
Microbial metabolism of biochar-bound organics suggests apotentially synergistic relationship when microbial degradation ispaired with biochar adsorption. This synergy has been describedin microbial-AC work, referred to as bioregeneration (Aktas� and Çeçen, 2007). Bioregeneration is the renewal of a materials adsorp-tive capacity by microorganisms. In this, a material (e.g. biochar)adsorbs organics,which aremetabolized by attachedmicrobes, thusfreeing binding functional groups for further adsorption. Bioregen-eration has also been empirically supported with OSPW microbialbiofilms metabolizing NAs while attached to AC (Islam et al., 2015).
3.3. NA removal in the presence of metals
Co-contamination of organics (i.e. NAs) and inorganics is com-mon in industrial waste sites such as the tailings pond from whichthe OSPW bacterial community was sourced (Allen, 2008). Metalco-contamination has been shown to reduce the biodegradationof organic pollutants (Sandrin and Maier, 2003), thus this studyalso aimed to evaluated the effect of metals on OSPW communityinteractions with NAs.
Biochar N3 demonstrated less removal (abiotic and biotic) ofNAs in the presence of metals (vs. 8vNA Media, Table 5). Similarbiological removal efficiencies were demonstrated in OSPW cul-tures as 8vNA incubations, including the removal of HA, DA, CHBA,and the accumulation of CHAA and associated negative removalratio discussed in NA removal (Fig. 4iii). Other than the biodegrada-tion of these select NAs, little to no removal beyond that of sterilebiochar N3 was evident in 6-day incubations (Fig. 4bi vs. bii). Con-versely, while there was less growth in OSPW community culturesin the presence of metals (as described in Section 3.1), biochar SBhad the highest NA removal (87%) in biotic cultures grown inModel OSPW (vs. 8vNA Media, Table 5), with complete removalof all component NAs (except for ACA, Fig. 4bii). As with 8vNAexperiments, there was little variation in pH (6.9 ± 0.2) due tomicrobial presence, or biochar type, in Model OSPW incubations.
Biological removal efficiency values (Fig. 4biii) suggest that theenhanced NA attenuation can be attributed to the presence of theattached microbial community. Differences demonstrated in NAbiodegradation associated with each support material (N3 or SB)speaks to the heterogeneity reported in the literature regardingbiochar characteristics (Ahmad et al., 2014); this suggests that dif-ferent types of biochar may select for different subpopulations ofan environmental community, which in turn would have differentmetabolic potentials (Lehmann et al., 2011). The ability of the N3-associated microbes to degrade NAs appeared to be inhibited bythe presence of metals, where 42% removal was evident in 8vNAcultures vs. 34% in Model OSPW (Table 5). While some might pointto the reduced microbial proliferation in Model OSPW cultures forthe differences in model NA removal, biochar SB-microbes, whichdemonstrated comparable biofilm thickness to N3-microbes(Fig. 3), had significantly greater NA attenuation in Model OSPWthan 8vNA cultures (87 vs. 72%, Table 5). Additionally, thisbiodegradation and removal by SB-biofilms in Model OSPW (87%)suggests a synergism in the presence of metals, as there wasgreater NA removal by the combined biofilm-biochar approachthan the added effects of sterile SB (22–28%) and the OSPWmicrobes independent of biochar (31–43%, Lemire et al., 2015).
3.4. Metal sorption
Independently, biochar and microbial biofilms each have prop-erties conducive to the adsorption of metals: biochar has porosityto physically interact with metals, and surface functional groups
that can interact chemically (Ahmad et al., 2014), while microbeshave metabolic dependent and non-dependent mechanisms ofadsorption (Blanco et al., 1999; Veglio’ and Beolchini, 1997), aswell as the sorption potential of biofilm ECM biochemicals (Paland Paul, 2008).
Elemental analysis via EDX detected few elements from theModel OSPW on biochar and associated biofilms; refer to Table 2for metals and Media (Section 2.2) for Model OSPW composition.Even so, elemental analysis shows that while there is accumulationon biochar surfaces, the presence of biofilms had a concentratingeffect (Fig. 5A). Of all the elements detected, the greatest accumula-tion was evident in biofilm-adsorbed metals, with as much as aseven-fold increase in Al (2.2 vs. 15.6 mg g�1) and As (19.2 vs.149 mg g�1) on biochar SB-associated biomass compared to sur-rounding biochar (Fig. 5A). This was also evident when comparingareas (0.24–0.48 mm2) of sterile- to biotic-biochar, where the great-est differenceswere seen inAs (4.4 vs. 20.6) on biocharN3, aswell asAl (19.2 vs. 149 mg g�1) and Fe (2.6 vs. 11.6 mg g�1) on biochar SB,or over four times greater accumulation on biotic-biochar (Fig. 5B).
Microbial work done with granulated AC has similarly demon-strated that biofilm attachment to AC can increase metal uptake(vs. virgin AC), both in magnitude and rate of adsorption (Scottet al., 1995). Of the elements detected, none were exclusively pre-sent on biochar or biofilms, and the increased levels on biofilmssuggests the biomass acts as a sink for biochar-adsorbed elements,namely metals. Biofilm-associated functional groups make ECManionic in nature (Pal and Paul, 2008) and thus bacterialattachment has been suggested to reduce the surface charge of
360 M.L. Frankel et al. / Bioresource Technology 216 (2016) 352–361
the carbon (Rivera-Utrilla et al., 2001), which even if only locallyeffected (i.e. by microcolonies) will enhance the capacity to adsorbpositively charged contaminants (e.g. cationic metals). While thismight help elucidate the ability of biochar-associated biofilms toconcentrate adsorbed metals, it was still a surprise to find so fewmetals from the Model OSPW in the EDX analysis.
4. Conclusions
Several carbonaceous materials were screened and two biocharsamples – from softwood bark (SB) and Aspen wood – were shownto grow biofilms most effectively. Biodegradation by attachedmicrobes was observed, and with biochar SB, a synergistic behaviorbetween the adsorbent and biofilm was demonstrated for NAremoval from water. With an initial NA concentration of200 mg L�1, biotic-SB demonstrated greater NA removal than ster-ile biochar (22–28%), in the absence (72%) and presence of metals(87%), outperforming 6-day NA removal demonstrated by themicrobial community alone. Additionally, there was greater metalsorption by the biofilm-biochar complex than sterile biochar.
Acknowledgements
This work was supported by grants from the Natural Scienceand Engineering Research Council to RJT (RGPIN/219895-2010).We thank industry contributors for their gifts of activated carbon(Jacobi Carbons AB), Black Carbon (Atlantic Hydrogen Inc.) and bio-char feedstock biomass (Abri-TechTM modular construction, andnorthern Alberta sawmills). We would also like to thank Dr. L. Giegfor access to the gas chromatograph supported by Genome Canada,and acknowledge an Alberta oil sands operator for their contribu-tion of OSPW.
Appendix A. Supplementary data
Supplementary data (i.e. biochar production parameters, anddata from initial P. fluorescens screens and OSPW community assaysto evaluate 6-day growth in BH8v. Appendix A also includes proteindata from the 8xNA and Model OSPW pre-conditioned microbialcommunities, incubated for 30-days in their correspondingamended media (BH8v, BHM+), unamended media (BH8vo, BHM+o),BH with 0.1 g L�1 glucose, as well as sterile Model OSPW incuba-tions with each biochar. Additionally, correlations of physical char-acteristics of biochar samples vs. 6-day BHG protein accumulation,rationale for Model OSPW metal working concentrations, scanningelectron micrograph images, EDX spectra, summarized EDX ele-mental data, and pH from media before and after 6-day 8vNA andModel OSPWexperiments) associatedwith this article can be found,in the online version, at http://dx.doi.org/10.1016/j.biortech.2016.05.084.
References
Ahmad, M., Rajapaksha, A.U., Lim, J.E., Zhang, M., Bolan, N., Mohan, D., Vithanage,M., Lee, S.S., Ok, Y.S., 2014. Biochar as a sorbent for contaminant management insoil and water: a review. Chemosphere 99, 19–33. http://dx.doi.org/10.1016/j.chemosphere.2013.10.071.
Aktas�, Ö.,Çeçen,F., 2007.Bioregenerationofactivatedcarbon:a review. Int. Biodeterior.Biodegrad. 59, 257–272. http://dx.doi.org/10.1016/j.ibiod.2007.01.003.
Alessi, D.S., Alam, M.S., Kohler, M.C., 2014. Designer Biochar-Coke Mixtures toRemove Naphthenic Acids from Oil Sands Process-Affected Water (OSPW) (No.OSRIN Report No. TR-57). Oil Sands Research and Information Network.
Allen, E.W., 2008. Process water treatment in Canada’s oil sands industry: I. Targetpollutants and treatment objectives. J. Environ. Eng. Sci. 7, 123–138. http://dx.doi.org/10.1139/S07-038.
Blanco, A., Llama, J., Serra, J.L., 1999. Biosorption of heavy metals to immobilisedPhormidium laminosum biomass. J. Biotechnol. 69, 227–240. http://dx.doi.org/10.1016/S0168-1656(99)00046-2.
Brown, L.D., Ulrich, A.C., 2015. Oil sands naphthenic acids: a review of properties,measurement, and treatment. Chemosphere 127, 276–290. http://dx.doi.org/10.1016/j.chemosphere.2015.02.003.
Bushnell, L.D., Haas, H.F., 1941. The utilization of hydrocarbons by microorganisms.J. Bacteriol. 41, 653–673.
Demeter, M.A., Lemire, J.A., Yue, G., Ceri, H., Turner, R.J., 2015. Culturing oil sandsmicrobes as mixed species communities enhances ex situ model naphthenicacid degradation. Front. Microbiol. 6, 1–13. http://dx.doi.org/10.3389/fmicb.2015.00936.
Frankel, M.L., Demeter, M.A., Lemire, J.A., Turner, R.J., 2016. Evaluating the metaltolerance capacity of microbial communities isolated from the Alberta oil sandsprocess water. PLoS ONE 11. http://dx.doi.org/10.1371/journal.pone.0148682.
Golby, S., Ceri, H., Gieg, L.M., Chatterjee, I., Marques, L.L.R., Turner, R.J., 2012.Evaluation of microbial biofilm communities from an Alberta oil sands tailingspond. FEMS Microbiol. Ecol. 79, 240–250. http://dx.doi.org/10.1111/j.1574-6941.2011.01212.x.
Hale, L., Luth, M., Crowley, D., 2015. Biochar characteristics relate to its utility as analternative soil inoculum carrier to peat and vermiculite. Soil Biol. Biochem. 81,228–235. http://dx.doi.org/10.1016/j.soilbio.2014.11.023.
Hall-Stoodley, L., Costerton, J.W., Stoodley, P., 2004. Bacterial biofilms: from thenatural environment to infectious diseases. Nat. Rev. Microbiol. 2, 95–108.http://dx.doi.org/10.1038/nrmicro821.
Harrison, J.J., Ceri, H., Yerly, J., Stremick, C.A., Hu, Y., Martinuzzi, R., Turner, R.J., 2006.The use of microscopy and three-dimensional visualization to evaluate thestructure of microbial biofilms cultivated in the Calgary Biofilm Device. Biol.Proced. Online 8, 194–215. http://dx.doi.org/10.1251/bpo127.
He, C., Rochfort, Q., Mcfadyen, R., 2014. Potential errors and error propagation inmethods used to determine particle removal efficiency. J. Environ. Eng. 140, 1–5. http://dx.doi.org/10.1061/(ASCE)EE.1943-7870.0000839.
Herman, D.C., Fedorak, P.M., MacKinnon, M.D., Costerton, J.W., 1994. Biodegradationof naphthenic acids by microbial populations indigenous to oil sands tailings.Can. J. Microbiol. 40, 467–477.
Islam, M.S., Zhang, Y., McPhedran, K.N., Liu, Y., Gamal El-Din, M., 2015. Granularactivated carbon for simultaneous adsorption and biodegradation of toxic oilsands process-affected water organic compounds. J. Environ. Manage. 152, 49–57. http://dx.doi.org/10.1016/j.jenvman.2015.01.020.
Lehmann, J., Rillig, M.C., Thies, J., Masiello, C.A., Hockaday, W.C., Crowley, D., 2011.Biochar effects on soil biota – a review. Soil Biol. Biochem. 43, 1812–1836.http://dx.doi.org/10.1016/j.soilbio.2011.04.022.
Lemire, J.A., Demeter, M.A., George, I., Ceri, H., Turner, R.J., 2015. A novel approachfor harnessing biofilm communities in moving bed biofilm reactors forindustrial wastewater treatment. AIMS Bioeng. 2, 387–403. http://dx.doi.org/10.3934/bioeng.2015.4.387.
Lo, C.C., Brownlee, B.G., Bunce, N.J., 2006. Mass spectrometric and toxicologicalassays of Athabasca oil sands naphthenic acids. Water Res. 40, 655–664. http://dx.doi.org/10.1016/j.watres.2005.12.008.
McKenzie, N., Yue, S., Liu, X., Ramsay, B.A., Ramsay, J.A., 2014. Biodegradation ofnaphthenic acids in oils sands process waters in an immobilized soil/sedimentbioreactor. Chemosphere 109, 164–172. http://dx.doi.org/10.1016/j.chemosphere.2014.02.001.
Nicolella, C., van Loosdrecht, M.C.M., Heijnen, J.J., 2000. Wastewater treatment withparticulate biofilm reactors. J. Biotechnol. 80, 1–33.
Nzila, A., 2013. Update on the cometabolism of organic pollutants by bacteria.Environ. Pollut. 178, 474–482. http://dx.doi.org/10.1016/j.envpol.2013.03.042.
Pal, A., Paul, A.K., 2008. Microbial extracellular polymeric substances: centralelements in heavy metal bioremediation. Indian J. Microbiol. 48, 49–64. http://dx.doi.org/10.1007/s12088-008-0006-5.
Quesnel, D.M., Bhaskar, I.M., Gieg, L.M., Chua, G., 2011. Naphthenic acidbiodegradation by the unicellular alga Dunaliella tertiolecta. Chemosphere 84,504–511. http://dx.doi.org/10.1016/j.chemosphere.2011.03.012.
Rivera-Utrilla, J., Bautista-Toledo, I., Ferro-Garca, M.A., Moreno-Castilla, C., 2001.Activated carbon surface modifications by adsorption of bacteria and theireffect on aqueous lead adsorption. J. Chem. Technol. Biotechnol. 76, 1209–1215.http://dx.doi.org/10.1002/jctb.506.
Rowland, S.J., Scarlett, A.G., Jones, D., West, C.E., Frank, R.A., 2011. Diamonds in therough: identification of individual naphthenic acids in oil sands process water.Environ. Sci. Technol. 45, 3154–3159. http://dx.doi.org/10.1021/es103721b.
Sandrin, T.R., Maier, R.M., 2003. Impact of metals on the biodegradation of organicpollutants. Environ. Health Perspect. 111, 1093–1101. http://dx.doi.org/10.1289/ehp.5840.
Scott, J.A., Karanjkar, A.M., Rowe, D.L., 1995. Biofilm covered granular activatedcarbon for decontamination of streams containing heavy metals and organicchemicals. Miner. Eng. 8, 221–230. http://dx.doi.org/10.1016/0892-6875(94)00115-S.
Singh, R., Paul, D., Jain, R.K., 2006. Biofilms: implications in bioremediation. TrendsMicrobiol. 14, 389–397. http://dx.doi.org/10.1016/j.tim.2006.07.001.
Spokas, K.A., 2010. Review of the stability of biochar in soils: predictability of O:Cmolar ratios. Carbon Manage. 1, 289–303. http://dx.doi.org/10.4155/cmt.10.32.
Suncor, 2014. SUNCOR: Rep. on sustain. 2014.Veglio’, F., Beolchin, F., 1997. Removal of metals by biosorption: a review.
Hydrometallurgy 44, 301–316. http://dx.doi.org/10.1016/S0304-386X(96)00059-X.

M.L. Frankel et al. / Bioresource Technology 216 (2016) 352–361 361
Veksha, A., McLaughlin, H., Layzell, D.B., Hill, J.M., 2014. Pyrolysis of wood tobiochar: increasing yield while maintaining microporosity. Bioresour. Technol.153, 173–179. http://dx.doi.org/10.1016/j.biortech.2013.11.082.
Wyndham, R.C., Costerton, J.W., 1981. Heterotrophic potentials and hydrocarbonbiodegradation potentials of sediment microorganisms within the Athabasca oilsands deposit. Appl. Environ. Microbiol. 41, 783–790.
Xie, T., Reddy, K.R., Wang, C., Yargicoglu, E., Spokas, K., 2015. Characteristics andapplications of biochar for environmental remediation: a review. Crit. Rev.Environ. Sci. Technol. 45, 939–969. http://dx.doi.org/10.1080/10643389.2014.924180.