Embed Size (px)
Citation preview
AUGUST 25, 2016 REMEDY OPTIMIZATION & SITE EXIT STRATEGIES
REMEDY OPTIMIZATION OVERVIEW GEORGIA ENVIRONMENTAL CONFERENCE AUGUST 25, 2016
AUGUST 25, 2016 REMEDY OPTIMIZATION & SITE EXIT STRATEGIES
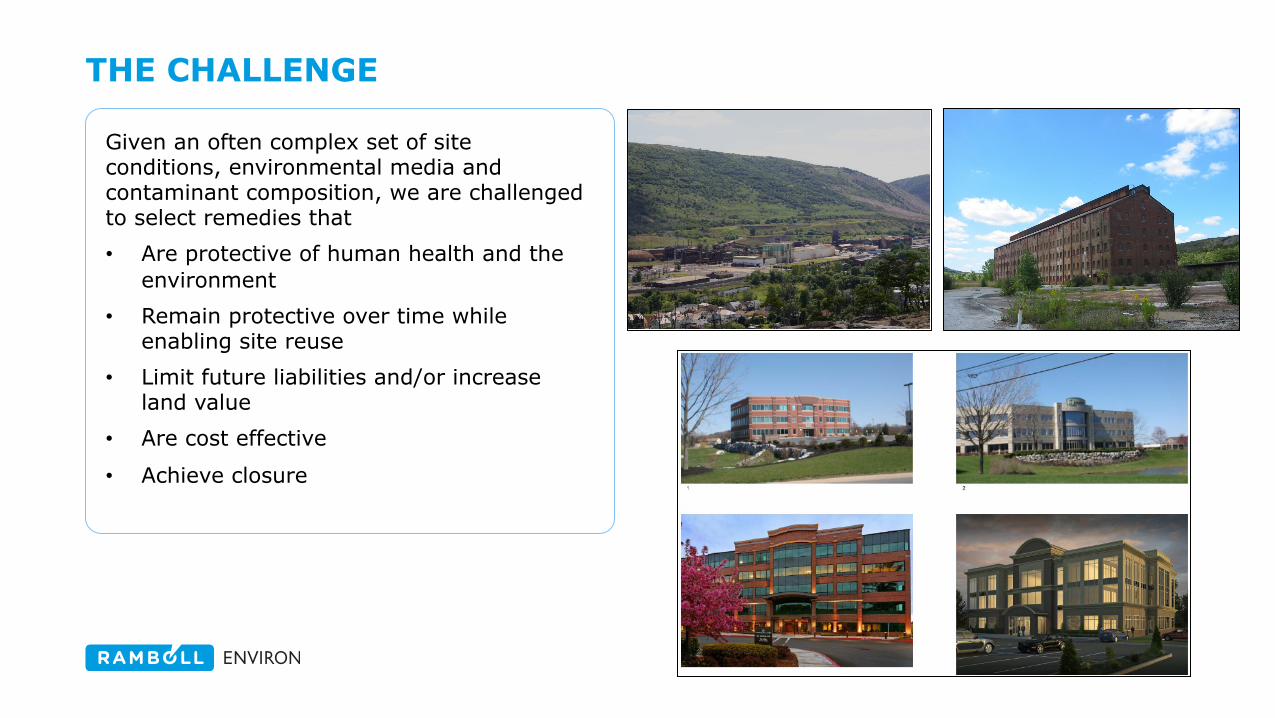
THE CHALLENGE
Given an often complex set of site conditions, environmental media and contaminant composition, we are challenged to select remedies that • Are protective of human health and the
environment • Remain protective over time while
enabling site reuse • Limit future liabilities and/or increase
land value • Are cost effective
• Achieve closure
AUGUST 25, 2016 REMEDY OPTIMIZATION & SITE EXIT STRATEGIES
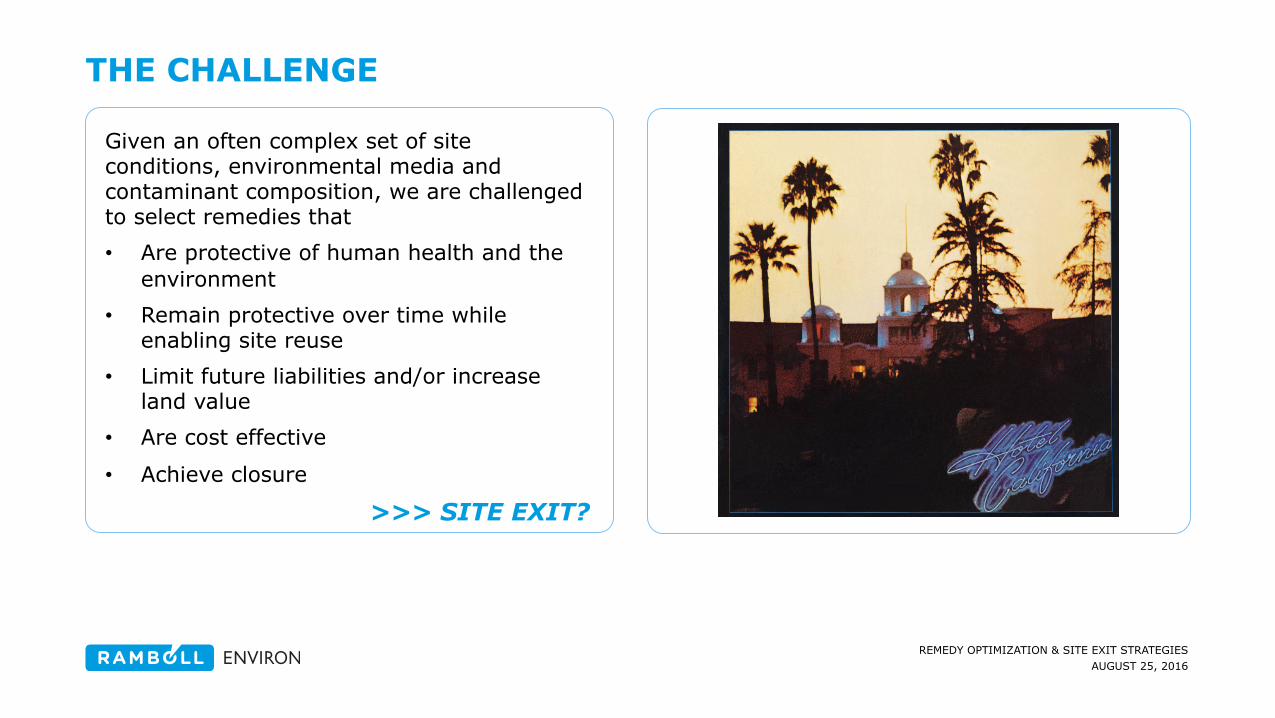
THE CHALLENGE
Given an often complex set of site conditions, environmental media and contaminant composition, we are challenged to select remedies that • Are protective of human health and the
environment • Remain protective over time while
enabling site reuse • Limit future liabilities and/or increase
land value • Are cost effective
• Achieve closure
>>> SITE EXIT?
AUGUST 25, 2016 REMEDY OPTIMIZATION & SITE EXIT STRATEGIES
4
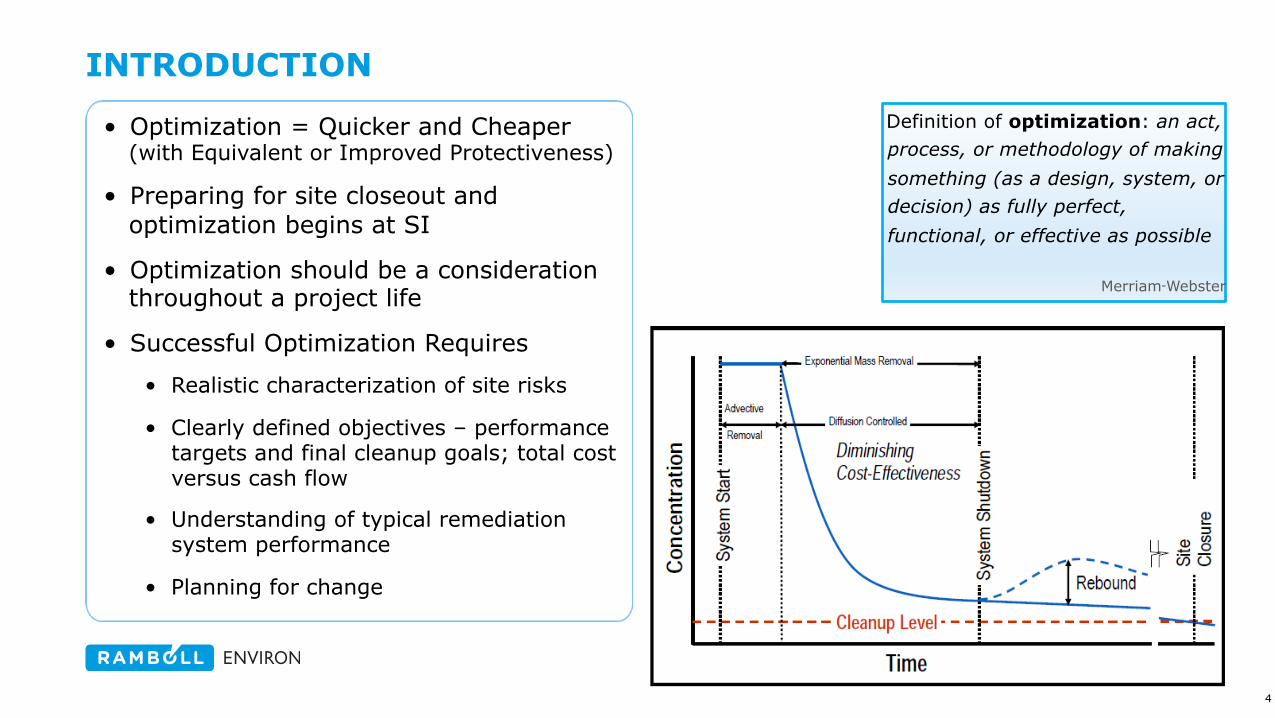
INTRODUCTION
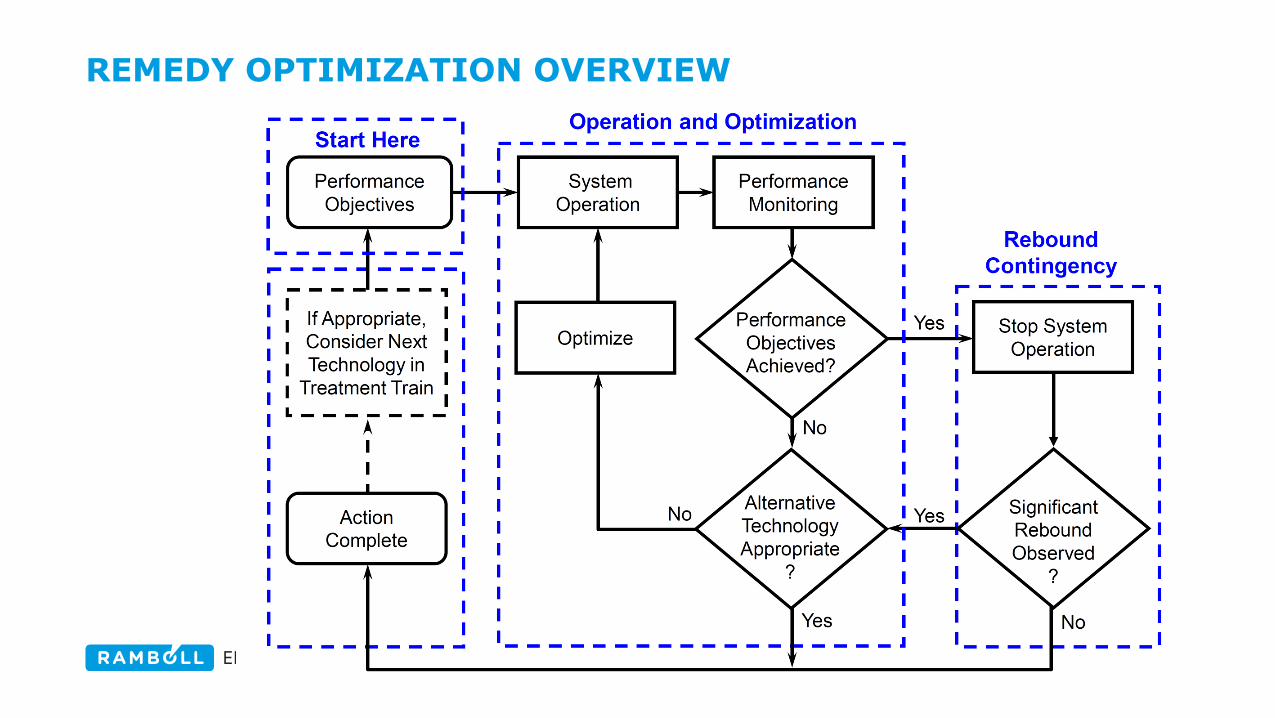
• Optimization = Quicker and Cheaper (with Equivalent or Improved Protectiveness)
• Preparing for site closeout and optimization begins at SI
• Optimization should be a consideration throughout a project life
• Successful Optimization Requires
• Realistic characterization of site risks
• Clearly defined objectives – performance targets and final cleanup goals; total cost versus cash flow
• Understanding of typical remediation system performance
• Planning for change
Definition of optimization: an act, process, or methodology of making something (as a design, system, or decision) as fully perfect, functional, or effective as possible
Merriam‑Webster
AUGUST 25, 2016 REMEDY OPTIMIZATION & SITE EXIT STRATEGIES
5
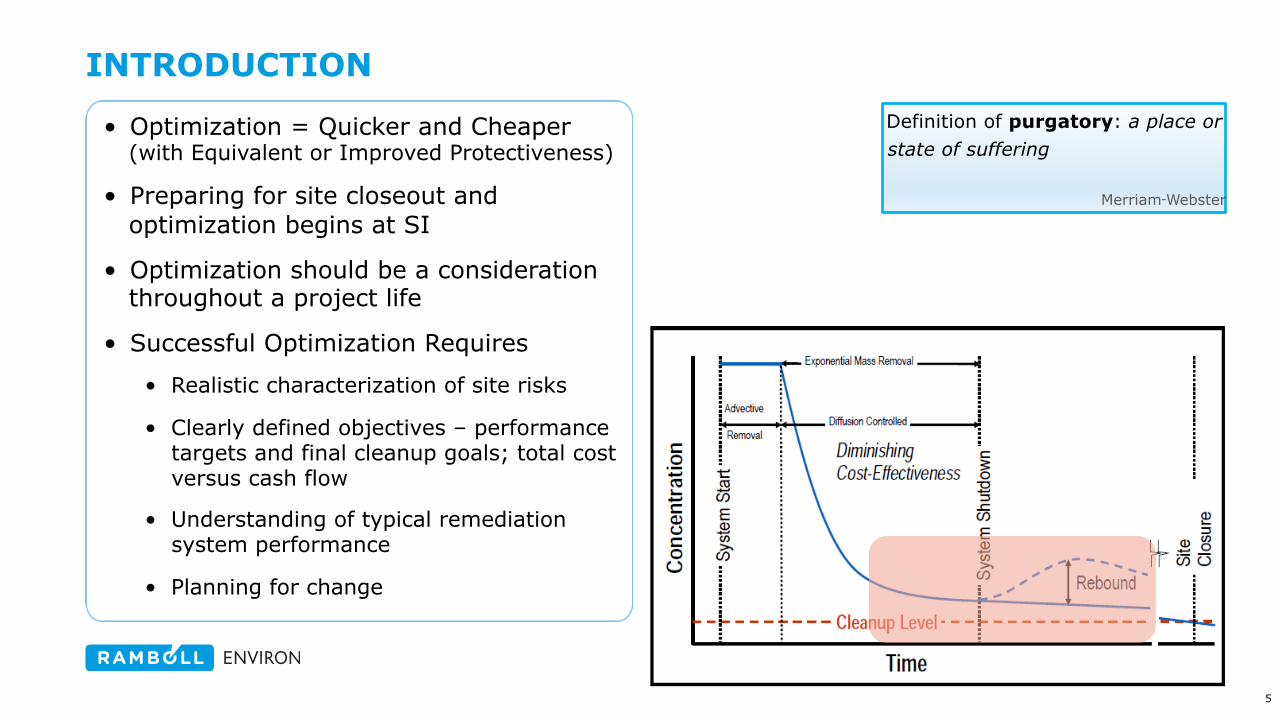
INTRODUCTION
• Optimization = Quicker and Cheaper (with Equivalent or Improved Protectiveness)
• Preparing for site closeout and optimization begins at SI
• Optimization should be a consideration throughout a project life
• Successful Optimization Requires
• Realistic characterization of site risks
• Clearly defined objectives – performance targets and final cleanup goals; total cost versus cash flow
• Understanding of typical remediation system performance
• Planning for change
Definition of purgatory: a place or state of suffering
Merriam‑Webster
AUGUST 25, 2016 REMEDY OPTIMIZATION & SITE EXIT STRATEGIES
REMEDY OPTIMIZATION OVERVIEW
AUGUST 25, 2016 REMEDY OPTIMIZATION & SITE EXIT STRATEGIES
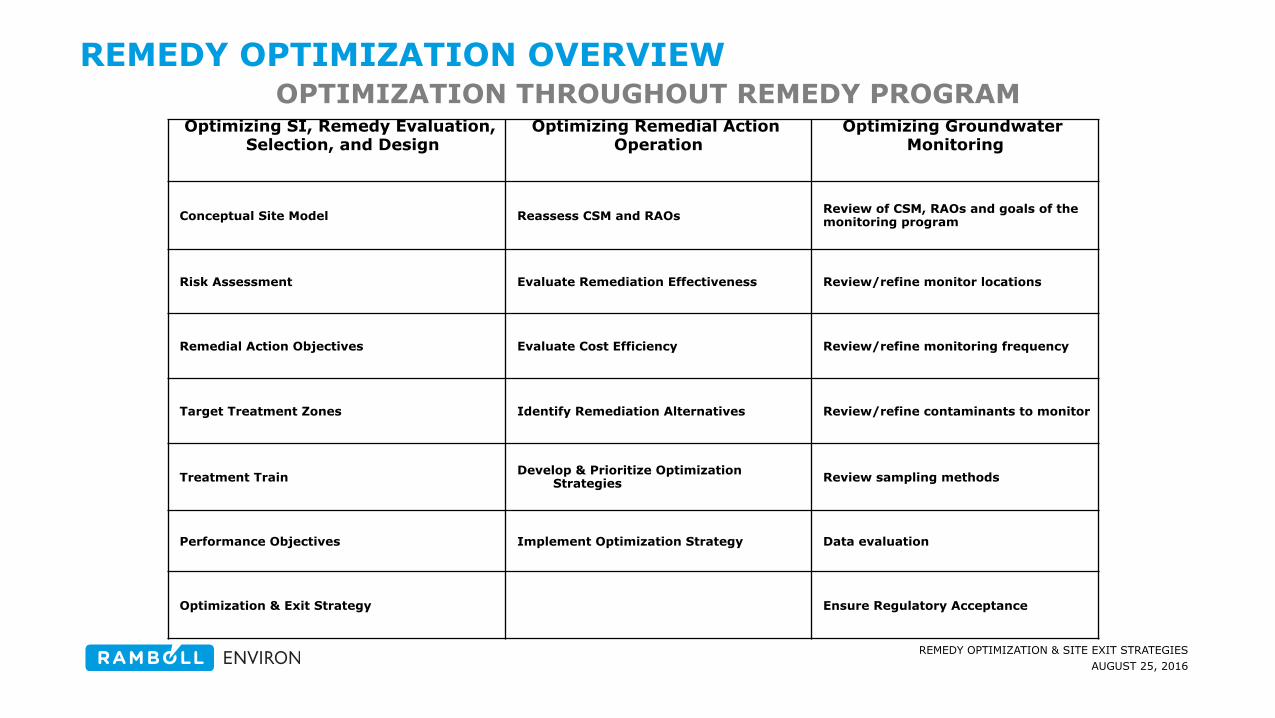
REMEDY OPTIMIZATION OVERVIEW OPTIMIZATION THROUGHOUT REMEDY PROGRAM
Optimizing SI, Remedy Evaluation, Selection, and Design
Optimizing Remedial Action Operation
Optimizing Groundwater Monitoring
Conceptual Site Model Reassess CSM and RAOs Review of CSM, RAOs and goals of the monitoring program
Risk Assessment Evaluate Remediation Effectiveness Review/refine monitor locations
Remedial Action Objectives Evaluate Cost Efficiency Review/refine monitoring frequency
Target Treatment Zones Identify Remediation Alternatives Review/refine contaminants to monitor
Treatment Train Develop & Prioritize Optimization Strategies Review sampling methods
Performance Objectives Implement Optimization Strategy Data evaluation
Optimization & Exit Strategy Ensure Regulatory Acceptance
AUGUST 25, 2016 REMEDY OPTIMIZATION & SITE EXIT STRATEGIES
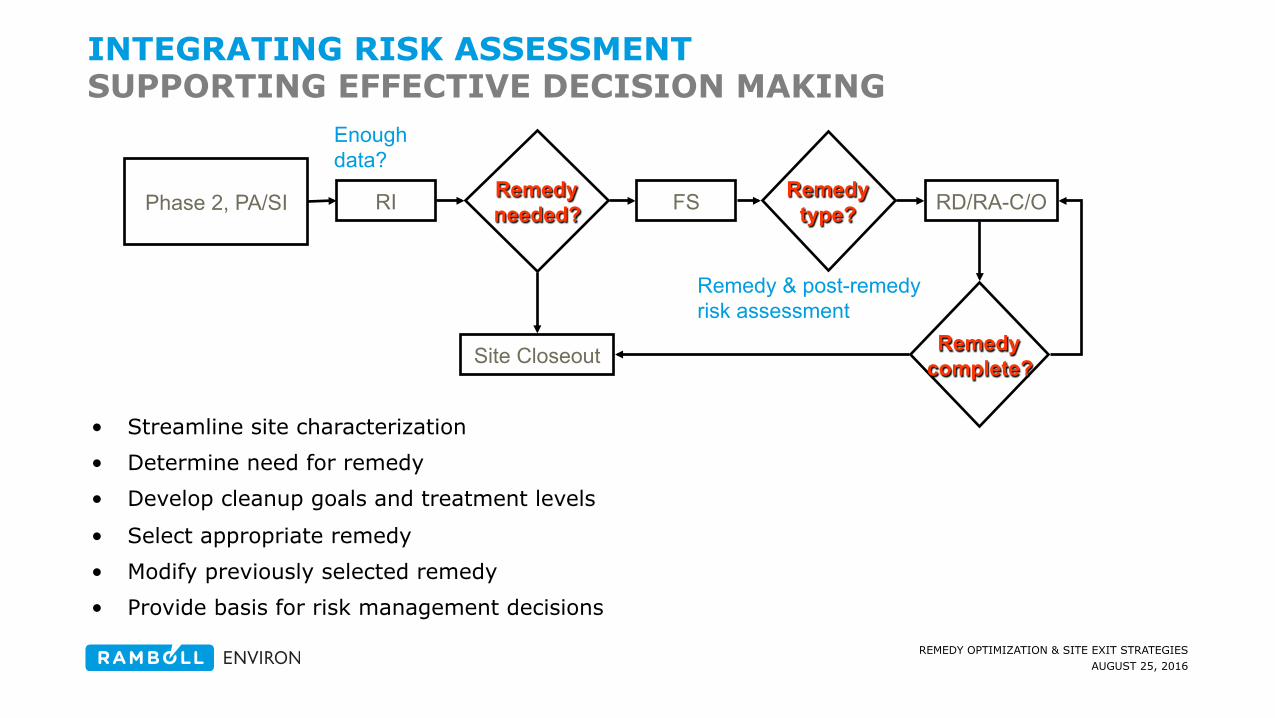
Remedy & post-remedy risk assessment
INTEGRATING RISK ASSESSMENT SUPPORTING EFFECTIVE DECISION MAKING
• Streamline site characterization • Determine need for remedy • Develop cleanup goals and treatment levels
• Select appropriate remedy • Modify previously selected remedy • Provide basis for risk management decisions
Enough data?
Remedy needed?
Remedy type?
Remedy complete?
RI Phase 2, PA/SI FS
Site Closeout
RD/RA-C/O
AUGUST 25, 2016 REMEDY OPTIMIZATION & SITE EXIT STRATEGIES
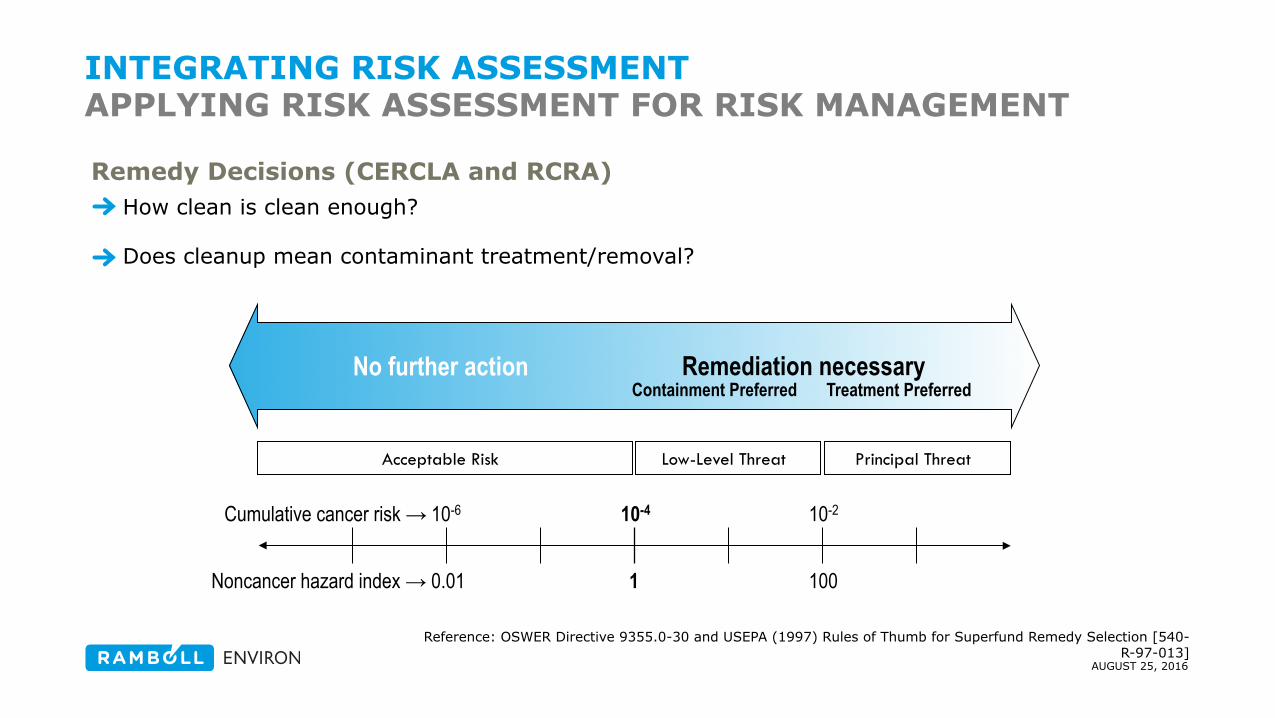
INTEGRATING RISK ASSESSMENT APPLYING RISK ASSESSMENT FOR RISK MANAGEMENT
Remedy Decisions (CERCLA and RCRA) How clean is clean enough?
Does cleanup mean contaminant treatment/removal?
No further action
10-4 10-2 10-6
Low-Level Threat Principal Threat Acceptable Risk
1 0.01 100 Noncancer hazard index →
Cumulative cancer risk →
Remediation necessary Containment Preferred Treatment Preferred
Reference: OSWER Directive 9355.0-30 and USEPA (1997) Rules of Thumb for Superfund Remedy Selection [540-R-97-013]
AUGUST 25, 2016 REMEDY OPTIMIZATION & SITE EXIT STRATEGIES
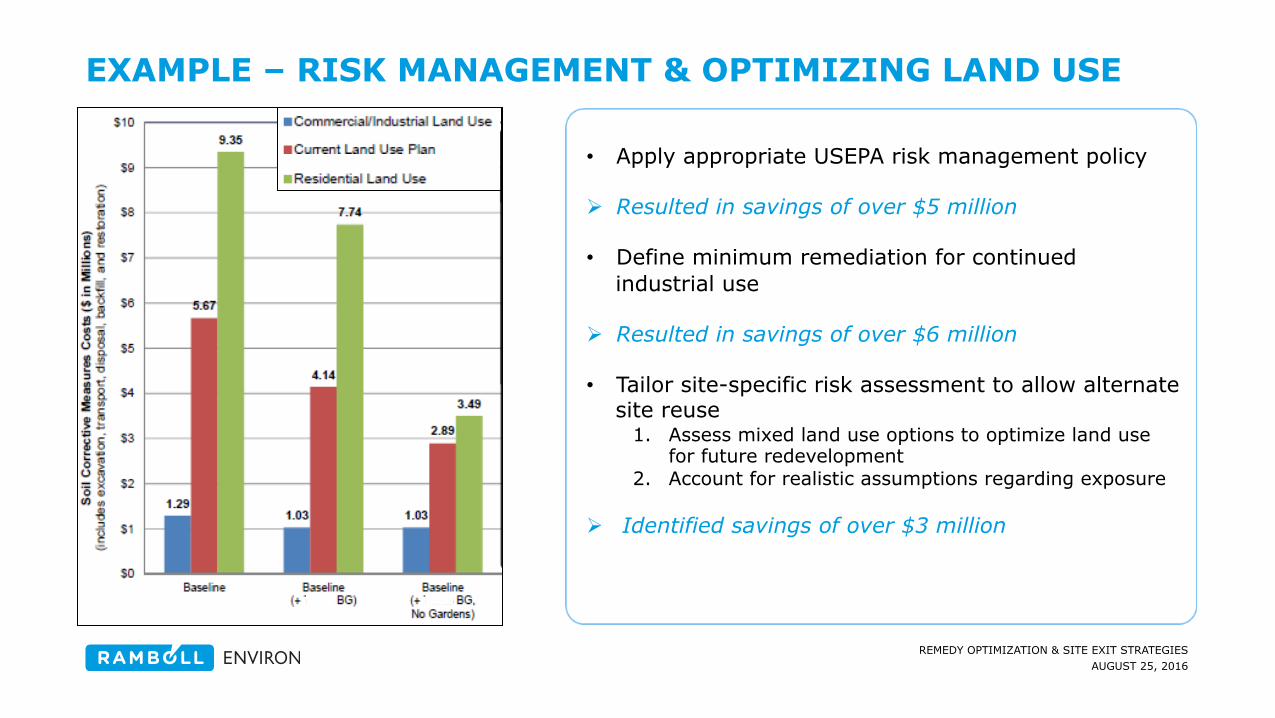
EXAMPLE – RISK MANAGEMENT & OPTIMIZING LAND USE
• Apply appropriate USEPA risk management policy Ø Resulted in savings of over $5 million
• Define minimum remediation for continued industrial use
Ø Resulted in savings of over $6 million • Tailor site-specific risk assessment to allow alternate
site reuse 1. Assess mixed land use options to optimize land use
for future redevelopment 2. Account for realistic assumptions regarding exposure
Ø Identified savings of over $3 million
AUGUST 25, 2016 REMEDY OPTIMIZATION & SITE EXIT STRATEGIES
Effort/Cost ($)
Con
cent
ratio
n/Ris
k
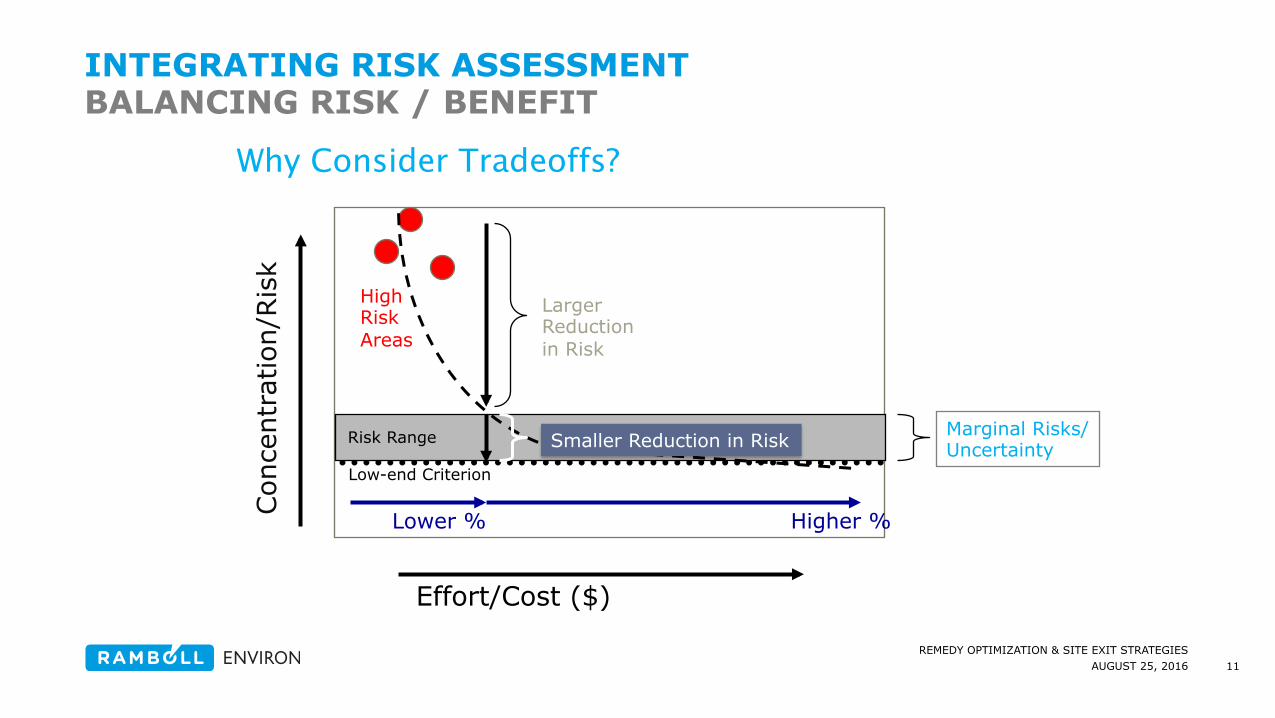
Low-end Criterion
High Risk Areas
Larger Reduction in Risk
Lower % Higher %
Marginal Risks/ Uncertainty
Risk Range Smaller Reduction in Risk
Why Consider Tradeoffs?
11
INTEGRATING RISK ASSESSMENT BALANCING RISK / BENEFIT
AUGUST 25, 2016 REMEDY OPTIMIZATION & SITE EXIT STRATEGIES
1.00E-07
1.00E-06
1.00E-05
1.00E-04
1.00E-03
1.00E-02
1.00E-01
0
2
4
6
8
10
12
14
16
18
20
1 2 3 4 5 6
Res
idua
l Can
cer R
isk
C
ost I
ncre
ase
Fact
or R
elat
ive
to A
ltern
ativ
e 1
Remedial Alternative
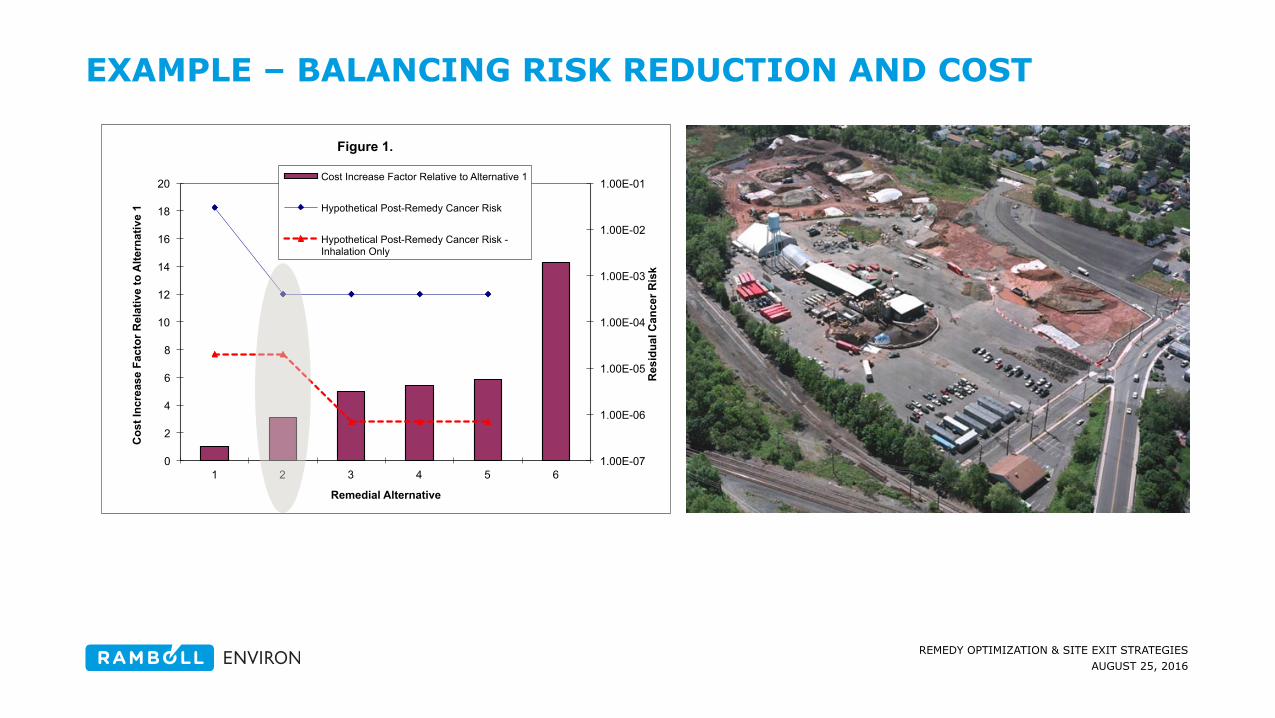
Figure 1.
Cost Increase Factor Relative to Alternative 1
Hypothetical Post-Remedy Cancer Risk
Hypothetical Post-Remedy Cancer Risk - Inhalation Only
EXAMPLE – BALANCING RISK REDUCTION AND COST
AUGUST 25, 2016 REMEDY OPTIMIZATION & SITE EXIT STRATEGIES
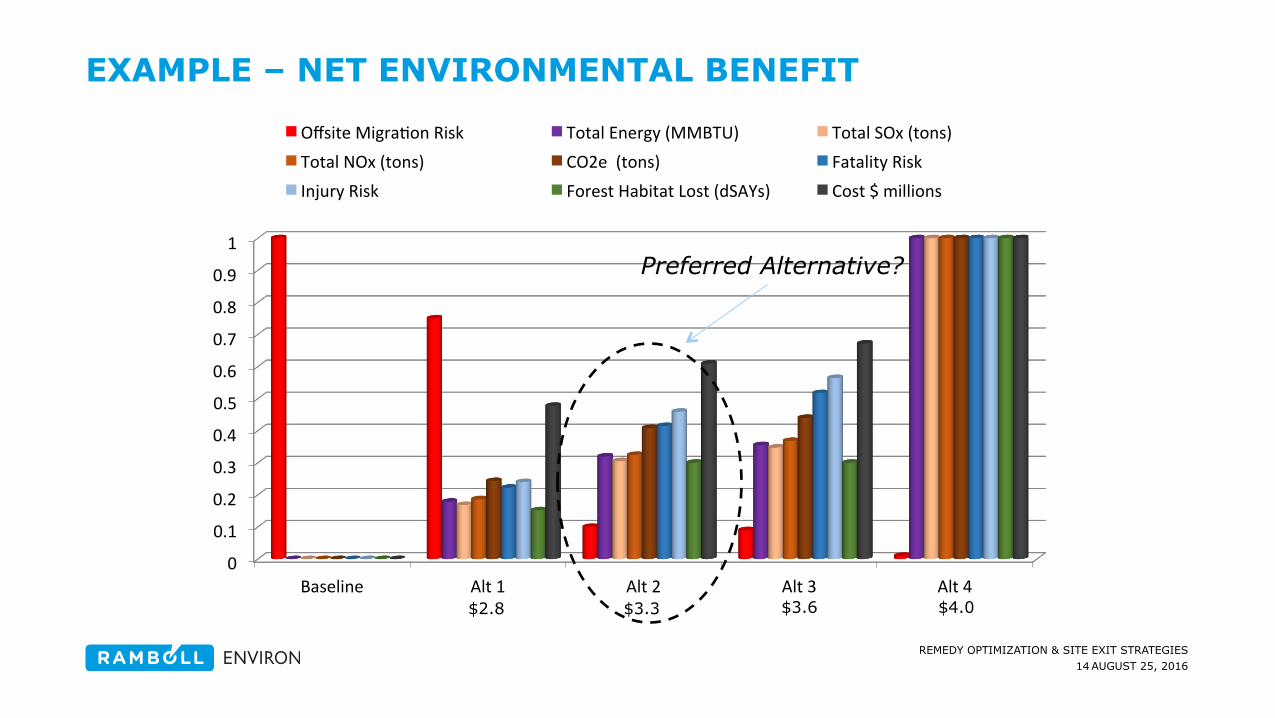
INTEGRATING RISK ASSESSMENT USE OF NET ENVIRONMENTAL BENEFIT ANALYSIS
Goal: Identify remedies that are ecologically protective, serves the public interest, meets stakeholder goals , help conserve resources that provide human and ecological value, and are generally more cost effective
• Shifts focus from a chemical-centric view of the environment to environmental services, productivity, and health
• Quantitative assessment of total impacts related to the remedial alternatives being considered; for example
• direct and indirect sources of GHGs and relative scale of the GHGs,
• material reused on site or disposed,
• travel required to maintain the remedy.
• Differentiate between remedies that offer equivalent public health and environmental protection using relevant and readily calculable metrics
AUGUST 25, 2016 REMEDY OPTIMIZATION & SITE EXIT STRATEGIES
0
0.1
0.2
0.3
0.4
0.5
0.6
0.7
0.8
0.9
1
Baseline Alt 1 Alt 2 Alt 3 Alt 4
Offsite Migra;on Risk Total Energy (MMBTU) Total SOx (tons) Total NOx (tons) CO2e (tons) Fatality Risk Injury Risk Forest Habitat Lost (dSAYs) Cost $ millions
Preferred Alternative?
$2.8 $3.3 $3.6 $4.0
14
EXAMPLE – NET ENVIRONMENTAL BENEFIT
AUGUST 25, 2016 REMEDY OPTIMIZATION & SITE EXIT STRATEGIES
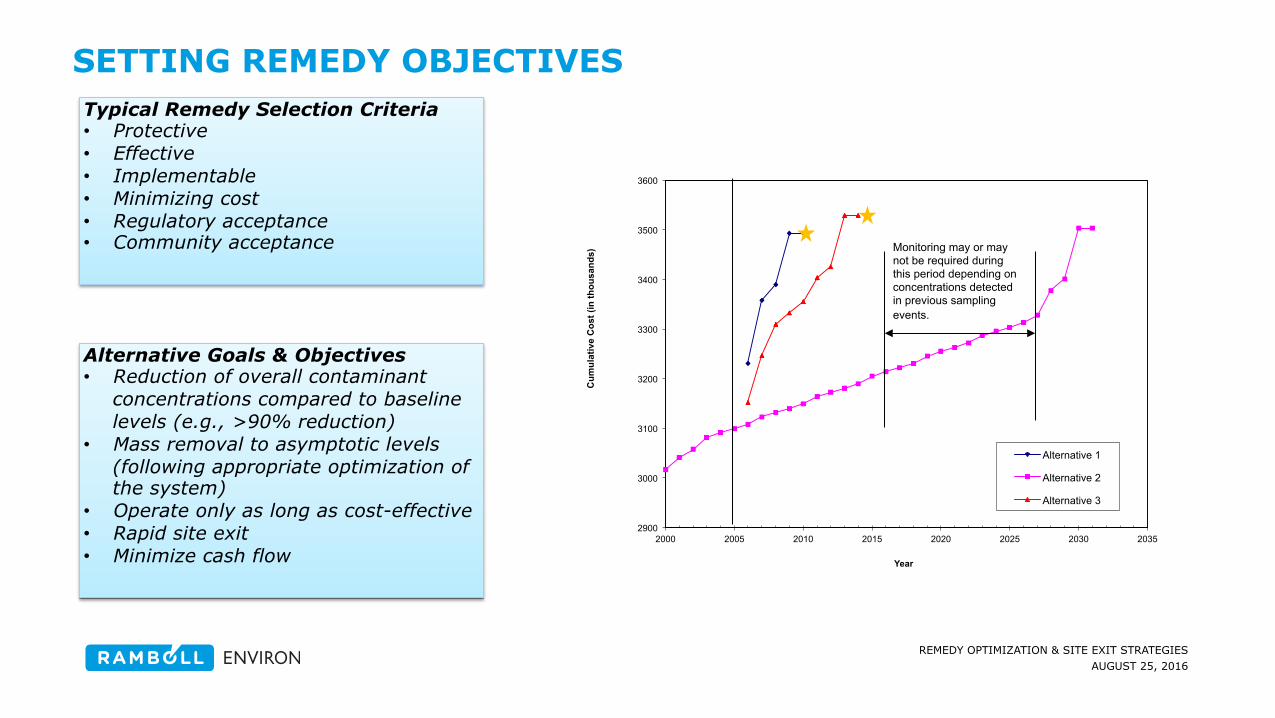
SETTING REMEDY OBJECTIVES
Alternative Goals & Objectives • Reduction of overall contaminant
concentrations compared to baseline levels (e.g., >90% reduction)
• Mass removal to asymptotic levels (following appropriate optimization of the system)
• Operate only as long as cost-effective • Rapid site exit • Minimize cash flow
2900
3000
3100
3200
3300
3400
3500
3600
2000 2005 2010 2015 2020 2025 2030 2035
Cum
ulat
ive
Cos
t (in
thou
sand
s)
Year
Alternative 1
Alternative 2
Alternative 3
Monitoring may or may not be required during this period depending on concentrations detected in previous sampling events.
Typical Remedy Selection Criteria • Protective • Effective • Implementable • Minimizing cost • Regulatory acceptance • Community acceptance
AUGUST 25, 2016 REMEDY OPTIMIZATION & SITE EXIT STRATEGIES
16
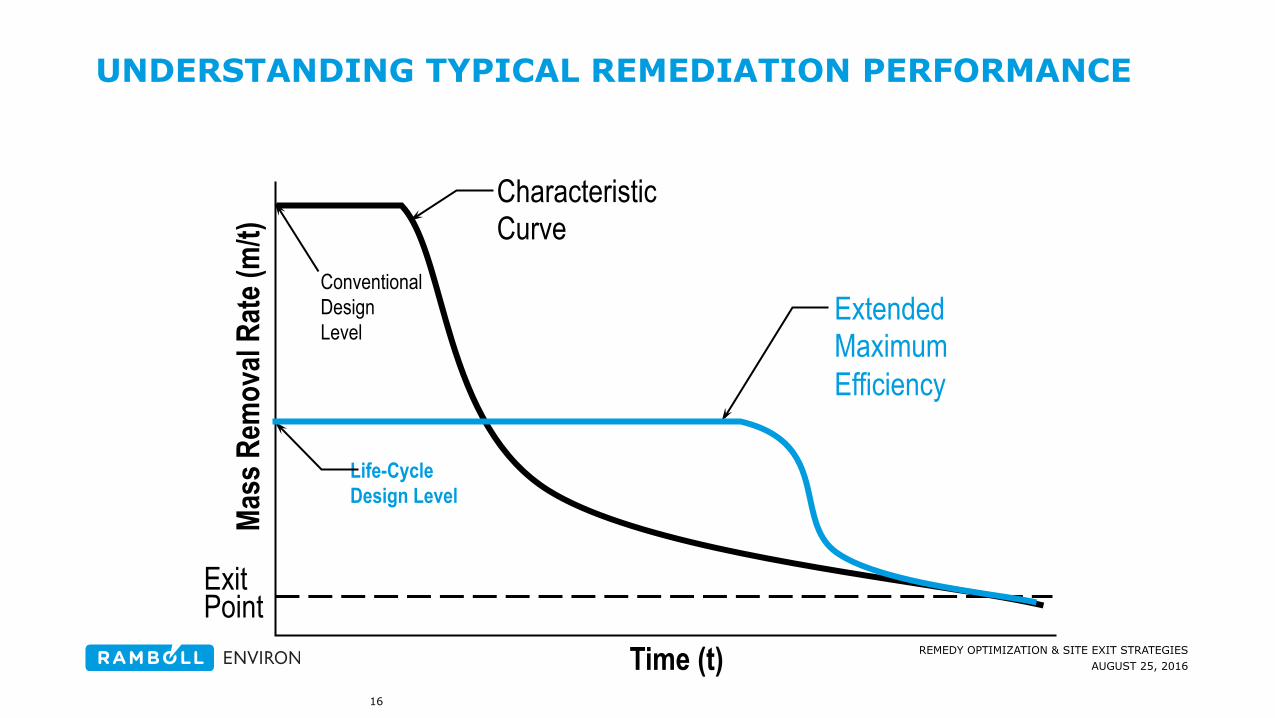
UNDERSTANDING TYPICAL REMEDIATION PERFORMANCE
Time (t)
Mass
Rem
oval
Rate
(m/t)
Exit Point
Characteristic Curve
Conventional Design Level
Life-Cycle Design Level
Extended Maximum Efficiency
AUGUST 25, 2016 REMEDY OPTIMIZATION & SITE EXIT STRATEGIES
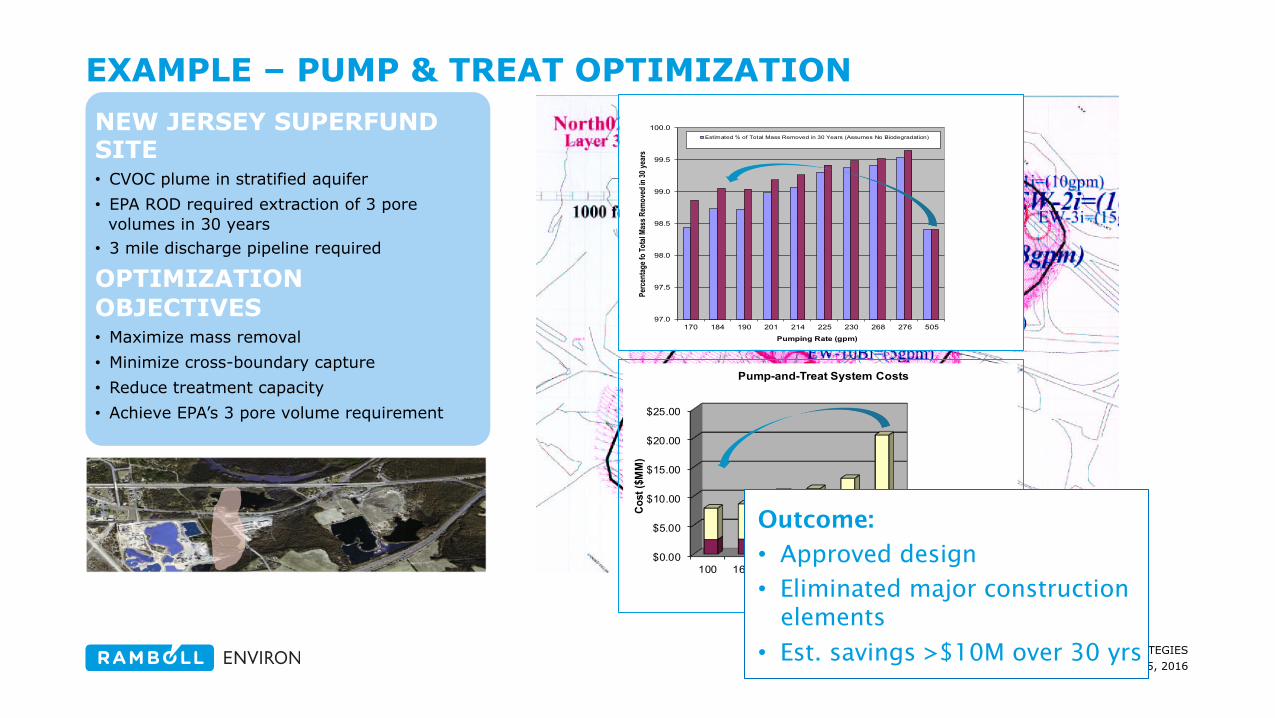
EXAMPLE – PUMP & TREAT OPTIMIZATION
$0.00
$5.00
$10.00
$15.00
$20.00
$25.00
100 166 270 325 400 600
Cost
($M
M)
Flow Rate (gpm)
Pump-and-Treat System Costs
O&M -- 30yrTotal Cap Costs
NEW JERSEY SUPERFUND SITE • CVOC plume in stratified aquifer • EPA ROD required extraction of 3 pore
volumes in 30 years • 3 mile discharge pipeline required
OPTIMIZATION OBJECTIVES • Maximize mass removal • Minimize cross-boundary capture • Reduce treatment capacity • Achieve EPA’s 3 pore volume requirement
Light blue fact box
97.0
97.5
98.0
98.5
99.0
99.5
100.0
170 184 190 201 214 225 230 268 276 505
Perc
entag
e fo T
otal
Mass
Rem
oved
in 30
year
s
Pumping Rate (gpm)
Estimated % of Total Mass Removed in 30 Years (Assumes No Biodegradation)
Outcome:
• Approved design
• Eliminated major construction elements
• Est. savings >$10M over 30 yrs
AUGUST 25, 2016 REMEDY OPTIMIZATION & SITE EXIT STRATEGIES
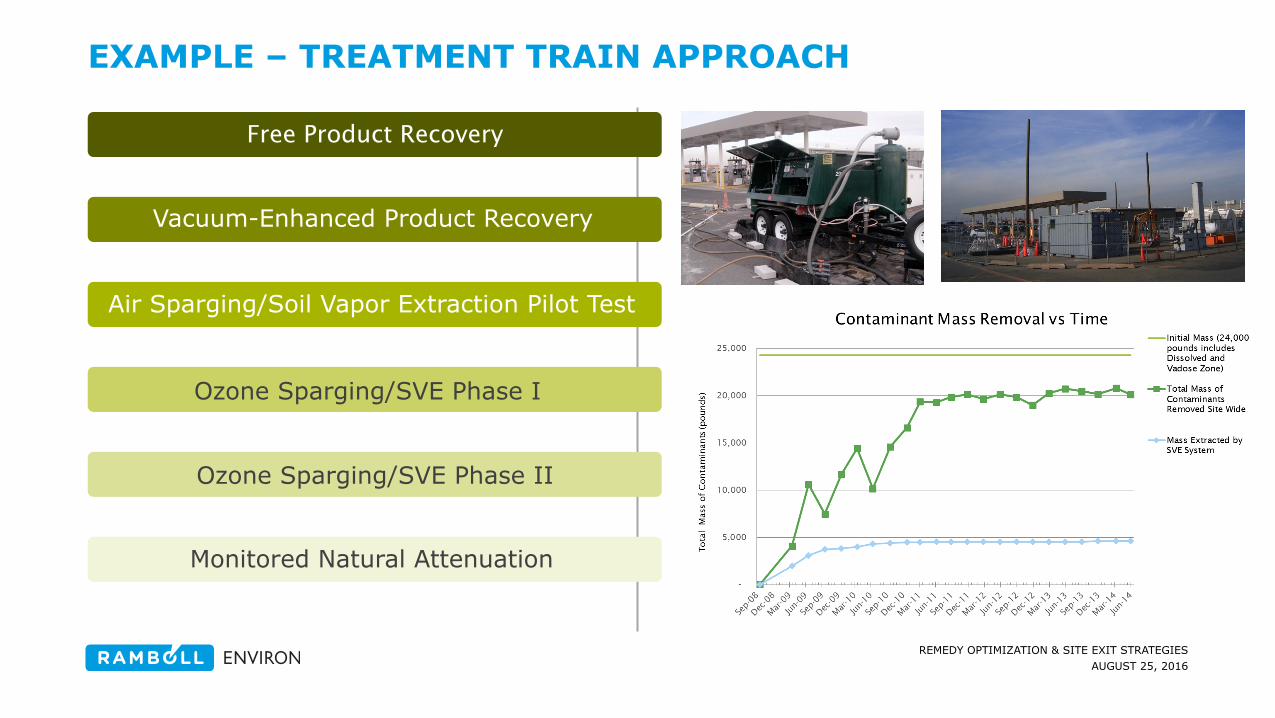
EXAMPLE – TREATMENT TRAIN APPROACH
Free Product Recovery
Vacuum-Enhanced Product Recovery
Air Sparging/Soil Vapor Extraction Pilot Test
Ozone Sparging/SVE Phase II
Ozone Sparging/SVE Phase I
Monitored Natural Attenuation
AUGUST 25, 2016 REMEDY OPTIMIZATION & SITE EXIT STRATEGIES
SUMMARY
Optimization of a remedy should be continuous throughout remedy evaluation, implementation and post-remedy monitoring
• Risk analysis throughout project will lead to more efficient investigation and remedy selection Ø The costs of remedies selected need to be warranted by the benefits derived -- Higher cost does
not always mean overall lower risk
• Projects can be expedited by making decisions in the field (as much as possible) using real-time data. Ø New technologies are available for improved access to environmental media for sample
collection, as well as analysis of in situ conditions (i.e. contaminant concentrations, lithologic conditions, etc.)
• Recognize current technological limitations in remedy selection decisions, while being open to innovative technologies where appropriate Ø Multiple remediation technologies “Treatment Trains” should be used concurrently or
sequentially (depending on site-specific conditions) to achieve remedial objectives
AUGUST 25, 2016 REMEDY OPTIMIZATION & SITE EXIT STRATEGIES
THANK YOU!
20
Mark Nielsen [email protected] 1-215-523-5602