Embed Size (px)
Citation preview

RELIABILITY OF BEAMS SUBJECTED TO TORSION DESIGNED USING STM
L BUDA-OŻOacuteG1 K SIEŃKOWSKA2 I SKRZYPCZAK3
This paper presents probabilistic assessment of load-bearing capacity and reliability for different STM of beams
loaded with a torsional and bending moment Three beams having different reinforcement arrangement obtained
on the basis of STM but the same overall geometry and loading pattern were analysed Stochastic modelling of
this beams were performed in order to assess probabilistic load-bearing capacity In the analysis the random
character of input data - concrete and steel was assumed During the randomization of variables the Monte Carlo
simulation with the reduce the number of simulations the Latin Hypercube Sampling (LHS) method was applied
The use of simulation methods allows for approximation of implicit response functions for complex in
description and non-linear reinforced concrete structures On the basis of the analyses and examples presented in
the paper it has been shown that the adoption of different ST models determines the different reliability of the
analysed systems and elements
Keywords strut ad tie model torsion reinforced concrete beam reliability
1 DSc PhD Eng Rzeszow University of Technology Faculty of Civil and Environmental Engineering and
Architecture ul Poznanska 2 35-084 Rzeszow Poland e-mail lidaprzedupl2 MSc Eng Rzeszow University of Technology Faculty of Civil and Environmental Engineering and Architecture
ul Poznanska 2 35-084 Rzeszow Poland e-mail ksienkowskaprzedupl3 DSc PhD Eng Rzeszow University of Technology Faculty of Civil and Environmental Engineering and
Architecture ul Poznanska 2 35-084 Rzeszow e-mail izasprzedupl
1 INTRODUCTION
The use of strut-and-tie model (STM) for the design of reinforced concrete structures has a very
long history and is practically inseparable from the history of reinforced concrete structures
The STM is a powerful tool for analysing the structures in D-regions where the Bernoulli
hypothesis does not apply The STM design concept assumes that the designed D-Region is
sufficiently ductile (to allow the force redistribute after concrete cracked) based on the lower bound
plasticity theorem The lower bound theory of limit analysis states that A stress field that satisfies
equilibrium and does not violate yield criteria at any point provides a lower-bound estimate of
capacity of elastic-perfectly plastic materials For this to be true crushing of concrete (struts and
nodes) does not occur prior to yielding of reinforcement (ties or stirrups) So lower bound
plasticity theorem only satisfies equilibrium and yield criteria where the third requirement in
solid mechanics framework strain compatibility does not have to be satisfied An STM idealizes
a complex force flow in the structures as a collection of compression members (struts) tension
members (ties) and the intersection of such members (nodes)
Designing special structures and predicting their behaviour will increase the possibility of using
them in confidence and it will also increase the performance of the structure as a whole in safety
and as well as economy Many different types of techniques and algorithms have been proposed by
dozens of researchers and the selection of the optimal model has been the subject of numerous
scientific works published in recent years The choice of the STM depending on the considered
issue can be made by using truss analogies the load path and knowledge of stress trajectories based
on numerical models and topological optimization The concepts of the STM are originally referred
to truss analogy proposed more than one century ago by Ritter [1] and Moumlrsch [2] In subsequent
years strut-and-tie modelling techniques have been extensively investigated in comprehensive
works by Thuumlrlimann [3] Schlaich et al [4] Adebar Kuchma and Collins [5] and many others
Despite such a large number of studies the standard recommendations [6 7 8] and the literature [9]
do not provide rules to determine unambiguously the shape and direction of elements in the ST
method and the choice of the STM is usually made without reliability assessment of the obtained
model Designing safe structures should be the overriding objective since the reliability of
a structure is closely related to the ways of dealing with uncertainty and making decisions in the
initial design phase
In this paper cantilever reinforced concrete beams with the same overall geometry and loading
pattern loaded but having different reinforcement arrangements obtained on the basis of STM were
556 L BUDA-OOacuteG K SIEKOWSKA I SKRZYPCZAK
analysed Stochastic modelling of this beams were performed in order to assess probabilistic load-
bearing capacity The Monte Carlo simulation was applied during the randomization of variables
In order to reduce the number of simulations to an acceptable level the Latin Hypercube Sampling
(LHS) method was selected
2 REINFORCED CONCRETE BEAMS DESIGNED WITH THE
STM
The subject of analysis was a cantilever reinforced concrete beam with real dimensions shown in
Fig 1
Fig 1 The view of the analysed cantilever beam
In this article for the beam loaded with a torsional and bending moment three Strut and Tie Models
(STMs) shown in Fig2 were compared
a) b)
RELIABILITY OF BEAMS SUBJECTED TO TORSION DESIGNED USING STM 557
c)
Fig 2 STMs of cantilever reinforced concrete beams a) model B1 b) model B2 c) model B3
For all the analysed beams (STM) the designed reinforcement was performed for the external load
of 60 kN On the basis of the value of forces in the tension bars of the truss longitudinal
reinforcement and stirrups were chosen and the conditions for anchoring the reinforcement in the
nodes were checked In the compression elements of the STMs the condition of not exceeding the
allowable stresses were checked Struts can be assigned as prismatic shaped The design strength for
notional concrete struts were reduced in cracked compression zones according the standard EC 2
[21] Depending on the type of nodes CCC CCT or CTT the design values for the compressive
stresses for S- elements and the anchorage length of the reinforcement for T-elements were
checked according to standard EC 2 [10]
The analysed cantilever beams with reinforcement obtained on the basis of the adopted STM are
shown in Fig 3
Fig 3 Geometry and reinforcement of tested beams
558 L BUDA-OOacuteG K SIEKOWSKA I SKRZYPCZAK
3 EXPERIMENTAL RESEARCH OF BEAMS
Assessment of the reliability of beams under torsion was preceded by experimental tests carried out
on elements on a natural scale The research was aimed at presenting the complex character of the
torsion phenomenon in reinforced concrete constructions and the obtained results were used to
validate numerical models Due to the statistical representativeness and reliability of the obtained
results each series contained four beams of the same parameters ie concrete class and
reinforcement The results obtained from the measurements were statistically evaluated The mean
value and standard deviation of the selected measurement results ie the maximum load the
deflection of point A and the angle of rotation of the side plane along line 2 are presented in
Table 1
Table 1 The results obtained from the measurements ie the maximum load the deflectionof point A and the angle of rotation
Measured values
Nobeams Mean value Standard deviation
P [kN]
B1 1210 47
B2 1091 70
B3 974 85
u [mm]
B1 134 07
B2 158 13
B3 118 19
φ [degm]
B1 094 006
B2 086 005
B3 092 008
Localization of the elements ie point A and line 2 are shown in Fig 4
RELIABILITY OF BEAMS SUBJECTED TO TORSION DESIGNED USING STM 559
Fig 4 Point A and linear elements defined on the beam surface
On the basis of the experiment results were noticed that the average breaking load depending on
the model ranged from 121 kN for model 1 to 97 kN for model 3 Beams with reinforcement
shaped on the basis of different ST models are also characterized by different deflection and angle
of rotation of the lateral plane There was also a different measure of scattering of the results
obtained in the case of breaking load and deflection a relation between the value of standard
deviation and the adopted ST model was visible No significant differences were observed in the
cracks image of the analysed beams the example cracks of beams B1 and B3 are shown in Fig 5
a) b)
Fig 5 The cracks image of the analysed beams a) beam B1 b) beam B3
560 L BUDA-OOacuteG K SIEKOWSKA I SKRZYPCZAK
4 NUMERICAL MODELS OF BEAMS
In the next step the numerical analysis of beams in ATENA 3D ndash Studio [11] were made For non-
linear analysis of reinforced concrete beams it used concrete models describing the dependence
in the complex state of stress with material parameters modified in accordance with the
results of strength tests of the concrete used The reinforcement was modelled discreetly using the
reinforcement model built into the ATENA program to ensure adhesion between concrete and
reinforcement In ATENA program was used the three dimensional combined fracturendashplastic
material model for concrete Tension is handled by a fracture model based on the classical
orthotropic smeared crack formulation and the crack band approach It employs the Rankine failure
criterion exponential softening and it can be used as a rotated or a fixed crack model The
plasticity model for concrete in compression is based on the MeneacutetreyndashWillam failure surface the
plastic volumetric strain as a hardeningsoftening parameter and a non-associated flow rule based
on a nonlinear plastic potential function [12 13] Initially the beams to be tested were supposed to
be fully fixed but during the tests due to inaccurate beam design and surface irregularities in the
adhesion of the planes small displacements were observed at the junction between the beams and
the steel members of the fixture This was taken into account by using a conventional material in the
numerical model the interface the behaviour of which under load was supposed to reflect the
minimal inaccuracies in the beam execution and the occurrence of displacements at the beam - steel
elements junction A detailed description of the numerical model of the analysed beams and its
validation based on experimental studies have been presented in the publication [14]
A comparison of selected results for the beam B3 obtained from numerical simulations and from
experimental data is shown in Figures 6 through 9 The location of selected points and lines for
which the detailed results are presented is marked in Fig 4 The curve load-deflection plot obtained
from the FEA for point A is shown in Fig 6 The curve agrees accurately with the experimental
data A comparison of displacements from numerical simulations and experimental tests of points
along the lines 1 2 and 3 is shown in Figures 7 8 and 9 These are displacements obtained for the
maximum measured forces Fig 7 presents vertical displacements from FEM simulations and an
experimental test for the horizontal line 1 Fig 8 shows horizontal displacement perpendicular to
the plane of the beam along the vertical line 2 caused by torsion Fig 9 presents horizontal
displacement in the direction of the beam axis along the vertical line 3 caused by the sliding out of
(slipping off) the beam from the fixing As shown in Figures 6 to 9 the displacement and load
obtained from numerical simulations are close to the results obtained from experimental research
RELIABILITY OF BEAMS SUBJECTED TO TORSION DESIGNED USING STM 561
Given the coefficients of variation of specific parameters numerical simulations and experimental
tests can be considered consistent
Fig 6 Load ndash vertical displacements for the point A FEM simulations and test
Fig 7 Comparison of vertical displacements for the line 1 FEM simulations and test
562 L BUDA-OOacuteG K SIEKOWSKA I SKRZYPCZAK
Fig 8 Comparison of horizontal displacements for the line 2 FEM simulations and test
Fig 9 Comparison of horizontal displacements for the line 3 FEM simulations and test
5 STOCHASTIC MODELLING OF BEAMS
The constructed and validated numerical models were used to estimate the reliability of the
analysed beams The objective was to study the impact of a type of STM and some input data on the
bearing capacity and displacements of the beams The reliability of beams were assessed using
probabilistic method - FORM and fully probabilistic method Monte Carlo with the use of variance
reduction techniques by Latin hypercube sampling (LHS) The basic feature of LHS is that the
probability distribution functions for all random variables are divided into NSim equivalent intervals
(NSim is a number of simulations) the values from the intervals are then used in the simulation
process (random selection middle of interval or mean value) This means that the range of the
probability distribution function of each random variable is divided into intervals of equal
RELIABILITY OF BEAMS SUBJECTED TO TORSION DESIGNED USING STM 563
probability The samples are chosen directly from the distribution function based on the inverse
transformation of the distribution function The representative parameters of variables are selected
randomly being based on random permutations of integers 1 2 j NSim Every interval of each
variable must be used only once during the simulation ndash Fig10 Being based on this precondition a
table of random permutations can be used conveniently each row of such a table belongs to a
specific simulation and the column corresponds to one of the input random variables [15]
Fig 10 Illustration of LHS - samples as the probabilistic means of intervals
The mean of each interval should be chosen as (41)
(41)
where fi is the probability density function of variable Xi and the integration limits are (42)
(42)
The estimated mean value is achieved accurately and the variance of the sample set is much closer
to the target one [16 17]
564 L BUDA-OOacuteG K SIEKOWSKA I SKRZYPCZAK
In the analysis the random character of input data - concrete and steel was assumed Taking into
account the calculation time and the accuracy of the results obtained the number of samples in the
LHS method was optimized The optimization criterion was the approximate stabilization of the
Cornell reliability index and the reliability index determined by the FORM method The
optimization was carried out for the B2 beam analysing samples with 10 30 50 and 70 elements
Taking into account the results obtained it was finally decided that for each of the beams 30
simulations were performed with modified statistic parameters The statistic parameters were
described using the recommendations specified in JCSS [18] ISO [19] The input values should be
properly described eg with a mean value a coefficient of variation or a type of distribution The
distribution and coefficient of variation - COV for the input variables of concrete and steel are
shown in Table 2
Table 2 Material properties in the stochastic modelling
Input Mean value Standard deviation Distribution
Ec [ ] 34867 5230 Lognormal
ft [ 44 079 Lognormal
fc [ 64 486 Lognormal
fy 545 2725 Lognormal
In the analysis the correlation between parameters of concrete was assumed The correlation matrix
used for the concrete in the stochastic modelling was built based on the publication [20] and shows
in Table 3
Table 3 Correlation matrix of concrete
Input Ec ft fc
Ec 1 09 -07
ft 09 1 -08
fc -07 -08 1
RELIABILITY OF BEAMS SUBJECTED TO TORSION DESIGNED USING STM 565
The stochastic modelling was carried out using SARA [21] software application For each of the
beams the results of the stochastic simulations were estimations of the mean value variance
coefficient of skewness kurtosis and empirical cumulative probability density function estimated by
empirical histogram structural response This basic statistical assessment is visualized through the
histograms The histograms with estimate ultimate load for the beams B1 B2 and B3 are shown in
Fig 11
a) Histogram of ultimate load for the beam B1- the 3-Parameter Weibull Distribution
b) Histogram of ultimate load for the beam B1- Studentrsquos t Distribution
Force
0104 0106 0108 011 0112 0114 0116 0118 012 0122 0124 0126 0128 013
MeanStd Std
20
40
60
80
100
Force
009 0092 0094 0096 0098 01 0102 0104 0106 0108 011 0112 0114
MeanStd Std
20
40
60
80
100
120
566 L BUDA-OOacuteG K SIEKOWSKA I SKRZYPCZAK
c) Histogram of ultimate load for the beam B1- the 2-Parameter Weibull Distribution
Fig 11 The histograms with estimate ultimate load for the beams B1 B2 and B3
The mean value of the ultimate load- P standard deviation COV coefficient of skewness kurtosis
the characteristic value of the ultimate load Pk the minimum value of load ndash Pmin and the maximum
value of load ndash Pmax are compared in Tables 4 The Pk is a 5 fractile of the statistical distribution
for P
Table 4 Mean value standard deviation COV skewness and kurtosis upper and lower value of load bearing capacity of beams
Element P[kN] σP [kN] ν[] skewness kurtosis Pk [kN] Pmin[kN] Pmax[kN]
B1 1165 433 37 -00522 -0846 1093 1079 1240
B2 1030 385 37 00503 0095 966 935 1105
B3 989 362 37 -01639 -0543 922 919 1063
The reliability analyses were carried out after statistical analyses The limit state function -Z
(margin of safety) was formulated (43)
(43) Z = R ndash E
This function is a difference between resistance ndash R and load effect - E
In presented analysed simulation methods were used for obtained implicit limit state functions - R
In simulation methods many random samples for each of the basic random variables in the problem
are generated in a way that they can represent their true probability distributions and stochastic
characteristics Using each realisation of the random variables in the problem and analysing the
Force
0084 0086 0088 009 0092 0094 0096 0098 01 0102 0104 0106 0108
MeanStd Std
20
40
60
80
100
120
140
RELIABILITY OF BEAMS SUBJECTED TO TORSION DESIGNED USING STM 567
problem deterministically will lead to a realisation of the problem itself Each of these deterministic
analyses is referred to as a simulation trial
According to the original assumptions the design load applied to the considered beams was 60 kN
For the load effect -E probabilistic description by means of normal distribution with COV 015 was
used In presented analyses the average value of load amounted to 45 kN
In the next step reliability analysis methods employing the Cornellacutes reliability index ndash βc and the
FORM method-βFORM were applied The probability of failure the Cornells reliability index the
probability of failure obtained from the FORM method and the reliability index of the tested beams
are presented in Table 5
Table 5 Probability of failure and reliability index estimated by Cornella method and FORM method
Element βc βFORM
B1 838 25610-17 961 37510-22
B2 690 25410-12 737 87710-14
B3 732 12210-13 663 16710-11
Vertical displacements of the point A indicated in Fig and the angle of rotation of the side plane of
the beam at line 2 (analogously to the experimental tests) were also statistically evaluated
The results of the statistical assessment of horizontal displacements and the angle of rotation of the
side plane of the beam are presented in the Tables 6 and 7
Table 6 Estimators of the deflection distribution function at point A
Element u [mm] σu [mm] ν[] βc
B1 142 114 80 124
B2 126 102 81 123
B3 110 070 63 158
Table 7 Estimators of the side plane rotation function
Element φ [degm] [degm] βC
B1 142 014 99
B2 139 021 68
B3 102 014 73
568 L BUDA-OOacuteG K SIEKOWSKA I SKRZYPCZAK
The presented results of the reliability analysis confirmed a safe estimation of the load capacity in
the STM The most reliable taking into account the bearing capacity deflection and the angle of
rotation of the side plane is characterized by the B1 beam Although the measured deflection of
point A and the angle of rotation of the lateral plane are in this case the highest of the three analysed
beams the result obtained is characterized by the least coefficient of variation
6 CONCLUSION
The paper presents the probabilistic assessment of load-bearing capacity and reliability for different
STM of beams loaded with a torsional moment bending moment as well as a shear force Summing
up the results of the analysis the following detailed conclusions can be formulated
The highest values of the reliability index taking into account the bearing capacity deflection
and angle of rotation of the side plane were obtained from the beam B1
Structures designed on the basis of different ST models are characterized by different load
bearing capacity and different mass of reinforcement The mean value of load bearing capacity
ranged from 121 kN for the beam B1 to 974 kN for the beam B3
The result of the stochastic simulations shows that the coefficients of variation of load bearing
capacity are different for the tested beams The obtained coefficients of variation means from
4 for the beam B1 to 9 for the beam B3
Based on the analysis it can be concluded that the STM with the compressed concrete struts
inclined at an angle of 45deg to the axis of the bar is the most advantageous due to the bearing
capacity and reliability Therefore this STM should be recommended for element subjected to
torsion and bending
To sum up it should be stated that the knowledge of the random nature of variable states including
the strength of materials and loads used on the designed structure and the estimated probability of
failure allows for a better understanding of the behaviour of the tested structural system than the
deterministic analysis using even the most complex finite element model The application of
probabilistic methods allows for the selection of the most advantageous one with regard to the
reliability of the ST model and the presented examples and methods of reliability estimation may
serve as an indication in the process of ST model optimization
RELIABILITY OF BEAMS SUBJECTED TO TORSION DESIGNED USING STM 569
REFERENCES
1 W RitterldquoThe Hennebique Design Methodrdquo (Zuumlrich) (in German) Vol 33 No 7 pp 59-61 18992 E MoumlrcshReinforced Concrete Construction-Theory and Application 5th Ed Wittwer Stutgart V1 Part
1 Part 2 1920 19223 B Thϋrlimann P Marti J Pralong P Ritz and B Zimmerli Application of the theory of plasticity to
reinforced concrete Institute of Structrural Engineering ETH Zϋrich 19834 J Schlaich K Schaumlfer M Jennewein ldquoToward a consistent design of structural concreterdquo PCI J 32(3) pp
74ndash150 19875 P Adebar D Kuchma and MP Collins ldquoStrut-and-Tie Models for the Design of Pile Caps An Experimental
StudyrdquoACI Structural Journal Vol 87 No 1 pp 81-9219906 EN 1992-1-1 Eurocode 2 Design of concrete structures - Part 1-1 General rules and rules for buildings 20047 Model Code Final draft fib Bulletin no 66 vol 2 20128 FIB Bulletinrdquo Practical Design of Structural Concrete Design examples for strut and tie modelsrdquo no 6 20119 H Thorerdquo Do EN 1992‐1‐1 and the European Concrete Platform comply with tests Commentary on the rules
for strut‐and‐tie models using corbels as an examplerdquo Structural ConcreteVolume 16 Issue 3pp418-427 httpsdoiorg101002suco201400066 2015
10 ldquoEurocode 2 Design of concrete structures ndash Part 1-1 General rules and rules for buildingsrdquo European Committee for Standardization Brussels 2004
11 ATENA Program Documentation Praga 201412 P Meneacutetrey KJ Willam Triaxial failure criterion for concrete and its generalization ACI Structural Journal
Vol 92 No 3 pp 311 ndash 318 199513 J Červenka VK Papanikolaou VK ldquoThree dimensional combined fracture-plastic material model for
concrete International Journal of Plasticityrdquo Vol 24 pp 2192-2220 200814 B Turoń D Ziaja L Buda-Ożoacuteg B Miller DIC in Validation of Boundary Conditions of Numerical Model
of Reinforced Concrete Beams Under Torsion Archives of Civil Engineering 201815 Ronald L I ldquoLatin Hypercube Samplingrdquo John Wiley amp Sons Ltd and republished in Wiley Statistics
Reference Online httpsdoiorg1010029781118445112 201416 M Keramat R Kielbasa ldquoEfficient average quality index of estimation of integrated circuits by modified
Latin hypercube sampling Monte Carlordquo Journal of Analog Integrated Circuits and Signal Processing vol19 issue 1 April pp 87-98 1997
17 D Huntington C Lyrintzis ldquoImprovements to and limitations of Latin hypercube sampling Probabilistic Engineering Mechanics vol 13(4) pp 245ndash253rdquo 1997
18 Probabilistic Model Code JCSS working material httpwwwjcssethzch (online) 201219 ISO 2394General principles on reliability for structures 201020 R Iman W Conover ldquoA distribution-free approach to inducing rank correlation among input variables
Communication in Statisticsrdquo ndash Simulation and Computation Vol 11n 3 pp 311 ndash 334 198221 SARA Program Documentation Praga 2015
LIST OF FIGURES AND TABLES
Fig 1 The view of the analysed cantilever beam
Rys 1 Widok analizowanej belki wspornikowej
Fig 2 STMs of cantilever reinforced concrete beams a) model B1 b) model B2 c) model B3
Rys 2 Modele ST wspornikowej belki żelbetowej a) model B1 b) model B2 c) model B3
Fig 3 Geometry and reinforcement of tested beams
Rys 3 Wymiary i zbrojenie testowanych belek
Fig 4 Point A and linear elements defined on the beam surface
Rys 4 Lokalizacja punktu A i linii na powierzchni belki
Fig 5 The cracks image of the analysed beams a) beam B1 b) beam B3
Rys 5 Obraz pęknięć analizowanych belek a) belka B1 b) belka B3
570 L BUDA-OOacuteG K SIEKOWSKA I SKRZYPCZAK
Fig 6 Load ndash vertical displacements for the point A FEM simulations and test
Rys 6 Obciążenie - przemieszczenia pionowe punktu A symulacje MES i test
Fig 7 Comparison of vertical displacements for the line 1 FEM simulations and test
Rys 7 Poroacutewnanie przemieszczeń pionowych dla linii 1 symulacje MES i test
Fig 8 Comparison of horizontal displacements for the line 2 FEM simulations and test
Rys 8 Poroacutewnanie przemieszczeń poziomych dla linii 2 symulacje MES i test
Fig 9 Comparison of horizontal displacements for the line 3 FEM simulations and test
Rys 9 Poroacutewnanie przemieszczeń poziomych dla linii 3 symulacje MES i test
Fig 10 Illustration of LHS - samples as the probabilistic means of intervals
Rys 10 Ilustracja metody proacutebkowania w metodzie LHS
Fig 11 The histograms with estimate ultimate load for the beams B1 B2 and B3
Rys 11 Histogramy wraz z przybliżoną postacią funkcji gęstości prawdopodobieństwa nośności
Tab 1 The results obtained from the measurements ie the maximum load the deflection of point A and the
angle of rotation
Tab 1 Wyniki pomiaroacutew tj maksymalne obciążenie odkształcenie i kąt obrotu pkt A
Tab 2 Material properties in the stochastic modelling
Tab 2 Właściwości materiałowe i ich opis w modelu stochastycznym
Tab 3 Correlation matrix of concrete
Tab 3 Macierz korelacji dla betonu
Tab 4 Mean value standard deviation COV skewness and kurtosis upper and lower value of load bearing
capacity of beams
Tab 4 Wartość średnia odchylenie standardowe wspoacutełczynnik zmienności wspoacutełczynnik skośności
kurtoza minimalna i maksymalna nośność belek
Tab 5 Probability of failure and reliability index estimated by Cornella method and FORM method
Tab 5 Prawdopodobieństwo awarii i wskaźnik niezawodności Cornela oraz metodą FORM
Tab 6 Estimators of the deflection distribution function at point A
Tab 6 Estymatory funkcji rozkładu ugięć w punkcie A
Tab 7 Estimators of the side plane rotation function
Tab 7 Estymatory funkcji obrotu płaszczyzny bocznej
RELIABILITY OF BEAMS SUBJECTED TO TORSION DESIGNED USING STM 571
NIEZAWODNOŚĆ BELEK SKRĘCANYCH PROJEKTOWANYCH METODĄ STRUT AND TIE
Słowa kluczowe metoda ST skręcanie belki żelbetowe niezawodność
STRESZCZENIEW pracy analizowano niezawodność wspornikowych belek żelbetowych Obiektem badań były belki skręcane
i zginane w ktoacuterych zbrojenie zaprojektowano metodą ST przedstawione na rys 1
a) b)
Fig 1 Analizowana belka wspornikowa a) wymiary b) widok belki na stanowisku badawczym
Zbrojenie analizowanych belek uzyskano na podstawie trzech modeli Strut i Tie Model 1 stanowiła kratownica
przestrzenna w ktoacuterej ściskane krzyżulce betonowe wydzielone rysami ukośnymi są na każdym boku pionowym
i poziomym nachylone do osi pręta pod kątem 45o Pręty pionowe kratownicy to rozciągane zbrojenie w postaci
strzemion Pas goacuterny i pas dolny kratownicy to odpowiednio zbrojenie rozciągane i ściskane pasy betonowe W modelu
2 kratownicy przestrzennej ściskane krzyżulce betonowe przyjęto nachylone do osi pręta pod kątem 37o natomiast
w modelu 3 nachylone pod kątem 27o
Ocenę niezawodności belek skręcanych poprzedziły badania doświadczalne przeprowadzone na elementach w skali
naturalnej Badania miały na celu obserwację złożonego charakteru zjawiska skręcania w konstrukcjach żelbetowych
a uzyskane wyniki posłużyły do walidacji modeli numerycznych Z uwagi na statystyczną reprezentatywność
i wiarygodność otrzymanych wynikoacutew badań każda seria zawierała po 4 belki o takich samych parametrach tj klasie
betonu i zbrojeniu Otrzymane z pomiaroacutew wyniki podano ocenie statystycznej Na podstawie przeprowadzonych badań
doświadczalnych zauważono że średnie obciążenie niszczące w zależności od modelu wynosiło od 121 kN dla modelu
1 do 97 kN dla modelu 3 Belki o zbrojeniu ukształtowanym na podstawie roacuteżnych modeli ST charakteryzuje też inne
ugięcie oraz kąt obrotu płaszczyzny bocznej W następnym kroku przeprowadzono analizę numeryczną belek
w ATENA 3D - Studio Do nieliniowej analizy belek żelbetowych wykorzystano modele betonu opisujące zależność
w złożonym stanie naprężenia o parametrach materiałowych zmodyfikowany zgodnie z wynikami badań
wytrzymałościowych zastosowanego betonu Zbrojenie zamodelowano dyskretnie wykorzystując wbudowany
w programie ATENA model zbrojenia zapewniający przyczepność między betonem i zbrojeniem
Ocenę niezawodności belek przeprowadzono metodami probabilistycznymi ndash FORM oraz w pełni probabilistyczną
Monte Carlo z wykorzystaniem technik redukcji wariancji hipersześcianem łacińskim Metody FORM wykorzystują
572 L BUDA-OOacuteG K SIEKOWSKA I SKRZYPCZAK
pełny opis probabilistyczny zmiennych losowych czyli średnią odchylenie standardowe i informacje o funkcji gęstości
W modelu stochastycznym przyjęto że wartości wejściowe opisane są średnią odchyleniem standardowym i rodzajem
rozkładu Modelowanie stochastyczne przeprowadzono w programie SARA Oszacowano nośność średnią
maksymalną i minimalną nośność uzyskaną z symulacji odchylenie standardowe wspoacutełczynnik zmienności
wspoacutełczynnik skośności oraz kurtozę dla wszystkich analizowanych belek Na podstawie histogramoacutew odpowiedzi
i przybliżonej postaci funkcji gęstość prawdopodobieństwa nośności uzyskanych z symulacji stochastycznej
wyznaczono wskaźnik niezawodności Cornella - βc oraz wskaźnik niezawodności metodą FORM- βFORM W tabeli 1
zestawiono oszacowany wskaźnik niezawodności Cornella i odpowiadające mu prawdopodobieństwo zniszczenia oraz
otrzymywane metodą FORM i SORM prawdopodobieństwo awarii i wskaźnik niezawodności
Tabela 1 Prawdopodobieństwo awarii i wskaźnik niezawodności metodami FORM i Cornella
Element βc βFORM
B1 838 25610-17 961 37510-22
B2 690 25410-12 737 87710-14
B3 732 12210-13 663 16710-11
W wyniku przeprowadzone oceny statystycznej zauważono wpływ przyjętego modelu ST na niezawodność belek
Przedstawione wyniki analizy niezawodności potwierdziły bezpieczne oszacowanie nośności metodą ST dla wszystkich
badanych belek Zauważono że w przypadku belek B2 i B3 wskaźnik niezawodności jest niższy niż w przypadku
belki B1
Podsumowując można stwierdzić że zastosowanie metod probabilistycznych pozwala na wybranie najkorzystniejszej
pod względem niezawodności modelu ST a przedstawione przykłady i metody szacowania niezawodności mogą służyć
jako wskazanie w procesie optymalizacji modelu ST stosowanych w konstrukcjach żelbetowych
Received 23032020 Revised 28052020
RELIABILITY OF BEAMS SUBJECTED TO TORSION DESIGNED USING STM 573
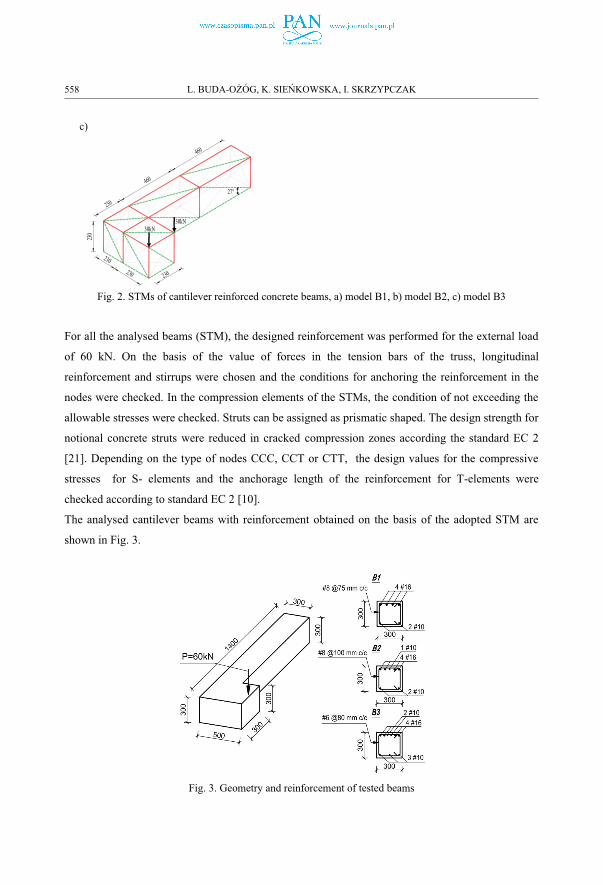

Fig 4 Point A and linear elements defined on the beam surface
On the basis of the experiment results were noticed that the average breaking load depending on
the model ranged from 121 kN for model 1 to 97 kN for model 3 Beams with reinforcement
shaped on the basis of different ST models are also characterized by different deflection and angle
of rotation of the lateral plane There was also a different measure of scattering of the results
obtained in the case of breaking load and deflection a relation between the value of standard
deviation and the adopted ST model was visible No significant differences were observed in the
cracks image of the analysed beams the example cracks of beams B1 and B3 are shown in Fig 5
a) b)
Fig 5 The cracks image of the analysed beams a) beam B1 b) beam B3
560 L BUDA-OOacuteG K SIEKOWSKA I SKRZYPCZAK
4 NUMERICAL MODELS OF BEAMS
In the next step the numerical analysis of beams in ATENA 3D ndash Studio [11] were made For non-
linear analysis of reinforced concrete beams it used concrete models describing the dependence
in the complex state of stress with material parameters modified in accordance with the
results of strength tests of the concrete used The reinforcement was modelled discreetly using the
reinforcement model built into the ATENA program to ensure adhesion between concrete and
reinforcement In ATENA program was used the three dimensional combined fracturendashplastic
material model for concrete Tension is handled by a fracture model based on the classical
orthotropic smeared crack formulation and the crack band approach It employs the Rankine failure
criterion exponential softening and it can be used as a rotated or a fixed crack model The
plasticity model for concrete in compression is based on the MeneacutetreyndashWillam failure surface the
plastic volumetric strain as a hardeningsoftening parameter and a non-associated flow rule based
on a nonlinear plastic potential function [12 13] Initially the beams to be tested were supposed to
be fully fixed but during the tests due to inaccurate beam design and surface irregularities in the
adhesion of the planes small displacements were observed at the junction between the beams and
the steel members of the fixture This was taken into account by using a conventional material in the
numerical model the interface the behaviour of which under load was supposed to reflect the
minimal inaccuracies in the beam execution and the occurrence of displacements at the beam - steel
elements junction A detailed description of the numerical model of the analysed beams and its
validation based on experimental studies have been presented in the publication [14]
A comparison of selected results for the beam B3 obtained from numerical simulations and from
experimental data is shown in Figures 6 through 9 The location of selected points and lines for
which the detailed results are presented is marked in Fig 4 The curve load-deflection plot obtained
from the FEA for point A is shown in Fig 6 The curve agrees accurately with the experimental
data A comparison of displacements from numerical simulations and experimental tests of points
along the lines 1 2 and 3 is shown in Figures 7 8 and 9 These are displacements obtained for the
maximum measured forces Fig 7 presents vertical displacements from FEM simulations and an
experimental test for the horizontal line 1 Fig 8 shows horizontal displacement perpendicular to
the plane of the beam along the vertical line 2 caused by torsion Fig 9 presents horizontal
displacement in the direction of the beam axis along the vertical line 3 caused by the sliding out of
(slipping off) the beam from the fixing As shown in Figures 6 to 9 the displacement and load
obtained from numerical simulations are close to the results obtained from experimental research
RELIABILITY OF BEAMS SUBJECTED TO TORSION DESIGNED USING STM 561
Given the coefficients of variation of specific parameters numerical simulations and experimental
tests can be considered consistent
Fig 6 Load ndash vertical displacements for the point A FEM simulations and test
Fig 7 Comparison of vertical displacements for the line 1 FEM simulations and test
562 L BUDA-OOacuteG K SIEKOWSKA I SKRZYPCZAK
Fig 8 Comparison of horizontal displacements for the line 2 FEM simulations and test
Fig 9 Comparison of horizontal displacements for the line 3 FEM simulations and test
5 STOCHASTIC MODELLING OF BEAMS
The constructed and validated numerical models were used to estimate the reliability of the
analysed beams The objective was to study the impact of a type of STM and some input data on the
bearing capacity and displacements of the beams The reliability of beams were assessed using
probabilistic method - FORM and fully probabilistic method Monte Carlo with the use of variance
reduction techniques by Latin hypercube sampling (LHS) The basic feature of LHS is that the
probability distribution functions for all random variables are divided into NSim equivalent intervals
(NSim is a number of simulations) the values from the intervals are then used in the simulation
process (random selection middle of interval or mean value) This means that the range of the
probability distribution function of each random variable is divided into intervals of equal
RELIABILITY OF BEAMS SUBJECTED TO TORSION DESIGNED USING STM 563
probability The samples are chosen directly from the distribution function based on the inverse
transformation of the distribution function The representative parameters of variables are selected
randomly being based on random permutations of integers 1 2 j NSim Every interval of each
variable must be used only once during the simulation ndash Fig10 Being based on this precondition a
table of random permutations can be used conveniently each row of such a table belongs to a
specific simulation and the column corresponds to one of the input random variables [15]
Fig 10 Illustration of LHS - samples as the probabilistic means of intervals
The mean of each interval should be chosen as (41)
(41)
where fi is the probability density function of variable Xi and the integration limits are (42)
(42)
The estimated mean value is achieved accurately and the variance of the sample set is much closer
to the target one [16 17]
564 L BUDA-OOacuteG K SIEKOWSKA I SKRZYPCZAK
In the analysis the random character of input data - concrete and steel was assumed Taking into
account the calculation time and the accuracy of the results obtained the number of samples in the
LHS method was optimized The optimization criterion was the approximate stabilization of the
Cornell reliability index and the reliability index determined by the FORM method The
optimization was carried out for the B2 beam analysing samples with 10 30 50 and 70 elements
Taking into account the results obtained it was finally decided that for each of the beams 30
simulations were performed with modified statistic parameters The statistic parameters were
described using the recommendations specified in JCSS [18] ISO [19] The input values should be
properly described eg with a mean value a coefficient of variation or a type of distribution The
distribution and coefficient of variation - COV for the input variables of concrete and steel are
shown in Table 2
Table 2 Material properties in the stochastic modelling
Input Mean value Standard deviation Distribution
Ec [ ] 34867 5230 Lognormal
ft [ 44 079 Lognormal
fc [ 64 486 Lognormal
fy 545 2725 Lognormal
In the analysis the correlation between parameters of concrete was assumed The correlation matrix
used for the concrete in the stochastic modelling was built based on the publication [20] and shows
in Table 3
Table 3 Correlation matrix of concrete
Input Ec ft fc
Ec 1 09 -07
ft 09 1 -08
fc -07 -08 1
RELIABILITY OF BEAMS SUBJECTED TO TORSION DESIGNED USING STM 565
The stochastic modelling was carried out using SARA [21] software application For each of the
beams the results of the stochastic simulations were estimations of the mean value variance
coefficient of skewness kurtosis and empirical cumulative probability density function estimated by
empirical histogram structural response This basic statistical assessment is visualized through the
histograms The histograms with estimate ultimate load for the beams B1 B2 and B3 are shown in
Fig 11
a) Histogram of ultimate load for the beam B1- the 3-Parameter Weibull Distribution
b) Histogram of ultimate load for the beam B1- Studentrsquos t Distribution
Force
0104 0106 0108 011 0112 0114 0116 0118 012 0122 0124 0126 0128 013
MeanStd Std
20
40
60
80
100
Force
009 0092 0094 0096 0098 01 0102 0104 0106 0108 011 0112 0114
MeanStd Std
20
40
60
80
100
120
566 L BUDA-OOacuteG K SIEKOWSKA I SKRZYPCZAK
c) Histogram of ultimate load for the beam B1- the 2-Parameter Weibull Distribution
Fig 11 The histograms with estimate ultimate load for the beams B1 B2 and B3
The mean value of the ultimate load- P standard deviation COV coefficient of skewness kurtosis
the characteristic value of the ultimate load Pk the minimum value of load ndash Pmin and the maximum
value of load ndash Pmax are compared in Tables 4 The Pk is a 5 fractile of the statistical distribution
for P
Table 4 Mean value standard deviation COV skewness and kurtosis upper and lower value of load bearing capacity of beams
Element P[kN] σP [kN] ν[] skewness kurtosis Pk [kN] Pmin[kN] Pmax[kN]
B1 1165 433 37 -00522 -0846 1093 1079 1240
B2 1030 385 37 00503 0095 966 935 1105
B3 989 362 37 -01639 -0543 922 919 1063
The reliability analyses were carried out after statistical analyses The limit state function -Z
(margin of safety) was formulated (43)
(43) Z = R ndash E
This function is a difference between resistance ndash R and load effect - E
In presented analysed simulation methods were used for obtained implicit limit state functions - R
In simulation methods many random samples for each of the basic random variables in the problem
are generated in a way that they can represent their true probability distributions and stochastic
characteristics Using each realisation of the random variables in the problem and analysing the
Force
0084 0086 0088 009 0092 0094 0096 0098 01 0102 0104 0106 0108
MeanStd Std
20
40
60
80
100
120
140
RELIABILITY OF BEAMS SUBJECTED TO TORSION DESIGNED USING STM 567
problem deterministically will lead to a realisation of the problem itself Each of these deterministic
analyses is referred to as a simulation trial
According to the original assumptions the design load applied to the considered beams was 60 kN
For the load effect -E probabilistic description by means of normal distribution with COV 015 was
used In presented analyses the average value of load amounted to 45 kN
In the next step reliability analysis methods employing the Cornellacutes reliability index ndash βc and the
FORM method-βFORM were applied The probability of failure the Cornells reliability index the
probability of failure obtained from the FORM method and the reliability index of the tested beams
are presented in Table 5
Table 5 Probability of failure and reliability index estimated by Cornella method and FORM method
Element βc βFORM
B1 838 25610-17 961 37510-22
B2 690 25410-12 737 87710-14
B3 732 12210-13 663 16710-11
Vertical displacements of the point A indicated in Fig and the angle of rotation of the side plane of
the beam at line 2 (analogously to the experimental tests) were also statistically evaluated
The results of the statistical assessment of horizontal displacements and the angle of rotation of the
side plane of the beam are presented in the Tables 6 and 7
Table 6 Estimators of the deflection distribution function at point A
Element u [mm] σu [mm] ν[] βc
B1 142 114 80 124
B2 126 102 81 123
B3 110 070 63 158
Table 7 Estimators of the side plane rotation function
Element φ [degm] [degm] βC
B1 142 014 99
B2 139 021 68
B3 102 014 73
568 L BUDA-OOacuteG K SIEKOWSKA I SKRZYPCZAK
The presented results of the reliability analysis confirmed a safe estimation of the load capacity in
the STM The most reliable taking into account the bearing capacity deflection and the angle of
rotation of the side plane is characterized by the B1 beam Although the measured deflection of
point A and the angle of rotation of the lateral plane are in this case the highest of the three analysed
beams the result obtained is characterized by the least coefficient of variation
6 CONCLUSION
The paper presents the probabilistic assessment of load-bearing capacity and reliability for different
STM of beams loaded with a torsional moment bending moment as well as a shear force Summing
up the results of the analysis the following detailed conclusions can be formulated
The highest values of the reliability index taking into account the bearing capacity deflection
and angle of rotation of the side plane were obtained from the beam B1
Structures designed on the basis of different ST models are characterized by different load
bearing capacity and different mass of reinforcement The mean value of load bearing capacity
ranged from 121 kN for the beam B1 to 974 kN for the beam B3
The result of the stochastic simulations shows that the coefficients of variation of load bearing
capacity are different for the tested beams The obtained coefficients of variation means from
4 for the beam B1 to 9 for the beam B3
Based on the analysis it can be concluded that the STM with the compressed concrete struts
inclined at an angle of 45deg to the axis of the bar is the most advantageous due to the bearing
capacity and reliability Therefore this STM should be recommended for element subjected to
torsion and bending
To sum up it should be stated that the knowledge of the random nature of variable states including
the strength of materials and loads used on the designed structure and the estimated probability of
failure allows for a better understanding of the behaviour of the tested structural system than the
deterministic analysis using even the most complex finite element model The application of
probabilistic methods allows for the selection of the most advantageous one with regard to the
reliability of the ST model and the presented examples and methods of reliability estimation may
serve as an indication in the process of ST model optimization
RELIABILITY OF BEAMS SUBJECTED TO TORSION DESIGNED USING STM 569
REFERENCES
1 W RitterldquoThe Hennebique Design Methodrdquo (Zuumlrich) (in German) Vol 33 No 7 pp 59-61 18992 E MoumlrcshReinforced Concrete Construction-Theory and Application 5th Ed Wittwer Stutgart V1 Part
1 Part 2 1920 19223 B Thϋrlimann P Marti J Pralong P Ritz and B Zimmerli Application of the theory of plasticity to
reinforced concrete Institute of Structrural Engineering ETH Zϋrich 19834 J Schlaich K Schaumlfer M Jennewein ldquoToward a consistent design of structural concreterdquo PCI J 32(3) pp
74ndash150 19875 P Adebar D Kuchma and MP Collins ldquoStrut-and-Tie Models for the Design of Pile Caps An Experimental
StudyrdquoACI Structural Journal Vol 87 No 1 pp 81-9219906 EN 1992-1-1 Eurocode 2 Design of concrete structures - Part 1-1 General rules and rules for buildings 20047 Model Code Final draft fib Bulletin no 66 vol 2 20128 FIB Bulletinrdquo Practical Design of Structural Concrete Design examples for strut and tie modelsrdquo no 6 20119 H Thorerdquo Do EN 1992‐1‐1 and the European Concrete Platform comply with tests Commentary on the rules
for strut‐and‐tie models using corbels as an examplerdquo Structural ConcreteVolume 16 Issue 3pp418-427 httpsdoiorg101002suco201400066 2015
10 ldquoEurocode 2 Design of concrete structures ndash Part 1-1 General rules and rules for buildingsrdquo European Committee for Standardization Brussels 2004
11 ATENA Program Documentation Praga 201412 P Meneacutetrey KJ Willam Triaxial failure criterion for concrete and its generalization ACI Structural Journal
Vol 92 No 3 pp 311 ndash 318 199513 J Červenka VK Papanikolaou VK ldquoThree dimensional combined fracture-plastic material model for
concrete International Journal of Plasticityrdquo Vol 24 pp 2192-2220 200814 B Turoń D Ziaja L Buda-Ożoacuteg B Miller DIC in Validation of Boundary Conditions of Numerical Model
of Reinforced Concrete Beams Under Torsion Archives of Civil Engineering 201815 Ronald L I ldquoLatin Hypercube Samplingrdquo John Wiley amp Sons Ltd and republished in Wiley Statistics
Reference Online httpsdoiorg1010029781118445112 201416 M Keramat R Kielbasa ldquoEfficient average quality index of estimation of integrated circuits by modified
Latin hypercube sampling Monte Carlordquo Journal of Analog Integrated Circuits and Signal Processing vol19 issue 1 April pp 87-98 1997
17 D Huntington C Lyrintzis ldquoImprovements to and limitations of Latin hypercube sampling Probabilistic Engineering Mechanics vol 13(4) pp 245ndash253rdquo 1997
18 Probabilistic Model Code JCSS working material httpwwwjcssethzch (online) 201219 ISO 2394General principles on reliability for structures 201020 R Iman W Conover ldquoA distribution-free approach to inducing rank correlation among input variables
Communication in Statisticsrdquo ndash Simulation and Computation Vol 11n 3 pp 311 ndash 334 198221 SARA Program Documentation Praga 2015
LIST OF FIGURES AND TABLES
Fig 1 The view of the analysed cantilever beam
Rys 1 Widok analizowanej belki wspornikowej
Fig 2 STMs of cantilever reinforced concrete beams a) model B1 b) model B2 c) model B3
Rys 2 Modele ST wspornikowej belki żelbetowej a) model B1 b) model B2 c) model B3
Fig 3 Geometry and reinforcement of tested beams
Rys 3 Wymiary i zbrojenie testowanych belek
Fig 4 Point A and linear elements defined on the beam surface
Rys 4 Lokalizacja punktu A i linii na powierzchni belki
Fig 5 The cracks image of the analysed beams a) beam B1 b) beam B3
Rys 5 Obraz pęknięć analizowanych belek a) belka B1 b) belka B3
570 L BUDA-OOacuteG K SIEKOWSKA I SKRZYPCZAK
Fig 6 Load ndash vertical displacements for the point A FEM simulations and test
Rys 6 Obciążenie - przemieszczenia pionowe punktu A symulacje MES i test
Fig 7 Comparison of vertical displacements for the line 1 FEM simulations and test
Rys 7 Poroacutewnanie przemieszczeń pionowych dla linii 1 symulacje MES i test
Fig 8 Comparison of horizontal displacements for the line 2 FEM simulations and test
Rys 8 Poroacutewnanie przemieszczeń poziomych dla linii 2 symulacje MES i test
Fig 9 Comparison of horizontal displacements for the line 3 FEM simulations and test
Rys 9 Poroacutewnanie przemieszczeń poziomych dla linii 3 symulacje MES i test
Fig 10 Illustration of LHS - samples as the probabilistic means of intervals
Rys 10 Ilustracja metody proacutebkowania w metodzie LHS
Fig 11 The histograms with estimate ultimate load for the beams B1 B2 and B3
Rys 11 Histogramy wraz z przybliżoną postacią funkcji gęstości prawdopodobieństwa nośności
Tab 1 The results obtained from the measurements ie the maximum load the deflection of point A and the
angle of rotation
Tab 1 Wyniki pomiaroacutew tj maksymalne obciążenie odkształcenie i kąt obrotu pkt A
Tab 2 Material properties in the stochastic modelling
Tab 2 Właściwości materiałowe i ich opis w modelu stochastycznym
Tab 3 Correlation matrix of concrete
Tab 3 Macierz korelacji dla betonu
Tab 4 Mean value standard deviation COV skewness and kurtosis upper and lower value of load bearing
capacity of beams
Tab 4 Wartość średnia odchylenie standardowe wspoacutełczynnik zmienności wspoacutełczynnik skośności
kurtoza minimalna i maksymalna nośność belek
Tab 5 Probability of failure and reliability index estimated by Cornella method and FORM method
Tab 5 Prawdopodobieństwo awarii i wskaźnik niezawodności Cornela oraz metodą FORM
Tab 6 Estimators of the deflection distribution function at point A
Tab 6 Estymatory funkcji rozkładu ugięć w punkcie A
Tab 7 Estimators of the side plane rotation function
Tab 7 Estymatory funkcji obrotu płaszczyzny bocznej
RELIABILITY OF BEAMS SUBJECTED TO TORSION DESIGNED USING STM 571
NIEZAWODNOŚĆ BELEK SKRĘCANYCH PROJEKTOWANYCH METODĄ STRUT AND TIE
Słowa kluczowe metoda ST skręcanie belki żelbetowe niezawodność
STRESZCZENIEW pracy analizowano niezawodność wspornikowych belek żelbetowych Obiektem badań były belki skręcane
i zginane w ktoacuterych zbrojenie zaprojektowano metodą ST przedstawione na rys 1
a) b)
Fig 1 Analizowana belka wspornikowa a) wymiary b) widok belki na stanowisku badawczym
Zbrojenie analizowanych belek uzyskano na podstawie trzech modeli Strut i Tie Model 1 stanowiła kratownica
przestrzenna w ktoacuterej ściskane krzyżulce betonowe wydzielone rysami ukośnymi są na każdym boku pionowym
i poziomym nachylone do osi pręta pod kątem 45o Pręty pionowe kratownicy to rozciągane zbrojenie w postaci
strzemion Pas goacuterny i pas dolny kratownicy to odpowiednio zbrojenie rozciągane i ściskane pasy betonowe W modelu
2 kratownicy przestrzennej ściskane krzyżulce betonowe przyjęto nachylone do osi pręta pod kątem 37o natomiast
w modelu 3 nachylone pod kątem 27o
Ocenę niezawodności belek skręcanych poprzedziły badania doświadczalne przeprowadzone na elementach w skali
naturalnej Badania miały na celu obserwację złożonego charakteru zjawiska skręcania w konstrukcjach żelbetowych
a uzyskane wyniki posłużyły do walidacji modeli numerycznych Z uwagi na statystyczną reprezentatywność
i wiarygodność otrzymanych wynikoacutew badań każda seria zawierała po 4 belki o takich samych parametrach tj klasie
betonu i zbrojeniu Otrzymane z pomiaroacutew wyniki podano ocenie statystycznej Na podstawie przeprowadzonych badań
doświadczalnych zauważono że średnie obciążenie niszczące w zależności od modelu wynosiło od 121 kN dla modelu
1 do 97 kN dla modelu 3 Belki o zbrojeniu ukształtowanym na podstawie roacuteżnych modeli ST charakteryzuje też inne
ugięcie oraz kąt obrotu płaszczyzny bocznej W następnym kroku przeprowadzono analizę numeryczną belek
w ATENA 3D - Studio Do nieliniowej analizy belek żelbetowych wykorzystano modele betonu opisujące zależność
w złożonym stanie naprężenia o parametrach materiałowych zmodyfikowany zgodnie z wynikami badań
wytrzymałościowych zastosowanego betonu Zbrojenie zamodelowano dyskretnie wykorzystując wbudowany
w programie ATENA model zbrojenia zapewniający przyczepność między betonem i zbrojeniem
Ocenę niezawodności belek przeprowadzono metodami probabilistycznymi ndash FORM oraz w pełni probabilistyczną
Monte Carlo z wykorzystaniem technik redukcji wariancji hipersześcianem łacińskim Metody FORM wykorzystują
572 L BUDA-OOacuteG K SIEKOWSKA I SKRZYPCZAK
pełny opis probabilistyczny zmiennych losowych czyli średnią odchylenie standardowe i informacje o funkcji gęstości
W modelu stochastycznym przyjęto że wartości wejściowe opisane są średnią odchyleniem standardowym i rodzajem
rozkładu Modelowanie stochastyczne przeprowadzono w programie SARA Oszacowano nośność średnią
maksymalną i minimalną nośność uzyskaną z symulacji odchylenie standardowe wspoacutełczynnik zmienności
wspoacutełczynnik skośności oraz kurtozę dla wszystkich analizowanych belek Na podstawie histogramoacutew odpowiedzi
i przybliżonej postaci funkcji gęstość prawdopodobieństwa nośności uzyskanych z symulacji stochastycznej
wyznaczono wskaźnik niezawodności Cornella - βc oraz wskaźnik niezawodności metodą FORM- βFORM W tabeli 1
zestawiono oszacowany wskaźnik niezawodności Cornella i odpowiadające mu prawdopodobieństwo zniszczenia oraz
otrzymywane metodą FORM i SORM prawdopodobieństwo awarii i wskaźnik niezawodności
Tabela 1 Prawdopodobieństwo awarii i wskaźnik niezawodności metodami FORM i Cornella
Element βc βFORM
B1 838 25610-17 961 37510-22
B2 690 25410-12 737 87710-14
B3 732 12210-13 663 16710-11
W wyniku przeprowadzone oceny statystycznej zauważono wpływ przyjętego modelu ST na niezawodność belek
Przedstawione wyniki analizy niezawodności potwierdziły bezpieczne oszacowanie nośności metodą ST dla wszystkich
badanych belek Zauważono że w przypadku belek B2 i B3 wskaźnik niezawodności jest niższy niż w przypadku
belki B1
Podsumowując można stwierdzić że zastosowanie metod probabilistycznych pozwala na wybranie najkorzystniejszej
pod względem niezawodności modelu ST a przedstawione przykłady i metody szacowania niezawodności mogą służyć
jako wskazanie w procesie optymalizacji modelu ST stosowanych w konstrukcjach żelbetowych
Received 23032020 Revised 28052020
RELIABILITY OF BEAMS SUBJECTED TO TORSION DESIGNED USING STM 573

Fig 8 Comparison of horizontal displacements for the line 2 FEM simulations and test
Fig 9 Comparison of horizontal displacements for the line 3 FEM simulations and test
5 STOCHASTIC MODELLING OF BEAMS
The constructed and validated numerical models were used to estimate the reliability of the
analysed beams The objective was to study the impact of a type of STM and some input data on the
bearing capacity and displacements of the beams The reliability of beams were assessed using
probabilistic method - FORM and fully probabilistic method Monte Carlo with the use of variance
reduction techniques by Latin hypercube sampling (LHS) The basic feature of LHS is that the
probability distribution functions for all random variables are divided into NSim equivalent intervals
(NSim is a number of simulations) the values from the intervals are then used in the simulation
process (random selection middle of interval or mean value) This means that the range of the
probability distribution function of each random variable is divided into intervals of equal
RELIABILITY OF BEAMS SUBJECTED TO TORSION DESIGNED USING STM 563
probability The samples are chosen directly from the distribution function based on the inverse
transformation of the distribution function The representative parameters of variables are selected
randomly being based on random permutations of integers 1 2 j NSim Every interval of each
variable must be used only once during the simulation ndash Fig10 Being based on this precondition a
table of random permutations can be used conveniently each row of such a table belongs to a
specific simulation and the column corresponds to one of the input random variables [15]
Fig 10 Illustration of LHS - samples as the probabilistic means of intervals
The mean of each interval should be chosen as (41)
(41)
where fi is the probability density function of variable Xi and the integration limits are (42)
(42)
The estimated mean value is achieved accurately and the variance of the sample set is much closer
to the target one [16 17]
564 L BUDA-OOacuteG K SIEKOWSKA I SKRZYPCZAK
In the analysis the random character of input data - concrete and steel was assumed Taking into
account the calculation time and the accuracy of the results obtained the number of samples in the
LHS method was optimized The optimization criterion was the approximate stabilization of the
Cornell reliability index and the reliability index determined by the FORM method The
optimization was carried out for the B2 beam analysing samples with 10 30 50 and 70 elements
Taking into account the results obtained it was finally decided that for each of the beams 30
simulations were performed with modified statistic parameters The statistic parameters were
described using the recommendations specified in JCSS [18] ISO [19] The input values should be
properly described eg with a mean value a coefficient of variation or a type of distribution The
distribution and coefficient of variation - COV for the input variables of concrete and steel are
shown in Table 2
Table 2 Material properties in the stochastic modelling
Input Mean value Standard deviation Distribution
Ec [ ] 34867 5230 Lognormal
ft [ 44 079 Lognormal
fc [ 64 486 Lognormal
fy 545 2725 Lognormal
In the analysis the correlation between parameters of concrete was assumed The correlation matrix
used for the concrete in the stochastic modelling was built based on the publication [20] and shows
in Table 3
Table 3 Correlation matrix of concrete
Input Ec ft fc
Ec 1 09 -07
ft 09 1 -08
fc -07 -08 1
RELIABILITY OF BEAMS SUBJECTED TO TORSION DESIGNED USING STM 565
The stochastic modelling was carried out using SARA [21] software application For each of the
beams the results of the stochastic simulations were estimations of the mean value variance
coefficient of skewness kurtosis and empirical cumulative probability density function estimated by
empirical histogram structural response This basic statistical assessment is visualized through the
histograms The histograms with estimate ultimate load for the beams B1 B2 and B3 are shown in
Fig 11
a) Histogram of ultimate load for the beam B1- the 3-Parameter Weibull Distribution
b) Histogram of ultimate load for the beam B1- Studentrsquos t Distribution
Force
0104 0106 0108 011 0112 0114 0116 0118 012 0122 0124 0126 0128 013
MeanStd Std
20
40
60
80
100
Force
009 0092 0094 0096 0098 01 0102 0104 0106 0108 011 0112 0114
MeanStd Std
20
40
60
80
100
120
566 L BUDA-OOacuteG K SIEKOWSKA I SKRZYPCZAK
c) Histogram of ultimate load for the beam B1- the 2-Parameter Weibull Distribution
Fig 11 The histograms with estimate ultimate load for the beams B1 B2 and B3
The mean value of the ultimate load- P standard deviation COV coefficient of skewness kurtosis
the characteristic value of the ultimate load Pk the minimum value of load ndash Pmin and the maximum
value of load ndash Pmax are compared in Tables 4 The Pk is a 5 fractile of the statistical distribution
for P
Table 4 Mean value standard deviation COV skewness and kurtosis upper and lower value of load bearing capacity of beams
Element P[kN] σP [kN] ν[] skewness kurtosis Pk [kN] Pmin[kN] Pmax[kN]
B1 1165 433 37 -00522 -0846 1093 1079 1240
B2 1030 385 37 00503 0095 966 935 1105
B3 989 362 37 -01639 -0543 922 919 1063
The reliability analyses were carried out after statistical analyses The limit state function -Z
(margin of safety) was formulated (43)
(43) Z = R ndash E
This function is a difference between resistance ndash R and load effect - E
In presented analysed simulation methods were used for obtained implicit limit state functions - R
In simulation methods many random samples for each of the basic random variables in the problem
are generated in a way that they can represent their true probability distributions and stochastic
characteristics Using each realisation of the random variables in the problem and analysing the
Force
0084 0086 0088 009 0092 0094 0096 0098 01 0102 0104 0106 0108
MeanStd Std
20
40
60
80
100
120
140
RELIABILITY OF BEAMS SUBJECTED TO TORSION DESIGNED USING STM 567
problem deterministically will lead to a realisation of the problem itself Each of these deterministic
analyses is referred to as a simulation trial
According to the original assumptions the design load applied to the considered beams was 60 kN
For the load effect -E probabilistic description by means of normal distribution with COV 015 was
used In presented analyses the average value of load amounted to 45 kN
In the next step reliability analysis methods employing the Cornellacutes reliability index ndash βc and the
FORM method-βFORM were applied The probability of failure the Cornells reliability index the
probability of failure obtained from the FORM method and the reliability index of the tested beams
are presented in Table 5
Table 5 Probability of failure and reliability index estimated by Cornella method and FORM method
Element βc βFORM
B1 838 25610-17 961 37510-22
B2 690 25410-12 737 87710-14
B3 732 12210-13 663 16710-11
Vertical displacements of the point A indicated in Fig and the angle of rotation of the side plane of
the beam at line 2 (analogously to the experimental tests) were also statistically evaluated
The results of the statistical assessment of horizontal displacements and the angle of rotation of the
side plane of the beam are presented in the Tables 6 and 7
Table 6 Estimators of the deflection distribution function at point A
Element u [mm] σu [mm] ν[] βc
B1 142 114 80 124
B2 126 102 81 123
B3 110 070 63 158
Table 7 Estimators of the side plane rotation function
Element φ [degm] [degm] βC
B1 142 014 99
B2 139 021 68
B3 102 014 73
568 L BUDA-OOacuteG K SIEKOWSKA I SKRZYPCZAK
The presented results of the reliability analysis confirmed a safe estimation of the load capacity in
the STM The most reliable taking into account the bearing capacity deflection and the angle of
rotation of the side plane is characterized by the B1 beam Although the measured deflection of
point A and the angle of rotation of the lateral plane are in this case the highest of the three analysed
beams the result obtained is characterized by the least coefficient of variation
6 CONCLUSION
The paper presents the probabilistic assessment of load-bearing capacity and reliability for different
STM of beams loaded with a torsional moment bending moment as well as a shear force Summing
up the results of the analysis the following detailed conclusions can be formulated
The highest values of the reliability index taking into account the bearing capacity deflection
and angle of rotation of the side plane were obtained from the beam B1
Structures designed on the basis of different ST models are characterized by different load
bearing capacity and different mass of reinforcement The mean value of load bearing capacity
ranged from 121 kN for the beam B1 to 974 kN for the beam B3
The result of the stochastic simulations shows that the coefficients of variation of load bearing
capacity are different for the tested beams The obtained coefficients of variation means from
4 for the beam B1 to 9 for the beam B3
Based on the analysis it can be concluded that the STM with the compressed concrete struts
inclined at an angle of 45deg to the axis of the bar is the most advantageous due to the bearing
capacity and reliability Therefore this STM should be recommended for element subjected to
torsion and bending
To sum up it should be stated that the knowledge of the random nature of variable states including
the strength of materials and loads used on the designed structure and the estimated probability of
failure allows for a better understanding of the behaviour of the tested structural system than the
deterministic analysis using even the most complex finite element model The application of
probabilistic methods allows for the selection of the most advantageous one with regard to the
reliability of the ST model and the presented examples and methods of reliability estimation may
serve as an indication in the process of ST model optimization
RELIABILITY OF BEAMS SUBJECTED TO TORSION DESIGNED USING STM 569
REFERENCES
1 W RitterldquoThe Hennebique Design Methodrdquo (Zuumlrich) (in German) Vol 33 No 7 pp 59-61 18992 E MoumlrcshReinforced Concrete Construction-Theory and Application 5th Ed Wittwer Stutgart V1 Part
1 Part 2 1920 19223 B Thϋrlimann P Marti J Pralong P Ritz and B Zimmerli Application of the theory of plasticity to
reinforced concrete Institute of Structrural Engineering ETH Zϋrich 19834 J Schlaich K Schaumlfer M Jennewein ldquoToward a consistent design of structural concreterdquo PCI J 32(3) pp
74ndash150 19875 P Adebar D Kuchma and MP Collins ldquoStrut-and-Tie Models for the Design of Pile Caps An Experimental
StudyrdquoACI Structural Journal Vol 87 No 1 pp 81-9219906 EN 1992-1-1 Eurocode 2 Design of concrete structures - Part 1-1 General rules and rules for buildings 20047 Model Code Final draft fib Bulletin no 66 vol 2 20128 FIB Bulletinrdquo Practical Design of Structural Concrete Design examples for strut and tie modelsrdquo no 6 20119 H Thorerdquo Do EN 1992‐1‐1 and the European Concrete Platform comply with tests Commentary on the rules
for strut‐and‐tie models using corbels as an examplerdquo Structural ConcreteVolume 16 Issue 3pp418-427 httpsdoiorg101002suco201400066 2015
10 ldquoEurocode 2 Design of concrete structures ndash Part 1-1 General rules and rules for buildingsrdquo European Committee for Standardization Brussels 2004
11 ATENA Program Documentation Praga 201412 P Meneacutetrey KJ Willam Triaxial failure criterion for concrete and its generalization ACI Structural Journal
Vol 92 No 3 pp 311 ndash 318 199513 J Červenka VK Papanikolaou VK ldquoThree dimensional combined fracture-plastic material model for
concrete International Journal of Plasticityrdquo Vol 24 pp 2192-2220 200814 B Turoń D Ziaja L Buda-Ożoacuteg B Miller DIC in Validation of Boundary Conditions of Numerical Model
of Reinforced Concrete Beams Under Torsion Archives of Civil Engineering 201815 Ronald L I ldquoLatin Hypercube Samplingrdquo John Wiley amp Sons Ltd and republished in Wiley Statistics
Reference Online httpsdoiorg1010029781118445112 201416 M Keramat R Kielbasa ldquoEfficient average quality index of estimation of integrated circuits by modified
Latin hypercube sampling Monte Carlordquo Journal of Analog Integrated Circuits and Signal Processing vol19 issue 1 April pp 87-98 1997
17 D Huntington C Lyrintzis ldquoImprovements to and limitations of Latin hypercube sampling Probabilistic Engineering Mechanics vol 13(4) pp 245ndash253rdquo 1997
18 Probabilistic Model Code JCSS working material httpwwwjcssethzch (online) 201219 ISO 2394General principles on reliability for structures 201020 R Iman W Conover ldquoA distribution-free approach to inducing rank correlation among input variables
Communication in Statisticsrdquo ndash Simulation and Computation Vol 11n 3 pp 311 ndash 334 198221 SARA Program Documentation Praga 2015
LIST OF FIGURES AND TABLES
Fig 1 The view of the analysed cantilever beam
Rys 1 Widok analizowanej belki wspornikowej
Fig 2 STMs of cantilever reinforced concrete beams a) model B1 b) model B2 c) model B3
Rys 2 Modele ST wspornikowej belki żelbetowej a) model B1 b) model B2 c) model B3
Fig 3 Geometry and reinforcement of tested beams
Rys 3 Wymiary i zbrojenie testowanych belek
Fig 4 Point A and linear elements defined on the beam surface
Rys 4 Lokalizacja punktu A i linii na powierzchni belki
Fig 5 The cracks image of the analysed beams a) beam B1 b) beam B3
Rys 5 Obraz pęknięć analizowanych belek a) belka B1 b) belka B3
570 L BUDA-OOacuteG K SIEKOWSKA I SKRZYPCZAK
Fig 6 Load ndash vertical displacements for the point A FEM simulations and test
Rys 6 Obciążenie - przemieszczenia pionowe punktu A symulacje MES i test
Fig 7 Comparison of vertical displacements for the line 1 FEM simulations and test
Rys 7 Poroacutewnanie przemieszczeń pionowych dla linii 1 symulacje MES i test
Fig 8 Comparison of horizontal displacements for the line 2 FEM simulations and test
Rys 8 Poroacutewnanie przemieszczeń poziomych dla linii 2 symulacje MES i test
Fig 9 Comparison of horizontal displacements for the line 3 FEM simulations and test
Rys 9 Poroacutewnanie przemieszczeń poziomych dla linii 3 symulacje MES i test
Fig 10 Illustration of LHS - samples as the probabilistic means of intervals
Rys 10 Ilustracja metody proacutebkowania w metodzie LHS
Fig 11 The histograms with estimate ultimate load for the beams B1 B2 and B3
Rys 11 Histogramy wraz z przybliżoną postacią funkcji gęstości prawdopodobieństwa nośności
Tab 1 The results obtained from the measurements ie the maximum load the deflection of point A and the
angle of rotation
Tab 1 Wyniki pomiaroacutew tj maksymalne obciążenie odkształcenie i kąt obrotu pkt A
Tab 2 Material properties in the stochastic modelling
Tab 2 Właściwości materiałowe i ich opis w modelu stochastycznym
Tab 3 Correlation matrix of concrete
Tab 3 Macierz korelacji dla betonu
Tab 4 Mean value standard deviation COV skewness and kurtosis upper and lower value of load bearing
capacity of beams
Tab 4 Wartość średnia odchylenie standardowe wspoacutełczynnik zmienności wspoacutełczynnik skośności
kurtoza minimalna i maksymalna nośność belek
Tab 5 Probability of failure and reliability index estimated by Cornella method and FORM method
Tab 5 Prawdopodobieństwo awarii i wskaźnik niezawodności Cornela oraz metodą FORM
Tab 6 Estimators of the deflection distribution function at point A
Tab 6 Estymatory funkcji rozkładu ugięć w punkcie A
Tab 7 Estimators of the side plane rotation function
Tab 7 Estymatory funkcji obrotu płaszczyzny bocznej
RELIABILITY OF BEAMS SUBJECTED TO TORSION DESIGNED USING STM 571
NIEZAWODNOŚĆ BELEK SKRĘCANYCH PROJEKTOWANYCH METODĄ STRUT AND TIE
Słowa kluczowe metoda ST skręcanie belki żelbetowe niezawodność
STRESZCZENIEW pracy analizowano niezawodność wspornikowych belek żelbetowych Obiektem badań były belki skręcane
i zginane w ktoacuterych zbrojenie zaprojektowano metodą ST przedstawione na rys 1
a) b)
Fig 1 Analizowana belka wspornikowa a) wymiary b) widok belki na stanowisku badawczym
Zbrojenie analizowanych belek uzyskano na podstawie trzech modeli Strut i Tie Model 1 stanowiła kratownica
przestrzenna w ktoacuterej ściskane krzyżulce betonowe wydzielone rysami ukośnymi są na każdym boku pionowym
i poziomym nachylone do osi pręta pod kątem 45o Pręty pionowe kratownicy to rozciągane zbrojenie w postaci
strzemion Pas goacuterny i pas dolny kratownicy to odpowiednio zbrojenie rozciągane i ściskane pasy betonowe W modelu
2 kratownicy przestrzennej ściskane krzyżulce betonowe przyjęto nachylone do osi pręta pod kątem 37o natomiast
w modelu 3 nachylone pod kątem 27o
Ocenę niezawodności belek skręcanych poprzedziły badania doświadczalne przeprowadzone na elementach w skali
naturalnej Badania miały na celu obserwację złożonego charakteru zjawiska skręcania w konstrukcjach żelbetowych
a uzyskane wyniki posłużyły do walidacji modeli numerycznych Z uwagi na statystyczną reprezentatywność
i wiarygodność otrzymanych wynikoacutew badań każda seria zawierała po 4 belki o takich samych parametrach tj klasie
betonu i zbrojeniu Otrzymane z pomiaroacutew wyniki podano ocenie statystycznej Na podstawie przeprowadzonych badań
doświadczalnych zauważono że średnie obciążenie niszczące w zależności od modelu wynosiło od 121 kN dla modelu
1 do 97 kN dla modelu 3 Belki o zbrojeniu ukształtowanym na podstawie roacuteżnych modeli ST charakteryzuje też inne
ugięcie oraz kąt obrotu płaszczyzny bocznej W następnym kroku przeprowadzono analizę numeryczną belek
w ATENA 3D - Studio Do nieliniowej analizy belek żelbetowych wykorzystano modele betonu opisujące zależność
w złożonym stanie naprężenia o parametrach materiałowych zmodyfikowany zgodnie z wynikami badań
wytrzymałościowych zastosowanego betonu Zbrojenie zamodelowano dyskretnie wykorzystując wbudowany
w programie ATENA model zbrojenia zapewniający przyczepność między betonem i zbrojeniem
Ocenę niezawodności belek przeprowadzono metodami probabilistycznymi ndash FORM oraz w pełni probabilistyczną
Monte Carlo z wykorzystaniem technik redukcji wariancji hipersześcianem łacińskim Metody FORM wykorzystują
572 L BUDA-OOacuteG K SIEKOWSKA I SKRZYPCZAK
pełny opis probabilistyczny zmiennych losowych czyli średnią odchylenie standardowe i informacje o funkcji gęstości
W modelu stochastycznym przyjęto że wartości wejściowe opisane są średnią odchyleniem standardowym i rodzajem
rozkładu Modelowanie stochastyczne przeprowadzono w programie SARA Oszacowano nośność średnią
maksymalną i minimalną nośność uzyskaną z symulacji odchylenie standardowe wspoacutełczynnik zmienności
wspoacutełczynnik skośności oraz kurtozę dla wszystkich analizowanych belek Na podstawie histogramoacutew odpowiedzi
i przybliżonej postaci funkcji gęstość prawdopodobieństwa nośności uzyskanych z symulacji stochastycznej
wyznaczono wskaźnik niezawodności Cornella - βc oraz wskaźnik niezawodności metodą FORM- βFORM W tabeli 1
zestawiono oszacowany wskaźnik niezawodności Cornella i odpowiadające mu prawdopodobieństwo zniszczenia oraz
otrzymywane metodą FORM i SORM prawdopodobieństwo awarii i wskaźnik niezawodności
Tabela 1 Prawdopodobieństwo awarii i wskaźnik niezawodności metodami FORM i Cornella
Element βc βFORM
B1 838 25610-17 961 37510-22
B2 690 25410-12 737 87710-14
B3 732 12210-13 663 16710-11
W wyniku przeprowadzone oceny statystycznej zauważono wpływ przyjętego modelu ST na niezawodność belek
Przedstawione wyniki analizy niezawodności potwierdziły bezpieczne oszacowanie nośności metodą ST dla wszystkich
badanych belek Zauważono że w przypadku belek B2 i B3 wskaźnik niezawodności jest niższy niż w przypadku
belki B1
Podsumowując można stwierdzić że zastosowanie metod probabilistycznych pozwala na wybranie najkorzystniejszej
pod względem niezawodności modelu ST a przedstawione przykłady i metody szacowania niezawodności mogą służyć
jako wskazanie w procesie optymalizacji modelu ST stosowanych w konstrukcjach żelbetowych
Received 23032020 Revised 28052020
RELIABILITY OF BEAMS SUBJECTED TO TORSION DESIGNED USING STM 573
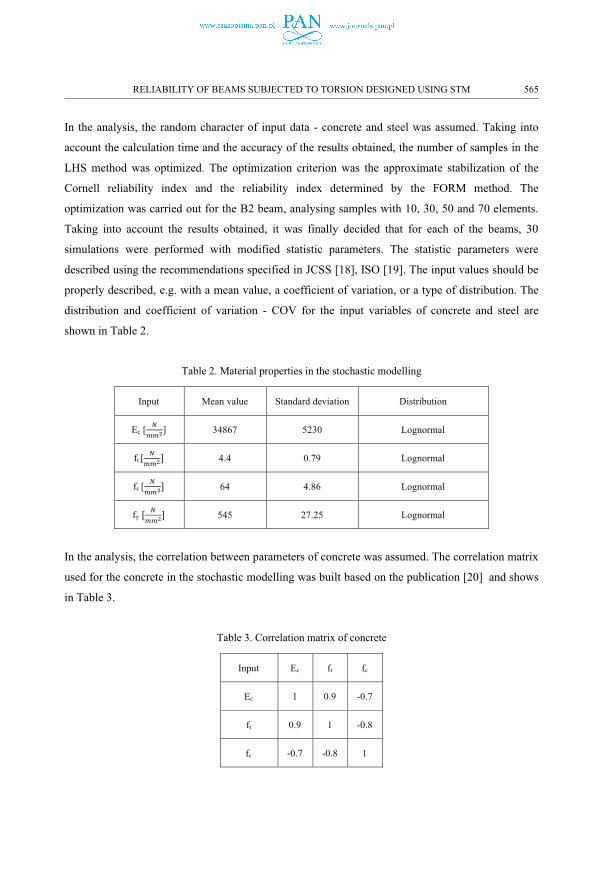
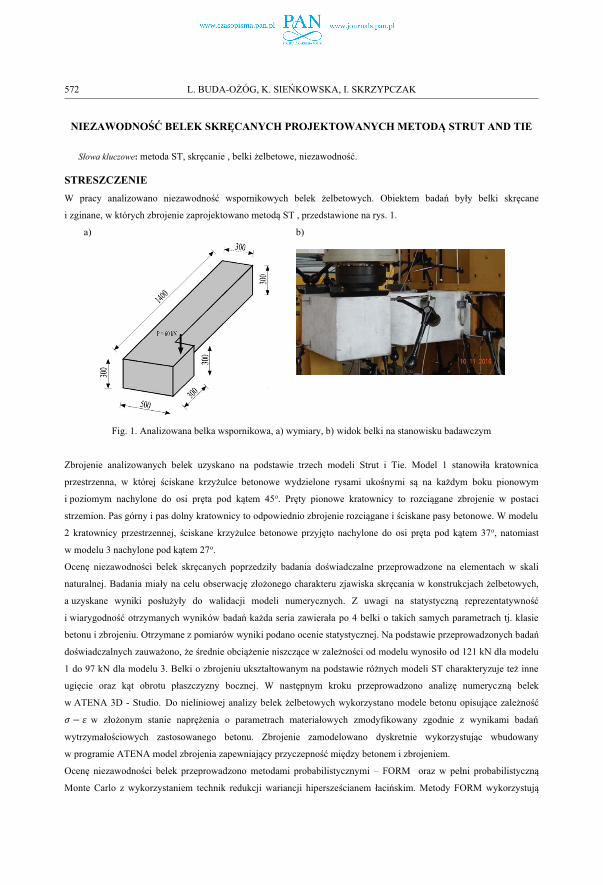
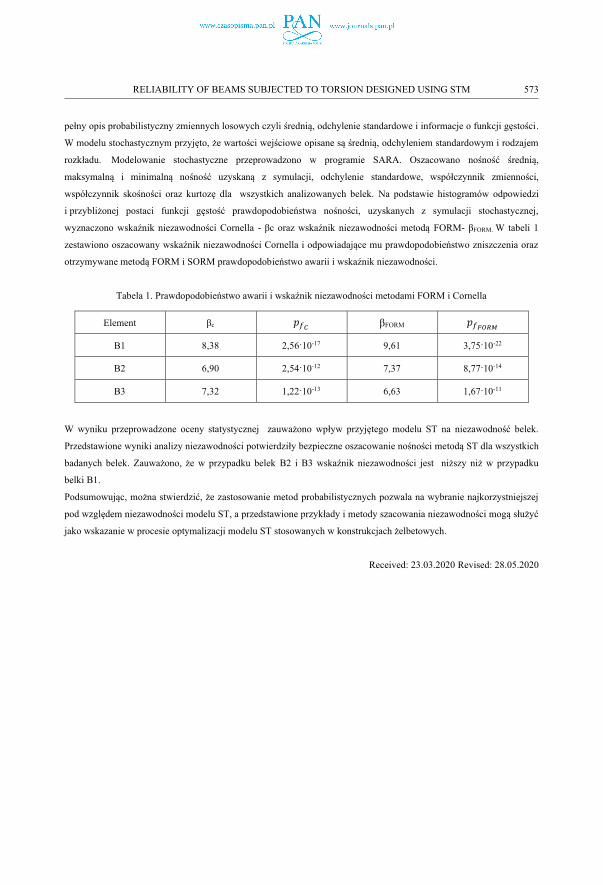