Embed Size (px)
Citation preview

Eksploatacja i NiEzawodNosc – MaiNtENaNcE aNd REliability Vol.18, No. 2, 2016 237
Article citation info:
1. Introduction
According to the International Energy Agency (www.iea.org) in 2009 total electricity generation share of the nuclear power plants was 13.4 %, natural gas 21.4 %, oil 5.1 % and coal power plants 40.6 %, while share of renewables (without large hydropower plants – 16.2 %) was 3.3 %. Those non-renewable power generation units, though generally highly dispatchable and reliable, have in turn huge environ-mental influence, especially on the global warming, due to the great share of fossil fuels usage [17].
In recent years, share of renewables in total electricity genera-tion is increasing: excluding big hydropower plants, the greatest share in electricity generation from renewables is coming from the wind power plants. Total installed capacity in renewables in 2013 was 560 GW respectively, out of which 56.7 % or 318 GW from wind power plants [28]. In regard to a conventional power plant (thermal, hydro and nuclear) which implies adequacy of primary energy and constant power generation, wind power plants are depending on wind speed that is highly variable.
Due to the great increase of the capacity of wind power plants in recent years, their reliability is more and more important. That resulted in many wind turbine reliability models and methods being developed. However, due to the recent availability of long-term wind power plant statistics and fast development of wind turbine technol-ogy and size, it is important to continue developing new and more
accurate wind turbine reliability models. This paper is an effort in that direction presenting advanced reliability modelling for different wind turbine types, taking into account different wind power plant configurations developed over the past years and component perform-ance statistics.
The former developed reliability models of wind power plants in [5, 7, 8, 22, 23, 28] have so far related to the wind power plant as a whole. These reliability models have yielded a detailed overview of the impact of wind power plants on the reliability and availability, but they were not taking into account the impact of individual com-ponents of the each single wind power plant on the calculation of reliability indices of wind power plant. In [3] an analytical model is presented that describes in detail the reliability of wind power plant by taking into account diversity of the wind power plant configura-tion from the generator aspect. Also, according to [2] and described in chapter 2, there are four dominant configuration groups of wind power plants differed by type of generator, by network connection, by power control and by speed rate.
2. Wind turbine’s construction characteristics
Wind turbine’s main components are namely: rotor (hub and blades), brake, gearbox, generator, electronic control system, yaw system, nacelle, drive train, anemometer and tower. According to [2],
Topić D, ŠljivAc D, STojkov M. Reliability model of different wind power plant configuration using sequential monte carlo simulation. Eksploatacja i Niezawodnosc – Maintenance and Reliability 2016; 18 (2): 237–244, http://dx.doi.org/10.17531/ein.2016.2.11.
Danijel TopićDamir ŠljivAcMarinko STojkov
Reliability model of diffeRent wind poweR plant configuRation using sequential monte caRlo simulation
model niezawodności Różnych konfiguRacji zestawu elektRowni wiatRowej opaRty na sekwencyjnej symulacji monte caRlo
Paper presents an enhanced model for calculation of reliability indices for different wind power plants configuration concepts used over past two decades. The autoregressive – moving average (ARMA) model is used combined with the sequential Monte Carlo simulation in order to predict expected energy not served (EENS) more accurately during the failure. Statistical database of LWK (Land Wirtschafts Kammer) is used for determining different wind power plant configuration types component reliability (performance) used for calculating influence of individual wind power plant configuration concepts on expected energy not served. Furthermore, a comparison of the distribution of EENS of different wind power plants configuration concepts have been presented, as well as the influence of the predominantly mechanical and electrical components failures on both EENS and failure rates. .
Keywords: wind turbine; components; reliability; failure rate; Monte Carlo, ARMA.
W pracy przedstawiono udoskonalony model służący do obliczania wskaźników niezawodności dla różnych koncepcji konfiguracji zestawów elektrowni wiatrowych jakie stosowano w ostatnich dwóch dziesięcioleciach. Wykorzystano autoregresyjny model śred-niej ruchomej (ARMA), który w połączeniu z symulacją sekwencyjną Monte Carlo pozwala z większą dokładnością przewidzieć oczekiwaną wartość energii niedostarczonej (EENS) podczas awarii. Baza statystyczna LWK (Land Wirtschafts Kammer) posłu-żyła autorom do określania niezawodności (wydajności) części składowych elektrowni wiatrowych przy różnych typach konfigu-racji zestawu. Otrzymane wartości wykorzystano do obliczenia wpływu poszczególnych koncepcji konfiguracji zestawu elektrowni wiatrowej na oczekiwaną wartość energii niedostarczonej. Ponadto, przedstawiono porównanie rozkładu EENS dla różnych kon-cepcji konfiguracji zestawu elektrowni wiatrowej jak również omówiono wpływ uszkodzeń części mechanicznych i elektrycznych elektrowni na EENS oraz awaryjność.
Słowa kluczowe: turbina wiatrowa; części składowe, niezawodność; awaryjność; Monte Carlo, ARMA.
Eksploatacja i NiEzawodNosc – MaiNtENaNcE aNd REliability Vol.18, No. 2, 2016238
sciENcE aNd tEchNology
there are four typically configuration concepts of a wind turbine: Type A, Type B, Type C and Type D.
Type A configuration presents wind turbine with constant speed, stall power regulation and squirrel cage induction generator. Type B configuration corresponds to the limited variable speed wind tur-bine with variable generator rotor resistance, known as OptiSlip. It uses a wound rotor induction generator (WRIG) and has been used by the Danish manufacturer Vestas since the mid-1990s. The genera-tor is directly connected to the grid [2]. Type C, which is known as the doubly fed induction generator (DFIG) concept, corresponds to the limited variable speed wind turbine with a wound rotor induction generator (WRIG) and partial scale frequency converter (rated at ap-proximately 30 % of nominal generator power) on the rotor circuit [2]. Type D configuration corresponds to the full variable-speed wind turbine, with the generator connected to the grid through a full-scale frequency converter. Some full variable-speed wind turbine systems have no gearbox [2].
3. Statistical data of a wind turbine components
For a wind turbine reliability assessment, it is very important to have statistical data on performances and failures of wind turbine components. Detailed data on performance of wind turbines were pre-sented by Windstats [35]. Windstats is a commercial newsletter for the wind industry and records details of performance of wind turbines in many countries [33]. Tavner, Xiang and Spinato have performed detailed analysis of Windstats reliability data for German (WSD) and Danish (WSDK) wind turbines for 10-year period from October 1994 to September 2004 presented in [33]. Except the Windstats data, Spinato, Tavner, van Bussel and Koutoulakos in [31] have also ana-lysed reliability data for wind turbines obtained from a survey per-formed by the Land Wirtschafts Kammer (termed in this paper LWK) in Schleswig Holstein, Germany. LWK data are based on 11-year long period. Also, data on the performance of wind turbines extracted from WMEP (Wissenschaftliches Mess und Evaluierungsprogramm) are available. WMEP data are based on 17-year period of research and include more than 1500 wind turbines. Those data were analysed and presented in [13, 16] and [32]. Other performance statistics of reli-ability of wind for Sweden, Germany and Finland were presented in [29] and [30]. In this paper will be used data from LWK database. In research presented in this paper, reliability analysis for type A con-
figuration of wind turbine will be performed using LWK database for wind turbine Nordex N52/N54, for type B configuration of wind tur-bine will be performed using LWK database for wind turbine Vestas V39 and for type D configuration of a wind turbine will be performed using LWK database for wind turbine Enercon E66. For type C con-figuration of wind turbine there are no available data and this type of configuration will not be taken in to consideration. Table 1 presents statistical data on the failure rates and downtimes of particular compo-nents of a wind turbine according to LWK database [31].
4. Model description
4.1. Wind speed model
When it comes to a reliability assessment of a wind turbine, it is very important to have data about wind speed because output power of wind turbine is directly dependent on wind speed as previously described. For the reliability assessment of a wind turbine, data about wind speed can be used directly or, as it will be described below, can be modelled. In the previous research wind speed with the time-series (autoregressive, moving average or autoregressive moving average model), Weibull, Rayleigh or normal distribution or Markov chain was modelled.
Billinton, Chen and Ghajar in [6] have modelled the wind speed with time series (autoregressive moving average - ARMA) and in de-scribed in detail. Also, many other authors have used ARMA model for wind speed modelling as in [1, 5 ,7 ,8, 21, 22, 23, 27, 28]. Deshmukh and Ramakumar in [11] have used a Weibull distribution for wind speed modelling. Also, Weibull distribution for wind speed modelling in [3, 10, 12] and [20] was used. Giorseto and Utsurogi in [14], Wang, Dai, Hui and Thomas in [34] and Attvwa and El-Saadany in [4] have used Rayleigh distribution for wind speed modelling. Normal distri-bution for wind speed modelling in [15, 18, 19, 25] and Markov chain in [9, 24, 26] was used.
In this paper the wind speed model described in [6] is used. In this paper wind speed with the time series will be modelled. General form of the time series (ARMA model) is given with the following expression:
y y y yt t t n t n t t t m t m= + + + − − − −− − − − − −Φ Φ Φ Θ Θ Θ1 1 2 2 1 1 2 2... ...α α α α
(1)
Where: Φi n=1 2, ,..., autoregressive pa-
rameters, 1,2,...,i mΘ = moving aver-age parameters, αt{ } white noise with normally distributed with mean zero and varianceσa
2 . Wind speed model according to [6] with the following equation can be expressed:
V yt t= +µ (2)
Where is: Vt – simulated wind speed in the hour t, μ – mean value of the wind speed of the all observed measured data, yt – time series of the wind speed described with ex-pression (1).
4.2. Wind power plant model
In this chapter, enhanced reliability model of wind turbine is shown and de-
Table 1. Reliability data for different wind turbine types according to LWK database [31]
Wind turbine compo-nent
Failure rate [1/year]Downtime [h/
failure]Nordex N52/N54 (Type A) vestas v39 (Type B) Enercon E66
(Type D)
Electrical system 0.28 0.34 0.50 255
Electronic system 0.15 0.27 0.31 60
Generator 0.11 0.09 0.13 160
Hydraulic system 0.19 0.26 - 70
Yaw system 0.12 0.10 0.17 60
Mechanical brake 0.08 0.01 0.02 45
Sensors 0.03 0.08 0.26 42
Anemometer 0.13 0.06 0.07 4
pitch control - 0.10 0.47 70
Rotor and blades 0.46 0.17 0.14 125
Gearbox 0.51 0.18 - 335
Air brake 0.06 - - 110
Shaft/bearings 0.07 - 0.05 130
other 0.43 0.20 0.24 65

Eksploatacja i NiEzawodNosc – MaiNtENaNcE aNd REliability Vol.18, No. 2, 2016 239
sciENcE aNd tEchNology
scribed. New introduced and developed reliability model of wind tur-bine has the aim to give a detailed calculation of reliability indices of wind turbine. Output power of wind turbine with the following equation is presented:
2
0 0
( )
0
t ci
ci t rt t r
r t cor
t co
v vv v vA Bv Cv PPv v vP
v v
≤ ≤ ≤ ≤+ += ≤ ≤ ≥
(3)
Where is: Pr – rated power of wind turbine, vci – cut in wind speed, vr – rated wind speed, vco – cut out wind speed vt – wind speed. Coefficient’s A, B and C can be calculated by:
( )( ) ( )
( )( ) ( )
( )
3
2
3
2
3
2
1 42
1 4 32
1 2 42
ci rci ci r ci r
rci r
ci rci r ci r
rci r
ci r
rci r
v vA v v v v vvv v
v vB v v v vvv v
v vCvv v
+ = + − ⋅ − + = + − + − + = − −
(4)
Wind turbine model with series reliability model is presented. Failure of any component of wind turbine causes outage of wind tur-bine. Failure rate of whole wind turbine λWT can be calculated by:
λ λWT ii
n=
=∑
1 (5)
Where is: λi – failure rate of i-th component of wind turbine. Since wind turbine is with series reliability model presented, then average downtime of whole wind turbine rWT based on failure rates and downtimes of idividual components can be calculated by:
rr
WT
i ii
n
ii
nWT
=⋅
==
=
∑
∑
λ
λµ
1
1
1 (6)
Where is: ri – downtime of i-th component of wind tur-bine, μWT – repair rate of whole wind turbine.
Once all the required input data have been entered and wind speeds and the corresponding output power of wind power plant have been listed, calculation of the reli-ability index of wind power plant have been based on the sequential Monte Carlo simulation (SMCs). As previously stated, for sequential Monte Carlo simulation exponential distribution is assumed. An example of sequential Monte Carlo simulation is presented in Figure 1. Duration of the period of correct work or time to failure TTF and dura-tion of failures time or time to repair TTR, wind speed and power output of the wind power plant are monitored and presented in Figure 1. For sampling TTF and TTR the
random number generated U1 and U2 must be transformed into time according to equations (7) and (8).
TTF U= −1
1λln (7)
TTR U= −1
2µln (8)
At the moment of failure and after, wind speed is continually measured. Electric energy not supplied during downtime depends on wind speed during downtime. Two similar failures in duration, but significantly different by expected energy not served (EENS) are pre-sented in Figure 1.
Sequential Monte Carlo simulation ends when convergence con-ditions have been reached. If default number of simulations is ex-ecuted without the desired conditions of convergence achieved, it is necessary to increase the number of simulations N.
The convergence criterion for stopping the simulation is applied on the slowest variable convergence. In this case, the expected energy not served (EENS) is the slowest variable convergence, and then suf-ficient accuracy of simulation is achieved. Coefficient of accuracy α, for described case when the converges variable is expected energy not served (EENS), can be written by the following expression:
ασ
=( )
−EENS
EENS (9)
Where σ(EENS) represents the standard deviation of expected en-
ergy not served and _
EENS represents average expected energy not served of all previous simulations. In this paper, as a condition of sufficient accuracy the value is set as: α = 0.05. Block diagram of the enhanced reliability model of wind power plant is shown in Figure 2.
Fig. 1. An example of sequential Monte Carlo simulation

Eksploatacja i NiEzawodNosc – MaiNtENaNcE aNd REliability Vol.18, No. 2, 2016240
sciENcE aNd tEchNology
5. Results
In this example, enhanced reliability model of the wind power plant is applied for the calculation of reliability indices of several different wind power plant configurations, based on concepts of type A, B and D. Data on the failure rates and down-times of wind power plant configuration types A, B and D have already been presented in Table 1. The wind power plant which will be used as a case study of enhanced reliability model to get reliability indices has the following data: Pr = 2 MW, vci = 5 m/s, vr = 12 m/s, vco = 25 m/s.
To model wind speed “System identification Tool” after ARMA model ARMA (5,0) is obtained, further on as AR (5) abbreviated. The part of wind speed sequence is presented in Figure 3. Actual measured wind speeds are marked with a black line, while simulated values of wind speed using the AR (5) model are illustrated with blue lines. The resulting autoregressive parameters of AR (5) model are: Φ1 = 0.9635, Φ2 = − 0.06591, Φ3 = 0.03536, Φ4 = 0.0042 and Φ5 = 0.05521. Having obtained the parameters of ARMA model, they are
then used for enhanced reliability model of wind power plant. Wind speed model based on described procedure is then used in the Monte Carlo simulation.
The impact of individual components downtime of the wind power plant configuration types A, B and D on the EENS is shown in Figure 4.
From Figure 4 it is easy to see that gearbox has the largest contribution to the expected energy not served with the highest failure rate for type A. After the gear-box, electrical system, rotor and rotor blades failures have the greatest contributions to the EENS for type A. Downtimes of these three components (gearbox, electri-cal systems and rotor) caused about 48 % of all wind power plant failures, but they are responsible for about 75 % of the EENS. The remaining 60 % downtime of wind power plant is responsible for only about 25 % of the EENS.
From the same figure 4, it is obvious that electric system failures, gearbox failure, rotor and blades fail-ures and hydraulic system failures have the largest con-tribution to the EENS for type B. Electric system has also the highest failure rate. Electronic control system has the second highest failure rate, but also has signifi-cantly smaller contribution to the total EENS. Failures of electric system and gearbox failures caused about 28 % of all downtime of the wind power plant. On the other hand, failure of above mentioned components are responsible for almost 60 % of the EENS. Remaining components failures make up about 72 % of downtimes, but they are responsible for only about 40 % of power plant’s EENS, configuration type B.
It is very clear from Figure 4 that the electric system is the most unreliable component which caused the larg-est part of expected energy not served of wind power plant, configuration type D. The EENS, due to failures of electric system is 40.39 MWh/year. The rotor blades (pitch control) failures followed according to the partial amount of EENS is 10.93 MWh/year.
A comparison of the distribution of EENS of the wind power plants configuration types A, B and D is shown in Figure 5.
The comparison of absolute contributions of pre-dominantly mechanical and electrical components fail-
Fig. 2. Block diagram of wind turbine reliability model
Fig. 3. An example of the simulated sequence of wind speed

Eksploatacja i NiEzawodNosc – MaiNtENaNcE aNd REliability Vol.18, No. 2, 2016 241
sciENcE aNd tEchNology
ures of wind power plant, configuration types A, B and D, to EENS is presented in Figure 6.
The most significant contribution to the EENS of wind power plant, configuration type A is caused by mechanical components, as present-ed in Figure 6. For wind power plant of configu-ration type B, mechanical components failures and electric system components failures have fairly uniform contribution to EENS, while for wind power plant configuration type D, the most significant contribution to the EENS is caused mostly by failures of the electrical components. If absolute contributions of all components in all three analysed wind power plant configura-tions are compared (Figure 6), the largest contri-butions to the EENS are caused by: mechanical components of the wind power plant configura-tion type A, electrical components wind power plant configuration D, mechanical and electrical components of the wind power plant configura-
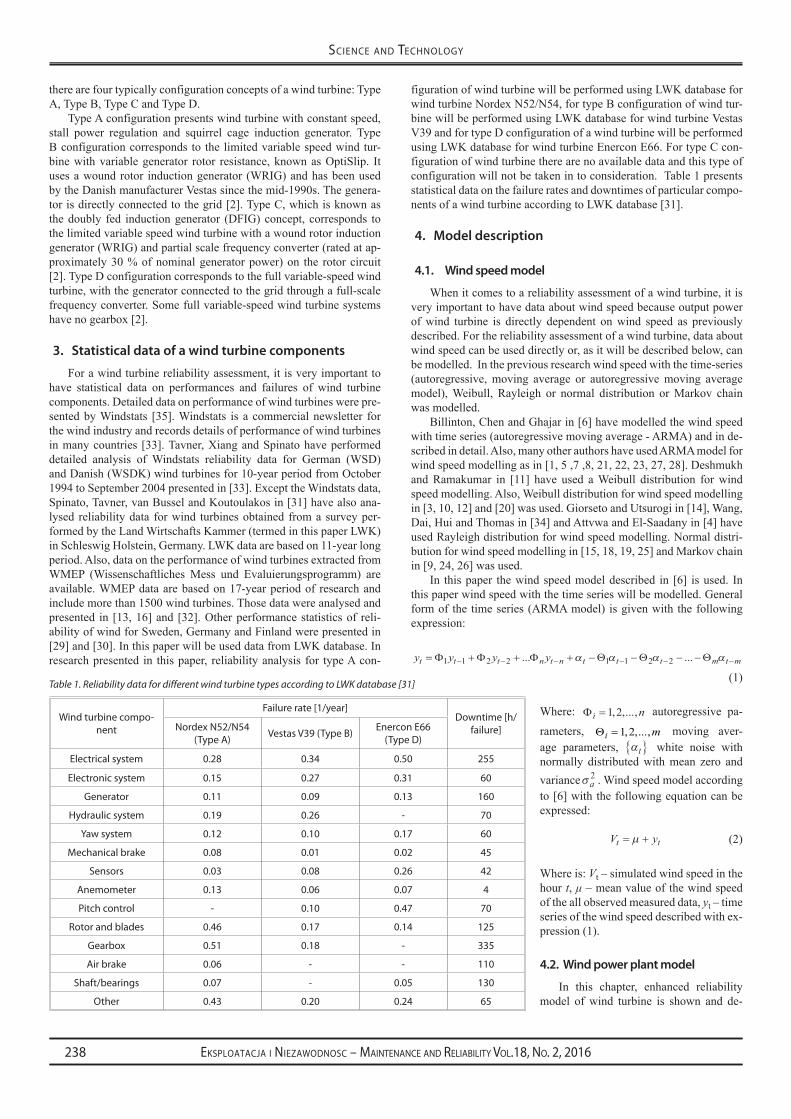
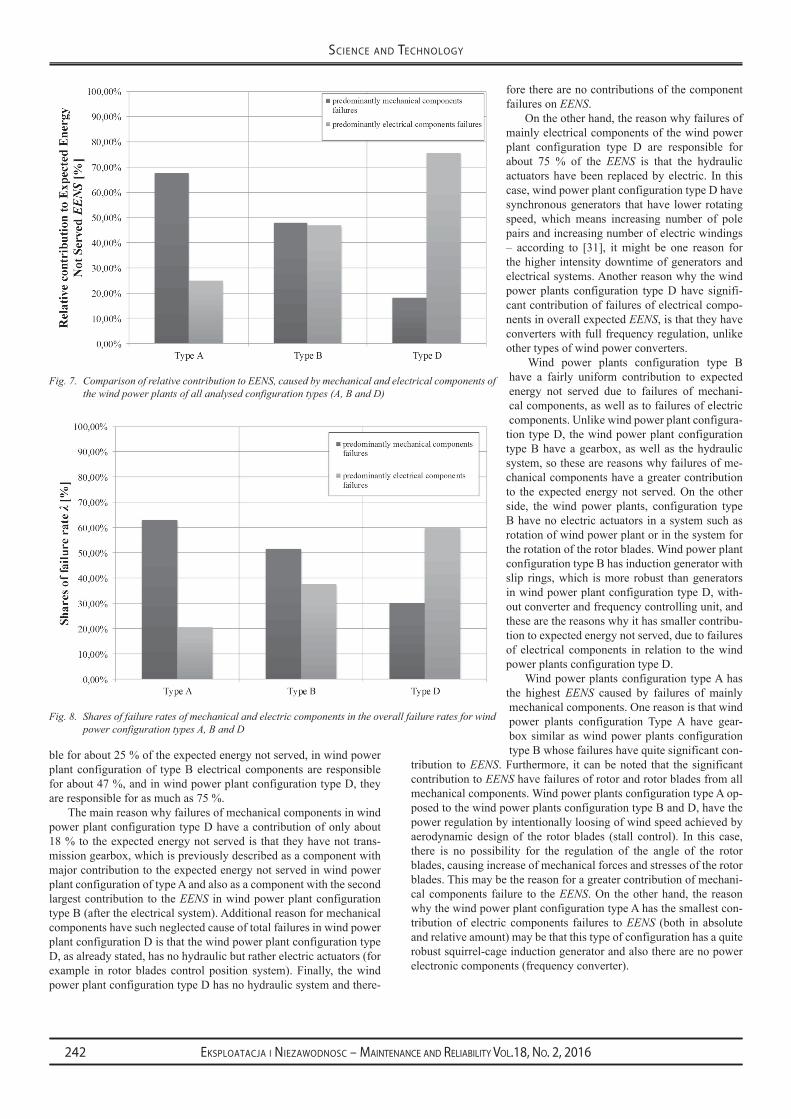
tion type B, electrical components of the wind power plant configuration type A and mechanical components of wind power plant configuration type D, respectively. A comparison of the rela-tive contribution to expected energy not served caused by mechanical and electrical components of the wind power plants of all analysed configu-ration types (A, B and D) is presented in Figure 7. Shares of mechanical and electric components failure rates in the overall intensity of downtime for wind power configuration types A, B and D are illustrated in Figure 8.
6. Conclusion
The paper presents the availability and ex-pected energy not served calculation of different type of wind turbines based on the statistical data on the performance of wind turbine components. Recently installed wind turbines in Germany (after 2008) have, in general, three blades, pitch power regulation, variable speed and synchronous or double-fed induction generator. Those charac-teristics correspond to wind turbine configuration concepts C and D. It can therefore be expected that newly installed wind turbine in near future will have, in general, configuration concept C or D, while on the other hand, many wind turbines currently in operation have configurations con-cepts A or B. Therefore results of the performed availability analysis of all configuration concepts presented in this paper can be used for reliability modelling of both operation of the existing and planning and design of new wind turbines which is the focus of the future research.
Failures of predominantly mechanical com-ponents in wind power plant configuration of type A are responsible for about 67 % of the ex-pected energy not served, in wind power plant configuration type B mechanical components are responsible for 48 %, and at least in wind power configuration type D for about 18 %. On the other hand, failures of mainly electrical components in wind power configuration of type A are responsi-
Fig. 4 Comparison of the EENS caused by failures of individual components of wind power plant for configuration concepts A, B and D
Fig. 6. The comparison of absolute contributions of predominantly mechanical and electrical compo-nents failures of wind power plant, configuration types A, B and D, to EENS
Fig. 5. A comparison of the distribution of EENS of the wind power plant configuration types A, B and D
Eksploatacja i NiEzawodNosc – MaiNtENaNcE aNd REliability Vol.18, No. 2, 2016242
sciENcE aNd tEchNology
ble for about 25 % of the expected energy not served, in wind power plant configuration of type B electrical components are responsible for about 47 %, and in wind power plant configuration type D, they are responsible for as much as 75 %.
The main reason why failures of mechanical components in wind power plant configuration type D have a contribution of only about 18 % to the expected energy not served is that they have not trans-mission gearbox, which is previously described as a component with major contribution to the expected energy not served in wind power plant configuration of type A and also as a component with the second largest contribution to the EENS in wind power plant configuration type B (after the electrical system). Additional reason for mechanical components have such neglected cause of total failures in wind power plant configuration D is that the wind power plant configuration type D, as already stated, has no hydraulic but rather electric actuators (for example in rotor blades control position system). Finally, the wind power plant configuration type D has no hydraulic system and there-
fore there are no contributions of the component failures on EENS.
On the other hand, the reason why failures of mainly electrical components of the wind power plant configuration type D are responsible for about 75 % of the EENS is that the hydraulic actuators have been replaced by electric. In this case, wind power plant configuration type D have synchronous generators that have lower rotating speed, which means increasing number of pole pairs and increasing number of electric windings – according to [31], it might be one reason for the higher intensity downtime of generators and electrical systems. Another reason why the wind power plants configuration type D have signifi-cant contribution of failures of electrical compo-nents in overall expected EENS, is that they have converters with full frequency regulation, unlike other types of wind power converters.
Wind power plants configuration type B have a fairly uniform contribution to expected energy not served due to failures of mechani-cal components, as well as to failures of electric components. Unlike wind power plant configura-
tion type D, the wind power plant configuration type B have a gearbox, as well as the hydraulic system, so these are reasons why failures of me-chanical components have a greater contribution to the expected energy not served. On the other side, the wind power plants, configuration type B have no electric actuators in a system such as rotation of wind power plant or in the system for the rotation of the rotor blades. Wind power plant configuration type B has induction generator with slip rings, which is more robust than generators in wind power plant configuration type D, with-out converter and frequency controlling unit, and these are the reasons why it has smaller contribu-tion to expected energy not served, due to failures of electrical components in relation to the wind power plants configuration type D.
Wind power plants configuration type A has the highest EENS caused by failures of mainly mechanical components. One reason is that wind power plants configuration Type A have gear-box similar as wind power plants configuration type B whose failures have quite significant con-
tribution to EENS. Furthermore, it can be noted that the significant contribution to EENS have failures of rotor and rotor blades from all mechanical components. Wind power plants configuration type A op-posed to the wind power plants configuration type B and D, have the power regulation by intentionally loosing of wind speed achieved by aerodynamic design of the rotor blades (stall control). In this case, there is no possibility for the regulation of the angle of the rotor blades, causing increase of mechanical forces and stresses of the rotor blades. This may be the reason for a greater contribution of mechani-cal components failure to the EENS. On the other hand, the reason why the wind power plant configuration type A has the smallest con-tribution of electric components failures to EENS (both in absolute and relative amount) may be that this type of configuration has a quite robust squirrel-cage induction generator and also there are no power electronic components (frequency converter).
Fig. 7. Comparison of relative contribution to EENS, caused by mechanical and electrical components of the wind power plants of all analysed configuration types (A, B and D)
Fig. 8. Shares of failure rates of mechanical and electric components in the overall failure rates for wind power configuration types A, B and D

Eksploatacja i NiEzawodNosc – MaiNtENaNcE aNd REliability Vol.18, No. 2, 2016 243
sciENcE aNd tEchNology
References
1. Abul'Wafa A R. Reliability/cost evaluation of a wind power delivery system. Electric Power Systems Research 2011; 81: 873-879, http://dx.doi.org/10.1016/j.epsr.2010.11.028.
2. Ackermann, T. Wind Power in Power Systems. Wiley, 2005, http://dx.doi.org/10.1002/0470012684.3. Arabian-Hoseynabadi H, Oraee H, Tavner P J. Wind turbine productivity considering electrical subassembly reliability. Renewable Energy
2010; 35: 190-197, http://dx.doi.org/10.1016/j.renene.2009.04.014.4. Attwa Y M, El-Saadany E F. Wind Based Distributed Generation; Uncertainties and planning Obstacles. Proceedings of IEEE Power
Engineering Society General Meeting, Tampa, USA, June 2007: 1–5, http://dx.doi.org/10.1109/pes.2007.385800.5. Billinton R, Bagen. A Sequential Simulation Method for the Generating Capacity Adequacy Evaluation of Small Stand - Alone WECS. IEEE
Proceedings of Canadian Conference on Electrical and Computer Engineering 2002; 1: 72-77.6. Billinton R, Chen H, Ghajar R. Time-series models for reliability evaluation of power systems including wind energy. Microelectronics
Reliability 1996; 36: 1253-1261, http://dx.doi.org/10.1016/0026-2714(95)00154-9.7. Billinton R, Gao Y. Multistate Wind Energy Conversion System Models for Adequacy Assessment of Generating Systems Incorporating
Wind Energy. IEEE Transactions on Energy Conversion 2008; 23: 163-170, http://dx.doi.org/10.1109/TEC.2006.882415.8. Billinton R, Hua C, Ghajar R. A sequential Simulation Technique for Adequacy Evaluation of Generating Systems Including Wind Energy.
IEEE Transactions on Energy Conversion 1996; 11: 728-734, http://dx.doi.org/10.1109/60.556371.9. Castro Sayas F, Allan N R. Generation availability assessment of wind farms. IET Generation, Transmission and Distribution, 1996; 143;
507-518, http://dx.doi.org/10.1049/ip-gtd:19960488.10. D'Annunzio C, Santoso S. Wind power generation reliability analysis and modelling. Proceedings of IEEE Engineering Society General
Meeting, San Francisco, USA, 2005; 35-39.11. Deshmukh R G, Ramakumar R. Reliability Analysis of combined wind-electric and conventional generation systems. Solar Energy 1982;
28; 345-352, http://dx.doi.org/10.1016/0038-092X(82)90309-7.12. Ehsani A, Fotuhi M, Abbaspour A, Ranjbar A M. An Analytical Method for the Reliability Evaluation of Wind Energy Systems. Proceedings
of IEEE Region 10 TENCON, Melbourne, Australia, November 2005; 1-7, http://dx.doi.org/10.1109/tencon.2005.300832.13. Faulstich S, Lyding P, Tavner P J. Effects of Wind Speed on Wind turbine Availability. Proceedings of EWEA 2011, Brussels, Belgium,
March 2011.14. Giorsetto P, Utsurogi K F. Development of a new procedure for reliability modeling of wind turbine generators. IEEE Transactions on Power
Apparatus and Systems 1983: 134-143, http://dx.doi.org/10.1109/TPAS.1983.318006.15. Haghifam M R, Omidvar M. Wind Farm Modeling in Reliability Assessment of Power System. Proceedings of International Conference on
Probabilistic Methods Applied to Power Systems, Stockholm, Sweden, June 2006: 1-5, http://dx.doi.org/10.1109/pmaps.2006.360414.16. Hahn B, Durstewitz M, Rohrig K. Reliability of wind turbines - Experiences of 15 years with 1500 WTs. (Institut für Solare
Energieversorgungstechnik (ISET), Verein an der Universität Kassel, Kassel), Germany, 200617. International Energy Agency. www.iea.org, accessed November 201218. Jaeseok C, Jeongje P, Kyeonghee C, Taegon O, Shahidehpour M. Probabilistic Reliability Evaluation of Composite Power Systems Including
Wind Turbine Generators. Proceedings of International Conference on Probabilistic Methods Applied to Power Systems, Singapore, Singapore, June 2010: 802-807.
19. Kaigui X, Billinton R. Energy and reliability benefits of wind energy conversion systems. Renewable Energy 2011; 36: 1983–1988, http://dx.doi.org/10.1016/j.renene.2010.12.011.
20. Karaki S H, Chedid R B, Ramadan R. Probabilistic Performance Assessment of Wind Energy Conversion Systems. IEEE Transactions on Energy Conversion 1999; 14: 217-224, http://dx.doi.org/10.1109/60.766986.
21. Karki R, Billinton R. Cost-Effective Wind Energy Utilization of Reliable Power Supply. IEEE Transactions on Energy Conversion 2004; 19: 435-440, http://dx.doi.org/10.1109/TEC.2003.822293.
22. Karki R, Hu P, Billinton R. Reliability Evaluation of a Wind Power Delivery System Using an Approximate Wind Model. Proceedings of the 41st International Universities Power Engineering Conference, Newcastle, UK, September 2006: 113-117, http://dx.doi.org/10.1109/UPEC.2006.367726.
23. Karki R, Hu P. Wind Power Simulation Model for Reliability Evaluation. Proceedings of Canadian Conference on Electrical and Computer Engineering, Saskatoon, Canada, May 2005: 541-544, http://dx.doi.org/10.1109/ccece.2005.1556988.
24. Leite A P, Borges C L T, Falcao D M. Probabilistic Wind Farms Generation Model for Reliability Studies Applied to Brazilian Sites. IEEE Transactions on Power Systems 2006; 21: 1493-1501, http://dx.doi.org/10.1109/TPWRS.2006.881160.
25. Liang W, Jeongje P, Jaeseok C, El-Keib A A, Shahidehpour M, Billinton R. Probabilistic Reliability Evaluation of Power Systems Including Wind turbine Generators Using a Simplified Multi State Model: A case Study. Proceedings of IEEE Power & Energy Society General Meeting, Calgary, Canada, July 2009: 1-6.
26. Manco T, Testa A. A Markovian Approach to Model Power Avaliability of a Wind Turbine. Proceedings of IEEE Power Tech, Lausanne, Switzerland, July 2007: 1256-1261.
27. Peng W., Billinton R. Reliability Benefit Analysis of Adding WTG to a Distribution System. IEEE Transactions on Energy Conversion 2001; 16: 134-139, http://dx.doi.org/10.1109/60.921464.
28. Renewables 2013 – Global Status Report. http://www.ren21.net, accessed January 201429. Ribrant J, Bertling L. Survey of Failures in Wind Power Systems With Focus on Swedish Wind Power Plants During 1997 – 2005. IEEE
Transactions on Energy Conversion 2007; 22: 167-173, http://dx.doi.org/10.1109/TEC.2006.889614.30. Ribrant, J. Reliability performance and maintenance - A survey of failures in wind power systems, Stockholm: Master thesis, KTH School
of Electrical Engineering, 2006.31. Spinato F, Tavner P J, Van Bussel G J W, Koutoulakos E. Reliability of wind turbine subassemblies. IET Renewable Power Generation 2008;
3: 387-401, http://dx.doi.org/10.1049/iet-rpg.2008.0060.

Eksploatacja i NiEzawodNosc – MaiNtENaNcE aNd REliability Vol.18, No. 2, 2016244
sciENcE aNd tEchNology
32. Tavner P J, Greenwood D M, Whittle M W G, Gindele R, Faulstich S, Hahn B. Study of weather and location effects on wind turbine failure rates. Wind Energy 2012; 16: 175-187, http://dx.doi.org/10.1002/we.538.
33. Tavner P J, Xiang J, Spinato F. Reliability Analysis for Wind Turbines. Wind Energy 2007; 10: 1-18, http://dx.doi.org/10.1002/we.204.34. Wang X, Dai Hui Z, Thomas R J. Reliability Modeling of Large Wind Farms and Associated Electric Utility Interface Systems. IEEE
Transactions on Power Apparatus and Systems 1984: 569-575, http://dx.doi.org/10.1109/TPAS.1984.318746.35. Windstats. www.windstats.com, accessed November 2010.
danijel topićFaculty of Electrical Engineeringjosip juraj Strossmayer University of osijekUlica kneza Trpimira 2b, 31000 osijek, croatia
damir ŠljivacFaculty of Electrical Engineeringjosip juraj Strossmayer University of osijekUlica kneza Trpimira 2b, 31000 osijek, croatia
marinko stojkovMechanical Engineering Facultyjosip juraj Strossmayer University of osijekTrg ivane Brlić Mažuranić 2, 35000 Slavonski Brod, croatia
E-mail: [email protected], [email protected], [email protected]