Embed Size (px)
Citation preview

Graduate Theses, Dissertations, and Problem Reports
2010
Relationships of developmental traits in young alpaca crias and Relationships of developmental traits in young alpaca crias and
lambs lambs
Sara Elizabeth Lewis West Virginia University
Follow this and additional works at: https://researchrepository.wvu.edu/etd
Recommended Citation Recommended Citation Lewis, Sara Elizabeth, "Relationships of developmental traits in young alpaca crias and lambs" (2010). Graduate Theses, Dissertations, and Problem Reports. 3022. https://researchrepository.wvu.edu/etd/3022
This Thesis is protected by copyright and/or related rights. It has been brought to you by the The Research Repository @ WVU with permission from the rights-holder(s). You are free to use this Thesis in any way that is permitted by the copyright and related rights legislation that applies to your use. For other uses you must obtain permission from the rights-holder(s) directly, unless additional rights are indicated by a Creative Commons license in the record and/ or on the work itself. This Thesis has been accepted for inclusion in WVU Graduate Theses, Dissertations, and Problem Reports collection by an authorized administrator of The Research Repository @ WVU. For more information, please contact [email protected].
Relationships of developmental traits in young alpaca crias and lambs
Sara Elizabeth Lewis, B.S.
Thesis submitted to the Davis College of Agriculture, Natural Resources, and Design
at West Virginia University in partial fulfillment of the requirements
for the degree of
Master of Science In
Reproductive Physiology
Eugene Felton, PhD., Chair E. Keith Inskeep, Ph.D., Co-chair
David Moran, Ph.D. Melanie Clemmer, Ph.D.
Phil Turk, Ph.D.
Division of Animal and Veterinary Sciences
Morgantown, WV 2010
Keywords:
Weight, girth, rumen development, ultrasound
Abstract
Relationships of developmental traits in young alpaca crias and lambs
Sara Elizabeth Lewis
Successful reproduction in alpacas is highly dependent upon postnatal survival, which in turn is dependent upon a pattern of continuous gain in weight as an indicator of health. Weighing alpacas is the primary method used to assess their general health. Unfortunately, the measurement of cria weight is not always a simple, routine, or easy determination. The purpose of this study was to determine if, as in other species such as cattle and horses, morphometric body measurements can be used to estimate weight. In this study, continuous weight and girth measurements were taken on 34 alpaca cria. Age and girth were shown to be good predictors of weight in male and female Suri alpaca. However, in Huacaya alpaca, girth did not account for much variation not accounted for age in either male or female cria. This could have been due to the small sampling size of Huacaya alpaca. Overall, girth could be used in a predictive equation to estimate weight; individual relationships exist for males and females of the same breed and therefore the equations for the sexes would be different. Early rumen development will affect body weight measures as rumen volume changes and may need to be considered. Rumen development and functionality was examined via ultrasonography and fecal sampling in nine lambs of comparable ages. Rumen area and volume, as determined from ultrasonographic measurements, increased with time with a somewhat more rapid increase in growth occurring between days 40 and 50 of age. In vitro true digestibility of fecal samples decreased, demonstrating that the lambs’ own ability to digest fiber increased over the sampling period. Tracking rumen development via ultrasound is a feasible method. The fecal sample data supported the conclusions drawn from the ultrasound images. However, fecal fiber analysis is still a better method to track rumen maturity. With possible improvement to the ultrasound method and more practice, this method could be used to track rumen maturity.
iii
Table of Contents
Abstract………………………………………………………………………………….ii List of Figures……………………………………………………………………………v List of Tables………………………………………………………………………..........vii Acknowledgements………………………………………………………………………..1 Statement of the Problem…………………………………………………………………..2 Introduction………………………………………………………………………………..3 Review of Literature……………………………………………………………………….5
A. Morphometric Data and correlations with body weight ………………………5
I. Heart girth and body weight…………………………………………………5 II. Heart girth, body weight, and other morphometric measures ………………9 III. Morphometric measurements and other species ………………………….12 IV. Practical application of morphometric data……………………………….15 B. Rumen Development in Sheep………………………………………………...16
I. Morphological development of the rumen…………………………………..17
i. Phase 1: 0 to 3 Weeks of Age…………………………………………….17
ii. Phases 2 & 3: 3-8 weeks of age & 8 plus weeks of age………………….18
II. Metabolic development……………………………………………………..22
i. Carbohydrase enzyme development……………………………………...22
ii. pH, ammonia Nitrogen (N) production, VFA production………………..23
iii. VFA production and ketogenic activity…………………………………..26
III. Microbial effects on development…………………………………………...29

iv
Materials and Methods………………………………………………………………….33 Cria Data Collection…………………………………………………………….33 Rumen Development via Ultrasound…………………………………………...33 Feed and Fecal Sample Analysis………………………………………………..34 Results…………………………………………………………………………………..35
Cria data………………………………………………………………………...35
Rumen Development……………………………………………………………36
Discussion………………………………………………………………………………48 Conclusions…………………………………………………………………...54
Literature Cited………………………………………………………………55

v
List of Figures
Figure 1. Line graph depicting the regression lines of heart girth measurements on weights of beef cattle………………………………………………………………………………………….6 Figure 2. Line graph depicting the regression of body weight on heart girth measurement of dairy bulls………………………………………………………………………………………………..6 Figure 3. Scatter plots of body weight estimations as determined by hipometer and electronic scale or by heart girth tap and electronic scale…………………………………………………..12 Figure 4. Line graph depicting mean wet and oven-dry rumen weights for lambs ages 7 to 57 days……………………………………………………………………………………………...19 Figure 5. Line graph depicting milligrams of stomach dry matter per 100 Gm body weight…..19 Figure 6. Effect of girth and age when used as predictors of body weight in female Suri alpaca from the Crimson Shamrock Ranch. Age is shown in days, girth in centimeters, and predicted weight in kilograms……………………………………………………………………………..38 Figure 7. Effect of girth and age when used as predictors of body weight in female Huacaya alpaca from the Crimson Shamrock Ranch. Age is shown in days, girth in centimeters, and predicted weight in kilograms. Girth was not shown to have additional value as a predictor of weight when age was in the model……………………………………………………………..39 Figure 8. Effect of girth and age when used as predictors of body weight in male Suri alpaca from the Crimson Shamrock Ranch. Age is shown in days, girth in centimeters, and predicted weight in kilograms.…………………………………………………………………………….40 Figure 9. Effect of girth and age when used as predictors of body weight in female Suri alpaca from the Orchard Hill Alpaca farm. Age is shown in days, girth in centimeters, and predicted weight in kilograms……………………...……………………………………………………...41 Figure 10. Effect of girth and age when used as predictors of body weight in female Huacaya alpaca from the Orchard Hill Alpaca farm. Age is shown in days, girth in centimeters, and predicted weight in kilograms. Girth was not shown to have additional value as a predictor of weight when age was in the model………………..……………………………………………42 Figure 11. Effect of girth and age when used as predictors of body weight in male Suri alpaca from the Orchard Hill Alpaca farm. Age is shown in days, girth in centimeters, and predicted weight in kilograms……………………...……………………………………………………...43

vi
Figure 12. Effect of girth and age when used as predictors of body weight in male Huacaya alpaca from the Orchard Hill Alpaca farm. Age is shown in days, girth in centimeters, and predicted weight in kilograms. Girth was not shown to have additional value as a predictor of weight when age was in the model………………………………………………………………44 Figure 13. Line graph depicting the least squares means for rumen area for lambs 17 to 61 days of age…………………………………………………………………………………………….45 Figure 14. Line graph depicting the least squares means for rumen volume for lambs 17 to 61 days of age……………………………………………………………………………………….46 Figure 15. Line graph depicting the least squares means for percent in vitro true digestibility on fecal samples from days 39 to 61………………………………………………………………..47

vii
List of Tables Table 1. Regression equations: logarithms for estimating weight of beef cattle………………...7 Table 2. Equations for estimation of weight from girth and length measurements in horses……14 Table 3. Rumino-reticulum function and organ size measurements in lambs fed differing diets………………………………………………………………………………………………21

1
Acknowledgements
I would like to thank all of my committee members for their guidance, patience, and help
throughout this project. A special thanks to Dr. Inskeep and Dr. Felton for allowing me to
combine two of my interests into one project. Especial thanks to David Moran for introducing
me to the world of camelids and all his encouragement and help throughout the past eight years.
Thanks to Crimson Shamrock ranch and Orchard Hill Alpacas, who all allowed me access to
their animals for my project. Without their cooperation, none of this would have been possible.
Thanks to Dr. Turk for the statistical work. I would also like to thank my fellow graduate
students for their friendship, help, and commiseration throughout this whole academic
experience. A special thanks to Todd Ramboldt and the veterinary techs at the university farm
for their help, humor, and support during the ultrasonography portion of the project. Finally, I’d
like to thank my family, especially my parents, for their support and love during both my
undergraduate and graduate careers.

2
Statement of the Problem
It has been established that relationships exist between morphometric
measurements and body weight in several species, including cattle and horses. While many
measurements are correlated with body weight, heart girth is one measurement that is more
highly correlated with weight than other measurements. Additions of other measures to heart
girth can yield equations that will predict body weight more accurately than using heart girth
alone. The purpose of the study was to examine the relationship between heart girth and weight
in alpaca cria.
Rumen development will affect body weight measures as rumen volume changes.
Development of the rumen in young lambs has been demonstrated by changes in morphology,
microbial populations, and feed utilization. However, developmental changes have not been
tracked through the use of ultrasound. Therefore, the purpose of the study was to examine
whether development of the lamb rumen could be assessed via ultrasonography. Determination
of digested fiber from fecal and fiber samples will help validate ultrasonography results.

3
Introduction
Successful reproduction in alpacas is highly dependent upon postnatal survival, which in
turn is dependent upon a pattern of continuous gain in weight as an indicator of health.
Weighing alpacas is the primary method used to assess their general health. Monitoring weight
is especially important in alpaca offspring or crias. When crias are born, their weight is
measured and tracked from birth throughout their first month of life to assess their growth and
vitality. Weight loss, failure to gain weight, or a plateau in weight gain early in postnatal life is
generally indicative of some problem, related to either milk supply or other health concerns.
Unfortunately, the measurement of cria weight is not always a simple, routine, or easy
determination. Alpaca cria are energetic animals that can kick and wiggle endlessly, making the
weight determination difficult and variable. An additional issue is that the weighing of a cria is a
significant stressor on the animal; separation and placement into an unfamiliar environment can
cause stress for the cria. This stress is imposed on the cria at exactly the time when a stress-free
environment may be critical to cria-mother bonding, the mother’s milking receptivity, and the
cria’s digestive capability. Traditionally, a cria is either measured on a digital scale or put in a
sling for a hanging scale measurement.
A possible way to avoid undue stress would be to use other objective body measurements
in order to obtain an accurate estimation of weight. Significant relationships have been found
between certain morphological data and animal body weight in several species including cattle,
sheep, goats, horses, and other wildlife. Across species, heart girth is often the measurement
found to be correlated most highly with weight. From this relationship, weight tapes for cattle
and horses have been developed. The following literature review focuses on the relationships

4
between morphometric data and body weight as well as rumen development, one of the major
components of body weight in immature, growing ruminants.

5
Review of Literature
Objective body measurements have often been used to study growth. During these
growth studies, significant relationships have been discovered between certain morphometric
data and animal body weight. Frequently, these relationships have been used to estimate an
animal’s body weight in the absence of weight scales. Across species, heart girth is often the
measurement found to be most highly correlated with weight. One way to estimate weight has
been through the use of a weight tape. Weight tapes were developed from the relationship
between an animal’s heart girth and its weight. These tapes have proven valuable when the
taking of actual body weight measurements is not possible in certain production settings. Tapes
have been developed for many livestock species including cattle, both beef and dairy, and horses.
Additionally, relationships between heart girth and weight have been investigated in sheep,
goats, and wildlife species such as white-tailed deer.
A. Morphometric data and correlations with body weight
I. Heart girth and body weight
Beginning in the early 1940s, the relationship between heart girth and weight was
investigated in several breeds of cattle. Heart girth is measured by placing a measuring tape
around the chest circumference, just behind the forelegs with the tape pulled tight enough to keep
the hair down, but not so tight that it indented the flesh. In Aberdeen-Angus and Hereford
steers and Aberdeen-Angus heifers and cows, the correlation coefficients between heart girth and
weight were 0.89, 0.91, and 0.93 respectively (Wanderstock and Salisbury, 1946). In mature
Holstein and Guernsey bulls a similar relationship was found; the coefficients of correlation
between heart girth and weight were 0.954 and 0.958, respectively and 0.976 for both breeds
6
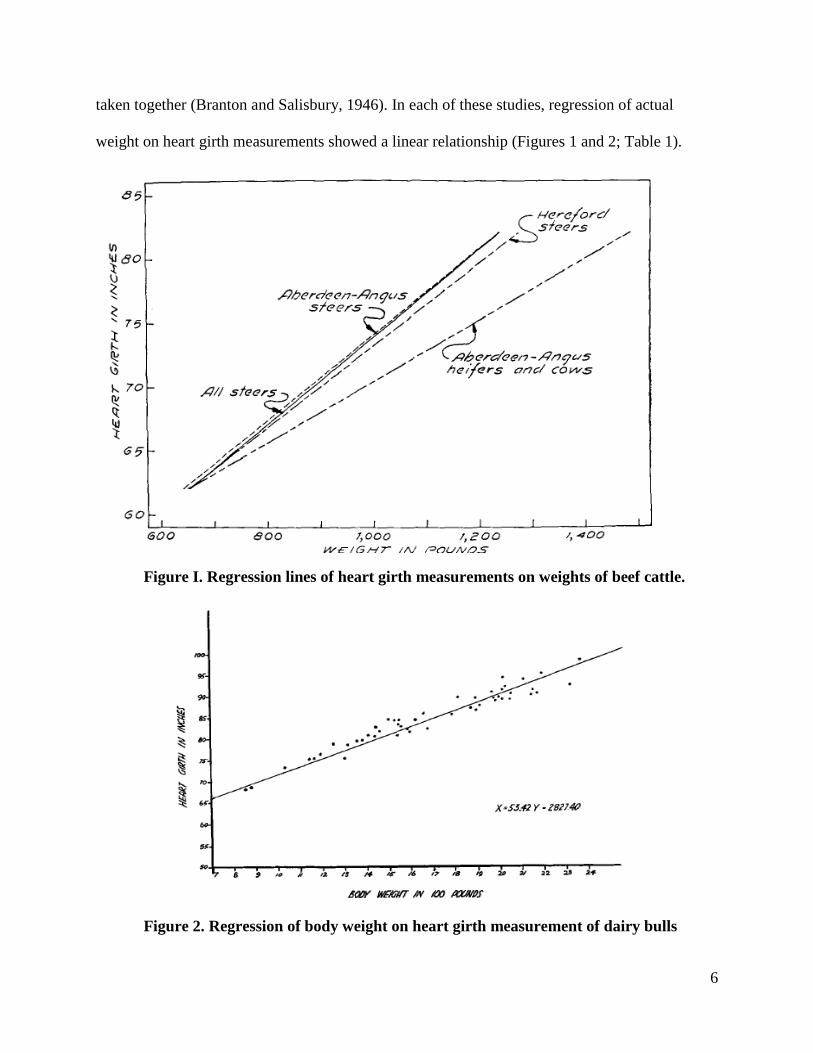
taken together (Branton and Salisbury, 1946). In each of these studies, regression of actual
weight on heart girth measurements showed a linear relationship (Figures 1 and 2; Table 1).
Figure I. Regression lines of heart girth measurements on weights of beef cattle.
Figure 2. Regression of body weight on heart girth measurement of dairy bulls

7
Table 1. Regression equations: Logarithms for estimating the weight of beef cattle.
More specifically in the study by Branton and Salisbury (1946), the equation for the line was X=
53.42Y – 2827.4, where X was the calculated estimate of weight and Y was the measured heart
girth. From this linear relationship, the standard error of the line was 83.8 pounds or 5.05% of
the mean; this error rate indicates that the estimates were very accurate.
When the heart girth / weight relationship was examined in modern Holstein heifers, it
was determined that comparison of true body weights with range of body weights as predicted
from heart girth measurement showed that there was a less than 8% difference between real and
predicted body weight. This small difference allows for a reasonable estimation of body weight
by examining heart girth (Heinrichs et al., 2007).
Heart girth and weight are found to be correlated not only in cattle but also in sheep and
goat breeds as well. Atta and El Khidir (2004) examined the use of heart girth for predicting
body weight in male and female Nilotic lambs from birth to eight months of age. Data were used
to predict weight based on the equation y = axb , where y is the body weight, x is the heart girth, a
is a constant, and b is the regression coefficient. For male lambs, the regression coefficient of
body weight (Y) on heart girth (X) was 0.98 and the resulting equation was Y= 0.00017X2.87. In
female lambs, the regression coefficient of body weight on heart girth was 0.96 and the resulting

8
equation was Y= 0.0011X2.41. The equations represent non-linear regressions. Analysis of the
data showed that heart girth had a great accuracy of prediction.
Similarly, Kuene et al. (2009) determined a prediction equation for estimating body
weight in Nguni sheep of different ages by measuring heart girth. The regression model used
was Y= b0 + b1Xik +b2X2ik + b3X3
ik + ei, where Y is the observation on live weight, b0 is the
intercept, b1, b2, b3 are the corresponding linear, quadratic, and cubic regression coefficients, Xik
is the body measurements k on the ith animal, and ei is the residual. The results showed that
estimating live weight in young animals (< 15 months) is best when using an equation of cubic
polynomial heart girth. In older animals, linear regression of heart girth was a better estimator of
live weight.
Live weight estimations from heart girth also can be used in commercial sheep and goat
herds. Olatunji-Akioye and Adeyemo (2009) studied animals from each of three Nigerian
commercial sheep and goat herds, all raised under varying production conditions. The resulting
predictive equations for bodyweight in the three sheep flocks were as follows: Flock 1 W=18.59
+ (0.36)CG; Flock 2 W=22.4 + (0.29)CG; Flock 3 W=20.4 + (0.32)CG. R2 values for each group
were 0.80, 0.39, and 0.78 respectively. The predictive equations for bodyweight in the three goat
herds were as follows: Group1 (W= 18.51+ (0.31)CG); Group 2 (W= 20.03 + (0.20)CG); Group
3 (W= 20.71+ (0.28)CG). R2 values for each group were 0.76, 0.40, and 0.05 respectively.
These equations were able to accurately predict body weight in 80% of the sheep, and only 50-
76% of the goats. The authors concluded that the reason for this was that some of the goats were
underweight and hidebound; for these animals, a different equation would have to be developed
to reduce the overestimation of weight.

9
As discussed above, heart girth and weight are highly correlated for both beef and dairy
cattle as well as sheep and goats. This means that the heart girth measurement can be used to
accurately predict body weight. The equation demonstrating the relationship between heart girth
and weight might be slightly different in mature versus growing animals; however, the
relationship still exists and can be used when actual weights cannot be determined.
II. Heart girth, body weight, and other morphometric measures
While the most highly correlated morphological measure to weight, in species tested thus
far, is heart girth, there are several other measures that can be associated with the estimation of
body weight. These other components can help in reducing the over- and under- estimations of
body weight that might occur with using chest girth alone. One such component of weight
estimation is body condition score (BCS), which estimates body fat, a component of overall
animal body weight. While sometimes referred interchangeably with body weight, body
condition score is a subjective measurement while actual body weight is a quantitative
measurement (Kertz et al., 1997). There are positive relationships among BCS, weight, hip
height, and heart girth within a cattle breed for individuals from a similar background (Nelson et
al., 1985).
Nelson and collegues (1985) determined the correlations among weight, hip height, heart
girth, and body condition scores for Hereford and crossbred cows. Weight, height, and heart girth
were highly and positively correlated with each other. Positive correlation was seen between
weight and BCS and between heart girth and BCS. These correlations were greater than those
between weight, BCS, and heart girth. A height-body condition score correlation was seen for
Hereford cattle but not for crossbred cattle (Nelson et al., 1985). Although weight and condition
score were highly correlated, this association was not as great as the association between heart

10
girth and weight. Therefore, estimating body condition is less accurate than using heart girth
measurements to estimate live weight.
Similarly, Mäntysaari and Mäntysaari (2008) evaluated the relationships among heart
girth, wither height, body length, body condition score and body weight in Finnish Ayshire cows.
Heart girth was measured as described previously, while body length was measured horizontally
from the highest point of the shoulder to the pin bone. As seen in previous studies, heart girth
was the measurement found to be most highly correlated to body weight. Body length also was
highly correlated to body weight (0.67 to 0.71 for different parity groups). The lowest
correlation was found between wither height and body weight.
When age of the cow was taken into consideration, age was correlated positively to body
weight and body measurements for both younger and older cows (753 to 1203 days old and 1203
to 2839 days old, respectively). The positive correlation between body condition score and body
weight was stronger for older than for younger cows. Linear regression of heart girth alone was
able to estimate body weight accurately, but the predictive value of the model was improved
slightly when body length was included in the model. However, if only heart girth was
available, body condition score should be considered in predicting weight of older cows.
Body weight is an important indicator of cumulative growth. Standards of growth have
changed over time as breed genotypes have changed. To determine if using more than one body
measurement to estimate weight in modern Holstein heifers was better than older relationship
indicators based on body measurements, Heinrichs, Rogers, and Cooper (1992) measured wither
height, body weight, hip width, heart girth, and body length. Regression analysis of body weight
on the various body measurements showed that heart girth and hip width were highly correlated
with body weight. The regression equation of body weight (kg) on heart girth (cm) was Y=

11
65.36 – 1.966X + 0.1959X2 + 0.00001691X3 with an R2 value of 0.9873. The equation for body
weight on hip width was Y= -70.98 + 6.269X – 0.01261X2 + 0.00240003X3 with an R2 value of
0.9806. While these two measurements were more highly correlated with weight than any of the
other measures, all measures were found to accurately predict body weight (Heinrichs et al.,
1992).
Other measures, specifically heart girth, wither height, and body weight, are relatively
easy to measure and are good indicators of growth. Wither height and hip width may be good
indicators of skeletal growth because they are not influenced by body condition (Heinrichs et al.,
1992). Body weight measurements are often not just measurements of fat. Body weight
encompasses many things including skeletal size, body fat, and gut fill (Enevoldsen and
Kristensen, 1997). Body measurements that are taken to estimate body weight should take these
things into consideration. Measurements that can be used in this fashion include hip height and
width, wither height, and estimates of body condition score. Hip width is probably the best
predictor of body weight out of all these measurements; this body dimension is developed last
and has the most variation of all the other measurements (Enevoldsen and Kristensen, 1997).
One way that hip width can be measured is with a hipometer. This tool measures the
width between the hip joints at the point of the greater trochanters of the femurs in cattle
(Dingwell et al., 2006). In modern dairy production systems, producers often believe that
weighing
their animals is too time consuming and costly. Therefore, they would like to use a less work
intensive and cheaper way to measure body weight. To determine if a hipometer or a heart girth
tape was better as a less time consuming, cheaper method of estimating body weight, Holstein
calves and heifers of differing ages were evaluated using both methods. Overall, actual mean

12
weights (261 ± 124 kg) were not significantly different from overall mean weights as measured
by the heart girth tape (258 ± 118 kg) or the hipometer (254 ± 123 kg) (Dingwell et al., 2006).
Scatter plots of body weight estimations determined by hipometer and heart girth tape on scale
weight both showed linear relationships (Dingwell et al., 2006; Figure 3). When age differences
were taken into account, the hipometer and heart girth tape measurements were closely related to
the scale measurement of body weight. While scale measurement of body weight remains the
best measurement, hipometers and heart girth weight tapes can be used in lieu of actual
measurements to save time and money.
Figure 3. Scatter plots of body weight estimations as determined by hipometer and electronic scale or by heart girth tape and electronic scale. III. Morphometric measurements and other species
Not only are objective body measurements important to producers in estimating weight in
cattle, sheep, and goats to save time and money, they are also important in several other species
as well. Objective body measurements have been used to estimate weight in horses and wildlife
species including white-tailed deer, mountain goats, and grizzly bear (Smart et al., 1973; Rideout
and Worthen, 1975; Nagy et al. 1984).
Over the years, several groups have investigated the relationship between heart girth,
other body measurements, and weight in horses. Each of the following groups looked at the

13
current methods for estimating weight and determined if any modifications might yield a better
method to estimate weight. Milner and Hewitt (1969) used current methods and subsequently
developed their own equations. The first equation developed was: Estimated weight = (Girth1.97
X Length1.05) / 241.3 and the second one was: Estimated weight = (Girth2 X Length) / 228.1.
Compared to other formulas and weight tapes at the time, these two equations were found to be
better, because they used more information to estimate weight, such as the length measurement.
The authors concluded that using a length measurement along with girth can estimate a horse’s
weight within a smaller margin of error than previous methods that used only girth (Milner and
Hewitt, 1969).
Similarly, Carroll and Huntington (1988) added additional measurements, including
wither height and body condition score, to their study using various breeds, sexes, and sizes of
horses. They determined that all these measurements were highly correlated with weight, but that
a squared girth and length relationship was more highly correlated with weight. From their
results they too created their own equation for estimating weight: Weight (kg) = [chest girth2
(cm) X Length (from the point of the shoulder to the tuber ischii) (cm)] / 11877 (Carroll and
Huntington, 1988).
Several authors have examined not only the relationship between morphological
measurements but also the existing formulas and methods to determine their accuracy. Jones and
colleagues (1989) evaluated several methods to determine if they over- or underestimated weight
and if it was possible to create a better method based on their study using horses of various types,
sexes, and liveweights. Of the methods tested, the ‘Bute’ method, which uses a calibrated tape to
measure girth, tended to underestimate weight; the ‘Reckitt Coleman’ method using umbilical
girth and length overestimated weight; the ‘M&B’ method using the formula: weight (kg) =

14
[chest girth2 (in) X shoulder length] / 660 overestimated weight more than the ‘Reckitt Coleman’
method; and the Carroll Huntington method, using the formula shown previously, slightly
underestimated weight. Given those results, the authors created the following equation to
estimate weight in mature horses: weight (kg) = [umbilical girth (cm) 1.78 X length of body to
elbow (cm)0.97] / 3011. In growing horses, their body shape is rapidly changing and may give
different relationships between the bodily measurements and weight (Jones et al., 1989).
Likewise and most recently, Reavell (1999) investigated the accuracy of several methods
for estimating weight in horses. Table 2 shows the main equations examined in the study; length
1 is measured from the tuber ischium to the point of the shoulder and length 2 is measured from
the tuber ischium to the olecranon. The most accurate formulas were determined to be the
Carroll and Huntington (1988) and Jones et al. (1989) formulas. For ponies, the Carroll and
Huntington (1988) formula was best and for larger horses the Jones et al. (1989) formula was
best (Reavell, 1999). Overall, it was determined that in a given situation a weight tape will be an
adequate tool to estimate body weight.
Table 2. Equations for estimation of weight from girth and length measurements.
Traditional formula Weight (lbs) = [Chest girth (ins)2 X Length 1 (ins)] / 300 Carroll and Huntington (1988)
Weight (kg) = [Chest girth (cm)2 X Length 2 (cm)] / 11877
Jones et al. (1989) Weight (kg) = [Umbilical girth (cm)1.78 X Length 2 (cm)1.05 ] / 3011
Animal producers are not the only ones in need of a way to determine body weight based
on objective body measurements. In the early 1950s and 60s, studies were conducted by wildlife
researchers to determine if such relationships existed in wildlife species. Early work led to
mathematical equations for the estimation of body weight in several game species (Smart et al.,
1973). Charles Smart et al. (1973) wanted to determine if heart girth measurements and

15
subsequent estimations of weight were as reliable as actual weight measurements in white-tailed
deer. This effort was trying to circumvent the costs and awkwardness created when animals in
the field were weighed directly. The data showed that, as in livestock species, there was a
correlation between heart girth and body weight, and that different relationships existed for
fawns and adults (Smart et al., 1973). Similar relationships exist for mountain goats (Rideout and
Worthen, 1975) and grizzly bears (Nagy et al. 1984). Subsequently, weight tapes were created
for use by wildlife field researchers.
IV. Practical application of morphometric data
Long before many of the relationships between different body measurements (other than
heart girth) and weight were investigated, heart girth tapes were used to estimate weight.
McDaniel and Legates (1965) used weight determined from heart girth weight tapes as body
weight and investigated weight’s possible association with milk yields and milk fat percentages
in Holstein dairy cows. The authors stated that the weights from the tape were reliable and that
the results were relevant. It was found that larger cows gave more milk and that genetic variance
in body weight was independent of genetic variance in milk yield and fat percentage (McDaniel
and Legates, 1965).
Similarly, other performance traits were examined via objective body measurements in
immature Hereford and Angus bulls. Height at the withers and hips, width of shoulders, hips,
and loin, depth of chest and body at rear flank, heart girth, and body length were all measured
(Brown et al., 1974). These measurements were examined in relation to: test gain, total amount
of feed consumed, feed conversion, and final weight. Regression analysis of the structural
variables on performance variables showed that some of the measurements were correlated to
performance, with some correlated in a negative fashion. For test gain, height at hips was

16
strongly positively correlated while heart girth was strongly negatively correlated. This same
relationship occurred for feed consumed. Heart girth was correlated positively to feed
conversion and negatively to final weight. Generally, body length was not highly correlated with
any of the variables, and it was not correlated at all with some of them (Brown et al., 1974).
Overall, it was concluded that considering these body measurements along with other factors
would help improve evaluation of potential growth performance.
Additionally, being able to appraise growth is important in Holstein heifers. Heinrichs
and Hargrove (1987) appraised growth of the modern Holstein dairy heifer. To achieve this,
they measured height at withers and the heart girth (to use as body weight) on heifers
representing 163 herds. Regression analysis of the data was performed and the quadratic
equations of height and weight on age were computed for each herd (Heinrichs and Hargrove,
1987). It was determined that animals were larger at younger ages than in the past.
Through many studies over the years, scientists have determined that several objective
body measurements are correlated with body weight. These correlations can be useful when
measuring actual body weight is not possible. The most common correlation used is that of heart
girth and body weight. The information garnered from the use of these relationships can be used
in practical settings in terms of predicting performance and growth. Livestock producers and
others can use these relationships when it is neither practical nor economical to take actual body
weight measurements.
B. Rumen Development in Sheep
There are many components of body weight including skeletal development, degree of
fatness, and gut fill (Enevoldsen and Kristensen, 1997). The last component could potentially be
very important in the determination of accurate weights in immature, growing animals. In

17
young ruminants, the development of the forestomach, consisting of the rumen, reticulum and
omasum, is a process that takes several weeks to complete. During this time, the different
compartments change in size and gain functionality. Specifically, in sheep, this process is
divided into three phases: 1.) non-ruminant phase, 2.) transition phase, and 3.) ruminant phase
(Poe et al., 1971). During these three phases, there are changes in the morphology, metabolism,
and bacterial population in the rumen, each of which are necessary for the animal to gain mature
rumen function and can be affected by many factors.
I. Morphological development of the Ovine rumen
i. Phase 1: 0 to 3 Weeks of Age
Ruminal development has often been studied at many stages of physiological
development; the earliest of this development can be seen in utero. The following information
pertains to rumen development seen in the embryo/fetus through birth and the first three weeks
of age. At 23 to 29 days of gestation, the rumen is a tube consisting of two distinct layers
(internal epithelium and external pluripotential blastemic tissue) and the epithelium is
pseudostratified with no secretory capacity (Franco et al., 1992). Days 30-32 show the rumen to
have the beginnings of internal compartments and the wall is now composed of three layers:
stratified epithelium, pluripotential blastemic tissue, and external serosa (Franco et al., 1992).
On day 33, histodifferentiation and vascularization of the pluripotential blastemic tissue takes
place as well as greater cell differentiation (Franco et al. 1992).
On day 42 of development, papilliform projections towards the lumen can be seen
(Franco et al., 1992). Day 46 of development shows the epithelial layers to have nuclei
(Wardrop, 1961) and capillaries are present in the subepithelial blastemic tissue (Franco et al.,
1992). The serosa at this time is highly vascularized (Franco et al., 1992). The lamina propria
18
and submucosa are not separated clearly on day 46 and the muscularis is thin and the layers
cannot be differentiated (Wardrop, 1961). By 53 days, the rumen wall is composed of
epithelium, lamina propria, submucosa, tunica muscularis, and serosa (Franco et al., 1992). Day
57 shows a thickening tunica muscularis and a highly vascularized serosa with some nerve
endings visible; evagination of the epithelium is observed on day 61 (Franco et al., 1992).
On day 70 of development, the basal layer of the epithelium is distinct, and collagen
fibers are visible in the submucosa but not in the propria (Wardrop, 1961). From days 81 to 150
extensive epithelial development occurs. The ruminal papillae become more evident, continue to
grow, and become fully differentiated. The tunica muscularis thickens and two distinct layers
can be observed (Franco et al., 1992). The submucosa is present in each papilla (Wardrop,
1961). After birth, development continues. In newborn lambs, the reticulo-rumen weight is
approximately 29 grams and the volume is 162 milliliters (Garín et al., 2003). At one week of
age, the papillary surface is smooth and epithelial cells are thin and flat (Žitňan et al., 1993).
ii. Phases 2 & 3: 3-8 weeks of age & 8 plus weeks of age
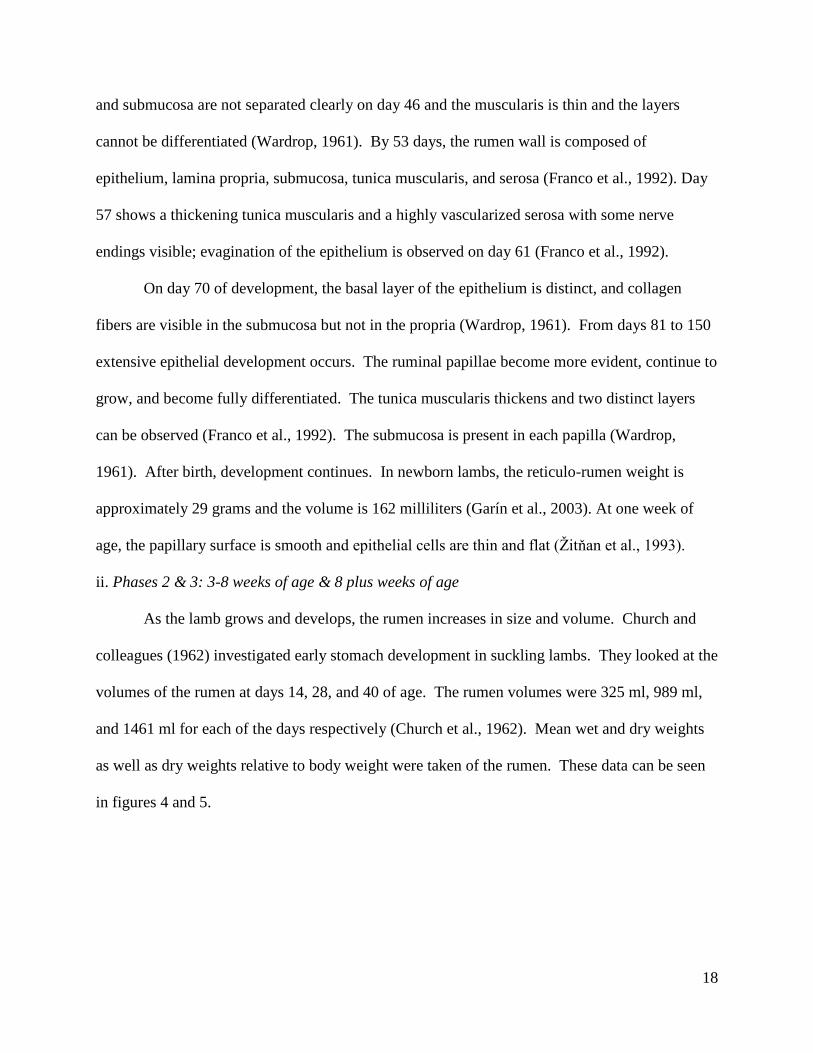
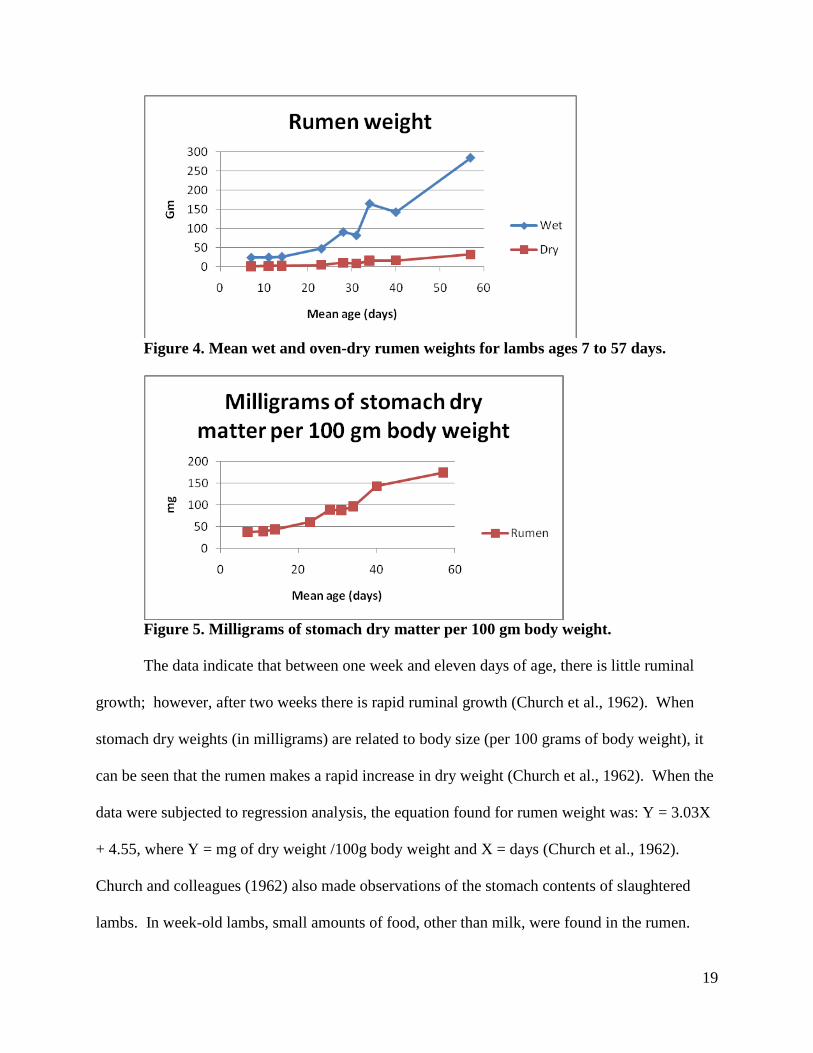
As the lamb grows and develops, the rumen increases in size and volume. Church and
colleagues (1962) investigated early stomach development in suckling lambs. They looked at the
volumes of the rumen at days 14, 28, and 40 of age. The rumen volumes were 325 ml, 989 ml,
and 1461 ml for each of the days respectively (Church et al., 1962). Mean wet and dry weights
as well as dry weights relative to body weight were taken of the rumen. These data can be seen
in figures 4 and 5.
19
Figure 4. Mean wet and oven-dry rumen weights for lambs ages 7 to 57 days.
Figure 5. Milligrams of stomach dry matter per 100 gm body weight.
The data indicate that between one week and eleven days of age, there is little ruminal
growth; however, after two weeks there is rapid ruminal growth (Church et al., 1962). When
stomach dry weights (in milligrams) are related to body size (per 100 grams of body weight), it
can be seen that the rumen makes a rapid increase in dry weight (Church et al., 1962). When the
data were subjected to regression analysis, the equation found for rumen weight was: Y = 3.03X
+ 4.55, where Y = mg of dry weight /100g body weight and X = days (Church et al., 1962).
Church and colleagues (1962) also made observations of the stomach contents of slaughtered
lambs. In week-old lambs, small amounts of food, other than milk, were found in the rumen.

20
Rumen contents began to take on mature characteristics in terms of appearance and odor between
11 and 14 days of age. However, some of the lambs still exhibited milk curds at 14 days of age.
When in vitro digestion was examined, there was insufficient data from lambs at 7 days of age,
while data indicated that at 11 days of age, dry matter digestion was normal. Cellulose digestion
increased between 11 and 23 days of age and remained unchanged thereafter (Church et al.,
1962).
Normal growth and rate of development of the rumen is dependent on the type of diet
fed. When animals are fed solely on milk, development can be delayed. Swan and Groenewald
(2000) investigated the physical and ultrastructural changes of the rumino-reticulum in lambs fed
two different diets. The dietary treatment was broken down into three phases. During phase I,
all lambs received milk replacer for two weeks (M). During phase II, one group was kept on
milk replacer (M) while the other group was provided with a standard diet of hay (H). Both
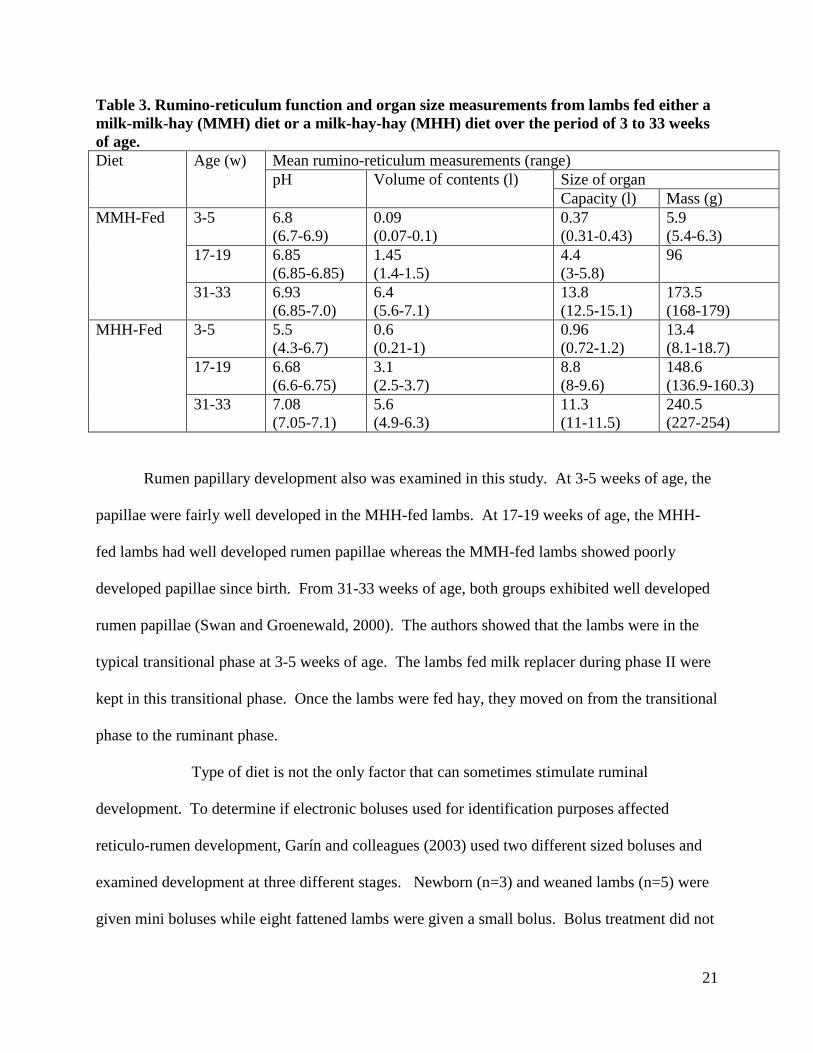
groups were given hay during phase III (Swan and Groenewald, 2000). Table 3 shows the
results of their experiment.
Development was delayed in milk-milk-hay (MMH) fed lambs compared to milk-hay-
hay (MHH) fed lambs up to 17-19 weeks of age. From that time period up to 33 weeks of age,
the MMH-fed lambs showed an increase in the volume of contents and capacity compared to the
MHH-fed lambs (Swan and Groenewald, 2000).
21
Table 3. Rumino-reticulum function and organ size measurements from lambs fed either a milk-milk-hay (MMH) diet or a milk-hay-hay (MHH) diet over the period of 3 to 33 weeks of age. Diet Age (w) Mean rumino-reticulum measurements (range)
pH Volume of contents (l) Size of organ Capacity (l) Mass (g)
MMH-Fed 3-5 6.8 (6.7-6.9)
0.09 (0.07-0.1)
0.37 (0.31-0.43)
5.9 (5.4-6.3)
17-19 6.85 (6.85-6.85)
1.45 (1.4-1.5)
4.4 (3-5.8)
96
31-33 6.93 (6.85-7.0)
6.4 (5.6-7.1)
13.8 (12.5-15.1)
173.5 (168-179)
MHH-Fed 3-5 5.5 (4.3-6.7)
0.6 (0.21-1)
0.96 (0.72-1.2)
13.4 (8.1-18.7)
17-19 6.68 (6.6-6.75)
3.1 (2.5-3.7)
8.8 (8-9.6)
148.6 (136.9-160.3)
31-33 7.08 (7.05-7.1)
5.6 (4.9-6.3)
11.3 (11-11.5)
240.5 (227-254)
Rumen papillary development also was examined in this study. At 3-5 weeks of age, the
papillae were fairly well developed in the MHH-fed lambs. At 17-19 weeks of age, the MHH-
fed lambs had well developed rumen papillae whereas the MMH-fed lambs showed poorly
developed papillae since birth. From 31-33 weeks of age, both groups exhibited well developed
rumen papillae (Swan and Groenewald, 2000). The authors showed that the lambs were in the
typical transitional phase at 3-5 weeks of age. The lambs fed milk replacer during phase II were
kept in this transitional phase. Once the lambs were fed hay, they moved on from the transitional
phase to the ruminant phase.
Type of diet is not the only factor that can sometimes stimulate ruminal
development. To determine if electronic boluses used for identification purposes affected
reticulo-rumen development, Garín and colleagues (2003) used two different sized boluses and
examined development at three different stages. Newborn (n=3) and weaned lambs (n=5) were
given mini boluses while eight fattened lambs were given a small bolus. Bolus treatment did not

22
affect growth compared to control lambs. Keratinization degree, papillae or crests size and
degree of dead cells also were examined in the rumen wall. There was a tendency of the boluses
to reduce keratinization in the rumen wall (P = 0.064). Lower keratinization was likely due to an
increase in ruminal motility. Papillae size was greater in lambs that were given mini boluses
than control or small bolus lambs. Degree of dead cells in the papillae of the rumen tended to be
smaller in both bolus treatments compared to control and this was most likely due to increased
motility of the rumen (Garín et al., 2003). Overall, the boluses had no adverse affects on the
development of the reticulo-rumen and more than likely induced positive changes in the anatomy
of the reticulo-rumen (Garín et al., 2003).
II. Metabolic development
Besides morphological development, the rumen also gains functionality in terms of
metabolism. There are several aspects of this development including enzyme functionality,
ammonia nitrogen production, volatile fatty acid (VFA) production, and ketogenesis. Again, the
ability of the rumen to carry out these functions can be affected by diet.
i. Carbohydrase enzyme development
Walker (1959) examined the contents and enzyme activity of the alimentary tract of
lambs varying in age from five days to five weeks. The particular sections were weighed as were
their contents. The results showed that once lambs had grass in their rumens, there was a
decrease in the percentage of dry matter found in the abomasums. Young lambs in the pre-
ruminant stage were unable to digest sucrose; however, lactase activity was adequate and
constant from birth to five weeks of age. Additionally, maltase activity was fairly constant; the
ability to break down starch was not affected greatly by age. The author concluded the young

23
lamb is dependent on the microbial population of the rumen to utilize all carbohydrates except
lactose and glucose (Walker, 1959).
ii. pH, ammonia Nitrogen (N) production, VFA production
Wardrop and Coombe (1961) conducted a series of experiments to investigate the
development of rumen function in grazing lambs and the effects of diet on rumen development in
artificially reared lambs (penned lambs without access to any plant material other than that
offered). When investigating ruminal function in grazing lambs, they conducted two similar
experiments (experiments I & II) with the difference between the two being that in the second
experiment, two lambs were slaughtered each week from birth to sixteen weeks of age and
weights and volumes of their rumen contents were measured. For both experiments, they looked
at pH, VFA concentrations, and ammonia N concentrations from the rumen.
For penned lambs, two experiments (experiments III & IV) also were conducted. For the
first of these two experiments, sixteen lambs were divided into four dietary groups (fed varying
amounts of milk and Lucerne chaff), slaughtered at either nine or thirteen weeks, and volume,
weight, appearance, pH, VFA and ammonia N concentrations were measured. The second
experiment used six lambs fed milk ad libitum for five days and then divided them into two
groups, which were then fed hay for fifteen weeks and decreasing amounts of milk for the first
nine weeks (Wardrop and Coombe, 1961).
For experiment I, VFA concentrations were very low for the first two weeks of age
followed by a rapid increase, which began to slow at week seven. Ammonia nitrogen
concentrations were high for the first three weeks and then fell rapidly before leveling off at
week four of age at 23 mmoles/liter (Wardrop and Coombe, 1961). Rumen pH fluctuated widely

24
with age. Similarly, in experiment II, rumen pH fluctuated widely and VFA concentrations were
low for the first two weeks and then rose rapidly, leveling off at eight weeks of age onwards
(Wardrop and Coombe, 1961). Total amount of VFA in the rumen was low for the first five
weeks and then rose rapidly with little tendency to level off with age. The millimoles of VFA
per 100 grams of body weight was low for the first five weeks, rose rapidly, and remained
constant from eight weeks onward (Wardrop and Coombe, 1961).
Ammonia nitrogen concentrations rose steadily with age and the millimoles of ammonia
N per 100 grams of body weight was low for the first seven weeks before rising slightly and
remaining constant after eight weeks (Wardrop and Coombe, 1961). Small amounts of pasture
were seen in the rumens of lambs at two weeks of age and at three weeks, there was partly
digested pasture. At four weeks and beyond, the appearance and odor of the rumen contents was
similar to adult sheep (Wardrop and Coombe, 1961). The volume of contents showed an
increase with age with the most rapid increase occurring from five weeks onward (Wardrop and
Coombe, 1961).
For experiment III, the different diets had no effect on live weight, but caused changes in
the appearance, weight, and volume of the lambs’ rumens. Three of the four dietary groups had
normal appearance of rumen contents (Wardrop and Coombe, 1961). When the lambs were fed
milk only, there was a reduction in the volume of rumen contents; lambs fed milk and chaff had
significantly greater (P <0.01) volume than those fed only milk (Wardrop and Coombe, 1961).
When fed milk compared to chaff, the VFA concentrations were lower, but did not remain
significantly different once the milk-fed lambs were switched to chaff. Additionally, when
lambs were switched from milk to chaff, the ammonia N concentrations were similar to values of
grazing lambs. Experiment IV showed that the intake of hay for the first four weeks was low,

25
rose rapidly until week fourteen, and then began to decline slightly (Wardrop and Coombe
1961).
From the experiments described above, the authors concluded that the rumen of a grazing
lamb was functionally developed by eight weeks of age. From this point onwards, production of
VFA is at adult levels. Also, when milk-fed lambs were switched from milk to roughage, the
rise in VFA concentrations indicated that their rumens contained the microorganisms required to
ferment the cellulose (Wardrop and Coombe 1961).
To determine the effects of a creep feed diet provided from birth, Poe et al. (1971)
conducted two different trials in which lambs were divided into different dietary treatments. In
trial I, lambs (n =12) received milk from birth till 28 days of age while the second group received
milk plus creep feed ad libitum. After day 28, the lambs were either kept on milk, weaned from
milk to creep feed, kept on milk and creep feed, or weaned to creep feed (Poe et al., 1971).
Rumen samples were collected from all lambs from day 28 through day 70. In trial II, lambs (n
=32) were grouped to four treatments: confined plus milk, confined plus milk and creep feed,
bluegrass pasture plus milk, or bluegrass pasture plus milk and creep feed. Rumen samples were
collected on days 3, 6, 10, 14, and 21 of age and analyzed for acetic, propionic, and butyric acids
(Poe et al., 1971).
In trial I, lambs receiving creep feed had higher ammonia N than lambs receiving only
milk and showed a significant increase in ammonia N from days 28 to 42 (Poe et al., 1971). The
ammonia N in the milk-fed group remained lower and did not increase significantly with age.
Ammonia N production is dependent on the numbers of microorganisms present in the rumen.
Because the milk-fed group did not have an increase in production with age, they more than
likely did not have enough microorganisms available to hydrolyze the dietary protein (Poe et al.,
26
1971). Additionally, VFA concentrations were significantly less (P <0.05) in the milk-fed group
than in the other groups. By day 56, all groups showed a significant increase (P <0.05) in VFA
production. Milk-fed lambs had more acetate from days 28 to 70 and less propionate and
butyrate (Poe et al., 1971).
In trial II, confined creep-fed lambs showed significantly greater (P <0.05) VFA
concentrations than the other groups (Poe et al., 1971). Lambs on pasture had higher VFA
concentrations. Confined milk-fed lambs had greater acetate and lower propionate and butyrate
concentrations than the other groups. Overall, intake of dry feed was more important than
nutrition on the stimulation of rumen microorganisms to produce VFA and ammonia nitrogen.
Even when lambs were allowed to nurse and were fed a hay plus concentrate diet and the
concentrate was changed after an allotment of time, VFA production increased with age (Žitňan
et al., 1993). Fifteen lambs were allowed to nurse while being fed alfalfa hay plus concentrate.
From weeks one to three the concentrate consisted of 15% dried skim milk, 35% soybean meal,
10% wheat bran, 25% cracked corn, 10% rolled oats, and 5% dehydrated alfalfa. From weeks
three to ten, the concentrate consisted of 30% soybean meal, 10% wheat bran, 43% cracked corn,
7% rolled oats, and 10% dehydrated alfalfa. Three lambs were slaughtered at each of five time
periods: 1, 3, 4, 6, and 10 weeks of age (Žitňan et al., 1993).
Significant differences (P<0.01) were seen between the 1st and 4th weeks of age and
between the 6th and 10th weeks of age. With age, proportion of propionic acid increased while
acetic acid proportions decreased. The highest proportion of butyric acid was seen in the ten-
week-old lambs (Žitňan et al., 1993).
iii. VFA production and ketogenic activity

27
Diet has been shown to affect ruminal development. Manipulation of development when
lambs were fed only milk replacer and whether consumption of solid feed at a later date led to a
more mature rumen was investigated by Lane et al. (2000). Lambs were assigned to two dietary
groups: either milk or feed. The milk group was given free access to milk replacer until
slaughter and the feed group was given milk replacer ad libitum until 49 days of age and then
gradually weaned to a lamb starter till day 77. From day 77 till slaughter at day 84, the feed
lambs were given only lamb starter.
The volume of the rumen increased significantly with age in the milk group.
Subsequently, the total amount of VFA within their rumens increased as well (Lane et al., 2000).
Fed lambs had significantly greater concentrations of acetate, propionate, butyrate, and valerate
at day 84 than lambs in the milk group. In milk lambs, there were no significant changes in
glucose or butyrate oxidation by rumen epithelial cells with change in age. Before day seven,
there were no changes in acetoacetate production and after this day there were no changes with
age in the rate of acetoacetate production from butyrate or of lactate production from glucose.
Before day 42, β-hydroxybutyrate (BHBA) production from butyrate was undetectable, but after
this day its rates of production were similar to those from rumen epithelial tissue in adult
animals. On day 84, there were no differences in production of acetoacetate and lactate or
glucose and butyrate productions between the two dietary groups (Lane et al., 2000).
Because glucose and butyrate production was low in milk-fed lambs, these lambs’ rumen
epithelia may not be able to oxidize these two substrates. This could be due to the fact that the
milk replacer fed was high in fat. The high fat content of the milk replacer (350 g/kg pork fat
and 650 g/kg dried whey) could cause greater circulating nonesterified fatty acids and ketone
bodies, leading to hepatic ketogenesis (Lane et al., 2000). In turn, the epithelium might oxidize

28
the nonesterified fatty acids and ketone bodies instead of glucose and butyrate. The increase in
BHBA production is one of the only metabolic changes that occur when solid feed is not
consumed by the lamb. Consumption of solid feed from day 49 to day 84 stimulated
morphologic changes, but not metabolic ones, in the rumen. Consequently, the rumen needs to
be exposed to VFA at an earlier time in order for metabolic development to be induced (Lane et
al., 2000).
In a follow up paper, Lane et al. (2002) wanted to examine the effects of age and diet on
acetoacetyl-CoA thiolase and HMG-CoA synthase mRNA concentration. HMG-CoA synthase
and acetoacetyl-CoA thiolase help regulate hepatic ketogenesis in mature ruminants and non-
ruminants. The authors used two groups of lambs for this study. The first group of 27 lambs
was raised conventionally, weaned at day 49 or 56, and offered feed ad libitum thereafter. Three
lambs were slaughtered at each of the following ages: 0, 4, 7, 14, 28, 42, 49, 56, 84 days (Lane et
al., 2002).
The second lamb group of 33 one-day-old lambs was given milk replacer only and
divided into three dietary groups: milk-fed, VFA-infused, and starter- fed. Three lambs from the
milk-fed group were slaughtered at each of the ages listed above. The lambs in the VFA group
were given only milk replacer until day 49 when they were started on VFA infusions. These
lambs were slaughtered at day 84. The starter-fed group lambs were given milk replacer until
day 49 and were weaned to a lamb starter between days 49 and 77. These lambs were
slaughtered at day 84. Samples of ventral ruminal epithelium were taken from all lambs (Lane et
al., 2002).
In both groups of lambs, there was an age-dependent increase in mRNA encoding
acetoacetyl-CoA thiolase showing an increase in epithelial ketogenesis regardless of diet (Lane

29
et al., 2002). Expression of acetoacetyl-CoA thiolase mRNA was similar at day 84 regardless of
diet; this also reflects the rate of epithelial ketogenesis. Expression of HMG-CoA synthase
increased with age in group one lambs, whereas expression was low through day 42 in the milk-
fed lambs. Therefore, diet appeared to affect expression of HMG-CoA synthase before day 42
(Lane et al., 2002). Seven days later, on day 49, the expression increased sixfold in the milk-fed
lambs and by day 84, there were no differences in expression due to diet (Lane et al., 2002).
The sixfold increase in HMG-CoA synthase expression coincided with the increase in
BHBA production seen in the earlier work. Therefore, the rate of ketogenesis in milk-fed lambs
is probably controlled by HMG-CoA synthase activity and not acetoacetyl CoA thiolase (Lane et
al., 2002). The amount of mRNA encoding HMG-CoA synthase increased at the same time
rumen epithelial ketogenic capacity increased. This means that ketogenesis may be limited by
HMG-CoA synthase mRNA production before day 49 of age (Lane et al., 2002). After this day,
there were no differences in HMG-CoA synthase mRNA or rumen epithelial ketogenic rates
among dietary treatments (Lane et al., 2002). The authors concluded that HMG-CoA synthase is
the rate-limiting enzyme in ruminal ketogenesis and that the expression of both enzymes
increases with age, regardless of dietary treatment (Lane et al., 2002). Therefore, there does not
need to be any VFA within the rumen for ketogenic capacity to develop in the rumen epithelium
(Lane et al., 2002).
III. Microbial effects on development
Not only does diet have an effect on ruminal tissues and their ability to become
metabolically active, diet also affects the microbial populations found in the rumen. These
microbes play several important roles in the maturation process of the rumen including the
production of VFA, which in turn stimulates tissue maturation. Different types of microbes exist
30
in the rumen and they must all play their roles in the physical and physiological maturation of the
rumen.
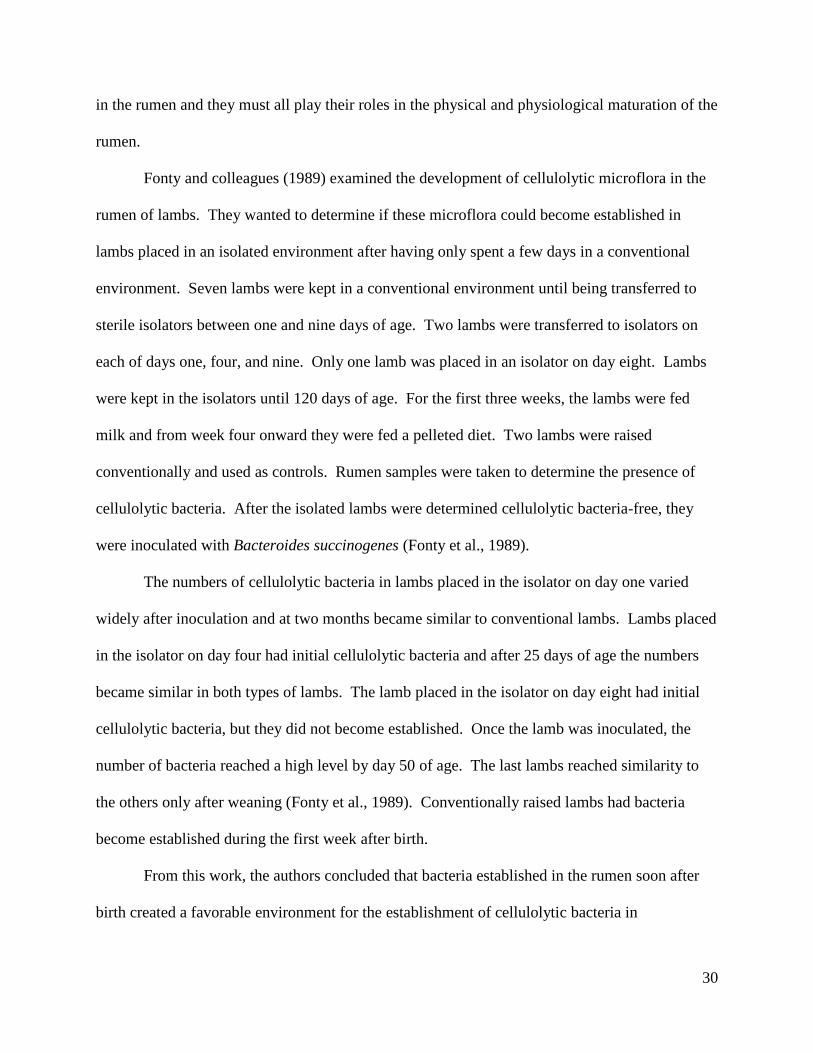
Fonty and colleagues (1989) examined the development of cellulolytic microflora in the
rumen of lambs. They wanted to determine if these microflora could become established in
lambs placed in an isolated environment after having only spent a few days in a conventional
environment. Seven lambs were kept in a conventional environment until being transferred to
sterile isolators between one and nine days of age. Two lambs were transferred to isolators on
each of days one, four, and nine. Only one lamb was placed in an isolator on day eight. Lambs
were kept in the isolators until 120 days of age. For the first three weeks, the lambs were fed
milk and from week four onward they were fed a pelleted diet. Two lambs were raised
conventionally and used as controls. Rumen samples were taken to determine the presence of
cellulolytic bacteria. After the isolated lambs were determined cellulolytic bacteria-free, they
were inoculated with Bacteroides succinogenes (Fonty et al., 1989).
The numbers of cellulolytic bacteria in lambs placed in the isolator on day one varied
widely after inoculation and at two months became similar to conventional lambs. Lambs placed
in the isolator on day four had initial cellulolytic bacteria and after 25 days of age the numbers
became similar in both types of lambs. The lamb placed in the isolator on day eight had initial
cellulolytic bacteria, but they did not become established. Once the lamb was inoculated, the
number of bacteria reached a high level by day 50 of age. The last lambs reached similarity to
the others only after weaning (Fonty et al., 1989). Conventionally raised lambs had bacteria
become established during the first week after birth.
From this work, the authors concluded that bacteria established in the rumen soon after
birth created a favorable environment for the establishment of cellulolytic bacteria in

31
conventionally raised lambs. Microflora that colonize the rumen after birth contributed to rumen
function because the lambs were weaned without difficulties (Fonty et al., 1989). As a follow
up, Fonty et al. (1991) conducted a similar experiment with the goals of looking at establishment
of cellulolytic bacteria and the development of rumen digestive functions and digestive
utilization. A similar experimental set up was used and rumen samples were taken to determine
concentrations of VFA, pH, ammonia N, and ethanol and lactic acid (Fonty et al., 1991). Feces
were collected from some of the lambs to determine digestive utilization.
For isolated lambs, solid feed intake was lower and pH was similar to control lambs.
VFA concentrations for isolated lambs were similar to the control lambs while composition
varied. Acetic acid concentrations were highest in the youngest lambs before weaning. In all
lambs isolated before weaning, propionic acid was greater than in control lambs and remained
higher after weaning. In both isolated and control lambs, ammonia N concentrations were higher
before weaning than after. Lactic acid concentrations in isolated and conventional lambs were
low. Also, each group had only traces of ethanol present. Little difference was seen in the total
digestion of dry matter and starch between isolated lambs (Fonty et al., 1991).
Similar conclusions were reached in terms of the establishment of microflora. The
bacterial population in control lambs used ammonia N more effectively for proteosynthesis than
did the population found in isolated lambs, thereby accounting for the greater decrease in
ammonia N in the control lambs after weaning (Fonty et al., 1991). The bacteria established in
the rumen shortly after birth set up digestive processes that affected the break down of cellulose
rich feeds and subsequent fermentation of the break down products (Fonty et al., 1991).
Microbial populations are responsible not only for the break down of cellulose and the
production of VFAs, but also for B-vitamin synthesis. Poe et al. (1972) evaluated the effect of

32
different diets on the promotion of B-vitamin synthesis in lambs of differing ages. At birth, 32
lambs were assigned to one of four dietary treatment groups: confined plus milk, confined plus
milk and creep feed, milk plus pasture, and milk plus pasture and creep feed. Rumen samples
were collected at 3, 6, 10, 14, and 21 days of age.
A significant increase in riboflavin was found in confined creep-fed lambs between six
and ten days of age. Similarly, confined milk-fed lambs showed the same amount of riboflavin
between three and six days of age with a marked increase at day 10. Pastured, creep-fed lambs
had higher amounts of riboflavin than did pastured, milk-fed lambs, but the differences were not
significant (Poe et al., 1972). The authors postulated that greater creep feed intake by confined
lambs resulted in a greater microorganism population that was capable of synthesizing more
riboflavin than lambs in any other treatment group. Among dietary treatments, there were no
significant differences in amounts of pantothenic acid or niacin (Poe et al., 1972). A significant
decrease in biotin was found as lambs got older, providing evidence that synthesis of this vitamin
was not attained by the microorganisms by the time the lambs reached 21 days of age (Poe et al.,
1972). Folic acid was similar between confined creep-fed and pastured creep-fed lambs and
between confined milk-fed and pastured milk-fed lambs. Overall, diet had a greater impact on
rumen development and B-vitamin synthesis than did plane of nutrition (Poe et al., 1972).
Many factors are involved in the development of the rumen. These factors affect
morphological development of the ruminal tissues as well as the establishment of ruminal
metabolism and microbial populations. Diet plays a major role in the development of all three
areas during all three phases of development.

33
Materials and Methods
Cria data collection: Initial data were collected on Suri crias (N=25) during the summer of 2000
(three female and two male), fall of 2002 (two male), fall of 2003 (four female and four male),
and during the summer/fall of 2008 (five female and five male). All of these crias were born at
the Crimson Shamrock ranch (Eglon, West Virginia). Crias were measured with a milliner’s
tape placed around the chest, directly behind the olecranon or elbow at the 4th or 5th rib. The
tape was pulled tight, but not so tight that the flesh was indented. The measurement was read
and recorded. Crias were weighed in a sling on a hanging scale. The sling was placed on the
scale and the scale was zeroed. The cria was first placed in the sling and then on the scale. The
measurement was read and recorded. Other weight and girth data were collected at Orchard Hill
Alpacas (Elkins, West Virginia) on Suri and Huacaya crias (N=9) during the summer/fall of
2009. Crias were weighed on a digital scale and were measured as previously described. All
crias were between the ages of 0 to 232 days.
Rumen development via ultrasound: Rumen development was examined weekly in nine
university flock lambs from 18 to 61 days of age. Each lamb had an approximate eight x eight
square centimeter section of fleece shorn from the left side of their bodies, directly behind the rib
cage and directly below the spine. The lambs were lain on their right sides and scanned with an
Aloka 500 V ultrasound console and a 3.5 MHz sector probe. After the rumen was located, the
image was frozen and measurements of length and height were measured by calipers on the
machine and recorded, one image per evaluation.

34
Feed and fecal sample analysis: From days 39 to 61 of age, fecal samples were taken from each
lamb during the same time as ultrasound evaluation. After collection, the samples were frozen
until analysis. Samples were weighed and placed in a 50ºC drying oven over night. After
drying, samples were weighed, ground, and approximately 0.25 grams were placed into weighed
F57 filter bags (Ankom Technology) that had been soaked in acetone and dried. Two filter bags
were filled for each sample to create duplicates. Sealed filter bags were then placed in an
Ankom DAISYII Incubator (Ankom Technology) to determine in vitro true digestibility. After a
48-hour incubation, samples were rinsed with water and placed in an Ankom200 Fiber Analyzer
to remove any remaining microbial debris and soluble fractions using Neutral Detergent Solution
(Ankom Technology). Following the washes in the analyzer, the samples were removed, soaked
in acetone for 3 minutes, air dried for half an hour, placed in a 50ºC drying oven overnight,
cooled in a desiccator, and then weighed. Percent in vitro true digestibility was calculated.
Lambs were kept with their dams and allowed access to milk. Samples of the lamb’s
solid diet, both haylage and creep feed, were collected at the same time as fecal samples.
Samples were frozen until analysis. Samples were weighed and then placed in a 50ºC drying
oven overnight. After drying, samples were ground. Approximately 0.25 to 0.3 grams of sample
were placed into pre-weighed F57 filter bags. Duplicates were made for each sample. Half of
the samples were placed in an Ankom200 Fiber Analyzer using Neutral Detergent Solution
(Ankom Technology). The remaining samples were placed in an Ankom200 Fiber Analyzer using
Acid Detergent Solution (Ankom Technology). After the final washes for both sets, samples
were placed in acetone for 3 minutes and then allowed to air dry for 30 minutes. Samples were
then placed in a 50ºC drying oven overnight. After drying, samples were placed in a desiccator
to cool and were immediately weighed. Both ADF and NDF were calculated on an as is basis.

35
Results
Cria Data: Data were analyzed to determine the effects of farm (Crimson Shamrock Ranch or
Orchard Hill Alpacas), sex (female or male), breed (Suri or Huacaya), girth, and age on body
weight. In type 3 tests for fixed effects, farm, sex, and breed, when considered individually,
were not significant. However, when taken into consideration with girth and age as interactions,
these effects were found to be significant with the exceptions of girth and farm and age and
breed. In these interactions, both farms and both breeds have the same relationship and thus
were excluded from the model. Girth had a significant effect as well as its interactions with sex
and breed (P = <0.0001, 0.0012, and 0.0573, respectively) on body weight. Similarly, age had a
significant effect as well as its interactions with farm and sex (P = <0.0001, 0.0018, and 0.0009,
respectively).
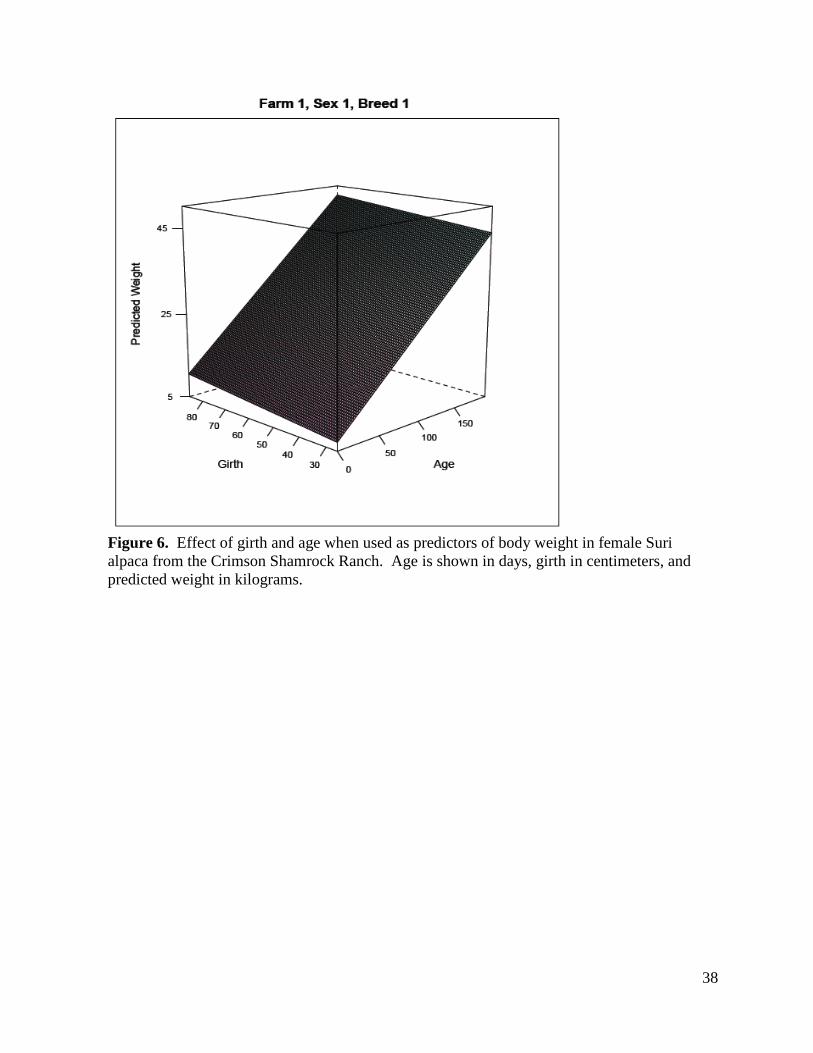
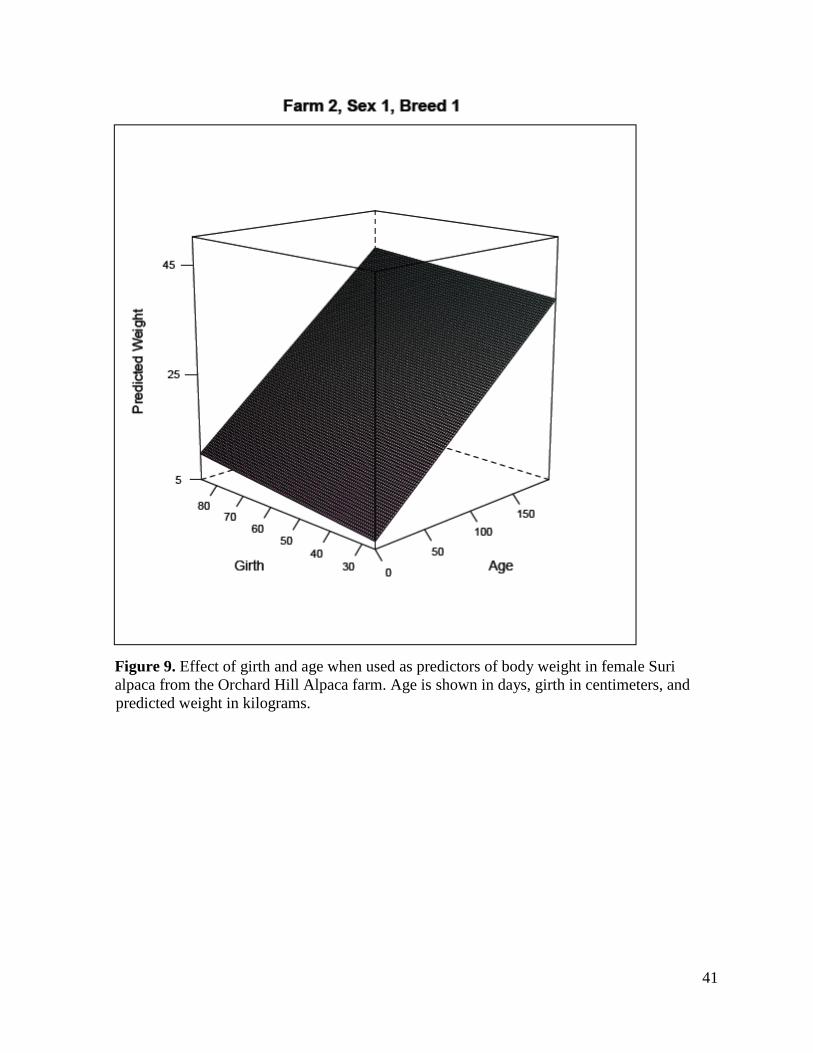
When looking at the response surface plots of girth and age (Figures 6 – 12) as predictors
of weight and factoring in farm, sex, and breed, farm was found to be an important predictor of
weight in female animals of both breeds on both farms. Girth was an important predictor of
weight for both sexes of the Suri breed (Figures 6, 8, 9, 11) but was not shown to be a predictor
of weight above and beyond the effects of age for either sex of the Huacaya breed (Figures 7, 10,
12). Age was an important predictor of weight in both sexes of both breeds on both farms.
36
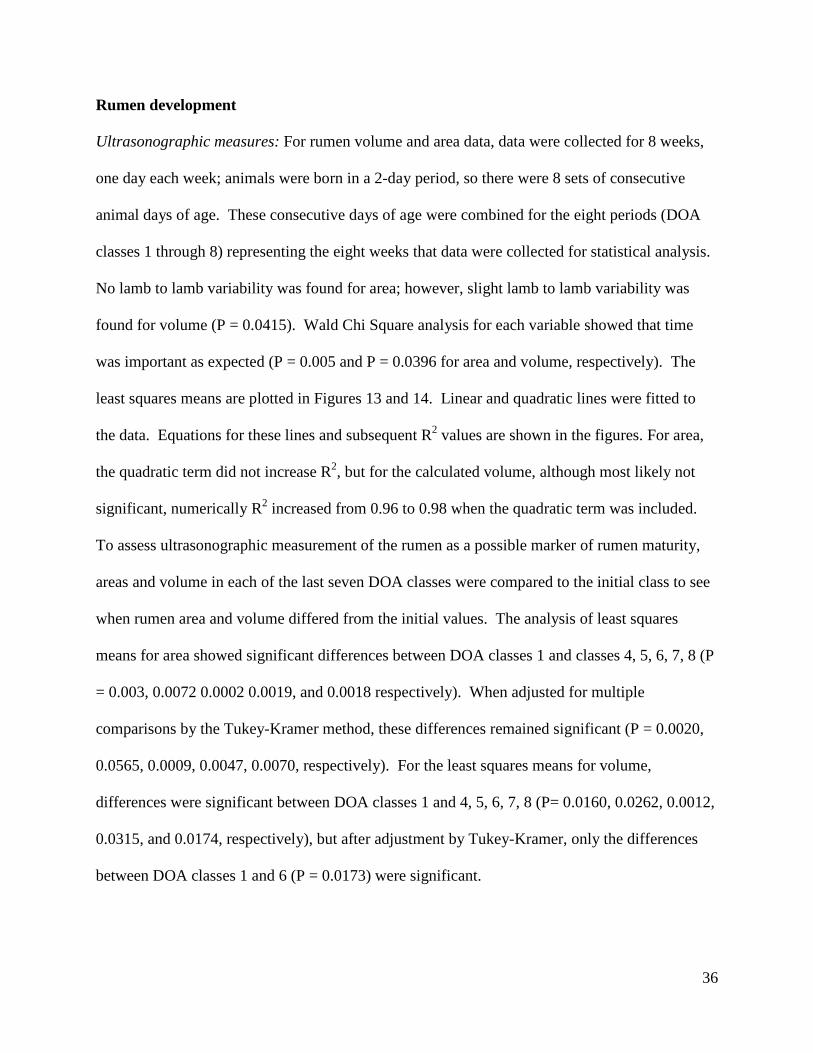
Rumen development
Ultrasonographic measures: For rumen volume and area data, data were collected for 8 weeks,
one day each week; animals were born in a 2-day period, so there were 8 sets of consecutive
animal days of age. These consecutive days of age were combined for the eight periods (DOA
classes 1 through 8) representing the eight weeks that data were collected for statistical analysis.
No lamb to lamb variability was found for area; however, slight lamb to lamb variability was
found for volume (P = 0.0415). Wald Chi Square analysis for each variable showed that time
was important as expected (P = 0.005 and P = 0.0396 for area and volume, respectively). The
least squares means are plotted in Figures 13 and 14. Linear and quadratic lines were fitted to
the data. Equations for these lines and subsequent R2 values are shown in the figures. For area,
the quadratic term did not increase R2, but for the calculated volume, although most likely not
significant, numerically R2 increased from 0.96 to 0.98 when the quadratic term was included.
To assess ultrasonographic measurement of the rumen as a possible marker of rumen maturity,
areas and volume in each of the last seven DOA classes were compared to the initial class to see
when rumen area and volume differed from the initial values. The analysis of least squares
means for area showed significant differences between DOA classes 1 and classes 4, 5, 6, 7, 8 (P
= 0.003, 0.0072 0.0002 0.0019, and 0.0018 respectively). When adjusted for multiple
comparisons by the Tukey-Kramer method, these differences remained significant (P = 0.0020,
0.0565, 0.0009, 0.0047, 0.0070, respectively). For the least squares means for volume,
differences were significant between DOA classes 1 and 4, 5, 6, 7, 8 (P= 0.0160, 0.0262, 0.0012,
0.0315, and 0.0174, respectively), but after adjustment by Tukey-Kramer, only the differences
between DOA classes 1 and 6 (P = 0.0173) were significant.

37
Feed Samples: Van Soest fiber analyses were conducted for each sampling date and standard
deviation across each fiber analysis within each feed type was minimal. Thus, mean values for
both ADF and NDF are reported: creep feed ADF = 11.04% and NDF = 24.46%; haylage ADF =
20.89% and NDF = 38.78%.
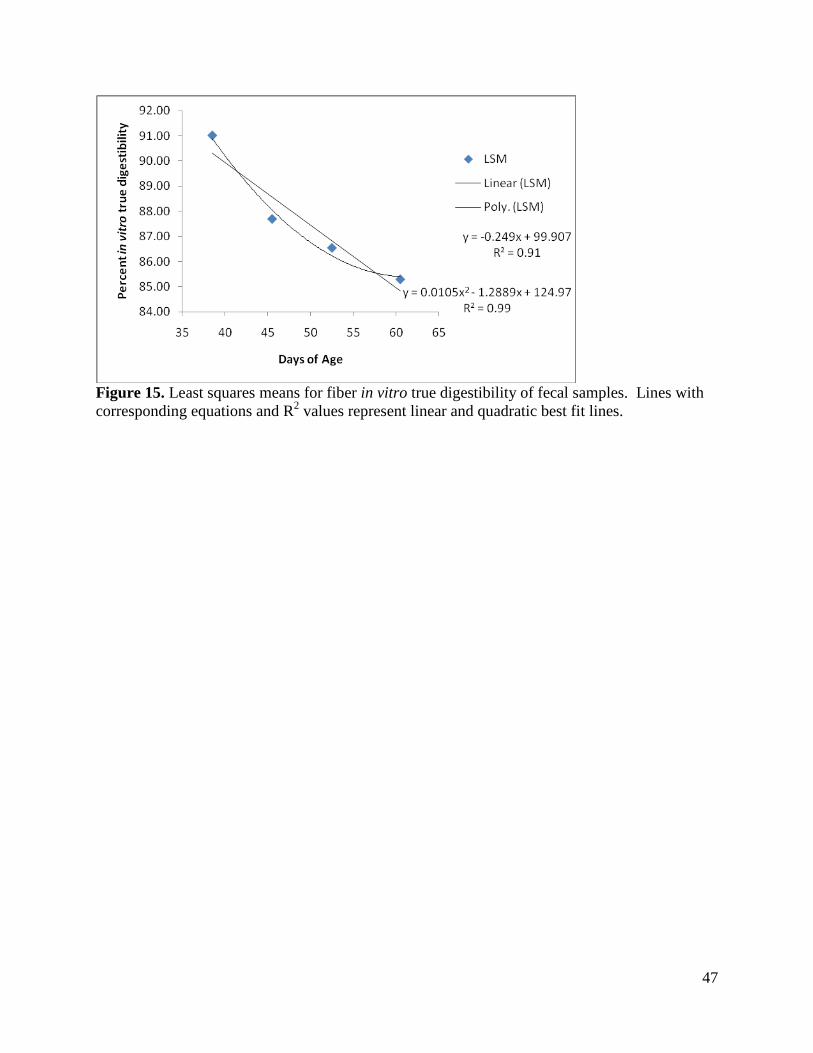
Fecal Samples: Similar to the rumen area and volume data, consecutive days of fecal sampling
(with subsequent 48 hour in vitro digestion; IVTD) were combined into four different sets over
time and labeled as DOA classes 1 through 4. The variance in fiber digestibility among lambs
was low (0.029) and by analysis of variance did not differ over time. The Wald Chi Square
analysis, however, showed that time was an important factor in digestible content of fecal fiber.
Comparisons of the least squares means of IVTD (Figure 15) showed a trend for difference
between DOA classes 1 and 3 (P = 0.0685) and a difference between classes 1 and 4 (P =
0.0271). Although highly linear when plotted (R2 = 0.91), there was an inflection in the curve at
around 50 days of age, which is supported by the greater goodness of fit (R2 = 0.99) with a
quadratic line fit to the data.
38
Figure 6. Effect of girth and age when used as predictors of body weight in female Suri alpaca from the Crimson Shamrock Ranch. Age is shown in days, girth in centimeters, and predicted weight in kilograms.

39
Figure 7. Effect of girth and age when used as predictors of body weight in female Huacaya alpaca from the Crimson Shamrock Ranch. Age is shown in days, girth in centimeters, and predicted weight in kilograms. Girth was not shown to have additional value as a predictor of weight when age was in the model.

40
Figure 8. Effect of girth and age when used as predictors of body weight in male Suri alpaca from the Crimson Shamrock Ranch. Age is shown in days, girth in centimeters, and
predicted weight in kilograms.
41
Figure 9. Effect of girth and age when used as predictors of body weight in female Suri alpaca from the Orchard Hill Alpaca farm. Age is shown in days, girth in centimeters, and
predicted weight in kilograms.

42
Figure 10. Effect of girth and age when used as predictors of body weight in female Huacaya alpaca from the Orchard Hill Alpaca farm. Age is shown in days, girth in centimeters, and
predicted weight in kilograms. Girth was not shown to have additional value as a predictor of weight when age was in the model.

43
Figure 11. Effect of girth and age when used as predictors of body weight in male Suri alpaca from the Orchard Hill Alpaca farm. Age is shown in days, girth in centimeters, and predicted weight in kilograms.

44
Figure 12. Effect of girth and age when used as predictors of body weight in male Huacaya alpaca from the Orchard Hill Alpaca farm. Age is shown in days, girth in centimeters, and
predicted weight in kilograms. Girth was not shown to have additional value as a predictor of weight when age was in the model.

45
Figure 13. Least squares means for rumen area as measured by transabdominal ultrasonography. Consecutive actual days of age were averaged to yield DOA classes for analysis. Days of age are based on those averages. Lines with corresponding equations and R2 values represent linear and quadratic best fit lines.

46
Figure 14. Least squares means for rumen volume as calculated from the assumption that the rumen was essentially tubular and that diameter measured ultrasonographically was equally applicable to width or height. Consecutive actual days of age were averaged to yield DOA classes for analysis. Days of age are based in those averages. Lines with corresponding equations and R2 values represent linear and quadratic best fit lines.
47
Figure 15. Least squares means for fiber in vitro true digestibility of fecal samples. Lines with corresponding equations and R2 values represent linear and quadratic best fit lines.

48
Discussion
When examining the heart girth and weight relationship in several different species,
researchers have found that the relationship can be affected by several different factors including
sex, age, breed, and herd differences (Atta and El khidir, 2004; Kuene et al., 2009; Branton and
Salisbury, 1946; Wanderstock and Salisbury, 1946; Olatunji-Akioye and Adeyemo, 2009).
Differing heart girth / weight relationships exist between animals of the same species when these
factors are examined. In this study, when differences between farm, sex, breed, and age were
added to girth and used to model body weight, age, as expected, was found to account for more
variation in weight than heart girth. Biologically, this finding is not surprising as age would be
expected to play a role in the determination of weight; as animals age, they also grow.
However, girth also accounted for a good amount of variation in weight in both male and
female Suri alpaca (Figures 6, 8, 9, and 11). On the other hand, girth was not found to account
for much variation of weight of male and female Huacaya alpaca (Figures 7, 10, and 12). While
this was unexpected, this difference between breeds could be due to the fact that there were only
five Huacaya alpaca measured across both farms. If more Huacaya were measured, girth could
become an important predictor of weight. Breed differences between the heart girth / weight
relationship were expected. Differences in this relationship among different breeds of the same
species have been evidenced by studies by Branton and Salisbury (1946) and Wanderstock and
Salisbury (1946). In these two studies, Branton and Salisbury (1946) examined the heart girth /
weight relationship in dairy bulls and found that the predictive equation for weight differed from
the one for beef cattle as determined by Wanderstock and Salisbury.
Additionally, it was expected that there might be some differences between farms with
only two farms sampled (Figures 6-8 vs. Figures 9-12). Similarly, when Olatunji-Akioye and

49
Adeyemo (2009) examined the heart girth / weight relationship in different commercial Nigerian
sheep flocks and goat herds, they found that differences existed within the three groups of sheep
and within the three groups of goats. They attributed these differences to the different conditions
under which these animals were raised. In their study, 20 animals from each group were
sampled. If more animals had been measured across more farms in the current study, then farm /
herd differences would have more than likely been minimal. This is supported by the work of
Heinrichs and Hargrove (1987) in their study using heart girth to predict weight across 163
commercial dairy cattle herds.
Between sexes of the same breed, it was expected that there would be differences
between heart girth as a predictor of weight. This was seen between male and female Suri alpaca
(Figures 6 & 8 and 9 & 11) but not between male and female Huacaya alpaca (Figures 10 & 12)
again most likely due to small numbers of Huacaya in the analysis. Typically, males of many
species grow faster than females and thus would have a differing relationship between heart girth
and body weight. Furthermore, differences in areas of fat deposition between the sexes would
also contribute to the different relationships between heart girth and weight. Such differences
between heart girth and weight have been observed between males and females of other species.
Atta and El khidir (2004) and Kuene and collegues (2009) observed these differences in Nilotic
and Nguni sheep and Wanderstock and Salisbury (1946) observed these differences in Angus
cattle.
Overall, based on the data, heart girth can be used as a predictor of weight in alpaca.
Even though heart girth did not account for much variation in weight of Huacaya alpaca, this
could change with a larger sample size. More heart girth and weight measurements taken across
more herds / farms should yield a better picture of the heart girth / weight relationship in this

50
species. Then, more universal predictive equations could be created that would accurately
estimate weight while taking sex and breed differences into consideration.
Body weight is comprised of many components including skeletal development, degree
of fatness, and gut fill (Enevoldsen and Kristensen, 1997). The latter component is especially
important in the developing ruminant, as there are phases the animal passes through before
attaining a fully mature ruminant stomach. Rumen development has been tracked by gross
examination and dietary studies (Franco et al., 1992; Wardrop, 1961; Swan and Groenewald,
2000; Wardrop and Coombe, 1961). The aim of this study was to determine if rumen
development could be tracked via ultrasonography as an alternative to more labor-intensive
methods. Lambs were used as the animal model because alpacas at the cria stage were
unavailable during the time period of study. Data for rumen area and volume were analyzed
separately. Animal to animal variability was found for rumen volume, but not for area. This
could have been influenced by the fact that area was calculated for an ellipse while volume was
calculated for a cylinder. The images as seen on the ultrasound screen appeared elliptical.
Therefore, area for an ellipse was calculated from the actual measurements taken on the
ultrasound machine of length and height / diameter. Volume was determined for a cylinder
because of the measurements available and because prior to the beginning of the study, gross
dissection of neonatal lambs, which had died of natural causes, showed a tube-like structure of
the rumen. While the rumen changes in size and shape over time, calculations of area and
volume were assumed to best reflect the actual ultrasonographic observations of the developing
rumen.
Based on the above information, Figure 13, the graph of least squares means for area,
might be considered to better reflect observed growth, while actual volume would technically be

51
the better measure biologically, because the rumen is a three dimensional organ and would be
represented more effectively by a three dimensional measurement. In figure 14, it is seen that
the quadratic line for volume yielded a slightly better fit to the data, indicating that ruminal
development may become more uniform at the times. Additional observations taken after 61
days should show more of the plateauing of area that should occur as the rumen reaches full
maturity. This equation, along with that for area, can be used to estimate rumen size for a given
day of age.
Statistical analysis showed that both area and volume were important factors with respect
to time. When lambs are born, they are not mature ruminants. There are three phases the lamb
must go through in terms of forestomach, specifically rumen, development. These phases
include the following: non-ruminant phase (0-3 weeks of age), transition phase (3-8 weeks of
age), and ruminant phase (8 weeks of age and beyond) (Poe et al., 1971). Logically, as the lamb
goes through these phases, the size and capacity (volume) of the rumen should change.
Figures 13 and 14 show that between 40 and 52 days of age there begins a somewhat
more rapid increase in both area and volume. This is evidenced by the fact that the observed
value at day 45 for area and the values for volume at 40 and 45 days are above the linear
regression lines. Church et al. (1962) showed a rapid increase in rumen dry weight relative to
body size between 40 and 50 days of age, which would coincide with an apparent rapid increase
in area and volume in the current study. Also, at 5 weeks of age Wardrop and Coombe (1961)
saw a rapid increase in volume which began to level off at 7 to 8 weeks of age. The significant
differences from initial values seen in both area and volume by DOA class 6 of age fit with a
more rapid increase of rumen growth from week 5 onwards. Using adjusted P values, more
differences were found for days of age in area because less lamb to lamb variability was found to

52
be associated with this measurement. The P values were adjusted for variance in the
measurements of area and volume because of the multiple comparisons to the initial day of
observation. When the variability in the measurements was taken into consideration, it shows
when there is a beginning of a change in the growth of the rumen itself.
Beginning at 5 weeks of age, Wardrop and Coombe (1961) found a rapid increase in total
volatile fatty acid content in the rumen which leveled off at weeks 7 to 8. Volatile fatty acids,
specifically butyric and propionic acids, are important for indices of tissue maturation in the
rumen. Greater tissue maturation would yield greater metabolic activity and reflect greater
overall rumen growth.
In order to ensure that the feeds the lambs had access to during the sampling period did
not change drastically over time and contribute to major dietary differences, acid detergent fiber
and neutral detergent fiber analyses were conducted. Both fiber determinations were performed
on creep feed and haylage samples. Acid detergent fiber (ADF) is considered indigestible plant
material, usually cellulose coated with lignin. The ADF value indicates digestibility; the lower
the ADF value, the higher the digestibility. Neutral detergent fiber (NDF) is considered total
cellulose and hemicellulose content in plant material. The NDF value predicts intake potential
because it includes the indigestible and slowly digestible components; the more of these
components there are in a feed, the faster the animal will feel full and the intake of the feed will
be lower. Standard deviation of ADF and NDF values for both feeds indiates that the feeds were
of a consistent composition over time and would not have affected rumen maturity.
To provide a basis for validation of the ultrasonographic data, fecal samples were
collected and used to determine fiber digestibility as a measure of rumen functionality and
maturity. It was hypothesized that because the lambs undergo a transitory phase between being a

53
non-ruminant and a ruminant, that changes in fiber digestibility would be seen during this time.
Therefore, samples were collected during the middle of this phase and thereafter. Before being
subjected to in vitro digestion, it was expected that there should be an increase in actual rumenal
digestibility over time, which would coincide with increased area and volume. When the fecal
samples were subjected to incubation in rumen fluid, the amount of undigested fiber from the
lambs was expected to be high at the beginning of the sampling period and decrease with time,
leaving the in vitro microbes with more material to break down in early samples and less
material in the later samples. Figure 15 shows that over the sampling period, the in vitro true
digestibility decreased, demonstrating that the lambs’ own ability to digest fiber increased; the
undigested potentially digestible fiber remaining in the samples decreased with time and thus the
in vitro microbes had less to act on. This decrease in IVTD of fecal fiber indicates that the
rumens in these lambs were maturing and initiating better digestion of the fiber in their diet.
This increased digestive ability coincided with the more rapid growth of the rumen seen in the
ultrasound data.
On the contrary, Church et al. (1962) found that the contents of the rumen had a normal
odor and appearance between 11 and 14 days of age. When they conducted in vitro digestion
studies, they found that dry matter digestion was considered to be normal at 11 days of age.
Cellulose digestion increased between 11 and 23 days of age. While these data do not
necessarily support the findings in the current study, differences in lamb diets could explain the
different outcomes. Lambs in the Church et al. (1962) study were allowed access to milk from
their dams, alfalfa hay, young grass, and grain fed to the ewes. The lambs in the current study
were allowed access to milk from their dams, creep feed, and haylage fed to the dams. It has
been demonstrated that differences in diet can affect the attainment of rumen maturity (Wardrop

54
and Coombe, 1961; Poe et al., 1971; and Lane et al., 2000). Dietary differences affect rumen
microbial populations, which in turn would affect tissue maturation and digestive ability, leading
to differing times of overall rumen maturity.
Based on the data, tracking rumen development via ultrasound is a feasible method. The
fecal sample data supported the conclusions drawn from the ultrasound images. However, fecal
fiber analysis is still a better method to track rumen maturity. With possible improvement to the
ultrasound method and more practice, this method could be used to track rumen maturity. This
would allow rumen growth to be examined without having to slaughter the animal or analyze
fecal samples. When rumen area and volume increased, fiber digestibility also increased in the
lambs. Both the increase in size and fiber digestibility demonstrated rumen maturity. A future
study should be conducted to look at rumen development past the 60-day mark to better
determine the pattern of rumen area and volume, indicative of full rumen maturity.
Conclusions
Overall, based on the data, heart girth can be used as a predictor of weight in alpaca cria.
Even though heart girth did not account for much variation in weight of Huacaya alpaca, this
could change with a larger sample size. Also, tracking rumen development via ultrasound is a
feasible method. The fecal sample data supported the conclusions drawn from the ultrasound
images.

55
Literature Cited
Atta, M., O.A. El khidir. 2004. Use of heart girth, wither height and scapuloischial length for prediction of liveweight of Nilotic sheep. Small Ruminant Research. 55:233-237. Branton, C., G.W. Salisbury. 1946. The estimation of the weight of bulls from heart girth measurements. Journal of Dairy Science. 29:141-143. Brown, C.J., J.E. Brown, and W.T. Butts. 1974. Evaluating relationships among immature
measures of size, shape and performance of beef bulls. IV. Regression models for predicting postweaning performance of young Hereford and angus bulls using preweaning measures of size and shape. Journal of Animal Science. 38:12-19.
Carroll, C.L., P.J. Huntington. 1988. Body condition scoring and weight estimation of horses. Equine Veterinary Journal. 20 (1):41-45. Church, D.C., G.L. Jessup, and R. Bogart. 1962. Stomach development in the suckling lamb. American Journal of Veterinary Research. 23:220-225. Dingwell, R.T., M.M. Wallace, C.J. McLaren, C.F. Leslie, and K.E. Leslie. 2006. An evaluation of two indirect methods of estimating body weight in Holstein calves and heifers. Journal of Dairy Science. 98:3992-3998. Enevoldsen, C., T. Kristensen. 1997. Estimation of body weight from body size measurements and body condition scores in dairy cows. Journal of Dairy Science. 80:1988-1995. Fonty, G., P.Gouet, and J.M. Nebout. 1989. Development of the cellulolytic microflora in the rumen of lambs transferred into sterile isolators a few days after birth. Canadian Journal of Microbiology. 35:416-422. Fonty, G., J.P. Jouany, M. Chavarot, F. Bonnemoy, and P. Gouet. 1991. Development of the rumen digestive functions in lambs placed in a sterile isolator a few days after birth. Reproduction, nutrition, development. 31:521-528. Franco, A., S. Regdón, A. Robina, and E. Redondo. 1992. Histomorphometric analysis of the
rumen of sheep during development. American Journal of Veterinary Research. 53:1209-1217.
Garín, D., G. Caja, and F. Bocquier. 2003. Effects of small ruminal boluses used for electronic identification of lambs on the growth and development of the reticulorumen. Journal of Animal Science. 81:879-884. Heinrichs, A.J., G.L. Hargrove. 1987. Standards of weight and height for Holstein heifers. Journal of Dairy Science. 70:653-660. Heinrichs, A.J., G.W. Rogers, and J.B. Cooper. 1992. Predicting body weight and wither height

56
in Holstein heifers using body measurements. Journal of Dairy Science. 75:3576-3581. Heinrichs, A.J., H.N. Erb, G.W. Rogers, J.B. Copper, and C.M. Jones. 2007. Variability in Holstein heifer heart-girth measurements and comparison of prediction equations for live weight. Preventative Veterinary Medicine. 78:333-338. Jones, R.S., T.L.J. Lawrence, A. Veevers, N. Cleave, and J. Hall. 1989. Accuracy of prediction of the liveweight of horses from body measurements. The Veterinary Record. 125:549- 553. Kertz, A.F., L.F. Reutzel, B.A. Barton, and R.L. Ely. 1997. Body weight, body condition score, and wither height of prepartum Holstein cows and birth weight and sex of calves by parity: A database summary. Journal of Dairy Science. 80:525-529. Kuene, N.W., A.E. Nesamvuni, and I.V. Nsahlai. 2009. Determination of prediction equations for estimating body weight of Zulu (Nguni) sheep. Small Ruminant Research. 84:41-46. Lane, M.A., R.L. Baldwin VI, and B.W. Jesse. 2000. Sheep rumen metabolic development in response to age and dietary treatments. Journal of Animal Science. 78:1990-1996. Lane, M.A., R.L. Baldwin VI, and B.W. Jesse. 2002. Developmental changes in ketogenic enzyme gene expression during sheep rumen development. Journal of Animal Science. 80:1538-1544. Mäntysaari, P., E.A. Mäntysaari. 2008. Relationship of body measurements and body condition
score to body weight in modern Finnish Ayrshire cows. Acta Agriculturae Scand Section A. 58:170-178.
McDaniel, B.T., J.E. Legates. 1965. Association between body weight predicted from heart girth and production. Journal of Dairy Science. 48:947-956. Milner, J., D. Hewitt. 1969. Weight of horses: improved estimates based on girth and length. Canadian Veterinary Journal. 10(12):314-316. Nagy, J.A., M.C. Kingsley, R.H. Russell, A.M. Pearson, and B.C. Goski. 1984. Relationships of
weight to chest girth in the Grizzly bear. Journal of Wildlife Management. 48(4):1439-1440.
Nelsen, T.C., R.E. Short, W.L. Reynolds, and J.J. Urick. 1985. Palpated and visually assigned condition scores compared with weight, height and heart girth in Hereford and crossbred cows. Journal of Animal Science. 60(2):363-368. Olatunji-Akioye, A.O., O.K. Adeyemo. 2009. Liveweight and chest girth correlation in commercial sheep and goat herds in southwestern Nigeria. International Journal of Morphology. 27(I):49-53.

57
Poe, S.E., D.G. Ely, G.E. Mitchell Jr, H.A. Glimp, and W.P. Deweese. 1971. Rumen development in lambs. II. Rumen metabolite changes. Journal of Animal Science. 32(5): 989-993. Poe, S.E. G.E. Mitchell, and D.G. Ely. 1972. Rumen development in lambs. III. Microbial B-vitamin synthesis. Journal of Animal Science. 34(5):826-829. Reavell, D.G. 1999. Measuring and estimating the weight of horses with tapes, formulae, and by
visual assessment. Equine Veterinary Education. 11(6):314-317. Rideout, C.B., G.L. Worthen. 1975. Use of girth measurement for estimating weight of mountain goats. Journal of Wildlife Management. 39(4):705-708. Smart, C.W., R.H. Giles Jr, D.C. Guynn. 1973. Weight tape for white-tailed deer in Virginia. Journal of Wildlife Management. 37(4):553-555. Swan, G.E., H.B. Groenewald. 2000. Morphological changes associated with the development of the rumino-reticulum in growing lambs fed different rations. Onderstepoort Journal of Veterinary Research. 67:105-114. Walker, D.M. 1959. The development of the digestive system of the young animal. III.
Carbohydrase enzyme development in the young lamb. Journal of Agric. Science. 53:374-380.
Wanderstock, J.J., G.W. Salisbury. 1946. The relationship of certain objective measurements to weights of beef cattle. Journal of Animal Science. 5:264-271. Wardrop, I.D., J.B. Coombe. 1961. The development of rumen function in the lamb. Australian Journal of Agric. Research. 12:661-680. Wardrop, I.D. 1961. Some preliminary observations on the histological development of the fore- Stomachs of the lamb. I. Histological changes due to age in the period from 46 days of foetal life to 77 days post-natal life. Journal of Agric. Science. 57:335-341. Žitňan, R., A. Bomba, A. Sommer, and L. Kolodzieyski. 1993. Development of rumen metabolism and ruminal epithelium in lambs. Arch. Anim. Nutr. 44:227-233.


