Embed Size (px)
Citation preview

INTERNATIONAL JOURNAL OF CLIMATOLOGY, VOL. 9,601-618 (1989) 551.577.32(548.7):551.513.7
RELATIONSHIPS BETWEEN THE SOUTHERN OSCILLATION A N D THE RAINFALL OF SRI LANKA
RAMASAMY SUPPIAH Institute of Geoscience. University of Tsukuba. Ibaraki 30.5, Japan
Received 26 July 1988 Revised 24 October 1988
ABSTRACT
The Southern Oscillation (SO) signals in the monthly and seasonal rainfall of Sri Lanka are studied by using statistical analyses. Correlation coefficients (CCs) between the rainfall of the first intermonsoon season (March-April) and the seasonal Southern Oscillation Index (SOI) of August-September-October (ASO) and November-December-January (NDJ) are positive and significant. In particular, March rainfall in region A is significantly correlated with the subsequent SO1 of A S 0 and NDJ. The CC between the rainfall of the southwest monsoon season (May-September) and the SO1 is also positive. Cumulative rainfall of the peak monsoon months (July and August) reveals a strong and positive correlation with the seasonal SOL
The CC between the rainfall of the second intermonsoon season (October-November) and the SO1 is negative and significant. The rainfall of this season is also significantly correlated with the SO1 (Tahiti-Darwin) of May-June-July (MJJ). The SO1 of MJJ serves as a particularly useful predictor for this seasonal rainfall. The CC between the rainfall of the northeast monsoon season (December-February) and the SO1 is also negative but weak.
Large signals appear in wind anomalies over Sri Lanka prior to El Nifio/Southern Oscillation (ENSO) events. Upper level easterlies (westerlies) and weak (strong) low-level easterlies are dominant in March before the La Nifia (El Nifio) years. These wind anomalies persist until the ENSO events reach maturity.
Based on the results of correlation analysis and wind anomalies, schematic models of the zonal circulation along the Equator between 60"E and 140"W are presented for La Niiia and El Niiio phases for northern hemispheric summer and winter seasons.
KEY WORDS Rainfall fluctuation regions Rainfall Srj Lanka Seasonal rainfall and Southern Oscillation
INTRODUCTION
The dominant large-scale atmospheric system in the tropics is the Southern Oscillation (SO), a phenomenon defined statistically by Walker and Bliss (1932). The SO is characterized by the variations of pressure difference between the Indonesian low and the South Pacific subtropical high. The SO signals have been observed in sea-surface temperature (SST) anomalies (Weare et al., 1976), rainfall (Berlage, 1957; Fleer, 198 I), surface wind anomalies (Rasmusson and Carpenter, 1982) and upper wind anomalies (Arkin, 1982). It is closely linked with the oceanic event called El Niiio, a striking phenomenon involving large-scale interannual variations of SSTs, sea level, currents, thermocline and wind and rainfall over the tropical Pacific Ocean, particularly in the east (Bjerknes, 1969; Wyrtki, 1975; Philander, 1983). El Niiio events are associated with warm SST anomalies, which are related to weak trade winds, and therefore to a weak pressure gradient between the Indonesian Low and the South Pacific subtropical high. Based on these conditions, Bjerknes (1 969) proposed a thermally driven east-west circulation pattern along the Equator for which the Indonesian region or 'maritime continent' acts as the main source region releasing a large amount of latent heat to the atmosphere (Ramage, 1968). The term La Niiia refers to a phase opposite to an El Niiio phase (Philander, 1985). El Niiio and the SO together comprise a complex system of climate fluctuations presently termed the El Niiio/Southern Oscillation (ENSO) phenomenon.
0899-841 8/89/060601-18$09.00 0 1989 by the Royal Meteorological Society

602 R. SUPPIAH
Recently, Rasmusson and Carpenter (1983) demonstrated below-normal rainfall during June-September over India, particularly in central India, and above-normal rainfall between October and December over Sri Lanka and south-east India associated with warm SST anomalies over the eastern equatorial Pacific. Such relationships have been confirmed by Behrend (1987) using the cross-correlation method. These studies have clearly shown the relationship between the SO and autumn or second intermonsoon season rainfall, but not for the other seasons in Sri Lanka where seasonality in rainfall and its relationships with atmospheric circulations of the lower latitudes are strong.
The main purpose of this study is to contribute to an understanding of the teleconnection patterns between the SO phenomenon and the monthly and seasonal rainfall over Sri Lanka, and their time lags. First, a brief description of seasonal rainfall distribution is given. Second, statistical relationships between the SO phenomenon and monthly and seasonal rainfall are given. Third, the relationship between wind variations over Sri Lanka and the ENS0 phenomenon is discussed. Finally, anomalous circulation features are given for northern hemispheric summer and winter seasons in relation to La Niiia and El Niiio years.
DATA AND METHOD
Rainfall data
The basic set of rainfall data used in the study consists of monthly mean rainfall values for 29 stations for 100 years (1881-1980). The data were obtained from a recent publication (Yoshino and Suppiah, 1982) and from manuscripts in the Department of Meteorology, Colombo, Sri Lanka. Figure 1 shows the location of the rainfall stations and the different rainfall regions of Sri Lanka used in this study. These regions were demarcated in an earlier study (Suppiah and Yoshino, 1984) using the space coefficients of an empirical orthogonal function analysis.
Southern Oscillation Index (Sol)
Walker and Bliss ( 1 932) incorporated pressure, temperature and rainfall in their Sol. However, pressure alone has been suggested for this index (Troup, 1965; Quinn and Burt, 1972; Chen, 1982), but other indices based on rainfall and temperature are still used. Among the weather stations of the Pacific and Indian Oceans, Tahiti (18"S,15ODW) and Darwin (12"S,13loE) show a strong negative relationship in their pressure anomalies (Trenberth, 1976). Pressure anomalies at these two stations were recommended by Chen (1982) for diagnostic analyses of interannual climate variation studies. In the present study, the index documented by Parker (1983) has been used to analyse the monthly and seasonal relationships. Because the Tahiti station only opened in 1935, another index, that of Wright (1975), was used to analyse the long-term relationship for the last 100 years. Wright's index was derived from a principal component analysis on pressure data from Cape Town, Bombay, Djakarta, Darwin, Adelaide, Apia, Honolulu, and Santiago. The seasonal SO1 is available for four different seasons, i.e. FMA (February-March-April), MJJ (May-June-July), AS0 (August-September- October) and NDJ (November-December-January).
Upper wind data
Upper air data for Colombo were obtained from the manuscripts and published reports of the Department of Meteorology, Colombo. Data at ten levels (850, 700, 600, 500, 400, 300, 200, 150, 100, and 70 mbar) were analysed for the period from 1961 to 1980. Wind data for Singapore and Darwin were taken from Monthly Climatic Data for the World.
Methods
To study the monthly and seasonal relationships between the SO1 and rainfall, mean monthly rainfall and seasonal rainfall for the rainfall regions and for Sri Lanka as a whole have been calculated. Normalized values

SOUTHERN OSCILLATION AND SRI LANKAN RAINFALL 603
Figure 1 . Locations of stations and different rainfall regions of Sri Lanka. A, B, C, D, and E represent the different rainfall regions explained in the text. After Suppiah and Yoshino (1984)
of rainfall were used in all calculations. Relationships between the SO1 and the rainfall of Sri Lanka were analysed by cross-correlation and lag-correlation methods.
SEASONAL RAINFALL DISTRIBUTION
Most Sri Lankan rainfall is received from weather phenomena associated with the Inter Tropical Convergence Zone (ITCZ) and from two monsoons, the southwest and the northeast. Therefore, the rainfall exhibits a marked seasonality in its spatial and temporal aspects. In particular, the rainfall of March and April is produced by the northward migration of the ITCZ and the rainfall of October and November is associated with the southward migration of the ITCZ. These two transitional seasons are known as the intermonsoon seasons. The months of March and April comprise the first intermonsoon season and the months of October and November the second intermonsoon season. May to September comprises the southwest monsoon season and December to February the northeast monsoon season. Together with the influences of the ITCZ

604 R. SUPPIAH
A l t i t u d e (m)
Figure 2. General topography of Sri Lanka
and the monsoons, topography (see Figure 2) also plays an important role in influencing the spatial pattern of rainfall. Therefore, the rainfall pattern of Sri Lanka has multiple origins. It is strongly influenced by global and synoptic circulations and also, from time to time, by meso-scale weather systems. In Sri Lanka, clear peaks in rainfall are observed in March-April and October-November, except for the eastern part. Even in the south- west monsoon months, the influence of the ITCZ is felt because its location is closely related to the summer monsoon trough over South Asia and the influence is well pronounced in the peak monsoon months, July and August (Krishnamurti, 1971). Moreover the seasonal rainfall pattern is mixed with the southwest monsoon rainfall in the western part and with the northeast monsoon rainfall in the eastern part of the island.
Detailed descriptions of the seasonal distribution of rainfall in Sri Lanka are given by Thambyahpillay (1954) and Domroes (1974). Therefore, only a brief description of the subject is given here, because this study mainly deals with the seasonal relationships. During the first intermonsoon season the southwest quadrant of Sri Lanka experiences a great amount of rainfall (more than 300 mm), while the remaining parts receive less, especially the north of the country (Figure 3a). In this season, rainfall is frequently associated with thunderstorms, depending on local thermal conditions due to the influence of the ITCZ.

SOUTHERN OSCILLATION AND S R I LANKAN RAINFALL 605
DECEMBER o : s w T O FEBRUARY
I
Figure 3. Seasonal rainfall (mm) distribution of Sri Lanka
Figure 3(b) shows the distribution of rainfall in the southwest monsoon season. It reveals a clear contrast in its spatial pattern which is strongly influenced by topography. The amount of rainfall received by places during the 5-month period ranges from under 100 mm to over 2000 mm. The region of maximum rainfall greater than 1000 mm covers the southwest quadrant of the island. A small rainy area is also found along the western slopes of the eastern hills. The Uva Basin and the southeast and northwest coastal belts of the island experience much less rainfall.
During the intermonsoon season the entire island receives a great amount of rainfall, with nearly everywhere experiencing more than 400 mm (Figure 3c). However, the southwest quadrant experiences most rainfall. The northwest and southeast parts of the island also receive considerable amounts of rainfall during this season.
There are two distinct maximum rainfall regions in the northeast monsoon season, as shown in Figure 3(d). One is located on the eastern slopes of the central highlands and the other is along the eastern coast from Batticaloa to Trincomalee. Two regions of minimum rainfall are also found, one on the west coast, the other

606 R. SUPPIAH
on the south coast. The spatial pattern of rainfall during this season does not reveal as much contrast from one area to another as does the pattern during the southwest monsoon.
SEASONAL RELATIONSHIPS BETWEEN RAINFALL AND THE SO1
First intermonsoon season
Weak positive correlation coefficients (CCs) appear between the rainfall of this season and the seasonal SOX when Sri Lanka is considered as a single unit. They vary considerably among the different rainfall regions, as shown in Table I. The rainfall of region A, where more rainfall is received from strong convective systems during this season, is positively correlated with the subsequent SO1 of A S 0 and NDJ. In particular, the March rainfall of this region reveals strong correlations with the SO1 of AS0 and NDJ, indicating r =0.26 and r = 0.22, significant at the 1 per cent and 5 per cent levels, respectively. Not only are the relationships weak for the other regions, but they are statistically insignificant.
Southwest monsoon seuson
The relationship between the SO1 and the rainfall of this season is also positive. During this season, CCs become stronger when the selected periods become shorter, i.e. May-September, r =Od6 ( n = loo), June -September, r = 0.26, July-September, r = 0.29 and July and August, r = 043. The pattern of relationships varies among the different rainfall regions of the island. As shown in Table 11, CCs are stronger for regions D
Table I. Correlation coefficients between the rainfall of the first intermonsoon season (March and April) and the seasonal SOI. First
letters of the months are given for the SO1 seasons at the top
Region FMA MJJ A S 0 NDJ
A 011 0.18 0.24 0.25 B 006 0.06 0.07 016 C 0.07 015 0.16 0.17 D 014 0.07 0.12 010 E 010 0.14 0.08 0.08
Sri Lanka 011 0.15 0.16 0.19
Significance levels for 1 per cent and 5 per cent are 0.25 and 0.20, respectively (n=IW).
Table 11. Correlation coefficients between the seasonal SO1 and the July and August rainfall of Sri Lanka. First letters of the months are
given for the SO1 seasons at the top
Region FMA MJJ A S 0 NDJ
A -0.12 0.22 0.21 0.14 B 000 0.30 0.33 0 1 5 C 0.0 1 0.28 0.35 0.16 D 0.25 0.46 0.55 039 E 0.13 0.39 0.44 0.33
Sri Lanka -0.01 0.37 0.43 0.25 ~ ~~~ ~ ~
Significance levels for 1 per cent and 5 per cent are 0.25 and 0.20, respectively (n = 100).

Tab
le 1
11.
Ran
ked
rain
fall
depa
rtur
es in
Jul
y an
d A
ugus
t dur
ing
the
sout
h-w
est m
onso
on se
ason
of
Sri L
anka
: E de
note
s th
e El
Niii
o ev
ents
as
take
n fr
om
Ras
mus
son
and
Car
pent
er (1983), L d
enot
es t
he L
a N
iiia
even
ts a
s ta
ken
from
Wri
ght (1975) a
nd P
arke
r (1983) an
d SD
is g
iven
for
norm
aliz
ed r
ainf
all
.-
Ran
k SD
Y
ear
Ran
k SD
Y
ear
Ran
k SD
Y
ear
Ran
k SD
Y
ear
Ran
k SD
1 2 3 4 5 6 7 8 9 10
11
12
13
14
15
16
17
18
19
20
-1.81
1943
-1.60
1888
-1.37
1929
-1.23
1952
-1.23
El899
-1.20
El911
-1.17
1940
-1.16
1908
-1.09
El905
-1.08
1920
-1.05
El930
-1.05
1890
-1.02
El918
-1.01
El914
-0.96
1894
-096
El925
-0.95
1979
-0.93
1980
-0.93
El972
-0.93
1922
21
22
23
24
25
26
27
28
29
30
31
32
33
34
35
36
37
38
39
40
-0.92
1977
-0.84
1945
-0-82
1978
-0.82
1913
-0.79
L1956
-0.79
1901
-0.78
1966
-0.76
1944
-0.76
El976
-0.76
El891
-0.75
1927
-0.74
El951
-0.68
1936
-0.68
El957
-0.67
El896
-0.65
1943
-0.62
1898
-0.61
1958
-0.6
0 1948
-0.5
8 1895
41
42
43
44
45
46
47
48
49
50
51
52
53
54
55
56
57
58
59
60
- 0.54
- 0.52
- 0.
5 1
- 0.47
- 0.45
-0.33
- 028
-0.21
- 0.2 1
-0.16
-0.11
- 0.07
- 0.03
- 0-02
- 0.02
0.0 1
0.07
0.07
0.10
0.10
1912
1935
El884
1885
L1955
1973
L1893
E 1887
E 1969
L1968
1919
L1950
El941
1904
E 1902
1917
1970
1946
1967
1881
61
0.1 1
62
011
63
0.14
64
0.15
65
022
66
0.25
67
0.30
68
0.31
69
0.34
I0
0.42
71
0.45
72
047
73
0.55
74
062
75
069
76
0.78
77
0.78
78
080
79
0.86
80
092
E 1939
81
1954
82
L1938
83
L1962
84
1892
85
L1889
86
L1975
87
1942
88
1907
89
L1914
90
1926
91
1959
92
1937
93
L1971
94
L1903
95
L1921
96
El965
97
L1961
98
1910
99
1906
100
0.96
0.97
1 a4
1.13
1.13
1.21
1.3 1
1.36
1.36
1.40
1.51
1.57
1.57
1.68
2.02
2.03
2.18
2.25
2.50
2.52
Yea
r 5 5
1963
2: 0
1960
Ln fi
1928
r
El932
1915
4 s
L 1886
z L1924
1931
0 E
1883
L1933
r
El923
1900
1947
P
El953
L1916
L 1909
L1882
*1
L1897
?
P
P
Z v,
L1964
% E 3 XI
P r
1949
r

608 R. SUPPIAH
and E, where the southwest monsoonal winds usually blow as a warm fohn-like wind and thus cause high air temperature, and low rainfall and relative humidity. Regions D and E receive a great amount of convective rainfall during break-monsoon conditions. Regions A, B and C show weaker CCs than Regions D and E, though the values are still significant at the 1 per cent level. It is clearly seen from Table I11 that most of the El Niiio years had below-normal rainfall and most La Niiia years had above-normal rainfall.
However, CCs drop to 0.37 and -0.01 when the SO1 leads rainfall by one and two seasons, respectively. A similar pattern of relationship was reported between the Indian summer monsoon rainfall and the seasonal SO1 (Pant and Parthasarathy, 1981; Rasmusson and Carpenter, 1983; Parthasarathy and Pant, 1984). These findings suggest that the possibility of forecasting the mid-season southwest monsoon rainfall in Sri Lanka from the SO1 alone has a limited potential.
Second intermonsoon season
Unlike the relationships in the other seasons, the rainfall of the second intermonsoon season and the seasonal SOIs show a strong negative relationship, as shown in Table IV. The second intermonsoon season is related to the SO1 with from - 3 to 0 seasons' lag. The relationship is strong with the periods of MJJ and ASO. Ranked rainfall anomalies in Table V also indicate that the above- (below-) normal rainfall values are related to the El Niiio (La Niiia) years.
Since the SO1 provided by Wright (1 975) is not easily extendable, correlation coefficients between the SO1 of Tahiti minus Darwin pressure and the rainfall of the second intermonsoon months were calculated, because the pressure difference between these stations can be updated easily. Figure 4 illustrates the relationships between the monthly SO1 and the rainfall of October and November, which coincides with the beginning of the main crop season in Sri Lanka. Since CCs are stronger for May-June-July (MJJ) and the monthly pressure values show much noise (Wright, 1985), the mean value of the SO1 of MJJ is suggested as a predictor for rainfall anomalies of the second intermonsoon season. The relationship between the rainfall of the second intermonsoon season and the SO1 of MJJ is given in Figure 5. This figure reveals that the above- (below-) normal rainfall at the beginning of the main crop season over Sri Lanka could be predicted one season in advance using the SOI. Here the rainfall figure used in the calculation is the mean value for Sri Lanka, because the rainfall of this season reveals weak spatial variability over the island.
Figure 4 also suggests that the relationship between the monthly SO1 and October rainfall first appears in the month of March when signals in SST anomalies first appear off the South American coast (Rasmusson and Carpenter, 1982) and gradually build-up with minor fluctuations toward the concurrent month, which coincides with the mature stage of E N S 0 events. The gradual strengthening of the relationship between the rainfall of the second intermonsoon season and the SST anomalies of the Pacific and Indian Oceans has been demonstrated by Suppiah (1988). This pattern is closely related to the SO. However, Chiu and Newel1 (1983) reported that the equatorial Pacific SST changes lead those of the Indian Ocean by 2 4 months.
Table IV. Correlation coefficients between the rainfall of the second intermonsoon season (October and November) and the seasonal SOL First letters of the months are given for the SO1 seasons at the top
Region FMA MJJ A S 0 NDJ
A B C D E
-0.16 -041 - 0.43 - 0.32 - 0.2 1 - 0.48 - 0.49 -0.35 - 0.30 - 0.57 - 0.60 - 0.42 - 0.22 - 0.49 - 0.50 -0.35 - 0.20 - 0.45 - 0.54 - 0.40
Sri Lanka - 0.24 - 0.54 -0.59 - 0.43
Significance levels for 1 per cent and 5 per cent are 0.25 and 0.20, respectively (n=lOo).

Tabl
e V.
Ran
ked
rain
fall
depa
rtur
es in
the
seco
nd in
term
onso
on se
ason
of S
ri L
anka
: (E)
den
otes
the
El N
iiio
even
ts as
take
n fr
om R
asm
usso
n an
d C
arpe
nter
(1
983)
, L d
enot
es th
e La
Niii
a ev
ents
as
take
n fr
om W
righ
t (1
975)
and
Park
er (
1983
) and
SD
is g
iven
for
nor
mal
ized
rai
nfal
l
Ran
k SD
Y
ear
Ran
k SD
Y
ear
Ran
k SD
Y
ear
Ran
k SD
Y
ear
Ran
k SD
3 4 5 6 7 8 9 10
11
12
13
14
15
16
17
18
19
20
- 2.
92
-2.6
1 - 1.
87
- 1.
64
- 1.
50
- 1.
46
- 1.
46
- 1.
41
- 1.
33
- 1.
26
- 1.
20
- 1.
14
-1.1
1 - 1.
10
- 1.
09
- 1.
06
- 1.
01
- 0.
92
- 0.
9 1
- 0.
89
L197
4 L1
938
L189
7 L1
971
1908
19
47
L191
6 L1
889
1917
19
42
L195
0 L
1924
L1
964
L190
3 19
27
L188
6 19
04
1952
19
49
L195
5
21
22
23
24
25
26
27
28
29
30
31
32
33
34
35
36
37
38
39
40
-0.8
7 -0
.86
-0.8
2 -0
.77
- 0.
70
- 0.
70
-059
-0
55
- 0.
48
- 0.
47
- 0.
45
- 0.
44
- 0.
44
- 0.
43
- 0.
42
- 0.
40
- 0.
34
- 0.
29
- 02
9 - 0.
25
1936
L1
909
1929
18
90
L196
8 19
19
1954
19
01
1915
19
73
1948
L1
975
1926
19
80
1892
L1
921
1937
19
58
1931
L1
962
41
42
43
44
45
46
47
48
49
50
51
52
53
54
55
56
57
58
59
60
-0.2
1 - 02
0 - 0.
20
-0.1
7 -0
.17
-0.1
6 -0
.1 1
- 0.
08
- 0.
07
- 0.
04
- 0.
02
- 0.
02
0.02
00
5 0.
06
0.09
01
0 01
1 0.
11
0.15
1960
L1
956
El95
1 El
918
El88
7 El
969
L193
3 19
59
1894
L1
893
1910
19
12
El97
6 E
1905
18
81
El95
3 19
66
1970
L1
882
1888
61
017
62
0.20
63
0.
23
64
0.31
65
0.
41
66
0.51
67
0.52
68
05
2 69
0.
62
70
0.63
71
0.
66
72
0.66
73
07
0 74
0.
72
75
0.77
76
Q
77
77
0.81
78
08
4 79
0.
86
80
088
1943
El
899
El92
3 19
34
L196
1 18
95
El93
9 19
00
1978
19
35
El9
11
El88
4 19
07
1883
19
46
1898
19
79
El93
2 19
13
El91
4
81
82
83
84
85
86
87
88
89
90
91
92
93
94
95
96
97
98
99
100
0.88
0.88
0.
92
1.01
1.
03
1.05
1.
06
1.18
1 -
20
1.30
1.
37
1.38
1.
41
1.43
1.
50
164
1.76
1.
80
1.99
2.
60
~
Yea
r Is s
1977
5
El96
5 z 2
1944
2
El89
6 r
1920
r 8
El92
5 18
85
5 19
45
1940
v)
1928
E
1922
2
U E
1967
2
El97
2 E
l930
1963
P
1906
r
El9
41
r
El8
91
El90
2
El95
7 L 5 >

610 R. SUPPIAH
01
0.0 Z Lu 2 -0.1 L L UJ
V O -0.2
!?
5
Z 0 -0.3 - 2 UJ -0.4 a
V -0.5
- 0.6
\ \ \ \
1 1 1 1 1 1 1 1 1 1 1
J F M A M J J A S O N D
Sol- MONTH
Figure 4. Relationship between monthly SO1 (Tahiti-Darwin) and October and November rainfall anomalies of Sri Lanka
3 . 0 ~ 1 1 1 1 1 i l l I 1 1 1 1 I 1 1 1 1 1 I l I
- 1.5 -0.3 0.9 2.1 3.3
SOI ( MAY- JULY) Figure 5. Relationship between second intermonsoon season rainfall anomalies and the SO1 of MJJ showing a negative correlation coefficient ( r = -0.61). Regression equation for the line is y= - 0 . 5 6 4 ~ +0.636. Here y and x denote the rainfall anomalies and the SO1 for
MJJ. Mean rainfall of the season is 572 mm and the standard deviation is 127 mm

61 1 SOUTHERN OSCILLATION AND SRI LANKAN RAINFALL
Northeast monsoon season
Northeast monsoon rainfall is negatively correlated with the seasonal SOL The negative CC (r = - 0.22) between the northeast monsoon rainfall and the SO1 of AS0 is significant at the 5 per cent level, as shown in Table VI. Moreover, CCs are weak between the seasonal SO1 and the rainfall of this season when Sri Lanka is considered as a single unit, but they vary considerably among the different rainfall regions. In particular, CCs are weaker in regions D and E, where the northeast monsoon usually gives a great amount of rainfall due to orographic triggering, and stronger in regions A and B where the northeast monsoon gives little or no rain. Ranked rainfall departures for the northeast monsoon season in Table VII generally suggest that above- (below-) normal rainfall anomalies are associated with the weak (strong) SO1 though some El Niiio (La Niiia) years show below- (above-) normal rainfall. Above-normal rainfall anomalies in this season are also caused by tropical depressions and cyclones that originate in the southern part of the Bay of Bengal and strike Sri Lanka, particularly in December.
UPPER WINDS OVER SRI LANKA AND THE ENS0 PHENOMENON
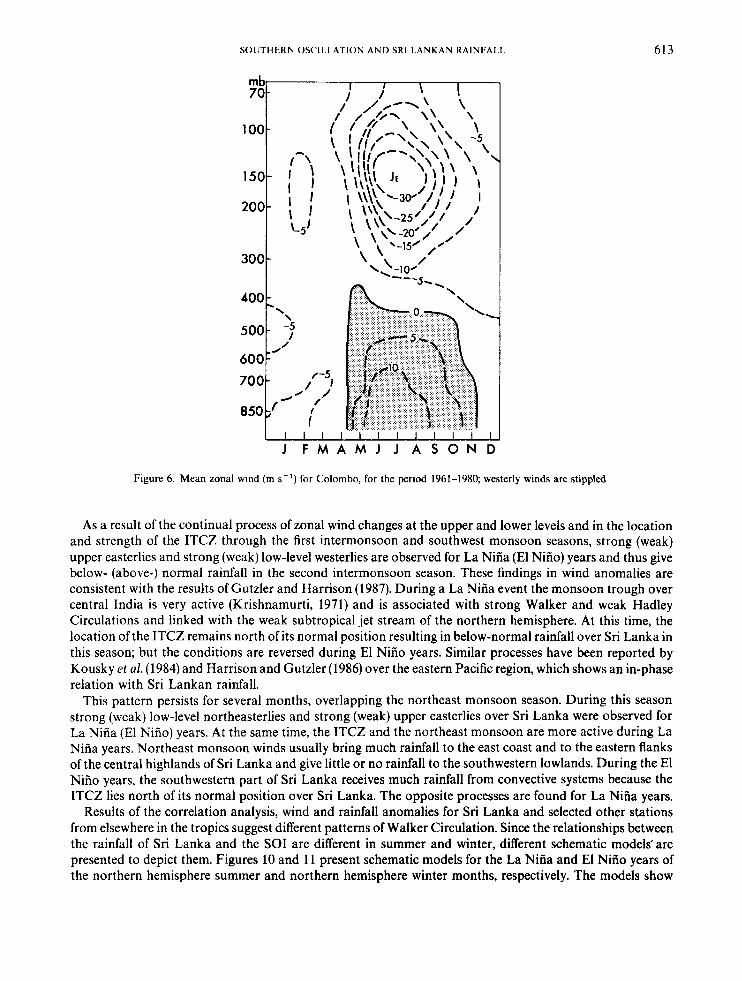
For mean conditions, as illustrated in Figure 6, easterlies predominate at the lower and upper levels during the first intermonsoon season. In the southwest monsoon season, strong upper level easterlies and strong low- level westerlies are observed. During the second intermonsoon season, moderate westerlies are found at low- levels and easterlies at upper levels. In the northeast monsoon season, weak easterlies are observed at both upper and lower levels. The patterns of wind components described above vary considerably between the La Niaa and El Niiio years. Though variations in components are observed throughout the year, they are particularly striking at the beginning of the intermonsoon seasons in March and in October. Zonal wind components for March in Figure 7(a) reveal weak (strong) easterlies at the lower level and easterlies (westerlies) at the upper level in March. This pattern is strengthened in October, as shown in Figure 7(b).
Figures 8 and 9 show the composite patterns of wind components at Colombo for La Niiia and El Niiio years. Here the La Niiia years include 1964, 1968, 1971,1974, and 1975, and the El Niiio years include 1965, 1969,1972, and 1976. During the early stage of an El Niiio event, the ITCZ is usually weak and lies far south of its mean position and thus gives little or no rainfall to Sri Lanka. This condition is associated with strong lower easterlies and upper westerlies. By contrast, strong upper level easterlies and weak low-level easterlies were observed for La Niiia years. This situation is associated with an active ITCZ and therefore with more rainfall over Sri Lanka.
In the southwest monsoon season strong (weak) upper level easterlies are observed and strong (weak) low- level westerlies are found for La Niiia (El Niiio) years. Strong (weak) monsoon circulation and above- (below-) normal rainfall occur over India (Shukla, 1987) and Sri Lanka (Suppiah, 1987). Krishnamurti and Kanamitsu (1981) also reported weak upper easterlies and weak low-level westerlies for a drought monsoon condition in 1972.
Table VI. Correlation coefficients between the seasonal SO1 and north-east monsoon season (December to February) rainfall. First
letters of the months are given for the SO1 seasons at the top
Regions FMA MJJ A S 0 NDJ
A -0.22 - 025 - 026 - 020 B -0.26 - 0.2 1 - 0.24 -0.16 C -019 -0.10 -0.17 -0.13 D - 0.2 1 -0.11 -0.18 -018 E -0.10 -016 -0.17 -0.15
Sri Lanka -018 -017 -022 -0-18
Significance levels for 1 percent and 5 per cent are 0.25 and 0.20, respectively (n = loo).

Tabl
e V
II.
Ran
ked
rain
fall
depa
rtur
es in
the
nort
h-ea
st m
onso
on s
easo
n of
Sri
Lank
a: E
den
otes
the
El N
iiio
even
ts ta
ken
from
Ras
mus
son
and
Car
pent
er
(198
3), L
den
otes
the
La N
iiia
even
ts a
s ta
ken
from
Wrig
ht (
1975
) and
Par
ker
(198
3), a
nd S
D is
giv
en f
or n
orm
aliz
ed r
ainf
all
Ran
k SD
Y
ear
Ran
k SD
Y
ear
Ran
k SD
Y
ear
Ran
k SD
Y
ear
Ran
k SD
Y
ear
1 2 3 4 5 6 7 8 9 10
11
12
13
14
15
16
17
18
19
20
-1.7
9 19
80
-1.6
5 E
l905
-1
.64
1915
-1
.57
1979
-1
.57
1944
-1
.51
L195
5 -1
.38
1883
-1
.30
El9
39
-1-2
2 L1
893
-1.2
2 19
79
-1.2
2 E
l972
-1
.19
1892
-1
.15
1934
-1
.03
1928
-1
.03
El9
41
-1.0
1 L1
975
-1.0
1 19
45
-1.0
0 L1
889
-0.8
7 19
07
-0.8
5 19
58
21
22
23
24
25
26
27
28
29
30
31
32
33
34
35
36
37
38
39
40
- 0.
80
- 0.
79
- 0.
78
- 0.
76
- 0.
75
- 0.
75
- 0.
74
- 0.
70
- 0.
70
- 0.
63
-0.6
1 - 0.
50
- 0.
49
- 0.
48
-0.4
7 - 0.
45
- 0.
44
- 0.
4 1
- 0.
4 1
-0.4
1
L188
6 E
l976
19
06
L196
8 L1
964
1978
L1
938
L 19
09
1894
19
10
El9
30
El9
18
1952
18
88
1890
E
l899
L1
974
1927
19
60
1967
41
42
43
44
45
46
47
48
49
50
51
52
53
54
55
56
57
58
59
60
-0.4
0 L1
971
-0.3
9 L1
956
-0.3
5 19
47
-033
19
17
-0.3
2 19
73
-0.3
2 19
66
-024
19
70
-0.2
3 19
04
-0.2
1 19
00
-0.2
0 19
01
- 0.
1 1
5188
4 -0
.09
1908
--
0.06
19
20
-0.0
5 19
19
0.05
E
l925
0.
06
L192
1 0.
10
El9
02
0.11
19
26
0.14
19
22
0.16
L1
916
61
0.19
62
0.
22
63
0.26
64
0.28
65
0.
34
66
0.35
67
0.
39
68
0.39
69
0.
42
70
0.53
71
0.
57
72
0.58
73
0.
62
74
0.63
75
0.
68
76
0.71
77
0.
79
78
0.80
79
08
1 80
0.
82
1940
E
1965
L1
961
El9
53
1937
L
1924
19
49
El9
51
1929
E
l914
L1
933
1885
19
31
1913
19
63
1935
L
1903
19
42
1948
L1
950
81
083
82
0.84
83
08
5 84
08
9 85
0.
92
86
0.99
87
0.
99
88
1 .oo
89
1.09
90
1.
32
91
1.36
92
1.
45
93
1.58
94
1.
60
95
1.79
96
1.
94
97
2.10
98
2.
50
99
2.59
10
0 2.
96
El9
11
1898
E
l887
E
l923
L1
962
L 18
97
L188
2
1959
1943
19
46
1936
18
81
El8
96
1954
E
l969
E
l957
19
12
El8
91
P
1895
$ 5
El9
32
X
SOUTHERN OSCILLATION AND SRI LANKAN RAINFALL 613
70
100-
-
t-\,
200- I ’
150- I I ’
\ I L5’
300 -
400
500- -; 600
\ \
1
J F M A M J J A S O N C
Figure 6. Mean zonal wind (m s - ’ ) for Colombo, for the period 1961-1980 westerly winds are stippled
As a result of the continual process of zonal wind changes at the upper and lower levels and in the location and strength of the ITCZ through the first intermonsoon and southwest monsoon seasons, strong (weak) upper easterlies and strong (weak) low-level westerlies are observed for La Niiia (El Niiio) years and thus give below- (above-) normal rainfall in the second intermonsoon season. These findings in wind anomalies are consistent with the results of Gutzler and Harrison (1987). During a La Niiia event the monsoon trough over central India is very active (Krishnamurti, 1971) and is associated with strong Walker and weak Hadley Circulations and linked with the weak subtropical jet stream of the northern hemisphere. At this time, the location of the ITCZ remains north of its normal position resulting in below-normal rainfall over Sri Lanka in this season; but the conditions are reversed during El Niiio years. Similar processes have been reported by Kousky et al. (1984) and Harrison and Gutzler (1986) over the eastern Pacific region, which shows an in-phase relation with Sri Lankan rainfall.
This pattern persists for several months, overlapping the northeast monsoon season. During this season strong (weak) low-level northeasterlies and strong (weak) upper easterlies over Sri Lanka were observed for La Niiia (El Niiio) years. At the same time, the ITCZ and the northeast monsoon are more active during La Niiia years. Northeast monsoon winds usually bring much rainfall to the east coast and to the eastern flanks of the central highlands of Sri Lanka and give little or no rainfall to the southwestern lowlands. During the El Niiio years, the southwestern part of Sri Lanka receives much rainfall from convective systems because the ITCZ lies north of its normal position over Sri Lanka. The opposite processes are found for La Niiia years.
Results of the correlation analysis, wind and rainfall anomalies for Sri Lanka and selected other stations from elsewhere in the tropics suggest different patterns of Walker Circulation. Since the relationships between the rainfall of Sri Lanka and the SO1 are different in summer and winter, different schematic models-are presented to depict them. Figures 10 and 11 present schematic models for the La Niiia and El Niiio years of the northern hemisphere summer and northern hemisphere winter months, respectively. The models show

614
100-
150-
200
300
400-
500
600- 700-
850
R. SUPPIAH
-
-
-
-
mb 70D
L
MARCH
\
I I I /
\ I
/ / /
1 -
4 2 0 - 2 - 4 - 6 - 8
70
100-
-
150-
200 -
300-
400-
500-
600- 700-
850-
OCTOBER
1 1 1 1 I I I I I I I I I I
8 4 0 -4 -8 -12 -16 -18 ZONAL WIND ( m r s ) ZONAL WIND ( m l s )
Figure 7. Zonal winds for March (a) and October (b). 1 , mean condition for 20 years; 2, La Nifia condition; 3, El Nifio condition
that a La Niiia year is associated with above-normal rainfall over Sri Lanka in the summer half of the year and that the reverse is the case in the winter half of the year. They also show that an El Niiio year is associated with below-normal rainfall over Sri Lanka in summer, and again that the reverse circulation pattern is true in winter.
CONCLUSIONS
The different rainfall regions of Sri Lanka exhibit either a winter maximum or winter and summer maxima. That pattern is closely related to the migrations of the ITCZ and to the southwest and northeast monsoons. Therefore, interannual variations in rainfall indicate distinct seasonal relationships with the variations of atmospheric circulations in the lower latitudes. Notably, the rainfall of the summer and winter halves of the year reveal significant positive and negative CCs with the SO phenomenon, which is stronger in the winter months of the northern hemisphere (van Loon and Madden, 1981).
Relationships are not clear in the first intermonsoon and northeast monsoon seasons if Sri Lanka is considered as a single unit. Yet the relationships are clear between the rainfall of the different regions and the seasonal SOI. In particular, the first intermonsoon rainfall of region A is positively correlated with the SO1 of

200-
300-
400-
50
0-
600-
, 7O
Or
850
-
1 I 1 / / I I I I I I I Il
ll
ll
ll
ll
Il
J
J F
MA
MJ
JA
SO
ND
Fi
gure
8.
Com
posi
te z
onal
win
d (m
s-')
con
ditio
n fo
r L
a N
iiia
even
ts.
Wes
terl
y w
inds
are
stip
pled
Fi
gure
9.
Com
posi
te z
onal
win
d (m
s-')
con
ditio
n fo
r El
Niii
o ev
ents
. W
este
rly
win
ds a
re s
tippl
ed

616
15-
';i 10- x -
c - I -
u -
!? w - x -
R. SUPPIAH
-
5 -
- -
0-
15
U
I 0 - 5 I W
60"E 80"
E x
!- U
I 5 t3 W
OmO( 100" 120" 140" 160" 180" 160" A
140" W Srl Lanka Singapore Darwin Canton
Island
Figure 10. Schematic models of the Walker Circulation along the Equator as determined from wind, SST and rainfall anomalies for the La Nifia (a) and El Niiio (b) phases of the northern summer. Warm and cold denote the warm and cold SST anomalies, respectively
Srl Lanka Slngaporo Darwln Canton Ieland
Figure 11. As in Figure 10, but for the northern winter

SOUTHERN OSCILLATION A N D SRI LANKAN RAINFALL 617
AS0 and NDJ, giving a signal in rainfall for the subsequent ENSO events. During the northeast monsoon season, the rainfall of region A reveals a significant negative relationship with a - 1 season lag.
During the southwest monsoon season the relationship is especially strong between the SO1 and the cumulative rainfall of July and August in the concurrent period and one season later. During these months, the rainfall of regions D and E shows a strong relationship with the SO1 because the regions have little rainfall with strong interannual variabilities.
The rainfall of the second intermonsoon season is negatively correlated with the SO1 at least two seasons earlier. This negative relationship first appears in the month of March and gradually develops to be stronger toward the October and November period, though the southwest monsoon masks the relationship between May and September. In particular, the SO1 of MJJ serves as a useful predictor for rainfall anomalies of the second intermonsoon season.
Signals in wind anomalies are observed over Sri Lanka prior to moderate and strong ENSO events. Upper easterlies (westerlies) and weak (strong) low-level easterlies are noticed for La Niiia (El Niiio) years. These wind anomalies persist until the maturity of ENSO events, and thus cause different patterns of the Walker Circulation in the summer and winter halves of the northern hemisphere.
ACKNOWLEDGEMENTS
I am grateful to Professor Masatoshi Yoshino and Dr Tetsuzo Yasunari of the University of Tsukuba for their helpful suggestions and encouragements. Thanks are due to anonymous referees who made useful comments on the manuscript. I would like to thank the Director, Department of Meteorology, Colombo, Sri Lanka for providing rainfall data. Most of the computations were made in the Sclence Information and Processing Center, University of Tsukuba.
REFERENCES
Arkin, P. A. 1982. ‘The relationships between interannual variability in the 200 mb tropical wind field and the Southern Oscillation’, Mon.
Bchrend, H. 1987. ‘Teleconnections of rainfall anomalies and of the Southern Oscillation over the entire tropics and their seasonal
Berlage, H. P. 1957. Fluctuations oJ the General Atmospheric Circulation ojmore than One Year, their Prognostic Value, Mededelin en
Bjerknes, J. 1969. ‘Atmospheric teleconnections from the equatorial Pacific’, Mon. Wea. Rev., 97, 163-1 72. Chen, W. Y. 1982. ‘Assessment of Southern Oscillation sea-level pressure indices’, Mon. Wea. Rev., 110, 8 W 8 0 7 . Chiu, L. S. and Newell, R. E. 1983. ‘Variations of zonal mean sea surface temperature and large-scale air-sea interaction’, Q. J . R.
Domroes, M. 1974. The Ayroclimute of’Ceylon, Franz Steiner Verlag, GMBH, Wiesbaden, p. 265. Flccr, H. 1981. ‘Teleconnections of rainfall anomalies in the tropics and subtropics’, in Lighthill, J. and Pearce, R. P. (Eds) Monsoon
Gutzler, D. S. and Harrison, D. E. 1987. ‘The structure and evolution of seasonal wind anomalies over the near-equatorial eastern Indian
Harrison, D. E. and Gutzler, D. S. 1986. ‘Variability of monthly-averaged surface and 850 mb winds at tropical Pacific islands’, Mon.
Kousky, V. E., Kagano, M. T. and Cavalcanti, I. F. A. 1984. ‘A review of the Southern Oscillation: oceanic-atmospheric circulation
Krishnamurti, T. N. 1971. ‘Tropical east-west circulations during the northern summer’, J . Atmos. Sci., 28, 1342-1347. Krishnamurti, T. N. and Kanamitsu, M. 198 1. ‘Northern summer planetary-scale monsoons during drought and normal rainfall months’,
Pant, G. 9 . and Parthasarathy, 9. 1981. ‘Some aspects ofan association between the Southern Oscillation and Indian summer monsoon’,
Parthasarathy, B. and Pant, G. B. 1984. ‘The spatial and temporal relationships between the Indian summer monsoon rainfall and the
Parker, D. E. 1983. ‘Documentation of a Southern Oscillation index’, Meteorol. Mag., 112, 184-188. Philander, S. G. H. 1983. ‘El Nino Southern Oscillation phenomena’, Nature, 302, 295-301. Philander, S. G . H. 1985. ‘El Niao and La Nina’, J . A m o s . Sci., 42, 2652-2662. Quinn, W. H. and Burt, W. V. 1972. ’Use of the Southern Oscillation in weather prediction’, J . Appl. Meteorol., 11, 6 1 M 2 8 . Ramage, C. S. 1968. ‘Role of a tropical ‘maritime continent’ in the atmospheric circulation’, Mon. Wea. Rev., 96, 365-370. Rasmusson, E. M. and Carpenter, T. H. 1982. ‘Variations in tropical sea surface temperature and surface wind fields associated with the
Wea. Rev., 110, 1393-1404. - dependence’, Tellus, 39A, 138-1 51.
Verhandelingen, Koninklijk Nederlands Meteorologisch Instituut, De Bilt, No. 69, pp. 1-1 52.
Meteorol. Soc., 109, 153-168.
Dynamics, Cambridge University Press, Cambridge, pp. 5-1 8.
and western Pacific oceans’, Man. Wea. Rev., 115, 169-192.
Wea. Reo., 114, 285-294.
changes and related rainfall anomalies’, Tellus, MA, 490-504.
in Lighthill, J. and Pcarcc, R. P. (Eds). Monsoon Dynamics, Cambridge University Press, Cambridge, pp. 19-48.
Arch. Meteorol. Geophys. Bioklimatol., B29, 245-252.
Southern Oscillation’, Tellus, MA, 269-277.
Southern Oscillation/El Nifio’, Mon. Wea. Rev., 110, 354-384.

618 R. SUPPIAH
Rasmusson, E. M. and Carpenter, T. H. 1983. ‘The relationship between eastern equatorial Pacific sea surface temperatures and rainfall
Shukla, J. 1987. ‘Interannual variability of monsoons’, in Fein, J. S. and Stephens, P. L. (Ed.) Monsoons, Wiley, Chichester, pp. 399463. Suppiah, R. 1987. Atmospheric circulation variations and the rainfall of Sri Lanka, Ph.D. thesis, Institute of Geoscience, University of
Suppiah, R. 1988. ‘Relationships between Indian Ocean sea surface temperature and the rainfall of Sri Lanka’, J . Meteorol. SOC. Jpn. , 66,
Suppiah, R. and Yoshino, M. M. 1984. ‘Rainfall variations of Sri Lanka. Part 1. Spatial and temporal patterns’, Arch. Meteorol. Geophys.
Thambyahpillay, G. 1954. ‘The rainfall rhythm in Ceylon’, Unio. Ceylon Rev., 12, 224273. Trenberth, K. E. 1976. ‘Spatial and temporal variations of the Southern Oscillation’, Q. J . R . Meteorol. Soc., 102, 639-653. Troup, A. J. 1965. ‘The Southern Oscillation’, Q. J . R. Meteorol. Soc., 91, 490-506. Van Loon, H. and Madden, R. A. 1981. ‘The Southern Oscillation. Part I. Global association with pressure and temperature in northern
Walker, G. T. and Bliss, E. W. 1932. ‘World weather V’, Mem. R. Meteorol. Soc., 4, 53-84. Weare, B. C., Navato, A. R. and Newell, R. E. 1976. ‘Empirical orthogonal analysis of Pacific sea surface temperature’, J . Phys. Oceanogr.,
Wright, P. B. 1975. An index ofthe Southern Oscillation, Climatic Research Unit, School of Environmental Science, University of East
Wright, P. B. 1985. ‘The Southern Oscillation: an ocean-atmosphere feedback system’, Bull. Am. Meteorol. Soc., 66, 398412. Wyrkti, K. 1975. ‘El Nifio-the dynamic response of the equatorial Pacific Ocean to atmospheric forcing’, J . Phys. Oceanogr., 5,572-584. Yoshino, M. M. and Suppiah, R. 1982. Climatic Records ofMonsoon Asia. Parts Ic and I l a with Appendix. Climatology Notes, Institute of
over India and Sri Lanka’, Mon. Wea. Rev., 111, 517-528.
Tsukuba, Japan, 151 pp.
103-112.
Biokfimatol., Ser. B, 34, 329-340.
hemisphere in northern winter’, Mon. Wea. Rev., 109, 115G1162.
6, 671-678.
Anglia, Norwich, CRU RP4 p. 20.
Geoscience, University of Tsukuba, No. 31, pp. 1-80,


![Multiscale interactionwithtopographyandextreme ... · [6] We have also used the gridded daily rainfall in the study by Rajeevan et al. [2006] to define a monsoon in-traseasonal oscillation](https://img.dokumen.tips/doc/110x75/5f2784c55baf625ab96ae395/multiscale-interactionwithtopographyandextreme-6-we-have-also-used-the-gridded.jpg)