Embed Size (px)
Citation preview
Rainfall & Temperature Scenarios for
Sri Lanka under the anticipated Climate Change
B.R.S.B. Basnayake1, Janaka Ratnasiri2, J.C. Vithanage2
1Centre for Climate Change Studies, Department of Meteorology2Sri Lanka Association for the Advancement of Sciences
AIACC Project - AS – 12
Sri Lanka

Outline.. Objectives Downscaling of GCM Baseline (1961 – 1990) climatology Observed Climate Change in Sri Lanka Temperature change Scenarios under
the A1FI, A2 & B1 Scenarios with HadCM3, CGCM & CSIRO
Rainfall change Scenarios under the A2 Scenario with HadCM3
Conclusion
Objectives…
Projection of Rainfall & Temperature Scenarios, which are applicable to Sri Lanka based on General Circulation Model (GCM) results

Downscaling of GCM
Since Sri Lanka is an Island
Resolution power of the grid points of the GCMs (300 km X 300 km) are not sufficient enough
High diversity of altitude from sea level within short distance

Downscaling Tools
GCM Based Statistical Downscaling is used
Pattern Scaling Method SimCLIM Software - developed by IGCI,
University of Waikato, New Zealand

Baseline (1961 – 1990) Climatology
ANUSPLIN Software – developed by Australian National University (ANU) is used to spatially interpolate the rainfall and temperature fields with terrain effect

Climatology of Sri Lanka

Climatological Seasons
First Inter-Monsoon (FIM) March & April
Southwest Monsoon (SWM) May – September
Second Inter-Monsoon (SIM) October & November
Northeast Monsoon (NEM) December – February

Baseline (1961-1990) average Rainfall in
Northeast Monsoon (NEM)
Baseline (1961-1990) average Rainfall in
Southwest Monsoon (SWM)

Baseline (1961-1990) average Rainfall in
First Inter Monsoon (FIM)
Baseline (1961-1990) average Rainfall in
Second Inter Monsoon (SIM)

1961-1990 Baseline average Tmean in Northeast Monsoon
1961-1990 Baseline average Tmean in Second Inter Monsoon

1961-1990 Baseline average Tmean in First Inter Monsoon
1961-1990 Baseline average Tmean in Southwest Monsoon

Observed Climate Changes
in Sri Lanka

Annual minimum air Temperature anomaly trend in Nuwara-Eliya
y = 0.02x - 1.6757
R2 = 0.6888
-2.5-2
-1.5-1
-0.50
0.51
1.5
1901 1909 1917 1925 1933 1941 1949 1957 1965 1973 1981 1989 1997
year
Tm
in A
no
mal
y in
C
(fro
m 1
961-
1990
)
Annual Maximum airTemperature anomaly trend in Nuwara-Eliya
y = -0.0004x + 0.021
R2 = 0.0007
-1.5-1
-0.50
0.51
1.5
1901
1907
1913
1919
1925
1931
1937
1943
1949
1955
1961
1967
1973
1979
1985
1991
1997
year
Tm
ax A
no
mal
y in
C
(fro
m 1
961-
1990
)

Annual minimum air Temperature anomaly trend in Puttalam
y = 0.0063x - 0.8009
R2 = 0.2933
-1.5
-1
-0.5
0
0.5
1
1901 1909 1917 1925 1933 1941 1949 1957 1965 1973 1981 1989 1997
year
Tm
in A
no
mal
y in
C (
fro
m
1961
-199
0)
Annual Maximum air Temperature anomaly trend in Puttalam
y = 0.0209x - 1.6402
R2 = 0.6548
-4-3-2-1012
1901
1907
1913
1919
1925
1931
1937
1943
1949
1955
1961
1967
1973
1979
1985
1991
1997
year
Tm
ax A
no
mal
y in
C
(fro
m 1
961-
1990
)
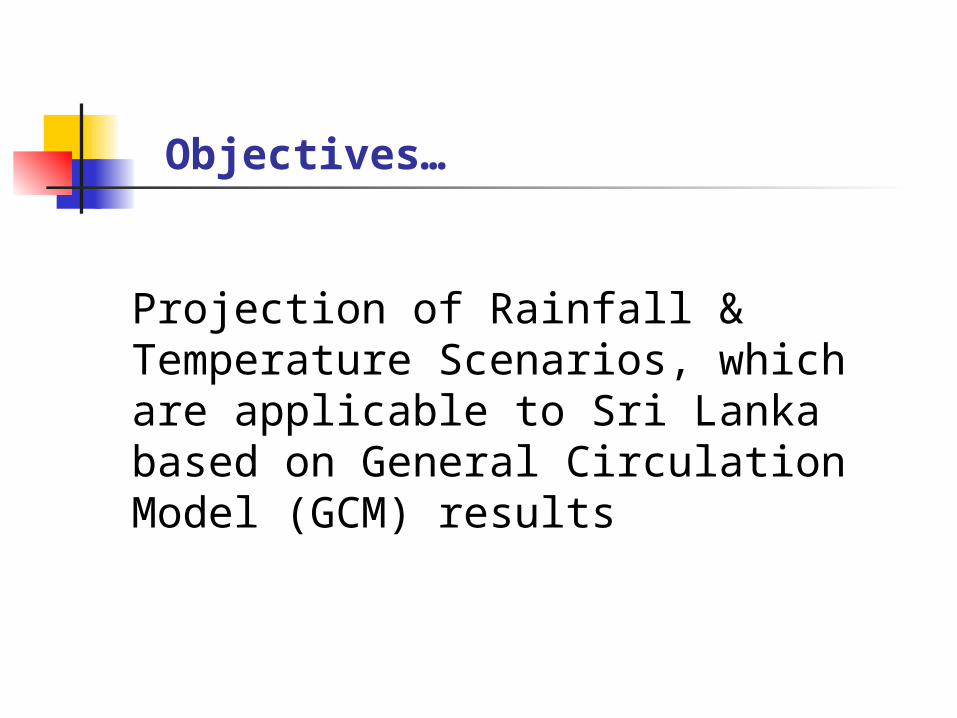
Annual Maximum airtemperature anomaly Colombo
y = 0.0034x - 0.286
R2 = 0.0347
-1.5-1
-0.50
0.51
1.52
2.5
1900
1906
1912
1918
1924
1930
1936
1942
1948
1954
1960
1966
1972
1978
1984
1990
1996
year
Tm
ax A
no
mal
y in
C (
fro
m
1961
-199
0)
Annual minimum air Temperature anomaly trend in Colombo
y = 0.005x - 0.3796
R2 = 0.1976
-1-0.8-0.6-0.4-0.2
00.20.40.60.8
1900 1908 1916 1924 1932 1940 1948 1956 1964 1972 1980 1988 1996
year
Tm
in A
no
mal
y i
n C
(fr
om
19
61-1
990)
• The rate of increase of mean annual air temperature for the 1961-1990 period is in the order of 0.016 0C per year.

Annual rainfall variability in Nuwara-Eliya
-1000
-500
0
500
1000
1500
2000
19
00
19
10
19
20
19
30
19
40
19
50
19
60
19
70
19
80
19
90
20
00
year
RF
an
om
aly
in
mm
(f
rom
19
61
-19
90
)
Annual rainfall variability in Puttalam
-1000
-500
0
500
1000
1500
1900
1910
1920
1930
1940
1950
1960
1970
1980
1990
2000
year
RF
an
om
aly
in m
m (
fro
m
1961
-199
0)

Annual rainfall variability in Colombo
-2000
-1500
-1000
-500
0
500
1000
1500
2000
1900
1910
1920
1930
1940
1950
1960
1970
1980
1990
2000
year
RF
an
om
aly
in m
m
(fro
m 1
961-
1990
)

• Annual average of rainfall over Sri Lanka has been decreased by about 7%, during 1961 to 1990 period compared to 1931 to 1960 period.

Season Coefficient of Variation of all Sri Lanka Rainfall
1931 – 1960
1961 - 1990
Northeast Monsoon (Dec. to Feb.)
31% 42%
First Intermonsoon (Mar. to Apr.)
23% 27%
Southwest Monsoon (May. to Sep.)
21% 16%
Second Intermonsoon (Oct. to Nov)
22% 23%
Annual (Jan. to Dec.) 12% 14%
The Coefficient of Variation of all-Sri Lanka Rainfall during the periods 1931-1960 and 1961-1990.

Future Scenarios

General Circulation Models HadCM3 CGCM CSIRO
Emission Scenarios
A1FI A2 B1

Mean Temperature Change Scenarios in
June 2100

Mean Temperature in June 2100 under the A2
HadCM3
Mean Temperature in June 2100 under the
A1FIHadCM3

Mean Temperature in June 2100 under the B1
HadCM3

Mean Temperature in June 2100 under the A2
CGCM
Mean Temperature in June 2100 under the A1FI
CGCM

Mean Temperature in June 2100 under the B1
CGCM

Mean Temperature in June 2100 under the A2
CSIRO
Mean Temperature in June 2100 under the A1FI
CSIRO

Mean Temperature in June 2100 under the B1
CSIRO

Range of Mean Temperature Increment over the baseline in
June 2100
HadCM3 CSIRO CGCM
A1FI 2.5 – 3.0
2.2 – 2.4 2.0 – 2.2
A2 2.1 – 2.5 1.9 – 2.0 1.7 – 1.8
B1 1.1 – 1.4 1.0 – 1.1 0.9 – 1.0

Rainfall Change Scenarios
in June 2100
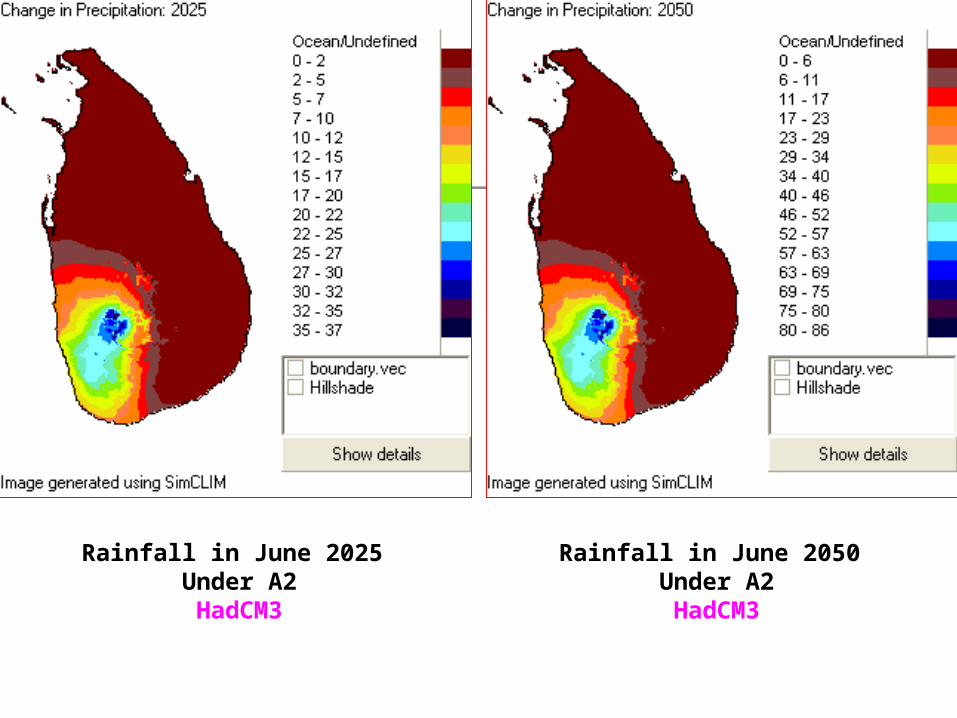
Rainfall in June 2050 Under A2HadCM3
Rainfall in June 2025 Under A2HadCM3

Rainfall in June 2100Under A2HadCM3
Rainfall in June 2075 Under A2HadCM3

Conclusions Projected Mean Temperature increases under
different scenarios for different GCM models with varying magnitudes.
Projected June Rainfall increases with HadCM3 under A2 Scenario. The increments are much more higher on the western slopes of the central hills (windward side) compared to leeward side.

Acknowledgement
IGCI, University of Waikato, New Zealand is greatly acknowledged

Thank You


Station Topographical Location
Coefficient of Variation (%)
1981 – 1990 1991 - 2000
Colombo Low Country 21% 20%
Galle Low Country 28% 12%
Ratnapura Low Country 23% 15%
Kandy Mid Country 21% 22%
Kenilworth Mid Country 37% 17%
Talawakelle Up Country 28% 21%
Nuwara-Eliya Up Country 26% 13%
The Coefficient of Variation of southwest monsoon rainfall at selected stations in low, mid and up country regions during 1981-1990 and 1990-2000 periods
(Basnayake and Punyawardane, 2003)