Embed Size (px)
Citation preview

RELATIONSHIPS BETWEEN CAREER RESILIENCE AND
CAREER BELIEFS OF EMPLOYEES IN TAIWAN
A Dissertation
by
YU-CHING LIU
Submitted to the Office of Graduate Studies of Texas A&M University
in partial fulfillment of the requirements for the degree of
DOCTOR OF PHILOSOPHY
December 2003
Major Subject: Educational Psychology
RELATIONSHIPS BETWEEN CAREER RESILIENCE AND
CAREER BELIEFS OF EMPLOYEES IN TAIWAN
A Dissertation
by
YU-CHING LIU
Submitted to Texas A&M University
in partial fulfillment of the requirements for the degree of
DOCTOR OF PHILOSOPHY
Approved as to style and content by:
Linda H. Parrish (Chair of Committee)
Kenneth E. Paprock (Member)
Gonzalo Garcia, Jr. (Member)
Victor L. Willson (Head of Department)
Victor L. Willson (Member)
December 2003
Major Subject: Educational Psychology

iii
ABSTRACT
Relationships between Career Resilience and Career Beliefs
of Employees in Taiwan. (December 2003)
Yu-Ching Liu, B.S., Chung Yuan Christian University;
M.A., University of Kansas
Chair of Advisory Committee: Dr. Linda H. Parrish
The purpose of this study was to explore the relationships between career
resilience and career beliefs among employees in Taiwan. This study also examined
whether selected demographic variables had effects on career resilience and career
beliefs. A pilot study involving 178 participants was conducted in Taiwan to validate
the instruments used in the main study. Twenty items were selected for measuring
career resilience. These items were taken from London’s Career Motivation Inventory
(1993b), Noe, R. A., Noe, A. W., and Bachhuber’s measures of career motivation
(1990), and Michigan’s Career Resilience Scale (Bice, 1999, January 24-30). Forty-nine
items consisting of 10 subscales in the Career Beliefs Scale were adopted from Yang’s
Chinese Career Beliefs Inventory—Form B (1996). The study had 578 current
employees from diverse work settings in Taiwan.
Career resilience scores were negatively correlated with the total career beliefs
scores (r = –.22, p < .01), which indicated that participants who were higher on career
resilience tended to possess fewer irrational career beliefs. Career resilience scores were
negatively correlated with belief in fate, avoidance of decision making, the belief that

iv
some occupations are more prestigious than others, possessing sex role stereotypes,
assuming other’s help can determine the best choice, and the belief that salary is the
primary concern when making career choices. Career resilience scores were positively
correlated with the belief that one should find the best-fit career and that work is very
important in one’s life. However, the magnitudes of coefficients were small (the
absolute r values were all less than .40).
The results of ANOVA showed that gender, education, type of institution, recent
participation in training/educational activities, and supervisory experience yielded
statistically significant main effects in career resilience scores. Additionally, there was a
significant interaction effect on career resilience for gender by education.
MANOVA results showed that gender, age, educational levels, types of
institutions, supervisory experience, career change, and recent participation in training
activities yielded statistically significant differences among career beliefs. Discriminant
analyses were applied to further investigate the differences among the 10 career belief
subscales for the significant demographic variables.

v
ACKNOWLEDGMENTS
This study could not have been accomplished without the help and support of
many people. First, I would like to acknowledge my chair, Dr. Linda Parrish, for her
guidance during this process. I also want to thank the committee members, Dr. Gonzalo
Garcia, Dr. Victor Willson, and Dr. Kenneth Paprock, for their contributions to my
research. Special and sincere thanks must be offered to Dr. Willson for his advice while
I was analyzing the data.
Secondly, I truly appreciate my friends at Texas A&M University. We shared
information, discussed problems we encountered, and encouraged each other.
Finally, and most importantly, I am grateful for the love of my family. I would
like to express my deepest love and thanks to my husband, Hung-Jen, and my sons, Pin-
Chia and Pin-Jung. Because of your understanding, support, and sacrifice, I was able to
study abroad and fulfill my goal.

vi
TABLE OF CONTENTS
Page
ABSTRACT .................................................................................................................iii
ACKNOWLEDGMENTS............................................................................................. v
TABLE OF CONTENTS ............................................................................................. vi
LIST OF TABLES ....................................................................................................... xi
LIST OF FIGURES....................................................................................................xiii
CHAPTER
I INTRODUCTION.......................................................................................... 1
Background ................................................................................................... 1 Rapid Advances in Technology ............................................................... 1 Global Competition .................................................................................. 1 Organization Restructuring ...................................................................... 2 Loss of Job Security ................................................................................. 3 Career Path No Longer Predictable and Upward Mobility ...................... 4 Continued Learning and Benchmarking Employability Are Required ............................................................................................ 5 Statement of the Problem ............................................................................... 6 Purpose of the Study and Research Questions ............................................... 9 Definition of Terms...................................................................................... 10 Career Resilience.................................................................................... 10 Career Beliefs ......................................................................................... 11 Limitations of This Study............................................................................. 11 Summary ...................................................................................................... 11 Overview of Remaining Chapters ................................................................ 12 II LITERATURE REVIEW............................................................................. 13 Career Resilience.......................................................................................... 13 Studies on Resilient Children................................................................. 13 London’s Theory of Career Resilience .................................................. 16 Waterman’s and Collard’s Perception of Career Resilience.................. 20 Measures of Career Resilience............................................................... 21 London’s Career Motivation Inventory............................................ 21 Noe’s Measures of Career Motivation ............................................. 22

vii
TABLE OF CONTENTS--CONTINUED
CHAPTER Page
An Integrated Career Resilience Subscale ....................................... 22 Michigan’s Career Resilience Scale................................................. 23 Research on Career Resilience............................................................... 24 Career Resilience and Personal Characteristics ............................... 24 Career Resilience and Age, Gender, Education, and Ethnicity........ 26 Career Resilience and Work Environment and Related Issues ........ 27 Career Beliefs ............................................................................................... 29 Formation of Beliefs............................................................................... 29 Beliefs and Career-Related Behaviors ................................................... 32 Irrational Career Beliefs/Career Myths .................................................. 33 The Characteristics of Irrational Career Beliefs..................................... 37 Beliefs in Self-Efficacy .......................................................................... 38 Measures of Career Beliefs .................................................................... 40 Krumboltz’s Career Beliefs Inventory (CBI)................................... 40 The Chinese Career Beliefs Inventory (CCBI) ................................ 42 Normative Sample...................................................................... 44 Reliability ................................................................................... 44 Construct Validity ...................................................................... 44 Research on Career Beliefs .................................................................... 46 Career Beliefs and Decision-Making and Career-Related Behaviors.......................................................................................... 46 Career Beliefs and Age, Gender Differences, and Sex Role Stereotypes ....................................................................................... 48 Career Beliefs of Unemployed Adults ............................................. 50 Career Beliefs Research in Taiwan .................................................. 51 Summary ...................................................................................................... 52 III METHODOLOGY....................................................................................... 55 The Pilot Study............................................................................................. 55 Purpose ................................................................................................... 55 Instruments ............................................................................................. 56 The Measures of Career Resilience.................................................. 56 The Career Beliefs Scale .................................................................. 57 The Personal Data Sheet .................................................................. 60 Sample.................................................................................................... 60 Procedures .............................................................................................. 61 Data Analysis ......................................................................................... 62
The Means and Standard Deviations (SDs) of Items in the Measures of Career Resilience ............................................... 63

viii
TABLE OF CONTENTS—CONTINUED CHAPTER Page Factor Analyses and Reliabilities for the Measures of Career Resilience ......................................................................................... 64 The Means and SDs of Items in the Career Beliefs Scale ................ 66 Factor Analyses and Reliabilities for the Career Beliefs Scale........ 66 The Main Study............................................................................................ 71 Purpose ................................................................................................... 71 Sample.................................................................................................... 72 Instruments ............................................................................................. 72 The Measures of Career Resilience.................................................. 72 The Career Beliefs Scale .................................................................. 72 The Personal Data Sheet .................................................................. 73 Procedures .............................................................................................. 73 Data Analysis ......................................................................................... 75 Summary ...................................................................................................... 78 IV RESULTS..................................................................................................... 80 Description of the Sample ............................................................................ 80 Results for Research Question 1 .................................................................. 83 Results for Research Question 2 .................................................................. 88 Results for Research Question 3 .................................................................. 92 Results for Research Question 4 .................................................................. 93 Results for Research Question 5 .................................................................. 95 Differences of Career Beliefs by Gender ............................................... 98 Differences of Career Beliefs by Type of Institution............................. 98 Differences of Career Beliefs by Educational Level............................ 100
Differences of Career Beliefs by Age Range ....................................... 101 Differences of Career Beliefs by Supervisory Experience................... 104 Differences of Career Beliefs by Career Change ................................. 104 Differences of Career Beliefs by Participation in Training Activities................................................................................ 107 Summary .................................................................................................... 107
V SUMMARY, DISCUSSION, AND RECOMMENDATIONS ................. 110 Summary .................................................................................................... 110 Purpose of the Study ............................................................................ 110 Research Questions .............................................................................. 111

ix
TABLE OF CONTENTS--CONTINUED
CHAPTER Page
Instruments ........................................................................................... 112 The Measures of Career Resilience................................................ 112 The Career Beliefs Scale ................................................................ 112 The Personal Data Sheet ................................................................ 113 Sample.................................................................................................. 113 Procedures of Data Collection.............................................................. 114 Discussion .................................................................................................. 115 Results for Research Question 1 .......................................................... 115 Results for Research Question 2 .......................................................... 117 Results for Research Question 3 .......................................................... 121 Results for Research Question 4 .......................................................... 122 Results for Research Question 5 .......................................................... 122 Differences of Career Beliefs by Gender ....................................... 122 Differences of Career Beliefs by Type of Institution..................... 123 Differences of Career Beliefs by Educational Level...................... 124 Differences of Career Beliefs by Age Range ................................. 125 Differences of Career Beliefs by Supervisory Experience............. 126 Differences of Career Beliefs by Career Change ........................... 126 Differences of Career Beliefs by Participation in Training Activities.......................................................................... 127 Limitations of the Study....................................................................... 127 Recommendations ...................................................................................... 130 REFERENCES.......................................................................................................... 134 APPENDIX A ........................................................................................................... 143 APPENDIX B ........................................................................................................... 144 APPENDIX C ........................................................................................................... 145 APPENDIX D ........................................................................................................... 146 APPENDIX E............................................................................................................ 148 APPENDIX F............................................................................................................ 153 APPENDIX G ........................................................................................................... 154 APPENDIX H ........................................................................................................... 155

x
TABLE OF CONTENTS--CONTINUED
Page
APPENDIX I............................................................................................................. 156 APPENDIX J............................................................................................................. 157
APPENDIX K ........................................................................................................... 158
VITA ......................................................................................................................... 159

xi
LIST OF TABLES
TABLE Page
3-1 Factor Loadings and Reliability Coefficients for the Career Resilience Items ........................................................................................... 67 3-2 Factor Loadings and Reliability Coefficients for the Career Beliefs Items ............................................................................................................. 68 4-1 Demographic Characteristics of the Sample ................................................ 81
4-2 Demographic Characteristics of Employees in Taiwan in 2002 .................. 83
4-3 Correlation Matrix for Career Resilience and Career Beliefs Total and Subscale Scores............................................................................ 85
4-4 Regressions of Career Beliefs Subscale Scores on Career Resilience Scores ........................................................................................................... 86 4-5 Structure Coefficients and Test Results of Standardized Beta Weights for the Career Belief Subscales .................................................................... 87 4-6 Main Effects of Demographic Variables on Career Resilience Scores........ 89 4-7 Means and SDs of Career Resilience Scores by Selected Demographic Variables....................................................................................................... 91
4-8 Gender by the Other Demographic Variables Two-Way Interaction Effects on Career Resilience Scores............................................................. 92
4-9 Trend Analysis on Career Resilience Scores by Years of Paid Work ........ 94 4-10 Main Effects of Demographic Variables on Career Beliefs Subscales ........ 95
4-11 Means, SDs, and ANOVA Results of Demographic Subgroups on Career Beliefs Total Scores.......................................................................... 96 4-12 Discriminant Analysis on Career Beliefs Subscales by Gender .................. 99
4-13 Discriminant Analysis on Career Beliefs Subscales by Type of Institution...................................................................................... 100

xii
LIST OF TABLES--CONTINUED
TABLE Page
4-14 Discriminant Analysis on Career Beliefs Subscales by Educational Level....................................................................................... 102 4-15 Discriminant Analysis on Career Beliefs Subscales by Age Range .......... 103 4-16 Discriminant Analysis on Career Belies Subscales by Supervisory Experience.............................................................................. 105 4-17 Discriminant Analysis on Career Beliefs Subscales by Career Change........................................................................................................ 106 4-18 Discriminant Analysis on Career Beliefs Subscales by Participation in Training Activities ................................................................................. 108

xiii
LIST OF FIGURES
FIGURE Page
3-1 The Scree Plot for the Career Resilience Items............................................ 65
4-1 Gender by Education Interaction on Career Resilience Scores.................... 93
4-2 Means of Career Resilience Scores by Years of Paid Work ........................ 94

1
CHAPTER I
INTRODUCTION
Background
Business strategies, organizational structures, and processes of production in
business and industry have undergone fundamental changes since the 1980s. These
changes result from rapid advances in technology, global competition, and restructuring
within organizations (Collard, Epperheimer, & Saign, 1996; Miles & Snow, 1996; Story,
2000; Walton, 1999; Waterman, R. H., Waterman, J. A., & Collard, 1994). They have
significant impacts on today’s workplace:
Rapid Advances in Technology
Technology innovation in automation has increased productivity as well as
reduced the need of labor in manufacturing procedures. Formerly, labor-intensive
industries had to lay-off extra employees in considering their costs. Workers who have
no skills or who do not keep pace with the technology advances find it difficult to obtain
jobs in the current workplace. In addition, advances in communication and information
technology allow transmission of information quickly and world-widely; thus facilitating
the development of international organizations, and consequently increasing the global
competition (Story, 2000).
Global Competition
Globalization has tremendous influence on the nature and forms of work.
_______________ This dissertation follows the style and format of the Journal of Vocational Behavior.

2
Because of the availability of wider products and the labor market, companies have
freedom of choice about where their goods are produced, based on the location that can
provide relatively inexpensive materials and labor. Thus, globalization results in
reduced job opportunities in expansive countries. On the other hand, globalization
increases the opportunities for individuals who work on international assignments to
enhance their competency (Story, 2000). Globalization also yields worldwide
competition; consequently, it accelerates changes in economy and industry. All
companies are forced to be more efficient and flexible when they struggle to survive in
this complex and turbulent environment.
Organization Restructuring
After the rise of Industrial Revolution in the late 1800s till the second half of the
20th century, as firms grew larger, they built up more and more levels of management
hierarchy in order to keep operations under control (Miles & Snow, 1996). However,
the multi-level bureaucratic structure could not respond efficiently to the fast changing
environment. Therefore, organizations conducted restructuring (e.g., downsizing,
delayering, mergers) to maximize communication and flexibility during the 1980s to
1990s. They decentralized decision-making processes so that the frontline workers
could respond to problems immediately, and they also created cross-functional teams
that could operate like a small business unit. These changes caused a lot of middle
managers to downsize, even though their jobs were presumably secure.
Some of the independent firms are linked together into an interrelated chain, each
contributes their expertise to strengthen their competition. The “network” structure was

3
formed in the 1970s (Miles & Snow, 1996). Recently, a new “cellular organization” is
beginning to be recognized. According to Miles and Snow’s definition: “a cellular
organization is made up of cells (self-managing teams, autonomous business units, etc.)
that could exist on their own, but by interacting with other cells, can produce a more
potent and competent organism” (p. 109). Therefore, it does not matter if it’s an
individual employee or an organization, cooperation and teamwork are increasingly
important in performing more complex functions more efficiently.
The updating technology, increasing competition from all over the world, and
leaner structure in organizations in turn have great impacts on individuals’ careers. In
contrast to the traditional view about one’s career development, employees now are
facing more challenges adapting to the competitive and unpredictable workplace.
Loss of Job Security
Organizational downsizing and delayering during the 1980s and 1990s increased
the fear of job insecurity. Lifelong employment is no longer promised because even the
organization itself does not know whether or not it can survive tomorrow under the
intensive competition. Job insecurity affects an individual’s long-term career planning
when the future is unpredictable and unstable. Individuals need to take responsibility for
their own placement and career development (Arthur & Rousseau, 1996; Collard et al.,
1996; Hall & Associates, 1996; Young & Collin, 2000).
Hall and Associates (1996) identified that the psychological contract between
employers and employees had been transitioned. A psychological contract (or social
contract) is not a legal document, but rather an agreement between employers and

4
employees. Schein (1965, cited in Collard et al., 1996) depicted the implicit old (or
traditional) psychological employment contract as: employees work hard, the job is
within the scope of their job description, and they are loyal to the company in exchange
for salary, status, and job security; thus, employers have to take care of their employees’
career development. The contract implies a parental relationship (Collard et al. 1996).
Today, the new contract is changed to a partnership relation: “It is the employees’
responsibility to manage his or her own careers.” It is the company’s responsibility to
“provide employees the tools, the open environment, and the opportunities for assessing
and developing their skills” to “exchange for better productivity and some degree of
commitment to the company” (Waterman et al., 1994, p. 88).
Career Paths No Longer Predictable and Upward Mobility
Traditionally, career success means climbing up to the top position of a
hierarchical organization, followed by increasing pay. In conducting restructuring,
organizations become flatter and thinner, so there are fewer opportunities for advanced
movement. Individuals may move laterally between divisions or even downwardly
within an organization’s structure. Hall and Associates (1996) argued that the traditional
career goal—path to the top—was redefined as psychological success—pace with a heart
(p. 34). The feeling of success is internally and individually defined. It does not come
from job promotion, but from the accomplishment of challenging work, or from self-
actualization in terms of one’s unique values and vision about life.
Since organizations are becoming more flexible in structure and staffing, they
have begun to offer flextime, work at home options, part-time employment, job sharing,

5
contract work, or project-based work assignment. For some people, periodical changes
in employment status (e.g., from full-time to part-time or being laid-off) and the degree
of membership in an organization (e.g., from core worker to contract worker) may create
confusion about self-identity as well as frustration. On the contrary, some people benefit
from the flexible job system. They can adjust their work commitments over time in
accordance with their family or non-work needs, hence developing a more expanded
view of self-concept and having a balanced life (Mirvis & Hall, 1996).
Continued Learning and Benchmarking Employability Are Required
In the past, jobs were relatively static. Once an employee mastered certain skills,
he or she could perform competently and stay employed as long as he or she worked.
However, due to rapid technology innovation and increasing competition, today’s
employees have to continuously update their skills in order to keep pace with the
changes. These updated skills are demanded not only for those who work in high-tech
industrial, but also for those who have frequent job rotation, short-term project
assignment, lateral career movement, or re-entry a new career—all will require sustained
learning in order to maintain employment security. Benchmarking demanded skills
against the standards in their area are also needed, such as obtaining certificates or
licenses. It represents the employees’ competence and thus enhances their
employability. Hall and Associates (1996) commented that the new career is no longer
“earning a living” but “learning a living.” London and Smither (1999) describe a self-
determined, career related continuous learner as:

6
…they regularly assess their work environments to identify what they
need to know. They develop alternative visions of the future to anticipate
what they will need to know tomorrow. They seek feedback and assess
their current skills and knowledge to determine learning gaps. They
search for development opportunities and set learning objectives (p. 89).
Statement of the Problem
Similar trends have emerged in Taiwan. Because of businesses and industries
downsizing, closing down, or moving abroad, the unemployment rate soared above 5%
in July of 2001 for the first time since 1935 (Directorate-General of Budget, Accounting
and Statistics, 2001, September). According to the 2001 Manpower Statistics Annual
Report (Directorate-General of Budget, Accounting and Statistics, 2002), 54% of the
unemployed persons are product and machine operators and related workers; however,
those workers in all only account for 35% of the total labor force in Taiwan. The
primary reason for job loss is “established closed or business shrink” (45.9%). The data
indicates that the higher unemployment rate among product and machine operators and
related workers is due to the impact of global competition that forces the labor-intensive
firms to close or to move to less expensive labor cost countries, plus the automatic
technique outdates those who have no skill or low skill workers. Statistics show that the
duration in average weeks of unemployment for unemployed persons was 29.67 weeks
in December 2001; compared to the average 17.20 weeks in 1995. That means
unemployed people have to suffer a much longer time before finding their next job.

7
Taiwan joined the World Trade Organization (WTO) in 2002. WTO is an
international organization whose main function is ensuring a free, non-discriminatory
global trading system. Each member of the WTO receives a guarantee that its exports
will be treated fairly and consistently in other countries’ markets. Each country agrees
to do the same for imports into its own market (World Trade Organization, 2003).
Therefore, both companies and employees are encountering more competition from
globalization. Even now, the assumed lifelong employment in government is facing
challenges. In order to increase efficiency, nine government-owned enterprises have
been undergoing privatization (Commission of National Corporations, 2001,
September); the central government plans to cut 3.225% of its employees per year in
2002 and 2003 (Central Personnel Administration, 2003). In sum, hundreds of
thousands of people will be affected by government restructuring. Commitment to
lifelong employment is gradually disappearing.
In response to the changes in the current workplace, Waterman et al. (1994),
Collard et al. (1996), and Griffith (1998) advocate “building a career-resilient
workforce.” A career-resilient worker should not cling to one job, one company, or one
career path. He/she has to manage his/her own career development and devote to
continued learning in order to maintain employability. With the competitive skills
required in the workforce, he/she can find a job whenever it is needed. Collard et al.
(1996) pointed out that career resilience is “the result, or the outcome of being self-
reliant” (p. 34), and these two terms can be used interchangeably. The emphasis of
career self-reliance is on self-awareness, learning, and dealing with change. The authors

8
illustrate a “Career Self-Reliance Wheel” to portray the concept of career self-
reliance/resilience (p. 37). The major components of the Wheel are: Being self-aware
and value driven, individuals know who they are and where they are going; being
connected and flexible, they can work with others; being future-focused and dedicated to
continuous learning, they can maintain functional work skills and know how to deal with
changes.
From London’s point of view (1983), career resilience is one component of
career motivation (the others are career insight and career identity). It is an internal
construct that arouses and directs an individual’s career decisions and behaviors. He
defined career resilience as “the ability to adapt to changing circumstance, even when
the circumstances are discouraging or disruptive” (p. 34). Being resilient keeps
individuals moving forward and gives them strength to overcome career barriers, such as
job loss, job transfer, job stress, and poor performance. London hypothesizes three sub-
domains of career resilience: (a) belief in self (self-efficacy), (b) willingness to take
risks, and (c) working independently or cooperatively as needed (London, 1983).
London and Mone (1987) stated that career resilience is the key to overcoming career
stress. In sum, career resilience is a required personal characteristic when individuals
face the turbulent and uncertain workplace.
Although the concept of career resilience was proposed by London (1983) almost
20 years ago, little research has focused on this topic. Since career resilience is a
required characteristic for employees to achieve success in the current and future
workplace, more understanding about the construct of career resilience and how it relates

9
to other career variables, such as career beliefs, will shed significant insight on designing
or improving manpower training program and career counseling. In addition, career
beliefs are essential factors affecting one’s career decision and job behaviors
(Krumboltz, Rude, Mitchell, Hamel, & Kinnier, 1982). However, the majority of the
literature focused on describing or categorizing individuals’ career beliefs and how they
affect one’s career decisions. No research was found which studied the current workers’
career beliefs in Taiwan, nor which examined the relationship between career beliefs and
career resilience. This study investigated the relationships between the two important
domains, and may provide a new research arena.
Purpose of the Study and Research Questions
The primary purpose of this study was to explore the relationships between
career resilience and career beliefs among employees in Taiwan. This study also
examined whether the demographic variables had effects on career resilience and career
beliefs of employees in Taiwan. The research questions to be answered by this study
were as follows:
1. What are the relationships between career resilience and career beliefs of
employees in Taiwan?
2. Are there any differences in the career resilience scores of employees in
Taiwan with regard to demographic characteristics such as gender, age,
educational level, number of years of paid work, supervisory experience,
career change, organization change, employment at a public or a private

10
institution, and participation in training/educational activities for more than
one week in the most recent six months?
3. Are there any two-way interaction effects between gender and the other
demographic variables on the career resilience scores of employees in
Taiwan?
4. What is the relationship (linear, quadratic, cubic, or quartic) between the
number of years of paid work and the career resilience scores of employees in
Taiwan?
5. Are there any differences in the career belief subscale scores of employees in
Taiwan with regard to demographic characteristics such as gender, age,
educational level, number of years of paid work, supervisory experience,
career change, employment at a public or a private institution, and
participation in training/educational activities for more than one week in the
most recent six months?
Definition of Terms
Career Resilience
Synthesizing London’s (1997) and Collard et al’s (1996) definitions, career
resilience in this study is defined as a person’s ability to actively manage his or her work
life and adapt to the changing workplace even when the changes cause career disruption.

11
Career Beliefs
Career beliefs are assumptions and generalizations an individual holds about the
self and the world of work, which affect one’s career decision-making and career
development (Krumboltz, 1994a).
Limitations of This Study
Because of practical constraints, random sampling was not conducted in this
study. Although the participants worked at a wide range of organizations, the percentage
distribution of the surveyed sample differed from that of the population in ages,
education levels, and type of institutions (i.e., private and public sectors) (Directorate-
General of Budget, Accounting and Statistics, 2003). Therefore, generalization of the
findings cannot be applied with confidence to the employed population in Taiwan.
A survey research design was used in this study. Data were collected based on
participants’ self-report. Gall, J. P., Gall, M. D., and Borg (1999) pointed out that the
drawbacks of survey research are “respondents can conceal information that they don’t
want others to know. Also, even if respondents want to give accurate information, they
may not have the self-awareness to do so” (p. 173).
Summary
Today’s workplace has undergone fundamental changes. In response to the
changing and uncertain work environment, human resource professionals and career
counselors advocate that individuals have to be career resilient; that is, they should take
responsibility for their own career development, continue to learn, and benchmark their
skills in order to keep their employability. This study explores the relationships between

12
career resilience and career beliefs among employees in Taiwan and examines whether
the demographic variables (e.g., gender, age, education, type of institution, number of
years of paid-work, career/organization change, participation in training/educational
activities for more than one week in the most recent six months) relate to participants’
career resilience and/or the career beliefs.
Overview of Remaining Chapters
Chapter II reviews the literature on career resilience, measurements of career
resilience, career beliefs, and measurements of career beliefs. Chapter III describes the
methods used in both the pilot and main studies; including the description about the
participants, instruments, procedures, and methods and results of data analysis. Chapter
IV reports the research findings. Chapter V contains a summary of this study, a
discussion of the results, and recommendations for future studies.

13
CHAPTER II
LITERATURE REVIEW
This chapter presents a review of literature relevant to career resilience and
career beliefs. The first section is the review of theoretical concepts, measurements, and
research in regard to career resilience. The second section is an overview of the
formation of beliefs, Krumboltz’s social learning theory of career decision-making,
career myths, measurements, and related studies. The last section is a brief summary
that concludes this chapter.
Career Resilience
Studies on Resilient Children
During the 1970s, psychologists and psychiatrists began to pay attention to the
phenomenon of resilience in children who developed well despite having been exposed
to the threats of risk or adversity. Researchers were interested in what factors made
these children “invulnerable,” and hoped their findings could foster interventions and
policies (Masten, 2001). Summarizing the results of major longitudinal studies, a set of
personality characteristics of resilient children was identified as buffering factors, such
as the ability to elicit others’ positive attention, holding an optimistic view of their
suffering experiences, possessing beliefs in a meaningful life, and having control over
their fate, seeking out novel experiences, taking an active approach toward problem
solving, autonomy, and self-reliance (Werner, 1984). In addition, a clear self-concept
and positive self-esteem were also found to be critical to enhance adaptive competencies
(Masten, 2001). Along with these personal attributes, family warmth and external

14
support for counsel and advice from teachers, counselors, coaches, and good neighbors
all contributed to facilitating children’s coping skills and protected them from
malfunctions (Rak & Patterson, 1996; Rutter, 1993).
Although resilience has been studied for over three decades, Luthar, Cicchetti,
and Becker (2000) pointed out that little consensus has been achieved concerning the
definition of resilience as well as the operationalization and measurement of key
constructs of resilience. Luthar et al. viewed resilience as a “dynamic developmental
process” rather than as a personal trait. They argued that if resilience is perceived only
as a personal trait, this might induct into a conclusion that some people just do not have
the right trait to overcome adversity. Such perspectives added little assistance to
clarifying the process underlying resilience, or to improving the design of intervention
programs.
Research findings revealed that some children who were labeled as resilient in
some domains might display problems in other domains. For example, an adolescent
who experienced adversities but manifested successful adaptation in academic areas
might suffer emotional difficulties. Thus, resilience may help individuals function
uniformly within similar adjustment spheres, but it may not show consistency across
heterogeneous areas. The evidence of uneven functioning across distinct domains leads
to the need for specificity in describing resilience outcome regarding its particular
competence criteria. Luthar et al. suggested using circumscribed terms such as
“educational resilience,” “emotional resilience,” or “behavior resilience” to specify the
particular dimension to which the study can apply. Accordingly, “career resilience”

15
should be used as a more precise term for representing the resilience constructs in career
domains.
Since resilience competencies are inconsistent across diverse adaptation domains,
it is complicated for researchers to outline optimal indicators of resilience within
individual studies. Different competence criteria may reflect particular constructs of
resilience in the assessed domain. Luthar et al. suggested examining the outcomes
separately if they represented discrete constructs. Additionally, when multiple criteria
are considered separately, are some more important than others? Luthar et al.
recommended that the researcher prioritize the more critical indicators over others based
on the nature of risk under study. For instance, in the study of career resilience,
employability should be given more priority than academic competence. However, if all
the outcomes are conceptually critical, they can be weighted equally, and either
considered separately or combined into a composite. Another concern was how well the
competence could be judged as resilience. When individuals are at risk or under
adversity, should their resiliency competence achieve an “excellent level” or simply
maintain at an average level that will meet the criteria of resilience? Again, Luthar et al.
advised that the choice should be guided by the nature of the risk studied. Concerns
about how to examine the constructs of resilience and how to define the outcome criteria
would provide more insight on conceptual and methodological aspects in the study of
resilience.

16
London’s Theory of Career Resilience
The term “career resilience” originated in London’s Career Motivation Theory
proposed in 1983. His career motivation theory intended to explain what motivates
managers to engage in and meet managerial role requirements. The theory then
expanded beyond managers to all workers, and went further to encompass motivation
associated with a wide range of career decisions and related behaviors.
There are three variables included in London’s inactive model of career
motivation: individual characteristics, situational conditions, and career decisions and
behaviors, which interact with each other and, in turn, influence career motivation.
Individual characteristics include needs, interests, and personalities that are relevant to
one’s career. Situational conditions include many elements of the work environment
that have potential impacts on one’s career motivation, such as staffing policies,
leadership style, job design, group cohesiveness, and the compensation system. London
conceptualized career motivation as a multi-dimensional construct that is internal to the
individual, influenced by situational conditions, and reflected in one’s career decisions
and behaviors. The individual characteristics consist of three domains:
1. Career insight—how realistically and clearly individuals perceive themselves
and their career goals.
2. Career identity—how central one’s career is to his or her identity.
3. Career resilience—how one resists career disruption in a less than optimal
environment.

17
In motivation terms, career insight is the energizing component of career
motivation, career identity is the direction of career motivation, and career resilience is
the maintenance component of career motivation. London and Noe (1997) defined
career resilience as “the ability to adapt to changing circumstances, even when the
circumstances are discouraging or disruptive” (p. 62). London (1983) posited three sub-
domains under career resilience: self-efficacy, risk taking, and dependency. He
elucidated that the self-efficacy sub-domain includes self-esteem, autonomy,
adaptability, internal control, need achievement, initiation, creativity, inner work
standards, and development orientation. The risk-taking sub-domain contains risk-
taking tendencies, fear of failure, need for security, and tolerance of uncertainty and
ambiguity. The third sub-domain—dependency—consists of career dependency and the
need for superior/peer approval. London stated that additional components can be
included in the resilience domain, but people do not need to possess all these
characteristics or be equally high on all dimensions to be resilient. He further concluded
that generally self-confidence, risk taking, and independent action go together as the
major components of career resilience.
London and Noe (1997) claimed that the dimensions of career motivation have
strong links to existing career theories. The authors argued that career resilience is
“conceptually similar to Holland’s notion that career decisions are influenced by the
ability to face barriers, the need for information and reassurance, and vocational
identity” (p. 63, as cited in London & Noe, 1997). Career resilience is also related to
career maturity. People who are mature in terms of career development tend to be more

18
intelligent, better able to adjust, higher achieving, and more successful on the job (Crites,
1978). Another related theory is Dawis and Lofquist’s Work Adjustment Theory (1984).
They defined work adjustment as a “continuous and dynamic process by which the
individual seeks to achieve and maintain correspondence with the work environment” (p.
55). The adjustment styles—flexibility, activeness, and reactiveness—describe how
individuals tolerate dissatisfaction (i.e., the work environment cannot fulfill the
requirements of the individuals’ needs), or how they respond to the incongruence
(activeness—acting on the work environment or reactiveness—changing the expression
of the work personality to increase correspondence).
Self-efficacy, one sub-domain of career resilience, is derived from Bandura’s
Self-Efficacy Theory (1977). According to Bandura, self-efficacy refers to the
individual’s self-appraisal about whether they have the ability to accomplish a given
task. An efficacy expectation is the conviction that one can successfully execute a task.
Moreover, whether or not an individual conducts certain behavior needs to consider
another factor: outcome expectancy, which is the person’s estimation about the possible
outcome if he/she initiates this behavior. Expectations of personal ability and possible
outcome affect both the individuals’ initiative and the persistence of the coping behavior.
Growing evidence from many domains, including career decisions and related behaviors,
supports the relationship between self-efficacy and successful performance and
adaptation.
Another closely related concept is hardiness. Kobasa (1979) defined hardiness
as a cluster of personality characteristics that function as a resistance resource when

19
individuals deal with stressful life events. According to Kobasa, hardiness consists of
three components: commitment (involve oneself in a stressful situation), control (feel
and act as if one is influential in the stressful situations), and challenge (belief that
change rather than stability is normal in life). Hardiness seems to be an important stress
mediator. People who showed stronger control, greater involvement in one’s life, and a
more positive response to change were more likely to maintain health in the face of high
stress (Kobasa, 1979, Kobasa, Maddi, & Kahn, 1982).
Career resilience is the key to overcoming career stress and career barriers
(London & Mone, 1987). People high in career resilience are able to control what
happens to them; they are willing to take risks even when the outcome is uncertain; they
can tolerate the unambiguous situation; they get a sense of accomplishment and persist
in their goals; they are autonomous and able to adapt to changing conditions; and they
work independently, but can cooperate with others if they need to. Understanding one’s
own resilience and providing opportunities to enhance it should help the individual
overcome career barriers.
London and Mone (1987) stated that career resilience is more personally driven
and is generally established in early ages (during the adolescent years and the early 20s).
They believed that people can learn to be resilient and hardy through positive
reinforcement for exercising their judgments and acting independently. Constructive
performance feedback can increase an individual’s confidence and self-esteem.
Encouragement of autonomy and creativity, provision of opportunities for taking risks

20
without severe negative consequences, and the creation of teamwork opportunities can
also facilitate an individual’s career resilience.
London suggested that career resilience is a multidimensional construct. Those
dimensions do not necessarily include all related individual characteristics, nor are they
orthogonal. Further research will be needed to refine the dimensions, group those
dimensions into specific domains, or derive more coherent domains.
Waterman’s and Collard’s Perception of Career Resilience
Waterman et al. (1994) and Collard et al. (1996) promoted building a resilient
workforce in response to the changing and competitive workplace. From their point of
view, resilient workers should take responsibility for their own career management and
enhance their employability skills. Collard et al. claimed that career resilience and
career self-reliance are interchangeable because both embrace the same concepts, and
career resilience is the result or the outcome of being self-reliance. They illustrated a
“Career Self-Reliance Wheel,” which contains six key characteristics, to portray the
concept of career self-reliance/resilience. These six characteristics are: self-aware,
value-driven, future-focused, dedicated to continuous learning, flexible, and connected.
Based on self-awareness, individuals are able to maintain a sense of control and find
direction in the face of change. Being value driven, individuals should align their values
with those of the organization. They should be dedicated to continuous learning in order
to keep their profession current, and be future-focused so they can foresee customer
needs and prepare for the market trend. They should also build and maintain a network

21
of contacts to facilitate teamwork and help them succeed in a career, and they should be
flexible so they can quickly adapt to change.
When comparing the characteristics described in career resilience to the findings
of the studies on resilient children, there are many elements each have in common, such
as a belief in self, a sense of control, initiative (taking an active approach toward
problem solving), autonomy, self-reliance, a clear self-concept, and positive self-esteem.
This might indicate that resilience represents a constellation of personality
characteristics that serve as a coping mechanism to adapt to disruptive situations.
Measures of Career Resilience
London’s Career Motivation Inventory
The original measures of career motivation were designed by London and his
staff at American Telephone & Telegraph (AT&T) (London & Bray, 1985). Using
information gained from the assessment center at AT&T, they developed 45 items for
the 3 dimensions of career motivation, with 21 of those items related to career resilience.
London’s Career Motivation Inventory was reduced to a 17-item version (1993b). Each
item was rated on a five-point scale, from 1 = low to 5 = high, and the midpoint 3 =
moderate. London’s Career Motivation Inventory focused on feelings and attitudes.
The factor analyses of the 17 items yielded three independent factors that confirmed the
three pre-posit dimensions of career identity, insight, and resilience. Five items
clustered under the factor of career resilience (factor loadings ≥ .40). Although the test-
retest reliability for the career resilience items was not specified in the report, the 3½
month test-retest reliability coefficients for the combined scales ranged from .48 (p <
22
.01) to .73 (p < .001) for employees’ self-ratings, and .27 (p < .05) to .78 (p < .001) for
supervisor’s ratings. Internal consistency reliabilities of resilience items were .66 for
employees’ self-ratings and .86 for supervisor’s ratings.
Noe’s Measures of Career Motivation
Noe et al. (1990) designed a 26-item inventory to measure career motivation.
The subscale of career resilience consisted of 13 items. These items referred mostly to
behaviors. It consists of a five-point scale as well. In their study, these 26 items resulted
in three factors that provided preliminary evidence of construct validity. Career
resilience items yielded moderate internal-consistency reliability (α = .74). Based on
London’s career motivation theory, the authors also hypothesized that personal and
situational variables would influence an employee’s career motivation. The results
supported most of their hypotheses that personal characteristics (career stage, work-role
salience) and situational characteristics (managerial support, presence of motivating job
characteristics) were significantly correlated with career resilience (r = .18, .34, .23, .46,
respectively, significant at least at the .05 level).
An Integrated Career Resilience Subscale
Combining both London’s and Noe et al’s items, Grzeda and Prince (1997)
suggested a 14-item subscale to measure career resilience (five items from London’s
inventory and nine items from Noe et al’s measures). Grzeda and Prince investigated the
convergent and discriminant validity for these items on 94 Canadian managers and
professionals who had recently been displaced because of downsizing. First, they
employed factor analysis, five items drawn from London’s inventory loaded on one

23
factor (resilience), with a reliability coefficient (α) of .69. Noe et al’s items concerning
career resilience showed two factors: risk-taking and self-efficacy. Standardized
Cronbach α reliabilities for these two factors were .67 and .78, respectively. Evaluation
of discriminant validity demonstrated that career resilience was comprised of three
expected sub-domains: resilience, risk-taking, and self-efficacy, as suggested by career
motivation theory. The test on convergent validity showed that career resilience
positively and significantly related to creativity and autonomy as measured by the Career
Orientations Inventory Scales (R2 = .44 and .10, p < .01 and .05, respectively). It also
related positively to persistence- and perseverance- latent variables, which were
measured by the Self-efficacy Scale (R2 = .51 and .12, p < .01 and .05, respectively).
Grzeda and Prince concluded that the results supported the hypothesized positive
relationships between career resilience and its associate constructs, and the career
resilience subscale received the strongest support in their study.
Michigan’s Career Resilience Scale
Developed by Morgan Lyons for Operation ABLE of Michigan, this scale
consisted of 14 items that focused on employees’ employability and willingness to
change (Bice, 1999, January 24-30). This scale uses a five-point scale ranging from 5
(strongly agree), through 2 (agree somewhat), to 1 (don’t agree at all). A reliability α
coefficient equaled .88 on 719 participants. The item-total correlations showed that this
scale is unidimensional (Operation ABLE of Michigan, 2001, March). Validity
evidence is unavailable for this scale.

24
Research on Career Resilience
Research on career resilience is relatively scarce. Most studies focused on
validation of London’s career motivation theory and career motivation inventories, or
examined the relationship between career motivation and career commitment. Studies
from London (1993b) and Noe et al. (1990) showed that career motivation consisted of
career insight, career identity, and career resilience. Career resilience seemed to be the
strongest factor, that is, it can be more clearly identified as an independent factor than
the other two (career insight and career identity) in the validation studies (Hall, 1990;
Grzeda & Prince, 1997). In addition, the results of discriminant validity demonstrated
that career resilience comprised three sub-domains, which the authors named resilience,
self-efficacy, and risk taking (Grzeda & Prince, 1997). Since most studies used “career
motivation” as a variable, sometimes career resilience could not be separated from the
combined variable—career motivation. The results for studies reporting career
resilience as a variable are described as follows.
Career Resilience and Personal Characteristics
Hall’s (1990) pilot test of London’s Career Motivation Inventory (45 items) with
308 responses found that career resilience was significantly and positively related (p <
.05) to achievement, control, influence, dependence, extension, and affiliation, as
measured by the Motivational Analysis of Organizations-Behavior Inventory. Noe et al.
(1990) surveyed 237 workers, and Grzeda and Prince investigated 94 employees who
were downsized. The results showed that career resilience was significantly and
positively related to autonomy (p < .05). Lin’s (1997) study of 1,388 Taiwanese

25
undergraduate students discovered that students who showed high spontaneous learning
behavior got higher scores on career resilience than the low spontaneous behavior group
(p < .001). Career resilience was found to be positively relative to self-efficacy. For
example, Grzeda and Prince’s study, Fisher and Stafford’s (2000) study of 467 graduates
and undergraduate students, Gowan, Craft, and Zimmermann’s (2000) study of 171
United State Army personnel who were making the transition to civilian jobs, and
Pulley’s qualitative study (1995) of 20 participants who lost jobs, all agreed with this
conclusion.
In Grzeda and Prince’s study, career resilience was significant and positively
correlated with creativity, persistency, and perseverance as well (R2 = .44, .51, and .10,
respectively, significant at least at the .05 level). Gowan et al’s results indicated that
career resilience had a positive relationship with self-esteem (r = .53, p < .005), but a
negative relationship with future harm appraisal (r = –.31, p < .005); that is, participants
with high career resilience were more likely to hold positive anticipation or a less
stressful appraisal about the future. It was found that career resilience was significantly
correlated with the desire for recognition (r = .31, p < .01, London, 1993a). This might
be explained by the premise that desire for recognition can be viewed as a motivational
source of achievement, and achievement is theoretically related to career resilience.
These findings are generally congruent with the hypothesized characteristics of career
resilience.

26
Career Resilience and Age, Gender, Education, and Ethnicity
Most studies indicated that career resilience was positively related to age
(Brainerd, 1992; Carson & Bedeian, 1994; Fu, 2001; London, 1993a; Noe et al., 1990).
Fu (2001) found that 32-to-34 year old female employees showed higher career
resilience than those within 25 to 27 years old. London and Noe (1997) assumed that
this might be due to workers’ increasing experience, especially the experience required
for adapting to change. As for whether there is a gender difference in career resilience,
London and Mone (1987) seemed to imply that women might show lower career
resilience. For example, they stated that women are more likely to underestimate their
potential and to give lower evaluations of their performances than men do. Women have
not been encouraged to participate in team sports, do not learn how to view risk as an
opportunity for success, and are limited in their opportunities for reaching their full
potential. These factors are considered to have negative effects on being career resilient.
However, Woodd (2000) argued that women might be higher in career resilience than
men in the face of the turbulent workplace. Generally, women’s career patterns suit
better for the requirements in today’s work environment. For example, women have
more chances to shift from full-time to part-time jobs or from permanent to temporary
work. They are more likely to have career breaks (quit from jobs and become a full-time
home maker). Hence, they have more experiences with career interruption/disruption.
In addition, women usually rate extrinsic factors (salary, promotion, job security, etc.)
lower than men do. Therefore, women appear to be more adaptive and flexible in the
less secure, non-linear upward workplace. Nevertheless, no gender difference on career

27
resilience was reported in relative studies (London, 1993a; Noe et al., 1990). Only one
study in Taiwan revealed that male students were higher in career resilience than female
students (Lin, 1997). The author conjectured that female students were less willing to
take risks, and risk-taking is one sub-dimension of career resilience. Unlike gender
difference, Chang (1995) surveyed 225 Taiwanese employees who worked at high-tech
companies. Her data showed no significant difference among participants based on
educational levels. Fisher and Stafford (2000) found that there was no significant
difference among African American, Hispanic, and Anglo American students on career
resilience.
Career Resilience and Work Environment and Related Issues
London’s (1993b) and Noe et al’s (1990) studies showed that workers who
believed they were empowered and who felt that their supervisors supported their career
development yielded higher career resilience. London proposed that people who
become resilient have been reinforced for exercising their judgment, and have received
approval and admiration for taking challenges and acting independently. Similar to the
working participants, Fisher and Stafford’s (2000) student sample also showed career
resilience correlated positively with positive support from significant others (e.g.,
teachers, parents, and friends). Nevertheless, although career resilience was
significantly and positively correlated with all supervisor support activities in Kidd and
Smewing’s (2001) study, the results of hierarchical regression analysis indicated that
there is no relationship between supervisor support and career resilience.

28
According to Noe et al’s research, workers tended to be high in career resilience
if they viewed their work as important and perceived their job as including motivating
characteristics (e.g., autonomy, feedback from the job, satisfaction, and challenging).
Their study did not find a significant correlation between employees’ managerial
positions and career resilience.
Results of the studies with part-time versus full-time workers were controversial.
In London’s (1993a) sample, part-time workers were higher in career resilience than
full-time workers. Whereas, in Brainerd’s (1992) data, full-time nurses had higher levels
of career resilience than part-time nurses did.
Hofsted (as cited in Noordin, Williams, & Zimmer, 2002) hypothesized culture
differences in terms of collectivism-individualism. A collectivistic culture emphasizes
belonging to an in-group; in return for their loyalty, people are provided with protection
and security. An individualistic culture encourages an individual’s initiative and
achievement. Therefore, a logical expectation is that employees in individualistic
cultures will show higher levels of career resilience than those in collectivistic cultures.
Noordin et al’s (2002) finding supported their hypotheses. Australian managers
(indicated as an individualistic culture) showed higher career resilience than Malaysian
managers (indicated as a collectivistic culture). In addition, based on semi-structured
interviews, Leung and Clegg (2001) reported that women who worked for the Hong
Kong public sectors evaluated themselves low on career resilience. Government sectors
were viewed as a highly structured work environment, less risk-taking, and a less

29
competitive job content nature. These women declared that these factors fitted their
personalities better because they are not risk-taking and aggressive.
Findings of the relationship between career motivation and career/organizational
commitment were not consistent. Some studies showed a positive correlation between
these two variables (Carson & Bedeian, 1994; Kidd & Smewing, 2001). Scoble (1991)
found no relationship in the nurse sample.
Career Beliefs
Formation of Beliefs
A number of writers seem to agree that beliefs are formed through individuals’
learning and interaction with the environment (Fishbein & Ajzen, 1975; Krumboltz,
1979; Rokeach, 1972). Fishbein and Ajzen (1975) posited beliefs as a person’s
subjective judgments about oneself and the environment around him/her. They
hypothesized three types of formation of beliefs: 1. Descriptive beliefs, which are
formed on the basis of a person’s direct observation and experience with an object (it
could be a person, an event, or an idea). 2. Inferential beliefs are established through a
process of inference from prior beliefs about certain objects. 3. Informational beliefs,
instead of direct observation and inference, a person may accept information about
objects provided by outside sources, such as books, newspapers, television, friends,
coworkers, etc. Beliefs serve as an information base to build a person’s conceptual
structure. Based on a set of salient beliefs, a person forms a specific attitude toward an
object; consequently, he/she generates a relative intention, which may influence his/her

30
behavior. People will test the accuracy of their beliefs by comparing theirs with others’
opinions, and the feedback provides a source for revising their original beliefs.
Rokeach (1972) postulated that “beliefs are inferences made by an observer
about underlying states of expectancy” (p. 2). They are organized into architectural
systems in which beliefs vary along a central-peripheral dimension. The more central a
belief locates, the more important it is to the individual, and the more resistant it is to
change. The core of the belief system primarily represents a person’s truths about
his/her physical and social reality, and the nature of “self.”
Employing the social learning theory (Bandura, 1977), Krumboltz’s Social
Learning Theory of Career Decision Making (1979) constructed a framework for
understanding career-related behaviors. People’s personalities, preferences, and
behaviors are learned through two types of experiences:
1. Instrumental learning. It occurs when individuals’ behaviors are positively
reinforced or negatively punished. As a result, people tend to repeat the
behaviors that are rewarded, but avoid the behaviors that are punished or not
appreciated.
2. Associative learning. It occurs when individuals associate the affectively
neutral event/stimulus with an emotionally-laden events/stimulus, observe the
behaviors of others, or gain new information through media (e.g., books,
television, the Internet).
Krumboltz also identified four kinds of factors that influence career
development:

31
1. Genetic endowment and special abilities. Genetic endowment is inherited
qualities that may affect an individual’s ability to acquire certain educational
and occupational preferences and skills. It includes ethnicity, gender,
physical appearance, special abilities, and disabilities.
2. Environmental conditions and events. They are social, cultural, political, and
economic forces which are outside the individual’s control, but which can
potentially impact people’s career development.
3. Learning experience. Each individual has unique learning experiences
through instrumental and associative learning mechanisms that result in
different career preferences, aspirations, and choices of careers.
4. Task approach skills. Interaction among the above three factors (genetic
endowment, environmental conditions and events, and learning experiences),
people develop their own task approach skills and apply them to tasks or
problems they encountered. These skills include performance standards,
values, work habits, perceptual and cognitive processing schema, and
emotional responses.
The above four factors contribute to the development of individuals’ overall
belief systems. Krumboltz (1979, 1983) viewed the belief system as personal
generalizations in an attempt to represent their own reality about self and environment.
Individuals are constantly observing themselves and assessing their performance in
comparison to their own or others’ standards; thus, establishing their self-concept, or

32
self-observation generalizations. Self-observation generalizations are related to one’s
attitudes, interests, and values; and they may be overt or covert self-statements.
People’s beliefs about the environment are world-view generalizations. They
result from individuals’ observations and interactions with the environment. World-
view generalizations are used to predict what will occur in the future and in other
environments.
Beliefs and Career-Related Behaviors
Mitchell and Krumboltz (1996) stated that “people’s beliefs about themselves
and the world of work influence their approach to learning new skills and ultimately
affect their aspirations and actions” (p. 243). Krumboltz pointed out that individuals’
interests and values are developed through one’s learning experiences, and both of them
become the categories of self-observation generalizations. Krumboltz (1991) described
that the way people make career decisions, search for jobs, and seek promotions depends
on what they believe about themselves and the world of work. For example, a person
who believes he/she has the ability and an interest in learning mechanics is more likely
to choose mechanic as a major or as an occupation. Another example is that a person
who believes the computer business will continue to prosper in the future will cling to
computer-related careers.
Beliefs are the generalizations that are formed through the learning process from
personal observations and inferences. They may not always be accurate. However,
beliefs affect people’s behaviors regardless of whether they are accurate or not.
Krumboltz (1994b) declared that beliefs are neither good nor bad. A belief could be

33
dysfunctional for one person but functional for another. Hence, whether a person’s
belief is good or bad depends on the person and the situation. A false belief becomes
problematic when it discourages individuals from exploring career information and
activities, or forecloses desired alternatives. “If their beliefs are accurate and
constructive, they will act in ways that are likely to foster the achievement of their goals.
If their beliefs are inaccurate, and self-defeating, they will act in ways that make sense to
them but may hinder accomplishment of their goals” (Krumboltz, 1991, p. 1).
Irrational Career Beliefs/Career Myths
Early in the 1960s, Ellis (1962) discovered the relationships among the irrational
beliefs and the causes of psychological problems. He listed 11 irrational beliefs that
people used to distort reality and produce emotional distress. Since the 1970s,
vocational counselors have recognized that some of the beliefs that clients hold are
erroneous, which may interfere with the clients’ vocational decision-making and lead to
anxiety and dissatisfaction. They labeled these beliefs as irrational expectations,
misconceptions, or myths (Lewis & Gilhousen, 1981; Nevo, 1987; Thompson, 1976;
Woodrick, 1979). Early literature has been devoted to describing various erroneous
beliefs that cause dysfunctional career-related behaviors.
For instance, Thompson (1976) discussed seven misconceptions found in his
vocational counseling experience:
1. Exactitude. Clients viewed vocational planning and decision-making as very
scientific, and as leading to an exact, perfect career plan.

34
2. Singularity and finality. Clients believed that career decisions are made at
one point in their lifetime. Once a decision is made, it cannot be changed
because the decision should remain valid throughout their lifetime.
3. Expectations for vocational tests. Clients relied on psychometric tests
because they believed the test results could show them what they should do.
Actually, clients usually intended to shift the responsibility for making
their decisions.
4. Misconceived relationship between interests and abilities. Clients assumed
that a direct causal relationship existed between interests and abilities.
Therefore, they wanted to discover what they were interested in; then doing
well would follow automatically. On the other hand, they found excuses for
poor performance by attributing it to lack of interest.
5. Clients irrationally thought that they should thoroughly analyze all the
possible choices in every step. However, analyzing all the steps may result in
“overwhelming oneself with decisions” (p. 33).
6. Dichotomize career goals as either complete success or failure. This extreme
misconception could increase clients’ anxieties about making any decision.
7. Passage of time. Clients suspended their actions and simply believed that the
passage of time would clarify alternatives and result in making better
decisions. However, if the clients did not use their time to explore or rethink
their plans, it was unlikely that a good decision would be made.

35
Woodrick (1979) identified 19 career myths in his study of college students.
Besides the misconceptions discussed by Thompson, the additional career myths listed
in Woodrick’s work were:
1. The perfect job myth. Students believed “somewhere out there the right job
is just waiting for me. All I have to do is keep looking until I find it” (p. 7).
2. The myth that happiness is dependent upon vocational success. Students
equated their happiness with the successful achievement of one’s career
goals, rather than with the process of exerting themselves toward the goal.
3. The myth of work as the central, one most important element of a person’s
life.
4. Work as a calling myth. There is one occupation that is calling a person; a
person only performs best in his/her calling job.
5. The myth of anyone can be president or work ethic myth. This myth
described the belief that anyone can do or be anything if they have aspirations
and work hard enough. However, hard work is only one variable for
achieving success.
6. My son (daughter) the doctor myth. This myth portrayed that a person’s self-
worth is measured by occupational status.
7. The expert myth. Students believed experts (e.g., counselors, teachers,
parents) or tests could tell a person what career is best or right for him/her.
8. College as vocational training myth. This myth represented the belief that
going to college can promise better jobs.

36
9. The myth of chance and circumstance. This myth implied that it is no use to
plan for a career in advance because the outcome is determined by luck,
chance, or the environment.
10. The myth of intuition. Everyone has innate intuition to know what the right
decision is for him/her when it comes to choosing the right occupation.
11. The myth of rationality. This myth stated that decision-making should rely
solely on a rational approach—that people’s feelings or intuitions are
unreliable.
12. The myth of sex role. This myth is associated with traditional stereotypes
about proper sex roles in the workplace, such as whether women should place
more effort in home and family; or whether women should stick to women’s
jobs.
Later, in Lewis and Gilhousen’s study (1981), career myths similar to
Woodrick’s were reported. One additional irrational belief was “I want you have it
better than I did.” This myth implied that there is a set of established rules that, if
followed, will lead to a better life. This belief also assumed that the younger generation
must achieve more than their parents.
Nevo (1987) observed 10 irrational career expectations that contribute to clients’
indecisions and frustrations when they deal with career choices. Most of the irrational
expectations have been described previously. Two that are different from those
previously discussed beliefs are: My vocation should satisfy the important people in my
life, and entering a vocation will solve all my problems.

37
The Characteristics of Irrational Career Beliefs
Mitchell (as cited in Krumboltz, 1983) categorized five reasons that caused false
beliefs:
1. Overgeneralization.
2. Inference made without checking sources.
3. Inability to see the possibility for changing learned behavior.
4. Catastrophizing.
5. Illogical inference.
Krumboltz (1994a) pointed out that some beliefs are so well ingrained in society
that people may not be able to identify them but, instead, they hold these beliefs as
undoubtable truths. He (1983) characterized troublesome beliefs into the following
factors:
1. Faulty Generalizations. The base of generalization may have been accurate,
but the overgeneralization becomes a poor decision.
2. Self-comparison with a single standard. Judgment about one’s performance
may be different depending on what/who it is compared with. If a person
compares himself/herself with someone who performs better, he/she will feel
incompetent.
3. Exaggerated estimate of the emotional impact of an outcome. People often
exaggerate their fear about negative outcomes. They think if the decisions
turn out not as they wanted, they cannot stand the disaster; so they are afraid
of making decisions.

38
4. False causal relationships. If people relate success to hard work and
ambition, this will encourage their aspirations and endeavors. If they relate
success to chance or fate, this will lead to no action or to waiting for good
luck.
5. Ignorance of relevant facts. If individuals only focus on the idealistic image
of an occupation, they will overlook the relevant facts and distort reality.
6. Undue weight given to low probability events. Avoiding making career
decisions based on a very low probability event (e.g., earthquake or tornado
in some areas) may limit alternatives.
7. Self-deception. Sometimes the stated beliefs are rationalizations or socially
acceptable ones for which actual reasons cannot be revealed.
Beliefs in Self-Efficacy
Bandura’s Self-Efficacy Theory hypothesized that people have beliefs about their
own ability to successfully perform a specific task (1977). The belief about their
abilities is defined as efficacy expectancy. In addition, people have beliefs about the
results of their performance, which is defined as outcome expectancy. If a person
believes he/she has the required capacity to accomplish the task, and also believes that
the outcome will turn out to be positive, he/she is more likely to initiate the behavior,
and to devote efforts to implementing the goal, even if he/she faces hindrance. In
contrast, low self-efficacy tends to block individuals’ actions, because people just simply
give up, or set lower goals for themselves.

39
Betz and Hackett (1981) were the first to apply the self-efficacy theory to career
domains. Career self-efficacy was proposed to play a major mediational role in the
process of choosing and pursuing a career. They emphasized self-efficacy expectation
as an important variable in understanding and modifying women’s career development.
Their studies indicated that self-efficacy was significantly related to occupational choice.
Gender differences could explain women’s low self-efficacy in non-traditional
occupations (i.e., male-dominated occupations), which limited the range of their career
options; and why women underutilized their abilities and talents in career pursuits,
which was the reason they were under represented in many male-dominated careers,
such as mathematics, engineering, and science.
Empirical evidence for the influence of self-efficacy on career related behavior
has been reported (Bandura, Barbaranelli, Caprara, & Pastorelli, 2001; Betz & Hackett,
1981; 1986; Cited in Lent & Hackett, 1987; Taylor & Popma, 1990). Taylor and
Popma’s (1990) study revealed that career decision self-efficacy was the only significant
predictor of vocational indecision. Niles and Sowa (1992) correlated Career Decision-
Making Self-Efficacy (CDMSE) with general self-efficacy, personality hardiness
(control, commitment, and challenge) and career beliefs (status, preference, motivation,
and flexibility). The results supported that CDMSE was significantly and positively
related to general self-efficacy, motivation, commitment, control, flexibility, and
preference (r ranged from .19 to .43, p < .01); more saliently, motivation (which was
defined as individuals’ willingness to overcome obstacles and to explore career options)
was the strongest predictor in the regression for CDMSE. Bandura, Barbaranelli,

40
Caprara, and Pastorelli (2001) identified that children’s self-efficacy was the essential
determinant of their perceived occupational self-efficacy and preference of career
choice. Lent and Hackett (1987) suggested that career self-efficacy had potential for
understanding and facilitating career adjustment.
Measures of Career Beliefs
Identifying individuals’ career beliefs is important because holding irrational
assumptions may impede progress toward career goals, thus leading to dissatisfaction
due to a lack of action or inappropriate coping skills.
Krumboltz’s Career Beliefs Inventory (CBI).
The CBI was designated as a counseling tool to increase individuals’ awareness
of their career beliefs and to assess the potential impact of these beliefs on occupational
choice and the pursuit of a career (Krumboltz, 1991). The CBI has 96 items grouped
into 25 scales. These 25 scales are organized under 5 headings:
1. My current career situation. This includes four scales: Employment Status,
Career Plans, Occupations of Uncertainty, and Openness.
2. What seems necessary for my happiness. This heading consists of five
scales: Achievement, College Education, Intrinsic Satisfaction, Peer Equality,
and Structured Work Environment.
3. Factors that influence my decisions contains six scales: Control,
Responsibility, Approval of Others, Self-other Comparison,
Occupation/College Variation, and Career Paths Flexibility.

41
4. Change I am willing to make. Three scales are under this heading: Post-
training Transition, Job Experimentation, and Relocation.
5. Effort I am willing to initiate. This includes seven scales: Improving Self,
Persisting While Uncertain, Taking Risks, Learning Job Skills,
Negotiating/Searching, Overcoming Obstacles, and Working Hard.
The CBI has been administered to more than 7,500 individuals in 12 states in the
United States and in Australia. The ages of participants range from 12 to 75, including
employed/unemployed adults and undergraduates, high school, and junior high school
students. Both test-retest and internal consistency reliabilities yielded from low to
moderate. On the college sample, 3-month test-retest reliabilities ranged from .27 to .68;
and the one-month test-retest reliabilities on the high school sample ranged from .35 to
.74. The relatively low test-retest reliabilities might reflect the groups’ change of beliefs
over a period of time. The reliabilities of internal consistency mostly fall between .40
and .50. The low internal consistency might be due to the small number of items in the
scales because 10 scales consist of only 2 items, and the longest scale has 8 items. The
CBI was criticized because some scales require additional items to achieve the desired
internal consistency (Fuqua & Newman, 1994).
Studies on the construct validity show an extremely small correlation between
the CBI and other career related instruments, such as the Strong Interest Inventory, the
Self-Directed Search, the Myers-Briggs Type Indicator, the School and College Ability
Test, the Career Assessment Inventory, and the Fundamental Interpersonal Relations
Orientation-Behavior (Naylor & Krumboltz, 1994). Those results provided evidence for
42
the construct validity that the CBI clearly measures constructs differently from aptitudes,
interests, and personalities. Holland, Johnston, Asama, and Polys (1993) validated the
CBI using the NEO Personality Inventory, the Self-Directed Search, the Vocational
Identity, and the Preconscious Activity Scale. They concluded that the CBI had at least
moderate construct validity. In addition, substantial correlation with the State-Trait
Anxiety Scale indicated that certain irrational beliefs caused individuals’ emotional
discomfort.
A factory analysis using Varimx (orthogonal) rotation on the CBI scale scores
extracts four factors: 1. beliefs that work is valuable vs. work has little value; 2. beliefs
in exploring options vs. maintaining a consistent direction; 3. beliefs in the importance
of self-reliance vs. seeking help from others; 4. Beliefs in the importance of compliance
vs. not being constrained (as cited in Fuqua & Newman, 1994). Therefore, instead of 25
scales, the factor analysis represents four major underlying variables that the CBI
potentially measures. However, Fuqua and Newman (1994) suggested using oblique
rotation (because factors might be well correlated) on items not on scale scores.
The Chinese Career Beliefs Inventory (CCBI)
In Taiwan, fewer than five measures on career beliefs have been designed for
study purposes (Chi, 1994; Jin, Lin, & Tien, 1989; Wu, 1991), and their participants
have all been students. Yang (1996) developed and standardized the Chinese Career
Beliefs Inventory for assessing the career beliefs held by high school and college
students, and for evaluating the effects of cognitive career counseling approaches.

43
The CCBI consists of three forms: Form A-1, Form A-2, and Form B (CCBI-B).
Form A-1 is the longest form, and it contains 180 items. Form B is the shortest form,
with 99 items (Yang, 1996). The items were generated by adopting three approaches: 1.
a review of Western literature, 2. a review of Chinese literature related to career beliefs,
and 3. the use of questionnaires and interviews to collect common career beliefs among
Taiwanese senior high school and university students. All items were classified as
relating to different concepts; then one Chinese professor, one high school counselor,
and one testing expert were invited to edit the items. There were 296 items in the pilot
form. Items were written as positive or negative statements. Respondents indicated
their agreement (from strongly agree to strongly disagree) with the statements on a five-
point Likert scale. Based on 1,656 usable questionnaires, 13 subscales and 180 items
were determined for Form A-1. Next, Form A-2 was created from selecting the 10 most
representative items from each subscale of Form A-1. After conducting factor analysis
using the Principal Component method with Oblimin rotation on Form A-1, 12 subscales
and 99 items were obtained for Form B. Each subscale consists of five to nine items.
The subscales on Form A and B are almost identical (11 subscales on Form B are the
same as on Form A-1 and Form A-2), except for two subscales on Form A
(“Recognition by Others” and “Desire for Achievement”), which are combined into one
subscale on Form B.
The 12 subscales on the CCBI-B are: 1. Responsibility for Decision-Making, 2.
Preparation for Occupation, 3. Finality of Decision, 4. Recognition by Others and Desire
for Achievement, 5. Importance of Work, 6. Occupational Status, 7. Economic Reward,

44
8. Sex Role Stereotypes, 9. Interests, 10. Avoidance of Decision-Making, 11. Fate, and
12. Perfectionism. The following technical considerations on CCBI are reviewed for
Form B because it is the instrument used in this study.
Normative Sample
The normative sample consisted of 2,210 senior high school and 1,750 university
students. The student samples were drawn by means of stratified and cluster-sampling
techniques based on the locations of the schools, the types of schools (public or private),
and grade levels.
Reliability
The Cronbach α coefficient was .86 for the total scores and ranged from .48 to
.83 for the subscales. The one-month test-retest reliability coefficients for the high
school sample were .82 for the total score, and ranged from .47 to .80 for the subscales.
For the university sample they were .77 for the total score, and ranged from .46 to .82 for
the subscales. The one-month test-retest reliability coefficients were low, but they were
higher than those in Krumboltz’s Career Beliefs Inventory (.35 to .74, Krumboltz, 1991).
Construct Validity
1. The correlation between the subscales of the CCBI and the Marlowe-Crowne
Social Desirability Inventory showed that most subscales did not relate to
social desirability, except for subscales of Recognition by Other and Desire
for Achievement, Economic Reward, Avoidance of Decision-Making, and
Fate. Results are congruent with Woodrick’s (1979) study.

45
2. The correlation with the State-Trait Anxiety Scale indicated that the more
rational beliefs the respondents held, the less anxiety they had. This finding
is similar to the CBI validity study (Krumboltz, 1991).
3. The correlation between the CCBI and the Rational Behavior Scale showed
that the lower respondents scored in career beliefs, the more rational
behaviors they had.
4. Correlation with the Lai’s Personality Inventory revealed that respondents
with more rational career beliefs were more likely to be better socially
adapted and more emotionally stable.
5. In relation to the Occupational Decision-Making subscale, the results yielded
that respondents with more rational career beliefs also showed better
occupational decision-making behaviors.
6. The CCBI related weakly to the Occupational Interest Inventory, which is
consistent with Krumboltz (1991) and Holland et al’s (1993) studies on the
CBI.
7. Inter-subscale correlation coefficients were .00 to .63, and subscale-total-
scale correlation coefficients were .14 to .79. The results showed most
subscales were independent of each other. The findings regarding the
construct validity of the CCBI yielded expected results and unfolded
supportive evidence for its construct validity.
Comparing the CCBI to the CBI, they both have low to moderate test-retest
reliabilities. The reliabilities of internal consistency on the CCBI were higher than those

46
on the CBI—the reason might be that the CCBI has more items in each scale. Studies on
validity seemed to demonstrate that both inventories had appropriate construct validity.
Examining the career beliefs on the CCBI and the common career myths reviewed in the
Western literature, similarity was found in both cultures: a career decision is singular
and final; there is a perfect job for each individual; happiness is dependent upon
vocational success; work is central to one’s life; sex role stereotypes; it is no use to plan
for a career in advance because the outcome is determined by luck, chance, or the
environment; and the experts can determine a better decision. The irrational beliefs
themselves may be similar in different cultures; however, they might vary in gender,
age, or other demographic dimensions. Research on career beliefs in the West (mostly
the United States) and in Taiwan is discussed in the following section.
Research on Career Beliefs
This section reviews research about the relationship among career beliefs and
career decision-making, gender differences, sex-role stereotypes, and unemployed
adults. Studies in both the United States and Taiwan are summarized and discussed for
in-depth understanding.
Career Beliefs and Decision-Making and Career-Related Behaviors
Literature reviewed previously suggests that people generate self- and world-
beliefs that serve as a cognition base to guide their behaviors. The focus has been how
irrational career beliefs lead to a maladaptive career decision-making process. In
Murry’s (1989) study on undergraduates, decidedness was correlated positively with
undecided stigma and negatively correlated with avoidance. Ryan-Jones (1990) found

47
that college students with low decidedness tended to assume that external forces were
responsible for their career decisions, and they were comfortable with their levels of
career indecision. Enright’s (1996) study showed that college students with greater
levels of self-doubt regarding career decision-making had higher levels of career
indecision. Lunney’s (1993) survey of Liberal Arts graduates revealed that decided
students demonstrated stronger career beliefs about hard work, in their abilities to
overcome obstacles, and in their own control over outcomes. On the other hand,
undecided students expressed more willingness to rely on expert advice, but were much
less willing to consider career choice involving flexibility and to take risks.
Luzzo (1997) examined Mexican American undergraduate students, and found
that participants who perceived more career barriers were less likely to believe they had
control over the barriers, or that they were responsible for their own career decision-
making processes. Students with more confidence had more adaptive career beliefs.
Mitchell’s (1993) investigation of adults considering midlife career changes
found that negative career beliefs and perceived blocks hindered career exploration
behavior. Her cognitive restructuring program, which assisted adults in exploring their
beliefs and their perceived blocks, proved to have an impact on increasing career
exploration behaviors.
Although proposing career beliefs was associated with the amount of time spent
on the processing of vocational information, Maichrowicz’s (1996) data failed to support
his hypothesis. It only found that participants with lower scores on the Intrinsic
Satisfaction Scale spent more time searching for information about salaries.

48
In sum, research portrays that career-undecided people tend to have beliefs on
avoidance, have self-doubt, perceive more obstacles, feel less control over their
problems, and rely on external forces or on experts for their career decision-making.
Decided people are more confident and have more adaptive career beliefs. They believe
in hard work, in their ability to overcome career barriers, and in their own control over
outcomes.
Career Beliefs and Age, Gender Differences, and Sex Role Stereotypes
Murry (1989) investigated 424 undergraduates found the level of irrational
beliefs decreased with age and work experience. Research findings conflict about career
belief differences between females and males. Some studies obtained a few significant
differences between male and female participants. Murry (1989) found male student
tended to hold stronger beliefs on Inappropriate Striving and Avoidance than female
students. Data from Holland et al’s (1993) study showed gender difference only on the
Negotiating/Searching Scale: women were more likely to negotiate work changes or
seek a new job than men. In Ryan-Jones’ (1990) study, female students were more
likely to believe that a college education was a critical requirement for attaining a good
job. Krumboltz (1991) reported male and female respondents only differed on scale 20
(Persisting While Uncertain). Females scored slightly higher than the male respondents
did, indicating that women were more willing to work hard when their goals were
uncertain. These findings did not present a pattern for gender difference.
Sex role occupational stereotypes are the images of the female and the male who
are typically in particular occupations. It is believed that these images are socially-

49
learned by members within a society, and that they are infused into boys’ and girls’
career beliefs about their sex roles regarding occupations (Cronen, 1999). The sex-role
stereotypes influence individuals’ developments of interest, competence, and career
choice.
Jackson’s (1995) study revealed that women employed in traditional occupations
yielded significantly lower scores on the scale of “Value of Hard Work” in the CBI than
women in non-traditional occupations and in training programs. This scale includes
Working hard, Negotiating/Searching, Persisting While Uuncertain, Overcoming
Obstacles, Achievement, Occupation/College Variation, Taking Risks, Openness, and
Intrinsic Satisfaction.
Stone (1996) reported a similar finding. She stated that women in non-traditional
careers tended to believe success comes from hard work, and that obstacles can be
overcome. They were willing to explore different jobs, were better able to tolerate
uncertainty, and valued intrinsic satisfaction. These women were also less likely to hold
occupational stereotypes, whereas their career beliefs tended to be more confident, open,
and flexible. Additionally, Stone’s data showed that younger women seemed to have
greater control over their career decisions, valued intrinsic satisfaction, and held less
stereotypical views about careers and college. Older women were more persistent even
when the outcome was uncertain. Frome (1998) found that if women held more
traditional occupation beliefs regarding sex role stereotypes, they tended to place less
importance on their career, expected less responsibility for providing the family with

50
income, and preferred jobs that were flexible enough to meet their family
responsibilities.
In summary, research has not come to an agreement on whether or not males and
females hold different patterns of career beliefs. However, studies on women in
traditional and non-traditional careers have shown discriminant beliefs. Women in non-
traditional careers tended to believe in hard work, thought obstacles can be overcome,
were better able to tolerate uncertainty, and valued intrinsic satisfaction. They were also
less likely to hold occupational stereotypes.
Career Beliefs of Unemployed Adults
Comparing the career beliefs of dislocated workers with those of the employed
norm sample presented in the CBI manual, Spor (1999) found significant differences in
the following career beliefs: Openness, Intrinsic Satisfaction, Responsibility, Self-other
Comparison, Occupation/College Variation, Career Path Flexibility,
Negotiating/Searching, and Working Hard. However, the direction of the differences
(i.e., which group yielded higher or lower scores) was not mentioned in the thesis.
Porat, Marshall, and Howell (1997) conducted a study investigating the difference in
career beliefs (using the CBI) among homeless veterans, employed adults, and
unemployed adults. When combining their results with Spor’s findings, common
significantly different career beliefs held by unemployed versus employed adults
emerged. The unemployed tended to believe that work is a means to other goals, and
that expert help can determine career choices for them. They see similarities between
colleges and workers within a given occupation, insist that certain steps must be

51
followed in order to attain a goal, right job is impossible to find, and hard work may not
bring success.
Career Beliefs Research in Taiwan
Unlike the findings in the United States, research in Taiwan reported significant
gender differences in career beliefs. For example, in Yang’s (1996) student sample,
significant gender differences were found in 8 of the 12 subscales. Male students had
more irrational career beliefs than female students. One common difference was the
belief concerning sex role stereotypes, but the results conflict. Some studies found that
female students (high school, vocational school, and college) held stronger sex role
stereotypes (Chang & Lin, 1996; Leu, 2000, Tien, 1998). Others reported that males
held more sex role stereotypes (Chiou, 1999; Jin, Lin, & Tien, 1989; Liu, 1997; Yang,
1996). Men generally believed that work is very important (Liu, 1997; that their
achievements at work represented their self-worth, and the higher positions they got, the
more important they felt about themselves (Chi, 1994; Jin, Lin, & Tien, 1989); that
economic reward is very important when choosing an occupation (Chiou, 1999; Yang,
1996); and that a career decision is final, it must not be altered (Jin, Lin, & Tien, 1989).
Studies could not generate a profile for women about their career beliefs.
Some studies on career decidedness yielded similar findings to studies done in
the United States. Chi (1994) reported that career undecided students seemed to agree
more with avoidance, obedience, and face-orientation; whereas career-decided students
tended to agree more with control and hard work. They also believed that decision-
making should be cautious, that interest is equal to ability, and that the characteristics of

52
the individual and the environment should match. Leu’s (2000) study showed that
career-indecisive participants were more likely to avoid challenges, set lower goals, fear
failure, and rely on experts to determine their career choices.
Using path analysis, Wu (1991) found career decision-making beliefs had strong
and direct influences on career decision-making behaviors through the factors of trait
anxiety and state anxiety. Leu (2000) found Perfectionism was the strongest factor
impacting participants’ indecision. Examining elementary school teachers’ irrational
career beliefs, Liu (1997) reported that the older the teachers were, the higher scores
they got on the career beliefs scales, and the differences between age levels reached
statistical significance. The author did not discuss this finding further; however, the
results revealed that the older teachers tended to hold more irrational career beliefs. This
conflicts with Murry’s (1989) findings that irrational beliefs decrease with age and work
experience. Concerning whether work experience influences career beliefs, Chi’s (1994)
data showed that students with work experience agreed more with hard work and held
more flexible beliefs; while students without work experience showed lower self-
confidence and more avoidant beliefs when making career decisions.
Summary
The literature review presented in this chapter focused on the two major areas:
career resilience and career beliefs that provide the framework for studying the
relationships between the two variables. London’s career motivation theory provided a
theoretical construct for career resilience (1983). He hypothesized that career resilience
consisted of three sub-domains: self-efficacy, risk taking, and dependency. Waterman et
53
al. (1994) and Collard et al. (1996) emphasized that resilient workers should continue to
learn, should maintain their employability, and should take responsible for their own
career management. Comparatively little research has focused on career resilience.
Among the studies, career resilience was found to be related to personal attributes, such
as achievement, autonomy, creativity, persistency, self-efficacy, and self-esteem, which
are congruent with theoretically proposed personality characteristics. Research findings
also indicate that career resilience seems to increase as workers age. Yet, there is not
sufficient evidence to conclude there is a gender or ethnicity difference. Some results
revealed that positive support, feedback on performance, and empowerment in the
workplace may enhance employees’ career resilience, but the other did not agree with it.
The conflicting results might be due to the different hypothesized constructs of career
resilience and the different measurements used in the studies. Measures of career
resilience have not been well developed or well validated. Further research is really
needed since career resilience has been recognized as the key to overcome career
barriers and to achieve career success in the accelerative changing workplace.
Review of the literature concerning career beliefs indicates that beliefs are
formed through individuals’ learning processes (personal observations and inferences) as
well as through their interaction with the environment. Beliefs serve as a cognition base
that influences an individual’s attitudes and behaviors. Krumboltz’s Social Learning
Theory of Career Decision-Making (1979) provides a framework for understanding the
relationship between career beliefs and career decision-making. He proposed that
people generate beliefs about themselves and the world of work. These beliefs will

54
influence people’s development of their career preferences and aspirations. Based on
their career beliefs, people either make or avoid making their decisions. Vocational
counselors have identified dozens of irrational career beliefs that may interfere with an
individual’s career decision-making and lead to anxiety and dissatisfaction.
Career self-efficacy was found to play a mediational role in the process of
choosing and pursuing a career as well as in understanding and modifying women’s
career development. People low in self-efficacy are more likely to be career indecisive
and to set lower goals for themselves. Since self-efficacy was also proposed as one sub-
domain of career resilience (London, 1983), it will be an important variable in
examining career decision-making and related behaviors. A review of the common
career myths existing in the United States and in Taiwan did not find much variation.
However, research in Taiwan showed greater gender differences in sex role stereotype
career beliefs than those found in the United States.
Career resilience and career beliefs will be the salient factors in understanding
individuals’ career related behaviors. No prior study investigated the relationship
between these two variables. This study attempts to examine their relationship and how
they interact with participants’ demographic variables (e.g., gender, age, education,
number of years of paid work, career/organization change, employment at a public or a
private institution, and participation in training/educational activities for more than one
week in the most recent six months) that may contribute to future research.

55
CHAPTER III
METHODOLOGY
Chapter III is a description of the procedures and methods that were used to
collect and analyze the data for both the pilot and the main studies. This chapter consists
of two major sections under the headings of “The Pilot Study” and “The Main Study.”
The first section describes the purposes, instruments, samples, procedures, and methods
and results of data analysis for the pilot study. The second section presents the purposes,
instruments, samples, procedures, and methods of data analysis for the main study. A
brief summary concludes this chapter.
The Pilot Study
Purpose
The purpose of this study was to explore the relationship between career
resilience and career beliefs of employees in Taiwan, as well as to examine whether the
individuals’ demographic factors (e.g., gender, age, educational levels, number of years
of work experience, etc.) have effects on these two variables. Through a review of
literature, the researcher found no appropriate instruments that could be used to measure
career resilience for the employees in Taiwan, and the Chinese Career Belief Inventory
(CCBI) was developed using only student samples. The purpose of the pilot study was
to adapt the existing measurements of career resilience and the CCBI-form B for the
employee sample in the main study.

56
Instruments
The Measures of Career Resilience
In the review of the relevant research, there was found to be no well-developed
and standardized instrument for measuring career resilience. London (1993b) developed
five items of career resilience that concerned feeling and attitudes. Based on London’s
career motivation theory, Noe, R. A., Noe, A. W., and Bachhuber (1990) designed 13
items measuring career resilience that focused on behaviors. Combining London’s and
Noe et al’s items, Grzeda and Prince (1997) proposed an integrated 14-item career
resilience scale. Because the integrated items showed a clear 3-factor structure that
was consistent with London’s theoretical construct of career resilience, the 14 items
were embraced as part of the Measures of Career Resilience in the pilot study.
In addition, Michigan’s Career Resilience Scale (Bice, 1999, January 24-30) was
included. This scale adopted Waterman et al’s (1994) and Collard et al’s (1996)
advocacies of a resilient workforce, and it consisted of 14 items that emphasized
employees’ employability and willingness to change. However, the first item, “I can
easily describe the value I bring to an employer,” was not be retained because there was
only one item dealing with value, and its meaning was ambiguous. The second item,
“During an interview, I could list at least 10 skills that I possess,” was a yes/no question,
and using 10 skills as the criteria to measure whether a person was resilient or not was
questionable. Hence, it was deleted. The fifth and sixth items were modified from “My
skills have been upgraded in a significant way in the past year” and “I have upgraded my
computer knowledge in the past year” to “My skills have been upgraded to keep pace

57
with current techniques” and “I have adequate computer knowledge and skills to do my
job.” Additionally, continuous learning was identified as one important characteristic of
career resilience (Brown, 1996, Waterman et al., 1994), yet it did not appear in any of
the mentioned scales. Therefore, two items concerning active learning were generated
by the researcher: “If I identify what I need to learn, I will actively seek learning
opportunities” and “I like to read or attend conferences and workshops to learn new
knowledge or skills.”
Combining the 14 integrated items suggested by Grzeda and Prince, 12 items
from Michigan’s Career Resilience Scale, and two items generated by the researcher, a
total of 28 items were employed to measure career resilience in the pilot study (see
Appendix D). In order to maintain consistency, all items were stated positively (the
original items that Grzeda and Prince suggested were written as question sentences).
The present Measures of Career Resilience was adopted from a 5-point Likert type scale.
The scale ranged from 1 (strongly disagree) to 5 (strongly agree), and 3 was “uncertain.”
The 28 items were translated into Chinese and tested in the pilot study.
The Career Beliefs Scale
Although Krumboltz’s Career Beliefs Inventory (CBI) is a formal, well-
developed instrument for measuring career beliefs, Yang’s Chinese Career Beliefs
Inventory—Form B (CCBI-B) was selected for this study because it was designed for
Taiwanese students and was also built on a relatively large sample. Comparing the
subscales of the CCBI-B to the career myths discussed in Western literature, they did not
differ much from each other. In addition, the CBI was criticized for its low internal

58
reliabilities in the subscales. One possible cause for this was that 10 out of the 25
subscales consisted of only two items. The CCBI-B included 12 subscales, in which
most subscales contained 8 or 9 items, the least including 5 items. Therefore, the
internal reliabilities of the CCBI-B (.48 to .83, Yang, 1996) were higher than those in the
CBI (.35 to .74, Krumboltz, 1991).
The participants in the pilot study were current employees or adults with work
experience. Some items in the CCBI-B were inadequate, such as items from subscale 2
“Preparation for College,” and subscale 9 “Interest” (four questions focused on choice of
a major). Subscale 2 and subscale 9 were not included in this study. Thus, 10 subscales
consisting of 81 items from the CCBI-B were validated in the pilot study (see Appendix
E). Minor changes were made in those items because some items in the original CCBI
were written in a future context with the phrases like “my future job” or “after I
graduate.” All the inappropriate sentences were changed into a present context (i.e.,
rephrased as “my job” or removed the phrase “in the future.”). Items referring to
choosing a “major” were changed to choosing a “career/occupation.”
The 10 career beliefs as measured by Yang’s (1996) CCBI-B and their respective
meanings are listed below:
1. Responsibility for Decision-Making
• High score: Other’s help can determine the best choice.
• Low score: A career choice is a personal responsibility.
2. Finality of Decision
• High score: Once a decision is made, one should not change it.

59
• Low score: A career decision can be changed whenever the individual
needs or the environment is changed.
3. Recognition by Others and Desire for Achievement
• High score: Other’s recognition and approval are important.
• Low score: Other’s recognition and approval do not matter.
4. Importance of Work
• High score: Work is very important in one’s life; it brings one meaning
and happiness.
• Low score: A person can obtain satisfaction and happiness from other
sources; one will not sacrifice family life for work.
5. Occupational Status
• High score: Some occupations are more prestigious than others.
• Low score: All occupations have an equal status.
6. Economic Reward
• High score: Salary is the primary concern when making a career decision.
• Low score: Salary is not the most important concern; interests and
abilities are also important when considering a job.
7. Sex Role Stereotypes
• High score: Some jobs are more suitable for men; some are more suitable
for women.
• Low score: Gender should not be a restriction when making career
decisions.

60
8. Avoidance of Decision-Making
• High score: Avoid making decisions.
• Low score: Do not avoid making decisions.
9. Fate
• High score: Leave decisions to fate.
• Low score: Future is controlled in one’s hand; one should plan for his/her
future.
10. Perfectionism
• High score: One should find the best-fit occupation.
• Low score: A career choice does not have to be perfect for a person.
The Personal Data Sheet
A one-page personal data sheet was designed to collect information on each
participant’s (1) type of institution: public or private, (2) business activity of the
organization, (3) the number of years in the current job, (4) supervisory experience and
the length of time as a supervisor, (5) total years of paid work, (6) number of career
changes, (7) number of organization changes, (8) gender, (9) age range, and (10) level of
education (see Appendix F).
Sample
The proposal of this study has been reviewed and approved by the Institutional
Review Board—Human Subjects in Research, Texas A&M University in May, 2002.
Non-random volunteer samples were selected in Taiwan for the pilot study. Participants
were employees in a government-owned company, and students of two colleges who

61
were enrolled in English and Business Administration classes and who had work
experience. Of the 260 questionnaires distributed in June of 2002, 178 were returned.
The total response rate was 68%. Almost all the employee sample returned the
questionnaires. In examining the reason why some student participants did not return
their questionnaires, it was discovered that they were busy preparing for final exams (in
Taiwan, schools usually hold final exams in mid-June).
Among the 178 participants, 30 employees were selected from a government-
owned company; and 148 college students who had work experiences were selected
from one college and one university. Approximately 68% of the participants were
female (N =120), and 32% were male (N = 57); 22% of participants worked at public
institutions (N = 37), and 78% worked at private organizations (N = 129); 30% of the
participants had been supervisors (N = 52); and 60% had changed careers before (N =
106). About 47% of participants had worked less than 5 years (N = 80), and 23% had
worked between 6 to 10 years (N = 39). The mode of the age range was 21-to-25 year
old (34.5%, N = 61). The second largest group was 26-to-30 year old (N = 27, 15.3%),
and followed by 31- to-35 year old (N = 25, 14.1%). Most of the participants had
bachelor degrees (41%, N = 73), and 35% had junior college degrees (N = 62). A
summary of the participants’ demographic data is presented in Appendix G.
Procedures
The pilot study was conducted in June of 2002. In May the researcher had called
and obtained permission from three contact persons for distributing questionnaires to
their colleagues and students. The researcher visited the classrooms and handed out the

62
questionnaires to potential participants. Some of the questionnaires were sent to the
contact persons who then delivered them to their colleagues or students.
The questionnaire for pilot study included: a cover letter that described the
purpose of this study and encouragement for participation (see Appendix A), a consent
form (see Appendix B), instructions on how to respond to the questions (see Appendix
C), the Measures of Career Resilience (see Appendix D), the Career Beliefs Scale (see
Appendix E), and a Personal Data Sheet (see Appendix F). All materials were presented
in Chinese. Voluntary participation and confidentiality of the individual’s information
were emphasized in the cover letter, the consent form, and the instructions, as well as
during the researcher’s/contact person’s oral explanation. Participants were asked to
complete the questionnaire after normal work hours or after class. The questionnaires
were collected by the researcher or by the contact persons.
Data Analysis
Data including participants’ personal information, responses to career resilience
and career beliefs were coded and analyzed using the computer statistics program
entitled Statistical Package for the Social Sciences, Version 10.0. Because items in the
CCBI were either negatively or positively stated, the positive items were reversed when
analyzing them. Rating as “1” was reversed to rating as “5,” “2” to “4,” “4” to “2,” and
“5” to “1.” The higher score in career beliefs indicates the more irrational career beliefs
a person has. Factor analyses and internal consistency reliabilities were applied to
analyze the responses on the Measures of Career Resilience and the Career Beliefs

63
Scale. Items not showing clustering under a meaningful factor and/or contributing little
to overall reliability were eliminated.
The primary procedure employed to select items was factor analysis. In
behavioral science, the observed variables usually correlate with each other because they
measure some things in common (McDonald, 1985). If the variables are highly
correlated, it means that they are clustered into one common factor (Kachigan, 1991).
Basically, the procedure of factor analysis is to simplify a correlation matrix. The goal
of factor analysis is to achieve parsimony by identifying fewer common factors among a
large set of observed variables, and thus represent a new construct while also
maintaining reliable variances of the initial data pool. The new construct is usually more
meaningful and interpretable. However, the determination of the number of factors has
no single rule and is subjective to the researcher’s decision. In the pilot study, the
number of factors extracted was based on three criteria: Kaiser’s eigenvalue-greater-than
1.0 rule, Cattell’s scree test plot, and the percentage of variance explained.
The Means and Standard Deviations (SDs) of Items in the Measures of Career
Resilience
The Measures of Career Resilience consisted of 28 items. The means of
responses ranged from 3.27 to 4.19. The results showed that most participants chose
option 4 (agree) and 5 (strongly agree). The SDs ranged from .49 (item 27) to 1.06 (item
18). Among the 28 items, 60.7% yielded SDs from .99 to .70, and 35.7% were less than
.70. The results indicated that the participants’ responses did not deviate much from
each other (detailed information is presented in Appendix H)

64
Factor Analyses and Reliabilities for the Measures of Career Resilience
For the career resilience data, the Principal Axis Factoring method was utilized
with Varimax, Direct Oblimin, and Promax rotation methods to see which result yielded
a clear and meaningful factor structure. Principal Axis Factoring method basically
extracts the first factor as a general factor that accounts for the maximum possible
variance, the second factor then accounts a maximum variance in the residual space as
the first factor removed, and so on (Harman, 1967). Varimax is an orthogonal
(uncorrelated) rotation, and Direct Oblimin and Promax are non-orthogonal (correlated)
rotations. The aim of rotation is to rotate the factor axes in order to maximize the
variance of the squared loadings of a factor on all the variables in a factor matrix (Kline,
1994). An item was selected if (1) its factor loading on one factor was greater than .3,
and (2) if this item loaded highly on more than one factor, this item would be retained
when the difference(s) was/were greater than .1.
The results of factor analysis showed that 8 factors with eigenvalues greater than
1.0 accounted for 44.5 % of the total variance. The scree plot is presented in Figure 3-1.
After extracting 3, 4, 5, 6, 7, and 8 factors, the result of extracting 6 factors with Promax
rotation was more meaningful. The 6-factor solution accounted for 38.7% of the total
variance. The first factor contained eight items that related to change (item 1), risk-
taking (item 6), network building (item 7), achievement (item 8 and 13), self-awareness
(item 15), and awareness of the demands/trends in the workplace (item 19 and 22). This
factor seemed to measure a general characteristic of career resilience. The second factor
consisted of four items that were related to adaptability (item 2, 4, 5, and 14). The third

65
Factor Number
27252321191715131197531
Eige
nval
ue
7
6
5
4
3
2
1
0
FIGURE 3-1 The Scree Plot for the Career Resilience Items
factor represented the characteristics of autonomy (item 24) and network building (item
23 and 25). The fourth factor indicated the employability and active learning (item 17,
18, and 27). The fifth factor dealt with self-confidence (item 10 and 11). The sixth
factor seemed to measure independency (item 3 and 12).
The reliability (Cronbach’s Alpha) for each factor was .75, .65, .63, .46, .50, and
.19, respectively. The sixth factor was deleted due to its low reliability. Thus, five
factors that consisted of 20 items were used as the Measures of Career Resilience in the
main study. Among the retained items, four were from London’s inventory, seven came
from Noe et al’s items, eight belonged to the Michigan’s Career Resilience Scale, and

66
one was generated by the researcher. The 20 career resilience items’ factor loadings and
alpha values are presented in Table 3-1.
The Means and SDs of Items in the Career Beliefs Scale
There were 81 items included in the 10 subscales in the Career Beliefs Scale.
The means of responses ranged from 2.17 to 4.41. The SDs ranged from .55 to 1.26.
Among the 81 items, 35.8% yielded SDs greater than 1.0; 53% of the items ranged from
.99 to .70; and only 11.1% yielded SDs less than .70 (detailed data are presented in
Appendix I). The results of the means and SDs indicated that the responses in the Career
Beliefs Scale showed more deviation than those in the Measures of Career Resilience.
Factor Analyses and Reliabilities for the Career Beliefs Scale
For the career beliefs data, the Principal Axis Factoring method was conducted
for all the items as well as within each subscale (with one factor extracted by the
researcher). The results of Principal Axis Factoring analysis showed that 25 factors had
eigenvalues greater than 1.0, and they accounted for 57.4% of the total variance.
Although items belonged to the same subscale tended to cluster together, however, the
factor structures were not paralleled to the original CCBI-B subscales. In order to keep
the same factors as in the original CCBI-B, factor analyses were conducted for each
subscale. When conducting factor analysis within each subscale, the items were selected
if they had factor loadings greater than .3; however, if there were more than five items
with factor loadings greater than .3, only the highest five items were selected. Subscale
2 only had four items that yielded factor loadings greater than .3; therefore, four items

67
TABLE 3-1
Factor Loadings and Reliability Coefficients for the Career Resilience Itemsa
Item Factor Loading
Factor 1 8. I will design better ways of doing my work. .73 15. My career goals are clear and I have a good idea of where I’m heading. .53 22. The skills and abilities that I need to be employable are clear to me. .52 19. I explore trends in my field/industry and have identified various changes that are occurring. .51 6. I have made suggestions to others even though they may disagree. .40 1. I welcome job and organizational changes. .39 7. I make and maintain friendships with people in different departments. .36 13. I will take the time to do the best possible job on a task. .34 Percentage of variance accounted for: 21.2% Reliability coefficient: .75 Factor 2 5. I am able to adapt to changing circumstances. .69 4. I look forward to working with new and different people. .65 2. I am willing to take risks even when the outcome is uncertain. .60 14. I look for opportunities to interact with influential people. .39 Percentage of variance accounted for: 4.6% Reliability coefficient: .65 Factor 3 23. I have a network of people in and outside my field that can help my career. .71 24. I have actively sought better assignments in my current or past jobs. .59 25. Regularly, I try to identify the future direction of my field by making personal contacts, reading, or attending professional meetings. .56
Percentage of variance accounted for: 3.5% Reliability coefficient: .63
Factor 4 17. My skills have been upgraded to keep pace with the current techniques. .68 27. If I identify what I need to learn, I will actively seek the learning opportunity. .46 18. I have adequate computer knowledge/skills to do my job. .33
Percentage of variance accounted for: 3.3% Reliability coefficient: .46
Factor 5 11. I believe other people when they tell me that I have done a good job. .75 10. I accept compliments rather than discount them. .64
Percentage of variance accounted for: 3.3% Reliability coefficient: .50
Factor 6 12. I will evaluate my job performance against personal standards rather than comparing it with what others do. .46 3. I can handle any work problem that comes my way. .33
Percentage of variance accounted for: 2.9% Reliability coefficient: .19
—————————————————————————————————————————— Note. aAdapted with permission from London, M, 1993b, Noe et al., 1990, and Operation ABLE of
Michigan, 2001, March.

68
were retained in this subscale. Thus, 49 items consisting of 10 subscales from this
instrument were retained for the main study. The Cronbach’s alphas for the 10 subscales
were .63, .56, .66, .72, .65, .73, .71, .72, .69, and .53, respectively. The 81 career beliefs
items’ factor loadings and alpha values are presented in Table 3-2.
Examining the remaining items, they seemed to adequately represent the content
of their original subscales: 1. Responsibility for Decision-Making, 2. Finality of
Decision, 3. Recognition by Others and Desire for Achievement, 4. Importance of Work,
5. Occupational Status, 6. Economic Reward, 7. Sex Role Stereotypes, 8. Avoidance of
Decision-Making, 9. Fate, and 10. Perfectionism.
TABLE 3-2
Factor Loadings and Reliability Coefficients for the Career Beliefs Itemsa
Item Factor Loading
Subscale 1: Responsibility for Decision-Making 46. I don’t want other people to plan my life. I should decide my occupation for myself. .64 80. I have to choose an occupation that meets my parents’ expectations; otherwise, I will not be a good son or daughter. .51 65. Parents should not interfere with their children’s choice of major or job. .50 68. Schools and teachers should not affect their students’ choice of major. .48 42. Teachers know their students very well so they can decide a major for them. .46 17. If my choice of career disappoints my parents, I will feel bad. .35 39. I don’t have to think about my future plans because I can follow the plan that my family
has made for me. .30 36. My occupation must have my parents’ approval for me to be satisfied. .22 Reliability coefficient: .63
Subscale 2: Finality of Decision 33. If a person changes jobs often, he or she cannot be successful in the future. .71 26. If a person changes jobs often, he or she must have personality problems. .55 16. In order to develop one’s potential fully, he or she should do the same job all his or her life. .46 45. Once one finds the best-fit job, he or she should not change it because there is only one best-fit job for him or her in the world. .39 72. One may have several occupations that suit him or her. .26 18. In order to adjust for personal and environmental needs, I can change my life plan. .19

69
TABLE 3-2—Continued
Item Factor Loading
38. If I find out my job is not suitable for me later, I can change it. .17 Reliability coefficient: .56
Subscale 3: Recognition by Others and Desire for Achievement 3. I will try my best to do my job; it doesn’t matter whether I am outstanding or not. .55 6. I don’t care whether my work will earn the recognition of my boss and colleagues or not. .53 55. If my work performance does not make me preeminent in my field, I will feel terrible. .48 63. I don’t care whether I am highly regarded at work or not. .44 50. I don’t mind that my parents compare me with others. .43 32. Even if I don’t make any outstanding achievements in my job, that doesn’t mean I am a failure. .41 14. I will do the job that fits me; I don’t care what other people say about my job. .35 1. To win others’ approval is not the reason I study. .32 76. Even if my performance is not better than someone else’s, I will be satisfied if it improves. .22 Reliability coefficient: .66
Subscale 4: Importance of Work 74. Only work can make me feel that my life is meaningful. .74 13. Only work can make me feel happy. .64 35. Work is more important than family. I can sacrifice time with my family for work. .60 37. I don’t worry about working too much; the more work I do, the more I achieve. .50 29. In order to concentrate on work, I am willing to be single. .41 22. In order to do better, I have to come to work earlier and leave later. .38 7. I don’t like a job with long hours because it may affect my family life. .36 71. In order to have better work performance, I have to sacrifice many things. .35 Reliability coefficient: .72
Subscale 5: Occupational Status 56. All occupations are equal (no high status or low status jobs); the most important thing is to choose a job that is suitable for you. .66 60. I am willing to do any jobs that fit my interest and ability. .64 73. Today’s hot majors may not be hot in the future; therefore, I should choose a major that fits me. .51 70. If I want a promising future, I have to be a doctor, lawyer, …etc. .41 44. Even though a person’s job is viewed as low status, he/she still can serve society. .39 Reliability coefficient: .65
Subscale 6: Economic Reward 28. I will give up a job that fits my interest and ability in order to pursue high salary. .63 31. My job doesn’t need to fit my major; only high salary is my concern. .60 58. Salary is not the primary concern when I consider choosing a job. .53 34. I am willing to do any jobs if its pay is good. .50 61. Accomplishing the work is more important than earning more money. .47 2. Earning a lot of money is the only purpose of life. .46 40. High salary doesn’t mean that the person has a successful career. .43 21. It is more important that one develops his/her professional knowledge and skills than it is to earn more money. .39 66. The ideal job is low work loading but high pay. .38 Reliability coefficient: .73

70
TABLE 3-2—Continued
Item Factor Loading
Subscale7: Sex Role Stereotypes 19. Men are more suitable to be supervisors. .71 53. Boys should choose science and engineering as their majors and girls should choose literature, education, sociology, and business as their majors. .62 59. Women should stay at home being a housewife but men should go out to work and bring back money. .62 67. Girls will marry someday, so they don’t need to consider career choice. .55 64. Both males and females are suitable for being doctors. .48 27. Girls will marry any way, so they don’t need to receive higher education. .42 10. Women can perform as well as men do in their jobs. .38 5. There are certain jobs that are suitable for men, and some that are suitable for women. .32 48. My job choice won’t be limited by my gender. .19 Reliability coefficient: .71
Subscale 8: Avoidance of Decision-Making 54. I will do whatever job I find, so I don’t need to plan for my future now. .65 47. The future is full of changes we can’t predict or control, so it is no use to make any future plan right now. .62 57. It won’t be too late to think about my future plan until the time that I have to. .60 49. If I have to make a future plan right now, I will be anxious and unable to face the problem. .57 43. I try to avoid making career choices, because it is difficult to make a decision. .51 20. I like to think about and plan for my future. .50 81. I began to think about my future plan very early. .38 78. I am afraid of making career choices, because if I make a wrong choice, all my life will be affected. .35 11. I often hesitate whenever I am facing career decisions. .18 Reliability coefficient: .72
Subscale 9: Fate 24. If we plan the future carefully, it will be easy to reach our goals. .62 79. The primary factor of career success is due to luck. .57 25. If you carefully plan and well prepare, you will have good results. .55 51. The accomplishment of a job is due to one’s competency and efforts instead of luck. .54 8. My future is controlled in my hands. .53 4. It is better to plan out the future actively rather than to passively obey the fate. .36 77. If I study hard while I am a student, I will find a suitable job after graduation. .36 9. It is no use to plan for the future because the future depends on luck. .35 75. It is irresponsible if you hand your own future to fate. .19 Reliability coefficient: .69

71
TABLE 3-2—Continued
Item Factor Loading
Subscale 10: Perfectionism 52. In order to make the right job choice, I have to consider it carefully until I find a perfect answer. .67 69. I will not be satisfied until I find a best-fit job. .55 41. My job must be the one I am most interested in, or I don’t want to do it. .44 15. Unless I am absolutely sure what job is suitable for me, I will not make any decision. .40 30. I will be very disappointed if I can’t find my best-fit job. .32 12. I must choose the best-fit job; otherwise, my future will be hopeless. .29 62. Even though my job doesn’t fit my major, I will still try my best to do the job. -.18 23. My future job should fit my major; otherwise, the four years spent at college are wasted. .04 Reliability coefficient: .53 —————————————————————————————————————————— Note .aAdapted with permission from Yang, 1996.
The Main Study
Purpose
The purpose of the main study was to explore the relationship between career
resilience and career beliefs of employees in Taiwan. Specifically, this study examined
whether the career resilience and the career beliefs were related to demographic
attributes, such as gender, age, educational level, number of years of paid work,
supervisory experience, career change, organization change, employment at a public or a
private institution, and participation in training/educational activities for more than one
week in the most recent six months or not. Basically, this study was a correlational
design: Two scales that measure career resilience and career beliefs served as the
dependent variables, and various demographic information collected by the Personal
Data Sheet served as independent variables.

72
Sample
The sample selected in the main study was non-random and voluntary. It
consisted of organizationally diverse employees in banks, colleges (included one
military college), hospitals, high-tech companies, traditional manufacturing factories,
insurance companies, wholesale companies, government institutions, construction
consultant firms, self-owned small businesses, and non-profit organizations, etc. All
participants were adults who were currently employed. Detailed description regarding
participants’ demographic information is presented in Chapter IV.
Instruments
The Measures of Career Resilience
Based on the results of pilot study, 20 career resilience items were selected for
use in the main study (see Appendix D items designated with an asterisk). These items
seemed to measure willingness to change, risk-taking, network building, self-confidence,
achievement, self-awareness, awareness of the demands/trend in the workplace,
adaptability, autonomy, employability, and active learning. Since the factor analyses did
not yielded a clear and theoretical structure, the researcher was not confident to interpret
career resilience by its separate factors. Therefore, only the total score of the 20 items
was used to indicate the degree of one’s career resilience.
The Career Beliefs Scale
Forty-nine items comprised of 10 career belief subscales were selected for use in
the main study (see Appendix E items designated with an asterisk). The subscales of the
career beliefs were as the same as in the original CCBI-B: 1. Responsibility for Decision

73
Making, 2. Finality of Decision, 3. Recognition by Others and Desire for Achievement,
4. Importance of Work, 5. Occupational Status, 6. Economic Reward, 7. Sex Role
Stereotypes, 8. Avoidance of Decision-Making, 9. Fate, and 10. Perfectionism. Each
subscale contained five items, except for subscale 2 which had only four items. Scores
for the 10 career belief subscales and the total scores (i.e., sum of the 10 subscales) were
computed and used for further data analyses. The total career beliefs scores represent
the general level of one’s irrational career beliefs; that is, a higher score indicates a
person possesses more irrational career beliefs, and vice versa.
The Personal Data Sheet
A minor change was made in the educational level. The “5-year junior college”
level was changed to “junior college” because there are not only 5-year junior colleges,
but also 2-year and 3-year junior colleges in Taiwan’s education system.
One item was added: “In the most recent six months, have you ever attended any
classes, workshops, or training programs for more than one week?” The options for this
question were 1. No. 2. Yes. This item was included because continuous learning is one
important factor in being a resilient worker. The researcher believes this item could be a
valuable indicator in evaluating one’s level of career resilience. A total of 11 items were
included on the Personal Data Sheet (see Appendix F).
Procedures
In order to reduce the length of the questionnaire, the cover letter was simplified
into a brief introduction. This was done because part of the letter’s content overlapped
with that in the consent form and the instructions. The introduction and the consent

74
form were printed on the first page; the second page contained the instructions; then
followed by the Measures of Career Resilience, the Career Beliefs Scale, and the
Personal Data Sheet.
During May and June of 2002, the researcher contacted approximately 20
individuals and asked for their assistance in this study. These contact persons were
families, relatives, friends, ex-colleagues, and business associates of the researcher. In
mid-July of 2002, questionnaires were sent to the contact persons. These contact
persons distributed the questionnaires to their colleagues or students. Fewer than 20
questionnaires were disseminated to the families of the contact persons. All the contact
persons were informed about the purpose of the study, the procedures for delivering the
questionnaires, and the emphases on volunteer and confidentiality. Each questionnaire
was numbered. To ensure confidentiality of responses, only the contact persons kept a
record of the participants’ names and their respective code number. The researcher
could not identify any information about the participants’ identity. The researcher
provided participants a business reply envelope with only the researcher’s address on it
so that they could mail the questionnaire back to the researcher without paying postage.
Most participants completed the questionnaire and gave it to the contact person who then
sent them back to the researcher. Very few participants used the business reply envelope
and mailed their responses to the researcher. At the end of August, telephone calls were
made to remind the contact persons to encourage their colleagues to complete the
questionnaires. A total of 750 questionnaires were distributed, and 578 valid

75
questionnaires were returned during August to October of 2002. The return rate was
77%.
Data Analysis
Data including participants’ personal information, and responses on career
resilience and career beliefs were analyzed using the computer statistics program entitled
Statistical Package for the Social Sciences, Version 10.0. Descriptive statistics
(frequencies, means, percentages, and standard deviations) portrayed a profile of the
characteristics of the participants and their responses on the two major concerns—career
resilience and career beliefs. Correlation, multiple regression, Analysis of Variance
(ANOVA), Multivariate Analysis of Variance (MANOVA), trend analysis, and
discriminant analysis were conducted to answer the following research questions:
Question 1. What are the relationships between career resilience and career
beliefs of employees in Taiwan?
For this question, the Pearson Product Moment coefficients were computed and
tested to see whether there were statistically significant correlations. The Pearson
Product Moment coefficient is an appropriate statistic for measuring the linear
relationship between two interval/ratio variables (Hinkle, Wiersma, & Jurs, 1998). Both
scores in career resilience and career beliefs were considered as interval data. However,
a significant correlation does not imply causation. Besides, the Pearson Product
Moment coefficient cannot detect non-linear relationships.
The multiple regression was used to determine whether and to what extent career
beliefs explain the variance of career resilience. The scores of the Measures of Career

76
Resilience was the criterion variable, and scores from 10 subscales of the Career Beliefs
Scale were the independent variables. Using the linear combination of the scores from
10 subscales, multiple R was calculated as the correlation coefficient between the
criterion variable and the independent variables (Hinkle et al., 1998). Multiple
regression was computed to detect the correlation between career resilience and career
beliefs as well as to determine which career belief subscale(s) explained career resilience
better.
Question 2. Are there any differences in the career resilience scores of
employees in Taiwan with regard to demographic characteristics
such as gender, age, educational level, number of years of paid
work, supervisory experience, career change, organization change,
employment at a public or a private institution, and participation in
training/educational activities for more than one week in the most
recent six months?
ANOVA was employed to examine whether there were any main effects among
these variables. ANOVA is a statistical technique to test the differences among multiple
(more than two) groups or independent variables.
Question 3. Are there any two-way interaction effects between gender and the
other demographic variables on the career resilience scores of
employees in Taiwan?

77
To answer this question, ANOVA with a two-way interaction effect model
(gender by the other eight demographic variables) was employed to analyze the
interaction effect.
Question 4. What is the relationship (linear, quadratic, cubic, or quartic)
between the number of years of paid work and the career resilience
scores of employees in Taiwan?
A trend analysis was conducted to determine the relationship. Trend analysis is a
special case of orthogonal comparisons. When the independent variable is an interval
scaling, a special set of orthogonal contrasts can be used to examine possible trends as
linear, cubic, quadratic, or quartic relationships between independent and dependent
variables (Hinkle et al., 1998).
Question 5. Are there any differences in the career beliefs subscale scores of
employees in Taiwan with regard to demographic characteristics
such as gender, age, educational level, number of years of paid
work, supervisory experience, career change, employment at a
public or a private institution, and participation in
training/educational activities for more than one week in the most
recent six months?
For this question, MANOVA was applied to determine whether there were
statistically significant differences among subgroups of the demographic variables.
MANOVA is designed to test the significance of group differences, including multiple
dependent variables. Since there were 10 scores from the 10 career belief subscales and

78
these subscales were somehow hypothetically correlated among each other, using
MANOVA has three advantages: (1) Testing several dependent variables instead of one
can cumulate the degrees of freedom across all outcomes and hence increase the power
to detect smaller effects. (2) Conducting several univariate analyses leads to a greatly
inflated overall Type I error rate. Using MANOVA can maintain the overall error rate at
the pre-selected α level. (3) Since in behavioral science, the dependent variables are
often correlated to each other, the use of MANOVA can incorporate the intercorrelations
among dependent variables into the analysis (Mertler & Vannatta, 2002). To further
identify how the subgroups of the demographic variables differed among the career
belief subscales, discriminant analyses were applied to identify the dimensions along
which the relevant subgroups differed most conspicuously (Tatsuoka, 1988). Because
most of the career belief subscales were related to each other, using discriminant
analysis was a better approach to analyze the differences while the inter-correlation
among the subscales are being taken into account at the same time.
Summary
This chapter described the procedures and methods that were used to collect and
analyze the data for both the pilot and the main studies. The participants were non-
random volunteer samples obtained in Taiwan. Participants in the pilot study were
current employees and students with work experience. The pilot study was conducted to
adapt the measurements of career resilience and the CCBI-B for the employee sample in
the main study. The primary principle employed to select items was factor analysis, and
the next concern was the internal consistency reliabilities. Twenty-eight career

79
resilience items were tested in the pilot study. These included 14 integrated items
suggested by Grzeda and Prince, 12 items from Michigan’s Career Resilience Scale, and
two researcher generated items. Ten subscales from the CCBI-B consisting of 81 items
were used as the Career Beliefs Scale in the pilot study. The present measurements were
adopted from a 5-point Likert type scale.
Finally, a 20-item Measures of Career Resilience and a 49-item Career Beliefs
Scale were selected for use in the main study. Participants in the main study were all
current employees. Correlation, multiple regression, Analysis of Variance (ANOVA),
Multivariate Analysis of Variance (MANOVA), trend analysis, and discriminant
analysis were conducted to answer the research questions.

80
CHAPTER IV
RESULTS
The purpose of this study was to explore the relationship between career
resilience and career beliefs of employees in Taiwan. Additionally, the relationships
between these two variables and participants’ demographic characteristics were also
examined. This chapter presents the descriptive statistics of the sample and the results of
the analyses for each research question. The final section briefly summarizes the results
obtained from this study.
Description of the Sample
A total of 750 questionnaires were distributed, and 578 participants completed
and returned their responses. The return rate was 77%. The participants came from
diverse work settings. Data regarding their demographic information are presented in
Table 4-1. Most of the participants worked at private organizations (N = 440, 76%); but
24% (N = 138) worked for public institutions. Of the participants, 313 (54.2%) were
male, and 264 (45.8%) were female. Fifty-two (9%) of the participants had high school
diplomas, but 220 (38%) had junior college degrees, 190 (33%) had bachelor degrees,
and 115 (20%) had post-bachelor (master or Ph.D.) degrees. The mode of the age range
was 31 to 35 years old (N = 146, 25.3%). There were 129 participants aged between 26
and 30 (22.3%), and 120 aged between 36 and 40 (20.8%), 36 aged between 21 and 25
(6.2%), and 48 aged above 46 (8.5%). Compared to the statistics of the employee
population in Taiwan (Directorate-General of Budget, 2003), this sample comprised
more employees with higher education and who worked at public institutions (see Table

81
4-2). The ages in this sample mostly grouped around 26 to 40 (68.4%), but the
population showed a more equal distribution among age 25 to 54. The ratios of gender
in this sample were close to the population.
Approximately 35.4% of the participants had been supervisors (N = 204), 41.7%
had changed careers before (N = 239), 73.6% had changed organizations (N = 415), and
46.4% indicated that they had attended class, workshops, or training program in the most
recent six months (N = 268). The number of years of paid work ranged from 6 months
to 45 years. The mode was 5.1 to 10 years (N = 154, 27.2%), and the next largest
category was between 10.1 and 15 years (N = 124, 21.9%), followed by 5 years and
below (N = 110, 19.4%).
TABLE 4-1
Demographic Characteristics of the Sample
Demographic Characteristics Number Valid Percentagea
Institution Public 138 23.9% Private 440 76.1% Gender Male 313 54.2% Female 264 45.8% Missing 1
Age Range 21 to 25 36 6.2% 26 to 30 129 22.3% 31 to 35 146 25.3% 36 to 40 120 20.8% 41 to 45 98 17.0% 46 to 50 30 5.2% 51 to 55 13 2.2% 56 to 60 5 0.9% 61 and above 1 0.2%

82
TABLE 4-1--Continued
Demographic Characteristics Number Valid Percentage
Education High School 52 9.0% Junior College 220 38.1% Bachelor 190 32.9% Master or Ph.D. 115 19.9% Missing 1
Years of Paid Work 5 years and below 110 19.4% 5.1 to 10 years 154 27.2% 10.1 to 15 years 124 21.9% 15.1 to 20 years 103 18.2% 20.1 and above 75 13.3% Missing 7
Supervisory Experience Never 373 64.6% Yes 204 35.4% 5 years and below 56 9.7% 5.1 to 10 years 61 10.6% 10.1 to 15 years 55 9.6% 15.1 years and above 30 5.2% Missing 3
Participated in Training Activities No 310 53.6% Yes 268 46.4%
Career Change Never 334 58.3% Yes 239 41.7% Once 139 24.8% Twice 58 10.3% Thrice and above 30 5.3% Missing 17
Organization Change Never 149 26.4% Yes 415 73.6% Once 156 28.6% Twice 130 23.9% Thrice 57 10.5% Fourfold and above 53 9.7% Missing 33
Note. aMissing data were not included in computing the valid percentage. Total N = 578

83
TABLE 4-2
Demographic Characteristics of Employees in Taiwan in 2002
Demographic Characteristics Numbera Valid Percentage
Institution Public 946 10.8% Private 7,813 89.2% Non-paid work 695 Gender Male 5,547 58.7% Female 3,907 41.3% Education Junior High School and below 3,197 33.6% High School 3,424 36.2% Junior College and above 2,851 30.2% Age Range Under 24 1,069 11.3% 25 to 29 1,358 14.4% 30 to 34 1,407 14.9% 35 to 39 1,460 15.4%
40 to 44 1,391 14.7% 45 to 49 1,175 12.4% 50 to 54 790 8.4% 55 to 59 384 4.1% 60 and above 419 4.4%
Note. aIn thousands.
Total N = 9,454,000
Results for Research Question 1
Research question 1 was: What are the relationships between career resilience
and career beliefs of employees in Taiwan? To answer this question, Pearson Product
Moment Correlation coefficients were calculated for each pair among career resilience
scores, the 10 career belief subscale scores, and the total career beliefs scores. The
correlation matrix is presented in Table 4-3. Fifty-five of the 66 correlations yielded
statistical significance at least at the .05 level. Career resilience scores were statistically
significant and negatively correlated with the total career beliefs scores (r = –.22, p <

84
.01). That is, participants with higher career resilience tended to possess less irrational
career beliefs. Eight of the 10 career belief subscales yielded statistically significant
correlations with career resilience scores (all p < .01). However, the magnitudes of
coefficients were small (the absolute r values were all less than .40). Career resilience
scores were statistically significant and negatively correlated with career belief subscale
9 (believe in fate, r = –.39), subscale 8 (avoid making decisions, r = –.35), subscale 5
(believe that some occupations are more prestigious, r = –.24), subscale 7 (possess sex
role stereotypes, r = –.17), subscale 1 (assume other’s help can determine the best
choice, r = –.16), and subscale 6 (salary is the primary concern when making career
choices, r = –.15). Subscale 10 (believe one should find the best-fit career) and 4 (work
is very important in one’s life) yielded statistically significant and positive correlations
with career resilience scores (r = .17 and .16, respectively).
In order to determine which of the 10 career belief scores were more influential
in predicting career resilience scores, multiple regression was conducted by entering all
the 10 career beliefs as predictors. The results are presented in Table 4-4. They yielded
a statistically significant multiple correlation (R) = .507, which is a Pearson correlation
coefficient between predicted and actual scores on the dependent variable. The squared
multiple correlation (R2), which represents the degree of variance accounted for by the
10 career belief subscales, equaled to .257; that is, 25.7% of the total variance could be
explained by the 10 predictors. Since the sample size in the main study was not small,
the adjusted squared multiple correlation (R2adj) was .244, not much different from R2 =
.257.

85
TABLE 4-3
Correlation Matrix for Career Resilience and Career Beliefs Total and Subscale Scores
Resilience
Score Belief
1 Belief
2 Belief
3 Belief
4 Belief
5 Belief
6 Belief
7 Belief
8 Belief
9 Belief
10 Belief
1 -.16**Belief
2 -.04 .24**Belief
3 .07 .04 -.09* Belief
4 .16** .06 .23** .03 Belief
5 -.24** .37** .23** .11** .06 Belief
6 -.15** .12** .08 .23** .04 .31**Belief
7 -.17** .26** .44** -.05 .12** .40** .16**Belief
8 -.35** .15** .20** -.13** .11** .15** .16** .24**Belief
9 -.39** .22** -.04 .06 -.11** .30** .18** .08* .36**Belief
10 .17** -.02 .16** .12** .32** -.08* .03 .09* -.03 -.26**Belief Total -.22** .49** .51** .31** .43** .58** .53** .57** .48** .37** .32**
Note. * indicates correlation is statistically significant at the .05 level (2-tailed). **indicates correlation is statistically significant at the .01 level (2-tailed).

86
TABLE 4-4
Regressions of Career Beliefs Subscale Scores on Career Resilience Scores
Predictors R R Square Adjusted R Square
Career Belief Subscale 1, 2, 3, 4, 5, 6, 7, 8, 9, 10 .507 .257 .244
Career Belief Subscale 3, 4, 5, 8, 9 .502 .252 .245
Career Belief Subscale 4, 5, 8, 9 .496 .246 .241
Career Belief Subscale 5, 8, 9 .467 .218 .214
Note. Method: Enter
The test of beta weights showed that career belief subscale 3, 4, 5, 8, and 9
contributed significantly to predict career resilience scores (see Table 4-5). When
entering these five predictors, they yielded R = .502, R2 = .252, and R2adj = .245, which
indicated that using the 5 predictors could obtain almost the same prediction effect (or
percentage of the total variance explained) as using 10 predictors. That is, participants
who expressed that they need recognition by others and desire for achievement, view
work as very important part in one’s life, believe all occupations have an equal status, do
not avoid making career decisions, and believe that the future is controlled by one’s own
hands tended to score higher on the Measures of Career Resilience. Table 4-4 also
presents the multiple correlations (R), squared multiple correlation (R2), and adjusted
squared multiple correlation (R2adj) when entered four subscales (4, 5, 8, and 9) and three

87
subscales (5, 8, and 9). The results showed that entering four subscales (4, 5, 8, and 9)
yielded almost as much R2 as entering five subscales.
TABLE 4-5
Structure Coefficients and Test Results of Standardized Beta Weights for the Career Belief Subscales
Predictors Structure Coefficient
Standardized Beta Weight t p
Belief Subscale 1 -.31 -.027 -.668** .504
Belief Subscale 2 -.09 .018 .422** .673
Belief Subscale 3 .14 .077 1.984** .048
Belief Subscale 4 .32 .166 4.217** .000
Belief Subscale 5 -.48 -.110 -.485** .013
Belief Subscale 6 -.29 -.044 -.122** .262
Belief Subscale 7 -.33 -.057 -.307** .192
Belief Subscale 8 -.69 -.235 -.666** .000
Belief Subscale 9 -.77 -.232 -.392** .000
Belief Subscale 10 .33 .032 .795** .427
Note. * indicates statistical significance at the .05 level.
** indicates statistical significance at the .01 level.
However, since most of the predictors were correlated with each other, the beta
weights no longer equaled to the correlation between a predictor and the dependent
variable. Thus, a predictor may have high correlation with the dependent variable, but

88
due to the redundancy with other predictors, its beta weight is small. Contrarily, a
predictor may have a near-zero correlation with a dependent variable but a sizeable beta
weight. This predictor might be a “suppressor variable,” such as subscale 3 in this study.
Therefore, both beta weights and structure coefficients are suggested when interpreting
the regression results (Courville &Thompson, 2001). A regression structure coefficient
is “the bivariate correlation between a given predictor variable and the synthetic
variable, predicted Y” (Courville &Thompson, 2001, p. 231). The structure coefficients
for the 10 subscales are shown in Table 4-5. According to these structure coefficients,
career belief subscale 9 (believe in fate), subscale 8 (avoid making decisions), subscale 5
(some occupations are more prestigious), subscale 10 (one should find the best-fit
career), and subscale 7 (sex role stereotypes) yielded the five highest structure
coefficients (subscale 5, 7, 8, and 9 were negatively correlated with career resilience
score, but subscale 10 had a positive correlation). Examining the results of beta weights
and structure coefficients, the three most important subscales for predicting career
resilience scores were: Fate, Avoidance of Decision-Making, and Occupational Status.
Thus, participants who believed that the future is controlled by one’s own hands and that
all occupations have equal status, and who do not avoid making decisions were more
likely to score higher on the Measures of Career Resilience.
Results for Research Question 2
Research question 2 focused on investigating the main effects of participants’
demographic characteristics (e.g., gender, age, educational level, number of years of paid
work, supervisory experience, career change, organization change, type of institution,
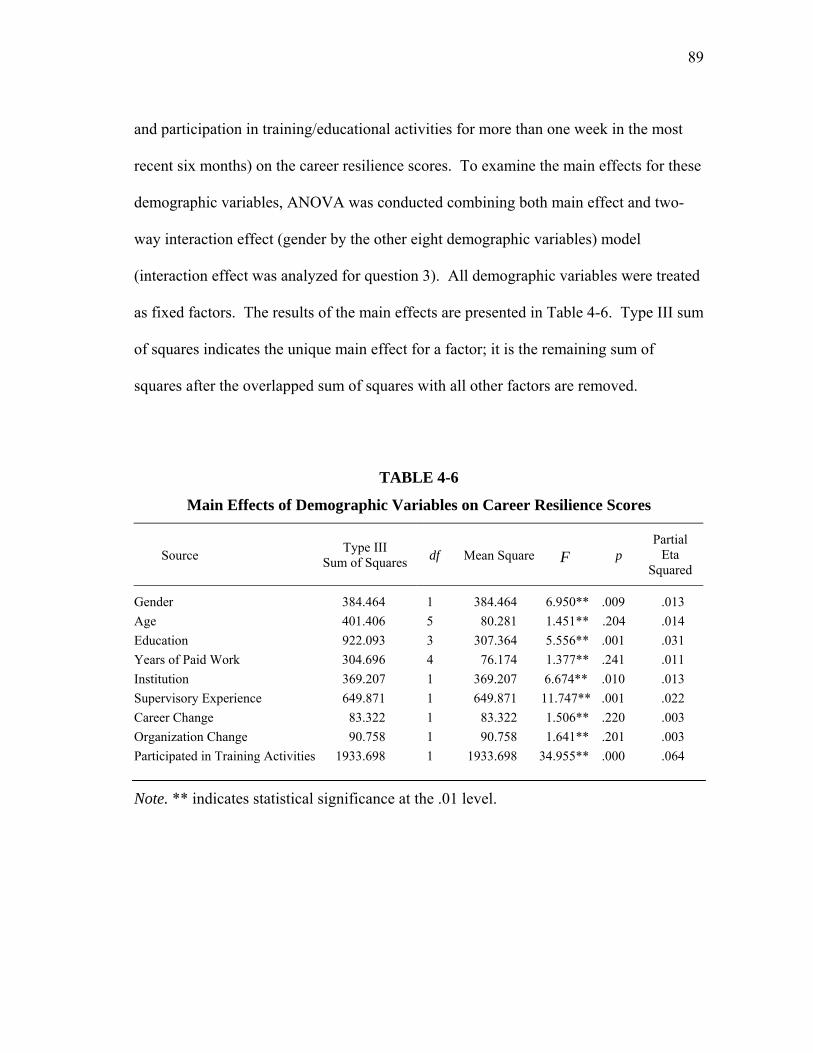
89
and participation in training/educational activities for more than one week in the most
recent six months) on the career resilience scores. To examine the main effects for these
demographic variables, ANOVA was conducted combining both main effect and two-
way interaction effect (gender by the other eight demographic variables) model
(interaction effect was analyzed for question 3). All demographic variables were treated
as fixed factors. The results of the main effects are presented in Table 4-6. Type III sum
of squares indicates the unique main effect for a factor; it is the remaining sum of
squares after the overlapped sum of squares with all other factors are removed.
TABLE 4-6
Main Effects of Demographic Variables on Career Resilience Scores
Source Type III Sum of Squares df Mean Square F p
Partial Eta
Squared
Gender 384.464 1 384.464 6.950** .009 .013 Age 401.406 5 80.281 1.451** .204 .014 Education 922.093 3 307.364 5.556** .001 .031 Years of Paid Work 304.696 4 76.174 1.377** .241 .011 Institution 369.207 1 369.207 6.674** .010 .013 Supervisory Experience 649.871 1 649.871 11.747** .001 .022 Career Change 83.322 1 83.322 1.506** .220 .003 Organization Change 90.758 1 90.758 1.641** .201 .003 Participated in Training Activities 1933.698 1 1933.698 34.955** .000 .064
Note. ** indicates statistical significance at the .01 level.

90
The ANOVA results showed that five factors—gender, type of institution,
educational level, participation in training/educational activities, and supervisory
experience—produced statistically significant main effects on career resilience scores.
However, the effect sizes (partial eta squared) of the main effects were relatively small
(ranging from .013 to .064). Examining the group means (see Table 4-7), the following
differences were found: Female mean on the career resilience was significantly lower
than males. Participants who worked at private institutions showed higher career
resilience mean scores than those who worked at public institutions. Participants who
had higher educational levels yielded higher scores in career resilience than those who
had lower educational levels. Participants who indicated they had participated in
training/educational activities more than one week in the most recent six months showed
higher career resilience mean scores than those who did not engage in those activities.
Participants who had been supervisors also scored higher in career resilience than those
who had never been a supervisor.
On the other hand, age, number of years of paid work, and whether career and
organization had changed or not did not yield a statistically significant main effect on
career resilience scores. The results indicated that although participants who were older,
with more years of work experience, and who had changed career or organizations
before scored higher in career resilience, the differences did not achieve statistical
significance.

91
TABLE 4-7
Means and SDs of Career Resilience Scores by Selected Demographic Variables
Demographic Characteristics Numbera Mean SD
Gender Male 313 76.24 7.59 Female 263 74.86 8.69
Education High School 52 75.48 10.28 Junior College 220 74.62 8.28 Bachelor 189 76.39 7.24 Master or Ph.D. 115 76.39 7.96
Age Range 21 to 25 36 72.61 8.42 26 to 30 129 75.38 7.65 31 to 35 146 75.57 7.77 36 to 40 120 75.97 8.44 41 to 45 98 75.44 8.85 46 and above 48 78.04 7.48
Years of Paid Work 5 years and below 110 75.05 7.75 5.1 to 10 years 154 75.06 7.97 10.1 to 15 years 124 75.84 8.29 15.1 to 20 years 103 75.95 8.10 20.1 and above 74 77.18 8.71
Institution Public 137 74.40 7.86 Private 440 75.98 8.18
Supervisory Experience Never 372 74.12 7.88 Yes 204 78.35 7.90
Career Change Never 333 74.65 7.58 Yes 239 76.93 8.74
Organization Change Never 148 74.22 7.50 Yes 415 76.08 8.34
Participated in Training Activities No 310 73.60 7.53 Yes 267 77.94 8.19
Note. aDue to the missing responses, some of the numbers in the demographic subgroups did not equal to the numbers listed on Table 4-1.

92
Results for Research Question 3
Question 3 focused on determining whether there were interaction effects
between gender and the other eight demographic variables (e.g., age, education, number
of years of paid work, type of institution, supervisory experience, career or organization
change, and participation in training/educational activities more than one week in the
most recent six months or not) on career resilience scores. To answer this question,
ANOVA was employed to analyze the interaction effects (main effects were also
conducted at the same time). The results indicated a statistically significant gender by
education interaction effect (refer to Table 4-8). Figure 4-1 showed that males who had
a high school degree scored the highest on career resilience, but the rest of the
educational levels (junior college, bachelor, master and Ph.D.) did not show large
variations. On the other hand, female scores increased as their educational levels
became higher.
TABLE 4-8
Gender by the Other Demographic Variables Two-Way Interaction Effects on Career Resilience Scores
Source Type III Sum of Squares df Mean Square F p
Partial Eta
Squared Gender by Age 36.243 5 7.249 .131** .985 .001 Gender by Education 1060.225 3 353.408 6.388** .000 .036 Gender by Years of Paid Work 384.963 4 96.241 1.740** .140 .013 Gender by Institution 96.727 1 96.727 1.748** .187 .003 Gender by Supervisory Experience 13.989 1 13.989 .253** .615 .000 Gender by Career Change 29.856 1 29.856 .540** .463 .001 Gender by Organization Change .365 1 .365 .007** .935 .000 Gender by Participated in Training 27.766 1 27.766 .502** .479 .001
Note. ** indicates statistical significance at the .01 level.

93
Educational levels
Master or PhDBachelorJunior CollegeHigh School
Mea
ns o
f Car
eer R
esili
ence
Sco
res
84
82
80
78
76
74
72
70
Gender
Male
Female
FIGURE 4-1. Gender by Education Interaction on Career Resilience Scores
Results for Research Question 4
Research question 4 investigated the relationships (linear, quadratic, cubic, or
quartic) between the number of years of paid work and career resilience scores. Trend
analyses were conducted to determine the relationship. Although the plot of the number
of years of paid work and career resilience mean scores portrayed an ascending linear
curve (see Figure 4-2), the results showed that none of the relationships yielded
statistical significance. However, the linear term yielded p = .053 (see Table 4-9).
Hence, the relationship between the number of years of paid work and career resilience
scores seemed to have a linear tendency.

94
Years of Paid Work
Above 2015.1 to 2010.1 to 155.1 to 10Under 5.1
Mea
ns o
f Car
eer R
esili
ence
Sco
res
77.5
77.0
76.5
76.0
75.5
75.0
74.5
FIGURE 4-2. Means of Career Resilience Scores by Years of Paid Work
TABLE 4-9
Trend Analysis on Career Resilience Scores by Years of Paid Work
Source df F p
Linear term 1 3.767 .053
Quadratic term 1 .334 .564
Cubic term 1 .022 .882
Quartic term 1 .269 .604

95
Results for Research Question 5
Research question 5 investigated the differences among the career belief
subscales by the participants’ demographic characteristics, including gender, age,
educational level, type of institution, number of years of paid work, supervisory
experience, career change, and participation in training/educational activities for more
than one week in the most recent six months. MANOVA was employed to test whether
there were statistically significant differences among demographic subgroups on career
beliefs. The results showed that all demographic variables, except for the number of
years of paid work variable, yielded statistically significant differences among career
beliefs (see Table 4-10).
TABLE 4-10
Main Effects of Demographic Variables on Career Beliefs Subscales
Source Hypothesis df Error df F p Partial Eta Squared
Gender 10 533 7.674 .000 .126
Institution 10 533 2.118 .022 .038
Education 30 1565.136 1.745 .008 .032
Age 50 2434.218 1.681 .002 .030
Supervisory Experience 10 533 1.856 .049 .034
Career Change 10 533 2.613 .004 .047
Participated in Training Activities 10 533 1.905 .042 .035
Years of Paid Work 40 2022.929 1.319 .088 .024

96
The means and SDs for each subgroup within the demographic variables, and the
results of ANOVA (based on type III sum of square) on the total career beliefs scores are
presented in Table 4-11. The results showed that the total career beliefs mean scores
were significantly different between males and females, and also among the educational
levels.
TABLE 4-11
Means, SDs, and ANOVA Results of Demographic Subgroups on Career Beliefs Total Scores
Demographic Characteristics Numbera Mean SD F p
Partial eta
squared
Gender 5.806** .016 .011 Male 313 121.70 12.74 Female 263 118.90 11.42
Education 5.544** .001 .030 High School 52 119.44 11.43 Junior College 220 122.39 11.50 Bachelor 189 119.61 11.17 Master or Ph.D. 115 118.60 15.02
Age Range 1.821** .107 .017 21 to 25 36 122.97 8.88 26 to 30 129 120.43 12.82 31 to 35 146 120.36 12.27 36 to 40 119 122.44 11.95 41 to 45 98 118.57 12.83 46 and above 49 117.84 11.55
Years of Paid Work 1.601** .173 .012 5 years and below 110 122.28 11.58 5.1 to 10 years 154 120.56 12.13 10.1 to 15 years 123 120.54 13.73 15.1 to 20 years 103 120.07 10.64 20.1 and above 75 118.03 12.75

97
TABLE 4-11--Continued
Demographic Characteristics Numbera Mean SD F p
Partial eta
squared
Institution .003 .955 .000 Public 138 119.95 12.53 Private 439 120.61 12.15
Supervisory Experience .083 .774 .000 Never 372 120.72 12.06 Yes 204 120.01 12.57
Participated in Training .030 .862 .000 No 309 120.28 11.73
Yes 268 120.64 12.81
Career Change .626 .429 .001 Never 333 121.15 12.01 Yea 239 119.44 12.42
Organization Change 1.943 .164 .004 Never 149 121.99 11.98 Yes 414 119.81 12.41
* indicates statistical significance at the .05 level.
Note. aDue to the missing responses, some of the numbers in the demographic subgroups did not equal to the numbers listed on Table 4-1.
** indicates statistical significance at the .01 level.
To further determine how the career belief subscales differed, discriminant
analyses were applied to identify the dimension among which the relevant subgroups
differed most conspicuously. Results of discriminant analyses of the demographic
variables on the 10 career belief subscales showed that only the first discriminant
function yielded statistical significance. The following is the interpretation of the results
for the significant demographic variables.

98
Differences of Career Beliefs by Gender
Examining the standardized discriminant function coefficients and the structure
matrix (i.e., structure coefficients, which are the correlations between career belief
subscales and discriminant functions), the discriminant function mainly correlated with
subscale 7 (positively correlated with Sex Role Stereotypes), subscale 8 (negatively
correlated with Avoidance of Decision-Making), and subscale 6 (positively correlated
with Economic Reward) (see Table 4-12). Then, referring to the group centroids
(subgroups’ means on discriminant function), the differences of gender on the career
beliefs can be interpreted as: Male participants tended to possess more sex role
stereotypes than females, they were less likely to avoid making decisions, and they
considered salary as the most important factor when choosing an occupation. The means
of the total career beliefs scores revealed that male scores were statistically higher than
females, which indicated that males seemed to possessed more irrational career beliefs
than females (see Table 4-11).
Differences of Career Beliefs by Type of Institution
The results showed that subscale 4 (Importance of Work), subscale 6 (Economic
Reward), subscale 3 (Recognition by Others and Desire for Achievement), 10
(Perfectionism), and subscale 2 (Finality of Decision) contributed mostly in
discriminating participants who worked at public or private institutions (see Table 4-13).
By contrast with those who worked at private organizations, participants who worked at
public institutions were less likely to view work as the most important thing in their
lives, or to assume that salary was their primary concern for considering career choices.

99
TABLE 4-12
Discriminant Analysis on Career Beliefs Subscales by Gender
Predictor Standardized Function Coefficient Structure Coefficient
Belief Subscale 1 -.165 .037
Belief Subscale 2 .038 .335
Belief Subscale 3 -.018 -.072
Belief Subscale 4 -.166 -.036
Belief Subscale 5 -.075 .223
Belief Subscale 6 .179 .187
Belief Subscale 7 1.031 .879
Belief Subscale 8 -.360 -.107
Belief Subscale 9 -.079 -.126
Belief Subscale 10 .065 .129
Functions at Group Centroids:
Male 1.099
Female .082

100
TABLE 4-13
Discriminant Analysis on Career Beliefs Subscales by Type of Institution
Predictor Standardized Function Coefficient Structure Coefficient
Belief Subscale 1 -.211 -.267
Belief Subscale 2 -.282 -.303
Belief Subscale 3 .338 .330
Belief Subscale 4 .805 .550
Belief Subscale 5 -.297 -.203
Belief Subscale 6 .435 .368
Belief Subscale 7 -.122 -.274
Belief Subscale 8 .052 .022
Belief Subscale 9 .024 .016
Belief Subscale 10 -.405 -.119
Functions at Group Centroids:
Public Institution -.4554
Private Institution .143
They showed less desire for recognition and achievement. They believed that
one should find the best-fit occupation, and that once a career decision has been made,
one should not change it.
Differences of Career Beliefs by Educational Level
The discriminant function (Table 4-14) revealed that participants with different
educational levels mainly varied on subscale 4 (Importance of Work), subscale 6

101
(Economic Reward), subscale 5 (Occupational Status), subscale 7 (Sex Role
Stereotypes), and subscale 8 (Avoidance of Decision-Making). Comparing the group
centroids, the discriminant function clearly separated participants with lower education
from those with higher education. Generally, participants with higher education neither
considered work as the most important part in one’s life, nor salary as the primary
concern when choosing an occupation; they tended to believe that some occupations
have a more prestigious status, and posses more sex role stereotypes regarding career;
but they were less likely to avoid making career decisions. Differences among the
means of the total career beliefs scores for different educational levels achieved
statistical significance (see Table 4-11).
Differences of Career Beliefs by Age Range
The results found that the differences among age ranges were mainly on
subscales 2 (Finality of Decision), subscales 3 (Recognition by Others and Desire for
Achievement), subscales 8 (Avoidance of Decision-Making), and subscales 1
(Responsibility for Decision-Making). Younger participants believed that a career
decision could be changed whenever their needs or environment is changed. They were
more likely to avoid making career decisions. They expressed the need for recognition
and achievement. They assumed that a career choice is a personal responsibility. On the
other hand, older participants believed that one should not change his/her career
decisions. They were less likely to avoid making decisions as well as less concerned
about other’s recognition and approval. They believed that teachers and parents could
help them make better decisions. The results are presented in Table 4-15.

102
TABLE 4-14
Discriminant Analysis on Career Beliefs Subscales by Educational Level
Predictor Standardized Function Coefficient Structure Coefficient
Belief Subscale 1 -.060 -.071
Belief Subscale 2 .215 .210
Belief Subscale 3 .046 .061
Belief Subscale 4 .699 .688
Belief Subscale 5 -.356 -.177
Belief Subscale 6 .595 .495
Belief Subscale 7 -.319 -.144
Belief Subscale 8 .261 .304
Belief Subscale 9 -.048 -.048
Belief Subscale 10 -.104 .177
Functions at Group Centroids:
High school degrees .302
Junior college degrees .173
Bachelor degrees -.020
Master or PhD degrees -.434

103
TABLE 4-15
Discriminant Analysis on Career Beliefs Subscales by Age Range
Predictor Standardized Function Coefficient Structure Coefficient
Belief Subscale 1 -.334 -.320
Belief Subscale 2 -.608 -.545
Belief Subscale 3 .482 .427
Belief Subscale 4 .104 .078
Belief Subscale 5 .249 -.013
Belief Subscale 6 .052 .144
Belief Subscale 7 -.136 -.227
Belief Subscale 8 .695 .332
Belief Subscale 9 -.242 -.012
Belief Subscale 10 .203 .178
Functions at Group Centroids:
21 to 25 years old .828
26 to 30 years old .497
31 to 35 years old .013
36 to 40 years old -.397
41 to 45 years old -.440
46 years old and above -.181

104
Differences of Career Beliefs by Supervisory Experience
Table 4-16 reveals that the differences were in subscales 2 (Finality of Decision),
subscales 4 (Importance of Work), subscales 6 (Economic Reward), subscales 8
(Avoidance of Decision-Making), subscales 9 (Fate), subscales 10 (Perfectionism), and
subscales 3 (Recognition by Other’s and Desire for Achievement). Participants who had
been supervisors tended to view work as the most important part of their lives, and
showed stronger needs for recognition and achievement at work, but salary was not their
primary concern for making a career choice. They believed that a career choice does not
have to be perfect, but insisted that one should not change his/her decisions. They also
believed the future is controlled by their own hands, and they will achieve their goals.
Hence, they were less likely to avoid making career decisions.
Differences of Career Beliefs by Career Change
Table 4-17 indicates that the differences between whether participants had
changed careers or not were in subscales 4 (Importance of Work), 6 (Economic Reward),
3 (Recognition by Others and Desire for Achievement), 10 (Perfectionism), and 7 (Sex
Role Stereotypes). Career changers were more likely to need recognition by others and
desired for achievement at work. Work was important to them, but salary was not their
major concern when making a career choice. They did not insist on finding the best-fit
jobs, and also possessed fewer sex role stereotypes.
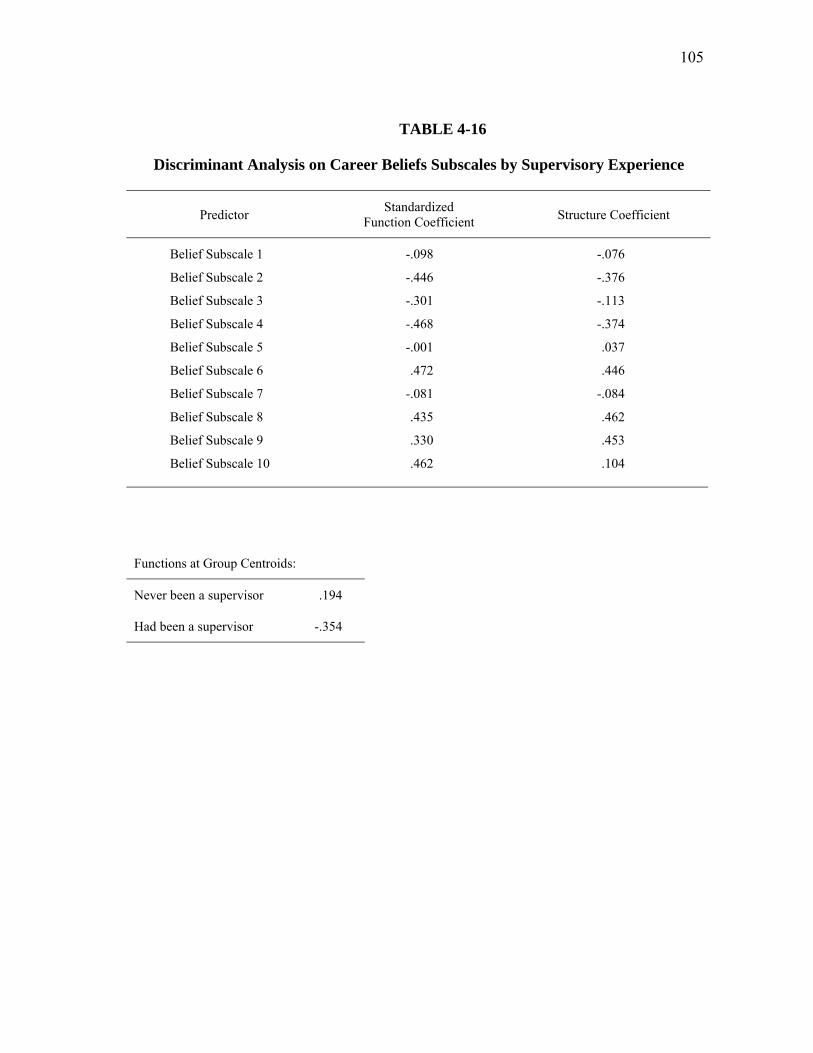
105
TABLE 4-16
Discriminant Analysis on Career Beliefs Subscales by Supervisory Experience
Predictor Standardized Function Coefficient Structure Coefficient
Belief Subscale 1 -.098 -.076
Belief Subscale 2 -.446 -.376
Belief Subscale 3 -.301 -.113
Belief Subscale 4 -.468 -.374
Belief Subscale 5 -.001 .037
Belief Subscale 6 .472 .446
Belief Subscale 7 -.081 -.084
Belief Subscale 8 .435 .462
Belief Subscale 9 .330 .453
Belief Subscale 10 .462 .104
Functions at Group Centroids:
Never been a supervisor .194
Had been a supervisor -.354

106
TABLE 4-17
Discriminant Analysis on Career Beliefs Subscales by Career Change
Predictor Standardized Function Coefficient Structure Coefficient
Belief Subscale 1 .199 .294
Belief Subscale 2 .029 .167
Belief Subscale 3 -.421 -.227
Belief Subscale 4 -.798 -.556
Belief Subscale 5 .039 .262
Belief Subscale 6 .439 .410
Belief Subscale 7 .304 .410
Belief Subscale 8 .023 .208
Belief Subscale 9 .143 .251
Belief Subscale 10 .427 .100
Functions at Group Centroids:
Never changed career .235
Had changed career -.328

107
Differences of Career Beliefs by Participation in Training Activities
The results showed the major differences between participants who participated
in training/educational activities for more than one week in the most recent six months
and those who did not on subscales 4 (Importance of Work), 6 (Economic Reward), 9
(Fate), 8 (Avoidance of Decision-Making), 3 (Recognition by Others and Desire for
Achievement), 5 (Occupational Status), and 1 (Responsibility for decision-making) (see
Table 4-18). Participants who recently engaged in training/educational activities viewed
work as very important in their life. All occupations have an equal status and salary is
not the primary factor when choosing an occupation. They desired recognition and
achievement. They assumed that a career decision was a personal responsibility, and
they did not avoid making career decisions. They believed the future is in their own
hands, and they would plan for it.
Summary
The results indicated that career resilience scores were correlated negatively with
the total career beliefs scores and 6 of the 10 career belief subscales, and positively
correlated with 2 career belief subscales. However, the magnitudes of coefficients were
small. Statistically significant differences were found in the career resilience scores for
gender, education, type of institution, participation in training/educational activities, and
supervisory experience. Additionally, gender by education revealed a statistically
significant interaction effect on career resilience scores. No statistically significant
relationship was found between the number of years of paid work and career resilience
scores.

108
TABLE 4-18
Discriminant Analysis on Career Beliefs Subscales by Participation
in Training Activities
Predictor Standardized Function Coefficient Structure Coefficient
Belief Subscale 1 .334 .159
Belief Subscale 2 .010 .010
Belief Subscale 3 .371 .392
Belief Subscale 4 .563 .425
Belief Subscale 5 -.343 -.160
Belief Subscale 6 .426 .304
Belief Subscale 7 .004 -.090
Belief Subscale 8 -.407 -.449
Belief Subscale 9 -.419 -.440
Belief Subscale 10 -.408 -.029
Functions at Group Centroids:
Did not Participated in Training -.189
Participated in Training .218

109
Most of the demographic variables (except number of years of paid work)
yielded statistically significant differences among career belief subscales. Discriminant
analyses were applied to further investigate the differences among the 10 career belief
subscales for each significant demographic variable. The primary differences between
males and females on career beliefs were subscale 7 (Sex Role Stereotypes) and subscale
8 (Avoidance of Decision-Making). Younger participants differed from older
participants on subscale 2 (Finality of Decision), subscale 3 (Recognition by Others and
Desire for Achievement), and subscale 8 (Avoidance of Decision-Making). For
demographic variables (type of institution, educational level, supervisory experience,
career change, and participation in training/educational activities), the major differences
were on subscale 4 (Importance of Work) and subscale 6 (Economic Reward).

110
CHAPTER V
SUMMARY, DISCUSSION, AND RECOMMENDATIONS
This chapter presents a summary of this study. The first section includes the
purpose, research questions, samples, instruments, and procedures of this study. The
second section describes the results of the analyses of the data and further discusses the
implications of the major findings and the limitations of this study. The last section
provides recommendations for future research and practice in career-related areas.
Summary
Purpose of the Study
The workplace has undergone dramatic changes. Through rapid advances in
technology, global competition, and restructuring within organizations, these changes, in
turn, have great impacts on individuals’ career development. Job security and linear
upward career paths are less and less practical. Continued learning and managing one’s
own career have become important issues for today’s workers. These phenomena do not
exist only in the western countries, but also in Taiwan.
Career resilience has been identified as a required characteristic for workers in
the face of a more turbulent and changing workplace. Therefore, the need for this study
to explore the constructs of career resilience and how it relates to other important career
variables, such as career beliefs was evident. Additionally, investigating the degree of
career resilience among employees in Taiwan and the career beliefs patterns held by
them provides further understanding about these two variables; thus, enhancing the
effects of career education, counseling, and career development programs.

111
Research Questions
Five research questions were proposed in this study. They are stated as follows:
Question 1: What are the relationships between career resilience and career
beliefs of employees in Taiwan?
Question 2: Are there any differences in the career resilience scores of
employees in Taiwan with regard to demographic characteristics,
such as gender, age, educational level, number of years of paid
work, supervisory experience, career change, organization change,
employment at a public or a private institution, and participation in
training/educational activities for more than one week in the most
recent six months?
Question 3: Are there any two-way interaction effects between gender and the
other demographic variables on career resilience scores of
employees in Taiwan?
Question 4: What is the relationship (linear, quadratic, cubic, or quartic)
between the number of years of paid work and career resilience
scores of employees in Taiwan?
Question 5: Are there any differences in the career belief scores of employees in
Taiwan with regard to demographic characteristics, such as gender,
age, educational level, number of years of paid work, supervisory
experience, career change, employment at a public or a private

112
institution, and participation in the training/educational activities for
more than one week in the most recent six months?
Instruments
The Measures of Career Resilience
Based on the analyses obtained from the pilot study, a total of 20 items were
retained as Measures of Career Resilience in the main study. Among these 20 items,
four were adopted from London’s (1993b) Career Motivation Inventory, seven were
taken from Noe et al’s (1990) measures of career motivation, eight came from
Michigan’s Career Resilience Scale (Bice, 1999, January 24-30), and one was generated
by the researcher. These 20 items related to the content of willingness to change, risk-
taking, network building, desire for achievement, awareness of one’s goals and the
trends/demands in the workplace, adaptability, autonomy, self-confidence,
employability, and active learning. The sum of the participants’ responses on the 20
items was calculated as the score on career resilience. Participants with higher scores
were considered to be higher on career resilience.
The Career Beliefs Scale
The Career Beliefs Scale was adopted from Yang’s (1996) Chinese Career
Beliefs Inventory—Form B (CCBI-B). According to the results of the pilot study, 49
items comprised the Career Beliefs Scale selected for use in this study. The 10 subscales
represented 10 irrational career beliefs. They were: (1) Responsibility for Decision-
Making, (2) Finality of Decision, (3) Recognition by Others and Desire for
Achievement, (4) Importance of Work, (5) Occupational Status, (6) Economic Reward,

113
(7) Sex Role Stereotypes, (8) Avoidance of Decision-Making, (9) Fate, and (10)
Perfectionism.
The Personal Data Sheet
The Personal Data Sheet was used to collect participants demographic variables.
It included 11 items: (1) type of institution: public or private, (2) business activity of the
organization, (3) number of years in the current job, (4) supervisory experience and the
length of time as a supervisor, (5) total years of paid work, (6) number of career changes,
(7) number of organization changes, (8) gender, (9) age range, (10) level of education,
and (11) whether or not the participants had attended any class, workshop, or training
program for more than one week in the most recent six months.
Sample
The sample was non-random and voluntary. Participants were from diverse work
settings, such as banks, colleges (including one military college), hospitals, high-tech
companies, traditional manufacturing factories, insurance companies, wholesale
companies, government institutions, construction consultant firms, self-owned small
businesses, and non-profit organizations. Seven hundred and fifty questionnaires were
distributed, and 578 valid responses were received. The return rate was 77%. Most of
the participants worked at private organizations (N = 440, 76%), but 24% (N = 138)
worked for public institutions (see Table 4-1). The participants were 313 (54.2%) male
and 264 (45.8%) female. Fifty-two (9%) of the participants had high school diplomas,
220 (38%) had junior college degrees, and 305 (53%) had bachelor and higher degrees.
The ages in the sample mostly grouped around 26 to 40 (N = 395, 68.4%). Compared to

114
the statistics of employees in Taiwan (Directorate-General of Budget, 2003, see Table 4-
2), the study sample comprised more employees with higher educations and who worked
at public institutions. The ratios of gender in the study sample were close to the
population. The mode of the years of paid work was 5.1 to 10 years (N = 154, 27.2%),
and the second largest category was between 10.1 and 15 years (N = 124, 21.9%),
followed by 5 years and below (N = 110,19.4%). Approximately 35.4% (N = 204) of the
participants had been supervisors, 41.7% (N = 239) had changed careers before, 73.6%
(N = 415) had changed organizations, and 46.4% (N = 268) indicated that they had
participated in training/educational activities for more than one week in the most recent
six months.
Procedures of Data Collection
The study was conducted in Taiwan from August to October in 2002. The
researcher either visited the work sites and classrooms to distribute questionnaires, or
sent the questionnaires to approximately 20 contact persons (families, friends, relatives)
who then distributed the questionnaires to their colleagues, students, or families.
Voluntary participation and the confidentiality of the individual’s information were
emphasized in the consent form, instructions, and the researcher’s oral explanation.
Each questionnaire was numbered, but only the contact persons kept a record of
the participants’ names and their respective numbers. Business reply envelopes were
provided for the participants. Most of participants completed the questionnaires and
gave their responses to the contact persons, who then sent them back to the researcher.

115
Discussion
Results for Research Question 1
Question 1 focused on the relationships between career resilience and career
beliefs. Career resilience scores were negatively correlated with the total career beliefs
scores (r = –.22, p < .01), which indicated that participants who were higher on career
resilience tended to possess fewer irrational career beliefs. Career resilience scores were
negatively correlated with career belief subscale 9 (believe in fate, r = –.39), career
belief subscale 8 (avoid making decisions, r = –.35), career belief subscale 5 (believe
that some occupations are more prestigious, r = –.24), career belief subscale 7 (possess
sex role stereotypes, r = –.17), career belief subscale 1 (assume other’s help can
determine the best choice, r = –.16), and career belief subscale 6 (salary is the primary
concern when making career choices, r = –.15), and positively correlated with career
belief subscale 10 (believe one should find the best-fit career, r = .17) and career belief
subscale 4 (work is the most important part in one’s life, r = .16). Although the
correlations achieved statistical significance, the magnitudes of coefficients were small
(the absolute r values were all less than .40). Generally speaking, these results implied
that a career resilient individual possessed less irrational career beliefs, was more self-
confident, liked to plan and prepare for the future, was flexible, but showed stronger
concerns about work and career.
Multiple regressions analyses revealed that the 10 career belief subscales
explained 25.7% of the total variance of career resilience scores. Considering both beta
weights and structure coefficients, four career belief subscales (4, 5, 8, and 9) were

116
identified as better predictors of career resilience scores. That is, participants who
viewed work as the most important part in one’s life (subscale 4), believed all
occupations have an equal status (subscale 5), did not avoid making decisions (subscale
8), and believed that the future is controlled by one’s own hands (subscale 9), tended to
score higher on career resilience.
These findings were both consistent and inconsistent with studies reviewed in
chapter II. Gowan, Craft, and Zimmermann (2000) investigated Army personnel who
were undergoing career transition, and found that participants who scored higher on
career resilience tended to express a less stressful appraisal about their future, and
anticipated the future more positively. This finding was congruent with this study that
found that participants who scored higher on career resilience were more likely to
believe they have control of their future and less likely to feel anxious about making
decisions. Hall (1990) and London (1993a) found career resilience to be related to
achievement and desire for recognition. However, in this study, career resilience
resulted in a near zero correlation (r = .07) with career belief subscale 3 (Recognition by
Others and Desire for Achievement). Although this subscale yielded a significant beta
weight in predicting career resilience scores, its contribution to the total variance was
very low, only .6% (see Table 4-3, 4-4, and 4-5). The incongruent findings from this
study might be the result of the use of different measurements, or due to culture
differences.

117
Results for Research Question 2
Question 2 examined the main effects of participants’ demographic
characteristics (including gender, age, education, number of years of paid work, type of
institution, supervisory experience, career change, organization change, and participation
in training/educational activities for more than one week in the most recent six months)
on career resilience scores. The ANOVA results showed that gender, education, type of
institution, participation in training/educational activities, and having been a supervisor
yielded statistically significant main effects on career resilience scores.
Further examining the subgroups’ means found the following differences: Male
participants, who had higher education, who had worked at private organizations, who
had been supervisors, and who had participated in training/educational activities for
more than one week in the most recent six months scored higher on career resilience
than their counterparts. On the other hand, age, years of paid work, and whether career
or organization had changed or not did not yield statistically significant main effects on
career resilience scores. Although participants who were older, with more years of work
experience, and who had changed careers or organizations before scored higher on
career resilience, the differences did not achieve statistical significance.
The finding that males scored higher on career resilience was consistent with
Lin’s (1997) study of college students in Taiwan. She argued that females were less
willing to take risks, and risk-taking is one essential component of career resilience.
Possible reasons might be found in London and Mone’s (1987) perceptions about the
disadvantages of women in developing career resilience. They described that women

118
tended to underestimate their potential, gave lower evaluations of their performances
than men did, and had not been encouraged to take risks or to participate in team work.
In fact, all these characteristics are important components of being career resilient.
The literature review found that career resilience positively correlated with age
or tenure in career fields (Brainerd, 1992; Carson & Bedeian, 1994; Fu, 2001; London,
1993a; Noe et al., 1990). However, this study showed that career resilience scores
increased with age and years of paid work, but the differences did not reach statistical
significance. Although Fu’s (2001) finding revealed that older Taiwanese female
employees (32 to 34 years old) showed higher career resilience than younger female
employees (25 to 27 years old), her sample contained only females and a very limited
age range (only 25 to 34 years old). Hence, this limitation might not accurately
represent the relationship between career resilience and age. One possible reason for the
conflicting results might be that an individual’s career resilience becomes stable after
he/she reaches the late 20s. London and Mone (1987) posited that career resilience is
personally driven and established during the adolescent years and the early 20s.
Therefore, according to these authors, an individual’s career resilience becomes stable in
his/her adulthood. However, London (1983, 1993b) also postulated that individuals
could learn and enhance their career resilience through positive reinforcement and
empowerment provided by the work environment. In other words, if the supervisors or
organizations do not provide necessary support, encouragement, and challenges,
employees may not have the chance to improve their career resilience. The surveyed
working environments in this study might not have provided enough support or

119
empowerment to facilitate employees’ career resilience. Hence, the participants’ career
resilience did not significantly increase with age or years of paid work. Longitudinal
studies may be needed to determine the causal relationships of age and work experience
on career resilience.
The differences found between types of institution showed that participants who
worked at private organizations scored higher on career resilience than those who
worked at public institutions. This finding might indicate significant differences that
exist in private and public institutions, such as organizational cultures, organizational
structures, reward systems, and leadership style, which have different influences on the
development of career resilience for employees in Taiwan. On the other hand, the
differences might be due to the distinct attributes possessed by employees at the two
types of organizations. For example, Leung and Clegg’s (2001) study concluded that the
participants (30 Hong Kong women) who had worked in government sectors were lower
on career resilience. Those women considered themselves neither risk-taking nor
aggressive. They chose to work at public institutions because the work environment was
highly structured, had greater job security, involved less risk-taking, was less
competitive, and allowed more flexible time for their private life. These were the
characteristics that they considered the most suitable factors for their career choices.
That is, participants who worked at public or private institutions basically possessed
different personal characteristics.
This study found that individuals who had participated in training/educational
activities for more than one week in the most recent six months yielded higher career

120
resilience scores than those who did not engage in training/educational activities in the
recent six months. One possible explanation could be that dedication to continuous
learning helps enhance employees’ employability, and thus, increases their career
resilience. This finding agrees with Waterman et al’ (1994) and Collard et al’s (1996)
perception of a career resilient worker. A related finding was revealed in Lin’s (1997)
study: Students who showed high spontaneous learning behaviors scored higher on
career resilience than the low spontaneous behavior students. Although this study could
not determine the causal relationship between active learning and career resilience, it
could be inferred that taking advantage of additional education opportunities had a
strong correlation to career resilience.
This study also found that education and supervisory experience yielded a
significant effect on career resilience. Participants who had been supervisors or had
higher education tended to score higher on career resilience. Questions about whether it
was the job content (e.g., challenging, greater responsibility, etc.) or the experience,
skills, or confidence obtained from higher education that increased participants’ career
resilience; or whether individuals with higher career resilience were more likely to be
promoted as a supervisor or to pursue higher education, remain unanswered in this study.
In the review of literature, Noe et al. (1990) failed to obtain a statistically significant
correlation between managerial positions and career resilience. Chang’s (1995) study
found no statistically significant difference on career resilience among the educational
levels of 225 high-tech employees in Taiwan. This study revealed different findings that

121
require further studies to clarify the relationships between career resilience and
education as well as supervisory experience.
Results for Research Question 3
Question 3 determined whether there was an interaction effect between gender
and the other demographic variables (e.g., age, educational level, number of years of
paid work, supervisory experience, career change, organization change, employment at a
public or a private institution, and participation in training/educational activities for
more than one week in the most recent six months). The results indicated a statistically
significant gender by education interaction effect (see Table 4-8). Males who had a high
school diploma scored the highest on career resilience, but males had higher degrees
(e.g., junior college, bachelor, master, or PhD degrees) did not show large variation. On
the other hand, female scores increased as their educational levels became higher. One
possible explanation for this might be that men with lower educational levels were
disadvantaged in the workplace—in order to compete with higher educated people, they
needed to be more resilient. However, lower educated women might not view career as
important as men did, or they may not be confident to take risk and challenge; hence,
they had lower scores on career resilience. Contrarily, higher educated women might be
more career-oriented, and have more competence to adapt to the changing workplace. It
is worth noticing that there were only 17 males and 35 females in the high school
subgroup. Because of the small sample size of this study, the results may not truly
represent the target population.

122
Results for Research Question 4
Question 4 investigated the relationship (linear, quadratic, cubic, or quartic)
between the number of years of paid work and career resilience scores. The result of
trend analysis showed that none of the relationships yielded statistical significance.
However, the linear term yielded p = .053, which approached significance at alpha =.05
(see Table 4-9). It implied that the relationship between the years of paid work and
career resilience close to a linear tendency.
Results for Research Question 5
Question 5 detected the differences among the career belief subscales by the
participants demographic characteristics, such as gender, age, educational level, type of
institution, years of paid work, supervisory experience, career change, and participation
in training/educational activities more than one week in the most recent six months.
MANOVA results showed that all demographic variables, except for the years of paid
work, yielded statistically significant differences on the career belief subscales.
Discriminant analyses were performed to further identify the major differences among
the career beliefs.
Differences of Career Beliefs by Gender
This study found male participants total career beliefs scores were statistically
higher than females’, which indicated that males seemed to possess more irrational
career beliefs than females. Male participants were more likely to possess more sex role
stereotypes than females, and considered salary the most important factor when choosing

123
an occupation. Females were more likely to avoid making decisions because they
believed the future is full of change, hence, it is no use to make any future plan now.
These results were consistent with research reviewed in Taiwan’s literature. For
example, Yang (1996) found that male students held more irrational career beliefs than
female students. But, she did not find that Taiwanese female students scored
significantly higher on “Avoidance of Decision-Making.” Several studies reported that
males held more sex role stereotypes than females (Chiou, 1999; Jin, Lin, & Tien, 1989;
Liu, 1997; Yang, 1996). It seemed that males’ career behaviors were more restricted by
the traditional, fixed sex-role images. Previous studies also found that salary was more
important for males when making career decisions (Chiou, 1999; Yang, 1996). This
might be due to the fact that males are still the major income earner in most families.
Differences of Career Beliefs by Type of Institution
The results showed that participants who worked at public institutions were less
likely to sacrifice family life for work. This finding was congruent with Leung and
Clegg’s (2001) results. In addition, participants who worked at public institutions were
also less likely to indicate that salary was their primary concern when considering career
choices. They showed less desire for recognition and achievement, but they believed
that one should find the best-fit job, and that a career decision is final, one should not
change it.
These results seemed to agree with the common stereotypes about employees at
public (i.e., government) institutions. For example, it is believed that working at a
public institution is less competitive, and that employees do not need to spend extra
124
hours at work; therefore, they can have more time for their family life. The salary levels,
it should be noted, for the middle to top positions in public sectors are comparatively
lower than those in private companies. Therefore, individuals might not place salary as
the major concern when they decide to work at public institutions. In addition, the
reward system at public institutions depends more on seniority, and less on an
individual’s achievement. This might be a reason why participants who worked at
public institutions showed less desire for recognition and achievement. Additionally, in
Taiwan, people usually spend years to prepare for the qualifying examinations for
working in the government sector; and once they pass the examination and are assigned
a job, it is not easy to transfer to another job if they want to change. Therefore, these
reasons might explain why participants who work for the government have to be very
sure about what the “best-fit job” is for them and why they feel that once a career
decision is made, the choice is final.
Differences of Career Beliefs by Educational Level
This study found that participants with lower education were more likely to state
that work is the most important part in their life, and to indicate that salary was their
primary concern when choosing an occupation. One possible reason might be that when
there are limited opportunities to choose jobs, work and salary become the most
important concerns for lower educated employees. They were also more likely to see no
need to plan for the future (because life is full of changes) and, therefore, they tended to
avoid making career decisions.

125
On the other hand, higher educated participants were more likely to believe that
some occupations have a more prestigious status. This belief might be one of their
motivations to pursue higher education in order to find “prestigious jobs.” In addition,
they also held more sex role stereotypes―for example, family is more important for
women, and women are not suitable to be supervisors.
Differences of Career Beliefs by Age Range
Generally, older participants had lower total career beliefs scores; that is, they
possessed fewer irrational career beliefs than younger participants. However, the
differences did not reach statistical significance (see Table 4-11). This result did not
agree with the results of Murry’s (1989) study which stated that irrational career beliefs
decreased as age and work experience increased.
The major differences among age ranges showed that younger participants (21 to
25 years old) tended to believe that a career decision could be changed whenever their
needs or environment changed as well as that they should make career decisions by
themselves. They expressed the need for recognition and achievement, but they were
more likely to avoid making career decisions since the future is uncertain. On the other
hand, older participants (mostly those between 41 to 45 years of age) believed that once
a career decision was made, one should not change it. They also believed that teachers
and parents could help them make better decisions. Older participants were less likely to
avoid making decisions, and they showed less concern about other’s recognition and
approval. Thus, recognition and achievement seemed to be very important for
employees at an early career stage. In addition, younger participants seemed to be more

126
independent when making their own career decisions even though they felt uncertain
about the future and hence tended to avoid making decisions.
Differences of Career Beliefs by Supervisory Experience
Whether individuals had been supervisors or not yielded differences on many
career belief subscales. Participants who had been supervisors tended to view work as
the most important factor that brings the meaning and happiness to their lives, but salary
was not their primary concern for making a career choice. They showed a stronger need
for recognition and achievement at work. They believed that a career choice did not
have to be perfect, but once a career decision is made, it must be adhered to. They also
believed that a successful career depended on their efforts and not on luck. They were
more likely to plan and prepare for the future. These results portrayed an individual who
had supervisory experience as a person who was devoted to his/her work because he/she
was motivated by recognition and achievement, but who did not care about the salary
and whether the job was suitable for them or not. They believed in their effort and
career plans, and persevered in his/her career decisions.
Differences of Career Beliefs by Career Change
The results indicated that participants who had changed careers before expressed
a stronger need for recognition and achievement at work. Work was important to them,
but salary was not their major concern when making a career choice. They believed that
a career decision is not a final decision, and that it could be changed. Their career
decisions were less likely to be restricted by sex role stereotypes. Generally, career

127
changers valued the importance of work, but they seemed to be more flexible regarding
career decisions.
Differences of Career Beliefs by Participation in Training Activities
In this study, participants who had participated in training/educational activities
for more than one week in the most recent six months had very different career beliefs
on most of the subscales than those who did not participate in training/educational
activities. They assumed that a career decision was a personal responsibility, and they
did not avoid making career decisions. They viewed work as very important in their life,
and they desired recognition and achievement at work, but salary was not the primary
factor for choosing a career. They also assumed that all occupations have an equal
status. They believed the future was in their own hands, and they should plan for it.
Participants who engaged in additional training/educational activities seemed to be more
active, and they valued economic reward, approval, and achievement at work.
Limitations of the Study
There are several limitations that should be considered in evaluating the
generalizability of this study. First of all, causal relationships of the variables
investigated cannot be established due to the nature of a correlational study. The
findings of this study simply revealed the correlational relationships among the selected
variables.
The second limitation relates to the representativeness of the sample. The sample
used in this study was non-random and voluntary. Efforts were made to include
participants from a variety of organizations. However, when compared to the statistics

128
on the employees in Taiwan in the year 2002 (Directorate-General of Budget, 2003, see
Table 4-2), the sample was comprised of participants who had more higher-educated
participants, who worked at public institutions, and whose age ranges were more
clustered (from 21 to 40 years old). Since there was a relatively smaller number of
participants with a high school degree (N = 52), any significant difference found in this
lower education subgroup would reduce its statistical power because of the smaller
sample size. On the other hand, the voluntary nature of the sample is another concern.
Gall, Gall, and Borg (1999) addressed the problem that a voluntary sample could be a
biased sample of the target population because the characteristics of volunteers have
been found to differ from non-volunteers. Fortunately, the return rate was quite high for
this study (N = 578, 77%).
The third concern is the survey method used for collecting the data. A survey
study usually utilizes questionnaires, interviews, or paper-and-pencil tests to obtain
participants’ responses, including their attitudes, beliefs, interests, personalities, and
abilities. This method could be questioned regarding whether the participants honestly
answered the questions (i.e., truly revealed their feelings) or, how accurate their
responses were. Moreover, it could be asked of they have enough self-awareness to
evaluate their abilities.
Fourth, this study used only paper-and-pencil questionnaires to collect data.
Relying on a mono-method approach to collect data might get a “common method
variance,” which refers to a potential bias that the variance measured is due to the
measurement method rather than the variables of interest (Spector, 1987).

129
Fifth, the limitation is the restriction in standard deviations (SD) of the career
resilience items. All of the 20 items in this study yielded SD less than 1.0 (see
Appendices J). In the literature review, only Michigan’s Career Resilience Scale
showed that 12 of the 14 items’ SD was greater than 1.0 (Operational ABLE of
Michigan, 2001, March); London’s (1993b) and Noe et al’s (1990) items also obtained
low SDs. The average SD in London’s career resilience items was .58, and only 3 of the
13 items had SDs greater than 1.0 in Noe et al’s items. The low SD implies a lower
variability of these items to discriminate among participants’ responses on career
resilience.
Sixth, in this study, only the personal characteristics regarding career resilience
were investigated. London’s career motivation theory (1983) hypothesized that all
individual characteristics, situational characteristics, and career decisions and behaviors
linked and interacted with each other; and altogether they influenced individuals’ career
motivations. This study did not investigate situational characteristics which referred to a
person’s work environment, such as leadership style, group cohesiveness, job design,
staffing policies, compensation system, and career development programs. London
proposed that organizational strength and support could facilitate employees’ career
resilience. Therefore, this study could not provide information about how personal and
situational characteristics interacted with each other, or how they together influenced
individuals’ career resilience.

130
Recommendations
The following recommendations for future research are derived from the findings
and the limitations of this study:
1. To reduce and improve the mono-method bias and common method variance,
three recommendations are proposed:
(1) Use of negative and positive statements can vary the presentation of the
career resilience items; thus, this might help to reduce common method
variance.
(2) Supervisors could be included in the measures of career resilience to
enhance the accuracy regarding the participants’ degree of career
resilience. In London’s (1993b) study, the correlation between
employees’ self-report and their supervisors’ appraisal was as low as .36
on career resilience items.
(3) The results of this study showed that the majority of participants selected
option 4 (agree) and 5 (strongly agree) on the career resilience items.
This suggests that a socially desirable effect may exist, which is a
predominant source of common method variance. For further research,
examining the correlation between the career resilience items and the
social desirability inventory could help to find out if social desirability
confounded participants’ responses.
2. In this study, participants who worked at private organizations and who had
been supervisors had significantly higher scores on career resilience than

131
their counterparts. These findings suggest that organizational cultures (e.g.,
more competitive, less structured, or less authority) and job content (e.g.,
challenging, need to be autonomous, more power) may have a significant
influence on enhancing individuals’ career resilience. Therefore, situational
variables need to be investigated in later studies so that a comprehensive
understanding of career resilience is evident.
3. This study found that career resilience did not increase as participants’ age
and years of paid work increased. London posited that career resilience is
established during the adolescent years and early 20s. Does a person’s career
resilience remain stable after they reach their late 20s? How can situational
factors facilitate individuals’ career resilience? These questions require more
efforts to disclose the answers. Longitudinal research might be needed to
study the relationship between age and career resilience. Additionally,
culture differences might exist. Hence, it might be necessary to develop a
suitable measure of career resilience for employees in Taiwan and elsewhere.
4. This exploratory study actually revealed more questions, such as how gender,
education, types of institutions, supervisory experience, and participation in
educational activities influence individuals’ career resilience. Due to the
limitations of correlational studies like this one, further research that uses a
carefully designed experimental study or a longitudinal study is needed to
clarify the cause and effect among these variables.

132
The following recommendations are suggested for practice in career education,
counseling, and human resource areas:
1. Individuals’ beliefs about themselves and the world of work have a direct
influence on their career-related behaviors. Examining the client’s career
beliefs not only helps to understand how irrational career beliefs may hinder
his/her career decision making, but can be successful to obtain information
about the degree of the client’s career resilience since most of the career
beliefs yielded significant correlations with career resilience in this study.
2. This study found different career belief patterns for demographic
characteristics, including gender, age, education, supervisory experience,
career changer, participation in additional education, and employment at
private or public institutions. These patterns are believed to provide useful
information for counselors or human resource professionals so they can better
understand their clients and, therefore, provide more informed services.
3. This study found males had more sex role stereotypes than females. On the
other hand, females were more likely to feel anxious when making career
decisions, and hence avoid making decisions. Therefore, for career
counseling or for the design of career development programs, considering the
gender differences and placing different emphases could provide more
suitable assistance for male and female students/clients.
4. In this study, younger participants showed a tendency to avoid making career
related decisions. Hence, it is recommended that career courses, counseling,

133
and career development programs in organizations provide younger adults
with more help in decision making as well as in how to deal with anxiety or
uncertainty when making a decision. As for the older adults, they tended to
believe that parents and teachers could make the best decisions for
children/students. Since most of them were parents, this belief may cause
conflict between them and their children when their children are faced with
making career related decisions because the parents might insist on what they
think is best for the children. Career counselors need to be aware of this
situation if students/clients have problems with their parents regarding career
decisions.
5. This study found that individuals who had recently participated in additional
training/educational activities had higher scores on career resilience
measures. Although it cannot be concluded that participation in these
activities enhances career resilience, it could partially support the concept
that learning has a strong relationship to higher career resilience. Since
continued learning becomes a required characteristic for every employee in
today’s workplace, participation in educational activities can help to maintain
their employability and keep pace with the advanced technology, which, in
turn, might enhance their career resilience. Therefore, emphasizing
continued learning, providing learning opportunities, and teaching employees
how to learn will be essential tasks for human resource professionals.

134
REFERENCES
Arthur, M. B., & Rousseau, D. M. (1996). Introduction: The boundaryless career as a new employment principle. In M. B. Arthur & D. M. Rousseau (Eds.), The boundaryless career: A new employment principle for a new organizational era (pp. 3-20). New York: Oxford University Press.
Bandura, A. (1977). Social learning theory. Englewood Cliffs, NJ: Prentice-Hall.
Bandura, A., Barbaranelli, C., Caprara, G. V., & Pastorelli, C. (2001). Self-efficacy beliefs as shapers of children’s aspirations and career trajectories. Child Development, 72 (1), 187-206.
Betz, N. E., & Hackett, G. (1981). The relationship of career-related self-efficacy
expectations to perceived career options in college women and men. Journal of Counseling Psychology, 28, 399-410.
Betz, N. E., & Hackett, G. (1986). Applications of self-efficacy theory to understanding
career choice behavior. Journal of Social Clinical Psychology, 4, 279-289. Bice, J. (1999, January 24-30). How resilient is your career? National Business
Employment Weekly, 10-11. Brainerd, K. G. (1992). The application of London’s interactive model of career
motivation to the professional career nurse (Doctoral dissertation, The University of Connecticut, 1992). Dissertation Abstracts International, 53(12), 6597
Brown, B. L. (1996). Career resilience (Report No. EDOCE96178). Columbus, OH:
ERIC Clearinghouse on Adult, Career, and Vocational Education. (ERIC Document Reproduction Service No. ED402474)
Carson, K. D., & Bedeian, A. G. (1994). Career commitment: Construction of a measure
and examination of its psychometric properties. Journal of Vocational Behavior, 44, 237-262.
Central Personnel Administration, Republic of China. (2003). Government restructuring
(original in Chinese). Retrieved March 14, 2003, from http://www.cpa.gov.tw/html2001/singlehtml/20020603133654.shtml
Chang, C. J. (1995). The relationship among corporate culture, career motivation, and
organizational identity (original in Chinese). Unpublished thesis, Da-Yeh University, Chang-Hua, Taiwan

135
Chang, H. F., & Lin, W. F. (1996). A preliminary report on the Juvenile’s Career Belief Check-List in Taipei metropolitan area (original in Chinese). Psychological Testing Annual Report, 43, 153-172.
Chi, H. Y. (1994). A study of the types of career decision-making and career decision
beliefs among college students (original in Chinese). Unpublished thesis, National Taiwan Normal University, Taipei, Taiwan.
Chiou, S. L. (1999). Research on the career beliefs of comprehensive school students in
Taiwan (original in Chinese). Unpublished thesis, National Kaohsiung Normal University, Kaohsiung, Taiwan.
Collard, B., Epperheimer, J. W., & Saign, D. (1996). Career resilience in a changing
workplace (Report No. CE-072-052). Columbus, OH: ERIC Clearinghouse on Adult, Career, and Vocational Education. (ERIC Document Reproduction Service No. ED396191)
Commission of National Corporations, Ministry of Economic Affairs, Republic of China
(2001, September). Privatize the subordinate enterprises of the Ministry of Economic Affairs (original in Chinese). Taipei, Taiwan: Author.
Courville, T., & Thompson, B. (2001). Use of structure coefficients in published
multiple regression articles: Beta is not enough. Educational and Psychological Measurement, 61(2), 229-248.
Crites, J. O. (1978). Career Maturity Inventory: Theory and research handbook (2nd
ed.). New York: McGraw-Hill. Cronen, S. M. (1999). The effect of occupational stereotypes and gender identity on
women’s career beliefs (Doctoral dissertation, Washington University, 1999). Dissertation Abstracts International,61(01), 586
Dawis, R. V., & Lofquist, L. H. (1984). A psychological theory of work adjustment.
Minneapolis, MN: University of Minneapolis Press. Directorate-General of Budget, Accounting and Statistics, Executive Yuan, Republic of
China. (2001, September). Monthly bulletin of manpower statistics, Taiwan area, Republic of China, No. 334 (original in Chinese).Taipei, Taiwan: Author.
Directorate-General of Budget, Accounting and Statistics, Executive Yuan, Republic of
China. (2002).Yearbook of manpower statistics Taiwan area, Republic of China, 2001 (original in Chinese).Taipei, Taiwan: Author.

136
Directorate-General of Budget, Accounting and Statistics, Executive Yuan, Republic of China. (2003). Yearbook of manpower statistics Taiwan area, Republic of China, 2002 (original in Chinese).Taipei, Taiwan: Author.
Ellis, A. (1962). Reason and emotion in psychotherapy. Secaucus, NJ: Lyle Stuart. Enright, M. S. (1996). The relationship between disability status, career beliefs, and
career indecision. Rehabilitation Counseling Bulletin, 40 (2), 134-152. Fishbein, M., & Ajzen, I. (1975). Belief, attitude, intention, and behavior: An
introduction to theory and research. Reading, MA: Addison-Wesley. Fisher, T. A., & Stafford, M. E. (2000) The impact of career and ethnic influences on
career resilience. Paper presented at the annual meeting of the American Educational Research Association, New Orleans, LA. (ERIC Document Reproduction Service No. ED 442959)
Frome, P. M. (1998). The influence of girls’ gender-linked beliefs on their educational
and occupational aspirations (Doctoral dissertation, University of Michigan, 1998). Dissertation Abstracts International, 59(07), 3770
Fu, H. (2001). The relationships among career barriers, career motivation, and coping
strategies of young female employees (original in Chinese). Unpublished thesis. National Chengchi University, Taipei, Taiwan.
Fuqua, D. R., & Newman, J. L. (1994). An evaluation of the Career Beliefs Inventory.
Journal of Counseling & Development, 72, 429-430. Gall, J. P., Gall, M. D., & Borg, W. R. (1999). Applying educational research: A
practical guide (4th ed.). New York: Addison Wesley Longman. Gowan, M. A., Craft, S. L. S., & Zimmermann, R. A. (2000). Response to work
transitions by United States Army personnel: Effects of self-esteem, self-efficacy, and career resilience. Psychological Reports, 86, 911-921
Griffith, C. (1998). Building a resilient work force. Training, 35 (2), pp. 54-56, 58, 60. Grzeda, M., & Prince, J. B. (1997). Career motivation measures: A test of convergent
and discriminant validity. The International Journal of Human Resource Management, 8(3), 172-196.
Hall, D. T. & Associates (1996). The career is dead: Long live the career. San
Francisco: Jossey-Bass.

137
Hall, M. J. (1990). The pilot test of the London career motivation inventory (Doctoral dissertation, George Mason University, 1990). Dissertation Abstracts International, 51(04), 1300. (UMI No. 9025962)
Harman, H. H. (1967). Modern factor analysis. Chicago: University of Chicago Press. Hinkle, W. J., Wiersma, W., & Jurs, S. G. (1998). Applied statistics for the behavioral
sciences. Boston, MA: Houghton Mifflin Company. Holland, J. L., Johnston, J. A., Asama, N. F., & Polys, S. M. (1993). Validating and
using the Career Beliefs Inventory. Journal of Career Development, 19(4), 233-244.
Jackson, C. M. (1995). A comparison of the career beliefs of women (Master’s thesis,
California State University, 1995). Masters Abstracts International,34(03), 1069. (UMI No. 1377524)
Jin, S. R., Lin, C. S., & Tien, H. L. (1989). The career development of Chinese college
students in Taiwan (original in Chinese). National Taiwan Normal University Educational Psychology Academic Report. 22, 167-190.
Kachigan, S. K. (1991). Multivariate statistical analysis: A conceptual introduction (2nd
Ed.). New York: Radius Press. Kidd, J. M., & Smewing, C. (2001). The role of the supervisor in career and
organizational commitment. European Journal of Work and Organizational Psychology, 10(1), 25-40.
Kline, P. (1994). An easy guide to factor analysis. New York: Routledge. Kobasa, S. C. (1979). Stressful life events, personality, and health: An inquiry into
hardiness. Journal of Personality and Social Psychology, 37, 1-11. Kobasa, S. C., Maddi, S. R., & Kahn, S. (1982). Hardiness and health: A prospective
study. Journal of Personality and Social Psychology, 42(1), 168-177. Krumboltz, J. D. (1979). A social learning theory of career decision making. In A. M.
Mitchell, G. B. Jones, & J. D. Krumboltz (Eds), Social learning and career decision making (pp. 19-49). Cranston, RI: Carroll Press.
Krumboltz, J. D. (1983). Private rules in career decision making (Report No. CE-035-
962). Columbus, OH: ERIC National Center for Research in Vocational Education. (ERIC Document Reproduction Service No. ED229608)

138
Krumboltz, J. D. (1991). Manual for the Career Beliefs Inventory. Palo Alto, CA: Consulting Psychologists Press.
Krumboltz, J. D. (1994a). The Career Beliefs Inventory. Journal of Counseling &
Development, 72, 424-428. Krumboltz, J. D. (1994b). Potential value of the Career Beliefs Inventory. Journal of
Counseling & Development, 72, 432-433. Krumboltz, J. D., Rude, S. S., Mitchell, L. K., Hamel, D. A., & Kinnier R. T. (1982).
Behaviors associated with “good” and “poor” outcomes in a simulated career decision. Journal of Vocational Behavior, 21 349-358.
Lent, R. W., & Hackett, G. (1987). Career self-efficacy: Empirical status and future
directions. Journal of Vocational Behavior, 30, 347-382. Leu, J. J. (2000). A study of investigation between career belief and career barriers in
college of physical education students (original in Chinese). Unpublished thesis, National Taiwan Physical Education College, Taipei, Taiwan.
Leung, A. S. M., & Clegg, S. R. (2001). The career motivation of female executives in
the Hong Kong public sector. Women in Management Review,16, 12-20. Lewis, R. S., & Gilhousen, M. R. (1981). Myths of career development: A cognitive
approach to vocational counseling. The Personnel and Guidance Journal, 59,296-299.
Lin, W. F. (1997). The study of undergraduate students’ career commitment and the
effect of group intervention (original in Chinese). Unpublished dissertation, The National Taiwan Normal University, Taipei, Taiwan.
Liu, Y. H. (1997). An investigation on the relationships among career beliefs, career
self-efficacy, and career development of elementary school teachers (original in Chinese). Unpublished thesis, National Taipei Normal College, Taipei, Taiwan.
London, M. (1983). Toward a theory of career motivation. Academy of Management
Review, 8(4), 620-630. London, M. (1993a). Career motivation of full- and part-time workers in mid and late
career. The International Journal of Career Management, 5, 21-29. London, M. (1993b). Relationships between career motivation, empowerment and
support for career development. Journal of Occupational and Organizational Psychology, 66, 55-69.

139
London, M. (1997). Overcoming career barriers: A model of cognitive and emotional
processes for realistic appraisal and constructive coping. Journal of Career Development, 24(1), 25-38.
London, M., & Bray, D. W. (1985). Measuring and developing young managers’ career
motivation. Journal of Management Development, 5, 3-26. London, M. & Mone, E. M. (1987). Career management and survival in the workplace.
San Francisco: Jossey-Bass. London, M., & Noe, R. A. (1997). London’s career motivation theory: An update on
measurement and research. Journal of Career Assessment, 5(1), 61-80. London, M., & Smither, W. (1999). Career-related continuous learning: Defining the
construct and mapping the process. Research in Personnel and Human Resources Management, 17, 81-121.
Lunney, C. A. M. (1993). Assessing career expectations and belief systems of liberal
arts graduates (Doctoral dissertation, Vanderbilt University, 1993). Dissertation Abstracts International,54(05), 1681
Luthar, S. S., Cicchetti D., & Becker B. (2000). The construct of resilience: A critical
evaluation and guidelines for future work. Child Development, 71(3), 543-562. Luzzo, D. A. (1997). Correlates of Mexican American college students’ perceptions of
career-related barriers. Paper presented at the 1997 annual meeting of the American Psychological Association, Chicago. (ERIC Document Reproduction Service No. ED 422530)
Maichrowicz, R. J. (1996). The importance of career beliefs in the processing of
occupational information (Doctoral dissertation, University of Akron, 1996). Dissertation Abstracts International,57(08), 5334
Masten, A. S. (2001). Ordinary magic: Resilience processes in development. American
Psychologist, 56(3), 227-238. McDonald, R. P. (1985). Factor analysis and related methods. Hillsdale, NJ: Lawrence
Erlbaum Association. Mertler, C. G., & Vannatta, R. A. (2002). Advanced and multivariate statistical
methods: Practical application and interpretation. Los Angeles: Pyrczak Publishing.
140
Miles, R. E., & Snow, C. C. (1996). Twenty-first century careers. In M. B. Arthur & D. M. Rousseau (Eds.), The boundaryless career: A new employment principle for a new organizational era (pp. 97-115). New York: Oxford University Press.
Mirvis, P. H., & Hall, D. T. (1996). Psychological success and the boundaryless career.
In Arthur, M. B., & Rousseau, D. M. (Eds.), The boundaryless career: A new employment principle for a new organizational era (pp. 237-255). New York: Oxford University Press.
Mitchell, K. E. (1993). The effects of cognitive restructuring and instruction in problem
solving on anxiety experienced by adults considering a midlife career change (Doctoral dissertation, University of San Francisco, 1993). Dissertation Abstracts International, 54(04), 1243.
Mitchell, L. K., & Krumboltz, J. D. (1996). Krumboltz’s learning theory of career
choice and counseling. In D. Brow, L. Brooks, and Associates (Eds). Career choice and development. (pp. 233-280). San Francisco: Jossey-Bass.
Murry, B. W. (1989). The relationship of irrational/maladaptive beliefs to subtypes of
career indecision (Doctoral dissertation, University of Maryland College Park, 1989). Dissertation Abstracts International,51(04), 1120
Naylor, F. D., & Krumboltz, J. D. (1994). The independence of aptitudes, interests, and
career beliefs. The Career Development Quarterly, 43, 152-160. Nevo, O. (1987). Irrational expectations in career counseling and their confronting
arguments. The Career Development Quarterly, 35, 239-250. Niles, S. G., & Sowa, C. J. (1992). Mapping the nomological network of career self-
efficacy. The Career Development Quarterly, 41, 12-21. Noe, R. A., Noe, A. W., & Bachhuber, J. A. (1990) An investigation of the correlations
of career motivation. Journal of Vocational Behavior, 37, 340-56. Noordin, F., Williams, T., & Zimmer, C. (2002). Career commitment in collectivist and
individualist cultures: A comparative study. Journal of Human Resource Management, 13(1), 35-54.
Operation ABLE of Michigan (2001, March). Building career and organizational
resilience: An evaluation of the Operation ABLE of Michigan Kellogg career resiliency/lifelong learning project, 1996-2001, Michigan, MI: Author.

141
Porat, H., Marshall, G., & Howell, W. (1997). The career beliefs of homeless veterans: Vocational attitudes as indicators of employability. Journal of Career Assessment, 5 (1), 47-59.
Pulley, M. L. (1995). Beyond the corporate box: Exploring career resilience (Doctoral
dissertation, Vanderbilt University, 1995). Dissertation Abstracts International, 57(02), 1427. (UMI No. 9616854)
Rak, C. F., & Patterson, L. E. (1996). Promoting resilience in at-risk children. Journal of
Counseling & Development, 74, 368-373. Rokeach, M. (1972). Beliefs, attitudes, and values: A theory of organization and change.
San Francisco: Jossey-Bass. Ryan-Jones, R. E. (1990). The relationship of career indecision, vocational identity, and
gender to career beliefs (Doctoral dissertation, The Florida State University, 1990). Dissertation Abstracts International, 51(12), 4025. (UMI No. 9112112)
Rutter, M. (1993). Resilience: Some conceptual considerations. Journal of Adolescent
Health, 14, 626-631. Scoble, K. B. (1991). Career resilient characteristics and commitment among registered
nurses: Predictors of organizational and professional retention (Doctoral dissertation, Columbus University, 1991). Dissertation Abstracts International, 52(10), 5571. (UMI No. 9136468)
Spector, P.E. (1987). Method variance as an artifact in self-reported affect and
perceptions at work: Myth or significant problem? Journal of Applied Psychology, 72(3), 438-443.
Spor, A. E. (1999). The effects career beliefs of dislocated workers have on potential for
employment (Master’s thesis, California State University, 1999). Master Abstracts International,37(05), 1527
Stone, E. (1996). Career beliefs and self-efficacy levels of working women (Doctoral
dissertation, Texas A&M University, 1996). Dissertation Abstracts International, 58(01), 319
Story, J. A. (2000). Fracture lines in the career environment. In A. Collin & R. A. Young
(Eds.), The future of career (pp. 21-36). New York: Cambridge University Press. Tatsuoka, M. M. (1988). Multivariate analysis: The techniques for educational and
psychological research. New York: Macmillan Publishing.

142
Taylor, K. M., & Popma, J. (1990). An examination of the relationships among career decision-making self-efficacy, career salience, locus of control, and vocational indecision. Journal of Vocational Behavior, 22, 63-81.
Thompson, A. P. (1976). Client misconceptions in vocational counseling. The Personnel
and Guidance Journal, 54, 30-33. Tien, H. (1998). Discriminant validity of the Career Beliefs Checklist (original in
Chinese). Psychological Testing Annual Report, 45, 137-158. Walton, J. (1999). Strategic human resource development. Harlow, UK: Financial
Times/Prentice Hall. Waterman, R. H., Waterman, J. A., & Collard B. A. (1994, July-August). Toward a
career-resilient workforce. Harvard Business Review, 72(4), 87-95. Werner, E. E. (1984). Resilient children. Young Children, 40(1), 68-72. Woodd, M. (2000). The move towards a different career pattern: Are women better
prepared than men for a modern career? Career Development International, 5(2), 95-105.
Woodrick, C. (1979). The development and standardization of an attitude scale designed
to measure career myths held by college students. (Doctoral dissertation, Texas A&M University, 1979). Dissertation Abstracts International, 40(08), 4506
World Trade Organization. What is the WTO? Retrieved May 26, 2003, from
http://www.wto.org/english/thewto-e/whatis-e/inbrief-e/inbr00-e.htm Wu, C. Y. (1991). A study on senior students’ beliefs, state-trait anxiety, and behaviors
of career decision-making: An example of National Taipei Commercial Junior College (original in Chinese). Unpublished thesis. National Taiwan Normal University, Taipei, Taiwan.
Yang, S. (1996). The construction of the Chinese Career Beliefs Inventory (original in
Chinese). NSC84-2413-H-018-013. Taipei, Taiwan: National Science Commission, Executive Yuan, Republic of China.
Young, R. A., & Collin, A. (2000). Introduction: Framing the future career. In A. Collin
& R. A. Young (Eds.), The future of career (pp. 1-17). Cambridge, UK: Cambridge University Press.

143
APPENDIX A
COVER LETTER
June 10, 2002
Dear Participants, I, a graduate student in the Department of Educational Psychology at Texas A&M University, am completing my dissertation study on Relationships between Career Resilience and Career Beliefs of Employees in Taiwan. With your assistance, I hope to identify the patterns of Taiwan employees’ career resilience and career beliefs and their correlations. In the year 2001, it was the first time in 67 years that the unemployment rate in Taiwan was higher than 5%. I am concerned with this problem and feel that the results of this study will provide more understanding about the career attitudes held by Taiwanese employees and will benefit developing career education programs. My research will be under the supervision of my advisor, Dr. Linda Parrish, of Texas A&M University. Enclosed are two copies of a Consent Form requesting your signature. Also included are the questionnaires and a personal data sheet. Please answer all information on the personal data sheet and questionnaires as it represents your situation and attitude. This task should take you approximately 30-40 minutes to complete. This study has been reviewed and approved by the Institutional Review Board-Human Subjects in Research, at Texas A&M University. All your responses will be kept confidential, and no name or any specific identities will be presented in the final dissertation report. If you have any questions, please contact me (for telephone numbers and e-mail addresses, please refer to the Consent Form). Please return the completed questionnaire, personal data sheet, and one copy of the Consent Form no later than June 30, 2002. To this endeavor, again I offer my appreciation and sincerest thanks. Sincerely, Yu-Ching Liu Principle Investigator ───────────── Note. The cover letter was simplified into a brief introduction and printed with the
consent form on the first page in the main study. All materials were translated into Chinese.

144
APPENDIX B
CONSENT FORM
• I agree to participate in the dissertation research study entitled “Relationships between Career Resilience and Career Beliefs of Employees in Taiwan.”
• I understand that the purpose of this study is to explore the relationships between a person’s career resilience and career beliefs.
• I understand that the study will include data from approximately 700 adult employees in Taiwan.
• I understand that my participation is strictly voluntary and that I may refuse to answer any of the questions on the questionnaire if I find it uncomfortable.
• I understand that it will take approximately 30-40 minutes to complete the questionnaire.
• I understand that there are no foreseeable risks or benefits from my participation. • I understand that my responses will be kept confidentially and that my name will
not be mentioned in any reports of the research. • I understand that if I have any questions later regarding this study, I can contact
the Principle investigator, Ms. Yu-Ching Liu, at 301 Ball St. Apt #1110, College Station, Texas 77840, phone (979) 862-9198. I can also contact Dr. Linda Parrish, at Mail Stop 4225, Texas A&M University, College Station, Texas 77843-4225, phone (979) 845-3447.
“I understand that this research study has been reviewed and approved by the Institutional Review Board – Human Subjects in Research. For research-related problems or questions regarding subjects’ rights, the Institutional Review Board may be contacted through Dr. Michael W. Buckley, Director of Compliance and Administration at (979) 845-8585 ([email protected]).”
• I have read and understood the explanation provided to me. • I have had all my questions answered to my satisfaction. • I have been given a copy of this consent form.
__________________ Signature of Participant Date ___________
Signature of Researcher Date

145
APPENDIX C
INSTRUCTIONS
1. This questionnaire is designed to study individuals’ attitudes regarding work and
career. Please read every statement carefully and choose the answer that most
accurately describes the way you act or feel about work and career.
2. For example:
If you strongly disagree with a statement, circle the number 1.
If you disagree with a statement, circle the number 2.
If you can’t decide whether you agree or disagree, circle the number 3.
If you agree with a statement, circle the number 4.
If you strongly agree with a statement, circle the number 5.
3. There is no correct answer for these items. Please respond to each item according to
your real feelings and reactions, and that would be the best answer. Your responses
will be treated as confidential, so please give honest responses to all questions. This
questionnaire contains two sections (a total of 109 itemsa). After you complete the
questionnaire, please check if you have omitted any questions. Enclosed please find
a business reply envelope (postage paid by the investigator), and mail your
questionnaire as well as the signed Consent Form to the investigator no later than
(month) (date). Thank you for your cooperation!
───────────── Note. aThe total number of items in the main study was 69.

146
APPENDIX D
THE MEASURES OF CAREER RESILIENCEa
*1. I welcome job and organizational changes.
*2. I am willing to take risks (actions with uncertain outcome).
3. I can handle any work problem that comes my way.
*4. I look forward to working with new and different people.
*5. I am able to adapt to changing circumstances.
*6. I have made suggestions to others even though they may disagree.
*7. I make and maintain friendships with people in different departments.
*8. I will design better ways of doing my work.
9. I have outlined ways of accomplishing jobs without waiting for my boss.
*10. I accept compliments rather than discount them.
*11. I believe other people when they tell me that I have done a good job.
12. I will evaluate my job performance against personal standards rather than comparing it with what others do.
*13. I will take the time to do the best possible job on a task.
*14. I look for opportunities to interact with influential people.
*15. My career goals are clear and I have a good idea of where I’m heading.
16. I can identify three important accomplishments from my current/last job.
*17. My skills have been upgraded to keep pace with the current technique.
*18. I have adequate computer knowledge/skills to do my job.
*19. I explore trends in my field/industry and have identified various changes that are occurring.

147
20. I have sought opportunities to take on new responsibilities in my work.
21. I have sought opportunities to work with others or contribute to work teams.
*22. The skills and abilities that I need to be employable are clear to me.
*23. I have a network of people in and outside my field that can help my career.
*24. I have actively sought better assignments in my current or past jobs.
*25. Regularly, I try to identify the future direction of my field by making personal contacts, reading or attending professional meetings.
26. I’m more comfortable than ever with the constantly changing world of work.
*27. If I identify what I need to learn, I will actively seek the learning opportunity.
28. I like to read or attend conferences and workshops to learn new knowledge or skills.
—————————— Note. aAdapted with permission from London, M, 1993b, Noe et al., 1990, and Operation ABLE of
Michigan, 2001, March. * Indicates this item was retained in the main study.

148
APPENDIX E
THE CAREER BELIEFS SCALEa
1. To win others’ approval is not the reason I study.
2. Earning a lot of money is the only purpose of life.
*3. I will try my best to do my job; it doesn’t matter whether I am outstanding or not.
4. It is better to plan out the future actively rather than to passively obey the fate.
5. There are certain jobs that are suitable for men, and some that are suitable for women.
*6. I don’t care whether my work will earn the recognition of my boss and colleagues or not.
7. I don’t like a job with long hours because it may affect my family life.
*8. My future is controlled in my hands.
9. It is no use to plan for the future because the future depends on luck.
10. Women can perform as well as men do in their jobs.
11. I often hesitate whenever I am facing career decisions.
12. I must choose the best-fit job; otherwise, my future will be hopeless.
*13. Only work can make me feel happy.
14. I will do the job that fits me; I don’t care what other people say about my job.
*15. Unless I am absolutely sure what job is suitable for me, I will not make any decision.
*16. In order to develop one’s potential fully, he or she should do the same job all his or her life.
17. If my choice of career disappoints my parents, I will feel bad.

149
18. In order to adjust for personal and environmental needs, I can change my life plan.
*19. Men are more suitable to be supervisors.
20. I like to think about and plan for my future.
21. It is more important that one develops his/her professional knowledge and skills than it is to earn more money.
22. In order to do better, I have to come to work earlier and leave later.
23. My future job should fit my major; otherwise, the four years spent at college are wasted.
*24. If we plan the future carefully, it will be easy to reach our goals.
*25. If you carefully plan and well prepare, you will have good results.
*26. If a person changes jobs often, he or she must have personality problems.
27. Girls will marry any way, so they don’t need to receive higher education.
*28. I will give up a job that fits my interest and ability in order to pursue high salary.
*29. In order to concentrate on work, I am willing to be single.
*30. I will be very disappointed if I can’t find my best-fit job.
*31. My job doesn’t need to fit my major; only high salary is my concern.
32. Even if I don’t make any outstanding achievements in my job, that doesn’t mean I am a failure.
*33. If a person changes jobs often, he or she cannot be successful in the future.
*34. I am willing to do any jobs if its pay is good.
*35. Work is more important than family. I can sacrifice time with my family for work.
36. My occupation must have my parents’ approval for me to be satisfied.

150
*37. I don’t worry about working too much; the more work I do, the more I achieve.
38. If I find out my job is not suitable for me later, I can change it.
39. I don’t have to think about my future plans because I can follow the plan that my family has made for me.
40. High salary doesn’t mean that the person has a successful career.
*41. My job must be the one I am most interested in, or I don’t want to do it.
*42. Teachers know their students very well so they can decide a major for them.
*43. I try to avoid making career choices, because it is difficult to make a decision.
*44. Even though a person’s job is viewed as low status, he/she still can serve society.
*45. Once one finds the best-fit job, he or she should not change it because there is only one best-fit job for him or her in the world.
*46. I don’t want other people to plan my life. I should decide my occupation for myself.
*47. The future is full of changes we can’t predict or control, so it is no use to make any future plan right now.
48. My job choice won’t be limited by my gender.
*49. If I have to make a future plan right now, I will be anxious and unable to face the problem.
*50. I don’t mind that my parents compare me with others.
*51. The accomplishment of a job is due to one’s competency and efforts instead of luck.
*52. In order to make the right job choice, I have to consider it carefully until I find a perfect answer.

151
*53. Boys should choose science and engineering as their majors and girls should choose literature, education, sociology, and business as their majors.
*54. I will do whatever job I find, so I don’t need to plan for my future now.
*55. If my work performance does not make me preeminent in my field, I will feel terrible.
*56. All occupations are equal (no high status or low status jobs); the most important thing is to choose a job that is suitable for you.
*57. It won’t be too late to think about my future plan until the time that I have to.
*58. Salary is not the primary concern when I consider choosing a job.
*59. Women should stay at home being a housewife but men should go out to work and bring back money.
*60. I am willing to do any jobs that fit my interest and ability.
*61. Accomplishing the work is more important than earning more money.
62. Even though my job doesn’t fit my major, I will still try my best to do the job.
*63. I don’t care whether I am highly regarded at work or not.
*64. Both males and females are suitable for being doctors.
*65. Parents should not interfere with their children’s choice of major or job.
66. The ideal job is low work loading but high pay.
*67. Girls will marry someday, so they don’t need to consider career choice.
*68. Schools and teachers should not affect their students’ choice of major.
*69. I will not be satisfied until I find a best-fit job.
*70. If I want a promising future, I have to be a doctor, lawyer, …etc.

152
71. In order to have better work performance, I have to sacrifice many things.
72. One may have several occupations that suit him or her.
*73. Today’s hot majors may not be hot in the future; therefore, I should choose a major that fits me.
*74. Only work can make me feel that my life is meaningful.
75. It is irresponsible if you hand your own future to fate.
76. Even if my performance is not better than someone else’s, I will be satisfied if it improves.
77. If I study hard while I am a student, I will find a suitable job after graduation.
78. I am afraid of making career choices, because if I make a wrong choice, all my life will be affected.
*79. The primary factor of career success is due to luck.
*80. I have to choose an occupation that meets my parents’ expectations; otherwise, I will not be a good son or daughter.
81. I began to think about my future plan very early.
—————————— Note .aAdapted with permission from Yang, 1996.
* indicates this item was retained for use in the main study.

153
APPENDIX F
PERSONAL DATA SHEET
Directions: Please circle or provide your answer in the space provided. 1. Your current organization is: 1. Public 2. Private 2. Business activity of your organization: ___________________________
(e.g., bank, department store, factory, government agency, high-tech company, hospital, insurance agency, school, trade company, etc.)
3. Number of years in the current job: ______(# of years) 4. Have you ever been a supervisor? 1. No 2. Yes ==>For ______(# of years) 5. Total number of years of paid work: ______(# of years) 6. Have you ever changed your career (change to a different occupation, not changed
jobs): 1. No 2. Yes ==>For _______(# of careers)
7 Have you worked for different organizations: 1. No 2. Yes ==>For _______(# of organizations)
8. Gender: 1. Male 2. Female 9. Age: 1. 20 or below
2. 21 to 25 3. 26 to 30
4. 31 to 35 5. 36 to 40 6. 41 to 45 7. 46 to 50 8. 51 to 55 9. 56 to 60
10. 61 and above 10. Highest Educational Level completed: 1. Junior high school or below
2. High School 3. Junior college 4. University 5. Graduate School
*11. In the most recent six months, have you ever attended any class, workshop, or training program for more than one week: 1. No 2. Yes ───────────── Note. * indicates this item was added in the main study.

154
APPENDIX G
DEMOGRAPHIC CHARACTERISTICS OF THE PILOT SAMPLE
Demographic Characteristics Number Valid Percentage
Gender Male 57 32.2% Female 120 67.8% Missing 1 Education Junior High School and below 1 0.6% High School 31 17.4% Junior College 62 34.8% Bachelor 73 41.0% Master or Ph.D. 11 6.2% Age Range 20 or below 22 12.4% 21 to 25 61 34.5% 26 to 30 27 15.3% 31 to 35 25 14.1% 36 to 40 10 5.6% 41 to 45 11 6.2% 46 to 50 7 4.0% 51 to 55 10 5.6% 56 to 60 3 1.7% 61 and above 1 0.6% Missing 1 Years of Paid Work 5 years and below 80 46.8% 6 to 10 years 39 22.8% 11 to 15 years 16 9.4% 16 to 20 years 9 5.3% 21 to 25 years 12 7.0% 26 years and above 15 8.8% Missing 7 Institution Public 37 22.3% Private 129 77.7% Missing 12 Supervisory Experience Never 121 69.9% Yes 52 30.1% Missing 5 Career Change Never 69 39.4% Yes 106 60.6% Missing 3
Note. Total N = 178

155
APPENDIX H
MEANS AND STANDARD DEVIATIONS FOR SCORES ON THE MEASURES OF CAREER RESILIENCE IN THE PILOT STUDY
Item Number
Mean Standard Deviation
1 3.83 .64 2 3.78 .74 3 3.88 .64 4 3.67 .85 5 3.80 .77 6 3.73 .79 7 4.06 .66 8 4.19 .54 9 3.79 .80 10 3.35 .86 11 3.37 .87 12 3.61 .93 13 4.10 .59 14 3.27 .97 15 3.58 .81 16 3.47 .88 17 3.64 .86 18 3.35 1.06 19 3.84 .70 20 3.98 .68 21 4.02 .69 22 4.10 .61 23 3.69 .88 24 3.40 .90 25 3.35 .97 26 3.89 .66 27 4.13 .49 28 3.73 .89
_____________________________________________________________________
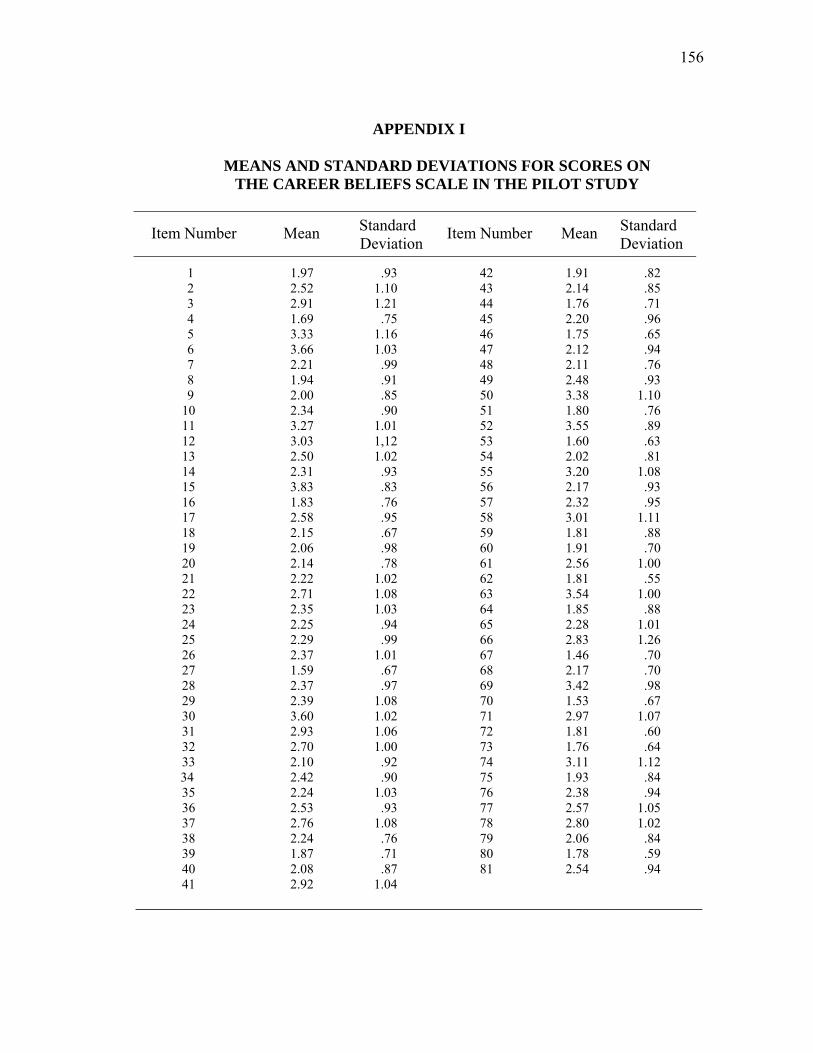
156
APPENDIX I
MEANS AND STANDARD DEVIATIONS FOR SCORES ON THE CAREER BELIEFS SCALE IN THE PILOT STUDY
Item Number Mean Standard Deviation Item Number Mean Standard
Deviation
1 1.97 .93 42 1.91 .82 2 2.52 1.10 43 2.14 .85
3 2.91 1.21 44 1.76 .71 4 1.69 .75 45 2.20 .96 5 3.33 1.16 46 1.75 .65 6 3.66 1.03 47 2.12 .94 7 2.21 .99 48 2.11 .76 8 1.94 .91 49 2.48 .93 9 2.00 .85 50 3.38 1.10 10 2.34 .90 51 1.80 .76 11 3.27 1.01 52 3.55 .89 12 3.03 1,12 53 1.60 .63 13 2.50 1.02 54 2.02 .81 14 2.31 .93 55 3.20 1.08 15 3.83 .83 56 2.17 .93 16 1.83 .76 57 2.32 .95 17 2.58 .95 58 3.01 1.11 18 2.15 .67 59 1.81 .88 19 2.06 .98 60 1.91 .70 20 2.14 .78 61 2.56 1.00 21 2.22 1.02 62 1.81 .55 22 2.71 1.08 63 3.54 1.00 23 2.35 1.03 64 1.85 .88 24 2.25 .94 65 2.28 1.01 25 2.29 .99 66 2.83 1.26 26 2.37 1.01 67 1.46 .70 27 1.59 .67 68 2.17 .70 28 2.37 .97 69 3.42 .98 29 2.39 1.08 70 1.53 .67 30 3.60 1.02 71 2.97 1.07 31 2.93 1.06 72 1.81 .60 32 2.70 1.00 73 1.76 .64 33 2.10 .92 74 3.11 1.12
34 2.42 .90 75 1.93 .84 35 2.24 1.03 76 2.38 .94 36 2.53 .93 77 2.57 1.05 37 2.76 1.08 78 2.80 1.02 38 2.24 .76 79 2.06 .84 39 1.87 .71 80 1.78 .59 40 2.08 .87 81 2.54 .94 41 2.92 1.04
_______________________________________________________________________

157
APPENDIX J
MEANS AND STANDARD DEVIATIONS FOR SCORES ON THE MEASURES OF CAREER RESILIENCE IN THE MAIN STUDY
Item Number Mean Standard Deviation
1 3.82 .73
2 3.61 .84
3 3.67 .85
4 3.83 .72
5 3.73 .81
6 4.24 .60
7 4.28 .57
8 3.39 .76
9 3.59 .72
10 4.21 .62
11 3.30 .97
12 3.59 .80
13 3.71 .80
14 3.72 .91
15 3.92 .74
16 4.23 .65
17 3.63 .91
18 3.50 .83
19 3.50 .92
20 4.12 .63
__________________________________________________________________________________

158
APPENDIX K
MEANS AND STANDARD DEVIATIONS FOR SCORES ON THE CAREER BELIEFS SCALE IN THE MAIN STUDY
Item Number Mean Standard Deviation Item Number Mean Standard
Deviation
1 2.78 1.07 26 2.38 .84
2 3.16 1.03 27 3.10 1.00
3 2.07 .79 28 2.07 .82
4 2.70 .98 29 3.34 .87
5 3.67 .84 30 1.77 .66
6 2.04 .82 31 2.14 .68
7 2.30 .98 32 3.32 .95
8 2.22 .98 33 1.88 .66
9 2.26 .81 34 2.36 .86
10 2.65 .93 35 3.07 1.00
11 2.53 .90 36 1.98 .85
12 2.12 .91 37 2.03 .68
13 3.52 .90 38 2.87 .92
14 2.84 .93 39 3.57 .85
15 2.40 .87 40 1.81 .71
16 2.53 .84 41 2.65 .93
17 2.16 .84 42 1.56 .71
18 2.72 .94 43 2.52 .95
19 2.85 .69 44 3.16 .88
20 1.99 .91 45 1.67 .68
21 2.19 .78 46 1.92 .72
22 1.90 .78 47 3.07 1.04
23 2.20 .85 48 2.25 .81
24 1.98 .70 49 1.85 .70
25 2.29 .82
_______________________________________________________________________
159
VITA
Yu-Ching Liu 3 Fl. No. 7 Alley 35 Line 136
Ming-Chuan East Rd. Section 6 Taipei 114, Taiwan, R. O. C.
Email: [email protected] Educational Background
Ph.D. Texas A&M University, Educational Psychology, December 2003 M.A. University of Kansas, Experimental Psychology, May 1990 B.S. Chung Yuan Christian University, Psychology, June 1985
Professional Experience
Specialist Career Guidance and Information Center The National Youth Commission June 1990 to December 1999
Lecturer Chinese Culture University September 1990 to January, 1991 Research Assistant Department of Psychology at University of Kansas January 1989 to May 1989
Teaching Assistant Department of Psychology at University of Kansas August 1988 to December 1988 Research Assistant Department of Psychology at National Taiwan University August 1985 to July 1987 Thesis
Voluntary control of attention in response to location cues, size cues, and their combination