Embed Size (px)
Citation preview
Relation Between the Number of Image Planes and theAccuracy of Three-Dimensional Echocardiography for
Measuring Left Ventricular Volumes andEjection Fraction
Peter G. Danias, MD, PhD, Michael L. Chuang, MSc, Robert A. Parker, ScD,Raymond A. Beaudin, MSc, Matthew G. Mooney, MS, Warren J. Manning, MD,
Pamela S. Douglas, MD, and Mark G. Hibberd, MD, PhD
Three-dimensional echocardiography (3DE) allowsfor integration and display of information from
multiple planes, minimizes the need for geometricassumptions for the left ventricle, and thus can accu-rately quantify left ventricular structure and systolicfunction.1–13 Although denser sampling of the leftventricular surface would theoretically provide moreaccurate measurements of ventricular volumes andejection fraction (EF), such potential benefits wouldbe achieved at the expense of increased time for imageacquisition and data analysis. Studies in experimentalanimals14,15 and postmortem human preparations16
under optimized conditions have suggested that 3 to12 component image planes are necessary for accuratecomputation of left ventricular volumes. However,similar data are not available for humans. Accord-ingly, we examined the relation between number ofcomponent planes used for 3DE and accuracy in esti-mating left ventricular end-diastolic volume, end-sys-tolic volume, and EF in humans using cardiac mag-netic resonance imaging (MRI) as the reference stan-dard.17–19
• • •Forty-one adult subjects (32 men, aged 396 19
years [range 24 to 77]), all in sinus rhythm at the timeof imaging, underwent transthoracic 3DE and cardiacMRI within 2 hours. There were 17 subjects (41%)with “abnormal” hearts, 14 (34%) with EF,55%, 13with dilated left ventricle (end-diastolic volume.90ml/m2), and 7 (17%) with regional left ventricularsystolic dysfunction. None of the subjects had anyMRI contraindications and written informed consentwas obtained before participation. The study protocolwas approved by the hospital committee on clinicalinvestigation.
The 3DE system consisted of a modified Hewlett-Packard Sonos 1500 system with a 2.5-MHz transtho-racic transducer (Hewlett–Packard, Medical ProductsDivision, Andover, Massachusetts). With the subject
remaining in the same position for the duration of eachstudy, up to 20 electrocardiographically triggered2-dimensional echocardiographic cine loops (eachspanning the entire cardiac cycle) were recorded dig-itally during breath-holding, and stored on an opticaldisk for later analysis. Imaging was performed fromboth parasternal and apical windows with the intentionto maximize endocardial visualization. A commer-cially available electromagnetic spatial location sys-tem (Flock of Birds, Ascension Technologies, Burl-ington, Vermont) was used to determine the positionand orientation of the transducer at a 30-Hz rate(matching the image frame rate).
End-diastolic and end-systolic endocardial borderswere manually traced. Regions with poor endocardialdefinition were not traced, because the reconstructionalgorithm can incorporate incomplete contours andcan accommodate regions with sparsely sampled en-docardial surfaces. Three-dimensional echocardio-graphic reconstructions of left ventricular endocardialsurfaces and volume computation were performed off-line on a Unix-based workstation (Hewlett-PackardSeries 735) with custom software. For each subject, afamily of 3DE reconstructions was created by usinggradually increasing numbers of component planes.At least 1 parasternal and 1 apical view were used foreach reconstruction, and the number of parasternaland apical views was approximately equal for eachreconstruction scheme.
All MR studies were performed on a 1.5-Teslawhole body scanner (Gyroscan NT, Philips MedicalSystems, Best, The Netherlands). A gradient echobreath-hold cine sequence with electrocardiographicgating20) was used to obtain 16 contiguous short-axisslices covering the entire left ventricle (slice thickness5 to 7 mm). The endocardial borders of both end-diastolic and systolic frames were manually traced andleft ventricular end-diastolic and end-systolic volumeswere computed using a disk-area summation method(modified Simpson’s rule).
Linear regression analysis was used to assess theability of 3DE to predict the MRI values for leftventricular EF and end-diastolic and end-systolic vol-umes. For an ideal prediction, the intercept and theslope should be 0.0 and 1.0, respectively. Differencesbetween each 3DE reconstruction and the correspond-ing MR data were computed, and the variance of thesedifferences was compared against the variance of thedifference between MR and an “optimal” (maximum
From the Charles A. Dana Research Institute and the Harvard-Thorndike Laboratory, Department of Medicine, Cardiovascular Divi-sion, Department of Radiology, and Biometrics Center, Beth IsraelDeaconess Medical Center, Boston, Massachusetts; the University ofConnecticut Health Center, Cardiology Division, Farmington, Con-necticut; and the Hewlett–Packard Company, Medical Products Divi-sion, Andover, Massachusetts. Dr. Douglas’s address is: Beth IsraelDeaconess Medical Center, 330 Brookline Avenue, Boston, Massa-chusetts 02215. E-mail: [email protected]. Manuscriptreceived May 19, 1998; revised manuscript received and acceptedJuly 1, 1998.
BRIEF REPORTS 1431
number of planes available) 3DE reconstruction usingan F test. All statistical tests were performed on apersonal computer with commercially available soft-ware (SAS, v6.11, SAS Institute, Cary, North Caroli-
na). Subgroup analysis was performedto comparatively assess 3DE accuracyfor subjects with normal and abnormalhearts using the same (least) number ofplanes. A p value of,0.05 was prede-termined as statistically significant.
Three-dimensional echocardiographicand MRI data for the end-diastolic andend-systolic volumes correlated well(r
2
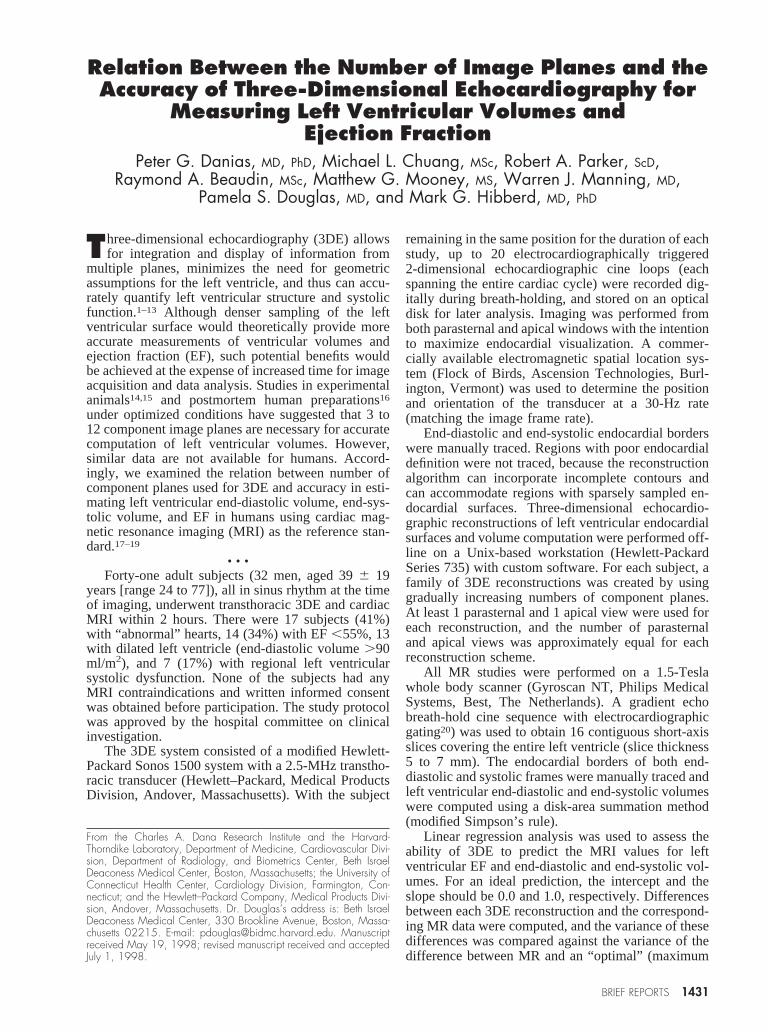
5 0.89 to 0.97 and 0.91 to 0.98,respectively) (Figure 1). Both the cor-relation coefficient (r) and the slopeincreased (toward 1.0) with increasingnumber of planes, while the interceptvalues conversely declined, approach-ing 0.0. The minimum number ofplanes that provided 3DE reconstruc-tions that consistently yielded slopesnot statistically significantly differentfrom 1.0 and intercepts not statisticallysignificantly different from 0.0 was the10-plane reconstruction (regressionequations: end-diastolic volumeMRI 50.943 end-diastolic volume3DE 1 10.6,and end-systolic volumeMRI 5 0.97 3end-systolic volume3DE 1 2.7). Thevariability of the mean difference fromMRI values (standard deviation of themean differences) and therefore the cor-responding F ratios markedly decreasedwith increasing numbers of planes (Fig-ure 2). The variability of the differencesfrom MRI values was consistentlynotstatistically significantly different fromthose of an optimal 3DE reconstruction,when$10 planes were used.
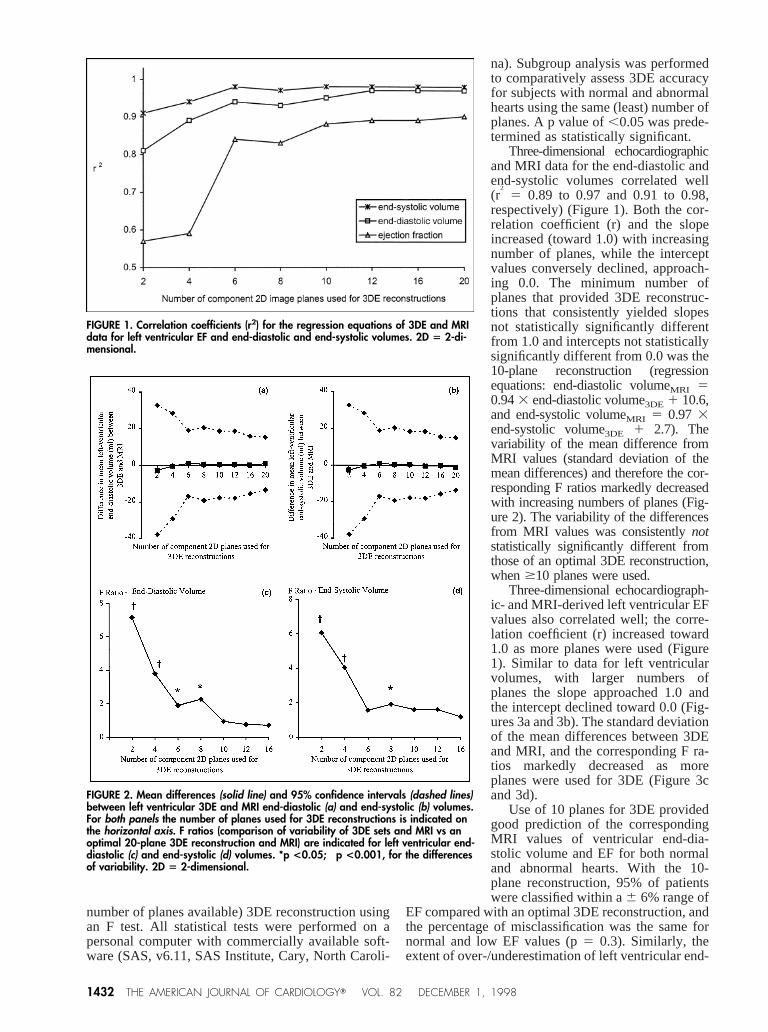
Three-dimensional echocardiograph-ic- and MRI-derived left ventricular EFvalues also correlated well; the corre-lation coefficient (r) increased toward1.0 as more planes were used (Figure1). Similar to data for left ventricularvolumes, with larger numbers ofplanes the slope approached 1.0 andthe intercept declined toward 0.0 (Fig-ures 3a and 3b). The standard deviationof the mean differences between 3DEand MRI, and the corresponding F ra-tios markedly decreased as moreplanes were used for 3DE (Figure 3cand 3d).
Use of 10 planes for 3DE providedgood prediction of the correspondingMRI values of ventricular end-dia-stolic volume and EF for both normaland abnormal hearts. With the 10-plane reconstruction, 95% of patientswere classified within a6 6% range of
EF compared with an optimal 3DE reconstruction, andthe percentage of misclassification was the same fornormal and low EF values (p5 0.3). Similarly, theextent of over-/underestimation of left ventricular end-
FIGURE 1. Correlation coefficients (r2) for the regression equations of 3DE and MRIdata for left ventricular EF and end-diastolic and end-systolic volumes. 2D 5 2-di-mensional.
FIGURE 2. Mean differences (solid line) and 95% confidence intervals (dashed lines)between left ventricular 3DE and MRI end-diastolic (a) and end-systolic (b) volumes.For both panels the number of planes used for 3DE reconstructions is indicated onthe horizontal axis. F ratios (comparison of variability of 3DE sets and MRI vs anoptimal 20-plane 3DE reconstruction and MRI) are indicated for left ventricular end-diastolic (c) and end-systolic (d) volumes. *p <0.05; †p <0.001, for the differencesof variability. 2D 5 2-dimensional.
1432 THE AMERICAN JOURNAL OF CARDIOLOGYT VOL. 82 DECEMBER 1, 1998
diastolic volume compared with optimal 3DE wassimilar for normal and dilated ventricles (p5 1.0).
• • •In this study of 3DE in humans, we describe the
relation between the number of component planesused for left ventricular reconstructions and accuracyin measurement of ventricular volumes and EF, com-pared with both MRI (reference standard) and with anoptimal (20-plane) 3DE study. Although larger num-bers of planes improved the accuracy of all measuredvalues (relative to MR), the incremental improvement(relative to the optimal 3DE) was of little significancewhen$10 planes were used.
In early studies of two-dimensional echocardiog-raphy, Weiss et al14 used an isolated ejecting canineheart preparation, and found that 3 to 5 ideally posi-tioned short-axis planes provided accurate estimationof left ventricular volumes. However, despite the ini-tial promising results in animals, a similar approach (5short-axis and 2 long-axis views) used in 4 humans
was significantly significant from cathe-terization data.21 In a more recent 3DEstudy, Siu et al15 reported that 8 to 12planes are needed for accurate measure-ment of left ventricular volumes. Theyrecognized, however, that a major limi-tation of their study was that it was per-formed in open-chest experimental ani-mals, in which heart rate and respiratoryvariation were minimized and endocar-dial border detection was optimized. Inanother study by Krebs et al,16 siliconerubber casts of normal and distortedpostmortem human ventricles were im-aged by 3DE using a multiplanar probewith a central rotational axis. In thatstudy, the point of rotation was arbi-trarily selected by the investigators, whoconcluded that 9 echo cross sections pro-vided optimal precision in measuring thecast volumes. Although similar system-atic studies in humans are lacking, sev-eral studies have shown high accuracy of3DE with a small number8–14 of compo-nent planes, using short-axis views eitherexclusively,3 preferentially,6–9 or by anapproximately even combination of short-and long-axis views.10,11
In using a system that is practical forclinical use, our results are in accord withprevious data and extend their signifi-cance to clinical practice. Similar find-ings in subjects with normal and abnor-mal heart structure and/or systolic func-tion in our study suggest that our findingsare robust and widely applicable. Use ofincreasing numbers of imaging planesimproves 3DE accuracy by decreasingthe confidence intervals when comparedwith cardiac MRI. Therefore, the likeli-hood that any one patient would have
values significantly different from MRI values de-creases as the number of planes used for 3DE in-creases. For determination of left ventricular EF using10 image planes, 95% of patients will have a calcu-lated EF that is within66% of the value that would beobtained using an optimal 3DE reconstruction. Forcomparison, 6- and 16-plane 3DE would have thesame accuracy in 68% and 98% of patients, respec-tively.
Our results may not be applicable to other 3DEsystems using single acoustic imaging windows, al-though previous studies using different 3DE sys-tems3,6–11have shown good accuracy using a similarnumber of planes. Additional images convey littlefurther information and add small and statisticallyinsignificant incremental accuracy, possibly due toredundant oversampling of the same left ventricularregions. We propose that for clinical purposes, if bothparasternal and apical views are used for 3DE, aminimum of 10 planes suffices for accurate 3DE as-sessment of left ventricular volumes and EF.
FIGURE 3. Left ventricular EF. For a to d, the number of planes used for 3DE re-constructions is indicated on the horizontal axis. (a), intercept values (bias) fromthe regression equations between MRI- and 3DE-measured values, plottedagainst the number of planes used for 3DE reconstructions. *p <0.05 and †p<0.001, for the differences of calculated intercept values from zero. (b), slopesof the regression lines predicting MRI (reference standard) using 3DE, plottedagainst the number of planes used for 3DE reconstructions. *p <0.05; †p<0.001, for the differences of calculated slope values from unity. (c), mean dif-ferences (solid line) and 95% confidence intervals (dashed lines) between valuesfor the various 3DE reconstructions and MRI. (d), F ratios (comparison of vari-ability of 3DE sets and MRI vs an optimal 20-plane 3DE reconstruction and MRI).*p <0.05; †p <0.001, for the differences of the variability. 2D 5 2-dimen-sional.
BRIEF REPORTS 1433
In summary, use of >10 component imageplanes from both parasternal and apical windowsprovides 3DE reconstructions that predict mag-netic resonance imaging–measured left ventricularend-diastolic volume, end-systolic volume, andejection fraction with a high degree of accuracy.
1. Levine RA, Weyman AE, Handschumacher MD. Three-dimensional echocar-diography: techniques and applications.Am J Cardiol 1992;69:121H–130H;131H–134H.2. Schwartz SL, Cao QL, Azevedo J, Pandian NG. Simulation of intraoperativevisualization of cardiac structures and study of dynamic surgical anatomy withreal-time three-dimensional echocardiography.Am J Cardiol1994;73:501–507.3. Siu SC, Rivera JM, Guerrero JL, Handschumacher MD, Lethor JP, WeymanAE, Levine RA, Picard MH. Three-dimensional echocardiography. In vivo val-idation for left ventricular volume and function.Circulation 1993;88:1715–1723.4. Siu SC, Levine RA, Rivera JM, Xie SW, Lethor JP, Handschumacher MD,Weyman AE, Picard MH. Three-dimensional echocardiography improves non-invasive assessment of left ventricular volume and performance.Am Heart J1995;130:812–822.5. Jiang L, de Prada JAV, Handschumacher MD, Vuille C, Guererro JL, PicardMH, Joziatis JT, Fallon JT, Weyman AE, Levine RA. Quantitative three-dimen-sional reconstruction of aneurysmal left ventricles. In vitro and in vivo validation.Circulation 1995;91:222–230.6. Eaton LW, Maughan WL, Shoukas AA, Weiss JL. Accurate volume determi-nation in the isolated ejecting canine left ventricle by two-dimensional echocar-diography.Circulation 1979;60:320–326.7. Ariet M, Geiser EA, Lupkiewicz SM, Conetta DA, Conti RC. Evaluation of athree-dimensional reconstruction to compute left ventricular volume and mass.Am J Cardiol1984;54:415–420.8. Martin RW, Bashein G. Measurement of stroke volume with three-dimensionaltransesophageal ultrasonic scanning: comparison with thermodilution measure-ment.Anesthesiology1989;70:470–476.9. Schneider AT, Hsu TL, Schwartz SL, Pandian NG. Single, biplane, multiplane,and three-dimensional transesophageal echocardiography. Echocardiographic-anatomic correlations.Cardiol Clin 1993;11:361–387.10. Gopal AS, Keller AM, Rigling R, King DL Jr, King DL. Left ventricularvolume and endocardial surface area by three-dimensional echocardiography:
comparison with two-dimensional echocardiography and nuclear magnetic reso-nance imaging in normal subjects.J Am Coll Cardiol1993;22:258–270.11. Sapin PM, Schroder KM, Gopal AS, Smith MD, DeMaria AN, King DL.Comparison of two- and three-dimensional echocardiography with cineventricu-lography for measurement of left ventricular volume in patients.J Am CollCardiol 1994;24:1054–1063.12. King DL, Gopal AS, Keller AM, Sapin PM, Schro¨der KM. Three-dimen-sional echocardiography. Advances for measurement of ventricular volume andmass.Hypertension1994;23(suppl I):I-172–179.13. Gopal AS, Shen Z, Sapin PM, Keller AM, Schnellbaecher MJ, LeibowitzDW, Akinboboye OO, Rodney RA, Blood DK, King DL. Assessment of cardiacfunction by three-dimensional echocardiography compared with conventionalnoninvasive methods.Circulation 1995;92:842–953.14. Weiss JL, Eaton LW, Kallman CH, Maughan WL. Accuracy of volumedetermination by two-dimensional echocardiography: defining requirements un-der controlled conditions in the ejecting canine left ventricle.Circulation 1983;67:889–895.15. Siu SC, Rivera JM, Handschumacher MD, Weyman AE, Levine RA, PicardMH. Three-dimensional echocardiography: the influence of number of compo-nent images on accuracy of left ventricular volume quantitation.J Am SocEchocardiogr1996;9:147–155.16. Krebs W, Klues HG, Steinert S, Sivarajan M, Job FP, Flachskampf FA,Franke A, Reineke T, Hanrath P. Left ventricular volume calculations using amultiplanar transesophageal echoprobe; in vitro validation and comparison withbiplane angiography.Eur Heart J1996;17:1279–1288.17. Higgins CB, Byrd BF II, McNamara MT, Lanzer P, Lipton MJ, Botvinick E,Schiller NB, Crooks LE, Kaufman L. Magnetic resonance imaging of the heart:a review of the experience in 172 subjects.Radiology1985;155:671–679.18. Nazarian GK, Julsrud PR, Ehman RL, Edwards WD. Correlation betweenmagnetic resonance imaging of the heart and cardiac anatomy.Mayo Clin Proc1987;62:573–583.19. Cranney GB, Lotan CS, Dean L, Baxley W, Bouchard A, Pohost GM. Leftventricular volume measurement using cardiac axis nuclear magnetic resonanceimaging. Validation by calibrated ventricular angiography.Circulation 1990;82:154–163.20. Chuang ML, Chen MH, Khasgiwala VC, McConnell MV, Edelman RR,Manning WJ. Adaptive correction of imaging plane position in segmented k-space cine cardiac MR imaging.J Magn Reson Imaging1997;7:811–814.21. Geiser EA, Ariet M, Conetta DA, Lupkiewicz SM, Christi LG Jr, Conti CR.Dynamic three-dimensional echocardiographic reconstruction of the intact humanleft ventricle: technique and initial observations in patients.Am Heart J1982;103:1056–1065.
Location of Stents in the Left Anterior DescendingCoronary Artery Using Three Dimensionally
Acquired, Two Dimensionally DisplayedTransthoracic Echocardiography
William C. Maxted, Jr., MD, Susan T. Swanson, RDCS, Melinda Huntley,Douglas S. Segar, MD, Stephen G. Sawada, MD, and Harvey Feigenbaum, MD
There has been a recent study suggesting that 2-di-mensional (2-D) transthoracic echocardiographic
coronary artery examinations may be useful in iden-tifying patients with coronary artery disease by mea-suring the thickness of the walls of the left anteriordescending artery (LAD).1 A problem with this ap-proach is capturing a small, moving artery with asingle 2-D scan. Acquiring a 3-dimensional (3-D)block of tissue and sampling with serial 2-D slicesincreases the possibility of interrogating the coronary
arteries. This 3D/2D approach holds great promise inenhanced visualization of the proximal, mid-, andeven distal LAD. It can be difficult to identify theLAD with this new 3D/2D approach because multipleechoes in and near the interventricular septum cansimulate a coronary artery. Thus, we considered itimportant to verify the location of the LAD. Thisstudy was designed to use an LAD stent as a means ofverifying the location of the LAD with the 3D/2Dapproach.
• • •Three-D/2D echocardiograms of 13 consecutive
patients with LAD stents were reviewed. The echo-cardiograms were recorded between August 1995 andSeptember 1996. Images were obtained with a 3- to5-MHz broad-band, phased-array transducer in com-bination with an HDI 3000 echograph (Advanced
From the Division of Cardiology, Indiana University Medical Center/Krannert Institute of Cardiology, Indianapolis, Indiana. Dr. Feigen-baum’s address is: Indiana University Hospital, Room 5420, 550North University Boulevard, Indianapolis, Indiana, 46202-5250. E-mail: [email protected]. Manuscript received May 11, 1998;revised manuscript received and acepted July 1, 1998.
1434 ©1998 by Excerpta Medica, Inc. 0002-9149/98/$19.00All rights reserved. PII S0002-9149(98)00653-5