Embed Size (px)
Citation preview

Department of Education
REHABILITATION SERVICES AND DISABILITY RESEARCH
Fiscal Year 2010 Budget Request
CONTENTS
Page Appropriations Language........................................................................................................... J-1 Analysis of Language Provisions and Changes......................................................................... J-2 Amounts Available for Obligation...............................................................................................J-3 Obligations by Object Classification........................................................................................... J-4 Summary of Changes ................................................................................................................ J-5 Authorizing Legislation............................................................................................................... J-6 Appropriations History................................................................................................................ J-8 Summary of Request ................................................................................................................. J-9 Activities:
Vocational rehabilitation State grants................................................................................. J-12 Client assistance State grants............................................................................................ J-28 Training .............................................................................................................................. J-33 Demonstration and training programs................................................................................ J-39 Migrant and seasonal farmworkers .................................................................................... J-43 Recreational programs....................................................................................................... J-47 Protection and advocacy of individual rights ...................................................................... J-50 Projects with industry .........................................................................................................J-54 Supported employment State grants.................................................................................. J-61 Independent living .............................................................................................................. J-66 Program improvement........................................................................................................ J-78 Evaluation .......................................................................................................................... J-84 Helen Keller National Center.............................................................................................. J-90 National Institute on Disability and Rehabilitation Research.............................................. J-97 Assistive technology......................................................................................................... J-112
State Tables........................................................................................................................... J-119

REHABILITATION SERVICES AND DISABILITY RESEARCH
J-1
Appropriations Language
For carrying out, to the extent not otherwise provided, the Rehabilitation Act of 1973, the
Assistive Technology Act of 1998, and the Helen Keller National Center Act, [$3,387,762,000:
Provided, That $3,088,000 shall be used for the projects, and in the amounts specified under
heading ‘Rehabilitation Services and Disability Research in the explanatory statement described
in section 4 (in the matter preceding division A of this consolidated Act)] 1 $3,500,735,000.
(Department of Education Appropriations Act, 2009)
Note.—Each language provision that is followed by a footnote reference is explained in the Analysis of Language Provisions and Changes document which follows the appropriation language.

REHABILITATION SERVICES AND DISABILITY RESEARCH
J-2
Analysis of Language Provisions and Changes
Language Provision Explanation
1 [: Provided, That $3,088,000 shall be used for the projects, and in the amounts, specified under the heading `Rehabilitation Services and Disability Research' in the explanatory statement described in section 4 (in the matter preceding division A of this consolidated Act)]
This language, which earmarks funds for specified projects under Demonstration and Training programs, is deleted because no funding is proposed for these projects in fiscal year 2010.

REHABILITATION SERVICES AND DISABILITY RESEARCH
J-3
Amounts Available for Obligation ($000s)
2008 2009 2010
Discretionary appropriation:
Appropriation $409,886 $413,127 $416,039 Across-the-board reduction -7,161 0 0
Subtotal, discretionary appropriation 402,725 413,127 416,039
Recovery Act supplemental (P.L. 111-5) 0 680,000 0
Subtotal, adjusted discretionary appropriation 402,725 1,093,127 416,039
Mandatory appropriation 2,874,043 2,974,635 3,084,696
Subtotal, discretionary and mandatory
appropriation 3,276,768 4,067,762 3,500,735
Recovery Act unobligated balance, start of year 0 0 87,500 Recovery Act unobligated balance, end of year 0 -87,500 0
Subtotal, obligations 3,276,768 3,387,762 3,500,735 Subtotal, Recovery Act obligations 0 592,590 87,500
Total, direct obligations 3,276,768 3,980,352 3,588,235

REHABILITATION SERVICES AND DISABILITY RESEARCH
J-4
Obligations by Object Classification ($000s)
2008 2009 2010
Contractual services and supplies:
Advisory and assistance services ................... $8,828 $10,374 $10,089 Peer review ..................................................... 523 867 779 Peer review, Recovery Act............................... 0 90 0 Other services.................................................. 120 0 0 Purchases of goods and services ................... 541 558 558
Subtotal ............................................ 10,012 11,889 11,426 Grants, subsidies, and contributions .................. 3,266,755 3,375,963 3,489,309 Grants, Recovery Act.......................................... 0 592,500 87,500 Interest payments ............................................... 1 0 0
Subtotal, obligations .................................. 3,276,768 3,387,762 3,500,735 Subtotal, Recovery Act obligations ............ 0 592,590 87,500
Total obligations............................................... 3,276,768 3,980,352 3,588,235

REHABILITATION SERVICES AND DISABILITY RESEARCH
J-5
Summary of Changes ($000s)
2009 .......................................................................................... $3,387,762 Recovery Act (non-add) ................................................................ (680,000) 2010 .......................................................................................... 3,500,735 Net change............................................... +112,973
Change 2009 base from base
Increases: Built in: Statutorily mandated increase in funding for Vocational Rehabilitation (VR) State grants. $2,974,635 +$110,061 Program: Increase in funding for Centers for Independent Living to assist individuals with disabilities to live independently and participate fully in all aspects of their communities. 77,266 +3,000 Increase in funding for Program Improvement to address the technical assistance needs of State VR agencies. 622 +230 Increase in funding for the National Institute on Disability and Rehabilitation Research to conduct demonstrations of promising models of postsecondary education programs for students with intellectual disabilities. 107,741 +3,000
Subtotal, increases +116,291
Decreases: Program: Decrease in funding for Demonstration and Training programs reflects the elimination of funding for earmarked projects. 9,594 -3,088 Decrease in funding for the Evaluation program to reflect current plans. 1,447 -230 Subtotal, decreases -3,318 Net change +112,973

REHABILITATION SERVICES AND DISABILITY RESEARCH
J-6
Authorizing Legislation ($000s)
2009 2009 2010 2010 Activity Authorized Estimate Authorized Request
Vocational rehabilitation State grants: Grants to States (RA-I A, B-110 and 111) 0 1,2 $2,938,522 0 1,3 $3,047,247 Grants for Indians (RA-I-C) --- 2,4 36,113 --- 3,4 37,449
Client assistance State grants (RA-I-112) 0 1 11,576 0 1 11,576 Training (RA-III-302) 0 1 37,766 0 1 37,766 Demonstration and training programs (RA-III-303(b)-(d)) 0 1 9,594 0 1 6,506 Migrant and seasonal farmworkers (RA-III-304) 0 1 2,239 0 1 2,239 Recreational programs (RA-III-305) 0 1 2,474 0 1 2,474 Protection and advocacy of individual rights (RA-V-509) 0 1 17,101 0 1 17,101 Projects with industry (RA-VI-A) 0 1 19,197 0 1 19,197 Supported employment State grants (RA-VI-B) 0 1 29,181 0 1 29,181 Independent living:
State grants (RA-VII-1-B) 0 1 23,450 0 1 23,450 Centers (RA-VII-1-C) 0 1 77,266 0 1 80,266 Services for older blind individuals (RA-VII-2) 0 1 34,151 0 1 34,151
Program improvement (RA-12(a)) 0 1 622 0 1 852 Evaluation (RA-14) 0 1 1,447 0 1 1,217 Helen Keller National Center for
Deaf-Blind Youths and Adults (HKNCA) 0 1 8,362 0 1 8,362 National Institute on Disability and Rehabilitation
Research (RA-II) 0 1 107,741 0 1 110,741 Assistive technology: (ATA) Assistive technology programs (ATA-4,5, and 6) Indefinite 5 30,960 Indefinite 5 30,960 Recovery Act - Vocational rehabilitation State grants (RA-I A, B-110 and 111) (non-add) 0 1 (540,000) 0 1 (0) Recovery Act – Centers for Independent Living (RA-VII-1-C) (non-add) 0 1 (140,000) 0 1 (0)
J-6

REHABILITATION SERVICES AND DISABILITY RESEARCH
Authorizing Legislation—continued ($000s)
J-7
2009 2009 2010 2010 Activity Authorized Estimate Authorized Request Unfunded authorizations: Demonstration projects to increase client choice (RA-III-303(a)) 0 6 0 0 7 0 Total definite authorization Total appropriation $3,387,762 $3,500,735 Portion of request subject to reauthorization 3,469,775
1 The GEPA extension expired September 30, 2004; the program was authorized in FY 2009 through appropriations language. Continued funding is proposed for this program in FY 2010 through appropriations language.
2 The authorizing legislation mandates funding for VR State grants at least at the level of $2,974,635 thousand, which is the 2008 appropriation adjusted by the 12-month change in the Consumer Price Index for all Urban Consumers (CPIU) published in October 2007.
3 The authorizing legislation mandates funding for the VR State grants at least at the level of $3,084,696 thousand, which is the 2009 appropriation adjusted by the12-month change in the Consumer Price Index for all Urban Consumers (CPIU) published in October 2008.
4 The Rehabilitation Act requires that 1.0 percent to 1.5 percent of the appropriation for Vocational Rehabilitation State grants be set aside for Grants for Indians.
5Such sums as are necessary are authorized, however up to $1,235 thousand may be used for section 6 National Activities, unless the amount available for section 4 AT State grants exceeds $20,953,534, in which case up to $1,900 thousand may be used for section 6.
6The GEPA extension expired September 30, 2004. The Administration is not proposing to fund this program through appropriations language
J-7

REHABILITATION SERVICES AND DISABILITY RESEARCH
J-8
Appropriations History ($000s)
Budget Estimate House Senate to Congress Allowance Allowance Appropriation 2001 $2,798,651 $2,776,803 $2,799,519 $2,805,339 2002 2,930,117 2,942,117 2,932,617 2,945,813 2003 3,001,840 2,956,676 2,959,838 2,953,633 Transfer 0 0 0 -587 Technical correction 0 0 0 +487 2004 3,002,913 2,999,165 3,004,360 3,011,270
2005 3,047,197 3,054,587 3,077,328 3,074,574 2006 3,059,298 3,128,638 3,133,638 3,125,544 2007 3,180,414 N/A 1 N/A 1 3,242,512 2008 3,184,263 3,279,743 3,286,942 3,276,768 2009 3,218,264 3,387,443 2 3,379,109 2 3,387,762 Recovery Act Supplemental (PL 111-5) 0 700,000 610,000 680,000 2010 3,500,735
1 This account operated under a full-year continuing resolution (P.L. 110-5). House and Senate Allowance amounts are shown as N/A (Not Available) because neither body passed a separate appropriations bill.
2 The levels for the House and Senate allowances reflect action on the regular annual 2009 appropriation bill, which proceeded in the 110th Congress only through the House Subcommittee and the Senate Committee.

DEPARTMENT OF EDUCATION FISCAL YEAR 2010 PRESIDENT'S REQUEST
(in thousands of dollars) 2010Category 2008 2009 President's
Office, Account, Program and Activity Code Appropriation Appropriation Request Amount Percent
Rehabilitation Services and Disability Research
1. Vocational rehabilitation State grants:(a) Grants to States (RA I Part A, sections 110 and 111) M 2,839,151 2,938,522 3,047,247 108,725 3.7%(b) Grants to Indians (RA I-C) M 34,892 36,113 37,449 1,336 3.7%
Subtotal 2,874,043 2,974,635 3,084,696 110,061 3.7%Discretionary D 0 0 0 0 ---Mandatory baseline M 2,874,043 2,974,635 3,084,696 110,061 3.7%
2. Client assistance State grants (RA section 112) D 11,576 11,576 11,576 0 0.0%3. Training (RA section 302) D 37,766 37,766 37,766 0 0.0%4. Demonstration and training programs (RA section 303) D 10,151 9,594 6,506 (3,088) -32.2%5. Migrant and seasonal farmworkers (RA section 304) D 2,239 2,239 2,239 0 0.0%6. Recreational programs (RA section 305) D 2,474 2,474 2,474 0 0.0%7. Protection and advocacy of individual rights (RA section 509) D 16,201 17,101 17,101 0 0.0%8. Projects with industry (RA VI-A) D 19,197 19,197 19,197 0 0.0%9. Supported employment State grants (RA VI-B) D 29,181 29,181 29,181 0 0.0%
10. Independent living (RA VII):(a) State grants (Chapter 1, Part B) D 22,193 23,450 23,450 0 0.0%(b) Centers (Chapter 1, Part C) D 73,334 77,266 80,266 3,000 3.9%(c) Services for older blind individuals (Chapter 2) D 32,320 34,151 34,151 0 0.0%
11. Program improvement (RA section 12(a)) D 622 622 852 230 37.0%12. Evaluation (RA section 14) D 1,447 1,447 1,217 (230) -15.9%13. Helen Keller National Center for Deaf-Blind Youths and Adults (HKNCA) D 8,362 8,362 8,362 0 0.0%14. National Institute on Disability and Rehabilitation Research (RA II) D 105,741 107,741 110,741 3,000 2.8%15. Assistive technology programs (ATA, sections 4, 5, and 6) D 29,920 30,960 30,960 0 0.0%
Subtotal 402,725 413,127 416,039 2,912 0.7%
Total 3,276,768 3,387,762 3,500,735 112,973 3.3%Discretionary D 402,725 413,127 416,039 2,912 0.7%Mandatory baseline M 2,874,043 2,974,635 3,084,696 110,061 3.7%
Outlays, Total 3,242,297 3,699,404 3,488,751 (210,653) -5.7%Discretionary D 401,753 692,577 435,258 (257,319) -37.2%Mandatory baseline M 2,840,544 3,006,827 3,053,493 46,666 1.6%
Rehabilitation Services and Disability Research, Recovery Act
1. Vocational rehabilitation State grants:(a) Grants to States (RA I Part A, sections 110 and 111) D 0 540,000 0 (540,000) -100.0%(b) Grants to Indians (RA I-C) D 0 0 0 0 ---
2. Independent living (RA VII):(a) State grants (Chapter 1, Part B) D 0 18,200 0 (18,200) -100.0%(b) Centers (Chapter 1, Part C) D 0 87,500 0 (87,500) -100.0%(c) Services for older blind individuals (Chapter 2) D 0 34,300 0 (34,300) -100.0%
Total D 0 680,000 0 (680,000) -100.0%
Outlays D 0 214,600 356,400 141,800 66.1%
NOTES: Category Codes are as follows: D = discretionary program; M = mandatory program. FY 2008 detail may not add to totals due to rounding.
Change from2009 Appropriation

REHABILITATION SERVICES AND DISABILITY RESEARCH
Summary of Request
J-10
The Rehabilitation Services and Disability Research account supports formula grants to States for vocational rehabilitation (VR) services and a variety of smaller research, demonstration, and service programs, including the programs authorized under the Helen Keller National Center Act and the Assistive Technology Act of 1998 (the AT Act). The purpose of the programs in this account is to develop and implement, through research, training, and direct services, comprehensive and coordinated programs of vocational rehabilitation and independent living services for individuals with disabilities.
The Administration is conducting a comprehensive review of Federal job training programs to assess their effectiveness. This review will inform the Administration’s proposals for reauthorization of the Workforce Investment Act and other statutes intended to help individuals prepare for successful employment.
The Administration’s $3.501 billion fiscal year 2010 request for the Rehabilitation Services and Disability Research account, an increase of $112.973 million from the 2009 level, supports the Department’s objective to prepare individuals with disabilities for higher education, employment, and productive independent lives.
The request includes $3.085 billion for the VR State Grants program, an increase of $110.061 million over the 2009 appropriation. The 3.7 percent increase is the amount necessary to satisfy the current law requirement to increase funding for the program by at least the percentage change in the Consumer Price Index for all Urban Consumers (CPIU) for the 12-month period ending in October 2008. These funds will assist States to strengthen the employment skills of VR consumers and increase the participation of individuals with disabilities in the general workforce. A total of $37.449 million would be set aside for grants for Indian tribes.
The Administration requests $110.741million for National Institute on Disability and Rehabilitation Research, an increase of $3 million over the 2009 appropriation. The increase would be used to support demonstration projects that implement promising models of postsecondary education programs for students with intellectual disabilities and evaluate the outcomes associated with these models.
The request includes $80.266 million for the Centers for Independent Living program, an increase of $3 million over 2009 level. The request would support the continuation of services that empower individuals with disabilities to live independently and participate fully in all aspects of their communities.
The Administration requests $852,000 for Program Improvement activities, an increase of $230,000 from the 2009 appropriation. Funds would be used to address technical assistance needs identified as a result of monitoring and program improvement activities, including activities initiated in fiscal years 2008 and 2009.
For the Evaluation program, $1.217 million is requested to continue support for evaluation activities begun in fiscal years 2008 and 2009 and to initiate 2 new evaluations.
The request includes $30.960 million, the same as the FY 2009 level, for programs authorized under the Assistive Technology (AT) Act State grant program. These programs enable

REHABILITATION SERVICES AND DISABILITY RESEARCH
Summary of Request
J-11
individuals to acquire technology they might not otherwise be able to obtain—technology that improves their quality of life, and in many cases, enables them to work or participate in other productive activities.
The $6.506 million request for the Demonstration and Training programs reflects the elimination of $3.088 million in fiscal year 2009 congressional earmarks. The Administration proposes to fund the remaining programs in the Rehabilitation Services and Disability Research account at the 2009 level.
The Rehabilitation Act requires that 1 percent of the aggregate funds appropriated for programs authorized in Titles II, III, VI, and VII be used for minority outreach activities. In fiscal year 2010, this amount would total $3.460 million, and we expect that the requirement would be implemented by reserving 1 percent of the funds provided for each of the specified programs.
REHABILITATION SERVICES AND DISABILITY RESEARCH
J-12
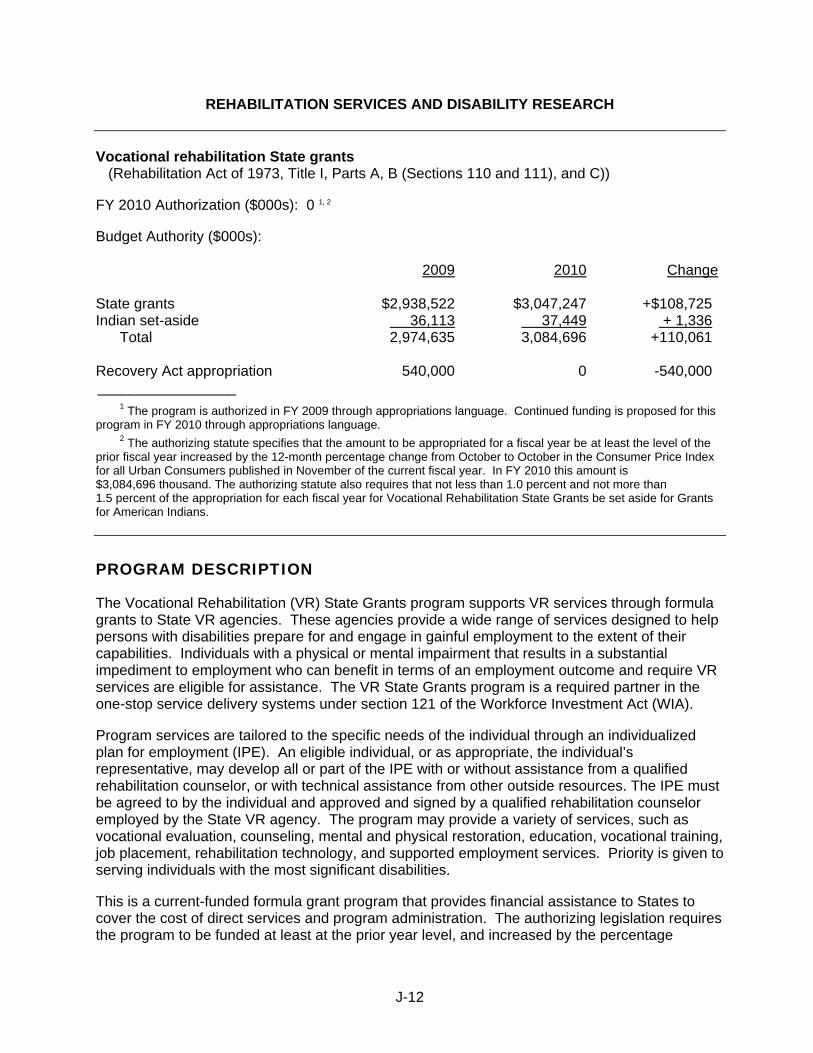
Vocational rehabilitation State grants (Rehabilitation Act of 1973, Title I, Parts A, B (Sections 110 and 111), and C))
FY 2010 Authorization ($000s): 0 1, 2
Budget Authority ($000s): 2009 2010 Change State grants $2,938,522 $3,047,247 +$108,725 Indian set-aside 36,113 37,449 + 1,336 Total 2,974,635 3,084,696 +110,061 Recovery Act appropriation 540,000 0 -540,000 _________________
1 The program is authorized in FY 2009 through appropriations language. Continued funding is proposed for this program in FY 2010 through appropriations language.
2 The authorizing statute specifies that the amount to be appropriated for a fiscal year be at least the level of the
prior fiscal year increased by the 12-month percentage change from October to October in the Consumer Price Index for all Urban Consumers published in November of the current fiscal year. In FY 2010 this amount is $3,084,696 thousand. The authorizing statute also requires that not less than 1.0 percent and not more than 1.5 percent of the appropriation for each fiscal year for Vocational Rehabilitation State Grants be set aside for Grants for American Indians.
PROGRAM DESCRIPTION
The Vocational Rehabilitation (VR) State Grants program supports VR services through formula grants to State VR agencies. These agencies provide a wide range of services designed to help persons with disabilities prepare for and engage in gainful employment to the extent of their capabilities. Individuals with a physical or mental impairment that results in a substantial impediment to employment who can benefit in terms of an employment outcome and require VR services are eligible for assistance. The VR State Grants program is a required partner in the one-stop service delivery systems under section 121 of the Workforce Investment Act (WIA).
Program services are tailored to the specific needs of the individual through an individualized plan for employment (IPE). An eligible individual, or as appropriate, the individual’s representative, may develop all or part of the IPE with or without assistance from a qualified rehabilitation counselor, or with technical assistance from other outside resources. The IPE must be agreed to by the individual and approved and signed by a qualified rehabilitation counselor employed by the State VR agency. The program may provide a variety of services, such as vocational evaluation, counseling, mental and physical restoration, education, vocational training, job placement, rehabilitation technology, and supported employment services. Priority is given to serving individuals with the most significant disabilities.
This is a current-funded formula grant program that provides financial assistance to States to cover the cost of direct services and program administration. The authorizing legislation requires the program to be funded at least at the prior year level, and increased by the percentage

REHABILITATION SERVICES AND DISABILITY RESEARCH Vocational rehabilitation State grants
J-13
increase in the Consumer Price Index for Urban Consumers (CPIU) over the past year. States may carry over unobligated Federal funds for an additional year, if a State has met all matching requirements for the fiscal year in which funds were appropriated.
An allotment formula that takes into account population and per capita income is used to distribute funds among the States. The fiscal year 2008 allotments were based on the July 1, 2006 population estimates published by the Census Bureau in December 2006. The fiscal year 2009 State allotments are based on the July 1, 2007 estimates published in December 2007. The fiscal year 2010 State distributions are based on the July 1, 2008 estimates released on December 22, 2008. Per capita income averages for fiscal year 2008 and 2009 were based on Bureau of Economic Analysis revised estimates for calendar years 2003, 2004, and 2005 as reported by the Department of Commerce on September 26, 2006. Per capita income averages for fiscal year 2010 are based on Bureau of Economic Analysis revised estimates for calendar years 2005, 2006, and 2007 as reported by the Department of Commerce on September 18, 2008. Fiscal year 2010 distributions are subject to minor revision if new population estimates become available for American Samoa, the Commonwealth of the Northern Mariana Islands, Guam, and the U.S. Virgin Islands.
Grant funds are administered by VR agencies designated by each State. There are currently a total of 80 State VR agencies. Thirty-two (32) States operate a “combined” agency serving all disability categories. Twenty-four (24) States operate a separate agency for individuals who are blind or visually impaired and a “general” agency for all other disability categories. The State matching requirement is 21.3 percent, except the State share is 50 percent for the cost of construction of a facility for community rehabilitation program purposes. States are required to maintain the level of State expenditures made under the State plan from non-Federal sources at least at the level spent during the fiscal year 2 years earlier. Each State is also required to reserve and use a portion of the Federal funds received under the VR State grant program for innovation and expansion activities authorized in section 101(a)(18).
Section 106 of the Rehabilitation Act requires the establishment of evaluation standards and performance indicators for the VR program that include outcome and related measures of program performance. Each State VR agency must report program performance data 60 days after the end of each fiscal year to determine if it is in compliance with the evaluation standards and performance indicators. A State agency failing to meet the standards must develop a program improvement plan outlining specific actions to be taken to improve program performance. The Department provides technical assistance to those State agencies that perform below the established evaluation standards to assist them to improve their performance.
The Rehabilitation Act requires that not less than 1.0 percent or more than 1.5 percent of the funds appropriated for the VR State grants program be set aside for grants under the American Indian VR Services program (section 121 of the Act). Service grants for up to 60 months are awarded to Indian tribes on a competitive basis to help tribes develop the capacity to provide VR services to American Indians with disabilities living on or near reservations.
Title VIII of the American Recovery and Reinvestment Act of 2009 (Recovery Act) provides additional funds, $540 million, for grants to States to carry out the VR Services program. These awards are in addition to the awards received under the regular FY 2009 appropriation for the

REHABILITATION SERVICES AND DISABILITY RESEARCH Vocational rehabilitation State grants
J-14
VR State Grants program. Together, these awards will constitute a State’s total FY 2009 allocation for the VR State Grants program. The Recovery Act funds will be allocated to State VR agencies under the program’s allotment formula. States received 50 percent of their Recovery Act allotment in March 2009 and will receive the remaining half by October 1, 2009. The Recovery Act funds for the VR State Grants program must be used to carry out the purposes and authorized activities consistent with the program’s statutory and regulatory requirements. These funds will remain available for obligation by State VR agencies until September 30, 2011. State VR agencies are not required to match these funds. Funding levels for the past 5 fiscal years were as follows: ($000s)
2005.......................................... $2,635,845 2006............................................ 2,720,192 2007............................................ 2,837,160 2008............................................ 2,874,043 2009............................................ 2,974,635 Recovery Act ................................. 540,000
FY 2010 BUDGET REQUEST
The Administration requests $3.085 billion to assist States and tribal governments to increase the participation of individuals with disabilities in the workforce. The requested increase of $110.061 million is the amount necessary to satisfy the current law requirement to increase funding for the program by at least the percentage increase in the CPIU for the 12-month period completed in October 2008.
The Vocational Rehabilitation (VR) State Grants program is the primary Federal vehicle for assisting individuals with disabilities, particularly individuals with the most significant disabilities, to prepare for, obtain, or retain employment. Although many people with disabilities are obtaining jobs and remaining employed, the unemployment rate for people with disabilities is still unacceptably high. For example, in its 2007 Annual Disability Status Report (2008), the Cornell University Rehabilitation and Research Center on Disability Demographics and Statistics reported results from the American Community Survey (U.S. Census Bureau, 2007) indicating that of those aged 21-64 (U.S. working age population), people with sensory, physical, mental, and/or self-care disabilities are much less likely to be employed (either full-time or part-time) than people without such disabilities (36.9 percent versus 79.7 percent respectively) and that only 21.2 percent of working-age individuals with disabilities were working full-time/full-year. In addition, the survey found that only 8.4 percent of working-age individuals with disabilities who were not working were actively looking for employment compared to 20.1 percent without such disabilities.
Nationally, there are about 1 million individuals with disabilities in various phases of the vocational rehabilitation process within the VR system. State VR agencies are facing numerous challenges. If a State VR agency cannot serve all eligible persons, it must serve first those individuals with the most significant disabilities under an “order of selection.” At the beginning of
REHABILITATION SERVICES AND DISABILITY RESEARCH Vocational rehabilitation State grants
J-15
fiscal year 2009, about half (55 percent) of the 56 general and combined State VR agencies were on an order of selection. In addition, about 21 percent of the 24 State VR agencies serving blind individuals were on an order of selection. In fiscal year 2008, there were 92,440 individuals with disabilities on the waiting list at some point during the year, 86 percent of whom were individuals with significant disabilities. During FY 2008, approximately 62,741 individuals were put on a waiting list prior to receiving services, 93 percent of whom were individuals with significant disabilities. At the end of fiscal year 2008, there were about 35,213 individuals on State agency waiting lists, 79 percent of whom were individuals with significant disabilities. However, the number of individuals on a waiting list varies considerably among State agencies operating under an order of selection. For example at the end of FY 2008, 15 agencies had 15 or fewer individuals on a waiting list, while 10 agencies had lists that ranged from just over 1,000 to 7,976 individuals.
The percentage of individuals with significant disabilities served by VR State agencies has increased annually since the 1992 reauthorization of the Rehabilitation Act, when about 70 percent of the individuals served were individuals with significant disabilities. Fiscal year 2008 caseload data show that 93 percent of the persons served by the program were individuals with significant disabilities. The percentage of individuals with significant disabilities as a proportion of all individuals with disabilities achieving an employment outcome has increased considerably (from 73.5 percent in fiscal year 1994 to 92 percent in fiscal year 2008). In addition, the percentage of individuals with disabilities obtaining competitive employment who are individuals with significant disabilities has increased annually from 78 percent in fiscal year 1997 to 92 percent in fiscal year 2007, the most recent year for which final data are available.
State VR agencies also play a major role under the Ticket to Work program administered by the Social Security Administration (SSA). Under this program, most Supplemental Security Income (SSI) recipients and Social Security Disability Insurance (SSDI) beneficiaries between the ages of 18 and 64 are offered a “ticket,” which they may use to obtain employment services, VR services, and other support services from an employment network of their choice to enable them to enter the workforce. State VR agencies have the option of participating in the Ticket to Work program as an employment network or remaining in the current reimbursement system, including the option to elect either payment method on a case-by-case basis. Under the current system, the VR program is reimbursed for the costs of services provided to SSDI and SSI beneficiaries with a single payment after the beneficiary performs substantial gainful activity (for 2009, earnings in excess of $980 per month for non-blind disabled beneficiaries and $1,640 per month for blind beneficiaries) for at least 9 consecutive months. As of February 9, 2009, about 91 percent of the 217,826 tickets that have been assigned have been assigned to State VR agencies, and only about 9 percent have been assigned to other employment networks. American Indian Vocational Rehabilitation Services
The Administration requests $37.49 million for grants under the American Indian Vocational Rehabilitation Services (AIVRS) program, an increase of $1.36 million over the 2009 level. The fiscal year 2010 requested set-aside of 1.2 percent of the amount requested for VR State grants is $6.603 million more than the minimum amount of funding required by law to be reserved for grants to American Indian tribes. The request will assist tribal governments to provide a program of VR services, in a culturally relevant manner, to American Indians with disabilities residing on

REHABILITATION SERVICES AND DISABILITY RESEARCH Vocational rehabilitation State grants
J-16
or near reservations. Fiscal year 2010 funds would be used to support 78 projects, including 25 new projects and 53 continuations.
PROGRAM OUTPUT MEASURES ($000s) Vocational rehabilitation State grants 2008 2009 2010
Individuals receiving services 1 985,472 990,000 1,000,000 Individuals with significant disabilities as a percent of all individuals receiving services
93% 93% 93%
Applicants Total number of cases closed 508,180 508,500 509,500
Individuals whose cases were closed and received VR services 353,875
354,000
355,120
Individuals achieving an employmentoutcome 2
205,021 205,500 207,000
Individuals with significant disabilities as a percent of all individuals achieving an employment outcome
92% 92% 92%
Note: Data for fiscal years 2008, 2009, and 2010 are projections based on actual data for fiscal years 2006 and
2007, and 2008 preliminary data from the RSA Quarterly Cumulative Caseload Report (RSA-113). Note: Projections for fiscal years 2009 and 2010 reflect the combination of the program’s regular appropriations and
the appropriation received under the Recovery Act. 1 Includes all eligible individuals who received VR services during the fiscal year. 2 Number of individuals who exited the program after receiving services and achieved an employment outcome.
American Indian vocational rehabilitation services 2008 2009
2010
Project funding: New project funding $11,074 $6,079 $12,898
Continuation funding 23,185 29,984 24,496
Forward funding 580 0 0
Peer review of new award applications 53
50
55
Number of projects:
New projects 24 15 25 Continuation 53 63 53
Total projects 77 78 78

REHABILITATION SERVICES AND DISABILITY RESEARCH Vocational rehabilitation State grants
J-17
PROGRAM PERFORMANCE INFORMATION Performance Measures This section presents selected program performance information, including, for example, GPRA goals, objectives, measures, and performance targets and data, and an assessment of the progress made toward achieving program results. Achievement of program results is based on the cumulative effect of the resources provided in previous years and those requested in FY 2010 and future years, and the resources and efforts invested by those served by this program.
Fiscal year 2008 data for the VR State Grants and the American Indian VR Services programs will be available in April of 2009. VR State Grants
Goal: Individuals with disabilities served by the Vocational Rehabilitation State Grant program will achieve high quality employment.
Objective: Ensure that individuals with disabilities who are served by the Vocational Rehabilitation State Grant program achieve employment consistent with their particular strengths, resources, abilities, capabilities, and interests.
Measure: Percentage of general and combined State VR agencies that assist at least 55.8 percent of individuals receiving services to achieve employment.
Year Target Actual 2005 75 71 2006 70 82 2007 71 82 2008 76 2009 78 2010 80
Measure: Percentage of State VR agencies for the Blind that assist at least 68.9 percent of individuals receiving services to achieve employment.
Year Target Actual 2005 75 54 2006 70 63 2007 65 63 2008 66 2009 66 2010 67
Assessment of progress: This measure assesses the performance of State VR agencies in meeting program performance indicator 1.2 established in program regulations pursuant to Section 106 of the Rehabilitation Act. Indicator 1.2 measures the percentage of individuals who

REHABILITATION SERVICES AND DISABILITY RESEARCH Vocational rehabilitation State grants
J-18
the State VR agency determines to have achieved an employment outcome out of all the individuals who exit the VR program after receiving services. In order to pass indicator 1.2, a general or combined agency must achieve an employment outcome rate of 55.8 percent, while an agency for the blind must achieve a rate of 68.9 percent. Targets for fiscal year 2006 and future years were adjusted in 2004 to reflect declines in the number of employment outcomes from 2001 to 2004, due, in part, to labor market conditions and to the elimination of extended employment as an acceptable employment outcome.
The percentage of agencies meeting the performance criterion for this measure in 2007 was the same as in the prior year for both general and combined State VR agencies and State VR agencies for individuals who are blind. In 2007, 46 of the 56 general and combined agencies (82 percent) and 15 of the 24 agencies for the blind (63 percent) met their respective performance criteria. However, there were changes in performance among State agencies. For example, 3 of the 56 general and combined agencies raised their performance to meet the criterion, while the performance of 3 other agencies that met the criterion in 2006 fell below the criterion in 2007.
Measure: Percentage of general and combined State VR agencies that assist at least 85 percent of individuals with employment outcomes to achieve competitive employment.
Year Target Actual 2005 89 95 2006 96 96 2007 96 96 2008 96 2009 97 2010 97
Measure: Percentage of State VR agencies for the Blind that assist at least 65 percent of individuals with employment outcomes to achieve competitive employment.
Year Target Actual 2005 54 75 2006 71 79 2007 75 79 2008 79 2009 79 2010 80
Assessment of progress: This measure is derived from Section 106 performance indicator 1.3, which measures the percentage of individuals who achieve competitive employment of all individuals who achieve employment. Competitive employment is defined under the State VR program as work in the competitive labor market that is performed on a full-time or part-time basis in an integrated setting, and for which an individual is compensated at or above the minimum wage, but not less than the customary wage and level of benefits paid by the employer for the same or similar work performed by individuals who are not disabled. In order to pass
REHABILITATION SERVICES AND DISABILITY RESEARCH Vocational rehabilitation State grants
J-19
indicator 1.3, a general or combined agency must achieve a rate of 72.6 percent, while an agency for the blind must achieve a rate of 35.4 percent. In fiscal year 2006, all of the general and combined agencies (with the exception of two of the territories) and 96 percent of the agencies for the blind passed this indicator.
The GPRA measure is more ambitious and has a higher performance criterion as compared to the State VR agency performance indicator 1.3. Under this measure, general and combined agencies must assist at least 85 percent of individuals with employment outcomes to achieve competitive employment, and agencies for the blind must assist at least 65 percent of individuals with employment outcomes to achieve competitive employment. Although on a national level the total number of employment outcomes has been declining, States have achieved an increase in the percentage of competitive employment outcomes and exceeded performance targets for the past 3 fiscal years. The percent of agencies for the blind that met the performance criterion increased significantly from 54 in 2003 to 71 in 2005. Their target for 2006 was raised from 56 to 71 percent to reflect this increase.
In 2006 and 2007, 96 percent of general and combined agencies met the performance criterion. Similarly, 79 percent of agencies for the blind met the performance criterion in both in 2006 and 2007, exceeding the targets. Excluding the territories, the percentage of individuals with employment outcomes who achieved competitive employment reported by general and combined agencies in 2007 ranged from 89.6 percent to 100 percent with a median of 98.0 percent. Excluding one agency with a rate of 25 percent, the percentage of individuals with employment outcomes who achieved competitive employment reported by agencies for the blind ranged from 53.7 percent to 100 percent in 2007 with a median of 87.9 percent.
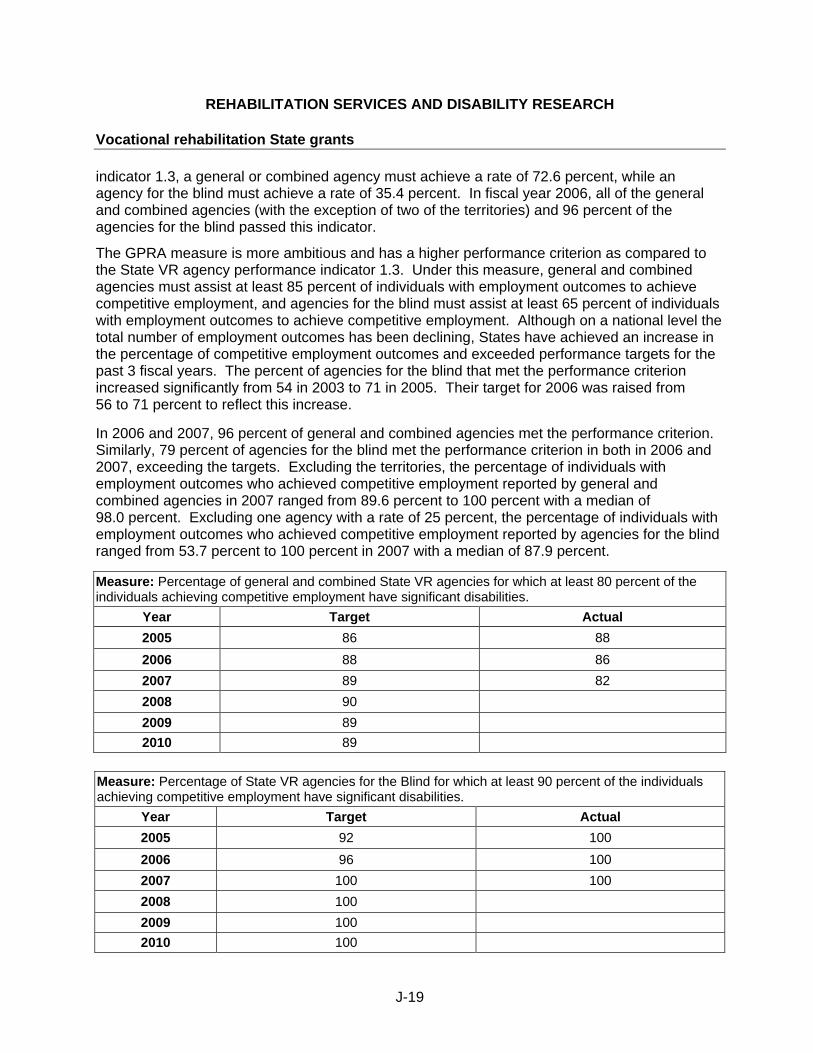
Measure: Percentage of general and combined State VR agencies for which at least 80 percent of the individuals achieving competitive employment have significant disabilities.
Year Target Actual 2005 86 88 2006 88 86 2007 89 82 2008 90 2009 89 2010 89
Measure: Percentage of State VR agencies for the Blind for which at least 90 percent of the individuals achieving competitive employment have significant disabilities.
Year Target Actual 2005 92 100 2006 96 100 2007 100 100 2008 100 2009 100 2010 100

REHABILITATION SERVICES AND DISABILITY RESEARCH Vocational rehabilitation State grants
J-20
Assessment of progress: This measure is derived from the Section 106 performance indicator 1.4, which measures the percentage of individuals achieving competitive employment who have significant disabilities. In order for a general or combined agency to pass this indicator, at least 62.2 percent of individuals achieving competitive employment must have a significant disability. In fiscal year 2003, all general and combined agencies, with the exception of one agency in a territory, passed indicator 1.4. For an agency for the blind to pass indicator 1.4, at least 89 percent of individuals achieving competitive employment must have a significant disability. In fiscal year 2003, 96 percent of agencies for the blind passed this indicator. Based on 2003 and 2004 performance on indicator 1.4, the Department decided to increase the criterion for meeting the GPRA measure beginning with the fiscal year 2006 performance plan. Under the revised GPRA measure, the criterion for general and combined agencies was raised significantly, from at least 62.2 percent to at least 80 percent. For agencies for the blind, the criterion was increased only slightly, from 89 percent to 90. In fiscal year 2007, 82 percent of general and combined agencies met the 80 percent criterion, but the GPRA target of 88 percent was not met. This is the first year that performance on this measure has declined. However, it should be noted that two of the three of the agencies that met the criterion in 2006, but not in 2007, were territories/ outlying areas. All of the agencies for the blind met the 90 percent criterion, meeting the target. Efficiency Measures Objective: Ensure that State VR agencies demonstrate effective fiscal management. The Department has established three efficiency measures to ensure that State VR agencies demonstrate effective fiscal management. These include cost per employment outcome, cost per participant, and a consumer expenditure rate.
Measure: Percentage of general and combined State VR agencies that demonstrate an average cost per employment outcome between $6,000 and $16,500.
Year Target Actual 2005 71 2006 Set baseline 66 2007 73 64 2008 70 2009 70 2010 70
Measure: Percentage of State VR agencies for the Blind that demonstrate an average cost per employment outcome of no more than $38,000.
Year Target Actual 2005 67 2006 Set baseline 71 2007 71 63 2008 71 2009 71 2010 71

REHABILITATION SERVICES AND DISABILITY RESEARCH Vocational rehabilitation State grants
J-21
Assessment of progress: At the national aggregate level, the cost per employment outcome can be calculated by dividing the total appropriation (minus the set-aside for Grants to Indians) by the total number of individuals who achieved an employment outcome. The sources of data for this measure are State agency data from the RSA-113 Caseload Report and RSA final State agency allocation tables. In fiscal year 2007, the average annual cost per employment outcome was $13,642. However, there is significant difference in the cost per employment outcome between general and combined State VR agencies and agencies serving the blind. The average cost per employment outcome for general and combined State VR agencies was $13,001 compared with $32,024 for agencies for the blind. In FY 2007, 36 of the 56 (64 percent) general and combined State VR agencies had an average cost per employment outcome between $6,000 and $16,500 – one less agency than in FY 2006. Eighteen agencies had an average cost per employment outcome above $16,500 and two agencies had an average cost per employment outcome of less than $6,000. Of the 24 agencies for the blind, 15 (63 percent) had an average cost per employment outcome of no more than $38,000 – 2 fewer agencies than in FY 2006. There is wide variation in the cost per employment outcome across these agencies. The cost per employment outcome for general and combined State VR agencies (excluding the outlying areas) ranged from about $5,037 to $26,912. The cost per employment outcome for agencies for the blind ranged from $11,243 to $109,340.
The Study of Variables Related to State VR Agency Performance (October 2004) indicates that whatever measure of cost efficiency is used, large differences are evident by agency type (blind, combined, general). For example, agencies for the blind are much smaller and still must maintain the same core administrative infrastructure. They also do not benefit from economies of scale available to larger agencies. In addition, on average, blind consumers spend more time in the program and the average cost of purchased services tends to be higher.
The Department is using the cost per employment outcome measure in monitoring State VR agency performance. In general, agencies with very high costs can be compared with agencies of similar size to evaluate the impact of agency operating decisions. If two agencies receive grant awards of similar size, and one assists more individuals at a lower cost than the other, the Rehabilitation Services Administration (RSA) can examine the organizational structure, resource allocation, and service delivery decisions that make this agency more efficient. RSA also uses this information to further examine State agencies whose performance on the efficiency measures falls outside the specified range, including variables such as the percentage of the grant award spent on direct services compared to the percentage spent on administrative costs.
This measure can also be used in monitoring the provision of services to individuals with the most significant disabilities and the requirement to provide all needed services based on the VR needs and informed choice of the individual. Individuals with the most significant disabilities generally need more services and more expensive services. RSA examines agencies with unusually low costs per outcome to ensure that individuals with the most significant disabilities are given priority for services and to determine if the agency is implementing any inappropriate policies regarding service provision.

REHABILITATION SERVICES AND DISABILITY RESEARCH Vocational rehabilitation State grants
J-22
Measure: Percentage of general and combined State VR agencies that demonstrate an average cost per participant between $1,200 and $3,300.
Year Target Actual 2005 73 2006 Set baseline 64 2007 73 61 2008 73 2009 70 2010 70
Measure: Percentage of State VR agencies for the Blind that demonstrate an average cost per participant of no more than $8,000.
Year Target Actual 2005 67 2006 Set baseline 67 2007 69 63 2008 70 2009 70 2010 70
Assessment of progress: A common efficiency measure for job training programs is the cost per participant. At the national aggregate level, the cost per participant is calculated by dividing the total appropriation (minus the set-aside for Grants to Indians) by the total number of eligible individuals who received VR services. The sources of data for this measure are State agency data from the RSA-113 Caseload Report and RSA final State agency allocation tables. For FY 2007, the average annual cost per participant for general and combined State vocational rehabilitation agencies was $2,718 with a range (excluding the outlying areas) of $1,194 to $4,892. For agencies for the blind, the average annual cost per participant ranged from $3,061 to $18,460, with an average of $7,062. In FY 2007, 34 of the 56 (61 percent) general and combined State VR agencies had an average cost per participant between $1,200 and $3,300 – 2 fewer agencies than in FY 2006. Of the 24 agencies for the blind, 15 (63 percent) had an average cost per participant of no more than $8,000 – 1 less agency than in FY 2006.
Measure: Percentage of general and combined State VR agencies that demonstrate an average annual consumer expenditure rate of at least 83 percent.
Year Target Actual 2005 75 2006 Set Baseline 70 2007 72 73 2008 73 2009 74 2010 74

REHABILITATION SERVICES AND DISABILITY RESEARCH Vocational rehabilitation State grants
J-23
Measure: Percentage of State VR agencies for the Blind that demonstrate an average annual consumer expenditure rate of at least 70 percent.
Year Target Actual 2005 67 2006 Set Baseline 63 2007 65 58 2008 67 2009 65 2010 65
Assessment of progress: The third efficiency measure examines the percentage of State VR agencies whose consumer service expenditure rate is at or above a specified level. Under this measure, the consumer service expenditure rate is calculated by dividing the agency’s consumer service expenditures by the agency’s total VR program expenditures. The sources of data for this measure are State agency data from the RSA-2 report and RSA final State agency allocation tables. In fiscal year 2007, the target was met with 41 of the 56 general and combined VR agencies (73 percent) demonstrating an average annual consumer expenditure rate of at least 83 percent. The average annual consumer service expenditure rate for all general and combined State vocational rehabilitation agencies was 86 percent with a range (excluding the outlying areas) of 54 percent to almost 100 percent. In 2007, 14 of the 24 agencies for the blind (58 percent) had an average annual consumer expenditure rate of at least 70 percent. The average annual consumer service expenditure rate for all agencies for the blind ranged from 31 percent to 90 percent, with an average of 70 percent. American Indian Vocational Rehabilitation Services
Performance Measures Goal: To improve employment outcomes of American Indians with disabilities who live on or near reservations by providing effective tribal vocational rehabilitation services. Objective: Ensure that eligible American Indians with disabilities receive vocational rehabilitation services and achieve employment outcomes consistent with their particular strengths, resources, abilities, capabilities, and interests.
Measure: The percentage of individuals who leave the program with employment outcomes, after receiving services under an individualized plan for employment.
Year Target Actual 2005 65 66 2006 65 67 2007 65 67 2008 66 2009 66 2010 67

REHABILITATION SERVICES AND DISABILITY RESEARCH Vocational rehabilitation State grants
J-24
Assessment of progress: The number of American Indians with disabilities served and the number of individuals achieving an employment outcome continue to increase annually along with the number of projects funded under the program. In fiscal year 2007, the projects served 6,592 American Indians with disabilities and assisted 1,663 American Indians with disabilities to achieve an employment outcome. Data for fiscal year 2007, based on the 73 projects operating in that fiscal year (projects funded with fiscal year 2006 appropriations), show that 66.7 percent of such individuals achieved an employment outcome, exceeding the program’s long-term goal. However, these outcomes may be inflated, since some grantees are reluctant to close the service records of individuals who have not obtained an employment outcome. In addition, there is wide variation in the percentage of individuals who achieved an employment outcome reported by these projects. In 2007, the percentage of individuals achieving an employment outcome reported by the 73 projects ranged from 20 percent to 100 percent.
Cross-training and resource coordination through annual conference and cluster training sessions have added to program effectiveness. Monitoring and technical assistance have enhanced the projects' abilities and expertise in the provision of vocational rehabilitation services to American Indians.
Efficiency Measures
Objective: Ensure that AIVRS projects demonstrate effective fiscal management. The Department has established two efficiency measures to ensure that AIVRS projects demonstrate effective fiscal management. These include cost per employment outcome and cost per participant.
Measure: The percentage of AIVRS projects that demonstrate an average annual cost per employment outcome of no more than $35,000.
Year Target Actual 2005 70 2006 Set baseline 64 2007 73 73 2008 66 2009 68 2010 70
Assessment of progress: This AIVRS program efficiency measure examines the percentage of AIVRS projects having a cost per employment outcome within a specified range. Fiscal year 2005 and 2006 data were used to establish performance criteria and set performance targets for fiscal years 2007 through 2011. The source of data for this measure is the AIVRS Annual Reporting Form.
At the national level, the average cost per employment outcome for this program is calculated by dividing the amount of the set-aside, excluding peer review costs, by the total number of individuals who achieved an employment outcome. Using this method for the AIVRS program in fiscal year 2007, the overall average cost per employment outcome was $19,843 with a median

REHABILITATION SERVICES AND DISABILITY RESEARCH Vocational rehabilitation State grants
J-25
of $24,000. However, the cost per employment outcome varied significantly across projects, ranging from $5,018 to $399,204. The target for this measure was met in FY 2007, with 53 of the 73 AIVRS projects (73 percent) demonstrating an average cost per employment outcome of no more than $35,000. Measure: The percentage of AIVRS projects that demonstrate an average annual cost per participant of no more than $10,000.
Year Target Actual 2006 72 2007 Set baseline 78 2008 76 2009 77 2010 78
Assessment of progress: At the national level, the average annual cost per participant for this program is calculated by dividing the amount of the set-aside, excluding peer review costs, by the total number of individuals who received services under an Individualized Plan for Employment. For fiscal year 2007, the overall average annual cost per participant was $5,006. The average cost per participant ranged from $1,393 to $99,194 with a median of $6,649. In FY 2007, 57 of the 73 AIVRS projects (78 percent) demonstrated an average cost per participant of no more than $10,000.
Program Improvement Efforts
The Department is undertaking the following improvement efforts for this program: VR State Grants
• Taking significant steps to improve program management using existing outcome data and making these data available to the public in a more timely manner. Effective management of the VR program had long been hindered by the Department’s inability to produce timely and transparent data on program performance. In recent years, the Department has made significant progress in improving the timeliness of its VR data and in promoting the use of the data for program improvement. Annual databases are now complete within 5 months of the close of the fiscal year. In comparison, the databases for fiscal year 2002 and prior years were not complete until 12 months or more after the close of the fiscal year. RSA has also developed detailed data tables and outcome reports that are being used by both program staff and State VR agencies to manage the program. State performance data in a variety of formats can be accessed at http://www.ed.gov/programs/rsabvrs/performance.html#rsamis.
• Continuing efforts to improve program management by using performance data to monitor State agency performance and to provide the State agencies with technical assistance. RSA has implemented a comprehensive approach to monitoring with more consistency and improved management controls. The new monitoring process assists the Department in improving VR agency performance by providing feedback, technical assistance, and timely monitoring reports to our grantees. State teams conduct the monitoring activities with a

REHABILITATION SERVICES AND DISABILITY RESEARCH Vocational rehabilitation State grants
J-26
single point of contact to interact with individual State agencies. Functional units work collaboratively to develop the monitoring protocols and State information that will be used as the basis for the monitoring activities. The Monitoring division is using data to monitor State performance and provide technical assistance. Increased access to management information allows staff to use State data for program management and monitoring. State profiles are developed containing program and fiscal data for use in evaluating State agency performance. RSA has used performance data in conducting State annual review reports for the past 3 fiscal years and in conducting comprehensive onsite monitoring of 42 VR agencies in 29 States and 2 territories over a 2-year period (fiscal year 2007 and 2008). Reports for the 14 States monitored in fiscal year 2008 can be accessed at http://www.ed.gov/rschstat/eval/rehab/107-reports/index.html. Promising practices that RSA has identified through its monitoring of State agencies can be found at http://www.ed.gov/rschstat/eval/rehab/promising-practices/index.html. The most recent Annual Review reports can be accessed at http://rsamis.ed.gov/de.cfm?form_id=107&mode=list&fy=2006.
• Developing supplemental measures. Supplemental performance measures are being developed with input from State VR agencies that would assess progress towards the goals and objectives of the VR Strategic Performance Plan. The Department has obtained input from State VR agencies and other interested parties on the plan's proposed goal and objectives. Measures are being developed that assess achievement of the plan's objectives with respect to achieving economic self-sufficiency, increasing earnings, and providing transition services.
• Collecting data to allow comparison with other job training programs, including necessary data to support the job training common measures. A field test of a data collection to support the common measures was conducted in fiscal year 2004. At that time, there were numerous difficulties in collecting the necessary Unemployment Insurance (UI) Wage Records data, including confidentiality issues and access to the UI database. Many State VR agencies now have at least limited access to UI data. The Department is participating in an interagency group that is working to identify States that continue to experience obstacles in gaining access to UI data. The Department has developed a draft instrument for collecting UI data that is under review.
American Indian Vocational Rehabilitation Services
• Examining reporting inconsistencies and developing guidance to grantees. The Department has taken a number of steps to improve data collection and reporting in the AIVRS program. A uniform online data collection was implemented in 2004 to facilitate grantee reporting and assist in program management. Although initially many grantees had difficulty using the web-based system to report their data, corrections were made to the system and technical assistance was provided. The Department has revised the annual grantee reporting form to make it easier to complete, clarify instructions, eliminate duplicative data items, and provide a more complete picture of the program. The most recent revision of the data collection was approved in September 2008. Program staff provided guidance to grantees on completion of the new form through teleconferences. Staff will continue to analyze project data to ensure consistency in reporting and provide technical assistance as needed.
REHABILITATION SERVICES AND DISABILITY RESEARCH Vocational rehabilitation State grants
J-27
• Implementing an outcome efficiency measure. The Department has established two efficiency measures, an outcome efficiency measure and an output measure, to ensure that AIVRS projects demonstrate effective fiscal management. The outcome measure examines the percentage of projects that demonstrate an average annual cost per employment outcome of no more than $35,000. Under this measure, the cost per employment outcome is calculated by dividing total Federal grant funds by the number of individuals who attain an employment outcome. Based on an analysis of performance data, program staff are able to identify grantees in need of technical assistance in fiscal management.
• Improving the use and transparency of project data to manage and improve the program. Improvements to RSA’s Management Information System (MIS) allow project staff to query and review grantee reported data and generate reports to assist in program management. RSA staff use grantee efficiency and program data to identify low performing grantees needing technical assistance. In FY 2008, RSA used project data to improve program performance and management by: (1) conducting on-site monitoring of grantees that did not meet the efficiency measure and/or had excessive grant balances; (2) conducting training in two geographic locations central to the AIVRS projects that focused on program and fiscal management; and (3) providing targeted technical assistance to AIVRS projects that demonstrated weak performance or specifically requested assistance. The Department is currently working to improve the transparency of aggregate program and grantee level performance data in the MIS and make it more accessible to the public.
• Monitoring key performance and fiscal indicators and providing technical assistance to ensure the timely expenditure of project funds and the achievement of project goals. Program staff are monitoring the expenditure of project funds and the progress of grantees in achieving project goals and providing technical assistance to grantees who have excessive fund balances and/or who are not on track to achieve their project's established quantitative goals.

REHABILITATION SERVICES AND DISABILITY RESEARCH
J-28
Client assistance State grants (Rehabilitation Act of 1973, Title I, Section 112)
FY 2010 Authorization ($000s): 0 1
Budget Authority ($000s):
2009 2010 Change $11,576 $11,576 0 _________________
1 The program is authorized in FY 2009 through appropriations language. Continued funding is proposed for this program in FY 2010 through appropriations language.
PROGRAM DESCRIPTION
The Client Assistance Program (CAP) provides grants to States for services to assist eligible individuals and applicants for the Vocational Rehabilitation (VR) State grants program and other programs, projects, and services funded under the Rehabilitation Act (the Act). Services are provided to help eligible individuals and applicants understand the rehabilitation services and benefits available under the Act, and to advise them of their rights and responsibilities in connection with those benefits. Assistance may also be provided to help eligible individuals and applicants in their relationships with those providing services under the Act, including assistance and advocacy in pursuing legal and administrative remedies to ensure the protection of their rights. State VR agencies must inform VR consumers about the services available from the CAP and how to contact the CAP. States must operate a CAP in order to receive VR State grant funds.
States and outlying areas have adopted different organizational structures for meeting the requirement to establish a CAP in each State. Each Governor designates a public or private agency to operate a CAP. This designated agency must be independent of any agency that provides services under the Act, except in cases where the Act “grandfathered” agencies providing services under the Act. In the event one of these “grandfathered” agencies is restructured, the Act requires the Governor to redesignate the CAP in an agency that does not provide services under the Act.
Current designations include the following:
• 28 of the Governors have designated their State Protection and Advocacy (P&A) system to provide CAP services;
• 12 of the Governors have designated the VR agency to provide services; and
• the remaining 16 Governors have designated other entities to provide CAP services.
Of the 16 CAPs located outside State VR agencies and not within the P&A system, 5 are located in the Governor’s Office; 6 are located in another State agency, office, or government-

REHABILITATION SERVICES AND DISABILITY RESEARCH Client assistance State grants
J-29
sponsored commission or group; 4 are located in legal aid and nonprofit organizations; and 1 is located in a private law firm.
The CAP is a current-funded formula grant program. When appropriations exceed $7.5 million, funds are distributed on the basis of population, with a minimum allotment of $100,000 to each of the 50 States, D.C., and Puerto Rico and $45,000 to each of the outlying areas. When the appropriation increases, the Act also requires the Secretary to increase the minimum allotments for States and outlying areas by a percentage not greater than the percentage increase in the appropriation. The fiscal year 2008 allotments were based on the July 1, 2005 population estimates published by the Census Bureau in December 2005. The fiscal year 2009 allotments are based on the July 1, 2006 population estimates published in December 2007. The fiscal year 2010 State distributions are based on the July 1, 2008 population estimates released on December 22, 2008. Grantees may carry over unobligated Federal funds for an additional year.
Funding levels for the past 5 fiscal years were as follows: ($000s)
2005.................................................. $11,901 2006.................................................. 11,782 2007.................................................. 11,782 2008.................................................. 11,576 2009.................................................. 11,576
FY 2010 BUDGET REQUEST
The Administration requests $11.576 million for the Client Assistance program (CAP) in fiscal year 2010, the same as the fiscal year 2009 appropriation. This request will help ensure that individuals with disabilities who are applying for or receiving services funded under the Act will receive appropriate services and have access to administrative, legal, and other appropriate remedies when needed to protect their rights.
Overall, in FY 2007, CAPs nationwide responded to 55,350 requests for information and provided extensive services to 7,087 individuals. Slightly more than 94 percent of those cases in which extensive services were provided involved applicants for or recipients of services from the VR program. In 93 percent of those cases, issues related to the delivery of VR services. These data also demonstrate that in 33 percent of the cases closed, CAPs enabled the individuals to advocate for themselves through the explanation of policies; that 18 percent of these cases resulted in the reestablishment of communication between the individuals and other parties; and 19 percent resulted in the development or implementation of an individualized plan for employment (IPE). In addition, 67 percent of the cases requiring action by the CAP on behalf of the individual were resolved in the individual’s favor.
Examples of CAP activities during fiscal year 2007 include:
In Arkansas, an individual with a disability requested services from the VR agency to enable him to start his own business making parts for racing cars. He needed a certain machine to make the parts for sale, but his VR counselor denied the request for funds to purchase the machine.

REHABILITATION SERVICES AND DISABILITY RESEARCH Client assistance State grants
J-30
The Arkansas CAP advocated on behalf of the individual, believing that his documentation demonstrated that he could be successful in this business with the machine. After meeting with the CAP advocate and the individual, the VR agency staff agreed to provide funding to purchase the machine. Currently, the individual is working in his business and reports that he is very satisfied.
In Louisiana, community colleges and high schools throughout the State have collaborated and are now offering a dual enrollment program, known as “STEPS to Success,” through which high school students can earn college credit prior to high school graduation. A student with a disability wanted to participate in a similar program by attending both cosmetology training and high school part-time. Although the high school agreed and the student was admitted to the cosmetology program, the VR agency was reluctant to support this endeavor because the student had yet to complete high school. The student’s VR counselor was concerned that the heavy course-load might exacerbate the student’s disability. The student’s social worker submitted written support regarding the student’s ability to psychologically handle the training. Together, the student and the CAP advocate gathered information on cosmetology certification requirements and duties, and job opportunities available in the community. The CAP submitted a request for reconsideration and the regional manager overturned the denial. The Steps to Success program is gaining popularity in Louisiana among students with disabilities transitioning from high school to work. This particular student’s case has expanded opportunities through which other individuals with disabilities can get a head start on career training.
PROGRAM OUTPUT MEASURES ($000s) 2008 2009 2010 Information inquiries/referrals 55,350 55,350 55,350 Individuals provided case services 7,087 7,087 7,087
Note: Data for fiscal years 2008 through 2010 are projected from actual data collected for fiscal year 2007. Data for fiscal year 2008 will be available in April of 2009.
PROGRAM PERFORMANCE INFORMATION
Performance Measures
This section presents selected program performance information, including, for example, GPRA goals, objectives, measures, and performance targets and data, and an assessment of the progress made toward achieving program results. Achievement of results is based on the cumulative effect of the resources provided in previous years and those requested in FY 2010 and future years, and the resources and efforts invested by those served by this program.
REHABILITATION SERVICES AND DISABILITY RESEARCH Client assistance State grants
J-31
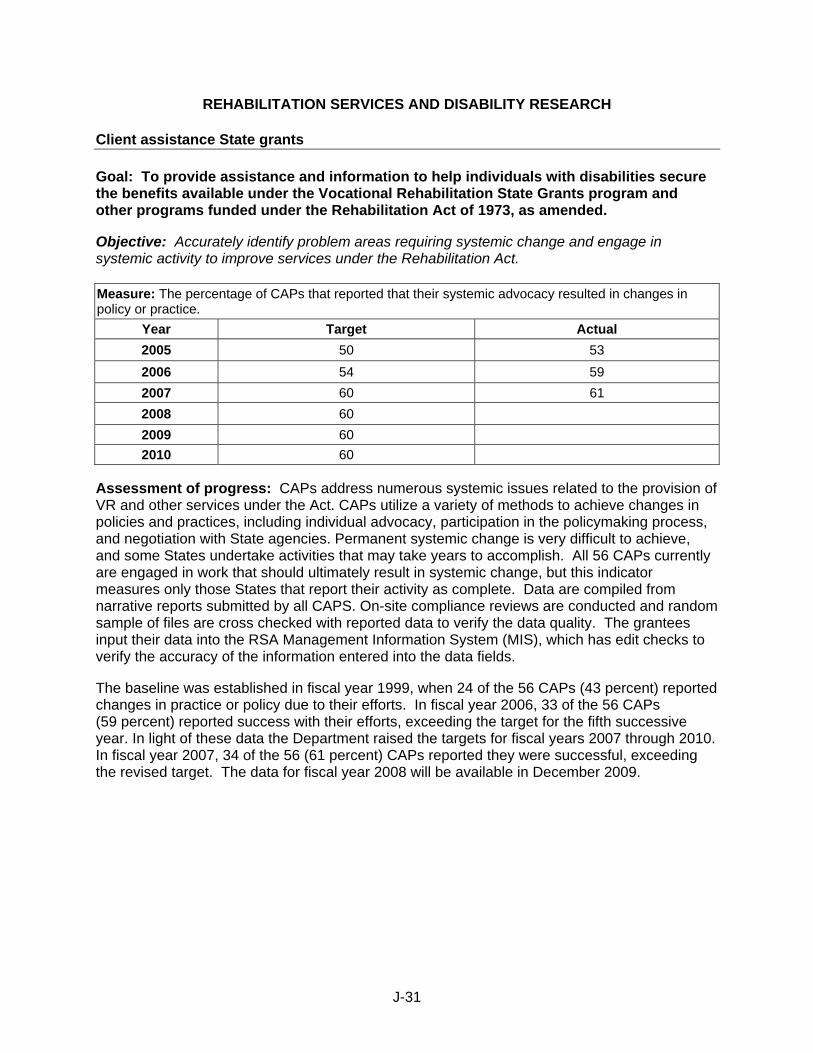
Goal: To provide assistance and information to help individuals with disabilities secure the benefits available under the Vocational Rehabilitation State Grants program and other programs funded under the Rehabilitation Act of 1973, as amended.
Objective: Accurately identify problem areas requiring systemic change and engage in systemic activity to improve services under the Rehabilitation Act. Measure: The percentage of CAPs that reported that their systemic advocacy resulted in changes in policy or practice.
Year Target Actual 2005 50 53 2006 54 59 2007 60 61 2008 60 2009 60 2010 60
Assessment of progress: CAPs address numerous systemic issues related to the provision of VR and other services under the Act. CAPs utilize a variety of methods to achieve changes in policies and practices, including individual advocacy, participation in the policymaking process, and negotiation with State agencies. Permanent systemic change is very difficult to achieve, and some States undertake activities that may take years to accomplish. All 56 CAPs currently are engaged in work that should ultimately result in systemic change, but this indicator measures only those States that report their activity as complete. Data are compiled from narrative reports submitted by all CAPS. On-site compliance reviews are conducted and random sample of files are cross checked with reported data to verify the data quality. The grantees input their data into the RSA Management Information System (MIS), which has edit checks to verify the accuracy of the information entered into the data fields.
The baseline was established in fiscal year 1999, when 24 of the 56 CAPs (43 percent) reported changes in practice or policy due to their efforts. In fiscal year 2006, 33 of the 56 CAPs (59 percent) reported success with their efforts, exceeding the target for the fifth successive year. In light of these data the Department raised the targets for fiscal years 2007 through 2010. In fiscal year 2007, 34 of the 56 (61 percent) CAPs reported they were successful, exceeding the revised target. The data for fiscal year 2008 will be available in December 2009.

REHABILITATION SERVICES AND DISABILITY RESEARCH Client assistance State grants
J-32
Objective: Resolve cases at lowest possible level.
Measure: The percentage of cases resolved through the use of alternative dispute resolution (ADR). Year Target Actual 2005 84 84 2006 84 85 2007 84 98 2008 84 2009 85 2010 86
Assessment of progress: The performance targets through fiscal year 2008 were based on fiscal year 2001 data, which showed 84 percent of cases resolved through alternative dispute resolution (ADR). The target was met in fiscal year 2005 and exceeded in fiscal year 2006, when 4,977 of the 5,855 closed cases (85 percent) were resolved through ADR techniques. In fiscal year 2007, 98 percent of the closed cases were resolved through ADR, again exceeding the Department’s target for this measure. In 2008 the Department increased the target for 2009. The Department will consider further changes if the program sustains the high level of performance shown in 2007.
In order to verify data quality, Department of Education program specialists conduct appropriate reviews of annual data. On-site compliance reviews are conducted and random samples of files are cross checked with reported data to verify the data quality. The grantees input their data into the RSA Management Information System (MIS), which has edit checks to verify the accuracy of the information entered into the data fields.

REHABILITATION SERVICES AND DISABILITY RESEARCH
J-33
Training (Rehabilitation Act of 1973, Title III, Section 302)
FY 2010 Authorization ($000s): 0 1
Budget Authority ($000s): 2009 2010 Change $37,766 $37,766 0 _________________
1 The program is authorized in FY 2009 through appropriations language. Continued funding is proposed for this program in FY 2010 through appropriations language.
PROGRAM DESCRIPTION
The purpose of the Training program is to ensure that skilled personnel are available to meet the rehabilitation needs of individuals with disabilities assisted through the vocational rehabilitation (VR), supported employment, and independent living programs. The program supports training and related activities designed to increase the number of qualified personnel providing rehabilitation services. Grants and contracts are awarded to States and public and nonprofit agencies and organizations, including institutions of higher education, to pay all or part of the cost of conducting training programs.
Awards may be made in any of 31 long-term training fields, in addition to awards for continuing education, short-term training, experimental and innovative training, and training interpreters for persons who are deaf or hard of hearing and persons who are deaf-blind. These training programs vary in terms of content, methodology, and type of trainee. For example, the Long-Term Training program supports academic training grants that must direct 75 percent of the funds to trainee scholarships. The statute requires trainees who receive assistance either to work for a period of time in public or private nonprofit rehabilitation agencies or related agencies, including professional corporations or professional practice groups that have service arrangements with a State agency, or to pay back the assistance they received.
The Training program authority requires recipients of grants under the Long-Term Training program to build closer relationships between training institutions and State VR agencies, promote careers in the public vocational rehabilitation program, identify potential employers who would meet students’ payback requirements, and ensure that data on student employment are accurate. Training of statewide workforce systems personnel is authorized under the Training program, and such training may be jointly funded by the Department of Labor. Statewide workforce systems personnel may be trained in evaluative skills to determine whether an individual with a disability may be served by the State VR grants program or another component of the statewide workforce system.
Of the funds appropriated for the Training program, 15 percent must be used to support the In-Service Training program. This program is intended to assist VR State agencies in the training of State agency staff consistent with the State’s Comprehensive System of Personnel Development (CSPD). Under Title I of the Rehabilitation Act, each State is required to establish

REHABILITATION SERVICES AND DISABILITY RESEARCH Training
J-34
procedures to ensure there is an adequate supply of qualified staff for the State agency, to assess personnel needs and make projections for future needs, and to address the current and projected personnel training needs. States are further required to develop and maintain policies and procedures for job-specific personnel standards that are consistent with certification, licensure, or other State personnel requirements for comparable positions. If a State’s current personnel do not meet the highest requirements for personnel standards within the State, the CSPD must identify the steps a State will take to upgrade the qualifications of their staff, through retraining or hiring. Title I VR State grant funds may also be used to comply with these requirements.
Funding levels for the past 5 fiscal years were as follows: ($000s)
2005............................................... $38,826 2006............................................... 38,438 2007............................................... 38,438 2008............................................... 37,766 2009............................................... 37,766
FY 2010 BUDGET REQUEST
The Administration requests $37.766 million for the Training program in fiscal year 2010, the same as the fiscal year 2009 appropriation. Approximately $22.339 million would be used to continue 124 projects that began in previous years and $14.699 million would support 134 new competitive grant awards.
Approximately $6.45 million will be used for 46 new grants under the Long-Term Training program (LTT) to support degree-granting university programs to increase the supply of qualified VR counselors and other specialists needed to fill crucial personnel positions in State VR agencies and community rehabilitation programs that provide the majority of services to VR consumers. As discussed in the Description section, 75 percent of the funds awarded to universities under the LTT program must go directly to students for tuition assistance and stipends. Since this tuition assistance must be repaid through work in certain appropriate work settings, the Rehabilitation Services Administration (RSA) believes it’s the best mechanism for recruiting new graduates into the field of rehabilitation.
As required by the statute, 15 percent of the funds requested ($5.665 million) would be set aside for the In-Service Training program. In fiscal year 2010, RSA will award all eligible State VR agencies with 5-year training grants for use in providing training activities tailored to the specific needs of that particular agency. Many newly hired individuals often need “on the job” training that is provided through the In-Service Training program.
The 2010 budget would also support six new 5-year awards under the Interpreter Training Program ($2.084 million). This program is designed to establish interpreter training programs to increase the numbers of skilled interpreters and to upgrade the skills of existing interpreters throughout the country.
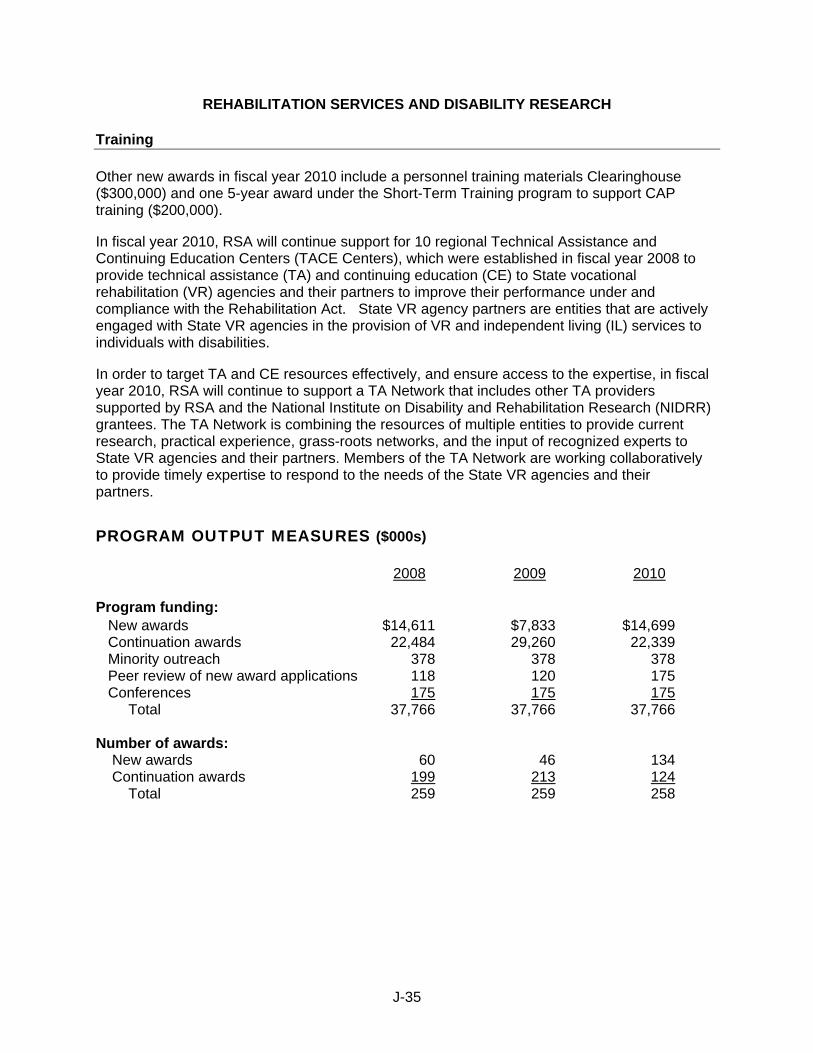
REHABILITATION SERVICES AND DISABILITY RESEARCH Training
J-35
Other new awards in fiscal year 2010 include a personnel training materials Clearinghouse ($300,000) and one 5-year award under the Short-Term Training program to support CAP training ($200,000).
In fiscal year 2010, RSA will continue support for 10 regional Technical Assistance and Continuing Education Centers (TACE Centers), which were established in fiscal year 2008 to provide technical assistance (TA) and continuing education (CE) to State vocational rehabilitation (VR) agencies and their partners to improve their performance under and compliance with the Rehabilitation Act. State VR agency partners are entities that are actively engaged with State VR agencies in the provision of VR and independent living (IL) services to individuals with disabilities.
In order to target TA and CE resources effectively, and ensure access to the expertise, in fiscal year 2010, RSA will continue to support a TA Network that includes other TA providers supported by RSA and the National Institute on Disability and Rehabilitation Research (NIDRR) grantees. The TA Network is combining the resources of multiple entities to provide current research, practical experience, grass-roots networks, and the input of recognized experts to State VR agencies and their partners. Members of the TA Network are working collaboratively to provide timely expertise to respond to the needs of the State VR agencies and their partners.
PROGRAM OUTPUT MEASURES ($000s) 2008
2009
2010
Program funding: New awards $14,611 $7,833 $14,699 Continuation awards 22,484 29,260 22,339 Minority outreach 378 378 378 Peer review of new award applications 118 120 175 Conferences 175 175 175 Total 37,766 37,766 37,766 Number of awards: New awards 60 46 134 Continuation awards 199 213 124 Total 259 259 258

REHABILITATION SERVICES AND DISABILITY RESEARCH Training
J-36
Program detail Funding Number of awards 2008 2009 2010 2008 2009 2010 Long-term training: New awards $6,711 $6,046 $6,450 50 43 46 Continuation awards 13,795 14,458 13,999 108 115 111 Total 20,506 20,504 20,449 158 158 157 Technical Assistance and Continuing Education
New awards 7,900 1,597 0 10 0 0 Continuation awards 0 6,303 7,900 0 10 10 Total 7,900 7,900 7,900 10 10 10 In-Service: New awards 0 0 5,665 0 0 80 Continuation awards 5,665 5,665 0 80 80 0 Short-term: New awards 0 190 500 0 3 2 Continuation awards 940 750 440 5 2 3 Total 940 940 940 5 5 5 Interpreter training: New awards 0 0 2,084 0 0 6 Continuation awards 2,084 2,084 0 6 6 0
PROGRAM PERFORMANCE INFORMATION
Performance Measures
This section presents selected program performance information, including, for example, GPRA goals, objectives, measures, and performance targets and data, and an assessment of the progress made toward achieving program results. Achievement of results is based on the cumulative effect of the resources provided in previous years and those requested in FY 2010 and future years, and the resources and efforts invested by those served by this program.
Goal: To provide the public vocational rehabilitation (VR) sector with well-trained staff and to maintain and upgrade the skills of current staff.
Objective: To provide graduates who work within the vocational rehabilitation (VR) system to help individuals with disabilities achieve their goals.

REHABILITATION SERVICES AND DISABILITY RESEARCH Training
J-37
Measure: The percentage of RSA-supported graduates fulfilling their payback requirements through acceptable employment.
Year Target Actual 2005 73 81 2006 83 86 2007 85 80 2008 85 2009 86 2010 86
Assessment of progress: Performance for this measure increased from 72 percent in 2000 to 86 percent in 2006, but did not meet the target established for 2007. Data for 2007 indicate that 49 percent of Master’s level graduates are fulfilling their payback through work in State VR agencies.
RSA is in the process of revising the Payback Reporting Form used by grantees in order to significantly improve the quality and accuracy of the data RSA receives about scholars. RSA plans to have a data collection package ready for review in April 2009 and implemented by January 2010.
Efficiency Measures
The Department has adopted an efficiency measure for the Long-Term Training program (LTT). That measure is the cost per Master’s-level vocational rehabilitation counseling graduate. The measure is calculated by dividing the total funds spent on long-term training by the number of graduates supported under that program.
Measure: The Federal cost per RSA supported rehabilitation counseling graduate at the Masters-level. Year Target Actual 2005 $11,150 2006 10,962 2007 $10,702 14,734 2008 10,702 2009 10,702 2010 10,702
Assessment of progress: The fiscal year 2007 cost is significantly greater than the cost in the prior years, primarily because of a change in methodology for calculating this measure. Prior to 2007 RSA only included the funds awarded to scholars in calculating this measure. RSA is now appropriately using all of the funds awarded to grantees under the program. RSA will consider establishing new targets after additional data are collected using a revised Payback Reporting Form.

REHABILITATION SERVICES AND DISABILITY RESEARCH Training
J-38
Program Improvement Efforts
The Department is undertaking the following improvement efforts for this program:
• Using existing outcome data to improve program management and direct priorities. RSA has integrated the Payback Reporting form data into the RSA management information system. RSA intends to provide increased grantee training on entering information into the Payback System. RSA hopes to improve the accuracy of program information as measured by the percentage of grantees that enter complete and accurate data into the payback system by an established deadline.
• Taking significant steps to improve the accuracy of information on payback and numbers of counselors who met their CSPD standard. RSA is in the process of revising the Payback Reporting Form used by grantees and plans to submit a data collection package to the Office of Management and Budget for review in April 2009. RSA hopes to implement the revised form by January 2010. For CSPD, RSA is establishing a process to review each State's CSPD plan along with the data reported by agencies through their In-Service performance report to determine annually the number of counselors meeting CSPD requirements.
• Making data on payback and numbers of counselors who met their CSPD standard available to the public. RSA has integrated the Payback Reporting Form data into the RSA management information system, a publicly available system. Data on counselors meeting their CSPD standard are not yet publicly available.
• Calculating and analyzing the efficiency measure data (cost per graduate) at the grantee level in order to establish targets and identify potential candidates for technical assistance. RSA has changed its methodology for calculating cost per graduate and expects further changes in the data once the Payback Reporting Form is revised. RSA does not intend to use grantee level data to establish new targets until RSA obtains additional and more accurate data.

REHABILITATION SERVICES AND DISABILITY RESEARCH
J-39
Demonstration and training programs (Rehabilitation Act of 1973, Title III, Section 303(b)-(d))
FY 2010 Authorization ($000s): 0 1
Budget Authority ($000s): 2009 2010 Change $9,594 $6,506 -$3,088 _________________
1 The program is authorized in FY 2009 through appropriations language. Continued funding is proposed for this program in FY 2010 through appropriations language. PROGRAM DESCRIPTION
Demonstration and Training programs are authorized to provide competitive grants to, or contracts with, eligible entities to expand and improve the provision of rehabilitation and other services authorized under the Rehabilitation Act (the Act) and to further the purposes and policies of the Act. These current-funded discretionary programs also are authorized to support activities that increase the provision, extent, availability, scope, and quality of rehabilitation services under the Act, including related research and evaluation activities.
Section 303(b) of the Rehabilitation Act authorizes the support of activities to demonstrate methods of service delivery to individuals with disabilities, as well as activities such as technical assistance, systems change, special studies and evaluation, and dissemination and utilization of project findings. Eligible entities include State Vocational Rehabilitation (VR) agencies, community rehabilitation programs, Indian tribes or tribal organizations, other public or nonprofit agencies or organizations, and for-profit organizations. Competitions may be limited to one or more type of entity.
Sections 303(c) and (d) of the Act authorize a parent information and training program and a Braille training program.
The majority of projects currently supported under Demonstration and Training programs are designed to increase employment opportunities for individuals with disabilities by expanding and improving the availability and provision of rehabilitation and other services. These projects are intended to increase employment outcomes for individuals for whom vocational rehabilitation services were previously unavailable or who previously did not take advantage of such services. Funding levels for the past 5 fiscal years were as follows:
($000s)
2005............................................... $25,607 2006............................................... 6,511 2007............................................... 8,756 2008............................................... 10,151 2009............................................... 9,594

REHABILITATION SERVICES AND DISABILITY RESEARCH Demonstration and training programs
J-40
FY 2010 BUDGET REQUEST
The Administration requests $6.506 million for Demonstration and Training programs in fiscal year 2010, a decrease of $3.088 million from the fiscal year 2009 appropriation that reflects the elimination of funds for congressional earmarks. All funds requested for fiscal year 2010 would provide funding for continuation of activities that began in previous fiscal years.
Of the amount requested, $2 million would be used to continue support for four new projects that will begin in fiscal year 2009 and will demonstrate how State VR agencies can achieve high quality employment outcomes for Social Security Disability Insurance (SSDI) beneficiaries and Supplemental Security Income (SSI) recipients.
The request would also continue support for a technical assistance center to assist the new SSDI/SSI projects in such areas as collecting and analyzing data from the projects. The center would share promising practices and help projects adopt and adapt practices to fit the unique needs of assisted projects. Project activities will be documented by the center, and the center will use available data to try to determine what practices work under specific circumstances, with the goal of producing a body of evidence-based practices that can be used by other States.
Finally, the request would continue support for:
• five State grants, awarded in 2007, designed to demonstrate promising practices in transition planning and service delivery in improving the postsecondary education and employment outcomes of students with disabilities;
• a technical assistance center for Assistive Technology Reutilization grantees that began in fiscal year 2006;
• seven parent information and training centers and a technical assistance grant that began in fiscal year 2007; and
• two Braille Training grants that will begin in fiscal year 2009.
PROGRAM OUTPUT MEASURES ($000s) 2008 2009 2010Program funding:
SSDI/SSI Demos and TA center 0 $1,866 $2,000Transition initiative $1,365 3,124 3,033AT Reutilization 1,727 258 258Parent Training and Information Centers 850 850 850Braille Training 200 200 200Mentoring Projects 2,030 0 0 Subtotal—Program funding 6,172 6,298 6,341

REHABILITATION SERVICES AND DISABILITY RESEARCH Demonstration and training programs
J-41
2008 2009 2010Other program costs:
TA for Telework grantees $100 $100 $100Peer review of new award applications 0 12 0Minority outreach 101 96 65Earmarks 3,100 3,088 0Orthotic and Prosethic Research earmark 678 1 0 0 Subtotal—Other program costs 3,979 3,296 165 Total—Program funding and other program costs
10,151 9,594 6,506
Number of projects: New 14 6 0Continuation 26 15 20 Total—Number of projects 30 19 19________________________________________________
1 The 2008 Appropriations Act requires that the Rehabilitation Services and Disability Research account support a total of $982,530 for Orthotic and Prosthetic Research, of which the Demonstration and Training program contributed $678,364.
PROGRAM PERFORMANCE INFORMATION
This section presents selected program performance information, including, for example, GPRA goals, objectives, measures, and performance targets and data, and an assessment of the progress made toward achieving program results. Achievement of results is based on the cumulative effect of the resources provided in previous years and those requested in FY 2010 and future years, and the resources and efforts invested by those served by this program.
Efficiency Measure
Goal: To expand, improve or further the purposes of activities authorized under the Act.
Objective: Expand and improve the provision of rehabilitation services that lead to employment outcomes.
The efficiency measure for this program is the percentage of projects that met their goals and objectives as established in their original applications, or as modified during the first year. This efficiency measure is designed to determine whether the grantees are providing the services for which they were awarded funding through the competitive process. The Rehabilitation Services Administration (RSA) reviewed applications in relation to the grantees’ annual reports and found that this measure must be modified in order to accurately capture meaningful data regarding performance. RSA is currently working with a contractor to develop the best measure for this demonstration program that supports such diverse project activities.

REHABILITATION SERVICES AND DISABILITY RESEARCH Demonstration and training programs
J-42
Program Improvement Efforts
The Department is undertaking the following improvement efforts for this program:
• Developing a comprehensive plan (including a plan for program evaluation) that will establish procedures for identifying multi-year initiatives and annual priority areas. RSA developed a comprehensive planning document in 2007 entitled the Future Initiatives Plan (FIP) for Demonstrations and Training Programs. The FIP was derived from the Office of Special Education and Rehabilitative Services (OSERS) priorities, which in turn, relate to Department goals. Among the OSERS priorities are: expanding meaningful and competitive employment for people with disabilities and emphasizing the transition of youth with disabilities to postsecondary education and/or employment; and building partnerships to leverage resources with Federal and other government agencies, non-governmental organizations, and the private sector. The FIP identifies specific priorities and a timetable for implementing the plan. The plan will be reviewed, evaluated, and updated annually by members of the planning group that developed the FIP.
• Developing long term measures and examining current annual measures to determine whether they should be maintained or revised in line with the comprehensive plan. RSA has not yet developed new long term measures for this program. In the meantime, RSA is working to reassess the efficiency measure for this program and how best to measure success. The efficiency measure is the percentage of projects that meet or exceed their original project objectives.
• Developing procedures for the review of grantee data, progress and final reports, to improve program performance. RSA collects a variety of data from its grantees. For example, under the transition priority, RSA collects data from grantees on the number of individuals provided transition services who then enrolled in higher education or were placed in employment, among other outcomes. RSA has developed a protocol for review of annual performance reports and data submissions. In 2008, RSA tested the protocol, and developed and tested procedures for comparing performance data for the current and previous years. RSA is now working to develop a mechanism that will be used to aggregate the data by August 2009.

REHABILITATION SERVICES AND DISABILITY RESEARCH
J-43
Migrant and seasonal farmworkers (Rehabilitation Act of 1973, Title III, Section 304)
FY 2010 Authorization ($000s): 0 1
Budget Authority ($000s):
2009 2010 Change $2,239 $2,239 0 _________________
1 The program is authorized in FY2009 through appropriations language. Continued funding is proposed for this program in FY 2010 through appropriations language
PROGRAM DESCRIPTION
The Migrant and Seasonal Farmworkers (MSFW) program makes comprehensive vocational rehabilitation (VR) services available to migrant and seasonal farmworkers with disabilities, with the goal of increasing employment opportunities for them. Projects also develop innovative methods for reaching and serving this population. Emphasis is given in these projects to outreach, specialized bilingual rehabilitation counseling, and coordination of VR services with services from other sources. Projects provide VR services to migrant and seasonal farmworkers and to members of their families when such services will contribute to the rehabilitation of the worker with a disability. Discretionary grants are limited to 90 percent of the costs of the projects providing these services. This is a current-funded program.
The Migrant and Seasonal Farmworkers program is administered in coordination with other programs serving migrant and seasonal farmworkers, including programs under Title I of the Elementary and Secondary Act of 1965, Section 330 of the Public Health Service Act, the Migrant and Seasonal Agricultural Worker Protection Act, and the Workforce Investment Act of 1998. Funding levels for the past 5 fiscal years were as follows: ($000)
2005............................................... $2,302 2006............................................... 2,279 2007............................................... 2,279 2008............................................... 2,239 2009............................................... 2,239
FY 2010 BUDGET REQUEST The Administration requests $2.239 million for the Migrant and Seasonal Farmworkers program in fiscal year 2010, the same as the fiscal year 2009 appropriation. At the requested level, the Department will support 2 new projects and 9 continuation projects. Migrant and seasonal

REHABILITATION SERVICES AND DISABILITY RESEARCH Migrant and seasonal farmworkers
J-44
farmworkers with disabilities, if eligible, receive VR services through each State’s Title I VR State Grants program. However, States that apply and receive funding under this program are better equipped to provide specialized services needed to effectively serve migrant and seasonal farmworkers with disabilities under the VR State Grants program. A 1995 study of services provided to migrant and seasonal farmworkers with disabilities found that grants under this program are used by States to provide additional support services that assist the States in serving this population through the VR State Grants program. State VR agency personnel believe many more migrant and seasonal farmworkers with disabilities could be served if they could be located and encouraged to apply. The personnel surveyed indicated that the VR State Grants program is serving only 2 to 3 percent of the migrant and seasonal farmworkers who are potentially eligible for services. States typically use grants under this program to hire additional staff who are often bilingual and can work more effectively in conducting outreach.
PROGRAM OUTPUT MEASURES ($000s) 2008 2009 2010 Program funding: New projects $560 0 $462 Continuation projects 1,647 $2,217 1,745 Minority outreach 22 22 22 Peer review of new award applications 10 0 10
Total 2,239 2,239 2,239 Number of projects: New projects 3 0 2 Continuation projects 10 13 9 Total 13 13 11
PROGRAM PERFORMANCE INFORMATION
Performance Measures
This section presents selected program performance information, including, for example, GPRA goals, objectives, measures, and performance targets and data, and an assessment of the progress made toward achieving program results. Achievement of results is based on the cumulative effect of the resources provided in previous years and those requested in FY 2010 and future years, and the resources and efforts invested by those served by this program.
Goal: To increase employment opportunities for migrant and seasonal farmworkers who have disabilities.
Objective: Ensure that eligible Migrant and Seasonal Farmworkers with disabilities receive Vocational Rehabilitation (VR) services and achieve employment.

REHABILITATION SERVICES AND DISABILITY RESEARCH Migrant and seasonal farmworkers
J-45
Measure: The percentage of migrant or seasonal farmwokers with disabilities served by both vocational rehabilitation (VR) and the VR Migrant and Seasonal Farmworkers projects who were placed in employment.
Year Target Actual 2005 65 71 2006 65 56
65 61 2008 65 2009 65 2010 65
Assessment of progress: During fiscal year 2007, the 13 States with MSFW projects served 280 individuals, placing 172 in employment (61 percent). Four of the grantees met or exceeded the performance target (65 percent) set for fiscal year 2007. Three agencies had more than a 70 percent placement rate. Five grantees had a rate of 62 percent or more. States without a Migrant and Seasonal Farmworkers project that reported serving migratory workers in fiscal year 2007, placed in employment 56 percent of individuals served.
Previously, data collected on migrant and seasonal farmworkers served by both programs could not be interpreted because of inconsistent State VR agency reporting. States were asked to report data solely on the migrant and seasonal farmworkers served through this program. However, some State VR agencies reported data on the migrant and seasonal farmworkers served through their VR State Grants program. To ensure consistent reporting across States, the Rehabilitation Services Administration (RSA) has clarified its reporting instructions to require States to report on all migrant and seasonal farmworkers served through either program. However, there are still problems with the quality of the data, with States without projects reporting individuals served by a project.
Program Improvement Efforts
The Department is undertaking the following improvement efforts for this program:
• Annually reviewing and analyzing MSFW grantee data and RSA 911 data on migrants to ensure accuracy and to eliminate incorrect reporting by VR agencies without MSFW projects. Program staff will review and analyze performance data submitted by grantees and compare them to data submitted by States using the RSA-911. Emphasis will be placed on determining the total number of migrant and seasonal farmworkers with disabilities who received vocational rehabilitation services from individual projects and State VR agencies and 1) the number who achieved an employment outcome, and 2) the number of individuals exiting the program with or without achieving an employment outcome. RSA will complete its review of data for fiscal year 2008 in August of 2009.
• Improving oversight and monitoring through teleconference reviews and on-site monitoring visits. Staff conduct monitoring calls with each grantee during the second month of each quarter. The purpose of these calls is to discuss progress toward achievement of the goals and objectives identified in the applications and to address any

REHABILITATION SERVICES AND DISABILITY RESEARCH Migrant and seasonal farmworkers
J-46
performance issues and barriers to implementation. Technical assistance related to the performance measures and data-gathering techniques is provided. Based on a review of the annual performance reports and other criteria, staff will identify grantees that would benefit from an on-site review.
• Making data available to the public. Grantees are required to submit an annual performance report that addresses specific data elements. Staff will prepare an annual summary of findings and post the analysis of fiscal year 2008 data on RSA's Management Information System in August 2009.

REHABILITATION SERVICES AND DISABILITY RESEARCH
J-47
Recreational programs (Rehabilitation Act of 1973, Title III, Section 305)
FY 2009 Authorization ($000s): 0 1
Budget Authority ($000s): 2009 2010 Change $2,474 $2,474 0 _________________
1 The program is authorized in FY 2009 through appropriations language. Continued funding is proposed for this program in FY 2010 through appropriations language.
PROGRAM DESCRIPTION
This program provides recreational and related activities to individuals with disabilities to aid in their employment, mobility, independence, socialization, and community integration. Programs are designed to promote the development of social skills that can help individuals with disabilities integrate into the community.
This current-funded program awards discretionary grants on a competitive basis to States, public agencies, and nonprofit private organizations, including institutions of higher education. The statute requires the Federal contribution for projects funded under this authority to decrease over the 3-year project period. Grantees are required to maintain services during the second and third years of the project at the level provided in the first year. The Federal share of the costs of the project is 100 percent for the first year, 75 percent for the second year, and 50 percent for the third. The applicant is required to include a description in the application of how the project will continue after Federal assistance ends.
Funding levels for the past 5 fiscal years were as follows: ($000s) 2005............................................... $2,543
2006............................................... 2,518 2007............................................... 2,518 2008............................................... 2,474 2009............................................... 2,474
FY 2010 BUDGET REQUEST
The Administration requests $2.474 million for Recreational programs in fiscal year 2010, the same as the fiscal year 2009 appropriation. The funds requested for this program will provide seed money for 25 recreational projects. These funds will leverage non-Federal funds over the duration of the projects, since grantees are required to provide an increased level of support from non-Federal sources over their 3-year project period. In fiscal year 2010, because the

REHABILITATION SERVICES AND DISABILITY RESEARCH Recreational programs
J-48
Federal share will be reduced to 75 percent for the 7 grants in their second year, and 50 percent for the 6 grants in their third year, $1.3 million will be available for 10 new grants.
Projects funded under this program must provide recreational activities for individuals with disabilities in settings with peers without disabilities when possible and appropriate. Successful integration can greatly benefit an individual with a disability by developing skills, building self-esteem, and reducing social barriers that can prevent the individual from seeking employment in settings where there may not be any individuals with apparent disabilities. Individuals without disabilities also benefit from integrated recreational activities, as they are provided with the opportunity to learn about the abilities that individuals with disabilities possess. This knowledge is likely to positively affect the attitudes of individuals without disabilities about the capabilities of individuals with disabilities in other settings, such as in the workplace.
PROGRAM OUTPUT MEASURES ($000s) 2008 2009 2010 New awards: Number 6 9 10 Average new award $168 $134 $130 Funding $1,010 $1,209 $1,300 Continuation awards: Number 24 15 15 Funding $1,439 $1,170 $1,149 Other: Minority outreach $25 $25 $25 Peer review of new award applications 01 $70 01
Total $2,474 $2,474 $2,474 ________________
1 RSA receives hundreds of applications for this program. In order to reduce the amount of funds spent on peer review, RSA supports new grant competitions every 2 years and awards funds to grantees that were approved for funding but could not be supported with grant funds until the succeeding fiscal year. As a result there were no peer review costs in fiscal year 2008 because RSA funded applications approved for funding, but not funded, from the competition in the prior year. In fiscal year 2010, RSA will fund awards approved but not funded from the fiscal year 2009 competition if funds are appropriated for this program.
PROGRAM PERFORMANCE INFORMATION
Performance Measures
This section presents selected program performance information, including, for example, GPRA goals, objectives, measures, and performance targets and data, and an assessment of the progress made toward achieving program results. Achievement of results is based on the cumulative effect of the resources provided in previous years and those requested in FY 2010 and future years, and the resources and efforts invested by those served by this program.

REHABILITATION SERVICES AND DISABILITY RESEARCH Recreational programs
J-49
Goal: To provide individuals with disabilities recreational activities and related experience that can be expected to aid in their employment, mobility, socialization, independence and community integration.
Objective: To initiate recreational programs for individuals with disabilities that continue after Federal funding ceases. Measure: The percentage of Vocational Rehabilitation-funded Recreational Programs in operation 1, 2, or 3 years after Federal funding ceased.
Year Target Actual 2005 66 78 2006 79 79 2007 79 79 2008 80 2009 80 2010 80
Assessment of progress: The primary purpose of this program is to initiate recreational programs that will continue on their own after Federal funding ends. Grantees are required to provide an increased level of support from non-Federal sources over their 3-year project period. RSA measures the success of this program through the percentage of projects in operation 1, 2, and 3 years after Federal funding ceases. In fiscal year 2005, 78 percent of the 25 projects that received their last year of Federal support during fiscal years 2002 through 2004 were still in operation and providing recreational services to individuals with disabilities. In fiscal year 2006, 79 percent of the 33 projects that received their last year of funding during 2003 through 2005. In fiscal year 2007, 79 percent of the 24 projects that received their last year of funding during 2004 through 2006 were still in operation and providing recreational services to individuals with disabilities. Data for fiscal year 2008 will be available in December 2009.
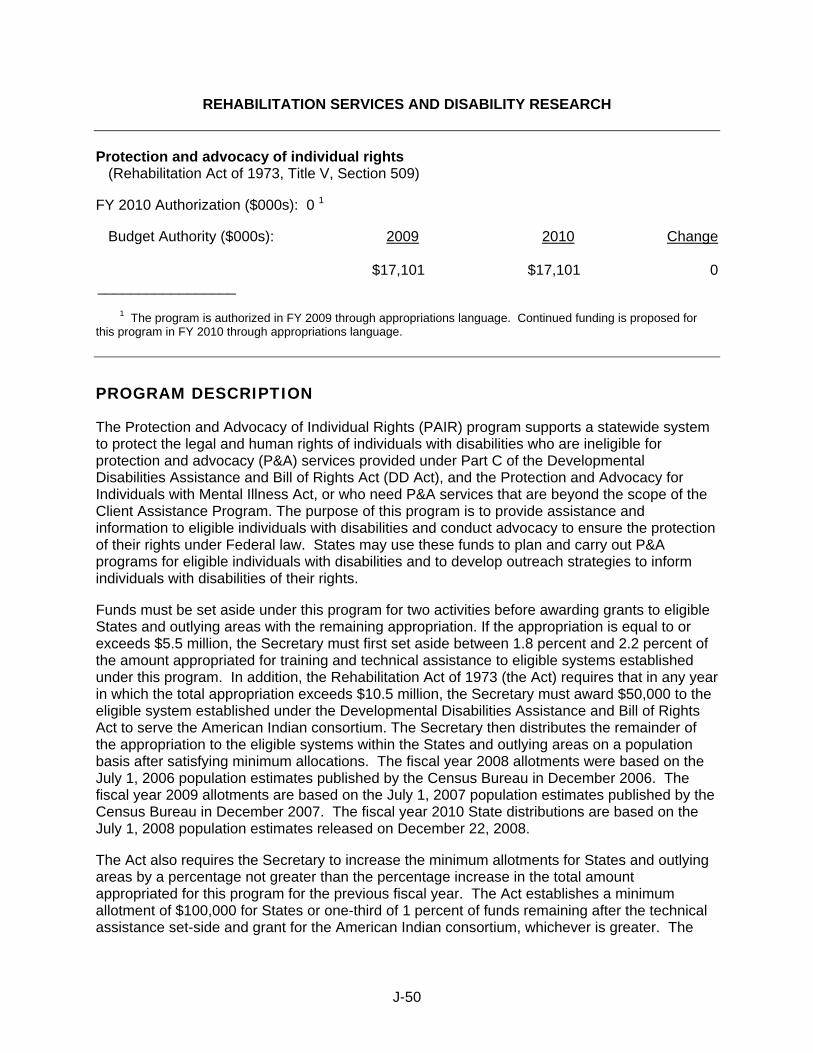
REHABILITATION SERVICES AND DISABILITY RESEARCH
J-50
Protection and advocacy of individual rights (Rehabilitation Act of 1973, Title V, Section 509)
FY 2010 Authorization ($000s): 0 1
Budget Authority ($000s): 2009 2010 Change $17,101 $17,101 0 _________________
1 The program is authorized in FY 2009 through appropriations language. Continued funding is proposed for this program in FY 2010 through appropriations language.
PROGRAM DESCRIPTION
The Protection and Advocacy of Individual Rights (PAIR) program supports a statewide system to protect the legal and human rights of individuals with disabilities who are ineligible for protection and advocacy (P&A) services provided under Part C of the Developmental Disabilities Assistance and Bill of Rights Act (DD Act), and the Protection and Advocacy for Individuals with Mental Illness Act, or who need P&A services that are beyond the scope of the Client Assistance Program. The purpose of this program is to provide assistance and information to eligible individuals with disabilities and conduct advocacy to ensure the protection of their rights under Federal law. States may use these funds to plan and carry out P&A programs for eligible individuals with disabilities and to develop outreach strategies to inform individuals with disabilities of their rights.
Funds must be set aside under this program for two activities before awarding grants to eligible States and outlying areas with the remaining appropriation. If the appropriation is equal to or exceeds $5.5 million, the Secretary must first set aside between 1.8 percent and 2.2 percent of the amount appropriated for training and technical assistance to eligible systems established under this program. In addition, the Rehabilitation Act of 1973 (the Act) requires that in any year in which the total appropriation exceeds $10.5 million, the Secretary must award $50,000 to the eligible system established under the Developmental Disabilities Assistance and Bill of Rights Act to serve the American Indian consortium. The Secretary then distributes the remainder of the appropriation to the eligible systems within the States and outlying areas on a population basis after satisfying minimum allocations. The fiscal year 2008 allotments were based on the July 1, 2006 population estimates published by the Census Bureau in December 2006. The fiscal year 2009 allotments are based on the July 1, 2007 population estimates published by the Census Bureau in December 2007. The fiscal year 2010 State distributions are based on the July 1, 2008 population estimates released on December 22, 2008.
The Act also requires the Secretary to increase the minimum allotments for States and outlying areas by a percentage not greater than the percentage increase in the total amount appropriated for this program for the previous fiscal year. The Act establishes a minimum allotment of $100,000 for States or one-third of 1 percent of funds remaining after the technical assistance set-side and grant for the American Indian consortium, whichever is greater. The

REHABILITATION SERVICES AND DISABILITY RESEARCH Protection and advocacy of individual rights
J-51
outlying areas receive a minimum allotment of $50,000. The program is current-funded but States and outlying areas may carry over unobligated Federal funds for an additional year.
Funding levels for the past 5 fiscal years were as follows: ($000s)
2005............................................... $16,656 2006............................................... 16,489 2007............................................... 16,489 2008............................................... 16,201 2009............................................... 17,101
FY 2010 BUDGET REQUEST
The Administration requests $17.101 million for the Protection and Advocacy of Individual Rights (PAIR) program in fiscal year 2010, the same as the fiscal year 2009 appropriation. Federal support for PAIR ensures that States can provide assistance and information to eligible individuals to ensure the protection of their rights under Federal law.
Each year, PAIR programs, with public input, must develop a statement of objectives and priorities, including a rationale for the selection of the objectives and priorities and a plan for achieving them. These objectives and priorities define the issues that PAIR will address during the year, whether through individual or systemic advocacy. During fiscal year 2007, PAIR programs reported representing 16,880 individuals and responding to 54,539 requests for information or referral. Of the cases handled by PAIR programs in that year, the greatest number of specified issues involved education (16 percent), employment (13 percent), government benefits/services (13 percent), and housing (10 percent). Because PAIR programs cannot address all issues facing individuals with disabilities solely through individual advocacy, they seek to change public and private policies and practices that present barriers to the rights of individuals with disabilities, utilizing negotiations and class action litigation. In FY 2007, 52 out of the 57 PAIR programs (91 percent) reported that these activities resulted in changes in policies and practices benefiting individuals with disabilities.
Examples of PAIR activities during fiscal year 2007 include the following:
The Arizona Center for Disability Law successfully represented a 45-year-old man with single-sided deafness in an administrative appeal challenging the denial of an osseointegrated implant, which replaces the function of the middle ear and allows a person with single-sided deafness to "hear" out of both ears. As a result of his hearing impairment, the client was unable to continue teaching, but the implant would allow him to return to his job. The State Medicaid program denied the implant on the basis that it was a hearing aid, a service not covered under the State Medicaid plan for adults. However, the Center was able to successfully argue that the implant was not an excluded hearing aid, but rather a covered prosthetic device. The ALJ ruled in the client's favor, and as a result, the Center was able to not only obtain coverage of the device for this client, but was also able to successfully advocate for a change to the State Medicaid program's prosthetic device coverage policy, such that now osseointegrated devices are explicitly covered by the Medicaid program for adults.

REHABILITATION SERVICES AND DISABILITY RESEARCH Protection and advocacy of individual rights
J-52
In Alabama, the National Oceanic and Atmospheric Administration (NOAA) began reviewing and improving upon existing community standards for informing people with disabilities about emergencies, especially quickly developing dangers with weather. The P&A worked with NOAA to provide information about methods of communication and the demographics of people with disabilities in Alabama. Due to the collaboration between NOAA and the Alabama P&A, people with disabilities will have instant and actionable information about potential or impending emergency weather or disaster situations in a format easily accessible to them.
The intervention of the Minnesota P&A on behalf of a deaf father of a teenager with behavioral problems resulted in enhanced communication access and policy changes. The parents placed their son in a private residential behavioral treatment program and school. This program included a series of parent and parent/child seminars that were sponsored by a third party. The school did not provide an American Sign Language (ASL) interpreter for meetings where the father was present. The seminar company also refused to provide an ASL interpreter. The client’s wife had to interpret as best she could for her husband during seminars and meetings. The P&A represented the clients in a complaint filed with the U.S. Department of Justice (DOJ) against the school and the seminar company and helped negotiate a settlement through the DOJ’s mediation program. The terms of the settlement are confidential, but did result in new policies to ensure that deaf and hard of hearing students and their parents receive the kind of auxiliary aids and services, including ASL interpreters, needed for effective communication.
As a result of intervention by the Puerto Rico P&A, a university student with a mobility disability was able to attend her graduation ceremony. The facility had no accessible route to gain access to the main area where the diplomas were to be given. A temporary ramp was constructed, and the client participated fully in her graduation. In the future, this facility will be able to offer this service to persons with disabilities, because procedures were put in place to ensure that the temporary ramp will be available to other students when needed.
PROGRAM OUTPUT MEASURES 2008 2009 2010 Information inquiries/referrals 54,539 54,539 54,539 Individuals provided case services 16,880 16,880 16,880
Note: Data for fiscal years 2008 through 2010 are projected from actual data collected for fiscal year 2007. Data for fiscal year 2008 will be available in April of 2009. PROGRAM PERFORMANCE INFORMATION
Performance Measures
This section presents selected program performance information, including, for example, GPRA goals, objectives, measures, and performance targets and data, and an assessment of the progress made toward achieving program results. Achievement of results is based on the

REHABILITATION SERVICES AND DISABILITY RESEARCH Protection and advocacy of individual rights
J-53
cumulative effect of the resources provided in previous years and those requested in FY 2010 and future years, and the resources and efforts invested by those served by this program.
Goal: To provide assistance and information to individuals with disabilities eligible for the Protection and Advocacy of Individual Rights program and conduct advocacy to ensure the protection of their rights under Federal law.
Objective: Identify problem areas requiring systemic change and engage in systemic activities to address those problems.
Measure: The percentage of PAIRs that reported that their systemic advocacy resulted in a change in policy or practice.
Year Target Actual 2005 79 89 2006 80 84 2007 83 91 2008 83 2009 83 2010 85
Assessment of progress: Because PAIR programs cannot address all issues facing individuals with disabilities solely through individual advocacy, they seek to change public and private policies and practices that present barriers to the rights of individuals with disabilities, utilizing negotiations and class action litigation. The targets for fiscal years 2007 through 2010 were previously increased from 80 percent to 83 percent, which was reached by averaging the actual performance over the fiscal years 2003 through 2005. Of the 57 PAIRs, 51 (89 percent) reported successful systemic change in fiscal year 2005, and 48 (84 percent) reported success on this measure in fiscal year 2006. In fiscal year 2007, 52 of the 57 (91 percent) PAIRS reported success on this measure. The Rehabilitation Services Administration (RSA) has increased the target for 2010 to 85 percent, based on the average of actual performance for fiscal years 2003 through 2007. Fiscal year 2008 data will be available in April of 2009.
Other Performance Information
In 1998, RSA contracted for an independent evaluation of the PAIR program in order to learn more about the services each PAIR is providing to individuals with disabilities and how each PAIR grantee establishes its annual priorities. PAIRs reported considerable difficulties in trying to serve the large numbers of persons with disabilities who are eligible for the program. PAIR staff could not estimate how many individuals eligible for PAIR go unserved but believe the number to be significant.

REHABILITATION SERVICES AND DISABILITY RESEARCH
J-54
Projects with industry (Rehabilitation Act of 1973, Title VI, Part A)
FY 2010 Authorization ($000s): 0 1
Budget Authority ($000s): 2009 2010 Change $19,197 $19,197 0 _________________
1 The program is authorized in FY 2009 through appropriations language. Continued funding is proposed for this program in FY 2010 through appropriations language.
PROGRAM DESCRIPTION
The purpose of the Projects With Industry (PWI) program is to create and expand job and career opportunities for individuals with disabilities in the competitive labor market by engaging the participation of business and industry in the rehabilitation process. PWI projects promote the involvement of business and private industry through Business Advisory Councils (BACs) that identify jobs and careers available in the community and provide advice on needed skills and training. BACs are required to identify job and career availability within the community, consistent with the current and projected local employment opportunities identified by the local workforce investment board for the community under the Workforce Investment Act of 1998 (WIA).
This current-funded program provides job development, job placement, and career development services, and, to the extent appropriate, training services to assist individuals with disabilities to obtain or advance in employment in the competitive labor market. Projects must determine eligibility for services in a manner consistent with section 102 of the Rehabilitation Act.
PWI grants are made to a variety of agencies and organizations, including business and industrial corporations, community rehabilitation programs, labor organizations, trade associations, and foundations. Competitive grants are awarded for a period of up to 5 years and may not exceed 80 percent of the total cost of a project. New awards may be made only to projects proposing to serve geographic areas that are unserved or underserved by the PWI program.
PWI grantees must provide to the Commissioner of the Rehabilitation Services Administration (RSA) an annual evaluation of project operations in accordance with the established program standards and compliance indicators. Data and information contained in the report include the number of individuals with disabilities served, the number of individuals with disabilities who achieved a competitive employment outcome, improvement of participants’ employment status and earning power following services, and employment retention. In addition, continuation awards may be made only to grantees that are carrying out the provisions of their approved grant application. In order to receive continuation funding for the third and subsequent years,

REHABILITATION SERVICES AND DISABILITY RESEARCH Projects with industry
J-55
grantees must meet the above requirements and also demonstrate compliance with the performance indicators by submitting data for the most recent complete project year. If a grantee does not demonstrate compliance on the basis of the previous year’s data, the grantee has an additional opportunity to demonstrate compliance with the standards by submitting data from the first 6 months of the current project year.
Funding levels for the past 5 fiscal years were as follows: 2005 ................................................ $21,625 2006 ................................................ 19,538 2007 ................................................ 17,2931 2008 ................................................ 19,197 2009 ................................................ 19,197 _________________
1 In FY 2007, funds amounting to $2,245,030 were not needed to make planned continuation awards because six projects did not demonstrate sufficient performance to receive continuation funding and one project declined its FY 2007 award. These funds were transferred to the Demonstration and Training program (section 303 of the Rehabilitation Act). FY 2010 BUDGET REQUEST
The Administration requests $19.197 million for PWI, the same as the 2009 appropriation. This request would support continuation awards to 66 projects that received new awards in fiscal year 2008. Although there is wide variation in grantee performance, project data indicates that individuals served by PWI projects achieve employment outcomes that are comparable to the outcomes of other vocational rehabilitation employment programs. PWI placed 4,842 individuals with significant disabilities into competitive employment positions in fiscal year 2007.
PROGRAM OUTPUT MEASURES ($000s) 2008 2009
2010
Continuation projects: 0 $19,005 $19,005 Number 0 66 66 Average Award 0 $288 $288
New projects: $18,900 0 0
Number 66 0 0
Average Award $286 0 0
Peer review of new award applications
$105 0 0
Minority outreach $192 $192 $192

REHABILITATION SERVICES AND DISABILITY RESEARCH Projects with industry
J-56
PROGRAM PERFORMANCE INFORMATION
Performance Measures
This section presents selected program performance information, including, for example, GPRA goals, objectives, measures, and performance targets and data, and an assessment of the progress made toward achieving program results. Achievement of program results is based on the cumulative effect of the resources provided in previous years, and the resources and efforts invested by those served by this program.
Goal: To facilitate the establishment of partnerships between rehabilitation service providers and business and industry in order to create and expand employment and career advancement opportunities for individuals with disabilities. Objective: Ensure that PWI services (through partnerships with business and industry) result in competitive employment, increased wages, and job retention for individuals with disabilities.
Measure: Percentage of individuals served who were placed into competitive employment. Year Target Actual 2005 63 52 2006 63 56 2007 55 63 2008 56 2009 57 2010 63
Assessment of progress: In order to make PWI performance measures comparable to other job training programs, RSA revised the program’s data collection package used for reporting on FY 2005 and beyond to include additional data elements that are comparable to those collected for other job training programs. Additional data elements include the total number served and number of individuals exiting the program during the reporting period.
In assessing program performance, it should be noted that there is wide variation among grantees in the data reported and in their performance. For example, although the average number of individuals placed per project was 68, the number ranged from 1 to 325 with a median of 55. Project placement rates ranged from 5.5 percent to 90.6 percent with a median of 58.1 percent. Similarly, while the average number served per project was 121, the number ranged from 13 to 808 with a median of 101. Fiscal year 2008 data are expected in April 2009.
The Department has added a new outcome measure that will measure the percentage of PWI participants exiting the program who are placed in competitive employment. Data to support this indicator were collected in FY 2006 and 2007 reporting periods. However, there are inconsistencies in the data that suggest that the projects did not collect and report the data accurately. RSA provided technical assistance to address this problem. In addition, RSA

REHABILITATION SERVICES AND DISABILITY RESEARCH Projects with industry
J-57
provided new instructions to grantees for completing the data collection. The revised instructions further clarify how grantees should collect and report data on program exits.
Measure: Average increase in weekly earnings in dollars of individuals who are placed in competitive employment.
Year Target Actual 2005 $238 $253 2006 $245 $248 2007 $248 $270 2008 $250 2009 $255 2010 $263
Assessment of progress: In fiscal year 2007, the average change in earnings for participants placed in competitive employment from the time of project entry was $270, a slight increase from the level reported for 2006. The average change in earnings reported by projects ranged from a decrease of $45 to an increase of $530, with a median of a $262 increase. The program continues to exceed the targets set for this measure. Fiscal year 2008 data are expected in April 2009.
Efficiency Measures
Measure: The percentage of Projects With Industry projects whose annual average cost per placement is no more than $7,000.
Year Target Actual 2006 56 2007 75 2008 2009 2010 77
This measure replaces the prior measure that focused on the percentage of projects with a cost per placement of no more than $11,000. As a result of substantial increases in the number of placements reported by projects in FY 2007, only a small number of non-representative projects reported a cost per placement in excess of $11,000. The new measure is more reflective of the general trends in cost per placement. For the purpose of this measure, the annual cost per placement is calculated as annual Federal project funds divided by the total number of placements in the reporting period. The average annual cost per placement for the 73 projects operating in fiscal year 2007 was $5,514. However, the annual cost per placement ranged from $379 to $32,025, with a median of $4,237. Fiscal year 2008 data are expected in April 2009.

REHABILITATION SERVICES AND DISABILITY RESEARCH Projects with industry
J-58
Measure: The percentage of Projects With Industry projects whose annual average cost per participant is no more than $4,500.
Year Target Actual 2006 75.6 2007 79.5 2008 78.5 2009 78.5 2010 80.0
PWI is part of the Job Training Common Measure initiative. The common efficiency measure for job training programs is the cost per participant. Cost per participant is calculated as annual Federal project funds divided by the total number of persons served during the reporting period. For fiscal year 2007, the average annual cost per participant was $3,270, with a range of $239 to $15,926, and a median of $2,500. Fiscal year 2008 data are expected in April 2009. Other Performance Information Grantee Performance on Program Compliance Indicators
PWI grantees must provide an annual evaluation of project operations in accordance with the established program standards and compliance indicators. In order to receive continuation funding for the third and subsequent years, grantees must demonstrate compliance with the performance indicators established in program regulations by submitting data for the most recent complete project year. Program compliance indicators place an emphasis on services to individuals who are considered most in need of PWI services due to their impaired capacity to obtain competitive employment. In 2007, approximately 87.6 percent (7,466) of the total number of individuals served and 90.6 percent (4,842) of the total number of individuals placed in competitive employment were individuals with significant disabilities. In 2007, 70.0 percent (5,961) of total individuals served and 74.9 percent (4,006) of the total number of individuals placed had been unemployed at least 6 months at the time of project entry. Evaluation of the Projects With Industry Program
Assessment of the PWI program is limited by the credibility of the data. In a Department-funded evaluation of the PWI program published in December 2003, the evaluators documented numerous concerns with the data collected and reported by PWI projects. In their review of participant files maintained by the 30 PWI projects visited during the study, the evaluators frequently encountered files lacking essential information, raising doubts about the quality and accuracy of the data that projects submit in compliance indicators reports. The project survey asked all respondents to report “the number of persons who achieved placement (i.e., a competitive employment outcome for a minimum of 90 days) during FY 2001,” information identical to that required by the compliance indicators. A comparison of data submitted by projects on the two forms (i.e., project survey and compliance indicator reports), each of which asks for data from FY 2001, found that 19 of the 92 responding projects reported different numbers for persons placed during the year, including several that differed by more than

REHABILITATION SERVICES AND DISABILITY RESEARCH Projects with industry
J-59
50 percent. The final report states that the fact “that one-fifth of the projects provided inconsistent information on such a fundamentally important variable as the number of persons placed raises serious questions about the accuracy of other data reported in compliance indicator submissions.” Program Improvement Efforts
The Department is working to address several weaknesses that are impairing the program’s effectiveness. Details on the problems identified and the Department’s progress in addressing those problems are given below:
Inconsistent Data Quality:
The Department is working to resolve problems with the quality of grantee reported data by providing grantees with additional guidance and support, improving the web-based reporting system, and directly contacting projects to resolve data anomalies. RSA begins the data collection process by providing each project with instructions on form completion and holding conference calls to answer specific questions that are not addressed in the instructions. After the projects submit their data, RSA reviews each submission and contacts grantees to resolve any anomalies. RSA is also in the process of incorporating additional edit checks to the web-based reporting system; these checks increase the efficiency of the data collection and review process by preventing projects from submitting inconsistent data. As of fiscal year 2007, several grantees continue to have difficulties collecting and accurately reporting data on individuals exiting the program. The Department has revised the program’s data collection to clarify reporting on program exits and expects to use the new forms for new grantees in time for the 2009 reporting cycle.
Measure Comparability:
The Department revised the program’s data collection package to make PWI performance measures comparable to similar employment programs. The data collection package now includes data on total number served and number of individuals exiting the program. The data on the number of individuals exiting the program will allow the Department to calculate a measure of the competitive employment rate that can be compared with those for other RSA employment programs. Data on total number served will provide a count of both individuals who entered the project during the reporting period and those from the previous reporting cycle who continued to receive services. These data will be used in assessing performance using the common job training measure of cost per participant. As mentioned above, anomalies in the reporting of the new data items indicate that many grantees did not correctly report the required data. As a result, the FY 2007 data on program exits cannot be used in measuring program performance.
A recent study found significant barriers to fully implementing the job training common measures in the PWI program, including grantees' capacity for data collection and reporting and grantees’ ability to access and use Unemployment Insurance Wage (UI) Records. The report suggests that supplemental data sources are the most practical alternative due to grantees’ difficulties in accessing and using UI Records. The Department is working with the Office of

REHABILITATION SERVICES AND DISABILITY RESEARCH Projects with industry
J-60
Management and Budget to develop a feasible approach to collecting comparable data to evaluate the long-term impact of PWI services on the retention of jobs and earnings of program participants. A revised PWI data collection that would provide more comparable data will be implemented for use by the 66 new projects that were awarded in FY 2008. These projects will report on their first-year performance (FY 2009) in December of 2009.
Management Information System:
The Department is working to use project data to better manage and improve the program. Project performance data are now managed through a web-based management information system (MIS). In addition, the Department is increasing data transparency by publishing all program data, including aggregate and grantee level data, on the Department website. RSA staff used FY 2006 grantee efficiency measure data to identify low-performing grantees needing technical assistance. In addition, project performance is discussed during quarterly conference calls between grantees and program officers. The public can access published program data in the MIS through the Department’s website at http://www.ed.gov/programs/rsapwi/performance.html.

REHABILITATION SERVICES AND DISABILITY RESEARCH
J-61
Supported employment State grants (Rehabilitation Act of 1973, Title VI, Part B)
FY 2010 Authorization ($000s): 01
Budget Authority ($000s): 2009 2010 Change $29,181 $29,181 0 _________________
1 The program is authorized in FY 2009 through appropriations language. Continued funding is proposed for this program in FY 2010 through appropriations language.
PROGRAM DESCRIPTION
The purpose of the Supported Employment (SE) State grants program is to assist States in developing collaborative programs with appropriate public and private nonprofit organizations to provide supported employment services for individuals with the most significant disabilities. Under this formula grant program, State vocational rehabilitation (VR) agencies receive supplemental funds to assist VR consumers with the most significant disabilities in achieving the employment outcome of supported employment. The term “supported employment” includes both competitive work and working in an integrated setting toward competitive work. Individuals in competitive employment must earn at least the minimum wage.
Supported employment placements are achieved by augmenting short-term vocational rehabilitation services (supported employment services) with ongoing support provided by other public or nonprofit agencies or organizations (extended services). State VR agencies provide time-limited services for a period not to exceed 18 months, unless a longer period to achieve job stabilization has been established in the individualized plan for employment (IPE). Once this period has ended, the State VR agency must arrange for “extended services” provided by other appropriate State agencies, private nonprofit organizations or other sources for the duration of that employment.
An individual's potential for supported employment must be considered as part of the assessment to determine eligibility for the Title I Vocational Rehabilitation State Grants program. The requirements pertaining to individuals with an employment goal of supported employment are the same in both the Title I VR State Grants program and the Title VI-B SE State Grants program. A State VR agency may support an individual’s supported employment services solely with VR State Grant funds, or it may fund the cost of SE services in whole or in part with funds under the SE State Grants program. Title VI-B SE funds may only be used to provide supported employment services and are essentially used to supplement Title I funds.
To be eligible for this current-funded formula grant program, States must submit a supplement to their Title I VR State Grants program plan. Funds are distributed on the basis of population, except that no State receives less than $300,000, or one-third of 1 percent of the sums

REHABILITATION SERVICES AND DISABILITY RESEARCH Supported employment State grants
J-62
appropriated, whichever is greater. The minimum allotment for Territories is one-eighth of 1 percent of the sums appropriated. The fiscal year 2008 allotments were based on the July 1, 2006 population estimates published by the Census Bureau in December 2006. The fiscal year 2009 State allotments are based on the July 1, 2007 estimates published in December 2007. The fiscal year 2010 State distributions are based on the July 1, 2008 estimates released on December 22, 2008. Fiscal year 2010 distributions are subject to minor revision if new population estimates become available for American Samoa, the Commonwealth of the Northern Mariana Islands, Guam, and the U.S. Virgin Islands. States may carry over unobligated funds to the next fiscal year.
Funding levels for the past 5 fiscal years were as follows: ($000s) 2005 ................................................ $37,379 2006 ................................................ 29,700 2007 ................................................ 29,700 2008 ................................................ 29,181 2009 ................................................ 29,181
FY 2010 BUDGET REQUEST
The Administration requests $29.181 million for Supported Employment State Grants program, the same as the fiscal year 2009 appropriation. Supported employment is now an integral part of the VR State Grants program and is recognized as an effective strategy in assisting individuals with the most significant disabilities to obtain competitive employment in integrated settings. State VR agencies may also use funds provided under the Recovery Act for the VR State Grants program, much of which is likely to be available for use during the same period of availability as the fiscal year 2010 funds requested for this program, to provide supported employment services.
Data from the FY 2007 RSA 911 Case Service Report show that approximately 38,000 individuals whose cases were closed that year after receiving services had a goal of supported employment on their individualized plan for employment at some time during their participation in the VR program. About 54 percent of those individuals received at least some support for their supported employment services from Title VI-B funds. These numbers do not include those individuals who were still receiving supported employment services at the close of the fiscal year.
On a national level, individuals who had a goal of supported employment represented about 11 percent of the total individuals whose cases were closed after receiving VR services in FY 2007. However, program data indicate there is significant variation among State agencies in the percentage of individuals who have SE as an employment goal. For example, RSA-911 2007 State data show that the percentage of individuals with a SE goal of all individuals whose service records were closed after receiving services ranged from 0 to 28 percent. These data also show that, for 7 of the 56 State VR agencies, excluding agencies for the blind, 20 percent

REHABILITATION SERVICES AND DISABILITY RESEARCH Supported employment State grants
J-63
or more of all individuals receiving services had a SE goal, while for 16 of the agencies, less than 5 percent of all individuals receiving services had a SE goal.
PROGRAM OUTPUT MEASURES ($000s) 2008 2009 2010 Individuals with a supported employment IPE goal who received services and exited the program.
38,500
38,800
39,000
Employment outcomes: 1 22,900 23,025 23,150
Supported employment outcomes 2
14,670 14,700 14,800
Employment without supports in an integrated setting3 8,100
8,125
8,150
Other employment outcomes4 200 200 200 Minority outreach $292 $292 $292
Note: Estimates are based on actual 2006 and 2007 closure data from the RSA-911 Case Service Report for all VR consumers with a supported employment goal identified on their IPE (including consumers who received support for SE services under Title I and/or under Title VI-B).
1 Includes employment outcomes for VR consumers who had or are estimated to have a supported employment goal. 2 Of the individuals who had a supported employment goal, the number who were employed in an integrated setting
and receiving ongoing support services. 3 Of the individuals who had a supported employment goal, the number who met the employment outcome criteria for
the VR State Grants program but who were not receiving ongoing support services. 4 Of the individuals who had a supported employment goal, the number who met the employment outcome criteria for
the VR State Grants program who were either self-employed, employed in a Business Enterprise Program, a family worker, or a homemaker.
PROGRAM PERFORMANCE INFORMATION
Performance Measures
This section presents program performance information, including, for example, GPRA goals, objectives, measures, and performance targets and data, and an assessment of the progress made toward achieving program results. Achievement of program results is based on the cumulative effect of the resources provided for this program and the Vocational Rehabilitation State Grants program in previous years and those requested in FY 2010 and future years, and the resources and efforts invested by those served by these programs.
Goal: Individuals with significant disabilities with a goal of supported employment will achieve high quality employment.
Objective: Increase the competitive employment outcomes of individuals with significant disabilities who receive supported employment services.

REHABILITATION SERVICES AND DISABILITY RESEARCH Supported employment State grants
J-64
Measure: Of those individuals with significant disabilities who had a supported employment goal and achieved an employment outcome, the percentage who obtained competitive employment, including individuals who receive supported employment services funded under the VR State Grants program and/or the Supported Employment State Grants program.
Year Target Actual 2005 93 93 2006 93 94 2007 93 94 2008 94 2009 94 2010 95
Assessment of progress: Individuals with a supported employment goal who achieve an employment outcome may be working in competitive employment (employment at least at the minimum wage in an integrated setting) or may be working in an integrated setting toward competitive work (receipt of the minimum wage). The performance targets have been met or exceeded each year.
In Fiscal year 2007, approximately 22,713 individuals, or 60 percent of individuals whose service records were closed after receiving services who had a SE goal, including both consumers who received support for SE services under Title I and under Title VI-B, achieved an employment outcome. Of those who achieved an employment outcome, 94 percent of individuals with a supported employment goal achieved a competitive employment outcome. Fiscal year 2007 RSA 911 Case Service Report data also show that 64 percent of the individuals who had a SE goal and achieved an employment outcome obtained a supported employment outcome (employment in the integrated labor market and receiving ongoing supports) and about 92 percent of those obtaining a supported employment outcome were in competitive employment. Data for FY 2008 is expected to be available in April 2009.
The Department established a new measure in FY 2008 to monitor the average weekly earnings of individuals with significant disabilities who achieved a supported employment outcome. As previously stated, individuals with significant disabilities in supported employment may be working in competitive employment or may be working in an integrated setting toward the receipt of the minimum wage. Performance data for this measure are calculated by dividing the average weekly earnings for all individuals who obtained a supported employment outcome with earnings by the total number of individuals who obtained a supported employment outcome with earnings. Performance data do not include individuals served by State VR agencies for the Blind. Performance targets for this measure will be set in FY 2009 and future years based on 2007 and 2008 data. Nationally, the average weekly earnings of individuals with significant disabilities who achieved a supported employment outcome were $197 in FY 2007. However, among agencies, average weekly earnings ranged from a low of $63 to a high of $411, with a median of $173.

REHABILITATION SERVICES AND DISABILITY RESEARCH Supported employment State grants
J-65
Efficiency Measure The efficiency measure developed by the Department for the Supported Employment State Grants program examines the percentage of State VR agencies whose cost per supported employment outcome is within a specified range. For the purpose of this measure, the annual cost per outcome will be calculated by dividing the amount of a State agency’s allocation under this program by the total number of supported employment outcomes. The Department will use fiscal year 2007 and 2008 data to establish a baseline and performance range and set performance targets.
Program Improvement Efforts
The Department is undertaking the following improvement efforts for this program.
• Improving the collection and reporting of supported employment-related data. The Department collects and compiles a variety of SE-related data from the RSA-911 Case Service Report and the RSA-2 Cost Report that are reported by State VR agencies on an annual basis. Recent monitoring visits and analyses of State data revealed inconsistencies in how State agencies report SE-related data in the R-911 Case Service Report. In response, the Department issued guidance clarifying the reporting of employment status at closure with respect to supported employment outcomes. A contract was awarded in Sept. 2008 to assist the Department in improving the collection and reporting of VR data, including supported employment related data.
• Improving the use and transparency of national and State data to manage and improve the program. Supported employment outcome data are included in each State's Annual Review Report and are accessible through the Department's website in RSA's Management Information System. SE-related performance data are now used in conducting State Vocational Rehabilitation agency onsite monitoring and the data were included in the FY 2008 monitoring reports. Current efforts to improve the collection and reporting of SE data will improve the future use and transparency of the data.
• In fiscal year 2009, the Department will initiate the first phase of a multi-phase evaluation of the State Supported Employment Grants program with funds provided under the section 14, evaluation authority. One of the objectives of this effort will be to enhance the Department’s understanding of how State VR agencies use their title VI, Part B funds, in conjunction with funds provided under the title I VR State Grants program, (both fiscally and programmatically) to assist individuals with significant disabilities to obtain a supported employment outcome.

REHABILITATION SERVICES AND DISABILITY RESEARCH
J-66
Independent living (Rehabilitation Act of 1973, Title VII, Parts B and C, and Chapter 2)
Independent living State grants: Chapter 1, Part B Centers for independent living: Chapter 1, Part C Services for older individuals who are blind: Chapter 2
FY 2010 Authorization ($000s): 0 1
Budget Authority ($000s): 2009 2010 Change Independent living State grants $23,450 $23,450 0 Centers for independent living 77,266 80,266 +$3,000 Services for older individuals who are blind 34,151 34,151 0 Recovery Act appropriation 140,000 0 -140,000 _________________
1 The program is authorized in FY 2009 through appropriations language. Continued funding is proposed for this program in FY 2010 through appropriations language.
PROGRAM DESCRIPTION
The purpose of the independent living programs is to maximize the leadership, empowerment, independence, and productivity of individuals with disabilities, and to integrate these individuals into the mainstream of American society. Independent living programs provide financial assistance to provide, expand, and improve independent living services; develop and support Statewide networks of centers for independent living; and improve working relationships among State independent living rehabilitation programs, centers for independent living, Statewide Independent Living Councils, Rehabilitation Act programs outside of Title VII, and other relevant Federal and non-Federal programs.
The independent living programs are current-funded. However, the Act contains a provision allowing all Title VII grantees to carry over funds that are not obligated and expended by the recipient for an additional fiscal year. States participating in the State Grants and Older Blind programs must match 10 percent of their grant with non-Federal cash or in-kind resources in the year for which the Federal funds are appropriated.
To be eligible for financial assistance under the Independent Living State Grants or Centers for Independent Living program, States are required to establish a Statewide Independent Living Council (SILC). Each State must also submit a State Plan for Independent Living that is jointly developed and signed by the director of the designated State vocational rehabilitation unit(s) (DSU) and the chairperson of the SILC.
The Independent Living State Grants program supports formula grants to States, with funds allotted based on total population. The fiscal year 2009 State distributions are based on the July 1, 2007 population estimates published by the Census Bureau in December 2007. The fiscal year 2010 State distributions are based on the July 1, 2008 population estimates released

REHABILITATION SERVICES AND DISABILITY RESEARCH Independent living
J-67
in December 2008. States may use these funds to provide resources to support the operation of the SILC and for one or more of the following purposes:
• to demonstrate ways to expand and improve independent living services;
• to provide independent living services;
• to support the operation of centers for independent living;
• to increase the capacity of public or nonprofit agencies and organizations and other entities to develop comprehensive approaches or systems for providing independent living services;
• to conduct studies and analyses, gather information, develop model policies and procedures, and present information, approaches, strategies, findings, conclusions, and recommendations to Federal, State, and local policymakers;
• to provide training on the independent living philosophy; and
• to provide outreach to populations who are unserved or underserved by programs under this title, including minority groups and urban and rural populations.
The Centers for Independent Living (CIL) program provides grants for consumer-controlled, community-based, cross-disability, nonresidential, private nonprofit agencies that are designed and operated within a local community by individuals with disabilities and provide an array of independent living services. At a minimum, centers are required to provide the core services of information and referral, independent living skills training, peer counseling, and individual and systems advocacy. Most centers are also actively involved in one or more of the following activities: community planning and decisionmaking; school-based peer counseling, role modeling, and skills training; working with local governments and employers to open and facilitate employment opportunities; interacting with local, State, and Federal legislators; and staging recreational events that integrate individuals with disabilities with their non-disabled peers.
A population-based formula determines the total amount that is available for discretionary grants to centers in each State. In most cases, the Department awards funds directly to centers for independent living. If State funding for CIL operation exceeds the level of Federal CIL funding in any fiscal year, the State may apply for the authority to award grants under this program through its DSU. There are currently only two States, Massachusetts and Minnesota, that are both eligible and have elected to manage their own CIL programs.
In addition to funding centers for independent living, the Department must award between 1.8 and 2 percent of the funds appropriated under this part for grants, contracts, or cooperative agreements to provide training and technical assistance with respect to planning, developing, conducting, administering, and evaluating centers for independent living. Each State must submit an annual performance report providing information regarding the centers’ and SILCs’ most pressing training and technical assistance needs.
The Rehabilitation Act establishes a set of standards and assurances that centers for independent living must meet and requires the Department to develop and publish indicators of

REHABILITATION SERVICES AND DISABILITY RESEARCH Independent living
J-68
minimum compliance with the standards. These standards and assurances are used in evaluating compliance in the following areas: philosophy, including consumer control and equal access; provision of services on a cross-disability basis; support of the development and achievement of the independent living goals chosen by consumers; advocacy to increase the quality of community options for independent living; provision of independent living core services; resource development; and community capacity-building activities, such as community advocacy, technical assistance, and outreach. Each year, the Department must conduct compliance reviews of at least 15 percent of the centers and one-third of the designated State units funded under this part.
The Rehabilitation Act requires the Department to award grants to any eligible agency that had been awarded a grant as of September 30, 1997. In effect, all centers funded by the end of fiscal year 1997 are "grandfathered in" and thus guaranteed continued funding as long as they continue to meet program and fiscal standards and assurances.
The Independent Living Services for Older Individuals Who Are Blind program supports services to assist individuals aged 55 or older whose recent severe visual impairment makes competitive employment extremely difficult to obtain, but for whom independent living goals are feasible. Funds are used to provide independent living services, conduct activities that will improve or expand services for these individuals, and conduct activities to improve public understanding of the problems of these individuals. Services are designed to help persons served under this program to adjust to their blindness by increasing their ability to care for their individual needs. Services provided under this program are typically not covered under private insurance or Medicaid.
Grantees are State vocational rehabilitation agencies for persons who are blind and visually impaired or, in States with no separate agency for persons who are blind, State combined vocational rehabilitation agencies. When appropriations for this program exceed $13 million—as they have since fiscal year 2000—awards are distributed to States according to a formula based on the population of individuals who are 55 years of age or older. The fiscal year 2009 and 2010 allotments are based on the resident population of individuals 55 years of age or older as of April 1, 2008. 2010 allotments will be revised when new population estimates by age group become available.
American Recovery and Reinvestment Act of 2009
The Independent Living State Grants, Centers for Independent Living, and Services for Older Individuals Who are Blind received significant one-time additional appropriations of funds under the American Recovery and Reinvestment Act of 2009 (the Recovery Act) of $18.2 million, $87.5 million, and $34.3 million respectively. These funds are available for obligation by the Department through September 30, 2010. As discussed above, the Rehabilitation Act contains a provision allowing all Title VII grantees to carry over funds that are not obligated and expended by the recipient for an additional fiscal year, so these funds are available for obligation and expenditure by grantees until September 30, 2011.
The funds appropriated under the Recovery Act are considered a supplemental to the regular 2009 appropriation for these programs and are being combined with the regular appropriations

REHABILITATION SERVICES AND DISABILITY RESEARCH Independent living
J-69
for purposes of calculating the allocations to States according to each program’s statutory formula. The Recovery Act funds for the IL State Grants and Services for Older Individuals Who are Blind programs were awarded in April 2009. The funds appropriated under the Recovery Act are subject to the requirements of the authorizing statute for each of these programs. Since these funds are also subject to additional reporting and transparency requirements in the Recovery Act and are available for obligation for an additional year, the Recovery Act funds are apportioned under separate Treasury accounts and awarded as separate grants from the 2009 appropriation.
Under the Centers for Independent Living program, any additional funds beyond those required to continue support for and provide cost of living adjustments to existing centers may be used to award new grants for centers to provide independent living services to unserved or underserved areas in each State. The Department expects that the significant one-time additional appropriation of $87.5 million under the Recovery Act will allow for awards for new centers in many States, consistent with the approved State Plans for Independent Living. These new centers would expand the provision of independent living services to unserved or underserved areas of these States.
The Administration’s overall guidance for use of Recovery Act funds includes the following principles that are particularly relevant for the Independent Living programs: (1) spend funds quickly to save and create jobs; (2) ensure transparency, reporting, and accountability; and (3) invest one-time Recovery Act funds thoughtfully so as to minimize any “funding cliff” when they are no longer available. Specific examples of activities that are consistent with these principles include the following:
• Designing or identifying and providing services that may be extended at low cost beyond 2012 to additional individuals who wish to transition from nursing homes to their communities;
• Creating more efficient and effective ways of increasing IL services to students with disabilities transitioning from school to employment and independent living;
• Building long-term capacity by improving the technological core of the program, including, but not limited to, purchasing equipment, improving electronic network connections, and obtaining software in order to better serve consumers;
• Training current staff in effective ways of providing assistive technology to consumers;
• Expanding information and referral and advocacy services to address the needs of consumers who were laid off and may need assistance replacing services or assistive technology previously provided through an employer; and
• Providing professional development opportunities that have both short-term and long-term benefits to service provider staff.

REHABILITATION SERVICES AND DISABILITY RESEARCH Independent living
J-70
Funding levels for the past 5 fiscal years were as follows: ($000s)
State grants 2005......................................... $22,816 2006......................................... 22,588 2007......................................... 22,588 2008......................................... 22,193
2009......................................... 23,450 Recovery Act ........................... 18,200
Centers for independent living
2005......................................... $75,392 2006......................................... 74,638 2007......................................... 74,638 2008......................................... 73,334
2009......................................... 77,266 Recovery Act ........................... 87,500
Services for older individuals who are blind
2005......................................... $33,227 2006......................................... 32,895 2007......................................... 32,895 2008......................................... 32,320
2009......................................... 34,151 Recovery Act ........................... 34,300
FY 2010 BUDGET REQUEST
The Administration requests $23.5 million for the Independent Living State Grants (State Grants) program, $80.3 million for the Centers for Independent Living program (CIL), and $34.2 million for the Independent Living Services for Older Individuals Who are Blind (Older Blind) program. The requested funds for each program would be level with the 2009 regular appropriation.
State Grants and Centers for Independent Living
The Administration requests $23.5 million for the State Grants program, level with fiscal year 2009, and $80.3 million for the CIL program, an increase of $3 million over 2009. Funds requested for the State Grants program would continue the Department's support of 78 designated State units (DSUs) that use grant funds to support Statewide Independent Living Councils (SILCs), provide independent living services in unserved and underserved geographic areas, promote coordination among centers for independent living, and provide assistance to new centers for independent living. An estimated 60 percent of State Grant funds are used to provide independent living services, either directly or through grants and contracts with centers

REHABILITATION SERVICES AND DISABILITY RESEARCH Independent living
J-71
for independent living and other providers. These services include skills training, communication services, and the provision of assistive devices and equipment.
The Administration’s request for the CIL program would help maintain services provided by existing centers, including any new center grants awarded in 2009. Since 2000, funding for this program has increased by 61 percent (excluding the Recovery Act funds), resulting in approximately 65 new centers and increased support for existing centers to better serve unserved and underserved populations. Centers provide essential services that help persons with disabilities to live independently and participate fully in activities within their communities.
Older Blind
The Administration requests $34.2 million for the Independent Living Services for Older Individuals who are Blind program for fiscal year 2010, the same as the regular 2009 appropriation. According to the 2000 census, 14.2 percent (about 4.7 million) of individuals 65 and older report having trouble with vision or hearing. The occurrence of a sensory disability was more than six times greater among older adults than working-age people. For this reason, the Administration believes a sustained investment in this program is warranted. At the requested funding level, an estimated 16 States would receive the minimum award of $225,000, and the Territories would continue to be funded at the minimum level.
PROGRAM OUTPUT MEASURES ($000s) 2008 2009 2010 Independent Living State Grants:
Number of Grantees 78 78 78
Minimum State award $296 $556 $313 Average State award $420 $789 $444 Minority outreach $222 $417 $235
Centers for Independent Living: Minimum State Allocation $785 $1,177 $859 States over the minimum allotment 28 36 27 Average State allocation $1,357 $3,061 $1,489 Largest State allocation $7,164 $17,824 $7,830 Minority outreach $733 $1,648 $803 Training and Technical Assistance $1,467 $2,966 $1,445 Peer review $1 $100 1 0
Services for Older Individuals Who Are Blind:
Number of Grantees 56 56 56 Average State award $612 $1,300 $647Minority outreach $323 $685 $323
1 The amount of funding required for peer review in 2009 will depend upon the number of new center grants required under State Plans for Independent Living due to the additional funding appropriated for this program under the Recovery Act.
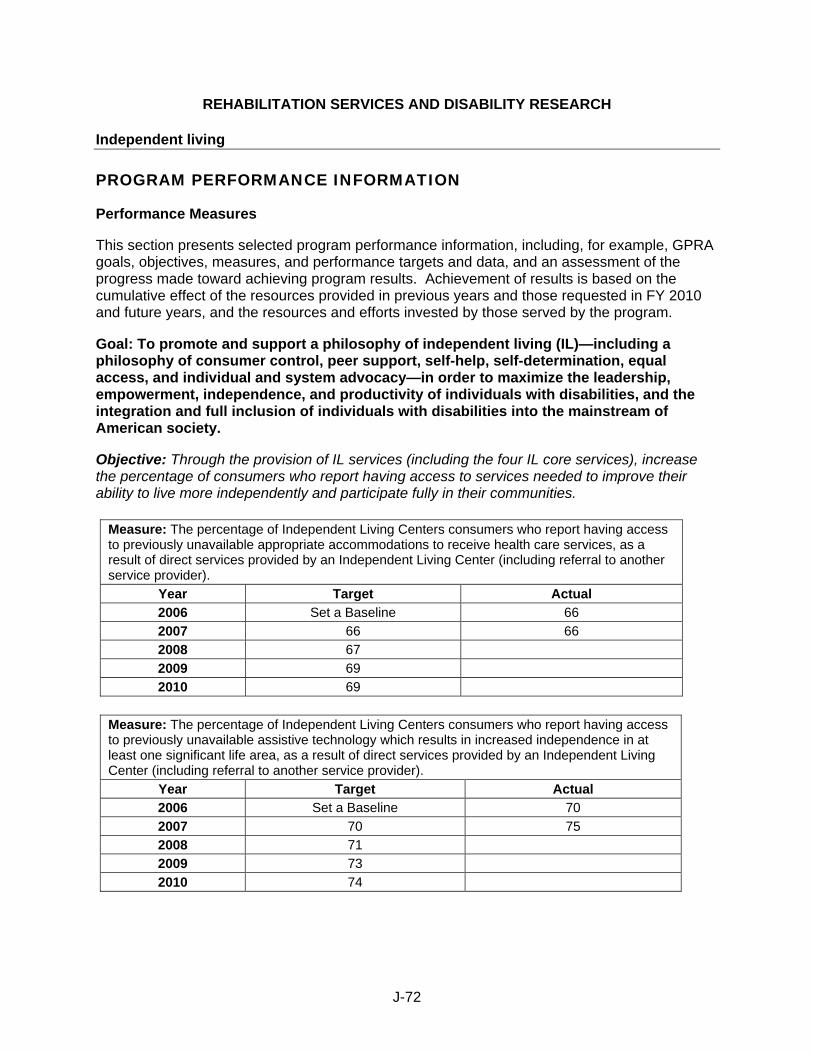
REHABILITATION SERVICES AND DISABILITY RESEARCH Independent living
J-72
PROGRAM PERFORMANCE INFORMATION
Performance Measures
This section presents selected program performance information, including, for example, GPRA goals, objectives, measures, and performance targets and data, and an assessment of the progress made toward achieving program results. Achievement of results is based on the cumulative effect of the resources provided in previous years and those requested in FY 2010 and future years, and the resources and efforts invested by those served by the program.
Goal: To promote and support a philosophy of independent living (IL)—including a philosophy of consumer control, peer support, self-help, self-determination, equal access, and individual and system advocacy—in order to maximize the leadership, empowerment, independence, and productivity of individuals with disabilities, and the integration and full inclusion of individuals with disabilities into the mainstream of American society.
Objective: Through the provision of IL services (including the four IL core services), increase the percentage of consumers who report having access to services needed to improve their ability to live more independently and participate fully in their communities.
Measure: The percentage of Independent Living Centers consumers who report having access to previously unavailable appropriate accommodations to receive health care services, as a result of direct services provided by an Independent Living Center (including referral to another service provider).
Year Target Actual 2006 Set a Baseline 66 2007 66 66 2008 67 2009 69 2010 69
Measure: The percentage of Independent Living Centers consumers who report having access to previously unavailable assistive technology which results in increased independence in at least one significant life area, as a result of direct services provided by an Independent Living Center (including referral to another service provider).
Year Target Actual 2006 Set a Baseline 70 2007 70 75 2008 71 2009 73 2010 74

REHABILITATION SERVICES AND DISABILITY RESEARCH Independent living
J-73
Measure: The percentage of Independent Living Centers consumers who report having access to previously unavailable transportation, as a result of direct services provided by an Independent Living Center (including referral to another service provider).
Year Target Actual 2006 Set a Baseline 81 2007 81 66 2008 83 2009 84 2010 86
Assessment of progress: For these new measures, CIL grantees are required to report annually on the percentage of their consumers who report—as result of services provided by a CIL (including referral to another service provider), DSU, or DSU grantee or contractor—having access to previously unavailable transportation, appropriate accommodations to receive health care services, and/or assistive technology resulting in increased independence in at least one significant life area. The denominator is determined by the grantee based on the number of consumers who have goals specified in their Independent Living Plans that require measurable progress on these intermediate outcomes (access to transportation, health care services, and/or assistive technology) for their achievement. These are not the only outcomes of interest to CIL grantees or consumers, but RSA believes that a significant portion of CIL activities are directly related to these outcomes and that improved performance on these outcomes will result in increased independence for CIL consumers overall. Data for 2007 indicate that targets were met or exceeded in health care and assistive technology but were not met for transportation. The Department will examine why performance on the transportation outcomes measure declined. Data for 2008 are expected in May 2009.
Measure: The percentage of Independent Living Center consumers who move out of institutions into a community-based setting through the provision of Independent Living services (including the four independent living core services).
Year Target Actual 2006 Set a Baseline 54 2007 55 56 2008 55 2009 56 2010 56
Assessment of progress: RSA previously measured progress in deinstitutionalization by collecting data on the number of persons with disabilities who moved out of institutions as a result of receiving CIL services, but these data did not capture grantee improvement in this area. RSA issued revised guidance for the section 704 reporting requirements in fiscal year 2006 to ensure that the data are valid by clearly defining the outcomes being measured and setting standards for collection and reporting. The target for 2007 was exceeded. Data for 2008 are expected in May 2009.

REHABILITATION SERVICES AND DISABILITY RESEARCH Independent living
J-74
Objective: Increase access to community life for persons with disabilities through the provision of community services.
Measure: The percentage of Independent Living Centers' staff, board members and/or consumers creating/participating on community committees, in advocacy initiatives, public information campaigns, and/or other community events designed to increase the accessibility to transportation within the community.
Year Target Actual 2006 Set a Baseline 69 2007 69 2008 70 2009 71 2010 72
Measure: The percentage of Independent Living Centers' staff, board members and/or consumers creating/participating on community committees, advocacy initiatives, public information campaigns, and/or other community events designed to develop relationships with health care providers within the community.
Year Target Actual 2006 Set a Baseline 64 2007 64 2008 65 2009 66 2010 67
Measure: The percentage of Independent Living Centers' staff, board members and/or consumers creating/participating on community committees, advocacy initiatives, public information campaigns, and/or other community events designed to increase the availability /access to assistive technology within the community.
Year Target Actual 2006 Set a Baseline 56 2007 56 2008 57 2009 58 2010 59

REHABILITATION SERVICES AND DISABILITY RESEARCH Independent living
J-75
Measure: The percentage of Independent Living Centers' staff, board members and/or consumers creating/participating on community committees, advocacy initiatives, public information campaigns, and/or other community events designed to increase the compliance with applicable laws/regulations governing the number of affordable accessible housing units within the community.
Year Target Actual 2006 Set a Baseline 67 2007 67 2008 68 2009 69 2010 70
Assessment of progress: These measures replace an indicator that measured the number of community goals met each year without allowing for differences in the time or other resources required to accomplish different types of goals. The Department developed these new measures in order to capture CIL efforts at the community level on key outcomes that correspond to the outcome measures for services and activities provided at the individual level. Grantees have found that measuring and reporting valid and reliable data on these outcomes at the community level is much more difficult. For this reason, 2007 data for these new measures are not yet available.
Objective: Through the provision of services (either directly or through contracts), increase the percentage of consumers receiving services funded through the Older Blind program who report having access to services needed to improve their ability to live more independently and participate fully in their communities.
Measure: The percentage of Independent Living, Title VII, Chapter 2, consumers who have access to previously unavailable assistive technology aids and devices.
Year Target Actual 2005 Set a Baseline 48 2006 49 n/a 2007 50 94 2008 52 2009 54 2010 56
Assessment of progress: Data for 2007 significantly exceeded the target. Future targets for this program should be reassessed and increased, if closer examination indicates that the 2007 data are valid and reliable. Data for 2008 are expected in May 2009.

REHABILITATION SERVICES AND DISABILITY RESEARCH Independent living
J-76
Measure: The percentage of Independent Living Title VII, Chapter 2, consumers who report an improvement in activities of daily living skills.
Year Target Actual 2005 Set a Baseline 53 2006 54 n/a 2007 55 53 2008 56 2009 57 2010 58
Assessment of progress: The target for 2007 was not met. Data for 2008 are expected in May 2009.
Efficiency Measures
The Department has established two efficiency measures for the CIL program: (1) the number of consumer service records closed with all goals met for every $10,000 in net operating funds and (2) the number of consumer goals accomplished per $10,000 in net operating funds. In fiscal year 2007, program staff began pilot testing these measures during site reviews of CIL grantees to see how grantees respond to the measures and how the data can be used to help grantees improve their efficiency. By the end of 2009, RSA will analyze annual performance data at the grantee level using these measures and begin to work with grantees to use these measures to improve efficiency.
Program Improvement Efforts
The Department is undertaking the following improvement effort(s) for this program.
• Devising and implementing an improved audit and site visit system to ensure that the agency is meeting its statutory oversight requirements. RSA conducted 14 site reviews of CILs in fiscal year 2008, well below the 15 percent of grantees required by statute. The statutory requirement was enacted when there were far fewer CILs and may need to be revisited due to the significant increase in the number of grants administered under this program. RSA expects to conduct at least 20 reviews in FY 2009 and will implement a plan for targeting technical assistance and monitoring resources based on performance data for more efficient oversight with available resources.
• Conducting periodic and high quality evaluations of each of the IL programs. The Department is using program improvement funds appropriated under Section 12 of the Rehabilitation Act to develop more reliable methods to gauge consumer satisfaction. RSA will work to develop an evaluation plan for the IL programs by the end of FY 2009.
• Developing at least one efficiency measure for each IL program. RSA has established efficiency measures for the CIL program and developed a methodology to use with these data to identify grantees in need of targeted assistance. RSA will need to produce grantee-

REHABILITATION SERVICES AND DISABILITY RESEARCH Independent living
J-77
level analyses of these data in order to outline the specific steps they will take to help grantees improve their efficiency.
• Developing long-term performance goals and measures that reflect the four core areas of services and the standards and assurances for the IL State Grants and CIL programs. The Department has developed annual and long-term performance measures that capture program objectives and revised the annual performance-reporting instrument to collect these data. Data for fiscal year 2006 were used to establish a baseline. RSA worked extensively with grantees to ensure that the data they submitted for the first reporting period were valid. RSA still needs to analyze these data and determine how they can inform program improvements. Progress toward the long-term targets is being assessed using the FY 2007 data.
• Reducing the time needed to collect and analyze grantee performance reports and making the aggregate data available to the public on the Department’s website in an accessible format. The first year of data from the revised section 704 annual performance-reporting instrument was due from grantees on December 31, 2006. RSA published these data on the ED website in May 2007, meeting its goal of publishing data within 5 months of their due date. For the fiscal year 2008 reporting period, the Department has agreed to maintain this target of 5 months from the end of each reporting period for the publication of these performance data on its website. Using the “quick reports” function in the RSA Management Information System (http://rsamis.ed.gov), the public is now able to easily access data on the performance of CIL grantees key indicators. This represents an important first step in making performance data more accessible and useful for the public. With the Management Information System, it may be possible in future years to reduce the amount of time required to post performance data.

REHABILITATION SERVICES AND DISABILITY RESEARCH
J-78
Program improvement (Rehabilitation Act of 1973, Section 12(a))
FY 2010 Authorization ($000s): 0 1
Budget Authority ($000s): 2009 2010 Change $622 $852 +$230 _________________
1 The program is authorized in FY 2009 through appropriations language. Continued funding is proposed for this program in FY 2010 through appropriations language.
PROGRAM DESCRIPTION
Section 12(a) of the Rehabilitation Act authorizes the Commissioner of the Rehabilitation Services Administration (RSA) to provide technical assistance and consultative services to public and nonprofit private agencies and organizations, including assistance to enable agencies and organizations to facilitate meaningful and effective participation by individuals with disabilities in workforce investment activities under the Workforce Investment Act of 1998 (WIA).
In addition, section 12(a) funds may be used to provide short-term and technical instruction, conduct special demonstrations, develop and disseminate educational or information materials, carry out monitoring, and conduct evaluations.
Program improvement funds are used to support activities that increase program effectiveness, improve accountability, and enhance the Department’s ability to address critical areas of national significance in achieving the purposes of the Rehabilitation Act. Program funds are awarded through grants and contracts to procure expertise in identified problem areas of national significance and technical support in order to improve the operation of the Vocational Rehabilitation (VR) State Grants program and the provision of services to individuals with disabilities under the Act. This activity is current-funded.
Funding levels for the past 5 fiscal years were as follows: ($000s) 2005 ................................................ $843
2006 ................................................ 835 2007 ................................................ 835 2008 ................................................ 622 2009 ................................................ 622

REHABILITATION SERVICES AND DISABILITY RESEARCH Program improvement
J-79
FY 2010 BUDGET REQUEST
The 2010 budget request for Program Improvement activities is $852,000, an increase of $230,000 over the 2009 level. Most of the fiscal year 2010 funds would be used to support new and ongoing projects designed to increase the Department’s capacity for providing technical assistance to RSA grantees, particularly State VR agencies. FY 2010 funds will also be used to support program improvement activities, such as implementation of RSA’s Vocational Rehabilitation Strategic Performance Plan.
The Department has undertaken three major initiatives in its effort to improve the performance of the VR State Grants program. These include implementing a new monitoring process that focuses on the performance of State VR agencies, enhancing RSA’s capacity to provide technical assistance, and developing a strategic performance plan for the VR program.
Nearly half (47 percent) of the Program Improvement funds would be used to continue support for the National Vocational Rehabilitation Technical Assistance Center (NTAC) that was initiated with FY 2008 funds. The NTAC assists in coordinating the activities and sharing of information between members of the technical assistance (TA) network, established by RSA in cooperation with NIDRR, and other RSA TA resources. The NTAC will collect, review, and disseminate TA materials; identify and disseminate research and other information that may be useful to TA network activities; identify potential technical assistance providers as needed on issues not specifically addressed by the Regional Technical Assistance and Continuing Education (TACE) centers; and implement a process for assessing performance of the TACE centers.
Program improvement funds will also be used to increase service delivery capacity by providing forums for sharing promising practices, and by enhancing the capacity of grantees to fulfill their responsibilities more effectively and efficiently. Timely training and technical assistance will be delivered to RSA grantees and stakeholders using state-of-the-art communication methods as the primary means of dissemination, including web-based seminars (webinars), and RSA’s new Dissemination and Technical Assistance Resource (DATAR) web-based resource. These strategies will allow RSA to reach a broader population of grantees and stakeholders without convening face-to-face meetings, greatly improving the cost effectiveness of providing ongoing training and technical assistance. In FY 2009 RSA will conduct 12 nationwide webinars, including webinars that will provide technical assistance to State VR agencies and independent living grantees receiving funds under the American Recovery and Reinvestment Act. FY 2010 funds will be used to provide additional webinars on a variety of timely topics identified through monitoring activities, the TA network, and stakeholders.
RSA is developing a Vocational Rehabilitation Strategic Performance Plan for the VR Program in order to ensure a long-term strategic focus on program performance, performance improvement, and outcomes for individuals with significant disabilities. RSA will use this plan to guide the administration of the VR program and address program challenges. The plan will assist RSA in monitoring progress of the VR program and to provide, appropriate, targeted technical assistance to State agencies toward the achievement of desired outcomes.

REHABILITATION SERVICES AND DISABILITY RESEARCH Program improvement
J-80
PROGRAM OUTPUT MEASURES ($000s) 2008 2009 2010 Funding for technical assistance activities:
New $644 0 $230
Continuations 18 $622 622
Total 662 622 852
Number of activities:
New 3 0 2 Continuation 1 4 4
Total 4 4 6
PROGRAM PERFORMANCE INFORMATION
A description of the major activities supported with Program Improvement funds that were completed in fiscal years 2006 through 2008, or are scheduled to be completed in fiscal year 2009 is provided below. Information from these activities and evaluation activities conducted under section 14 of the Rehabilitation Act will assist the RSA to better target and coordinate funding priorities under this program and the Demonstration and Training program and to identify technical assistance needs. Information from RSA’s new monitoring system will also assist the Department to identify critical performance improvement needs. VR Strategic Performance Plan
The Department, with assistance from a contractor, is developing a multi-year performance plan to identify appropriate goals, objectives, strategies, and outcome-oriented performance measures that will improve employment outcomes for individuals with disabilities. The plan will assist the Department in directing its resources (monitoring, technical assistance, training, demonstration, and evaluation) toward the implementation of policies and practices that are known to have a positive effect on increasing high-quality employment outcomes. A draft Strategic Performance Plan that outlines the proposed goals, objectives, and measures of progress towards achievement of the goals and objectives was developed in FY 2008 and made available to State VR agencies and other program stakeholders for comment. The draft has been revised based on comments received by RSA and will be presented at the Council of State Administrators of Vocational Rehabilitation in April 2009. Once the measures are finalized, RSA will examine the performance of each State VR agency, and conduct analysis of appropriate targets given agency size, consumer characteristics, funding contingencies, and other factors. RSA will continue to work with State agencies in determining appropriate targets of performance that are sensitive to conditions in the State, and conduct “gap” analysis to determine realistic steps that could be taken to improve performance or maintain high levels of performance.

REHABILITATION SERVICES AND DISABILITY RESEARCH Program improvement
J-81
Web-Based Dissemination and Technical Assistance Resource
The September 2005 Government Accountability Office report, entitled Vocational Rehabilitation: Better Measures and Monitoring Could Improve Performance of the VR Program, recommended that the Secretary take executive action to “…develop alternative means of disseminating best practices among state VR agencies…such as a central repository.” RSA intends to broaden the dissemination of information and publicize the availability of its monitoring and analytic work products. The Department awarded a contract in fiscal year 2006 to develop a web-based technical assistance resource (DATAR) that will provide broader access to a wide variety of vocational rehabilitation and independent living program resources. The web-based resource project will serve as the “doorway and card catalogue” for an extensive online repository to facilitate public access to the most current vocational rehabilitation and independent living program information, including demographic and performance measurement data, effective practices, program initiatives, and current issues, research, and literature. A controlled working prototype of DATAR was completed in FY 2008. The contractor and RSA staff are now working to enhance the prototype so that it is more user-friendly and presents as a seamless system. RSA expects to implement the full DATAR product in April 2009.
A Model Comprehensive Statewide Needs Assessment and Training/Technical Assistance to State Vocational Rehabilitation Agencies
Section 101(a)(15)(i) of the Rehabilitation Act requires State VR agencies to jointly conduct a comprehensive, statewide assessment with the State Rehabilitation Council at least once every 3 years that describes the rehabilitation needs of individuals with disabilities residing within that State. Section 101(a)(5) of the Rehabilitation Act requires State VR agencies to develop goals and priorities in carrying out their VR program during the period in which the annual State plan is in effect, based on analysis of the comprehensive Statewide needs assessment (CSNA), including strategies the State will use to address the needs identified in the CSNA. Finally, the State VR agency must submit an annual report to the Commissioner that includes an evaluation of the extent to which the State’s goals were achieved and, if not achieved, the factors that impeded achievement.
In reviewing FY 2007 State Plan submissions, RSA determined that State VR agencies have not carried out CSNAs that yield data that is sufficient to inform the development of goals and priorities. Many of the CSNAs do not address all of the required elements, and more importantly, even those CSNAs that do address the required elements, do not yield sufficient information on the rehabilitation needs of individuals with disabilities in the State. In discussions with State agencies about the quality of their CSNAs, many State agencies readily admit that they do not have the expertise to carry out a proper CSNA, and have asked RSA to provide them with a model. RSA awarded a contract in FY 2007 to develop a model CSNA to assist State VR agencies and SRCs in conducting their own CSNAs and to improve the development of goals and priorities based on the CSNA. A panel of experts was used to provide guidance in the development of the CSNA model. The conceptual model for the CSNA has been completed. The VR Needs Assessment Guide and Personal Computer Delivered Training and Self-Evaluation component are scheduled for completion in July of 2009.

REHABILITATION SERVICES AND DISABILITY RESEARCH Program improvement
J-82
Developing the Capacity of RSA to Effectively Use Performance Data in Managing and Improving Program Performance
The use of performance data to inform decisionmaking and planning is an important part of program improvement efforts. However, weakness in the transparency and use of data to manage and improve RSA discretionary programs was a common problem. In fiscal year 2005, the Department awarded a contract to assist RSA in developing its capacity to effectively use the performance data it collects to manage and improve program performance at the national and grantee levels. The plan developed by the contractor is primarily focused on enhancing the capabilities of RSA staff to more effectively use the data collected from its discretionary program grantees.
The contractor developed an analytical framework for examining individual and national level data on the American Indian VR Services (AIVRS) and the Projects with Industry (PWI) programs, including documentation mapping of the measures in the tables and graphics to information in RSA’s Management Information System (MIS) and annotations and documentation on data issues. The contractor provided guidance on the patterns to look for when looking at data within the analysis framework and edit checks to be incorporated into the MIS. The contractor also helped to develop templates for the MIS that provide tables and graphs structured to display key summary information and information for individual grantees, including data on program performance measures for the Projects With Industry and the American Indian Vocational Rehabilitation Services programs, and more recently the Independent Living programs. Assessment of the Technical Assistance Needs of State VR Agencies and State Rehabilitation Councils
In fiscal year 2005, the Department awarded a contract to identify the technical assistance needs of State VR Agencies, including administrative/management and service delivery needs, and of State Rehabilitation Councils (SRCs). Survey results indicate that State VR agencies and SRCs require technical assistance in the following areas:
• expanding the agency’s resource base;
• building relationships with business and industry;
• recruiting and retraining qualified and diverse staff members;
• assessing and serving former VR consumers who reapply to the program;
• using performance data for program improvement;
• implementing effective strategies for consumers with traumatic brain injury, mental illness, and autism;
• conducting statewide needs assessment; and
• understanding the role and responsibilities of the SRC.
RSA has used the findings from this study to target and improve the provision of technical assistance to these two constituencies. In addition, information from the technical assistance

REHABILITATION SERVICES AND DISABILITY RESEARCH Program improvement
J-83
assessment will assist RSA to better target and coordinate funding priorities under its demonstration and program improvement programs. The final report was completed in 2007. Developing the Capacity of the State Rehabilitation Council (SRC)
The purpose of this initiative was to enhance SRCs’ effectiveness in improving State VR programs and to enhance opportunities for high-quality outcomes for individuals with disabilities. The SRC can play an important role in ensuring the effectiveness of the State VR program. During FY 2004, RSA developed a national SRC training curriculum with the assistance of Rehabilitation Continuing Education Programs (RCEPS) and with input from the constituency. The curriculum was developed for use in two accessible formats, a power point presentation for use with a trainer and stand-alone power points set to motion as movies. However, the membership on SRCs is constantly rotating, creating a need for continuous training of new members. To address this challenge, State VR agencies and SRCs need sustainable training resources in a variety of accessible forms and delivery methods. The objectives of this SRC capacity building initiative were to develop systematic, sustainable training resources in multiple accessible formats that increase SRC members’ knowledge of the VR program, improve members’ understanding of their responsibilities, and enhance awareness of successful strategies and solutions for fulfillment of their responsibilities as defined by the Rehabilitation Act. In fiscal years 2006 and 2007, the Department awarded grant supplements to the RCEP at Georgia State University to develop and test a self-paced web-based tutorial for CRC members that includes graphics, interactive content, and a quiz at the end of each module and to convene regional sessions with SRCs in collaboration with RCEPs to demonstrate the features of the online tutorial and to develop additional capacity to carry out their responsibilities. Regional training sessions were conducted and the web-based tutorial became available for use (see http://www.erehab.org/SRC/index.php) in July 2008.

REHABILITATION SERVICES AND DISABILITY RESEARCH
J-84
Evaluation (Rehabilitation Act of 1973, Section 14)
FY 2010 Authorization ($000s): 0 1
Budget Authority ($000s): 2009 2010 Change $1,447 $1,217 -$230 _________________
1 The program is authorized in FY 2009 through appropriations language. Continued funding is proposed for this program in FY 2010 through appropriations language.
PROGRAM DESCRIPTION
The Secretary uses the funds appropriated under this authority to evaluate the impact and effectiveness of programs authorized by the Rehabilitation Act of 1973, including their general effectiveness in relation to their cost, their impact on related programs, and their structure and mechanisms for delivery of services. Studies are designed to provide information for policy decisions related to program management and effectiveness. In addition, subsection 14(f) of the Rehabilitation Act requires the Commissioner of the Rehabilitation Services Administration (RSA) to identify and disseminate information on exemplary practices concerning vocational rehabilitation.
This is a current-funded program. Contracts and cooperative agreements are awarded for studies to be conducted by persons not immediately involved in the administration of the programs authorized by the Act.
Funding levels for the past 5 fiscal years were as follows:
` ($000s) 2005 ................................................ $1,488 2006 ................................................... 1,473 2007 ................................................... 1,473 2008 ................................................... 1,447 2009 ................................................... 1,447
FY 2010 BUDGET REQUEST
The Administration requests $1.217 million for the evaluation program, a decrease of $230,000 below the 2009 level. Approximately 52 percent of the funds would be used to continue support for evaluation activities begun in fiscal years 2008 and 2009 and the remaining funds would be used to initiate two new evaluations. In fiscal year 2009, RSA will begin an evaluation planning process that will lead to the development of a comprehensive multi-year evaluation plan. The

REHABILITATION SERVICES AND DISABILITY RESEARCH Evaluation
J-85
evaluation plan will assist the Department in developing future budget requests for the evaluation program.
The Department did not exercise the option to continue the multi-year national study of the long-term post-program experiences of former VR consumers that began in FY 2006. Additional data collection activities were discontinued in FY 2008 after the first phase of data collection was completed. The study was designed to examine the long-term employment status of individuals with significant disabilities from four subgroups who may require long-term support in order to maintain employment over time. These subgroups were: (1) persons with mental illness, (2) persons with mental retardation, (3) transitional youth, and (4) persons who received Social Security disability benefits. Data were to be collected on a nationally representative sample of former VR consumers in these four groups who had recently exited the program through a baseline interview and two annual follow-up interviews. However, problems in locating these consumers and obtaining their consent to participate in the study resulted in a low response rate for the baseline interview. The Department felt that this low response rate would not provide a sufficient pool of respondents for the annual follow-up interviews and did not fund the option for further data collections. The final report of the study based on the data obtained from consumer responses to the baseline interview is scheduled for completion in June 2009.
Fiscal year 2008 and 2009 funds that were initially budgeted for carrying out the second phase and third phases of the post-program experiences of former VR consumers study are being used to support a number of evaluation projects. These projects include studies of the Supported Employment program and the Helen Keller National Center, a feasibility study examining consumer attrition in the VR State Grants program, an evaluation of model transition demonstration projects, and a comprehensive review and revision of the major data collections that provide performance data for the State VR Services program. Evaluation funds are also being used to support a number of short-term evaluation-related projects designed to assist the Department in assessing program performance or to provide information on topics that may warrant further study. Supported Employment Evaluation
Beginning in fiscal year 2009, RSA plans to initiate a series of graduated evaluation activities focused on the provision of supported employment services under title I and title VI of the Rehabilitation Act and the role of the Supported Employment (SE) State Grants program in assisting State VR agencies to obtain supported employment outcomes for individuals with the most significant disabilities. The SE State Grants program receives an annual appropriation of approximately $29 million as a supplement to the VR State Grants program to assist States in providing supported employment services. The evaluation will provide more in-depth understanding of how the SE program is implemented across State VR agencies from both a fiscal and programmatic perspective, including how the supplemental SE appropriation (Title VI B funds) is used in conjunction with Title I funds to assist these individuals to achieve supported employment outcomes. The evaluation will also seek to identify the role of these programs in the current environment, their successes and challenges, and their impact within the larger SE system. Information from this evaluation will be used to improve monitoring, data collection, and accountability, and to inform broader policy decisions.

REHABILITATION SERVICES AND DISABILITY RESEARCH Evaluation
J-86
Evaluation of Model Transition Projects
In FY 2007, the Department awarded six grants under the Demonstration and Training program to support 5-year projects that demonstrate the use of promising practices of collaborative transition planning and service delivery to improve the postsecondary education and employment outcomes of youth with disabilities. FY 2007 funds were used to design an annual performance report to obtain information from each grantee for each year of the project. In FY 2009, the Department will begin a 3-year evaluation of these model projects to explore early indications of success and challenges. The evaluation will analyze annual grantee data and produce an aggregated national data set that will include demographic data, disability data, services provided and outcome information. Intermediate outcomes, such as program retention and school attendance, will also be reported. VR Attrition Feasibility Study
In FY 2009, evaluation funds will also be used to conduct a feasibility study examining VR consumer attrition. RSA data show that approximately 30 percent of the eligible individuals whose case records were closed in fiscal years 2007 and 2008 dropped out of the VR program before an individualized plan for employment was developed or before receiving services. Attrition has a major negative impact on program operations and resources. State VR agencies often make significant resource investments in consumers only to have them drop out of the program prior to obtaining a successful employment outcome. In the first phase of this feasibility study, data from three of RSA’s VR data collections will be analyzed to provide a description of the national picture of State VR agency attrition. This information will also be used to provide direction for an in-depth evaluation that investigates factors that cause attrition and ways to correct them. In the second phase of this study, the contractor will develop a proposed evaluation design for a large-scale study that will provide causal data and a set of policy and program recommendations. Evaluation of the Helen Keller National Center In fiscal year 2008, the Department initiated an independent study of the Helen Keller National Center (HKNC) to evaluate the effectiveness of the Center. The study will address the efficiency and cost effectiveness of the programs for the various populations served by HKNC and its regional offices and the Center’s interactions with vocational rehabilitation agencies. In addition, it will examine the support that HKNC provides to other service providers and to the family members of deaf-blind individuals who, in turn, support those individuals. The results of the study will be used to assist HKNC in planning future activities and setting priorities and to the Department in fulfilling its oversight responsibilities. The Department anticipates that the study will be completed by October 2010. VR Program Performance Reporting
Fiscal year 2008 and 2009 funds are also being used to support a comprehensive review and revision of the three major data collections that are used to provide information and assess the performance of the Vocational Rehabilitation State Grants program. These data collections include the Case Service Report (RSA-911), the Cumulative Caseload Report (RSA-113), and

REHABILITATION SERVICES AND DISABILITY RESEARCH Evaluation
J-87
the Annual Vocational Rehabilitation Program/Cost Report (RSA-2). These data collections are submitted annually by the 80 State VR agencies and are the major sources of performance data for the VR State Grants program. The RSA-911 database, the largest of these collections, contains about 125 data elements for each individual served by a State VR agency, including information on the characteristics of, services received by, and outcomes for the consumers who have exited the VR program. The purpose of this project is to enhance the usefulness of the VR data in program management and evaluation to State and federal policymakers. In particular, the project is designed to improve the accuracy, consistency, and timeliness of the performance information that RSA collects, identify gaps in information that are necessary in assessing grantee performance, and delete unnecessary data. Input on the redesign of the reporting forms will be solicited from knowledgeable Federal personnel, State VR agencies, and other non-Federal consumers of the data.
PROGRAM OUTPUT MEASURES ($000s)
2008 2009 2010 Funding for evaluation activities:
New $1,177 $800 $589
Continuations 300 647 628
Number of activities: New 4 6 2 Continuation 1 4 4
Total 5 10 5
PROGRAM PERFORMANCE INFORMATION
A description of major studies and evaluations supported with funds from fiscal years 2005 through 2007 is provided below. Information obtained from these studies, along with information obtained from activities conducted under Program Improvement and findings from monitoring activities, are being used by RSA to improve program performance.
Evaluation of Projects Demonstrating the Use of Adult Education Literacy Services by State Vocational Rehabilitation Agencies to Improve the Earnings of Individuals with Disabilities
The purpose of the literacy evaluation, which received its final year of project funding in 2007, is to assess whether literacy instruction (focusing upon the Wilson Reading System) and the provision of relevant support services, as carried out by five Department-funded model demonstration projects, have an impact on the literacy skills, utilization of postsecondary education, employability, and earnings and benefits of VR consumers with poor literacy skills, particularly individuals with learning disabilities. The contract was modified in FY 2007 to support follow-up data collection at 6 and 12 months after a project participant’s VR case is closed. These data will assist in determining the degree to which individuals have progressed in employment and pursued additional education and/or services, and the participants’ perceptions of the usefulness of the literacy services. The contractor will be conducting follow-up activities in fiscal year 2007 and 2008. The final report is expected in the fall of 2009.

REHABILITATION SERVICES AND DISABILITY RESEARCH Evaluation
J-88
VR Practices Studies
FY 2007 evaluation funds were used to initiate targeted studies in three areas of State VR Agency practices, including the use of cooperative agreements, Comprehensive Rehabilitation Centers (CRCs), and quality assurance techniques. The studies will improve RSA’s understanding of how these three practices affect the delivery of services and assist RSA in its efforts to ensure the effective and efficient delivery of services by State VR agencies. A summary of the background interviews that the contractor conducted with Department staff and representatives of several national organizations describing respondents’ perspectives on each of the three topics was submitted to the Department in early 2008. Data collection on the use of cooperative agreements and quality assurance techniques includes a survey of the 80 State VR agencies and site visits to 9 state VR agencies, selected on the basis of survey results, and analysis of RSA datasets. The information for the CRC study is being collected through site visits to eight state-operated CRCs. The contractor has received State VR agency responses to the survey instrument and site visits are scheduled for completion by October 2009. The draft final report on the use of cooperative agreements and quality assurance techniques is due in February and the final report is expected in March 2010. Data collection for the CRC study has been completed and a briefing for RSA staff on the results of the study was conducted in early April. The draft report of this study is due in mid April and the final report is due in May 2009. A brief description of each of these studies is provided below.
Comprehensive Rehabilitation Centers:
Eight States provide VR services, in part, through a CRC. A CRC provides vocational rehabilitation training, counseling, and medical support with a residential component. The purpose of this study is to determine the extent to which States that support a CRC achieve different outcomes or have a difference in the cost of services compared to other States.
Cooperative Agreements:
Historically, some State agencies have used sources of match other than State general revenue fund appropriations to meet the VR program matching requirement. Available data indicate that, for some States, sources other than direct State appropriations account for up to 30 percent of the total matching funds. One such source is third party cooperative agreements. Reliance upon third party agreements affects the overall performance of VR agencies and may affect the scope of services and the populations served by the VR program. The purpose of this study is to determine how widespread the use of cooperative agreements is among State VR agencies, what the effects and outcomes are of such cooperative agreements, and the cost effectiveness of cooperative agreements.
State VR Agency Quality Assurance Procedures:
State VR agencies employ a variety of delivery models and mechanisms to provide services. Some agencies use quality assurance (QA) techniques to ensure that agency activities are being performed appropriately, efficiently, and effectively. However, it is not known to what extent VR agencies employ any standardized model or employ quality assurance techniques to ensure that services are provided in accordance with either Federal standards or in accordance

REHABILITATION SERVICES AND DISABILITY RESEARCH Evaluation
J-89
with State policies and requirements. The purpose of this study is to determine to what extent VR agencies perform QA and program evaluation functions, how well these functions are performed, the results that are attributable to QA and/or program evaluation functions, and what practices are effective. An Assessment of Transition Policies and Practices in State Vocational Rehabilitation Agencies
Youth with disabilities face significant challenges as they transition to adult life. Timely and significant investment in VR services for youth with disabilities before the beginning of their potential work life will give them the greatest opportunity to prepare themselves for self-support. The Department conducted a study supported with fiscal year 2004 and 2005 funds to increase its understanding of the transition policies and practices among State VR agencies. The study provides a descriptive national picture of transition policies and practices among State VR agencies, including the amount and source of resources supporting such practices, and identifies promising State VR agency practices in the provision of transition services. This study focuses on the population of individuals with disabilities aged 14 and over who are transitioning from secondary school (or an equivalent educational institution) to post-school activities, including postsecondary education or training and employment. The specific objectives of the study were as follows:
• Describe and classify State policies and practices for identifying and serving youth with disabilities who are transitioning from school to post-school outcomes;
• Identify and describe policy issues, promising practices, and other factors that facilitate effective collaboration, transition planning, and provision of services, including effective strategies, policies, and practices that promote successful collaboration with secondary schools, postsecondary institutions, employers, and independent living centers;
• Identify major obstacles to collaboration and early intervention in transition planning; and
• Examine the influence of financial factors, including provision of complementary or matching funds to the VR agency by educational or education-related agencies. Where they exist, identify non-Title I (VR) resources used to support transition practices.
The interim report was completed in November 2006 and site visits to identify promising practices were conducted in February and March 2007. A copy of the draft final report is available online at http://www.vrtransitionstudy.org/reports/final.html.

REHABILITATION SERVICES AND DISABILITY RESEARCH
J-90
Helen Keller National Center (Helen Keller National Center Act)
FY 2010 Authorization ($000s): 0 1
Budget Authority ($000s): 2009 2010 Change $8,362 $8,362 0 _________________
1 The program is authorized in FY 2009 through appropriations language. Continued funding is proposed for this program in FY 2010 through appropriations language.
PROGRAM DESCRIPTION
The Helen Keller National Center for Deaf-Blind Youths and Adults (HKNC) was created by Congress in 1969, and operates under the auspices of Helen Keller Services for the Blind, Inc. The Center provides services on a national basis to individuals who are deaf-blind, their families, and service providers through two component programs: a national headquarters center located in Sands Point, New York, with a residential training and rehabilitation facility where deaf-blind individuals receive intensive specialized services; and a network of 10 regional field offices that provide referral, counseling, and transition assistance to deaf-blind individuals and technical assistance to service providers. In addition, the Center uses private funds to provide seed money to State and private agencies to encourage them to establish or expand programs for individuals who are deaf-blind. These programs also receive targeted training and technical assistance from the Center.
The purpose of the program at the national headquarters center is to provide direct services for individuals with deaf-blindness in order to enhance their potential for employment and to live independently in their home communities. The program strives to provide clients with meaningful contact with the environment, improved means of communication, constructive participation in the home and community, increased employability, and other development pertinent to their rehabilitation. The headquarters program also offers training and consultation to other programs serving individuals who are deaf-blind through a technical assistance center and national training team.
The Center employs regional representatives in each of the 10 Federal regions. These representatives provide a variety of services, including training for service agency staff, general technical assistance, and help in developing direct service plans for deaf-blind clients for State vocational rehabilitation counselors, mental health workers, and special education programs. In addition, the regional staff provide counseling, information, transition assistance, and referral services for individuals who are deaf-blind and their families
HKNC also operates a number of special projects related to deaf-blindness. These include a service project for individuals who are elderly and deaf-blind and a national parent and family

REHABILITATION SERVICES AND DISABILITY RESEARCH Helen Keller National Center
J-91
services project. In addition, the Center operates an international internship program for professionals in the field of deaf-blindness. These interns are professionals who are financially supported by their sponsoring agencies during their stay and are expected to initiate and complete at least one project while at HKNC.
Funding levels for the past 5 fiscal years were: ($000s)
2005..................................................$10,581 1
2006.................................................. 8,511 2007................................................... 8,511 2008................................................... 8,362
2009................................................... 8,362
________________________________________
1 The amount shown for fiscal year 2005 included a one-time earmark of $1.984 million for HKNC.
FY 2010 BUDGET REQUEST
The Administration’s request for the Helen Keller National Center (HKNC) is $8.362 million, which would maintain funding at the fiscal year 2009 level. The Department believes the request is sufficient to support a range of educational, independent living, and training programs for individuals who are deaf-blind. The Department requests funds for this program in order to expand independent living and employment opportunities for individuals who are deaf-blind.
The Federal appropriation for HKNC represented about 73.5 percent of HKNC’s total budget in fiscal year 2007, the most recent year for which the Department has information. While HKNC only provides direct services to a target figure of 95 adult clients per year for the regular training provided by its headquarters program, most of the Center’s total budget supports operations and programs associated with these clients. This represents a large investment of resources per client. In fiscal year 2008, the Center only served 84 adult clients, 11 fewer than the target.
Other Sources of Funding: In addition to funds provided through the appropriation, the Center receives funding from a variety of State, private, and other Federal sources. The following chart shows the sources and percentages of the Center’s fiscal year 2007 operating budget of approximately $11.59 million. In fiscal year 2009, HKNC plans to expand its efforts to raise funds from private sources, including charitable foundations. The Center plans to target sources of funding for facilities improvement and special initiatives related to training and distance learning.
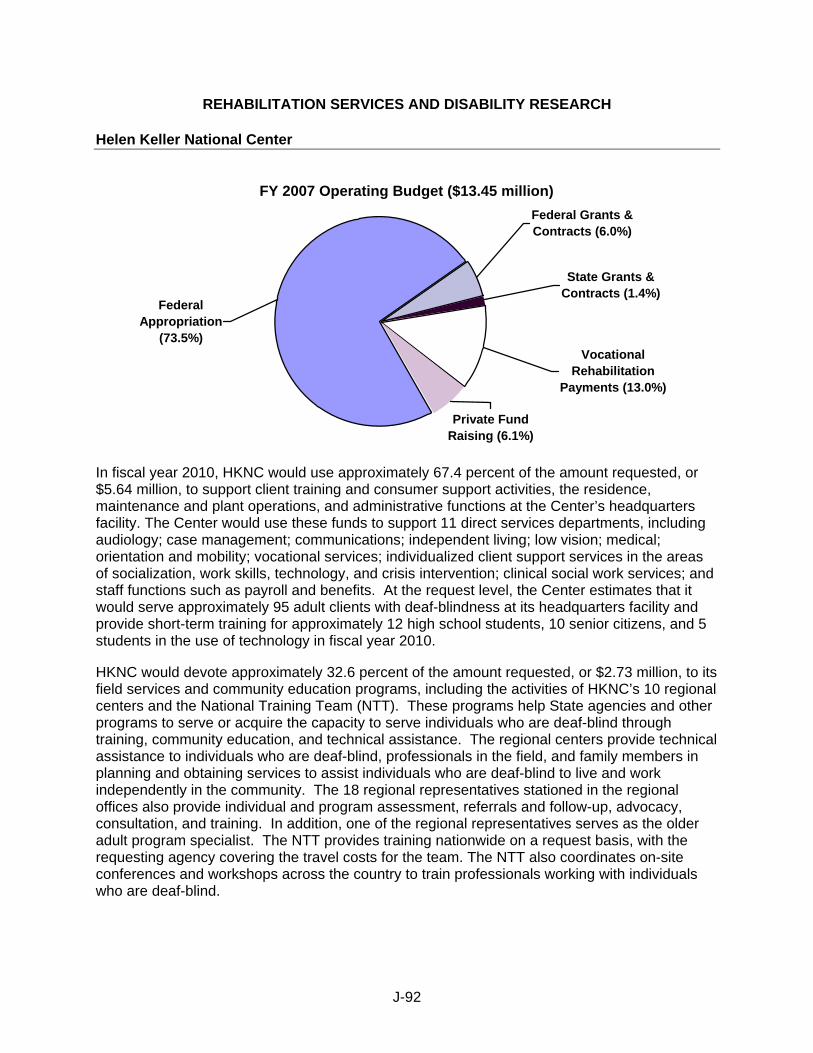
REHABILITATION SERVICES AND DISABILITY RESEARCH Helen Keller National Center
J-92
FY 2007 Operating Budget ($13.45 million)Federal Grants & Contracts (6.0%)
State Grants & Contracts (1.4%)
Vocational Rehabilitation
Payments (13.0%)
Private Fund Raising (6.1%)
Federal Appropriation
(73.5%)
In fiscal year 2010, HKNC would use approximately 67.4 percent of the amount requested, or $5.64 million, to support client training and consumer support activities, the residence, maintenance and plant operations, and administrative functions at the Center’s headquarters facility. The Center would use these funds to support 11 direct services departments, including audiology; case management; communications; independent living; low vision; medical; orientation and mobility; vocational services; individualized client support services in the areas of socialization, work skills, technology, and crisis intervention; clinical social work services; and staff functions such as payroll and benefits. At the request level, the Center estimates that it would serve approximately 95 adult clients with deaf-blindness at its headquarters facility and provide short-term training for approximately 12 high school students, 10 senior citizens, and 5 students in the use of technology in fiscal year 2010.
HKNC would devote approximately 32.6 percent of the amount requested, or $2.73 million, to its field services and community education programs, including the activities of HKNC’s 10 regional centers and the National Training Team (NTT). These programs help State agencies and other programs to serve or acquire the capacity to serve individuals who are deaf-blind through training, community education, and technical assistance. The regional centers provide technical assistance to individuals who are deaf-blind, professionals in the field, and family members in planning and obtaining services to assist individuals who are deaf-blind to live and work independently in the community. The 18 regional representatives stationed in the regional offices also provide individual and program assessment, referrals and follow-up, advocacy, consultation, and training. In addition, one of the regional representatives serves as the older adult program specialist. The NTT provides training nationwide on a request basis, with the requesting agency covering the travel costs for the team. The NTT also coordinates on-site conferences and workshops across the country to train professionals working with individuals who are deaf-blind.

REHABILITATION SERVICES AND DISABILITY RESEARCH Helen Keller National Center
J-93
PROGRAM OUTPUT MEASURES ($000s) 2008 2009 2010 Number of individuals served: At headquarters:
Adult training program clients 84 85 95 Short-term training:
High school students 12 12 12 Senior citizens 8 10 10 Technology training 6 5 5
Through regional representatives: 1
Consumers 1,258 1,600 1,600 Families 545 500 500 Agencies/organizations 774 750 1,000 HKNC FTE 119 120 135 ____________________________________ Note: Impact data are provided according to fiscal year, as opposed to HKNC’s program year of July to June. The number of individuals served in fiscal years 2009 and 2010 and full-time equivalent (FTE) figures are estimates based on historical trend data, which may or may not be consistent with data for the immediate prior year. 1 Individuals served by the regional representatives include individuals attending workshops or conferences in which HKNC participates, who receive materials from the Center, or who receive technical assistance, referral services, or counseling from regional staff. The regional offices began using a new data collection system in fiscal year 2007 that resulted in lower, but potentially more accurate output data. The estimates for fiscal years 2009 and 2010 are based on earlier projections. Additional data is necessary before a trend analysis can be conducted that can be used to estimate future numbers of clients to be served by the regional offices.
PROGRAM PERFORMANCE INFORMATION
This section presents selected program performance information, including, for example, GPRA goals, objectives, measures, and performance targets and data; and an assessment of the progress made toward achieving program results. Achievement of program results is based on the cumulative effect of the resources provided in previous years and those requested in fiscal year 2010 and future years, and the resources and efforts invested by those served by this program.
Goal: Individuals who are deaf-blind will become independent and function as full and productive members of their local community. Objective: Individuals who are deaf-blind receive the specialized services and training they need to become as independent and self-sufficient as possible.

REHABILITATION SERVICES AND DISABILITY RESEARCH Helen Keller National Center
J-94
Measure: The percentage of training goals set and achieved by adult consumers, of adult consumers seeking employment who are placed in employment, and of adult consumers seeking to maintain their ability to live independently or move to less restrictive settings who achieve their goals.
Year Target Actual
# of Adult
Consumers % of
Training goals met
% in Less Restrictive Settings
% Placed in
Employ-ment
# of Adult Consumers
% of Training
goals met
% in Less Restrictive Settings
% Placed in
Employ-ment
2005 95 88 70 45 89 89 91 41 2006 95 88 72 45 91 93 96 46 2007 95 90 75 45 78 91 91 48.5 2008 95 90 75 45 84 88 83 48 2009 95 90 75 45 2010 95 90 75 45
Assessment of progress: The number of adult clients attending the HKNC rehabilitation training center in fiscal year 2008 (84) was substantially below the target of 95, though somewhat higher than the prior year. HKNC points out that the number of consumers served may fluctuate from year to year due to factors beyond the control of the Center, such as changes in State vocational rehabilitation program funding or policy. In addition to its traditional adult consumers, HKNC also provides short-term training for youth in high school, senior citizens, and those seeking training in the use of technology. For example, the high school students participate in career exploration, college preparation, and other services offered by the Center. However, the students return to high school after their training. The high school students and senior citizens are not included in the counts of adult consumers, consumers placed in employment or less restrictive settings, or consumers who meet their individualized training goals. Clients who participate in short-term training in the use of technology are included in the measure on training goals set and achieved by adult consumers.
The percent placed in employment measure refers to outcomes for those individuals who came to the Center with a specific vocational objective. For example, while 73 adult clients were served by the Center’s vocational services unit in fiscal year 2007, only 31 individuals specified employment goals. Of these 31 individuals, 15 clients, or 48 percent, found some form of employment. This included 11 graduates who found competitive employment1 and 4 who were placed in supported employment. (Supported employment services support an individual with disabilities in maintaining employment by providing ongoing supports such as job coaches and on-site accommodations). Of the remaining 16 clients with employment objectives, 11 were seeking competitive employment, 4 were seeking supported employment, and 1 was seeking extended (sheltered) employment. The 42 clients who did not have immediate employment objectives included 8 homemakers, 6 attending postsecondary education programs, 9 who came for short-term training in technology, 12 high school students, and 7 who discontinued 1 Competitive employment is defined under the State Vocational Rehabilitation program as work in the competitive labor market that is performed on a full-time or part-time basis in an integrated setting, and for which an individual is compensated at or above the minimum wage, but not less than the customary wage and level of benefits paid by the employer for the same or similar work performed by individuals who are not disabled.

REHABILITATION SERVICES AND DISABILITY RESEARCH Helen Keller National Center
J-95
training for various reasons such as family or medical emergencies or difficulty adjusting to the program.
The less restrictive settings measure refers to clients who move from settings such as living with parents or guardians, assisted living settings, and nursing homes to more independent living arrangement such as their own home or apartment or group homes. The percentage is taken only of those consumers with a specific goal to move to a less restrictive living situation. In fiscal year 2007, HKNC revised this measure to include participants in the independent living program whose goal is to maintain their ability to live independently in their current living situation. The Center believes that it is as important to help consumers who need assistance in maintaining their ability to live independently as those seeking to move to less restrictive settings. The Center also evaluates the progress of clients in achieving the goals stated in their individualized training plans (ITPs). This measure represents the percent of training goals achieved by all consumers served during the program year. The consumers and their instructors mutually develop these instructional objectives. The method for reporting these data was changed in fiscal year 2004. Previously, this measure included outcomes for high school students and for senior citizens participating in short-term training programs. However, the Center and Department agreed that it would be a more accurate reflection of the Center’s performance if this measure were limited to results for adult clients enrolled in the formal program. The percentages for fiscal years 2005 through 2008 reflect the new measure. In addition, the figures also include clients enrolled in the technology training program. Objective: Increase the capacity of deaf-blind consumers to function more independently in the home community.
Performance measures are needed to assess the performance of HKNC’s field services and training programs. Several sets of measures have been proposed, but each has been rejected due to data collection problems or methodological issues. The regional offices and training programs are consuming an increasing percentage of HKNC resources. However, there are no performance measures specific to these activities.
Other Performance Information
There is very little in the way of outcome data available related to the performance of HKNC to justify this large investment. The only study conducted of the Center was completed in fiscal year 1988 and covered the fiscal year 1986 program year. The information in that study is now over 20 years old. In addition, despite repeated attempts, the Center has not been able to develop viable performance measures related to its field services and training activities. To address these concerns, the Department initiated an independent, comprehensive study of HKNC in fiscal year 2009 to evaluate the effectiveness of the Center. The scope of work for the study addresses not only the efficiency and cost effectiveness of the programs for the various populations served by HKNC and its regional offices, but also the Center’s interactions with vocational rehabilitation agencies. In addition, it will examine the support that HKNC provides to other service providers and to the family members of deaf-blind individuals who, in turn, support those individuals.

REHABILITATION SERVICES AND DISABILITY RESEARCH Helen Keller National Center
J-96
The study plan includes the following preliminary research questions: • Does HKNC meet its legislative mandates? • Is the Center providing services that address the vocational and independent living
needs of its clients? • Do the adjustment training, independent living, and vocational services provided by the
HKNC Headquarters program and regional representatives to individuals who are deaf-blind effectively lead to or result in successful employment or independent living outcomes?
• Are some services more or less effective than others and why? • Does HKNC make efficient use of its resources, and are services cost effective? • Is the training provided to families effective in assisting them to maximize the vocational
and independent living goals of individuals who are deaf-blind? • Is the training provided to staff of vocational rehabilitation (VR) agencies or the providers
with whom they contract effective? • Does pre-service and in-service training provided to professionals lead to enhanced
capacity by VR agencies or other service providers to serve individuals who are deaf-blind?
• Are the vocational services and independent living services provided by the HKNC Headquarters program and regional representatives to individuals who are deaf-blind effective, and do they lead to or result in successful employment outcomes?
• Do VR agencies believe HKNC is offering the right mix of services and that the services provided meet the needs of VR consumers and agencies?
• Are the current performance measures adequate for monitoring the effectiveness of HKNC Headquarters, field services, and training services?
• What alternative outcome measures could be developed for the field services and training programs, and cost effectiveness and efficiency measures for the HKNC Headquarters and regional programs?
• What improvements can HKNC put in place to make its programs more effective or more efficient?
The Department anticipates that the study will be completed by October 2010.

REHABILITATION SERVICES AND DISABILITY RESEARCH
J-97
National Institute on Disability and Rehabilitation Research (Rehabilitation Act of 1973, Title II)
FY 2010 Authorization ($000s): 0 1
Budget Authority ($000s): 2009 2010 Change $107,741 $110,741 +$3,000 _________________
1 The program is authorized in FY 2009 through appropriations language. Continued funding is proposed for this program in FY 2010 through appropriations language.
PROGRAM DESCRIPTION
The mission of the National Institute on Disability and Rehabilitation Research (NIDRR) is to generate knowledge and promote its effective use to improve the abilities of people with disabilities to perform activities of their choice in the community, and also to expand society’s capacity to provide full opportunities and accommodations for its citizens with disabilities. NIDRR conducts comprehensive and coordinated programs of research and related activities to maximize the full inclusion, social integration, employment, and independent living of individuals with disabilities of all ages. The purposes of NIDRR are to:
• Promote, coordinate, and provide for research, demonstration and training, and related activities with respect to individuals with disabilities;
• Widely disseminate findings, conclusions, and recommendations resulting from its activities; and
• Provide leadership in advancing the quality of life of individuals with disabilities.
NIDRR's research is conducted through a network of individual research projects and centers of excellence located throughout the Nation. Most funding is awarded through competitive grants, and most of the funds are awarded to universities or providers of rehabilitation or related services.
On February 15, 2006, NIDRR published its Long-Range Plan for Fiscal Years 2005—2009, which outlines three long-term performance goals and its strategies for achieving these goals. These goals are:
• Goal 1: Advancing knowledge through capacity building,
• Goal 2: Advancing knowledge through research and related activities, and
• Goal 3: Advancing knowledge through translation and dissemination.

REHABILITATION SERVICES AND DISABILITY RESEARCH National Institute on Disability and Rehabilitation Research
J-98
NIDRR funding supports a portfolio of research and development, capacity building, and knowledge translation projects that are aligned with these long-term performance goals
Following is a description of the primary areas for which NIDRR makes awards:
Rehabilitation Engineering Research Centers (RERCs). The RERCs conduct research on issues dealing with rehabilitation technology, including rehabilitation engineering and assistive technology devices and services. The Long-Range Plan notes that rehabilitation engineering and assistive technology development have played a major role in creating technology for use by individuals with disabilities in their daily lives. RERC activities include developing and disseminating innovative methods of applying advanced technology, scientific achievements, and psychological and social knowledge to rehabilitation issues such as the removal of environmental barriers; developing and disseminating technology designed to lessen the effects of sensory loss, mobility impairment, chronic pain, and communication difficulties; scientific research to assist in meeting the employment and independent living needs of individuals with severe disabilities; and stimulating the production and distribution of equipment in the private sector, as well as clinical evaluations of equipment. Each RERC must provide training opportunities to enable individuals, including individuals with disabilities, to become researchers and practitioners of rehabilitation technology. Awards are for 5 years, except that grants to new recipients or to support new or innovative research may be made for less than 5 years.
Future research may build upon recent advances in biomaterials research, composite technologies, information and telecommunication technologies, nanotechnologies, micro electro-mechanical systems, sensor technologies, and the neurosciences. A particular focus may be the further application of the principles of universal design to the development of new products. Products that incorporate the principles of universal design often prove to be highly useful for non-disabled individuals, as well as the growing elderly population.
Rehabilitation Research and Training Centers (RRTCs). RRTCs receive funding to conduct coordinated and advanced programs of research, training, and information dissemination in problem areas that are specified by NIDRR. More specifically, RRTCs conduct research to improve rehabilitation methodologies and service delivery systems, alleviate or stabilize disabling conditions, and promote maximum social and economic independence for persons with disabilities; provide training, including graduate, pre-service, and in-service training, to help rehabilitation personnel provide more effective rehabilitation services to individuals with disabilities; and serve as centers of excellence in rehabilitation research for providers and for individuals with disabilities and their representatives. Typically, awards are for 5 years. However, NIDRR also may award grants for less than 5 years to support new or innovative research.
Model Systems. NIDRR funds model systems projects in three areas: spinal cord injury, traumatic brain injury (TBI), and burn injury. Model systems funding supports 5-year grants to establish innovative projects for the delivery, demonstration, and evaluation of comprehensive medical, vocational, and other rehabilitation services to meet the wide range of needs of individuals in these areas. Grantees in each of the three areas contribute to a national database that is supported by NIDRR funding. These model systems programs have become platforms for conducting multi-site research, including randomized controlled trials to determine the

REHABILITATION SERVICES AND DISABILITY RESEARCH National Institute on Disability and Rehabilitation Research
J-99
efficacy of interventions. Currently, the NIDRR TBI model systems is participating as the largest nonmilitary TBI service delivery/research entity in various intergovernmental efforts to improve treatment and outcomes for returning veterans.
• Model Spinal Cord Injury Model Systems. The Model Spinal Cord Injury (SCI) program funds research to meet the wide range of needs of individuals with spinal cord injuries. (See http://www.ncddr.org/rpp/hf/hfdw/mscis/.) The projects also disseminate information to individuals with SCI and others.
• Traumatic Brain Injury Model Systems. The Traumatic Brain Injury (TBI) Model Systems projects are research and demonstration grants designed to advance the understanding of TBI and its consequences and improve rehabilitation outcomes. (See http://www.tbindsc.org)
• Burn Injury Model Systems. The Burn Model Systems (BMS) projects are research and demonstration grants designed to establish, demonstrate, and evaluate a model system of care for burn injury survivors. The goal of the projects is to reduce disability by improving treatment and rehabilitation. (See http://mama.uchsc.edu/pub/NIDRR/index.html.)
Field-Initiated Projects (FIP). Field-Initiated Projects supplement NIDRR’s directed research and address a wide range of topics identified by investigators, including research, demonstrations, development, and knowledge translation. These projects allow NIDRR to address emerging developments in the field beyond the scope of announced priorities. Most of these awards are made for 3 years.
Assistive Technology Fund/Small Business Innovation Research projects (SBIR). SBIR awards support the development of new rehabilitation technologies that are useful to persons with disabilities by inviting the participation of small business firms with strong research capabilities in science, engineering, or educational technology. This 2-phase program takes a product from development to market readiness. During Phase I, firms conduct feasibility studies to evaluate the scientific and technical merit of an idea. During Phase II, they expand on the results and pursue further development. In order to be eligible, small businesses must: be American-owned and independently operated; be for-profit and employ no more than 500 employees; and the principal researcher must be employed by the business.
Outreach to Minority Institutions. The Rehabilitation Act requires that 1 percent of funds appropriated for programs authorized under certain titles be reserved for awards to minority entities and Indian tribes, or to provide outreach and assistance to minority entities and Indian tribes.
Other Grant Awards. NIDRR makes awards in several other areas, including Switzer research fellowships, Advanced Rehabilitation Research Training (ARRT) projects, and Disability and Rehabilitation Research Projects (DRRP). Switzer research fellows receive 1-year fellowships to carry out discrete research activities that are related to NIDRR’s research priorities or to pursue studies in areas of importance to the rehabilitation community. The ARRT program supports grants to institutions to provide advanced postdoctoral training in areas that are directly related to NIDRR’s research portfolio, such as medical rehabilitation, engineering, technology, community integration, and employment. Grants are made to institutions to recruit qualified

REHABILITATION SERVICES AND DISABILITY RESEARCH National Institute on Disability and Rehabilitation Research
J-100
persons with doctoral or similar advanced degrees and prepare them to conduct independent research in areas related to disability and rehabilitation. These training programs must operate in interdisciplinary environments and provide training in rigorous scientific methods. The DRRP awards support research and related activities to address focused, discrete research topics. NIDRR uses the DRRP mechanism to make awards in its TBI and Burn Model Systems programs, as well as its Disability and Business Technical Assistance Centers (DBTAC) program. The DBTAC grants provide technical assistance, disseminate information, and provide training related to the requirements of the Americans with Disabilities Act (ADA) and promote awareness of the ADA.
Other Activities: NIDRR funding also supports a variety of other activities, including collaborative projects with other agencies; development and maintenance of grantee reporting systems; program review; and reporting, evaluation, long-range planning, and the Interagency Committee on Disability Research (ICDR). The primary purpose of the ICDR is to promote cooperation across various Federal agencies in the development and execution of disability and rehabilitation research activities. (See http://www.icdr.us/.)
Funding levels for the past 5 fiscal years were as follows: ($000s)
2005.............................................. $107,783 2006.............................................. 106,705 2007.............................................. 106,705 2008.............................................. 105,741 2009.............................................. 107,741
FY 2010 BUDGET REQUEST
The Administration requests $110.741 million for the National Institute on Disability and Rehabilitation Research (NIDRR), an increase of $3 million above the fiscal year 2009 appropriation level. The additional funds would be used to conduct demonstrations of promising models for serving students with intellectual disabilities, including students with mental retardation or significant cognitive impairments, in postsecondary education programs.
There are a small number of postsecondary institutions serving students with intellectual disabilities. However, preliminary research data indicate that students with intellectual disabilities who attended a postsecondary education program may have better employment outcomes than their peers who did not (Hart, D., Mele-McCarthy, J., Pasternak, R., Zimbrich, K., and Parker, D., 2004). In fiscal year 2010, the Department proposes to fund several demonstration projects to examine the feasibility of and outcomes associated with promising models of postsecondary education programs for students with intellectual disabilities. A comprehensive evaluation of each model would be an integral component of this demonstration program.
In fiscal year 2008, NIDRR awarded a grant for a three-year study to: (1) to learn more about students with intellectual disabilities who attend, or are able to attend postsecondary education institutions; and (2) conduct a survey of existing postsecondary education institutions that serve

REHABILITATION SERVICES AND DISABILITY RESEARCH National Institute on Disability and Rehabilitation Research
J-101
students with intellectual disabilities, including five in-depth studies of existing programs that might serve as models of successful postsecondary education programs for students with disabilities. The proposed demonstration projects would use information gathered during this study to help select the demonstration projects. We believe this program has strong potential to enhance our understanding of how postsecondary education institutions can serve students with intellectual disabilities and help them become more independent and productive citizens.
Individuals with disabilities face challenges in employment, housing, health services, recreation, and public accommodation. The Department provides support for NIDRR to conduct research that can help address these challenges. NIDRR supports a wide range of rehabilitation research in these areas and additional areas such as health and function, community living, assistive technology, and disability demographics. Past support for NIDRR has yielded substantial benefits in a variety of areas, including advancements in technology, policy changes, and improvements in rehabilitation and disability research. The cross-cutting category in the following chart refers to projects that address two or more domains.
Research Domains
Health & Function
EmploymentParticipation/Community Living
Cross-Cutting
Following are examples of results of NIDRR projects completed in fiscal year 2008:
Rehabilitation Engineering Research Centers (RERCs): “EZ Access” Techniques – The Universal Interface and Information Technology RERC has developed, and continues to improve a collection of interface enhancements (hardware and software) that can be utilized to make touchscreen-based information and transaction kiosks cross-disability accessible. EZ Access enhancements can be applied to a wide range of interactive electronic systems from public information and transaction machines, such as kiosks, to personal handheld devices like cellular phones. Some of the techniques have been incorporated into electronic voting systems and door entry systems. Recent implementations include: World War II and Korean War

REHABILITATION SERVICES AND DISABILITY RESEARCH National Institute on Disability and Rehabilitation Research
J-102
Memorials in Washington, D.C.; Amtrak Quik-Trak Ticket Machines nationwide; 20,000 U.S. Postal Service Automated Postal Centers; Phoenix Sky Harbor airport paging stations (throughout the airport); and IBM’s accessible travel self-service kiosk. The blue diamond EZ Help button shown to the left appears on devices that have approved implementations of the EZ Access system of access features and techniques. (www.cmhsrp.uic.edu/nrtc/tanf.asp)
The RERC on Telecommunications Access conducted work on cordless phone technology that was incorporated and cited in the industry standard. Digital cordless telephones were creating interference in hearing aids, and complaints were filed by consumers with the Federal Communications Commission. The RERC worked closely with the cordless phone industry and a national consumer group of hard of hearing people to identify the source of the problem, collaborate on research with hard of hearing consumers, evaluate cordless phones, and develop standards. The RERC’s work is cited in the industry standard for cordless phone performance and compatible cordless phones are now on the market.
Rehabilitation Research and Training Centers: The University of Pennsylvania Collaborative on Community Integration RRTC was funded to promote community integration of individuals with psychiatric disabilities. The project was conducted in partnership with the clearinghouse at the Mental Health Association of Southeastern Pennsylvania and The Matrix Center at Horizon House, Inc. The Collaborative targeted obstacles that prevent people from being full members of their communities, developed supports to enhance community integration, and expanded the range of opportunities for people who have mental illnesses to participate in their communities as active, equal members. In addition to the above partners, this framework was adopted by the Veterans Administration in its recovery centers to facilitate community integration outcomes of individuals with psychiatric disabilities.
Disability and Rehabilitation Research Projects (DRRP): A project at the University of Rochester on interpreter training, dialectical behavior therapy (DBT), and psychological testing developed an approach to help sign-language interpreters better translate meaning instead of just words. Phrases in spoken English can have little relation to their literal translation into sign language, which raises the danger of miscommunication in vital exchanges between doctor and patient. This approach emphasizes the meaning behind words and the context in which they are spoken (http://www.urmc.rochester.edu/pr/news/story.cfm). The Centers for Disease Control funded additional work on this approach to apply to projects related to domestic violence, asthma, and emergency response sheltering.
NIDRR’s Traumatic Brain Injury (TBI) Model Systems program was recognized by Congress as a source of research expertise in the field of TBI. The National Defense Authorization Act of Fiscal Year 2008, PL 110-181 (Section 1704 (c) and (d)), specifically requires the Secretary of Veterans Affairs (VA) to collaborate with institutions that receive TBI research grants from

REHABILITATION SERVICES AND DISABILITY RESEARCH National Institute on Disability and Rehabilitation Research
J-103
NIDRR. This congressionally mandated collaboration between NIDRR grantees and the VA is intended to produce a health registry of military veterans who exhibit symptoms of TBI. Pursuant to this legislation, NIDRR and the VA have entered into one Interagency Agreement (IAA), and are in the process of entering into a second. Through these IAAs, the VA is channeling resources to the NIDRR-funded TBI Model Systems National Data and Statistical Center (TBINDSC) at Craig Hospital. NIDRR’s TBINDSC is providing the VA with necessary clinical and database expertise, as well as the technology infrastructure to establish the mandated health registry of U.S. military veterans with symptoms of TBI.
In other areas, Model systems research has led to improved care and rehabilitation for persons with spinal cord injury, traumatic brain injury, and severe burns, resulting in shorter periods of care and faster reintegration into their communities. The extent to which a person with SCI, or any other disability, fully participates as a member of society is a function of the interaction between the individual’s impairments, activity limitations, and personal attributes on the one hand; and the physical, attitudinal, and policy environmental barriers and facilitators on the other. To address the importance of participation, coupled with the current absence of a standard acceptable measure of participation, an SCI model system grant is leading a study to identify the best existing measure of participation or combine the best items from existing measures of participation to form a new and improved tool with better psychometric properties (http://www.craighospital.org/Research/Projects.asp).
NIDRR support has led to the development of information resources such as the Center for Outcomes Measurement in Brain Injury (COMBI) (http://www.tbims.org/combi/), which provides detailed information on reliability and validity in the use of outcomes assessment tools. Other TBI work involves research on strategies to provide cognitive retraining for individuals with traumatic brain injury.
In fiscal year 2010, NIDRR will continue to strive to improve the quality and utility of disability and rehabilitation research, exchange expertise and information, train future researchers, determine the best strategies and programs to improve rehabilitation outcomes for underserved populations, identify research gaps and mechanisms of integrating research and practice, and disseminate findings. New activities that are being proposed for 2010 include a focus on research and other activities to improve employment outcomes for individuals with disabilities. In addition, NIDRR is considering priorities in the area of psychiatric disability.
Other highlights are discussed below.
Rehabilitation Engineering Research Centers (RERCs). In 2010, NIDRR proposes to fund RERCs at nearly $18.0 million, of which approximately $1.9 million would be used to make 2 new awards in the following areas: universal design and the built environment and children with orthopedic disabilities. In addition, $16.1 million would be used to continue funding for 17 existing grants.
Rehabilitation Research and Training Centers (RRTCs). In 2010, NIDRR proposes to fund RRTCs at nearly $17 million, of which $1 million would be used to make a new award in the area of psychiatric disability, and $15.7 million would be used to cover continuation costs for 19 existing RRTCs.

REHABILITATION SERVICES AND DISABILITY RESEARCH National Institute on Disability and Rehabilitation Research
J-104
Model Systems. In 2010, NIDRR plans to use approximately $19.8 million to support ongoing work in model systems: nearly $8.9 million to support 17 continuations in the area of spinal cord injury, nearly $9.2 million to support 19 continuations in traumatic brain injury, and $1.75 million for 5 continuations in the area of burn injury.
Field-Initiated Projects (FIP). Proposed 2010 funding is $11.6 million, which would allow continuation funding for 41 projects awarded in prior years, as well as approximately 20 new grant awards.
Assistive Technology Fund/Small Business Innovation Research (SBIR). In 2010, NIDRR plans to spend approximately $1.25 million to support 5 SBIR continuations, and $2.4 million to support 15 new phase I and 5 new phase II awards.
Outreach to Minority Institutions. Continuation funding for three projects awarded in 2008 would use all of the $1.1 million set aside for activities in this area in fiscal year 2010.
Other Grant Awards. NIDRR anticipates making approximately 15 new awards in other areas in 2010, including approximately 7 awards for Switzer research fellows, 4 awards for Advanced Rehabilitation Research Training (ARRT) projects, 4 awards for Disability and Rehabilitation Research Projects (DRRP), and 2 for knowledge translation. Priority areas for the DRRP program in 2010 will likely emphasize employment-related topics, including: transition to employment; knowledge translation of employment research findings, and the role of assistive technology in improving employment outcomes. Fiscal year 2010 funding also would support the continuation costs of ARRT and DRRP awards, including the Disability and Business Technical Assistance Centers and the Knowledge Translation Center, which helps determine how to best communicate new knowledge to beneficiaries, that were made in prior years.
Other Activities: NIDRR funding in this category will be used to support collaborative projects with other agencies; development and maintenance of grantee reporting systems; program review; reporting, evaluation, long-range planning; and the Interagency Committee on Disability Research (ICDR). Funds in this category also support Abledata (http://www.abledata.com/), which provides online information about assistive technology products and rehabilitation equipment.
PROGRAM OUTPUT MEASURES (000s) Funding Number of Awards 2008 2009 2010 2008 2009 2010 Rehabilitation Engineering Research Centers Continuations $9,477 $13,247 $16,097 12 16 17 New awards 6,650 2,850 1,900 7 3 2
Subtotal 16,127 16,097 17,997 19 19 19
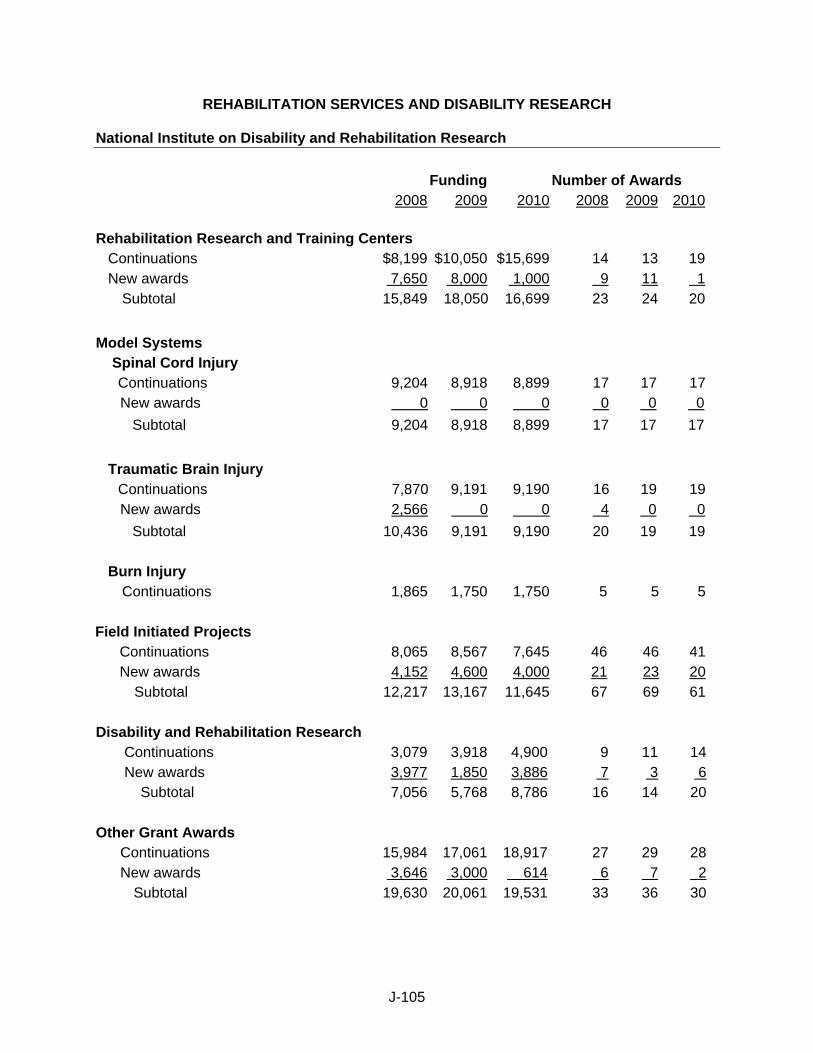
REHABILITATION SERVICES AND DISABILITY RESEARCH National Institute on Disability and Rehabilitation Research
J-105
Funding Number of Awards 2008 2009 2010 2008 2009 2010 Rehabilitation Research and Training Centers Continuations $8,199 $10,050 $15,699 14 13 19 New awards 7,650 8,000 1,000 9 11 1
Subtotal 15,849 18,050 16,699 23 24 20 Model Systems Spinal Cord Injury
Continuations 9,204 8,918 8,899 17 17 17 New awards 0 0 0 0 0 0 Subtotal 9,204 8,918 8,899 17 17 17 Traumatic Brain Injury
Continuations 7,870 9,191 9,190 16 19 19 New awards 2,566 0 0 4 0 0 Subtotal 10,436 9,191 9,190 20 19 19 Burn Injury
Continuations 1,865 1,750 1,750 5 5 5
Field Initiated Projects Continuations 8,065 8,567 7,645 46 46 41 New awards 4,152 4,600 4,000 21 23 20
Subtotal 12,217 13,167 11,645 67 69 61 Disability and Rehabilitation Research Continuations 3,079 3,918 4,900 9 11 14 New awards 3,977 1,850 3,886 7 3 6 Subtotal 7,056 5,768 8,786 16 14 20
Other Grant Awards Continuations 15,984 17,061 18,917 27 29 28 New awards 3,646 3,000 614 6 7 2
Subtotal 19,630 20,061 19,531 33 36 30

REHABILITATION SERVICES AND DISABILITY RESEARCH National Institute on Disability and Rehabilitation Research
J-106
Funding Number of Awards 2008 2009 2010 2008 2009 2010
Minority Outreach $1,064 $1,065 $1,059 3 3 3 Small Business Innovation Research 3,594 3,634 3,625 25 25 25 Other activities (Contracts) 7,855 8,929 7,530 NA NA NA Mary Switzer Fellowships 505 505 505 7 7 7 Peer review of new grant applications 339 606 539 Subtotal 13,357 14,739 13,258 Total, NIDRR 105,741 107,741 107,741 235 238 230
PROGRAM PERFORMANCE INFORMATION
Performance Measures
This section presents selected program performance information, including, for example, GPRA goals, objectives, measures, performance targets and data, and an assessment of the progress made toward achieving program results. Achievement of program results is based on the cumulative effect of the resources provided in previous years and those requested in FY 2010 and future years, and the resources and efforts invested by those served by the program.
In 2004, NIDRR established three long-term goals: To advance knowledge through capacity building, to advance knowledge through research and related activities, and to advance knowledge through translation and dissemination. NIDRR measures progress towards meeting these goals through both long-term and annual performance measures. Progress towards meeting long-term goals is assessed every 3 years.
Goal: To conduct high-quality research and related activities that lead to high-quality products.
Objective: Advance knowledge through capacity building: Increase capacity to conduct and use high-quality and relevant disability and rehabilitation research and related activities designed to guide decision-making, change practice and improve the lives of individuals with disabilities.
Measure: The percentage of NIDRR-supported fellows, post-doctoral trainees, and doctoral students who publish results of NIDRR-sponsored research in refereed journals.
Year Target Actual 2006 9 2007 17 2008 TBD 2009 TBD 2010 TBD

REHABILITATION SERVICES AND DISABILITY RESEARCH National Institute on Disability and Rehabilitation Research
J-107
Assessment of progress: For this measure, refereed journals are those journals that are recognized by the Thompson Institute for Scientific Information. See: http://www.thompsonscientific.com/cgi-bin/jrnlst/jloptions.cgi?PC=master. Due to the large difference between the 2006 and 2007 data, NIDRR intends to collect at least 1 more year of data before establishing targets for this measure. A single author is counted only once if he or she produces multiple peer-reviewed publications, and fellows or graduate students who co-authored a publication are counted individually for their contributions to one publication. In fiscal year 2007, NIDRR supported a total of 538 fellows, post-doctoral trainees, and doctoral students, of whom 92 produced publications that appeared in refereed journals. This measure only includes NIDRR research grantees funded under NIDRR’s RRTCs, RERCs, ARRTs, MS, DRRP, and FIP. In 2008, grants in these areas accounted for approximately 59 percent of NIDRR’s total appropriation. These data do not include awards funded by the SBIR program.
Objective: Advance knowledge through research and related activities: Generate scientific-based knowledge, technologies, and applications to inform policy, change practice, and improve outcomes.
Measure: The number of accomplishments (e.g., new or improved tools, methods, discoveries, standards, interventions, programs, or devices) developed or tested with NIDRR funding that have been judged by expert panels to be of high quality and to advance the field.
Assessment of progress: NIDRR has been reviewing one-third of its grant portfolio each year since fiscal year 2005. Reviewers who are experts in disabilities research were asked to rate the accomplishments reported by grantees. In fiscal year 2007, baseline data were reported that indicated that 49 percent of the number of accomplishments were judged to be of high quality and to advance the field. However, there were concerns about the validity and reliability of the data generated by these reviews. The Department is re-designing this peer review mechanism to improve the quality, reliability, and utility of expert reviews, along with data generated by such reviews. NIDRR is developing a pilot test to be implemented in fiscal year 2010 to test an external evaluation of grantee products. This evaluation will provide a new source of data for this measure. We expect that the data from the fiscal years 2005 to 2007 reviews will not be comparable with data produced by the new peer review mechanism. If necessary, the Department may need to change the language for this measure.
NIDRR has developed two annual measures to provide information related to its goal of advancing knowledge through research and related activities. Measure: Percentage of NIDRR-funded grant applications that receive an average peer review score of 85 or higher.
Year Target Actual 2005 99 2006 85 99 2007 90 96 2008 99 85 2009 99 2010 99

REHABILITATION SERVICES AND DISABILITY RESEARCH National Institute on Disability and Rehabilitation Research
J-108
Assessment of progress: This measure assesses the extent to which NIDRR-funded grant applications are judged by expert review panels to be of high quality. In fiscal year 2008, 85 percent of new awards received ratings of 85 or higher, which is lower than the scores for the preceding years. NIDRR believes that the decline in scores reflects improvements in the peer review process and increases in the expertise of panel members. Even with the decline, the data suggest that NIDRR makes awards to a high number of high-scoring grantees. Data for the measure include all grant awards made within a given fiscal year. Measure: Percentage of new grants that assess the effectiveness of interventions, programs, and devices using rigorous methods.
Year Target Actual 2005 65 49 2006 65 Not collected 2007 65 35 2008 -- 2009 35 2010 35
Assessment of progress: This measure provides information on the proportion of NIDRR grantees that are engaged in experimental or quasi-experimental projects to determine whether interventions, programs, and devices are effective. The percentage of NIDRR grants that include tightly controlled research methods, such as true experimental, quasi-experimental, or single-subject methodologies, appears to be declining each year. However, because NIDRR funds a wide range of types of grants—including those engaged in statistical analysis, dissemination of information, and more basic developmental work—NIDRR does not believe it is appropriate to require all grantees to conduct tightly controlled intervention research and development. For fiscal year 2009 and beyond, NIDRR reevaluated the targets based on actual performance and established a new target of 35 percent, or approximately one-third of its portfolio. NIDRR intends to propose priorities for future competitions that will help to ensure that studies using tightly controlled experimental methods are conducted, whenever possible, when interventions are being tested. NIDRR also is examining the peer review criteria to ensure that they are appropriate and being applied uniformly.
Objective: Advance knowledge through translation and dissemination: Promote the effective use of scientific-based knowledge, technologies, and applications to inform policy, improve practice, and enhance the lives of individuals with disabilities.
NIDRR has developed two measures to assess progress towards meeting the translation and dissemination goal. These measure are:
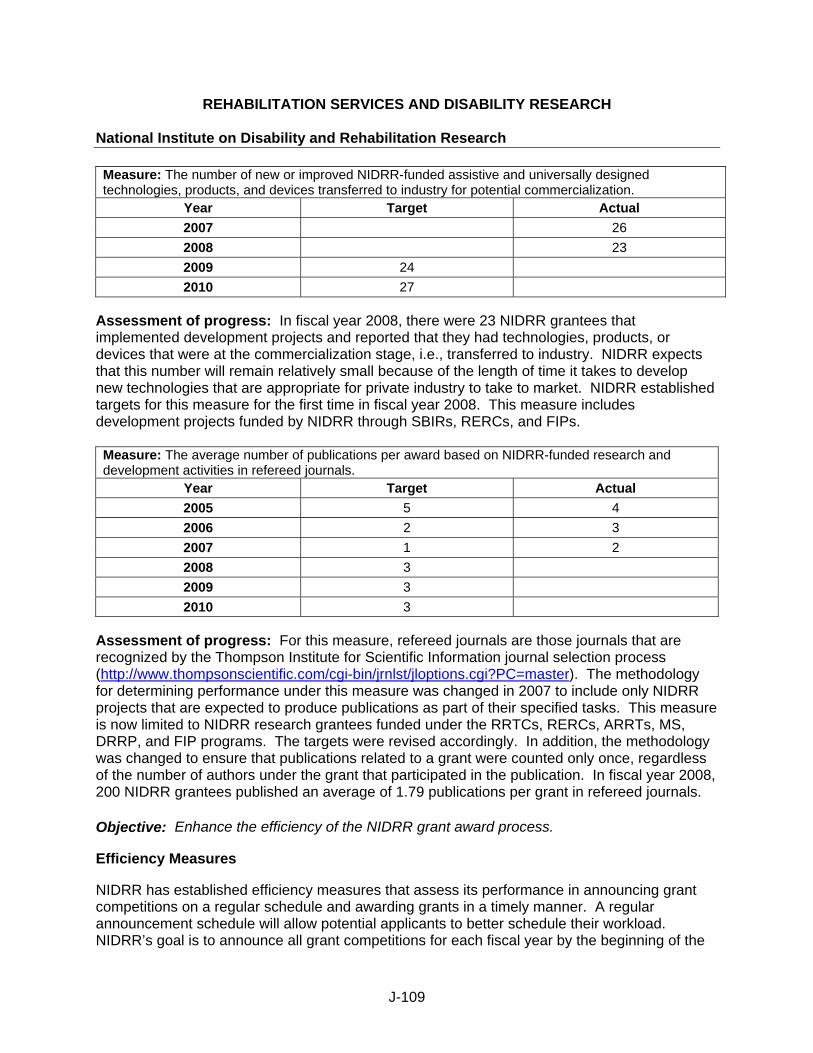
REHABILITATION SERVICES AND DISABILITY RESEARCH National Institute on Disability and Rehabilitation Research
J-109
Measure: The number of new or improved NIDRR-funded assistive and universally designed technologies, products, and devices transferred to industry for potential commercialization.
Year Target Actual 2007 26 2008 23 2009 24 2010 27
Assessment of progress: In fiscal year 2008, there were 23 NIDRR grantees that implemented development projects and reported that they had technologies, products, or devices that were at the commercialization stage, i.e., transferred to industry. NIDRR expects that this number will remain relatively small because of the length of time it takes to develop new technologies that are appropriate for private industry to take to market. NIDRR established targets for this measure for the first time in fiscal year 2008. This measure includes development projects funded by NIDRR through SBIRs, RERCs, and FIPs. Measure: The average number of publications per award based on NIDRR-funded research and development activities in refereed journals.
Year Target Actual 2005 5 4 2006 2 3 2007 1 2 2008 3 2009 3 2010 3
Assessment of progress: For this measure, refereed journals are those journals that are recognized by the Thompson Institute for Scientific Information journal selection process (http://www.thompsonscientific.com/cgi-bin/jrnlst/jloptions.cgi?PC=master). The methodology for determining performance under this measure was changed in 2007 to include only NIDRR projects that are expected to produce publications as part of their specified tasks. This measure is now limited to NIDRR research grantees funded under the RRTCs, RERCs, ARRTs, MS, DRRP, and FIP programs. The targets were revised accordingly. In addition, the methodology was changed to ensure that publications related to a grant were counted only once, regardless of the number of authors under the grant that participated in the publication. In fiscal year 2008, 200 NIDRR grantees published an average of 1.79 publications per grant in refereed journals. Objective: Enhance the efficiency of the NIDRR grant award process.
Efficiency Measures
NIDRR has established efficiency measures that assess its performance in announcing grant competitions on a regular schedule and awarding grants in a timely manner. A regular announcement schedule will allow potential applicants to better schedule their workload. NIDRR’s goal is to announce all grant competitions for each fiscal year by the beginning of the

REHABILITATION SERVICES AND DISABILITY RESEARCH National Institute on Disability and Rehabilitation Research
J-110
fiscal year (October 1) and to notify applicants whether they have received an award within 6 months of application closing dates.
Measure: The percentage of grant competitions for a given fiscal year that are announced by the beginning of that fiscal year (October 1).
Year Target Actual 2005 8 2006 25 11 2007 50 69 2008 90 75 2009 70 2010 75
Measure: The percentage of grant awards issued within 6 months of the competition closing date.
Year Target Actual 2005 90 57 2006 90 87 2007 90 100 2008 90 90 2009 80 2010 85
Assessment of Progress: In fiscal year 2008, 75 percent of new competitions were announced by October 1st. This is a 5 percent increase over fiscal year 2007. The targets for the timely announcement of grant competitions were revised based on past performance to reflect more realistic expectations. NIDRR met the target for grant awards issued within 6 months of the competition closing date, though the rate was 10 percent lower than the rate in fiscal year 2008.
Program Improvement Efforts
Following are a number of improvement efforts being undertaken by the Department:
• Reviewing and revising the research portfolio to focus on a more strategic set of priority areas that will help achieve its goals. The Office of Special Education and Rehabilitation Services (OSERS) is currently working to promote stronger linkages between NIDRR’s investments and areas of demonstrated need across the Department, such as programs that focus on similar populations and outcomes currently administered by the Rehabilitation Services Administration (RSA). For example, in fiscal year 2009, NIDRR plans to focus more strategically on a variety of employment-related new awards that will address many of the vocational and rehabilitation needs associated with individuals receiving services through RSA’s programs.
• Reviewing and revising the design of NIDDR’s current annual expert panel process to improve the quality, reliability, and management utility of the expert panel reviews, along

REHABILITATION SERVICES AND DISABILITY RESEARCH National Institute on Disability and Rehabilitation Research
J-111
with the data produced by such reviews. NIDRR is redesigning its annual review of product accomplishments to improve the quality, reliability, and utility of expert reviews, along with data generated by such reviews. NIDRR is developing a pilot test to be implemented in fiscal year 2010 to test an external evaluation of grantee products and accomplishments. We expect that this evaluation will provide a new source of valid, reliable performance data.
• Establishing a regular schedule for announcing grant competitions and competition results to allow applicants to better schedule their workload. In FY 2006, for the first time, NIDRR announced nearly all priorities in a single notice, which was published in the Federal Register on February 7th, 2006. NIDRR succeeded in announcing 69 percent of its fiscal year 2008 grant competitions by the beginning of the fiscal year. NIDRR’s ultimate goal is to align the grant competition announcement schedule with the revised expert panel review process to ensure that feedback from panel members may be incorporated into subsequent priorities.

REHABILITATION SERVICES AND DISABILITY RESEARCH
J-112
Assistive technology (Assistive Technology Act of 1998)
FY 2010 Authorization ($000s): Indefinite 1
Budget Authority ($000s):
2009 2010 Change $30,960 $30,960 0
_________________
1Up to $1,235 thousand may be used for National Activities, unless the amount available for AT State grants exceeds $20,953,534, in which case up to $1,900 thousand may be used for National Activities.
PROGRAM DESCRIPTION
The purpose of the Assistive Technology (AT) Act is to provide States with financial assistance that supports programs designed to maximize the ability of individuals with disabilities of all ages and their family members, guardians, advocates, and authorized representatives to obtain AT devices and AT services. AT devices are defined as any item, piece of equipment, or product system, whether acquired commercially, modified, or customized, that is used to increase, maintain, or improve functional capabilities of individuals with disabilities. A few examples of such devices are computer or technology aids, modified driving controls, and durable medical equipment such as wheelchairs or walkers. Grants support comprehensive statewide programs that are designed to increase the:
• availability of, funding for, access to, provision of, and training about AT devices and services;
• ability of individuals with disabilities of all ages to secure and maintain possession of AT during periods of transition, such as transition between school and home and home and work;
• capacity of public and private entities to provide and pay for AT devices and services;
• involvement of individuals with disabilities in decisions about AT devices and services;
• coordination of AT-related activities among State and local agencies and other private entities;
• awareness of and facilitate changes in law, regulations, procedures, policies, practices, and organizational structures, in order to improve access to AT; and
• awareness of the benefits of AT among targeted individuals and entities in the general population.

REHABILITATION SERVICES AND DISABILITY RESEARCH Assistive technology
J-113
Assistive Technology (AT) State grant program The AT State grant program has been a population-based formula grant program since fiscal year 2005. The purpose of these grants to States is to support comprehensive statewide programs that maximize the ability of individuals with disabilities of all ages to access and acquire AT. States must establish consumer-responsive advisory councils with a majority membership of individuals with disabilities who use AT to advise on the planning, implementation, and evaluation of these statewide programs.
Under the formula, States and outlying areas are allocated a base amount that is not less than the amount they received in fiscal year 2004 (totaling $20,288,534). Funds appropriated in excess of the base amount are divided in half and distributed equally to each State, and by a State population-based formula, so that each State receives not less than $410,000 and outlying areas receive $125,000. If funds remain after increasing all States and outlying areas to these minimums, the remainder is again divided and distributed to States with 80 percent being allotted through the State population-based formula and 20 percent allotted in equal shares. The fiscal year 2008 allotments were based on the July 1, 2005 population estimates published by the Census Bureau in December 2005. The fiscal year 2009 allotments are based on the July 1, 2006 population estimates published in December 2007. The fiscal year 2010 State distributions are based on the July 1, 2008 population estimates released on December 22, 2008. Each State must submit an application that contains measurable goals, with time lines, that address the AT needs of individuals with disabilities related to: education (including goals related to the delivery of AT devices and services to students receiving services under the Individuals with Disabilities Education Act (IDEA)); employment (including goals related to the Rehabilitation Act’s Vocational Rehabilitation State Grant program); telecommunications and information technology; and community living. The application must include information on how the State will determine whether it has met its goals. The Rehabilitation Services Administration (RSA) has the authority to hold States accountable for a lack of progress toward these goals.
The application must also contain a detailed description of how the State will implement each of the required activities. Required activities include State-level activities and State leadership activities. States must spend a minimum of 60 percent (unless the State elects to comply with the State flexibility provision in section 4(e)(6) described below) of their formula grant funds on four State-level activities: State financing programs, device reutilization programs, device loan programs, and device demonstrations. States may, however, direct their funds towards these activities in varying amounts if they use other State or non-Federal funds to support these activities at a comparable or greater level.
States may use up to 40 percent of their AT State grant program funding on State leadership activities, with at least 5 percent of that amount devoted to technical assistance and training related to transition for students exiting school or adults entering community living. The State leadership activities include the provision of technical assistance and training to targeted individuals and entities focused on promoting the general awareness of the benefits of AT; skills development for persons involved in the assessment of the need for AT; the appropriate application of AT; and the integration of AT devices and services in plans required to be developed under other Federal laws, such as the IDEA’s Individualized Education Program and the Rehabilitation Act’s Individualized Plan for Employment. In addition, States must use a portion of their grant funds on public awareness

REHABILITATION SERVICES AND DISABILITY RESEARCH Assistive technology
J-114
activities, including the continuation and maintenance of a statewide system of information and referral, and coordination and collaboration activities amongst entities in the States that are responsible for the provision of AT. The law provides States with flexibility to decide to carry out only two or three State-level activities, rather than all four. If a State elects to carry out two or three State-level activities, it must spend a minimum of 70 percent of its funds on those activities, while spending not more than 30 percent on the State leadership activities. The AT Act specifies what a State must include in its annual progress report to RSA, including data on: the State’s financing program, device loan program activities, device reutilization programs, device demonstrations, including an analysis of those individuals who benefited from each of these programs; training activities; the statewide system of information and referral; and the outcomes of any improvement initiatives carried out by the State. The report must also provide data on the use of resources, including any contributed to the program by other public and private entities, and the level of customer satisfaction. Protection and Advocacy for Assistive Technology
Formula grants for protection and advocacy (P&A) systems established under the Developmental Disabilities Assistance and Bill of Rights Act support protection and advocacy services to assist individuals with disabilities of all ages in the acquisition, utilization, or maintenance of AT services or devices. Funds are distributed on a State population basis, with a minimum annual grant of $50,000. Outlying areas must receive not less than $30,000 annually. Also, the Act requires a minimum award of $30,000 to the P&A system serving the American Indian consortium. The fiscal year 2009 allotments are based on the July 1, 2007 population estimates published by the Census Bureau in December 2007. The fiscal year 2010 State distributions are based on the July 1, 2008 population estimates released on December 22, 2008. National Activities
The AT Act provides authority for the provision of technical assistance—through grants, contracts, or cooperative agreements awarded on a competitive basis—to individuals with disabilities of all ages, AT State grant program grantees, and to protection and advocacy systems. The AT Act requires the Secretary to make an award to renovate, update, and maintain the National Public Internet Site (http://www.assistivetech.net). In addition, the AT Act includes authority for grants, contracts, or cooperative agreements to assist grantees in developing and implementing effective data collection and reporting systems.
In designing its technical assistance activities, the Department must consider the input of directors of AT State grant programs and Alternative Financing programs, individuals with disabilities who use AT, family members, and protection and advocacy service providers, among others. The technical assistance must respond to specific requests for information and disseminate information to States, entities funded under the AT Act, and any other public entities that seek information about AT. The technical assistance must provide model approaches for the removal of barriers to accessing AT, examples of effective program coordination, and practices that increase funding for AT devices.
REHABILITATION SERVICES AND DISABILITY RESEARCH Assistive technology
J-115
Alternative Financing program In fiscal year 2005, the AT Act authorized the Secretary to award grants under the Alternative Financing program (AFP), as authorized in title III of the AT Act in effect prior to October 25, 2004. This authority was extended in fiscal year 2006 through appropriations language. Although no new awards are being made, the Alternative Financing Programs funded previously continue to operate. In addition financing programs are among the State level activities specified under the AT State grant program.
Funding levels for the past 5 fiscal years were as follows: ($000s)
2005................................................. $29,760 2006................................................. 30,452 2007................................................. 30,452 2008................................................. 29,920 2009................................................. 30.960
FY 2010 BUDGET REQUEST
The Administration requests $30.96 million in fiscal year 2010 for Assistive Technology (AT), the same as the fiscal year 2009 appropriation for this program. This program includes the AT State grant program, the Protection and Advocacy for Assistive Technology program, and National activities. These programs enable individuals to acquire technology they might not otherwise be able to obtain—technology that improves their quality of life, and in many cases, enables them to work or participate in other productive activities.
The request includes $25.66 million for the AT State grant program. These funds will be used by States to carry out the second year of their State plan. State plans must describe how the State intends to carry out its AT State grant program to meet the AT needs of individuals with disabilities in the State, achieve the measurable goals required by the AT Act, and comply with all applicable statutory and regulatory requirements.
The fiscal year 2010 request includes $4.3 million for the Protection and Advocacy for Assistive Technology (PAAT) program. At the requested level, 31 States would receive $50,000, the minimum amount allowed under the AT Act for the protection and advocacy systems established under the Developmental Disabilities Assistance and Bill of Rights Act to carry out this program. Outlying areas would receive $30,000. Currently, RSA is working to complete the Annual PAAT Performance Report that will be used to obtain information on the number of individuals with disabilities currently receiving protection and advocacy services under this program. No similar information is available from other data sources. Data from the form will be used to evaluate the effectiveness of eligible systems within individual States in meeting annual AT priorities and objectives.
The fiscal year 2010 request also includes $1 million for National Activities. In fiscal year 2010, the Department will make grants to support technical assistance for activities under the AT Act. The Act requires activities for a National Information Internet System, State training and technical assistance, and data collection and reporting assistance.

REHABILITATION SERVICES AND DISABILITY RESEARCH Assistive technology
J-116
PROGRAM OUTPUT MEASURES ($000s)
2008 2009 2010
AT State grant program $24,620 $25,660 $25,660 Protection and advocacy program 4,265 4,300 4,300 National activities 1,035 1,000 1,000
Total 29,920 30,960 30,960 PROGRAM PERFORMANCE INFORMATION
Performance Measures
This section presents selected program performance information, including, for example, GPRA goals, objectives, measures, and performance targets and data, and an assessment of the progress made toward achieving program results. Achievement of results is based on the cumulative effect of the resources provided in previous years and those requested in FY 2010 and future years, and the resources and efforts invested by those served by this program.
Under the AT Act, each State is required to establish measurable goals for access to and acquisition of AT, with timelines for meeting those goals. These goals must address the AT needs of individuals with disabilities in the State in the domains of education, employment, community living, and telecommunications and information technology (IT).
Acquisition of AT: In order to measure the increase in the acquisition of AT, the following three measures have been established for the AT State grant program. The Department is requiring States to survey individuals served under this program to determine whether those who obtained AT (for education, employment, or community living purposes) believe they would not have otherwise obtained the AT device or service.
Goal: To increase access to and acquisition of assistive technology for individuals with disabilities.
Objective: To increase acquisition of assistive technology for individuals with disabilities.
Measure: Targeted individuals and entities as defined by the AT Act obtain devices and services in the domains of (1) education, (2) employment, and (3) community living despite systemic and cost barriers.
The percent of States that met or exceeded their target percentage established for appropriate targeted individuals and entities who obtained AT for:
(1) educational purposes,
(2) employment purposes, or
(3) community living
through State financing activities or reutilization programs who would not have obtained the device or service.

REHABILITATION SERVICES AND DISABILITY RESEARCH Assistive technology
J-117
Assessment of Progress: The Department had hoped that the first year of data for these three measures related to the acquisition of AT would be available in the spring of 2008. However, the Department did not have an approved data collection instrument in place until January 2007. Data collection for the 2007 activities did not begin until February 2007. As a result, first year data cover only February 2007 through September 2007. However, States used this partial year data to set targets for 2008, and used their 2008 data to set targets for 2009. The Department plans to use the States’ 2008 performance data as the baseline for establishing national targets. The Department intends to establish targets for 2010 once it has received 2008 data from all the States.
Access to AT: In order to measure the increase in the access to AT, the Department has established the following 4 measures for the AT State grant program. The Department is requiring States to collect information from individuals served under this program regarding whether the services helped the individual to make an informed decision.
Objective: To increase access to assistive technology for individuals with disabilities. Measure: Targeted individuals and entities as defined by the AT Act have increased access to AT in the domains of (1) education, (2) employment, (3) community living, and (4) telecommunications/IT because of exposure that enables them to make informed decisions.
The percent of States that met or exceeded the target percentage established for appropriate targeted individuals and entities who accessed device demonstration and/or loan programs and made a decision about an AT device or service:
(1) for educational purposes,
(2) for employment purposes,
(3) for community living, or
(4) that meets an IT/telecommunications need.
Assessment of Progress: The Department had hoped that the first year of data for these four measures related to the access to AT would be available in the spring of 2008. However, the Department did not have an approved data collection instrument in place until January 2007. See the previous Assessment of Progress for the three measures for acquisition of AT for detailed information on when data will be available and how the Department intends to set targets.
Efficiency Measures
The efficiency measure established for the Alternative Financing program (AFP) will continue to be used to measure activities conducted as a result of this program. This measure is calculated by dividing the total amount loaned by a State by the Federal AFP grant funds awarded to that State. Data fluctuates from year to year depending on how long the program has been operating, the mechanisms States use to make alternative financing available (e.g., guaranteed loans, interest rate buy-down loans, non-guaranteed low interest loans, guaranteed and interest rate buy-down loans, and direct loans), and differences in the amount paid from the AFP permanent account to cover administrative and program costs.

REHABILITATION SERVICES AND DISABILITY RESEARCH Assistive technology
J-118
Goal: To increase availability of, funding for, access to, and provision of assistive technology devices and assistive technology services.
Objective: Reduce barriers associated with the cost of assistive technology devices and services for individuals with disabilities. Measure: Alternative Funding Program (AFP): The amount loaned per $1 million Federal investment.
Year Target Actual ($ in millions)
Cumulative $
Loaned per $1M Federal
Annual Federal
Investment
Annual Amount Loaned
Cumulative Federal
Investment
Cumulative Amount Loaned
Cumulative $ Loaned per $1M Federal
2005 0 12.05 53.25 38.69 .76 2006 .75 3.94 13.39 57.19 52.08 .96 2007 .75 2.61 14.45 59.80 66.53 1.2 2008 .95 0 59.80 2009 1 0 2010 1.25
Assessment of progress: The AFPs began to operate during the fiscal year following the fiscal year from which they received their Federal funding. Therefore, the annual Federal investment data are shown in the fiscal year following the year in which the funds were awarded. For example, the $2.61 million shown in fiscal year 2007 was appropriated in fiscal year 2006. No funds have been appropriated since fiscal year 2006.
The amount loaned per $1 million has fluctuated greatly from year-to-year, depending on the number of new programs being established, the type of program being implemented, and the availability of additional funds. Since fiscal year 2005 the amount loaned has risen as States continue to operate their programs. The Department continues to raise the target for the amount loaned per $1 million loaned and is contemplating a new efficiency measure that may look at how many States loan a certain amount per $1 million. A target of $1.25 million has been set for fiscal year 2010.

J-119
REHABILITATION SERVICES AND DISABILITY RESEARCH State Tables
Vocational Rehabilitation State Grants State or 2008 Recovery Act 2009 2010 Change from Other Area Actual Estimate Estimate Estimate 2009 Estimate Alabama 57,286,047 9,790,731 57,549,994 59,738,095 2,188,101 Alaska 9,474,966 1,800,000 9,795,073 10,157,490 362,417 Arizona 57,950,200 13,086,333 61,333,265 64,455,231 3,121,966 Arkansas 36,246,470 6,589,832 37,032,216 38,232,432 1,200,216 California 276,152,015 56,470,213 284,801,269 290,100,414 5,299,145 Colorado 36,083,923 7,307,044 37,762,655 39,946,210 2,183,555 Connecticut 20,156,212 3,334,533 20,448,222 20,994,172 545,950 Delaware 9,476,746 1,800,000 9,795,073 10,157,490 362,417 District of Columbia 12,641,236 1,879,421 12,989,280 13,344,297 355,017 Florida 156,442,912 32,158,840 158,864,413 160,629,351 1,764,938 Georgia 91,919,444 18,686,184 96,490,231 103,495,369 7,005,138 Hawaii 11,052,823 2,249,150 11,382,243 11,437,871 55,628 Idaho 15,903,623 3,299,632 16,653,504 17,306,187 652,683 Illinois 105,461,896 20,079,289 108,449,013 112,927,718 4,478,705 Indiana 66,660,094 12,335,350 68,785,415 74,033,711 5,248,296 Iowa 32,052,273 5,715,709 32,073,576 33,868,390 1,794,814 Kansas 26,929,144 5,108,753 27,795,281 29,184,106 1,388,825 Kentucky 51,743,094 9,318,274 53,469,261 56,093,089 2,623,828 Louisiana 43,077,993 9,895,321 57,943,864 57,192,474 (751,390)Maine 15,106,639 2,587,757 15,392,368 16,127,498 735,130 Maryland 39,639,603 6,879,192 39,178,766 40,346,288 1,167,522 Massachusetts 45,812,921 7,068,629 46,665,511 48,069,849 1,404,338 Michigan 97,537,485 18,126,329 99,951,580 109,179,631 9,228,051 Minnesota 43,124,084 7,737,672 44,483,884 47,212,992 2,729,108 Mississippi 41,647,036 7,214,520 42,469,871 43,508,596 1,038,725 Missouri 62,158,573 11,375,265 64,044,600 67,929,638 3,885,038 Montana 11,071,300 2,059,043 11,187,185 11,444,553 257,368 Nebraska 17,800,971 3,189,315 17,887,225 19,064,847 1,177,622 Nevada 16,280,179 4,217,502 19,022,522 19,235,319 212,797 New Hampshire 10,754,717 1,923,884 11,035,515 11,648,480 612,965 New Jersey 55,267,043 9,455,472 56,467,925 57,884,170 1,416,245 New Mexico 22,734,126 4,426,362 23,494,920 24,461,385 966,465 New York 148,275,309 25,694,844 151,237,839 149,175,745 (2,062,094)North Carolina 92,812,979 18,029,008 97,149,937 102,901,505 5,751,568 North Dakota 9,463,837 1,800,000 9,795,073 10,157,490 362,417 Ohio 118,727,629 21,589,801 123,619,686 131,447,636 7,827,950 Oklahoma 41,092,320 7,583,851 42,098,298 42,124,445 26,147 Oregon 35,382,650 7,064,114 36,596,934 39,065,944 2,469,010 Pennsylvania 123,532,053 20,925,941 124,249,697 128,869,623 4,619,926 Rhode Island 10,427,658 1,734,860 10,254,195 10,506,074 251,879 South Carolina 50,840,519 9,686,547 52,953,306 55,600,301 2,646,995 South Dakota 9,479,199 1,800,000 9,795,073 10,157,490 362,417 Tennessee 65,575,720 12,177,598 68,343,348 72,498,952 4,155,604 Texas 218,216,581 44,810,968 227,487,659 232,469,610 4,981,951 Utah 28,030,439 6,006,642 29,788,834 31,667,974 1,879,140 Vermont 9,475,824 1,800,000 9,795,073 10,157,490 362,417 Virginia 63,381,530 11,601,624 64,262,735 66,138,004 1,875,269 Washington 51,125,448 10,437,937 53,176,641 54,425,556 1,248,915 West Virginia 25,312,666 4,312,919 25,912,097 26,575,711 663,614 Wisconsin 55,648,242 10,000,997 57,088,852 60,798,676 3,709,824 Wyoming 9,058,438 1,800,000 9,795,073 10,157,490 362,417 American Samoa 928,801 204,598 1,037,429 1,081,719 44,290 Guam 2,052,208 554,268 2,992,531 3,117,358 124,827 Northern Mariana Islands 1,159,806 270,196 1,226,979 1,299,065 72,086 Puerto Rico 71,531,013 12,596,832 73,125,960 75,345,060 2,219,100 Virgin Islands 1,974,343 350,904 2,043,031 2,100,739 57,708 Freely Associated States 0 0 0 Indian set-aside 34,892,000 0 36,113,000 37,449,000 1,336,000 Undistributed (non-State allocations) 0 0 0 Total 2,874,043,000 540,000,000 2,974,635,000 3,084,696,000 110,061,000

J-120
REHABILITATION SERVICES AND DISABILITY RESEARCH
Client Assistance State Grants State or 2008 Recovery Act 2009 2010 Change from Other Area Actual Estimate Estimate Estimate 2009 Estimate Alabama 149,933 0 149,793 149,689 (104)Alaska 117,465 0 117,463 117,463 0 Arizona 201,029 0 205,171 208,714 3,543 Arkansas 117,465 0 117,463 117,463 0 California 1,188,556 0 1,183,147 1,180,217 (2,930)Colorado 154,965 0 157,356 158,601 1,245 Connecticut 117,465 0 117,463 117,463 0 Delaware 117,465 0 117,463 117,463 0 District of Columbia 117,465 0 117,463 117,463 0 Florida 589,750 0 590,752 588,504 (2,248)Georgia 305,275 0 308,942 310,999 2,057 Hawaii 117,465 0 117,463 117,463 0 Idaho 117,465 0 117,463 117,463 0 Illinois 418,336 0 416,009 414,256 (1,753)Indiana 205,828 0 205,383 204,752 (631)Iowa 117,465 0 117,463 117,463 0 Kansas 117,465 0 117,463 117,463 0 Kentucky 137,123 0 137,287 137,081 (206)Louisiana 139,786 0 138,962 141,626 2,664 Maine 117,465 0 117,463 117,463 0 Maryland 183,079 0 181,853 180,889 (964)Massachusetts 209,859 0 208,764 208,643 (121)Michigan 329,129 0 326,003 321,199 (4,804)Minnesota 168,453 0 168,236 167,621 (615)Mississippi 117,465 0 117,463 117,463 0 Missouri 190,479 0 190,271 189,815 (456)Montana 117,465 0 117,463 117,463 0 Nebraska 117,465 0 117,463 117,463 0 Nevada 117,465 0 117,463 117,463 0 New Hampshire 117,465 0 117,463 117,463 0 New Jersey 284,430 0 281,144 278,791 (2,353)New Mexico 117,465 0 117,463 117,463 0 New York 629,403 0 624,625 625,813 1,188 North Carolina 288,732 0 293,286 296,122 2,836 North Dakota 117,465 0 117,463 117,463 0 Ohio 374,195 0 371,159 368,800 (2,359)Oklahoma 117,465 0 117,463 117,463 0 Oregon 120,649 0 121,297 121,695 398 Pennsylvania 405,578 0 402,422 399,701 (2,721)Rhode Island 117,465 0 117,463 117,463 0 South Carolina 140,877 0 142,668 143,842 1,174 South Dakota 117,465 0 117,463 117,463 0 Tennessee 196,872 0 199,279 199,554 275 Texas 766,379 0 773,732 781,114 7,382 Utah 117,465 0 117,463 117,463 0 Vermont 117,465 0 117,463 117,463 0 Virginia 249,166 0 249,623 249,457 (166)Washington 208,510 0 209,369 210,289 920 West Virginia 117,465 0 117,463 117,463 0 Wisconsin 181,148 0 181,313 180,708 (605)Wyoming 117,465 0 117,463 117,463 0 American Samoa 52,860 0 52,859 52,859 0 Guam 52,860 0 52,859 52,859 0 Northern Mariana Islands 52,860 0 52,859 52,859 0 Puerto Rico 128,050 0 127,606 126,960 (646)Virgin Islands 52,860 0 52,859 52,859 0 Freely Associated States 0 0 0 0 0 Indian set-aside 0 0 0 0 0 Undistributed (non-State allocations) 0 0 0 0 0 Total 11,576,169 0 11,576,000 11,576,000 0

J-121
REHABILITATION SERVICES AND DISABILITY RESEARCH
Protection and Advocacy of Individual Rights State or 2008 Recovery Act 2009 2010 Change from Other Area Actual Estimate Estimate Estimate 2009 Estimate Alabama 206,047 0 217,281 217,132 (149)Alaska 157,505 0 166,262 166,262 0 Arizona 276,264 0 297,609 302,752 5,143 Arkansas 157,505 0 166,262 166,262 0 California 1,633,378 0 1,716,195 1,711,973 (4,222)Colorado 212,962 0 228,251 230,060 1,809 Connecticut 157,505 0 166,262 166,262 0 Delaware 157,505 0 166,262 166,262 0 District of Columbia 157,505 0 166,262 166,262 0 Florida 810,466 0 856,908 853,659 (3,249)Georgia 419,525 0 448,132 451,122 2,990 Hawaii 157,505 0 166,262 166,262 0 Idaho 157,505 0 166,262 166,262 0 Illinois 574,900 0 603,435 600,902 (2,533)Indiana 282,859 0 297,915 297,005 (910)Iowa 157,505 0 166,262 166,262 0 Kansas 157,505 0 166,262 166,262 0 Kentucky 188,441 0 199,140 198,844 (296)Louisiana 192,101 0 201,569 205,437 3,868 Maine 157,505 0 166,262 166,262 0 Maryland 251,597 0 263,785 262,390 (1,395)Massachusetts 288,400 0 302,820 302,649 (171)Michigan 452,307 0 472,879 465,918 (6,961)Minnesota 231,497 0 244,032 243,144 (888)Mississippi 157,505 0 166,262 166,262 0 Missouri 261,766 0 275,995 275,338 (657)Montana 157,505 0 166,262 166,262 0 Nebraska 157,505 0 166,262 166,262 0 Nevada 157,505 0 166,262 166,262 0 New Hampshire 157,505 0 166,262 166,262 0 New Jersey 390,879 0 407,810 404,403 (3,407)New Mexico 157,505 0 166,262 166,262 0 New York 864,959 0 906,041 907,778 1,737 North Carolina 396,791 0 425,421 429,542 4,121 North Dakota 157,505 0 166,262 166,262 0 Ohio 514,240 0 538,379 534,967 (3,412)Oklahoma 160,356 0 169,835 169,646 (189)Oregon 165,802 0 175,945 176,525 580 Pennsylvania 557,367 0 583,728 579,790 (3,938)Rhode Island 157,505 0 166,262 166,262 0 South Carolina 193,601 0 206,945 208,651 1,706 South Dakota 157,505 0 166,262 166,262 0 Tennessee 270,552 0 289,062 289,464 402 Texas 1,053,200 0 1,122,326 1,133,051 10,725 Utah 157,505 0 166,262 166,262 0 Vermont 157,505 0 166,262 166,262 0 Virginia 342,418 0 362,088 361,852 (236)Washington 286,546 0 303,697 305,036 1,339 West Virginia 157,505 0 166,262 166,262 0 Wisconsin 248,944 0 263,001 262,128 (873)Wyoming 157,505 0 166,262 166,262 0 American Samoa 78,753 0 83,131 83,131 0 Guam 78,753 0 83,131 83,131 0 Northern Mariana Islands 78,753 0 83,131 83,131 0 Puerto Rico 175,973 0 185,097 184,163 (934)Virgin Islands 78,753 0 83,131 83,131 0 Freely Associated States 0 0 0 0 0 Indian set-aside 67,555 0 71,311 71,311 0 Undistributed (non-State allocations) 291,617 0 307,818 307,818 0 Total 16,200,937 0 17,101,000 17,101,000 0
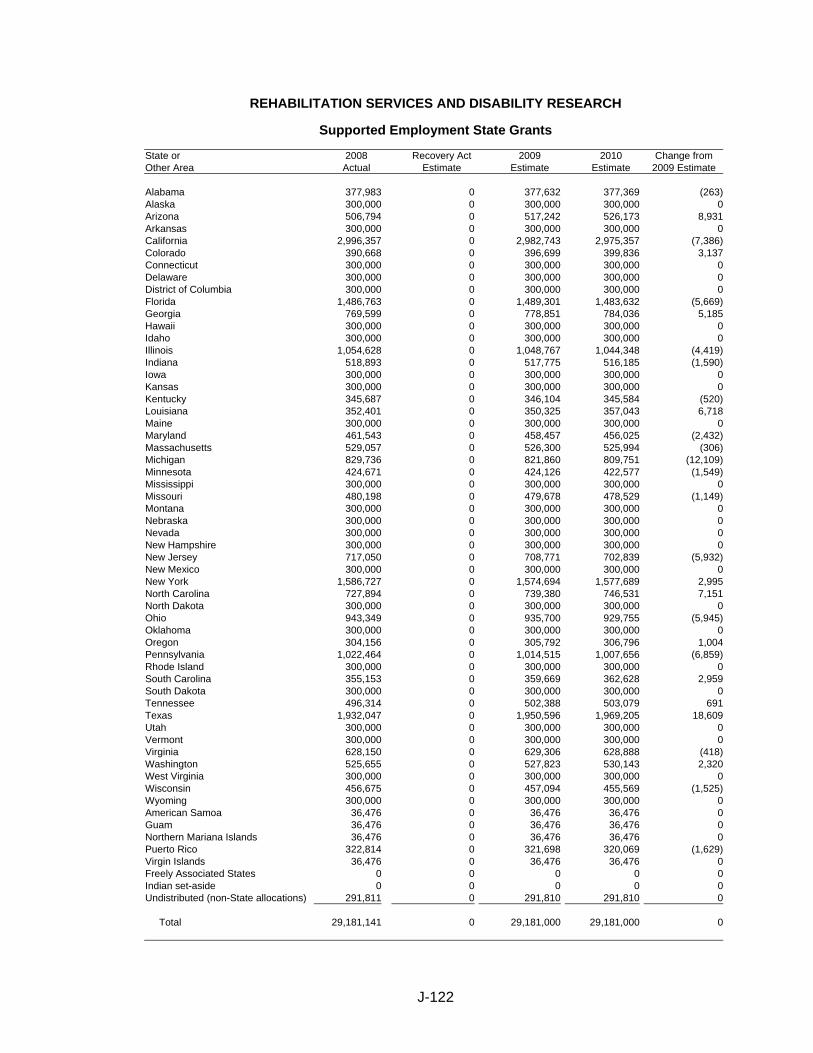
J-122
REHABILITATION SERVICES AND DISABILITY RESEARCH
Supported Employment State Grants State or 2008 Recovery Act 2009 2010 Change from Other Area Actual Estimate Estimate Estimate 2009 Estimate Alabama 377,983 0 377,632 377,369 (263)Alaska 300,000 0 300,000 300,000 0 Arizona 506,794 0 517,242 526,173 8,931 Arkansas 300,000 0 300,000 300,000 0 California 2,996,357 0 2,982,743 2,975,357 (7,386)Colorado 390,668 0 396,699 399,836 3,137 Connecticut 300,000 0 300,000 300,000 0 Delaware 300,000 0 300,000 300,000 0 District of Columbia 300,000 0 300,000 300,000 0 Florida 1,486,763 0 1,489,301 1,483,632 (5,669)Georgia 769,599 0 778,851 784,036 5,185 Hawaii 300,000 0 300,000 300,000 0 Idaho 300,000 0 300,000 300,000 0 Illinois 1,054,628 0 1,048,767 1,044,348 (4,419)Indiana 518,893 0 517,775 516,185 (1,590)Iowa 300,000 0 300,000 300,000 0 Kansas 300,000 0 300,000 300,000 0 Kentucky 345,687 0 346,104 345,584 (520)Louisiana 352,401 0 350,325 357,043 6,718 Maine 300,000 0 300,000 300,000 0 Maryland 461,543 0 458,457 456,025 (2,432)Massachusetts 529,057 0 526,300 525,994 (306)Michigan 829,736 0 821,860 809,751 (12,109)Minnesota 424,671 0 424,126 422,577 (1,549)Mississippi 300,000 0 300,000 300,000 0 Missouri 480,198 0 479,678 478,529 (1,149)Montana 300,000 0 300,000 300,000 0 Nebraska 300,000 0 300,000 300,000 0 Nevada 300,000 0 300,000 300,000 0 New Hampshire 300,000 0 300,000 300,000 0 New Jersey 717,050 0 708,771 702,839 (5,932)New Mexico 300,000 0 300,000 300,000 0 New York 1,586,727 0 1,574,694 1,577,689 2,995 North Carolina 727,894 0 739,380 746,531 7,151 North Dakota 300,000 0 300,000 300,000 0 Ohio 943,349 0 935,700 929,755 (5,945)Oklahoma 300,000 0 300,000 300,000 0 Oregon 304,156 0 305,792 306,796 1,004 Pennsylvania 1,022,464 0 1,014,515 1,007,656 (6,859)Rhode Island 300,000 0 300,000 300,000 0 South Carolina 355,153 0 359,669 362,628 2,959 South Dakota 300,000 0 300,000 300,000 0 Tennessee 496,314 0 502,388 503,079 691 Texas 1,932,047 0 1,950,596 1,969,205 18,609 Utah 300,000 0 300,000 300,000 0 Vermont 300,000 0 300,000 300,000 0 Virginia 628,150 0 629,306 628,888 (418)Washington 525,655 0 527,823 530,143 2,320 West Virginia 300,000 0 300,000 300,000 0 Wisconsin 456,675 0 457,094 455,569 (1,525)Wyoming 300,000 0 300,000 300,000 0 American Samoa 36,476 0 36,476 36,476 0 Guam 36,476 0 36,476 36,476 0 Northern Mariana Islands 36,476 0 36,476 36,476 0 Puerto Rico 322,814 0 321,698 320,069 (1,629)Virgin Islands 36,476 0 36,476 36,476 0 Freely Associated States 0 0 0 0 0 Indian set-aside 0 0 0 0 0 Undistributed (non-State allocations) 291,811 0 291,810 291,810 0 Total 29,181,141 0 29,181,000 29,181,000 0

J-123
REHABILITATION SERVICES AND DISABILITY RESEARCH
Independent Living State Grants State or 2008 Recovery Act 2009 2010 Change from Other Area Actual Estimate Estimate Estimate 2009 Estimate Alabama 296,212 242,913 312,984 312,984 0 Alaska 296,212 242,913 312,984 312,984 0 Arizona 336,132 281,463 362,653 369,110 6,457 Arkansas 296,212 242,913 312,984 312,984 0 California 1,987,334 1,623,087 2,091,286 2,087,212 (4,074)Colorado 296,212 242,913 312,984 312,984 0 Connecticut 296,212 242,913 312,984 312,984 0 Delaware 296,212 242,913 312,984 312,984 0 District of Columbia 296,212 242,913 312,984 312,984 0 Florida 986,096 810,417 1,044,192 1,040,767 (3,425)Georgia 510,437 423,820 546,075 550,001 3,926 Hawaii 296,212 242,913 312,984 312,984 0 Idaho 296,212 242,913 312,984 312,984 0 Illinois 699,482 570,697 735,321 732,610 (2,711)Indiana 344,156 281,753 363,027 362,103 (924)Iowa 296,212 242,913 312,984 312,984 0 Kansas 296,212 242,913 312,984 312,984 0 Kentucky 296,212 242,913 312,984 312,984 0 Louisiana 296,212 242,913 312,984 312,984 0 Maine 296,212 242,913 312,984 312,984 0 Maryland 306,118 249,474 321,437 319,901 (1,536)Massachusetts 350,897 286,391 369,004 368,984 (20)Michigan 550,323 447,223 576,230 568,040 (8,190)Minnesota 296,212 242,913 312,984 312,984 0 Mississippi 296,212 242,913 312,984 312,984 0 Missouri 318,492 261,022 336,316 335,688 (628)Montana 296,212 242,913 312,984 312,984 0 Nebraska 296,212 242,913 312,984 312,984 0 Nevada 296,212 242,913 312,984 312,984 0 New Hampshire 296,212 242,913 312,984 312,984 0 New Jersey 475,584 385,684 496,940 493,041 (3,899)New Mexico 296,212 242,913 312,984 312,984 0 New York 1,052,397 856,884 1,104,064 1,106,748 2,684 North Carolina 482,776 402,340 518,401 523,691 5,290 North Dakota 296,212 242,913 312,984 312,984 0 Ohio 625,676 509,170 656,046 652,222 (3,824)Oklahoma 296,212 242,913 312,984 312,984 0 Oregon 296,212 242,913 312,984 312,984 0 Pennsylvania 678,150 552,058 711,306 706,870 (4,436)Rhode Island 296,212 242,913 312,984 312,984 0 South Carolina 296,212 242,913 312,984 312,984 0 South Dakota 296,212 242,913 312,984 312,984 0 Tennessee 329,181 273,379 352,239 352,910 671 Texas 1,281,431 1,061,436 1,367,620 1,381,397 13,777 Utah 296,212 242,913 312,984 312,984 0 Vermont 296,212 242,913 312,984 312,984 0 Virginia 416,621 342,443 441,225 441,164 (61)Washington 348,641 287,220 370,072 371,895 1,823 West Virginia 296,212 242,913 312,984 312,984 0 Wisconsin 302,890 248,731 320,482 319,582 (900)Wyoming 296,212 242,913 312,984 312,984 0 American Samoa 27,464 22,523 29,019 29,019 0 Guam 27,464 22,523 29,019 29,019 0 Northern Mariana Islands 27,464 22,523 29,019 29,019 0 Puerto Rico 296,212 242,913 312,984 312,984 0 Virgin Islands 27,464 22,523 29,019 29,019 0 Freely Associated States 0 0 0 0 0 Indian set-aside 0 0 0 0 0 Undistributed(non-State allocations) 221,934 182,000 234,500 234,500 0 Total 22,193,388 18,200,000 23,450,000 23,450,000 0

J-124
REHABILITATION SERVICES AND DISABILITY RESEARCH
Services for Older Blind Individuals State or 2008 Recovery Act 2009 2010 Change from Other Area Actual Estimate Estimate Estimate 2009 Estimate Alabama 487,465 565,407 515,817 515,817 0 Alaska 225,000 3,170 225,000 225,000 0 Arizona 606,661 722,405 659,045 659,045 0 Arkansas 304,391 353,503 322,498 322,498 0 California 3,168,533 3,707,078 3,381,946 3,381,946 0 Colorado 416,511 497,578 453,938 453,938 0 Connecticut 371,497 427,951 390,416 390,416 0 Delaware 225,000 3,170 225,000 225,000 0 District of Columbia 225,000 3,170 225,000 225,000 0 Florida 2,186,358 2,549,536 2,325,927 2,325,927 0 Georgia 795,702 940,207 857,745 857,745 0 Hawaii 225,000 87,883 225,000 225,000 0 Idaho 225,000 89,539 225,000 225,000 0 Illinois 1,218,955 1,411,724 1,287,907 1,287,907 0 Indiana 625,545 728,054 664,200 664,200 0 Iowa 326,277 378,516 345,318 345,318 0 Kansas 276,413 321,368 293,182 293,182 0 Kentucky 435,278 508,466 463,871 463,871 0 Louisiana 421,441 483,554 441,144 441,144 0 Maine 225,000 119,998 225,000 225,000 0 Maryland 542,771 629,924 574,677 574,677 0 Massachusetts 672,267 778,450 710,176 710,176 0 Michigan 1,019,899 1,187,077 1,082,963 1,082,963 0 Minnesota 500,881 586,345 534,918 534,918 0 Mississippi 288,038 331,382 302,317 302,317 0 Missouri 609,053 707,956 645,864 645,864 0 Montana 225,000 13,781 225,000 225,000 0 Nebraska 225,000 173,530 225,000 225,000 0 Nevada 237,150 280,405 255,811 255,811 0 New Hampshire 225,000 80,095 225,000 225,000 0 New Jersey 891,375 1,026,700 936,652 936,652 0 New Mexico 225,000 213,300 225,000 225,000 0 New York 1,985,566 2,297,730 2,096,207 2,096,207 0 North Carolina 883,496 1,042,363 950,942 950,942 0North Dakota 225,000 3,170 225,000 225,000 0 Ohio 1,202,152 1,392,958 1,270,787 1,270,787 0 Oklahoma 370,451 430,314 392,572 392,572 0 Oregon 393,727 463,792 423,115 423,115 0 Pennsylvania 1,419,592 1,637,247 1,493,651 1,493,651 0 Rhode Island 225,000 23,999 225,000 225,000 0 South Carolina 455,243 538,106 490,911 490,911 0 South Dakota 225,000 3,170 225,000 225,000 0 Tennessee 626,567 738,619 673,838 673,838 0 Texas 1,938,805 2,281,461 2,081,364 2,081,364 0 Utah 225,000 194,306 225,000 225,000 0 Vermont 225,000 3,170 225,000 225,000 0 Virginia 741,565 866,036 790,079 790,079 0 Washington 623,223 736,414 671,827 671,827 0 West Virginia 225,000 252,612 230,457 230,457 0 Wisconsin 569,010 667,231 608,711 608,711 0 Wyoming 225,000 3,170 225,000 225,000 0 American Samoa 40,000 0 40,000 40,000 0 Guam 40,000 0 40,000 40,000 0 Northern Mariana Islands 40,000 0 40,000 40,000 0 Puerto Rico 400,263 469,910 428,697 428,697 0 Virgin Islands 40,000 0 40,000 40,000 0 Freely Associated States 0 0 0 0 0 Indian set-aside 0 0 0 0 0 Undistributed (non-State allocations) 323,203 343,000 341,510 341,510 0 Total 32,320,324 34,300,000 34,151,000 34,151,000 0
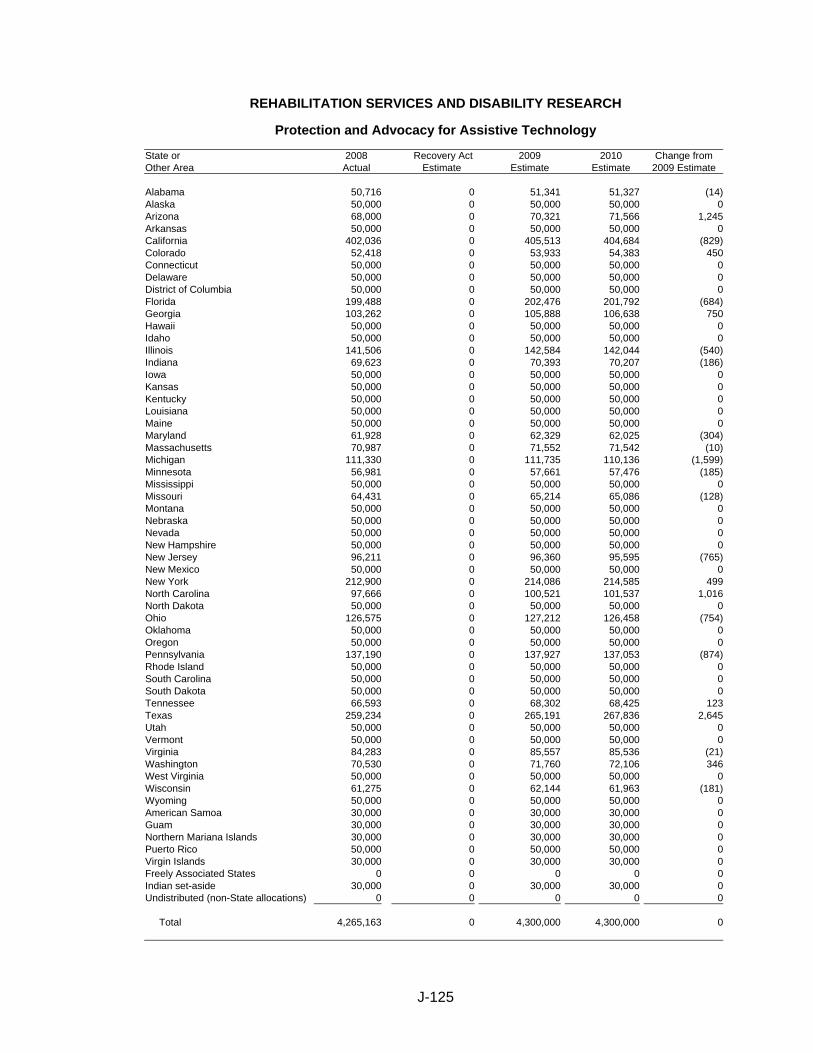
J-125
REHABILITATION SERVICES AND DISABILITY RESEARCH
Protection and Advocacy for Assistive Technology State or 2008 Recovery Act 2009 2010 Change from Other Area Actual Estimate Estimate Estimate 2009 Estimate Alabama 50,716 0 51,341 51,327 (14)Alaska 50,000 0 50,000 50,000 0 Arizona 68,000 0 70,321 71,566 1,245 Arkansas 50,000 0 50,000 50,000 0 California 402,036 0 405,513 404,684 (829)Colorado 52,418 0 53,933 54,383 450 Connecticut 50,000 0 50,000 50,000 0 Delaware 50,000 0 50,000 50,000 0 District of Columbia 50,000 0 50,000 50,000 0 Florida 199,488 0 202,476 201,792 (684)Georgia 103,262 0 105,888 106,638 750 Hawaii 50,000 0 50,000 50,000 0 Idaho 50,000 0 50,000 50,000 0 Illinois 141,506 0 142,584 142,044 (540)Indiana 69,623 0 70,393 70,207 (186)Iowa 50,000 0 50,000 50,000 0 Kansas 50,000 0 50,000 50,000 0 Kentucky 50,000 0 50,000 50,000 0 Louisiana 50,000 0 50,000 50,000 0 Maine 50,000 0 50,000 50,000 0 Maryland 61,928 0 62,329 62,025 (304)Massachusetts 70,987 0 71,552 71,542 (10)Michigan 111,330 0 111,735 110,136 (1,599)Minnesota 56,981 0 57,661 57,476 (185)Mississippi 50,000 0 50,000 50,000 0 Missouri 64,431 0 65,214 65,086 (128)Montana 50,000 0 50,000 50,000 0 Nebraska 50,000 0 50,000 50,000 0 Nevada 50,000 0 50,000 50,000 0 New Hampshire 50,000 0 50,000 50,000 0 New Jersey 96,211 0 96,360 95,595 (765)New Mexico 50,000 0 50,000 50,000 0 New York 212,900 0 214,086 214,585 499 North Carolina 97,666 0 100,521 101,537 1,016 North Dakota 50,000 0 50,000 50,000 0 Ohio 126,575 0 127,212 126,458 (754)Oklahoma 50,000 0 50,000 50,000 0 Oregon 50,000 0 50,000 50,000 0 Pennsylvania 137,190 0 137,927 137,053 (874)Rhode Island 50,000 0 50,000 50,000 0 South Carolina 50,000 0 50,000 50,000 0 South Dakota 50,000 0 50,000 50,000 0 Tennessee 66,593 0 68,302 68,425 123 Texas 259,234 0 265,191 267,836 2,645 Utah 50,000 0 50,000 50,000 0 Vermont 50,000 0 50,000 50,000 0 Virginia 84,283 0 85,557 85,536 (21)Washington 70,530 0 71,760 72,106 346 West Virginia 50,000 0 50,000 50,000 0 Wisconsin 61,275 0 62,144 61,963 (181)Wyoming 50,000 0 50,000 50,000 0 American Samoa 30,000 0 30,000 30,000 0 Guam 30,000 0 30,000 30,000 0 Northern Mariana Islands 30,000 0 30,000 30,000 0 Puerto Rico 50,000 0 50,000 50,000 0 Virgin Islands 30,000 0 30,000 30,000 0 Freely Associated States 0 0 0 0 0 Indian set-aside 30,000 0 30,000 30,000 0 Undistributed (non-State allocations) 0 0 0 0 0 Total 4,265,163 0 4,300,000 4,300,000 0

J-126
REHABILITATION SERVICES AND DISABILITY RESEARCH
Assistive Technology State Grants Program State or 2008 Recovery Act 2009 2010 Change from Other Area Actual Estimate Estimate Estimate 2009 Estimate Alabama 417,263 0 435,098 435,072 (26)Alaska 410,706 0 421,927 421,903 (24)Arizona 574,719 0 596,401 597,366 965 Arkansas 446,659 0 461,503 461,484 (19)California 958,270 0 1,029,231 1,028,449 (782)Colorado 435,072 0 453,859 454,199 340 Connecticut 380,107 0 395,863 395,608 (255)Delaware 394,121 0 405,625 405,637 12 District of Columbia 352,337 0 363,353 363,343 (10)Florida 619,620 0 660,868 660,265 (603)Georgia 551,385 0 578,414 578,976 562 Hawaii 426,769 0 438,868 438,821 (47)Idaho 399,824 0 412,529 412,637 108 Illinois 559,069 0 590,409 589,938 (471)Indiana 440,632 0 461,321 461,152 (169)Iowa 420,597 0 435,564 435,482 (82)Kansas 381,837 0 396,498 396,531 33 Kentucky 440,421 0 457,666 457,612 (54)Louisiana 466,467 0 483,583 484,308 725 Maine 440,653 0 452,792 452,693 (99)Maryland 462,058 0 481,339 481,080 (259)Massachusetts 480,872 0 501,596 501,565 (31)Michigan 618,462 0 644,899 643,598 (1,301)Minnesota 456,540 0 475,327 475,163 (164)Mississippi 366,595 0 381,465 381,434 (31)Missouri 520,942 0 540,889 540,768 (121)Montana 423,062 0 434,733 434,750 17 Nebraska 432,272 0 445,241 445,194 (47)Nevada 389,373 0 404,101 404,224 123 New Hampshire 408,409 0 420,584 420,491 (93)New Jersey 446,885 0 470,931 470,295 (636)New Mexico 420,203 0 433,559 433,547 (12)New York 636,668 0 678,429 678,759 330 North Carolina 501,884 0 528,285 529,058 773 North Dakota 350,491 0 361,571 361,542 (29)Ohio 519,199 0 548,028 547,392 (636)Oklahoma 402,574 0 418,809 418,775 (34)Oregon 395,643 0 412,154 412,264 110 Pennsylvania 643,017 0 673,462 672,727 (735)Rhode Island 349,256 0 360,928 360,793 (135)South Carolina 485,736 0 503,620 503,940 320 South Dakota 399,032 0 410,445 410,458 13 Tennessee 410,024 0 431,016 431,093 77 Texas 781,010 0 833,260 835,274 2,014 Utah 428,597 0 443,637 444,247 610 Vermont 387,559 0 398,563 398,519 (44)Virginia 458,505 0 481,715 481,673 (42)Washington 444,887 0 466,070 466,322 252 West Virginia 400,417 0 413,357 413,252 (105)Wisconsin 436,665 0 456,223 456,060 (163)Wyoming 343,327 0 354,243 354,292 49 American Samoa 125,000 0 125,000 125,000 0 Guam 125,000 0 125,000 125,000 0 Northern Mariana Islands 125,000 0 125,000 125,000 0 Puerto Rico 403,545 0 420,149 419,975 (174)Virgin Islands 125,000 0 125,000 125,000 0 Freely Associated States 0 0 0 0 0 Indian set-aside 0 0 0 0 0 Undistributed (non-State allocations) 0 0 0 0 0 Total 24,620,237 0 25,660,000 25,660,000 0