Embed Size (px)
Citation preview
HAL Id: tel-00998383https://tel.archives-ouvertes.fr/tel-00998383
Submitted on 23 Jun 2014
HAL is a multi-disciplinary open accessarchive for the deposit and dissemination of sci-entific research documents, whether they are pub-lished or not. The documents may come fromteaching and research institutions in France orabroad, or from public or private research centers.
L’archive ouverte pluridisciplinaire HAL, estdestinée au dépôt et à la diffusion de documentsscientifiques de niveau recherche, publiés ou non,émanant des établissements d’enseignement et derecherche français ou étrangers, des laboratoirespublics ou privés.
Regulation of mitochondrial ATPase by its inhibitorprotein IF1 in Saccharomyces cerevisiae
Qian Wu
To cite this version:Qian Wu. Regulation of mitochondrial ATPase by its inhibitor protein IF1 in Saccharomyces cere-visiae. Agricultural sciences. Université Paris Sud - Paris XI, 2013. English. �NNT : 2013PA11T097�.�tel-00998383�
UNIVERSITE PARIS-SUD
FACULTÉ DE MÉDECINE PARIS-SUD
ÉCOLE DOCTORALE 419
SIGNALISATIONS ET RÉSEAUX INTÉGRATIFS EN BIOLOGIE
Laboratoire de Protéines Membranaires UMR 8221 CNRS/CEA Saclay
DISCIPLINE
Biochimie et biologie moléculaire
THÈSE DE DOCTORAT THÈSE DE DOCTORAT SUR TRAVAUX
soutenue le 12/12/2013
par
Qian WU
Regulation of mitochondrial ATP synthase
by its endogenous inhibitor IF1 in Saccharomyces cerevisiae
Directeur de thèse : Francis HARAUX Composition du jury : Président du jury : Marc LE MAIRE Rapporteurs : Bruno MIROUX Daniel BRÈTHES Examinateurs : Laura BACIOU Francis HARAUX

1

2
Acknowledgement Time flies! A blink, I am already at the end of my PhD study. It has been a very pleasant three years, during which I learnt so much about science and life, as well as my French, English and some fake Italian. This thesis would have remained a dream had it not been for Francis Haraux, my Director of thesis, my friend, guide and philosopher. Thank you so much, Francis, for being patient, encouraging and supporting; for all the scientific discussions, all the experiments we did together and things I learnt from you; for teaching me the most proper French; for your sense of humor and your art; for sharing the happy moments around delicious food and drinks; for all the personal help (especially important for a foreign student!); for all the …… (I need ten more pages.) It is with immense gratitude that I acknowledge the support and help of our team, Dr. Claire Lemaire, Mehdi Lembrouk, Margaux Renvoisé, as well as Gwenaëlle Moal. Well, Dr. Tiona Andrianaivomananjaona needs a whole line for her name! Thank you, Tiona for all the valuable help throughout the whole practical work! Thank you, my lovely colleagues for all the team meeting, discussion and lunchtime! I wish to thank our collaborator Dr. Emmanuel Tetaud, with whose professional skills and advise we could complete our work and eventually write an article. I would like to express my thanks of gratitude to my thesis committee: Dr. Bruno Miroux, who is as well my “rapporteur extérieur” during my thesis; Dr. Daniel Brèthes, who comes all the way from Bordeaux; Dr. Laura Baciou from Orsay; and Pr. Marc le Maire as the president of the committee. I am lucky to have this group of great scientists spending their valuable time and energy to review my thesis and coming to my defense. Thank you very much! I am indebted to Pr. Marc le Maire who offered me the opportunity to work in our institution iBiTec‐S. As the Director of master, he helped me with patience and encouragement; as the Director of URA2096, he and Dr. Ahmed Zahraoui offered me the internship in our institution in CEA saclay. In iBiTec‐S/SB2SM, it is with immense gratitude that I acknowledge the great support and help of Bruno Robert, the Director of SB2SM/UMR8221; Jean‐Marc Grognet, the Director of iBiTec‐S; Maïté Paternostre, the vise Director of iBiTec‐S.
It gives with me great pleasure in acknowledging the support of my colleagues and friends in SB2SM, whom I spent pleasant three years. Thanks Ghada, Violaine and Dominique, I learnt a lot from you! Thanks Anja, Sun for the lunchtime that I improved my English and for your warm help for my thesis! Thanks Hervé, without your spectro I could not have good yeast! Thanks Alain, for inviting me to your pots! Thanks Winfried for sharing cigarette breaks! Thanks my dear friends Amin, Benjamin, Cedric, Christian, Denis, Denise, Eduardo, Eiri, Kathleen, Liz, Manolis, Michał, Raj, Sana, Stéphanie, as well as my dearest physicists Cinthya, Marta, Adam and Niraj. Thank you for your support and all the happy time together! Those very close friends inside and outside of CEA who I didn’t write your names here are all in my heart!!! I am so lucky that I have many great friends here, which makes me feel like home. Finally, I would say that my thesis is dedicated to my parents who have given me the opportunity of an education from the best institutions and support throughout my life. I cannot find words to express my love!

3

4
Table of contents
Abbreviations ............................................................................................................ 9
1. Introduction ...................................................................................................... 18
1.1. Mitochondrion ............................................................................................... 18
1.1.1. History and diseases ................................................................................. 18
1.1.2. Main structure and function .................................................................... 20
a) Outer mitochondrial membrane ........................................................... 22
b) Intermembrane space .......................................................................... 22
c) Inner mitochondrial membrane ........................................................... 23
d) Matrix ................................................................................................... 23
1.1.3. Electron transport chain ........................................................................... 24
a) Complex I or NADH dehydrogenase ..................................................... 24
b) Complex II or succinate dehydrogenase ............................................... 25
c) Complex III or complex bc1 ................................................................... 25
d) Complex IV or cytochrome c oxidase .................................................... 26
e) Coupling with ATP production via ATP synthase, complex V ................ 26
1.2. ATP synthase .................................................................................................. 27
1.2.1. Classification of different types of ATPases ............................................. 27
1.2.2. Structures of FoF1 ATP synthase .............................................................. 29
1.2.2.1. Fo sector ............................................................................................ 31
1.2.2.2. F1 sector ............................................................................................ 34
1.2.2.3. FoF1 complex ...................................................................................... 36
1.2.2.4. Supramolecular organization of FoF1‐ATP synthase .......................... 38
1.2.3. FoF1 ATP synthase: A molecular rotary motor ......................................... 38
1.2.3.1. Visualization of the rotation .............................................................. 38
1.2.3.2. Rotor and stator ................................................................................ 42
1.2.3.3. Proton translocation ......................................................................... 42
1.2.4. Forward the mechanism of ATP synthase ................................................ 44

5
1.2.4.1. Binding change mechanism .............................................................. 45
1.2.4.2. Catalytic sites occupancy: Uni‐site catalysis and multi‐sites catalysis
……………………………………………………………………………………………………………………….47
1.2.4.3. non‐catalytic sites ............................................................................. 48
1.2.5. Regulation of ATP synthase ...................................................................... 49
1.3. Endogenous inhibitor of ATPase, IF1 .............................................................. 50
1.3.1. Structures of IF1: bovine vs yeast ............................................................. 50
1.3.2. Mechanism of IF1 inhibition ..................................................................... 53
1.3.2.1. Uni‐directional inhibitory mechanism ............................................... 53
1.3.2.2. Mitochondrial‐specific ATPase inhibition .......................................... 54
1.3.2.3. Other inhibitory system for bacterial and chloroplast ATPases ........ 55
1.4. Thesis statement ............................................................................................ 57
2. Materials and Methods ..................................................................................... 60
2.1. Materials ........................................................................................................ 60
2.1.1. Yeast and bacteria strains ........................................................................ 60
2.1.2. Cell culture media ..................................................................................... 61
2.1.3. Plasmid vectors and protein modification ................................................ 63
2.1.4. Oligonucleotide primers ........................................................................... 64
2.2. Methods ......................................................................................................... 67
2.2.1. Mutagenesis ............................................................................................. 67
2.2.1.1. Site‐directed mutagenesis principle .................................................. 67
2.2.1.2. Bacteria and Yeast cells transformations .......................................... 69
2.2.1.3. DNA extraction and quantification .................................................... 70
2.2.2. Production of yeast mitochondria (WT & mutants) ................................. 71
2.2.3. Production of yeast IF1 ............................................................................. 72
2.2.4. Kinetic measurement ............................................................................... 73
3. Results and Discussions ..................................................................................... 78

6
3.1. Analyses of published X‐ray crystallographic structures of F1‐ATPase ........... 78
3.1.1. Bos taurus F1‐ATPase crystal structures, with or without IF1 .................. 78
3.1.2. Saccharomyces cerevisiae F1‐ATPase crystal structures, with or without
IF1............................................................................................................................82
3.1.3. Sequence alignment on α and β subunits of mitochondrial and non‐
mitochondrial ATP synthases .................................................................................. 87
3.1.4. Kinetic parameters ................................................................................... 90
3.1.5. SMP centrifugation ................................................................................... 93
3.2. Specificity of mitochondrial ATPase inhibition by IF1 .................................... 99
3.2.1. Original study of IF1 specificity ................................................................. 99
3.2.2. Effect of mutations in α and β subunit: investigation of IF1 specificity . 104
3.2.3. Discussion ............................................................................................... 106
3.3. IF1‐F1‐ATPase interaction process in Saccharomyces cerevisiae: Grasping and
locking of inhibitor IF1 by yF1‐ATPase? ..................................................................... 107
3.3.1. Previous studies lead the pathway to study IF1 binding process ........... 107
3.3.2. Group A and B: γ‐remote residues from αDP, βDP ................................ 107
3.3.2.1. Effect of mutations in group A (α‐E357D‐Y399F‐R400A‐V402L‐
Q418N)…………………………………………………………………………………………………………108
3.3.2.2. Effect of mutations in group B (β‐T380R‐S383E, E471K‐A474E and
T380R‐S383E‐E471K‐A474E) ............................................................................. 111
3.3.2.3. Discussion ........................................................................................ 114
3.3.3. Group C and D: γ‐neighbouring residues from αDP, βDP ....................... 115
3.3.3.1. Effect of mutations in Group C: ....................................................... 117
3.3.3.2. Effect of mutations in Group D ....................................................... 124
3.3.3.3. Combination of crucial mutations α409GS‐ ‐ ‐AST416 and
β394DGLSEQD400 ................................................................................................ 126
3.3.3.4. Residues in γ subunit interacting with Group C .............................. 128

7
3.3.3.5. Discussion ........................................................................................ 129
4. Conclusion ...................................................................................................... 136
5. Perspectives .................................................................................................... 140
6. References ...................................................................................................... 146
Appendix .............................................................................................................. 160

8
List of figures
Figure 1. Ultra‐fine‐structure of mitochondria revealed by HRSEM .............................. 21
Figure 2. Model of mitochondrial components. ............................................................. 22
Figure 3. Representation of S. cerevisiae mitochondrial electron transport chain. ....... 24
Figure 4. Electron microscopic images of ATP synthase from various organisms. ......... 29
Figure 5. Simplified representation of yeast FoF1 ATP synthase structure ..................... 30
Figure 6. Models of FoF1 ATP synthases representing Saccharomyces cerevisiae
mitochondrial ATP synthase and Escherichia coli ATP synthase .................................... 32
Figure 7. 3D structure of E. coli subunit c monomer determined by NMR, and
representation of E. coli subunits a‐c12. ......................................................................... 34
Figure 8. Structure of F1‐ATPase from Saccharomyces cerevisiae. ................................ 35
Figure 9. X‐ray crystal structures of yeast and bovine F1c10‐ATP synthase. ................... 37
Figure 10. Observation of dimeric yeast mitochondrial ATP synthase by electron
microscopy ..................................................................................................................... 38
Figure 11. First direct observation of the γ subunit rotation in the α3β3γ subcomplex . 39
Figure 12. Observation of the c subunit rotation in F1‐ATPase of E. coli. ....................... 39
Figure 13. Observation of Bacillus PS3 F1‐ATPase stepwise rotation ............................. 40
Figure 14. Simultaneous observation system of Bacillus PS3 F1‐ATPase rotation and ATP
binding ........................................................................................................................... 41
Figure 15. Models for the generation of rotation by proton transport through the Fo
domain of bacterial ATP synthase. ................................................................................. 43
Figure 16. Model of ATP synthase rotary catalysis annotated according to Boyer’s
classic model .................................................................................................................. 46
Figure 17. Stereo view of the 2.2 Å crystal structure of bovine IF1 ............................... 51
Figure 18. Protein sequence alignment of bovine and yeast IF1. .................................. 52
Figure 19. Stereo view of the 2.5 Å crystal structure of yeast IF1 from the inhibited IF1‐
MF1 complex. ................................................................................................................. 53
Figure 20. Representation of IF1 inhibition of mitochondrial ATPase. .......................... 54
Figure 21. Representation of ε subunits regulation of bacterial ATPase. ...................... 55
Figure 22. Overview of site‐directed mutagenesis principle. ......................................... 68
9
Figure 23. Overview of bacteria transformations. ......................................................... 69
Figure 24. Principle of IF1 overexpression in E. coli BL21(DE3) ...................................... 72
Figure 25. ATP regeneration system using pyruvate kinase and lactate dehydrogenase
....................................................................................................................................... 73
Figure 26. Spectrophotometric recording of ATP hydrolysis and IF1 inhibition in real
time kinetics. .................................................................................................................. 74
Figure 27. Bovine mitochondrial F1‐ATPase, IF1‐free or IF1‐bound. .............................. 80
Figure 28. Zoom of IF1 binding region in bovine mitochondrial F1‐ATPase. .................. 81
Figure 29. Yeast mitochondrial F1‐ATPase, IF1‐free or IF1‐bound. ................................ 84
Figure 30. Zoom of IF1 binding region in yeast mitochondrial F1‐ATPase. .................... 85
Figure 31. Sequence alignment on α subunit of mitochondrial and non‐mitochondrial
ATP synthases. ............................................................................................................... 88
Figure 32. Sequence alignment on β subunit of mitochondrial and non‐mitochondrial
ATP synthase. ................................................................................................................. 89
Figure 33. Experimental determination of IF1 binding parameters to SMP WT. ........... 91
Figure 34. Experimental determination of IF1 binding parameters to MF1 WT, and SMP
WT. ................................................................................................................................. 92
Figure 35a. Experimental determination of kon value comparing SMP WT and
α409GS‐ ‐ ‐AST416 with or without centrifugation ............................................................ 95
Figure 35b. Experimental determination of Kd value comparing SMP WT and
α409GS‐ ‐ ‐AST416 with or without centrifugation ............................................................ 95
Figure 35c. Experimental determination of koff value comparing SMP WT and
α409GS‐ ‐ ‐AST416 with or without centrifugation ............................................................ 95
Figure 36. Yeast IF1 inhibiting ATP hydrolysis of purified F1‐ATPases from different
organisms. .................................................................................................................... 100
Figure 37. Bovine and yeast crystal structures showing the selected residues in F1‐
ATPase β subunit for IF1 specificity study. ................................................................... 102
Figure 38. Yeast crystal structures showing the selected residues in F1‐ATPase α
subunit for IF1 specificity study. .................................................................................. 103
Figure 39. IF1 inhibition of wild type and mutant SMP from yeast. ............................. 105

10
Figure 40. Experimental data of mutants in group A and determination of IF1 binding
parameters. .................................................................................................................. 109
Figure 41. Experimental data of mutants in group B and determination of IF1 binding
parameters ................................................................................................................... 112
Figure 42. Interaction between βDP‐E471, A474 and IF1 midpart in bovine IF1‐F1‐
ATPase. ......................................................................................................................... 115
Figure 43. Zoom of residues in Group C and D in bovine mitochondrial F1‐ATPase. ... 116
Figure 44a. Group C: rate constant of inhibition (kapp) as a function of IF1
concentration. .............................................................................................................. 119
Figure 44b. Group C: normalized ATPase activity at equilibrium as a function of IF1
concentration ............................................................................................................... 119
Figure 44c. Group C: normalized ATPase activity at equilibrium as a function of 1/kapp
..................................................................................................................................... 119
Figure 45. Kinetic constants of IF1 binding and release after mutagenesis of Group C
residues. ....................................................................................................................... 123
Figure 46. Experimental data of mutants in group D and determination of IF1 binding
parameters. .................................................................................................................. 125
Figure 47. Kinetics of ATP hydrolysis and IF1 inhibitions of yeast wild type and the
“double mutant” SMP. ................................................................................................. 127
Figure 48. Interaction between αDP409GSDLDAST416 and its neighbouring residues. .. 131
Figure 49. Interaction between β‐DELSEQD and its neighbouring residues. ............... 132
Figure 50. Representation of IF1 binding‐locking process in yeast mitochondrial
ATPase. ......................................................................................................................... 137

11

12
List of tables
Table 1. Nomenclature of subunits from FoF1 ATP synthase in bacterial, chloroplast and
mitochondrial ATP synthases. ........................................................................................ 31
Table 2. Identified covalent and non‐covalent inhibitors of mitochondrial F1‐ATPase .. 50
Table 3. Description of Saccharomyces cerevisiae strains. ............................................ 60
Table 4. Description of Escherichia coli strains .............................................................. 61
Table 5. Description of cell culture media. ..................................................................... 62
Table 6. Description of amino acids, bases and antibiotics. ........................................... 62
Table 7. Description of plasmid vectors. ........................................................................ 64
Table 8. Description of mutations and their oligonucleotide primers. .......................... 65
Table 9. Description of oligonucleotide primers for sequencing. .................................. 66
Table 10. Yeast (S. cerevisiae W303‐1A ∆ATP1∆ATP2) transformation Selections. ....... 70
Table 11. Residues in β subunit selected for IF1 specificity study. .............................. 101
Table 12. Residues in α subunit selected for IF1 specificity study. .............................. 104
Table 13. IF1 binding parameters of ATP synthase with mutants of group A. ............. 110
Table 14. IF1 binding parameters of ATP synthase with mutants of group A. ............. 111
Table 15. IF1 binding parameters of ATP synthase with mutants of group B. ............. 113
Table 16. IF1 binding parameters of ATP synthase with mutants of group B, at pH 8. 113
Table 17. IF1 binding parameters of ATP synthase with mutants of Group C. ............. 122
Table 18. IF1 binding parameters of ATP synthase with mutants of Group D. ............ 126
Table 19. IF1 binding parameters of “double mutant”, α409GS‐ ‐ ‐AST416 and
β394DGLSEQD400. ........................................................................................................... 127
Table 20. IF1 binding parameters of mutants in γ subunit. ......................................... 129

13

14
Abbreviations
3D
ADP
ATP
AMP-PNP
ANT
BCA
bIF1
CCCP
CoQ
dam
DCCD
DNA
DTT
EM
ER
FCCP
FRET
GFP
G418
HRSEM
IPTG
LB
LDH
MES
mtDNA
NADH
Ni-NTA
OSCP
PAGE
PCR
Three-dimensional
Adenosine diphosphate
Adenosine-5'-triphosphate
5’-adenylyl-β-γ-imidodiphosphate
Adenine nucleotide translocator
Bicinchoninic acid
Bovine IF1
Carbonyl cyanide m-chlorophenyl hydrazone
Coenzyme Q
DNA adenine methylase
N,N'-Dicyclohexylcarbodiimide
Deoxyribonucleic acid
Dithiothreitol
Electron microscopy
Endoplasmic reticulum
Carbonyl cyanide-4-(trifluoromethoxy)phenylhydrazone
Fluorescence resonance energy transfer
Green fluorescent protein
Geneticin
High-resolution scanning electron microscopy
Isopropyl β-D-1-thiogalactopyranoside
Luria Broth
Lactate dehydrogenase
2-(N-morpholino)ethanesulfonic acid
Mitochondrial deoxyribonucleic acid
Reduced nicotinamide adenine dinucleotide
Nickel-nitrilotriacetic acid
Oligomycin sensitivity-conferring protein
Poly-acrylamide gel electrophoresis
Polymerase chain reaction

15
pdb
PGK
PK
pmf
RNA
ROS
SDS
SMP
TIM
Tris
UCP
yIF1
Protein data bank
Phosphoglycerate kinase
Pyruvate kinase
Protomotive force
Ribonucleic acid
Reactive oxygen species
Sodium dodecyl sulfate
Submitochondrial particles
Transporter inner membrane
Tris(hydroxymethyl)aminomethane
Uncoupling protein
Yeast IF1

16
Chapter 1. Introduction

17

18
1. Introduction
1.1. Mitochondria
Mitochondria are organelles found in most eukaryotic cells (all plants, animals,
fungi and protists) (Henze & Martin, 2003). This compartment, which has a double‐
membrane‐enclosed structure, together with the nucleus is the distinguishing
characteristics of eukaryotic cells and is not found in prokaryotic cells. Mitochondria
are considered to be the double‐membrane‐bounded powerhouses of eukaryotic cells,
because they generate most of the supply of adenosine triphosphate (ATP) used as a
source of chemical energy for the cells. The prokaryote‐to‐eukaryote transition is still
unclear with many different theories on the go. In addition to supplying cellular
energy, mitochondria are involved in other functions such as signalling, cellular
differentiation, cell death, as well as the control of the cell cycle and cell growth. They
are also implicated in several human diseases including mitochondrial disorders
(Burnett et al, 2005) and cardiac dysfunction (Lesnefsky et al, 2001) and may play a
role in the aging process.
Mitochondria are semi‐autonomous in the sense that they are partially
dependent on the cell to replicate and grow. They have their own DNA, ribosomes and
can make their own proteins. Similar to bacteria, mitochondria have circular DNA (mt
DNA) and replicate by a reproductive process called fission. A typical animal cell will
have on the order of 1000 to 2000 mitochondria. So the cell will have a lot of materials
that are capable of producing a high amount of available energy. This ATP production
by the mitochondria is coupled to the process of respiration, which occurs in the
mitochondrial inner membrane with an electron transporting chain.
1.1.1. History and diseases
The first observations of intracellular structures probably representing
mitochondria date to the 1840s (e.g. Henle, 1841; Aubert, 1852; Kkolliker, 1856;

19
Butschli, 1871; Flemming, 1882; Kolliker, 1888; Retzius, 1890). In 1894, Richard
Altmann established them as “elementary organisms” living inside cells and carrying
out vital functions and called them “bioblasts”. His idea of symbiotic origin of
mitochondria was accepted several decades later, based on similarities between
mitochondria and bacteria. The term mitochondrion was introduced in 1898 by Carl
Benda. It originates from the Greek “mitos” (thread) and “chondros” (granule),
referring to the appearance of these structures during spermatogenesis. The
observations of mitochondria developed with time and electromicroscopy technology.
Bonjamin F. Kingsbury, in 1912, first related mitochondria with cell respiration but
almost exclusively based on morphological observations. It was not until 1925 when
David Keilin discovered cytochromes that the respiratory chain was described. In the
middle of 20th century, the observations of mitochondria were revolutionary on
structure and metabolism. The first high‐resolution micrographs appeared in 1952.
This led to a more detailed analysis of the structure of the mitochondria. The popular
term “powerhouse of the cell” was defined by Philip Siekevitz in 1957. In 1967 it was
discovered that mitochondria contained ribosomes. The year after, methods were
developed for mapping the mitochondrial genes, with the genetic and physical map of
yeast mitochondria being completed in 1976.
There are two hypotheses about the origin of mitochondria: endosymbiotic and
autogenous. The endosymbiotic hypothesis suggests mitochondria were originally
prokaryotic cells that were capable of implementing oxidative mechanisms, of which
eukaryotic cells were not capable. The autogenous hypothesis suggests mitochondria
were born by splitting off a portion of DNA from the nucleus of the eukaryotic cell at
the time of divergence with the prokaryotes. Since mitochondria share many common
features with bacteria, the endosymbiosis theory is more popular at present.
Mitochondria are found in every cell of the human body except red blood cells.
They are implicated in several human diseases. Mitochondrial diseases result from
failures of the mitochondria, damage and subsequent dysfunction in mitochondria,
which influence the cell metabolism. Diseases caused by mutation in the mtDNA
include Keams‐Sayre syndrome (Butler & Gadoth, 1976), MELAS syndrome

20
(Mitochondrial encephalomyopathy, lactic acidosis, and stroke‐like episodes) (Pavlakis
et al, 1984), Pearson’s syndrome (Baerlocher et al, 1992), progressive external
ophthalmoplegia, MERRF (myoclonic epilepsy with ragged red fibers) (Wu et al, 2010)
and Leber’s hereditary optic neuropathy (Hadavi et al, 2013). In most case, these
diseases are transmitted by a female to her children, as the zygote derives its
mitochondria and hence its mtDNA from the ovum. The disease primarily affects
children, but adult onset is becoming more and more common. In addition, a number
of mitochondrial dysfunctions of genetic origin are implicated in a range of age‐related
diseases, including tumours. Mutations in the mitochondria‐encoded subunits of ATP
synthase cause OXPHOS disease (Kovarova et al, 2012; Shoffner, 1999). ATP synthase
has also been found on the surface of cancer cells, whereas the enzyme was thought
to be localized mainly to mitochondria. More recent work on mitochondrial ATPase
regulator IF1 (description in paragraph 1.3) revealed that in tumor cells IF1
overexpression inhibits the oxidative phosphorylation causing membrane
hyperpolarization and favoring the aerobic glycolysis by ROS‐mediated activation of
NFkB which results in cell proliferation. It suggested that IF1 would inhibit both ATP
synthesis and hydrolysis depending on the mass action ratio. (Formentini et al, 2012;
Sanchez‐Cenizo et al, 2010). Conversely, it has been proposed that in the hypoxic
conditions of cancer cells, IF1 is involved in protecting tumor cells from excess ROS
production and ROS‐mediated apoptosis (Faccenda & Campanella, 2012).
1.1.2. Main structure and function
Mitochondria vary widely in shape, such as rod‐like or granular; and in size
ranging from 0.5 to 1.0 µm in diameter. The first high‐resolution micrographs
appeared in 1952 revealed by Palade (Palade, 1952). In the following years, different
models have been established. Figure 1 shows an observation of mitochondria from
rat pancreas exocrine cells using High‐resolution scanning electron microscopy
(Perkins & Frey, 2000). This ultra‐fine‐structure of mitochondria was published in 2000
by Perkins and Frey, from which we could clearly distinguish the outer and inner

21
mitochondrial membrane, as well as cristae, and maybe also the ATP synthase. A
model of mitochondria is shown in figure 2. Details of their components will be
developped as follows.
Figure 1. Ultra‐fine‐structure of mitochondria revealed by HRSEM (High‐Resolution Scanning Electron
Microscopy) (Perkins & Frey, 2000).
Mitochondria from rat pancreas exocrine cells are shown in the figure. 1) Fracture plane revealing the
surface (left) and interior structure (right) of mitochondria (M). Labeled features are outer mitochondrial
membrane (OM), inner mitochondrial membrane (IM), cristae (C), tubular cristae (tC), rough endoplasmic
reticulum (rER), ribosome (r). 2) View emphasizing the intermembrane space separating the outer and
inner membranes (arrowheads) and “elemental particles” (arrows), which may be the ATP synthases.

22
Figure 2. Model of mitochondrial components.
This model originated with Palade in 1952 and was reproduced by Perkins and Fray, 2000. This figure
shows the representation of the mitochondria that has been prominent until recently.
a) Outer mitochondrial membrane
The outer membrane of mitochondria encloses the entire organelle. It is around
6 and 7 nm thick and barely selective to ions or other small molecules. This membrane
has a protein‐to‐phospholipid ratio close to 4:6 which is similar to that of the
eukaryotic plasma membrane. It contains large numbers of integral proteins such as
porins and translocases allowing molecules of different sizes to pass from one side to
the other.
b) Intermembrane space
The intermembrane space is the space between outer membrane and inner
membrane of a mitochondrion. It is also known as perimitochondrial space. In the
intermembrane space, the concentration of small molecules such as ions and sugars is
the same as in cytosol because of the outer membrane permeability. However, large

23
size proteins have specific signalling sequences to be transported across the outer
membrane to the intermembrane space, e.g. cytochrome c (Chipuk et al, 2006).
c) Inner mitochondrial membrane
The inner membrane of mitochondria is very rich in protein. It contains around
1/5 of the total protein in a mitochondrion. It is also very selective to most of
molecules. Almost all ions and molecules require special membrane transporters to
enter or exit the matrix. Proteins are ferried into the matrix via the translocase of the
inner membrane (TIM) complex or via Oxa1 (Herrmann & Neupert, 2000). Besides, the
inner membrane has a particularly high level of one phospholipid, cardiolipin, which is
important to stabilize the respiratory chain supercomplexes (Eble et al, 1990; Pfeiffer
et al, 2003; Zhang et al, 2005). The respiratory chain, or electron transport chain, is
located in the inner membrane containing four protein complexes. It forms a
membrane potential, which is used to produce ATP. Most of the ATP in a cell is
produced in the inner membrane by the enzyme ATP synthase, which is also known as
complex V forming the oxidative phosphorylation (OXPHOS) chain. This membrane
also contains the ATP/ADP transporter, phosphate transporter that insure the
production of ATP.
d) Matrix
The matrix is the space enclosed by the inner membrane. It contains about 2/3 of
the total protein in a mitochondrion as well as a few mitochondrial genetic materials
and the machinery to manufacture the mitochondrial proteins. There are several
important metabolic processes occurring in the matrix, such as the oxidation of
pyruvate and fatty acids, the citric acid cycle, vitamins biosynthesis, and hormone
steroids biosynthesis etc. It is also implicated in the calcium and ROS signaling. In
addition, it participates in the cell aging and apoptosis.

24
1.1.3. Electron transport chain
The electron transport chain locates in the inner mitochondrial membrane. It
consists of a series of protein complexes cooperating to generate redox reactions,
which couples electron transfer between an electron donor and an electron acceptor
(such as NADH and O2) to the transfer of protons H+ across the membrane, establishing
an electrochemical proton gradient. The proton gradient is used by the enzyme ATP
synthase to store energy as ATP (adenosine triphosphate). Figure 3 shows the
mitochondrial electron transport chain in Saccharomyces cerevisiae.
Figure 3. Representation of S. cerevisiae mitochondrial electron transport chain (Rigoulet et al, 2010).
a) Complex I or NADH dehydrogenase
Complex I is the first enzyme of the respiratory chain, which contains a soluble
and transmembrane part. The protein structure in Thermus thermophiles was solved in
2010 (Efremov et al, 2010). This complex couples electron transfer between NADH and
quinone to proton translocation. Two electrons are removed from NADH and
transferred to ubiquinone (Q). The reduced product ubiquinol (QH2) freely diffuses
within the membrane, and complex I translocates n protons (n, the number of
translocated protons) across the membrane, thus producing a proton gradient.
NADH + H+ + Q + n H+matrix NAD+ + QH2 + n H
+intermembrane
Succinate Dehydrogenase
Complex II
Cytochrome bc1
Complex III
Cytochrome c oxydase
Complex IV

25
In yeast mitochondria, the complex I is replaced by two NADH dehydrogenases
located in inner membrane facing matrix (Ndip) or facing intermembrane space
(Nde1p and Nde2p). They lack the transmembrane part, thus in yeast mitochondria
the reduction of NADH does not induce proton translocation.
b) Complex II or succinate dehydrogenase
Complex II refers succinate dehydrogenase, which is bound to the inner
membrane facing matrix. It is the only enzyme that participates in both the citric acid
cycle and the electron transport chain (Oyedotun & Lemire, 2004). It catalyzes the
oxidation of succinate to fumarate with the reduction of ubiquinone to ubiquinol. The
succinate binding site and ubiquinione binding site are connected by a chain of redox
centers including FAD and the Fe‐S cluster.
c) Complex III or complex bc1
Complex III is also called cytochrome bc1 complex. It is a mutisubunit
transmembrane protein encoded by both mitochondrial (cytochrome b) and the
nuclear genomes (all other subunits) (Gao et al, 2003). Three subunits have prosthetic
groups. The cytochrome b subunit has two b‐type hemes (bL and bH), the cytochrome c
subunit has one c‐type heme (c1), and the Rieske Iron Sulfur Protein subunit (ISP) has a
two iron, two sulfur iron‐sulfur cluster (2Fe‐2S). This complex catalyzes the reduction
of cytochrome c by oxidation of coenzyme Q (ubiquinone) and the concomitant
translocation of four protons from the mitochondrial matrix to the intermembrane
space.
QH2 + 2 cyt c (Fe3+) + 2 H+
matrix Q + 2 cyt c (Fe2+) + 4 H+intermembrane
In the Q cycle process, two protons are consumed from the matrix, four protons
are released into the intermembrane space, and two electrons are passed to
cytochrome c (Kramer et al, 2004). As a result a proton gradient is formed across the
membrane.

26
d) Complex IV or cytochrome c oxidase
The complex IV or cytochrome c oxidase is a large transmembrane protein
complex found in bacteria and the mitochondrion (Iwata et al, 1995; Tsukihara et al,
1996). This is the last enzyme in the respiratory chain of mitochondria. It receives an
electron from each of four cytochrome c molecules, and transfers them to one oxygen
molecule, converting molecular oxygen to two molecules of water. In the process, it
translocates four protons across the membrane, helping to establish a transmembrane
proton gradient that is subsequently used by ATP synthase to synthesize ATP.
4 cyt c (Fe2+) + O2 + 8 H+matrix 4 cyt c (Fe3+) + 2 H2O + 4 H
+intermembrane
e) Coupling with ATP production via ATP synthase (complex V of OXPHOS chain)
The electron transport chain and ATP synthesis are coupled by the proton
gradient across the inner membrane. The chemiosmotic hypothesis was first proposed
in 1961 by Peter D. Mitchell. The protons move back across the inner membrane
through the enzyme ATP synthase (also called complex V). The flow of protons back
into the matrix of the mitochondria via ATP synthase provides energy for adenosine
disphosphate (ADP) to combine with inorganic phosphate to form ATP. The term
proton motive force (pmf) was created from the electrochemical gradient to describe
the energy that is generated by the transfer of protons or electrons across an energy
transducing membrane. The equation of the electrochemical proton gradient can be
simplified to:
ΔµH+ = FΔψ - 2,3 RT ΔpH
ΔG = ΔG ’+ 2.3 RT log[ATP]
~
where the F is Faraday constant (96,485 C mol‐1); R is the molar gas constant
(8.314 J mol‐1K‐1), T is the temperature in Kelvins, and Δψ is the transmembrane
electrical potential difference in volts.

27
1.2. ATP synthase
ATP synthase is an essential enzyme in all kinds of cells, no matter prokaryote or
eukaryote, plants or animals. It catalyzes ATP synthesis from ADP and inorganic
phosphate driven by a flux of protons across the membrane down the proton gradient
generated by electron transport chain. ATP is the most commonly used energy form of
cells from most organisms in order to achieve most of cellular functions. ATP synthase
is a large protein complex sitting in the inner membrane of mitochondria with a
membrane embedded section Fo and a soluble section F1‐ATPase facing the matrix. So
it is called FoF1 ATP synthase. When neither respiratory chain nor photosynthetic
proteins can generate the pmf, ATP synthase works as a proton pump at the expense
of ATP hydrolysis. The overall reaction is as following, where the n represents the
number of protons pumped through ATP synthase. This number varies from different
organismes (see paragraph 1.2.3.3 proton translocation).
ADP3‐ + HPO42‐ + H+ + n H+
intermembrane ATP4‐ + H2O + n H+matrix
However, in most cases ATP hydrolysis activity is a potential danger to a living
cell, so ATP synthase has several regulatory mechanisms to prevent futile ATP wasting,
such as the IF1 inhibition.
1.2.1. Classification of different types of ATPases
There are different types of ATPases found in different organisms. According to
their functions, structures, localisations as well as ions that they transport, they are
classified into different types.
F‐ATPase is also known as FoF1 ATP synthase, which is found in bacterial plasma
membranes, in mitochondrial inner membranes, and in chloroplast thylakoid
membranes. Its major function is to use the proton gradient to drive ATP synthesis by
allowing the protons flux across the membrane down their electrochemical gradient.

28
The produced energy is then used to support cell functions. The Fo domain is integral in
the membrane to insure the proton transport across the membrane, whereas the F1
domain is peripheral and contains the enzyme catalytic sites. FoF1 ATP synthase of
Saccharomyces cerevisiae is the central subject of our study. Its structure, function and
catalytic mechanism will be described in following paragraphs.
V‐ATPase is called vacuolar‐type H+‐ATPase, which is one of the most
fundamental enzymes found in almost every eukaryotic cell. V‐ATPase functions as
ATP‐dependent proton pump. It couples the energy of ATP hydrolysis to proton
transport across intracellular and plasma membranes of eukaryotic cells. It plays a
variety of roles for the function of many organelles (Nelson et al, 2000).
A‐ATPase is called AoA1 ATPase. It is found exclusively in Archaea and has a
similar function to F‐ATPase. But structurally, it is closer to V‐ATPase. This type of
ATPases may have arisen as an adaptation to the different cellular needs and the more
extreme environmental conditions faced by Archaeal species (Bickel‐Sandkötter et al,
1998).
P‐ATPase is also known as E1‐E2 ATPase. They are found in bacteria and in a
number of eukaryotic plasma membranes and organelles. And they function to
transport a variety of different compounds, including many ions and phospholipids,
across a membrane using ATP hydrolysis for energy. There are many different classes
of P‐ATPases, each of which transports a specific type of ion (Axelsen & Palmgren,
1998). In addition, they all appear to interconvert between at least two different
conformations, denoted by E1 and E2. During their ion transport cycle, P‐ATPases form
phosphorylated intermediate state, which is the distinction from other classes of
ATPases (Bublitz et al, 2011).
E‐ATPase is a type of membrane‐bound cell surface enzymes. E stands for
“Extracellular”. These ATPases are found in most eukaryotic cells and hydrolyse
nucleotide tri‐ and/or diphosphates in the presence of Ca2+ or Mg2+ (Plesner, 1995).
And they play important roles in many biological processes.
F‐, V‐ and A‐ATPases are multi‐subunit complexes with a similar architecture,
which is one membrane embedded part and one soluble catalytic part. And they
29
possibly use the rotary motors to achieve catalytic mechanism and ions transport.
Details will be described in FoF1 ATP synthase structures. The P‐ATPases are quite
distinct in their subunit composition and in the ions they transport, and they do not
appear to use a rotary motor.
1.2.2. Structures of FoF1 ATP synthase
In order to better understand the catalytic mechanism of this large protein
complex ATP synthase, it is necessary to start with its structure. The common global
structure shared by various ATP synthases is composed of two linked complexes: the
soluble catalytic core F1 ATPase complex and the membrane‐embedded proton
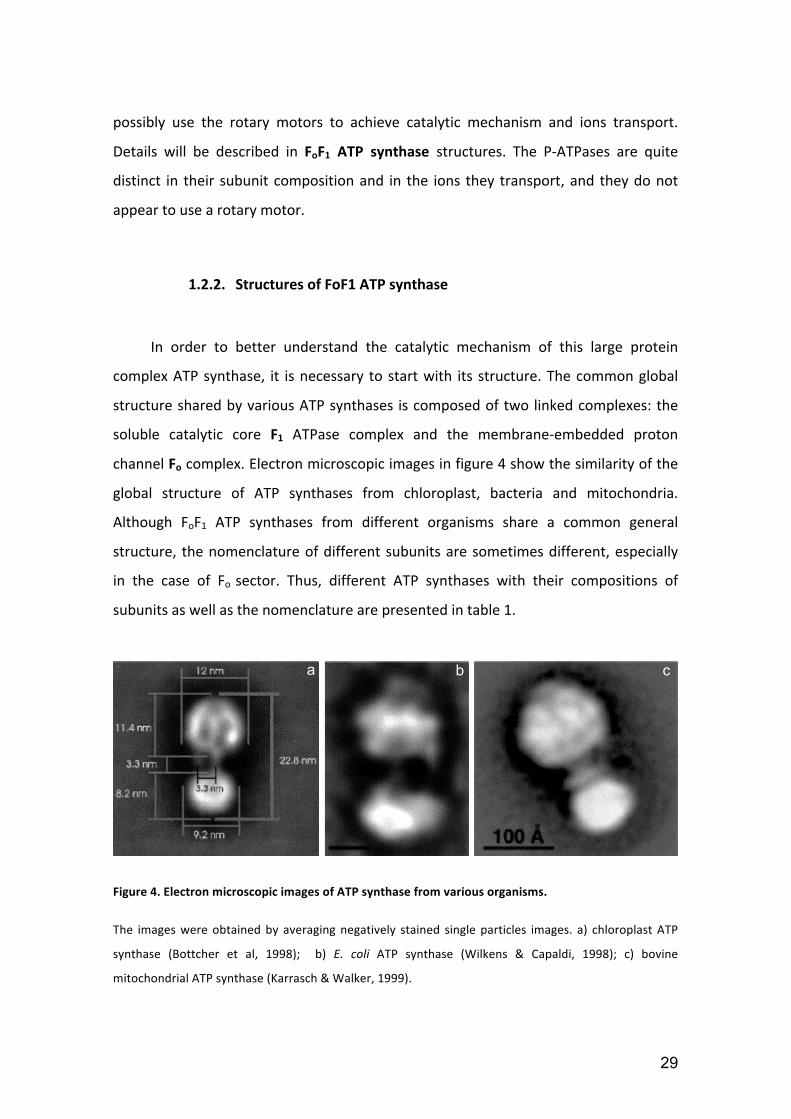
channel Fo complex. Electron microscopic images in figure 4 show the similarity of the
global structure of ATP synthases from chloroplast, bacteria and mitochondria.
Although FoF1 ATP synthases from different organisms share a common general
structure, the nomenclature of different subunits are sometimes different, especially
in the case of Fo sector. Thus, different ATP synthases with their compositions of
subunits as well as the nomenclature are presented in table 1.
a b c
Figure 4. Electron microscopic images of ATP synthase from various organisms.
The images were obtained by averaging negatively stained single particles images. a) chloroplast ATP
synthase (Bottcher et al, 1998); b) E. coli ATP synthase (Wilkens & Capaldi, 1998); c) bovine
mitochondrial ATP synthase (Karrasch & Walker, 1999).

30
Figure 5. Simplified representation of yeast FoF1 ATP synthase structure (according to the thesis of
Vincent Corvest, 2006).
Figure 5 is a simplified image representing yeast FoF1 ATP synthase architecture,
with its Fo and F1 sectors coloured in pink and blue respectively. In addition, since the
enzyme functions with a rotary mechanism, we could also distinguish the mobile part
as the rotor (hatched part in figure 5), and the fixed part as the stator (figure 5). It will
be described later in the following paragraphs.

31
Table 1. Nomenclature of subunits from FoF1 ATP synthase in bacterial, chloroplast and mitochondrial
ATP synthases.
The name and the stoichiometry of each subunit are indicated in this table. The composition of both
subcomplex Fo and F1 are as well indicated. In addition, proteins associated to Fo sector and proteins
function as ATP synthase regulators are listed.
1.2.2.1. Fo sector
Fo sector is the membrane‐embedded FoF1 ATP synthase subcomplex, which is
also well studied but less visualized comparing to the F1 sector. As we can see in table

32
1, this Fo sector consists of eight subunits (OSCP, 4, d, h, 9, 6, 8 and f, nomenclature of
yeast) in mitochondrial ATP synthases. In the case of yeast, there are four other
subunits associated to Fo, e, g, k and i; in the case of bovine, the associated proteins
are e and g. For bacteria and chloroplast, the Fo sector simply has subunits a, b and c,
which are equivalent of mitochondrial 6, 4 and 9.
a b
Figure 6. Models of FoF1 ATP synthases representing Saccharomyces cerevisiae mitochondrial ATP
synthase and Escherichia coli ATP synthase.
Panel a, topological model of Saccharomyces cerevisiae mitochondrial ATP synthase Fo sector, with
partially reconstructed protein structure (Stock et al, 1999) (thesis of Rémy Fronzes, 2004). Panel b, the
bacterial ATP synthase is illustrated as the simplest version of ATP synthases (Yoshida et al, 2001).
OSCP is the short form of Oligomycin Sensitivity Conferring Protein in
mitochondrial ATP synthase, which is called δ subunit for bacterial and chloroplast ATP
synthases. It appears to be part of the peripheral stalk that holds the F1 subcomplex
α3β3 catalytic core stationary against the torque of the rotating central stalk.
Subunit 4 links the F1 subcomplex to Fo membranous part via the OSCP and
related membranous proteins. Similar with OSCP, subunit 4 also stabilize the α3β3
catalytic core against the rotation.

33
Subunit 6 (analogue of subunit a in E. coli) cooperates with subunit 9 to form the
proton translocation pathway through the four indispensable residues Glu196, Arg210,
Glu219 and His245 (numbering in E. coli, also shown in figure 7) that form the two half‐
channels. In the basic structure of E. coli, it is proposed that this subunit consists of five
or six transmembrane segments (Jager et al, 1998; Long et al, 1998; Vik et al, 2000).
Subunit 9 (analogue of subunit c in bacteria, chloroplast and bovine) functions as
the membranous rotor of ATP synthase. Ten subunits 9 (the stoichiometry varies from
8 to 15 among different organisms) (Dimroth et al, 2006; Meier et al, 2006; Meier et al,
2007; Pogoryelov et al, 2007; Toei et al, 2007; Watt et al, 2010) form an oligomeric ring
that makes up the Fo rotor (Jiang et al, 2001; Stock et al, 1999). The earlier NMR study
of bacterial single copy subunit c showed a stoichiometry of twelve (Rastogi & Girvin,
1999) (see figure 7). Later on, the size of bacterial c‐ring was suggested to be ten
(Ballhausen et al, 2009; Fillingame & Dmitriev, 2002; Fillingame et al, 2000). The flux of
protons through the proton translocation channels drives the rotation of the c ring,
which in turn is coupled to the rotation of the F1 subcomplex γ subunit rotor due to the
permanent binding between the γ and ε subunits of F1 and the c ring of Fo. The residue
Asp61 in E.coli (figure 7) (glutamate for other organisms) is essentially implicated in the
proton translocation (described in paragraph 1.2.3.3 proton translocation).

34
Figure 7. 3D structure of E. coli subunit c monomer determined by NMR, and representation of E. coli
subunits a‐c12.
Panel A, side view of protonated subunit c monomer, at pH5 (pdb file, 1c0v) (Girvin et al, 1998). Panel B,
side view of deprotonated subunit c monomer, at pH8 (pdb file, 1c99) (Rastogi & Girvin, 1999). Panel C,
representation of duodenary oligomer of subunit c (green) with subunit a (orange) (pdb file, 1c17) (Rastogi
& Girvin, 1999).
Subunit 8 is essential for the Fo subcomplex assembly (Devenish et al, 2000;
Marzuki et al, 1989). But its function is not yet very clear.
Subunit d is important for the ATP synthase function. It is a hydrophilic protein,
and associated to subunits 4, h and OSCP (Norais et al, 1991).
Subunit f is required for the assembly of subunits 6, 8 and 9. (Spannagel et al,
1997).
1.2.2.2. F1 sector
F1 sector is the soluble part of the ATP synthase, which contains the catalytic
core of the enzyme. This subcomplex has been well studied in various organisms. F1
sector of ATP synthase could generate ATP synthesis as well as ATP hydrolysis when it
is attached to Fo part, whereas the isolated F1 could only hydrolyze ATP. So it is also
called F1‐ATPase. For instance, FoF1‐ATP synthase catalyzes ATP synthesis from ADP

35
and inorganic phosphate through its F1 sector en presence of the proton gradient
across the membrane generated by electron transport chain. When the membrane
could not generate the proton gradient or the F1‐ATPase becomes soluble detached
from the Fo part, F1‐ATPase would function in the direction of ATP hydrolysis. Many
studies have been done to determine the structure of F1‐ATPase, such as bacterial F1‐
ATPase from E. coli (Cingolani & Duncan, 2011; Hausrath et al, 1999; Rodgers & Wilce,
2000), chloroplast F1‐ATPase from spinach (Groth & Pohl, 2001), and mitochondrial F1‐
ATPase from beef heart (Abrahams et al, 1994), rat liver (Bianchet et al, 1998), and
also from yeast S. cerevisiae (Kabaleeswaran et al, 2006; Kabaleeswaran et al, 2009).
The common structure of F1‐ATPase shared by many organisms contains five subunits,
α, β, γ, δ and ε, with the stoichiometry of 3, 3, 1, 1 and 1 respectively (Walker et al,
1985) (see table 1 and figure 8).
a
ε
δ
γ
βα
b
Figure 8. Structure of F1‐ATPase from Saccharomyces cerevisiae.
Panel a, globle view of X‐ray crystal structure F1‐ATPase from Saccharomyces cerevisiae. Panel b,
separated presentation of α, β, γ, δ and ε subunits (Kabaleeswaran et al, 2006). The presented α and β
subunits correspond to αDP and βDP. Images created using PyMol software, with pdb file 2hld.

36
α and β subunits form the catalytic core of the F1 subcomplex with three copies
of each. There is a substrate‐binding site on each of the αβ interface, which is the
binding site in each αβ catalytic interface and αβ non‐catalytic interface. The α3β3
complex forms a cylinder that surrounds the central stalk. The three pairs of α/β
subunits undergo a sequence of conformational changes leading to ATP synthesis (or
hydrolysis), which are induced by the rotation of γ subunit.
γ subunit forms the central shaft that connects the Fo rotary motor to the F1
catalytic core. It sequentially deforms the α3β3 catalytic core by a rotary activity
transmitted from the membrane‐embedded rotor of subunit 9. Its two terminal
extremities are inserted into the catalytic core, and its midpart forms the “foot of
gamma” (name frequently used in this work, referring residues around 80‐180 in
yeast).
δ subunit contributes to the assembly of the protein rotor by the connection of γ
subunit and subunit 9 (Watts et al, 1995). But the mitochondrial δ subunit does not
play a role during enzyme catalytic activity. It is analogue of bacterial or chloroplast ε
subunit.
ε subunit only exists in mitochondrial ATP synthases. It is observed that yeast
depleted of this subunit could not grow in fermentative medium (Guelin et al, 1993).
Other experiments demonstrated the essential role of subunit ε in the assembly of F1
and the incorporation of hydrophobic subunit c into the F1‐c oligomer rotor structure
of mitochondrial ATP synthase in higher eukaryotes (Havlickova et al, 2010).
1.2.2.3. FoF1 complex
Using single particle electron cryomicroscopy, the complete view of bovine
(Baker et al, 2012; Rubinstein et al, 2003) and yeast (Lau et al, 2008) FoF1 ATP synthase
has been observed. None of the entire protein complex structure has been resolved
either by X‐ray crystallography or by NMR. Nevertheless, the protein assembly of F1
sector into the membrane‐embeded c ring has been studied. The first crystal structure

37
model of yeast F1c10‐ATP synthase was resolved at 3.9 Å. The visualization of the c ring
and its close contact with γ and δ subunits suggested that they might rotate as an
ensemble during catalysis (Stock et al, 1999). Then the yeast F1c10‐ATP synthase was
revealed by the recent work of at 3.43 Å, which was the first model of MgADP‐
inhibited state of the yeast enzyme (Dautant et al, 2010). Compared to bovine enzyme
that has eight copies of c subunit (Watt et al, 2010), the yeast central stalk was twisted
(see figure 9). Besides, isolated partial peripheral stalk has also been resolved (Dickson
et al, 2006). To date, the structure of the membranous subunit a (or subunit 6) as well
as the entire complex still remain unclear, which requires more research.
a b
Figure 9. X‐ray crystal structures of yeast and bovine F1c10‐ATP synthase.
Panel a, structure of yeast F1c10‐ATP synthase (Dautant et al, 2010); Panel b, structure of bovine F1c8‐ATP
synthase (Watt et al, 2010).

38
1.2.2.4. Supramolecular organization of FoF1‐ATP synthase
For many organisms including yeast, plant and mammals, mitochondrial ATP
synthase has been shown to adopt oligomeric structures (Arnold et al, 1998; Eubel et
al, 2003; Krause et al, 2005). In yeast mitochondria, it has been demonstrated that ATP
synthase subunits e and g are involved in the dimerization and oligomerization (Arnold
et al, 1998; Paumard et al, 2002; Thomas et al, 2008). This oligomerization of ATP
synthase has been suggested to determine the arrangement of mitochondrial cristae
(Arselin et al, 2004; Paumard et al, 2002), which is the basis of mitochondrial
mophology. An exemple of yeast dimeric ATP synthase observation using electron
microscopy is shown in figure 10. Althrough the oligomerization of ATP synthase is
shown to play an important role in the network of cristae during mitochondrial
biogenesis, no evidence has been shown that the ATP synthase oligomerization has
any effect on the enzyme functions.
Figure 10. Observation of dimeric yeast mitochondrial ATP synthase by electron microscopy (Thomas et
al, 2008).
Averaged images represent six classes in which dimers exhibit various angle between two monomers.
1.2.3. FoF1 ATP synthase: A molecular rotary motor
1.2.3.1. Visualization of the rotation
The first direct visualization of Bacillus PS3 F1 rotation driven by ATP was
obtained sixteen years ago (Noji et al, 1997). In that experiment, bacterial subcomplex
α3β3γ was immobilized on a glass surface covered by Ni‐NTA via the N‐terminal

39
extremity of its β‐subunits. The γ subunit was biotinylated to bind streptavindin and a
fluorescently labeled actin filament, which rotated uni‐directionally, counterclockwise
(view from membrane side) after ATP addition (figure 11).
Figure 11. First direct observation of the γ subunit rotation in the α3β3γ subcomplex (Noji et al, 1997).
The rotary motor model was confirmed in 1999 by another observation of c
subunit (equivalent to subunit 9 in Sccahromyces cerevisiae) of FoF1 ATP synthase
rotation (Sambongi et al, 1999). In this model (figure 12), Escherichia coli FoF1 was
immobilized on a coverslip through a His‐tag linked to the N‐terminus of each α
subunit. A c subunit glutamine was replaced by cysteine and then biotinylated to bind
streptavindin and a fluorescently labeled actin filament. After the addition of MgATP,
the actin filament that was connected to the c subunits rotated.
Figure 12. Observation of the c subunit rotation in F1‐ATPase of E. coli (Sambongi et al, 1999).

40
Later on, several similar experiments were carried out to show the rotation of
ATP synthase more precisely, such as different steps of rotation by 120° (Yasuda et al,
1998), which corresponds to the sequential ATP hydrolysis by the three β subunits. In
order to detect the stepwise rotation, a smaller marker, a colloidal gold bead of 40 nm
diameter was used to replace actin (Yasuda et al, 2001). PS3 subcomplex α3β3γ was
immobilized and its γ subunit was attached by the gold bead (figure 13). It was shown
that one 120° rotation step consisted of roughly 90° and 30° substeps, which were
suggested to be related to ATP binding and hydrolysis product (ADP, phosphate, or
both) release respectively.
Figure 13. Observation of Bacillus PS3 F1‐ATPase stepwise rotation (Yasuda et al, 2001).
More recently, the observation of the rotation was performed with a more
sophisticated technique that visualized rotation by attaching a bead duplex to the γ
shaft and simultaneously detected binding of a fluorescent ATP analog to a particular
site through angle‐resolved fluorescence imaging (Nishizaka et al, 2004) (figure 14).
This work showed that the 120° rotary step were more likely subdivided into an 80°
and a 40° substeps. In particular, this 80° substep was linked to the binding of one ATP
molecule to one empty site, triggering the ATP hydrolysis and/or the phosphate
release but not ADP release.

41
Figure 14. Simultaneous observation system of Bacillus PS3 F1‐ATPase rotation and ATP binding
(Nishizaka et al, 2004).
Simultaneous‐observation system (not to scale). Single turnovers of ATP hydrolysis on catalytic sites in
F1‐ATPase are visualized with fluorescently labeled ATP (Cy3‐ATP), which is excited by an evanescent
wave under total internal reflection fluorescence microscopy. Cy3‐ATP appears as a stable fluorescent
spot when it binds to a surface‐immobilized F1 molecule and the spot disappears when ADP is released,
whereas unbound Cy3‐ATP is virtually invisible because of its rapid Brownian motion. Rotation of a bead
duplex attached to the γ shaft is simultaneously observed under bright‐field illumination at a
wavelength different from the emission of Cy3‐ATP.
Stepwise γ rotation has also been proved by single‐molecule FRET (fluorescence
resonance energy transfer). In the study of Diez and co‐workers, the double‐labeled E.
coli FoF1 ATP synthase was incorporated into liposomes. And it was demonstrated that
γ subunit rotated during ATP synthesis powered by proton transport, showing three
distinct distances to b subunits in repeating sequences (Diez et al, 2004). More
recently, a splendid work using high‐speed atomic force microscopy revealed rotary
catalysis of rotorless F1‐ATPase. In this work, isolated α3β3 stator ring was shown to
cyclically propagate conformational states in the counterclockwise direction, similar to
rotary shaft rotation in F1‐ATPase. It suggested the cooperative interplay between
subunits in hexameric ATPases (Uchihashi et al, 2011).
All those studies as well as some other brilliant work demonstrated the rotary
mechanism of FoF1 ATP synthase in precising the substeps of the rotation and the
relative sequence of substrate binding, ATP hydrolysis and product release. In the
following paragraph, I am going to introduce the rotor and stator of ATP synthase.

42
1.2.3.2. Rotor and stator
The rotor refers to the mobile part of the molecular motor, which is to say the
subunit 9 (or c), the central axis formed by subunits γ, δ and ε in mitochondrial case, γ
and ε in bacterial and chloroplast cases (see figure 5).
The rotary activity is initiated by the protomotive force which triggers the
rotation of subunit 9 by the proton translocation. This rotary movement will then
transmit to the asymmetric central axis (γ, δ, ε subunits or γ, ε subunits), which then
deform the three catalytic sites located in β subunits, sequentially. The conformational
change of the catalytic sites generates the ATP synthesis from ADP and inorganic
phosphate. The transformation of chemiosmotic energy to mechanical energy is the
key point of ATP synthesis, which makes the subunit 9 essential by its contribution of
energetic coupling between Fo and F1 sectors.
The central axis γ subunit is essential not only for the protein complex assembly
but also for the rotary procedure owing to its contact with the membrane rotor
subunit 9 and asymmetric structure interacting with F1 catalytic subunits. It plays the
important role of coupling energy between the rotor and the stator.
The stator is the immobile part of FoF1 ATP synthase. It contains three pairs of
α/β subunits and all the subunits in Fo sector except the c‐ring (subunit 9). The crown‐
like α3β3 subunits are fixed by the peripheral stalk, subunits 4, 6 and OSCP through the
contact with OSCP (see figure 5). And the α3β3 subunits catalyse ATP synthesis or
hydrolysis. The subunit 6 contributes to the proton translocation (Fillingame et al,
2002) (see figure 5‐6).
1.2.3.3. Proton translocation
The proton translocation initiates the rotation of ATP synthase. This activity
requires the cooperation of the subunits 6 and 9 in yeast (a and c in E. coli,
respectively). Since these two subunits are coded by the mitochondrial genes, it is
difficult to perform genetic modifications. Moreover, the fact that the protein

43
structures of the membrane‐embedded subunits a and b are not yet clear adds more
inconvenience of the study. Most of the studies about proton translocation were
realized using the bacterial ATP synthase as model. The classic mechanism of proton
translocation in bacterial subunits a and c was proposed (Junge et al, 1997; Vik &
Antonio, 1994; Vik et al, 2000), and it could be adapted for mitochondrial and sodium‐
driven bacterial ATP synthases (figure 15).
a b
Figure 15. Models for the generation of rotation by proton transport through the Fo domain of bacterial ATP
synthase.
Panel a, model according to (Junge et al, 1997). Panel b, model according to (Vik et al, 2000).
It is shown that several properties are required for the proton translocation
function of ATP synthase. Firstly, an electrostatical constraint implies that protonated
sites (Asp61) on the c‐ring are always electroneutral when facing the lipid core,
whereas their facing the protein (a subunit) can be deprotonated and charged.
Secondly, the intramembranous a subunit contains two hypothetical half‐channels that
allow passage of protons through the membrane. The two accessible channels refer to:
the first one that extends from the cytoplasmic surface to the center of the membrane
44
includes subunit a residues His245 and Glu219; the second one that extends from the
periplasmic surface to the center of the membrane includes subunit a residues Arg210
and Glu196. Thirdly, the c subunit carries out Brownian rotational fluctuations relative
to a subunit with the influence of neighbouring molecules. As long as the Asp61 of c
subunit (interacting with Arg210 of subunit a) gets protonated from protons originating
from the periplasm through half channel His245 and Glu219, it is electroneutral and free
to rotate towards the lipid environment. Most importantly, this rotation will be driven
by the pmf. And it will also be electrostatically driven, as Arg210 of subunit a will be
strongly attracted to the remaining unprotonated Asp61. This arrangement assures that
rotation is unidirectional. When rotation occurs, a protonated Asp61 of c subunit will
move from the lipid environment into contact with subunit a and release the proton.
And the cycle continues.
The proton translocation drives the rotation of ATP synthase. And the number of
c subunit monomer determines the number of proton transported per cycle.
Consequently, as the F1 sector contains three catalytic sites and synthesizes three
molecules of ATP per cycle, the various number of c subunit monomers automatically
leads to different H+/ATP ratio. This ratio is also related to the number of ATP
molecules synthesized by mitochondrial respiration. So it is an important parameter
influencing the cell bioenergetics. In different species, the c ring monomers vary from
8 to 15. So the H+/ATP ratio are expected to vary from 2.7 to 5. Experimental
determination of the H+/ATP ratios revealed values of 4 for chloroplast (theoretical
values of 4.67) and E. coli ATP synthase (theoretical values of 3.33) (Steigmiller et al,
2008); 3 for yeast mitochondrial ATP synthase (theoretical values of 3.33) (Petersen et
al, 2012).
1.2.4. Forward the mechanism of ATP synthase
ATP synthase has a mode of function that is unusual for enzymes because of its
structural complexity and reaction mechanism, and this required much time and
extensive studies to establish. For years, the mechanism of ATP synthase has been a

45
popular topic for scientists. The most detailed studies of ATP synthase concern the F1
part and how it functions. Boyer and co‐workers clarified that the enzyme functions in
a very particular way. In 1993, Boyer established a sophisticated model called “Binding
Change Mechanism” (Boyer, 1993). Later on, Walker and co‐workers established the
3D structure of F1‐ATPase from bovine heart mitochondria (Abrahams et al, 1994).
Walker clarified the structural conditions of the enzyme’s molecular machinery and
thereby verified Boyer’s mechanism. To award their outstanding contribution to this
field, the Nobel Prize in Chemistry 1997 was divided, one half jointly to Paul D. Boyer
and John E. Walker "for their elucidation of the enzymatic mechanism underlying the
synthesis of adenosine triphosphate (ATP)"; and the other half to Jens C Skou for his
discovery of the enzyme Na+, K+‐ATPase. At the same period, there were many other
valuable studies focused on the structural and catalytic properties of ATP synthase
using various approaches. All of them contribute to cumulate our knowledge on this
splendid enzyme, an exceptional molecular machine. However, this journey is not
finished yet. For instance, the number and mode of participation of three potential
catalytic sites remain unsettled, which is still ongoing debated. And also the
regulations of ATP synthases during their catalysis, such as our topic of IF1 inhibition,
are not yet clear. Anyway, the research never stops.
1.2.4.1. Binding change mechanism
According to Boyer's binding change mechanism for ATP synthesis, the three
catalytic sites on the enzyme bind ADP and phosphate in sequence and then undergo a
conformational change so as to make a tightly bound ATP. The sites then change
conformation again to release the ATP. At any instant of catalysis, the three sites
undergoing sequential conformational changes have three different conformational
states (O: Open, T: Tight, L: loose). These conformational changes are accomplished by
rotational catalysis driven by the rotating inner core of the enzyme, which is in turn
driven by the protons crossing the mitochondrial membrane.
46
Most in vitro studies of the catalysis of ATP synthase trend to the reversed
direction, ATP hydrolysis. Since the purification of mitochondria as well as isolated F1‐
ATPase has been well developed, experiments testing ATP hydrolysis with these
materials are easier to establish. For example, with purified isolated F1‐ATPase, one
could manipulate more precise functional experiments and obtain more accurate
results without interference of impurities. Moreover, experimentally, with liposomes it
is difficult to create an artificial proton gradient that is necessary for the enzyme to
catalyze ATP synthesis.
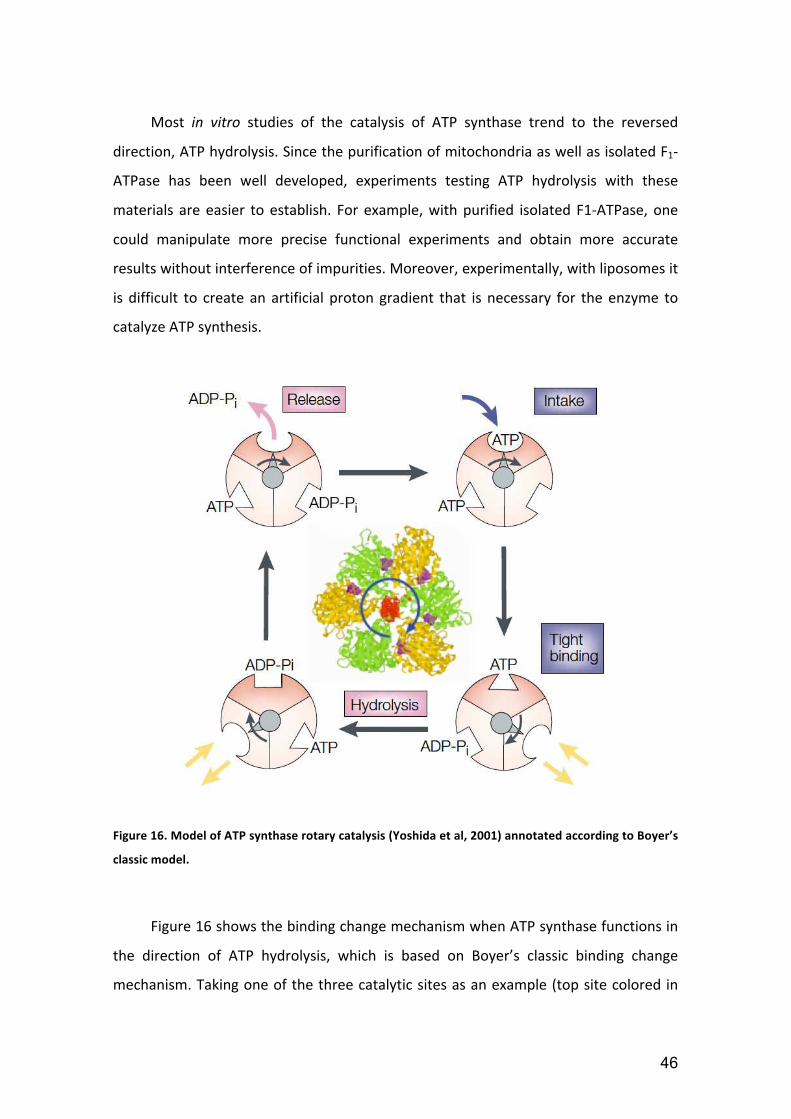
Figure 16. Model of ATP synthase rotary catalysis (Yoshida et al, 2001) annotated according to Boyer’s
classic model.
Figure 16 shows the binding change mechanism when ATP synthase functions in
the direction of ATP hydrolysis, which is based on Boyer’s classic binding change
mechanism. Taking one of the three catalytic sites as an example (top site colored in
47
dark salmon), we could see that hydrolysis of one nucleotide is subdivided into three
steps. When γ subunit rotates the first 120°, the catalytic site intakes one ATP with
loose binding. When γ subunit rotates the second 120°, ATP binding becomes tight
with the conformational change and hydrolysis occurs. When γ subunit rotates the
third 120°, the catalytic site containing the hydrolyzed products ADP and Pi will open
to release the products. Then the cycle repeats.
1.2.4.2. Catalytic sites occupancy: Uni‐site catalysis and multi‐sites
catalysis
Uni‐site catalysis refers to the conditions that allow only a single catalytic site to
bind one ATP molecule during the ATP hydrolysis of F1‐ATPase (Grubmeyer et al,
1982). In such conditions, ATP hydrolysis goes very slow, with a turnover around 10‐4s‐1
(Grubmeyer et al, 1982). Later on, other studies using nucleotide‐depleted enzyme
updated the turnover value to 10‐1 s‐1 (Milgrom Ya & Murataliev, 1987a; Milgrom Ya &
Murataliev, 1987b). This slow catalytic turnover of ATP hydrolysis was shown to be
related to the slow release of hydrolyzed products, especially ADP, but not to be
limited by the binding of ATP to the high affinity catalytic site (Grubmeyer et al, 1982;
Milgrom Ya & Murataliev, 1987a; Milgrom Ya & Murataliev, 1987b). In addition,
evidences showed that the uni‐site catalysis could occur without the γ subunit rotation
(Garcia & Capaldi, 1998). The γ subunit rotation only affects ATP binding to the second
or third catalytic site (Garcia & Capaldi, 1998). Moreover, when ATP is loaded at a
single catalytic site on nucleotide‐depleted MF1, the rate of product release is
accelerated by the binding of ATP at adjacent catalytic sites. This fact shows strong
cooperative interactions between catalytic sites (Milgrom & Cross, 1997). Finally, it is
shown that normal steady‐state ATPase activity requires three intact catalytic sites, of
which at least two are required to achieve a catalytic cooperativity (Amano et al,
1996).
Multi‐site occupancy has always been a controversial discussion. Some
specialists believe that ATPase catalyzes the maximal ATP hydrolysis with two catalytic

48
sites occupied (bi‐site); some others stand for a tri‐site model, in which the maximal
turnover rates occur as long as the filling of the third site. Since they all have
experimental evidence to support their hypotheses, this question still opens to
discussion. Here, I am going to show some of those different voices.
Bi‐site model is in agreement that all three catalytic sites participate sequentially
in an equivalent manner, but emphasizes that only two of the three catalytic sites
need to be simultaneously filled for rapid, steady‐state ATP hydrolysis (Boyer, 2000;
Murataliev & Boyer, 1994). Bi‐site model is as well supported by a centrifuge filtration
assay, which compared the ATP concentration dependence of the rate of ATP
hydrolysis by MF1 to the ATP concentration dependence of the level of catalytic sites
occupancy during steady‐state catalysis (Milgrom & Cross, 2005).
Tri‐site model supporters claim that occupancy of one or two catalytic sites per
F1 molecule did not yield significant rates of hydrolysis while occupancy of all three
sites yielded maximal rates (Weber & Senior, 2000; Weber & Senior, 2001; Weber et
al, 1993). The simultaneous observation of nucleotide kinetics and rotation stands by
the tri‐site scheme because the marked nucleotide remained bound until 240° of γ
rotation or until two more ATP molecules bound occurred (Nishizaka et al, 2004).
Specific placement of tryptophan in the catalytic site was used to detect the nucleotide
binding to the catalytic site. The fluorescence of this tryptophan was strongly
quenched on binding of nucleotides to the catalytic sites. Based on the concentration
dependency of fluorescence quenching upon ATP addition, it has been suggested that
three catalytic sites must be filled for near maximal hydrolysis activity to be attained
(Dou et al, 1998; Gruber & Capaldi, 1996; Weber et al, 1993; Weber et al, 1994).
1.2.4.3. non‐catalytic sites
Non‐catalytic sites refer to the nucleotide binding sites on α subunits. They
cooperate with the catalytic sites during enzyme catalytic activity. It is shown that the
nucleotide binding to the three non‐catalytic sites are indispensable for ATP hydrolysis
activity (Milgrom et al, 1990). Others showed an inhibitory effect of ADP bound to

49
these sites (Bullough et al, 1989; Di Pietro et al, 1981; Di Pietro et al, 1980).
Nevertheless, nucleotide binding to the non‐catalytic sites seems not so important
when enzyme functions as ATP synthesis (Bald et al, 1998).
1.2.5. Regulation of ATP synthase
As mentioned above, ATP synthesis is the main function of the enzyme in most
organisms. However, in many species, especially many bacterial ones (mostly
anaerobic), the reverse reaction of ATP hydrolysis is vitally important. When neither
respiratory nor photosynthetic chains can generate pmf, ATP synthase works as a
proton pump, generating pmf at the expense of ATP hydrolysis. In this way many
important cellular functions, such as flagella motility or ion\nutrients transmembrane
transport are supported. Clearly, ATP hydrolysis activity is mostly a potential danger to
a living cell, so ATP synthase has several regulatory mechanisms to prevent futile ATP
wasting.
Several regulatory mechanisms are known to suppress the ATPase activity. 1)
Non‐competitive inhibition by MgADP, a feature shared by FoF1 from bacteria,
chloroplasts and mitochondria. 2) Inhibition by subunit ε in chloroplast and bacterial
enzymes. 3) Inhibition upon oxidation of two cysteines in subunit γ in chloroplast FoF1.
4) Inhibition by an additional regulatory protein IF1 in mitochondrial enzymes, which is
the main subject of this work.
Many natural or synthetic molecules could also inhibit ATPase hydrolysis activity
by binding to different sites of ATPase. Table 2 shows a list of identified covalent and
non‐covalent inhibitors of mitochondrial F1‐ATPase (Gledhill & Walker, 2005).

50
Table 2. Identified covalent and non‐covalent inhibitors of mitochondrial F1‐ATPase (Gledhill &
Walker, 2005).
1.3. Endogenous inhibitor of ATPase, IF1
IF1 is a natural mitochondrial endogenous inhibitor, which was discovered in
1963 by Pullman and Monroy from bovine heart mitochondria (Pullman & Monroy,
1963). Until today, IF1 homologues have been characterized from mitochondria of
yeast (Hashimoto et al, 1981; Matsubara et al, 1981; Venard et al, 2003), rat (Cintron &
Pedersen, 1979), goat heart (Di Pancrazio et al, 2004) and plants (Norling et al, 1990).
Its basic inhibitory sequence is well conserved. As an inhibitor of ATPase, IF1 efficiently
prevents the enzyme from hydrolyzing ATP by binding to the F1‐ATPase.
1.3.1. Structures of IF1: bovine vs yeast
In bovine heart, IF1 is a small, heat‐stable protein of 84 amino acids, which is
encoded by nuclear DNA. It has been well studied and its 3D structure has been

51
characterized both in solution (Cabezon et al, 2001) and bound to MF1 (Bason et al,
2011; Gledhill et al, 2007b). The crystal structure of isolated soluble bovine IF1 is
shown in figure 17. As we can see, the major structure of IF1 is a long α helix with its
residues 19 to 83 solved. Its primary sequence is well conserved, particularly over
residues 14 to 47 (bovine numbering), which have been defined as the minimal
inhibitory region (van Raaij et al, 1996b). Bovine IF1 has been shown to have two
oligomeric states, tetramer and dimer, favoured by pH values above and below 6.5,
respectively (Cabezon et al, 2000b). Dimerization of IF1 occurs in its C‐terminal region,
allowing the active dimeric inhibitor IF1 to bind two F1 domains simultaneously
(Cabezon et al, 2000a). At pH 8, the protein forms a tetramer through its midpart,
where the inhibitory regions are masked (Cabezon et al, 2000b). The N‐terminal
extremity of IF1 is not visible in the crystal structure shown in figure 17. But it was
observed interacting with the central γ subunit of F1 domain in the structure of
inhibited complex (Gledhill et al, 2007a). The homologue of IF1 in yeast shares the
similarity with bovine IF1, especially the well conserved minimal inhibitory sequence
(see sequence alignment in figure 18).
Figure 17. Stereo view of the 2.2 Å crystal structure of bovine IF1 (Cabezon et al, 2001).
Image created by PyMol software. Pdb file, 1gmj. This crystal was solved as a tetramer. The selected
monomer has more complete residues (19 to 83) solved and shown.

52
Figure 18. Protein sequence alignment of bovine and yeast IF1.
In bovine IF1 sequence, the minimal inhibitory sequence (van Raaij et al, 1996a) is underlined.
In yeast, IF1 is a smaller protein of 63 amino acids, which is encoded by nuclear
DNA as well. The crystal structure of yeast IF1 bound to MF1 was recently solved with
only 1 to 36 residues visible, which is shown in figure 17. Previous study showed that
yeast IF1 also has two oligomeric states, monomer or dimer (Cabezon et al, 2002). The
monomer of yeast IF1 functions as an effective ATPase inhibitor according to the yeast
IF1 oligomerization study of Tiona ANDRIANAIVOMANANJAONA as well as the crystal
structure of IF1 inhibited ATPase (Robinson et al, 2013). But the dimeric yeast IF1 is
not yet characterized. Besides, the N‐terminal part of yeast IF1 is shown to stabilize the
inhibited IF1‐MF1 complex but plays no role in the protein recognition step
(Andrianaivomananjaona et al, 2011). In addition, it appears to exist a homologue of
IF1 in yeast, which is named STF1. STF1 shows a similar ATPase inhibitory activity to
IF1, but at presence of IF1, its affinity to ATPase is much lower (Venard et al, 2003).
Two other proteins STF2 and STF3 have been proposed to modulate the activities of
yeast IF1 and STF1. Their physiological characters and structures still remain unclear.
STF2 seems playing a role of stabilization during inhibition of ATPase (Hashimoto et al,
1990; Hong & Pedersen, 2002). STF3 is known to be a homologue of STF2, but it has
not been isolated yet.

53
Figure 19. Stereo view of the 2.5 Å crystal structure of yeast IF1 from the inhibited IF1‐MF1 complex
(Robinson et al, 2013).
Image created by PyMol software. Pdb file, 3zia. Residues 1 to 36 are solved and shown.
1.3.2. Mechanism of IF1 inhibition
1.3.2.1. Uni‐directional inhibitory mechanism
The inhibition of mitochondrial FoF1 ATPase by its endogenous inhibitor IF1 is
called uni‐directional, for the reason that IF1 is able to inhibit mainly the ATP
hydrolysis activity of the enzyme but not the ATP synthesis (Schwerzmann & Pedersen,
1986).
When the pmf across the mitochondrial inner membrane drops, ATPase starts to
hydrolyze ATP where IF1 binds to the F1 domain of ATPase and inhibits the ATP
hydrolysis. As soon as the mitochondrial inner membrane gets re‐energized and the
proton gradient is rebuilt across the membrane, the enzyme will restart to catalyze the
ATP synthesis again. At this moment, IF1 is rejected from the enzyme, so that the ATP
synthesis activity is not affected by IF1 (see figure 20).

54
Figure 20. Representation of IF1 inhibition of mitochondrial ATPase.
1.3.2.2. Mitochondrial‐specific ATPase inhibition
IF1 is known to be a mitochondrial‐specific ATPase inhibitor. It has not yet been
reported IF1 existence in bacteria or chloroplasts. Besides, it was revealed that neither
yeast IF1 nor bovine IF1 could inhibit E. coli ATPase (Cabezon et al, 2002). On the
contrary, either yeast or bovine IF1 could effectively inhibit ATPases from both species.
Whereas bovine IF1 inhibits yeast F1‐ATPase even better than yeast IF1, and yeast
inhibitors are not as effective as their bovine counterpart (Cabezon et al, 2002). Even
earlier, other studies showed that IF1 from potato mitochondria could also inhibit
bovine ATPase but poorly, despite its weak homology with IF sequences from
mammals and yeasts (Polgreen et al, 1995). Functional experiments in our lab also
showed similar results that yeast IF1 did not inhibit bacterial or chloroplast ATPase
(details in paragraph 3.2.1). The given evidences drive to the most probable conclusion
that IF1 inhibits specifically mitochondrial ATPases.

55
1.3.2.3. Other inhibitory system for bacterial and chloroplast
ATPases
Absence of IF1 regulation, bacteria and chloroplast have their own inhibitory
system for ATPase hydrolysis activity, which implicates the ε subunit (equivalent to δ
subunit in mitochondrial ATPases). The ε subunit was first shown to be important in
bacterial ATPase regulation by (Kuki et al, 1988). Similar function was then shown in
chloroplast (Nowak et al, 2002). The conformational change of ε subunit was finally
revealed to be the regulation system of bacteria ATPase (Tsunoda et al, 2001) (see
figure 21).
Figure 21. Representation of ε subunits regulation of bacterial ATPase.
Image is reconstructed according to the study of (Tsunoda et al, 2001). Panel A, with the C‐terminal
domain of ε toward the Fo (indicated as C10), ATP hydrolysis is activated. Panel B, with the C‐terminal
domain of ε toward the F1 part, ATP hydrolysis is inhibited. In both cases of ε conformations, the enzyme
is fully functional in ATP synthesis.
Two different arrangements of the ε subunit have been visualized, which are
simplified as shown in figure 21. The first one is as figure 21‐A, where the C‐terminal
portion of ε subunit is arranged as a hairpin of two α helices that extends away from
the α3β3 catalytic region and toward the position of the c subunit ring. In this
arrangement, ATP hydrolysis is activated, but the enzyme is fully coupled in both ATP

56
hydrolysis and synthesis. The second one is as figure 21‐B, where the two C‐terminal α
helices are apart and extend along the γ subunit to interact with α and β subunits.
With the C‐terminal domain toward the F1 part, ATP hydrolysis is inhibited and yet the
enzyme is fully functional in ATP synthesis, which is similar to the IF1 uni‐directional
inhibition. Moreover, the ε subunit conformational change was shown to respond the
proton motive force both in bacteria (Suzuki et al, 2003) and in chloroplast (Komatsu‐
Takaki, 1989; Richter & McCarty, 1987). Nucleotide binding also has an influence of ε
subunit conformational change. FRET probe was used to optically monitor the
transitions of ε subunit, which confirmed that ATP binding to catalytic site induced the
contracted conformation of ε subunit while ADP favored the extended one (Feniouk et
al, 2006; Iino et al, 2005; Suzuki et al, 2003).

57
1.4. Thesis statement
In this work, our central interest is the regulation of mitochondrial ATP synthase
by its endogenous inhibitor IF1 in Saccharomyces cerevisiae. Since ATP hydrolysis
activity is always a potential danger to a living cell, the study of IF1 regulation could
help us to better understand one efficient way to prevent futile ATP wasting, all the
more to better and better reveal details about the bio‐energy system created by the
art of nature. At the same time, yeast is a perfect biological model, which is simple but
complete, easy to manipulate but sophisticated to study. As a well‐studied model, we
also have access to more information, which prevents from wasting time and energy.
More precisely, in order to understand IF1 regulation system, we studied many
protein crystal structures. Indeed, they provide direct visualization of ATP synthases as
well as their interaction with IF1 (in some organisms). But this is not all. Knowing well
IF1 binding to ATP synthase is a dynamic procedure, we could only visualize the dead‐
end protein complex but not fully understand the inhibitor binding process. In our lab,
the current work as well as some previous work made connections of several
techniques, such as structure analyses, mutagenesis, enzymatic kinetics and so on, to
investigate how does IF1 bind to yeast mitochondrial ATPase thereby effectively inhibit
the ATP hydrolysis.
At a molecular level, we studied numerous residues in ATPase α, β and γ subunits
that are most probably implicated in IF1 binding process. Target residues were
generally classified into four groups. Mutagenesis was performed to modify those
residues, on one hand into their non‐mitochondrial counterpart to investigate IF1
mitochondrial ATPase specificity; on the other hand into glycine to weaken the protein
interaction thus determine IF1 binding pathway. And of course, mutagenesis was
combined to kinetic approach in order to study the effect of mutations and
consequently analyze the roles played by each residue during IF1 binding and locking
to ATPase. With all the results, we eventually managed to propose a binding‐locking‐
inhibiting model for the regulation of yeast mitochondrial ATPase by IF1. Even though
the problem is not 100% solved yet, our work allows the understanding to get closer to
the reality.

58
Chapter 2. Materials and Methods

59

60
2. Materials and Methods
2.1. Materials
2.1.1. Yeast and bacteria strains
In this work, we used yeast as a biological model to study the mitochondrial
ATPase and its inhibition by IF1. Wild type and mutated ATPase in different subunits
were expressed in yeast Saccharomyces cerevisiae, followed by subsequent
mitochondria preparations. We mainly used 3 different strains of yeast. 1)
Saccharomyces cerevisiae W303‐1A ∆ATP1∆ATP2 is a strain deficient in mitochondrial
ATPase α and β subunits. It was created by Dr. David Mueller (Chicago, IL) and kindly
provided by Dr. Marie‐France Giraud (CNRS Bordeaux). 2) Saccharomyces cerevisiae
Euroscarf BY4741 ΔATP2 purchased from Euroscarf is a strain deficient in
mitochondrial ATPase β subunit. 3) Saccharomyces cerevisiae W303‐1B YG1 ∆ATP3
deficient in mitochondrial ATPase γ subunit and transformed by wild type or mutations
were kindly provided by Dr. Emmanuel Tetaud (Bordeaux, IBGC). Detailed information
is shown in table 3.
Table 3. Description of Saccharomyces cerevisiae strains.
Bacteria Escherichia coli were used to amplify plasmids carrying ATPase
mutations and to overexpress yeast IF1. 3 different E. coli strains with different

61
functions were used. 1) XL1‐Blue was chemical competent and was used to amplify
plasmids of mutagenesis products. The transformation was made by a heat shock at
42°C. 2) DH5α was electrocompetent and was used to amplify plasmids in general. The
transformation was made by an electroporation system using a Bio‐Rad Gene Pulser.
3) BL21DE3 was a strain specially used for IF1 overexpression. It was deficient in two
key proteases, which reduced degradation of heterologous proteins expressed in the
strain. Detailed information is shown in table 4.
Table 4. Description of Escherichia coli strains
2.1.2. Cell culture media
Transformed yeasts and bacteria were grown at 28°C and 37°C respectively.
Their culture media were varied according to the selective markers. For yeast, cells
were grown either on a strictly respiratory medium with the selection of respiration, or
on a fermentable medium with the selection of amino acids lacked in the cell strain
and carried by transformed plasmid. The composition of liquid media is described in
table 5. As for solid media, 2% (m/v) of agar was added. All the media were sterilised
by autoclave at 120°C for 20min under pressure. However, glucose solution of 10%

62
(m/v) and amino acids solutions were sterilised separately, and subsequently added
into culture media. Amino acids or antibiotics used to prepare culture media are
indicated in table 6.
Table 5. Description of cell culture media.
Table 6. Description of amino acids, bases and antibiotics.

63
2.1.3. Plasmid vectors and protein modification
Gene encoding different mitochondrial ATPase subunits or IF1 were replicated
and inserted in different plasmid vectors (see table 7). Mutations were made on basis
of these plasmid constructions using site‐directed mutagenesis. In yeast mitochondrial
ATPase, mutations in α, β, and γ subunits were constructed and studied.
The plasmid with ATP1 gene was obtained by modifying the plasmid pFL61
(Minet et al, 1992) as following description. First, the 2 micron replication origin was
replaced by the ARS/CEN replication origin. Then, gene encoding α subunit was
amplified by polymerase chain reaction (PCR). The PCR fragment was ligated into a
centromeric plasmid between 5’ promotor and 3’ terminator PGK, leading to
pVC2/ATP1, created by Dr. Vincent Corvest. Two groups of mutations were made by us
in different regions of α subunit (locations see table 8).
Gene encoding β subunit was amplified by polymerase chain reaction. The PCR
fragment was ligated into a centromeric plasmid, pRS313. A His10‐tag codon was
inserted between the signal peptide sequence and the mature β subunit sequence by
site‐directed mutagenesis. The same as α subunit, different regions of β subunit were
mutated subsequently (locations see table 8).
Modifications in γ subunit were performed in Bordeaux, by Dr. Emmanuel
Tetaud. Gene encoding γ subunit was replicated using PCR and then ligated into
plasmid vector pES425#1 (Doron Rapaport). All mutants of γ subunit were obtained by
transforming S. cerevisiae cells with pES425. Transformed cells were subsequently
deleted for ATP3 gene with the ATP3 deletion cassette obtained by PCR amplification
of pUG6 containing KanMX4 module (Wach et al, 1994).
Gene encoding yeast IF1, INH1, was replicated and inserted into plasmid vector
pET30a offered by Dr. Marie‐France Giraud (Bordeaux). A protein fusion including a
His‐tag and an enterokinase cleavage site was added in front of INH1 sequence in
order to facilitate IF1 purification. The whole insert was overexpressed in E.coli. The
protein fusion was removed using enterokinase during purification
(Andrianaivomananjaona et al, 2011). Yeast IF1 “wild type” produced in this work
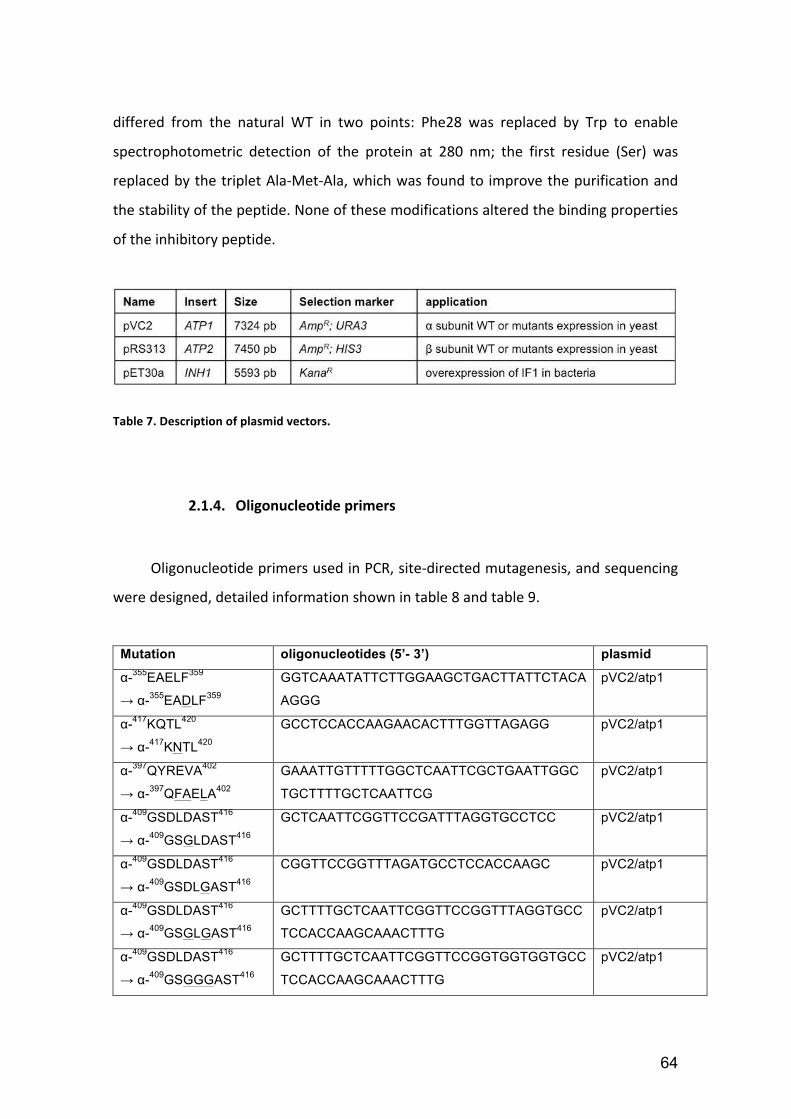
64
differed from the natural WT in two points: Phe28 was replaced by Trp to enable
spectrophotometric detection of the protein at 280 nm; the first residue (Ser) was
replaced by the triplet Ala‐Met‐Ala, which was found to improve the purification and
the stability of the peptide. None of these modifications altered the binding properties
of the inhibitory peptide.
Table 7. Description of plasmid vectors.
2.1.4. Oligonucleotide primers
Oligonucleotide primers used in PCR, site‐directed mutagenesis, and sequencing
were designed, detailed information shown in table 8 and table 9.
Mutation oligonucleotides (5’- 3’) plasmid
α-355
EAELF359
→ α-355
EADLF359
GGTCAAATATTCTTGGAAGCTGACTTATTCTACA
AGGG
pVC2/atp1
α-417
KQTL420
→ α-417
KNTL420
GCCTCCACCAAGAACACTTTGGTTAGAGG pVC2/atp1
α-397
QYREVA402
→ α-397
QFAELA402
GAAATTGTTTTTGGCTCAATTCGCTGAATTGGC
TGCTTTTGCTCAATTCG
pVC2/atp1
α-409
GSDLDAST416
→ α-409
GSGLDAST416
GCTCAATTCGGTTCCGATTTAGGTGCCTCC
pVC2/atp1
α-409
GSDLDAST416
→ α-409
GSDLGAST416
CGGTTCCGGTTTAGATGCCTCCACCAAGC
pVC2/atp1
α-409
GSDLDAST416
→ α-409
GSGLGAST416
GCTTTTGCTCAATTCGGTTCCGGTTTAGGTGCC
TCCACCAAGCAAACTTTG
pVC2/atp1
α-409
GSDLDAST416
→ α-409
GSGGGAST416
GCTTTTGCTCAATTCGGTTCCGGTGGTGGTGCC
TCCACCAAGCAAACTTTG
pVC2/atp1

65
α-409
GSDLDAST416
→ α-409
GGGGGAST416
GCTCAATTCGGTGGCGGTGGTGGTG pVC2/atp1
α-409
GSDLDAST416
→ α-409
GSGGGGGG416
CGGTGGTGGTGGCGGCGGCAAGCAAACTTTGG pVC2/atp1
α-409
GSDLDAST416
→ α-409
GGGGGGGG416
GCTCAATTCGGTGGCGGTGGTGGTG
+
CGGTGGTGGTGGCGGCGGCAAGCAAACTTTGG
pVC2/atp1
α-409
GSDLDAST416
→ α-409
GS---AST416
GCTTTTGCTCAATTCGGTTCCGCCTCCACCAAG
CAAACTTTGG
pVC2/atp1
β-394
DELSEQD400
→ β-394
GELSEQD400
GCTATTTTGGGTATGGGTGAATTGTCCGAACAA
G
pRS313/atp2-
H10
β-394
DELSEQD400
→ β-394
DGLSEQD400
GGGTATGGATGGATTGTCCGAAC
pRS313/atp2-
H10
β-394
DELSEQD400
→ β-394
DGGGEQD400
GCTATTTTGGGTATGGATGGAGGGGGCGAACA
AGATAAACTAACTGTCG
pRS313/atp2-
H10
β-394
DELSEQD400
→ β-394
DELSGQG400
GGTATGGATGAATTGTCCGGACAAGGTAAACTA
ACTGTCGAAAGGGC
pRS313/atp2-
H10
β- 379
QTYKSLQ385
→ β- 379
QRYKELQ385
CCTCCAAGGTTCAAGAAACTTTACAGAGATATA
AAGAATTACAAGATATCATTGCTATTTTGG
pRS313/atp2-
H10
β-470
AEKIAR475
→ β-470
AKKIER475
GAAGATGTTGTTGCTAAAGCTAAAAAGTTAGAA
GCTGAAGCCAACTAGAAG
pRS313/atp2-
H10
HindIII-Start-γ AGAAAGCTTATGTTGTCAAGAATTGTATCAAAC pES425/G2-G3
NotI-Stop-γ ATAGCGGCCGCTCATCCCAAAGAGGAAGCA pES425/G2-G3
γ-116
MQLL119
→ γ-116
GGLL119
GATAAAATTAAAGGTGGTCTATTGAGAACCCAT
C
pES425/G2
γ-116
MQLL119
→ γ-116
GGLL119
GATGGGTTCTCAATAGACCACCTTTAATTTTATC pES425/G2
γ-116
MQLL119
→ γ-116
GGGL119
GGTGATAAAATTAAAGGTGGTGGATTGAGAACC
CATCC
pES425/G3
γ-116
MQLL119
→ γ-116
GGGL119
GGATGGGTTCTCAATCCACCACCTTTAATTTTAT
CACC
pES425/G3
Atp3 deletion 5’ aggtggaaacaattgaagacgagcagtaaacattattttatttagtagt
cCATAGGCCACTAGTGGATCT
Atp3 deletion 3’ ttctacaaaaacaacgtcaaataaagaggcaatgcagggtgattttttt
aCAGCTGAAGCTTCGTACGC
Table 8. Description of mutations and their oligonucleotide primers.
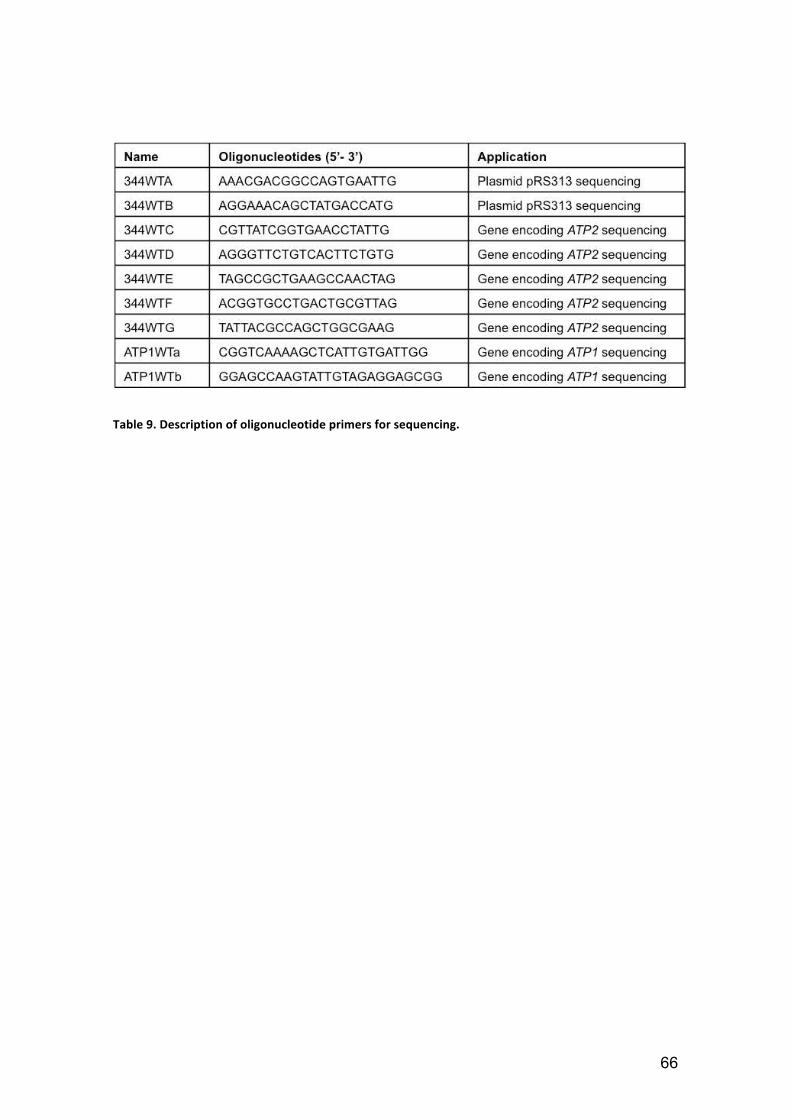
66
Table 9. Description of oligonucleotide primers for sequencing.
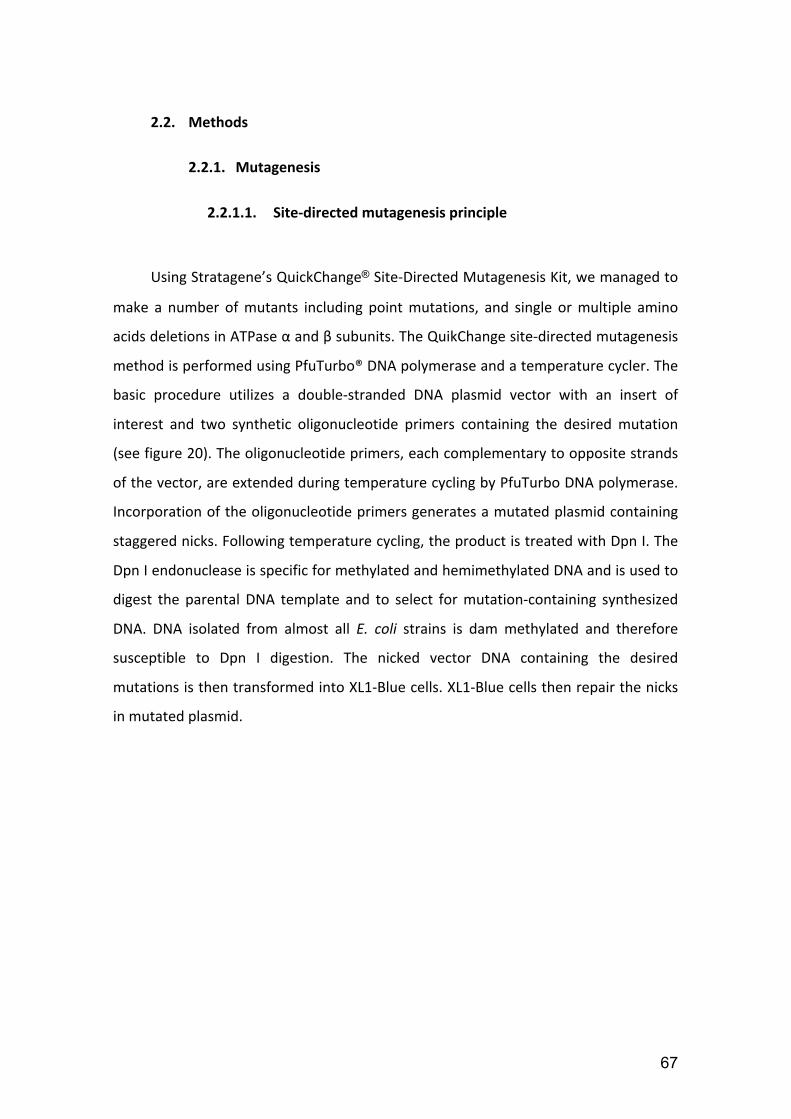
67
2.2. Methods
2.2.1. Mutagenesis
2.2.1.1. Site‐directed mutagenesis principle
Using Stratagene’s QuickChange® Site‐Directed Mutagenesis Kit, we managed to
make a number of mutants including point mutations, and single or multiple amino
acids deletions in ATPase α and β subunits. The QuikChange site‐directed mutagenesis
method is performed using PfuTurbo® DNA polymerase and a temperature cycler. The
basic procedure utilizes a double‐stranded DNA plasmid vector with an insert of
interest and two synthetic oligonucleotide primers containing the desired mutation
(see figure 20). The oligonucleotide primers, each complementary to opposite strands
of the vector, are extended during temperature cycling by PfuTurbo DNA polymerase.
Incorporation of the oligonucleotide primers generates a mutated plasmid containing
staggered nicks. Following temperature cycling, the product is treated with Dpn I. The
Dpn I endonuclease is specific for methylated and hemimethylated DNA and is used to
digest the parental DNA template and to select for mutation‐containing synthesized
DNA. DNA isolated from almost all E. coli strains is dam methylated and therefore
susceptible to Dpn I digestion. The nicked vector DNA containing the desired
mutations is then transformed into XL1‐Blue cells. XL1‐Blue cells then repair the nicks
in mutated plasmid.
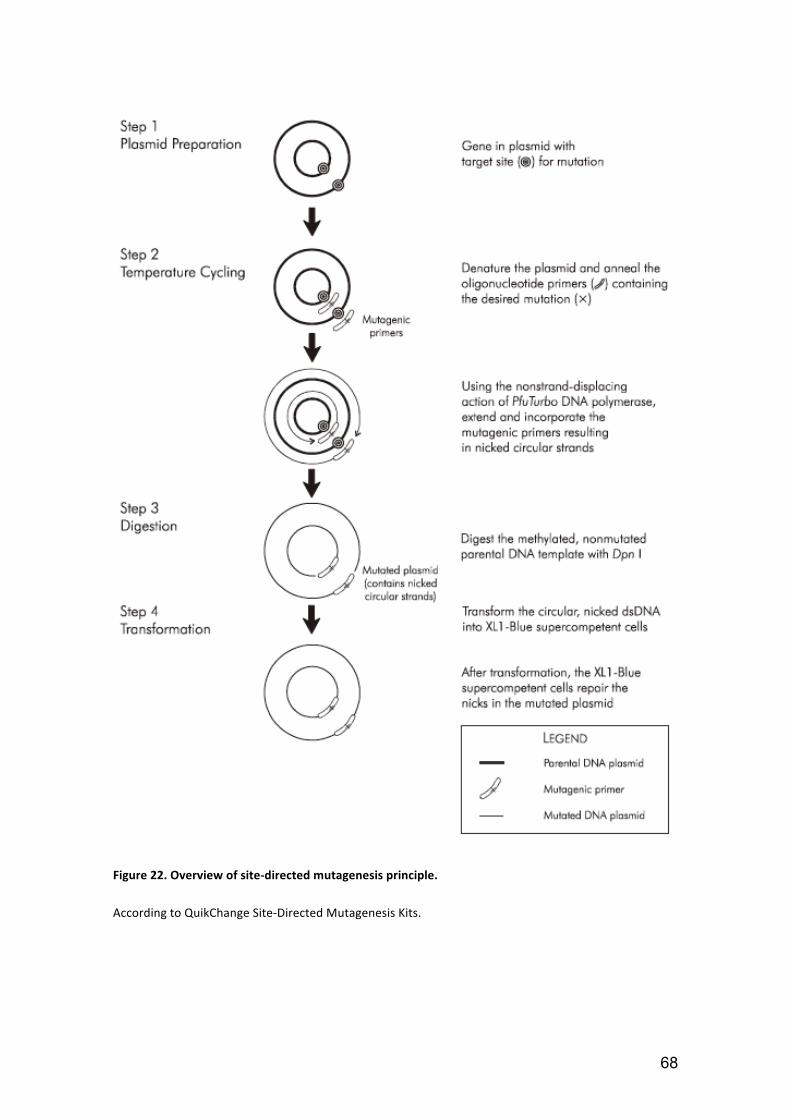
68
Figure 22. Overview of site‐directed mutagenesis principle.
According to QuikChange Site‐Directed Mutagenesis Kits.

69
2.2.1.2. Bacteria and Yeast cells transformations
Bacteria transformation with a plasmid vector carrying WT or mutation
information was performed using two methods: Heat shock at 42°C for chemical
competent cells as XL1‐Blue, or Electroporation with a Bio‐Rad Gene Pulser for
electrocompetent cells as DH5α and BL21(DE3). Transformed cells were incubated at
37°C with antibiotic selection. The harvest of selected cells was then used to extract
DNA for further use like yeast transformation and protein overexpression (figure 23).
4°C
Thaw competent bacteria cells on ice
Plasmid vector
Incubate bacteria cells with additional plasmid vectors
Bio-Rad Gene Pulser
Electroporation, pulse at 2.5 kV, 25µF, 200Ω
Heat shock at 42°C duing 45sec
or
Transformed cell harvest, with antibiotic selection
Figure 23. Overview of bacteria transformations.
Yeast transformation with a plasmid vector carrying WT or mutation information
was performed using lithium acetate treatment (Gietz et al, 1995). Transformed cells
were selected using SD medium lacked some certain amino acid, which was
complemented by transformed plasmid expression. Selected cells were grown on YLac
medium at 30°C to verify the respiration function. Growth time varied between
mutants. The most frequently used yeast strain was S. cerevisiae W303‐1A
∆ATP1∆ATP2. To achieve one final mutated product, two transformations were carried
out introducing 2 plasmids coding for ATP1 and ATP2. Each step was examined by a
group of selective media, including negative control of S. cerevisiae W303‐1A ∆ATP1 or
S. cerevisiae W303‐1A ∆ATP2 on strict respiratory medium (see table 10).

70
Table 10. Yeast (S. cerevisiae W303‐1A ∆ATP1∆ATP2) transformation Selections.
2.2.1.3. DNA extraction and quantification
Plasmids carrying mutations were amplified in E. coli and extracted and purified
using QIAprep Spin Miniprep Kit. Plasmid purification followed a simple bind‐wash‐
elute procedure. First, bacterial cultures were lysed and the lysates were cleared by
centrifugation. The cleared lysates were then applied to the QIAprep column where
plasmid DNA adsorbed to the silica membrane. Impurities were washed away and pure
DNA was eluted in a small volume of elution buffer or water.

71
Purified plasmid quantification was then estimated with a spectrophotometer at
260nm. 1 OD indicates about 50 μg/mL double‐stranded DNA.
2.2.2. Preparation of yeast mitochondria (WT & mutants)
Transformed yeast cells were grown on the strictly respiratory medium YLac with
large volume (3 to 8 L) at 30°C. Cell density was estimated by spectrophotometer
absorption at 600nm. The stage of population tells if the population is in lag phase,
exponential phase, or stationary phase. Our culture harvests were always at late state
of their exponential growth phase, around OD 7. One entire mitochondria preparation
lasts 4 days including cell culture. On day 4, cell harvest was centrifuged at 2500 xg
during 5 min. Cell pellet was washed and digested by zymolyase 20T (200U/ g dry cell).
In the meantime of yeast cell wall digestion (average 150 min), the cell membrane was
broken by osmotic pressure. The target particle mitochondrion was then released from
yeast cell. Following series of differential centrifugations, mitochondria were finally
purified from yeast cells (Venard et al, 2003). The final product was formed into
mitochondria beads in liquid nitrogen with the help of a syringe. Each bead contained
about 10µL mitochondria. All the purified mitochondria were conserved in liquid
nitrogen for further study.
Sub‐mitochondrial particles devoid of IF1 were prepared by sonication in TSE (20
mM Tris‐SO4, 200 µM EDTA, pH 8.5) as previously (Venard et al, 2003), except that
after endogenous IF1 release (4°C, overnight) they were centrifuged for 20 min (8000
g, 4°C). The supernatant was then centrifuged for 40 min (100,000 g, 4°C), and the
pellet was resuspended into a small volume (100‐200 µl) of TSE, then kept on ice
before use.
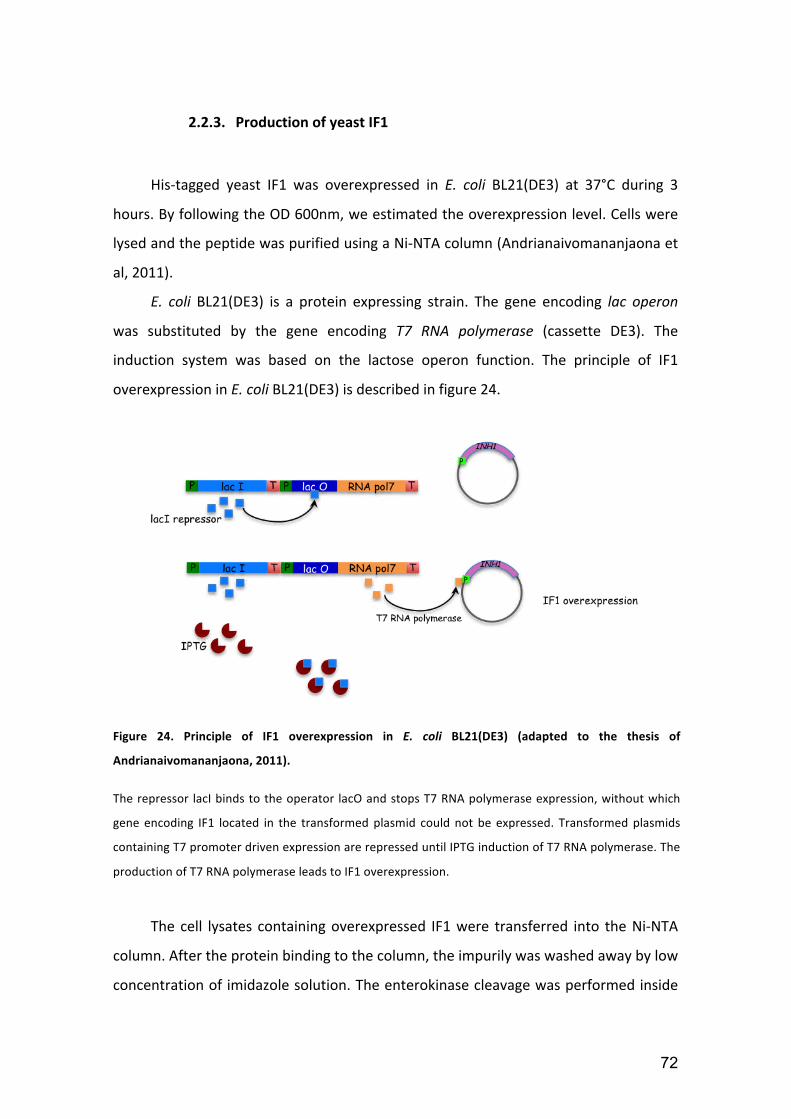
72
2.2.3. Production of yeast IF1
His‐tagged yeast IF1 was overexpressed in E. coli BL21(DE3) at 37°C during 3
hours. By following the OD 600nm, we estimated the overexpression level. Cells were
lysed and the peptide was purified using a Ni‐NTA column (Andrianaivomananjaona et
al, 2011).
E. coli BL21(DE3) is a protein expressing strain. The gene encoding lac operon
was substituted by the gene encoding T7 RNA polymerase (cassette DE3). The
induction system was based on the lactose operon function. The principle of IF1
overexpression in E. coli BL21(DE3) is described in figure 24.
Figure 24. Principle of IF1 overexpression in E. coli BL21(DE3) (adapted to the thesis of
Andrianaivomananjaona, 2011).
The repressor lacI binds to the operator lacO and stops T7 RNA polymerase expression, without which
gene encoding IF1 located in the transformed plasmid could not be expressed. Transformed plasmids
containing T7 promoter driven expression are repressed until IPTG induction of T7 RNA polymerase. The
production of T7 RNA polymerase leads to IF1 overexpression.
The cell lysates containing overexpressed IF1 were transferred into the Ni‐NTA
column. After the protein binding to the column, the impurily was washed away by low
concentration of imidazole solution. The enterokinase cleavage was performed inside

73
the column (30U enterokinase/column), where the His‐tag was removed. Enterokinase
was denatrued and removed by heating the sample at 90°C during 10 min and
centrifuging at 11000 rpm during 20 min at 10°C. Then IF1 was eluted and precipitated
by TCA (10%). Another step of centrifugation was performed to eliminate TCA. The
pellet containing the final product was dissolved in small volume of 50mM Na Acetate
solution, at pH5.5.
2.2.4. Kinetic measurement
Continuous monitoring of ATP hydrolysis by SMP coupled to NADH oxidation was
carried out spectrophotometrically as described (Andrianaivomananjaona et al, 2011).
We used the classic ATP regenerating system demonstrated in figure 25 below.
Figure 25. ATP regeneration system using pyruvate kinase and lactate dehydrogenase.
NADH consumption is detected at 340nm in the spectrophotometer during the kinetics of ATP hydrolysis
and IF1 inhibition.
The reaction was observed in a stirred and thermostated cuvette (25°C)
containing 50 mM MES (pH 6.5) or 50 mM Tris (pH 8.0), 20 mM KCl, 1 mM MgCl2, 1
mM phosphoenolpyruvate, 20 units/mL pyruvate kinase, 50 units/mL lactate
dehydrogenase, 0.4 mM NADH, 1 mM MgATP, 2 µM antimycin and 2 µM FCCP. ATP
hydrolysis was initiated by adding SMP and monitored by NADH absorbance decrease

74
at 340 nm. After 2 to 4 min, yeast IF1 was injected and ATPase activity decayed.
Demonstration of this procedure is shown in figure 26.
Figure 26. Spectrophotometric recording of ATP hydrolysis and IF1 inhibition in real time kinetics.
V0 represents the constant rate of absorbance variation before IF1 addition, which indicates the initial
ATPase activity; VI represents the final rate of absorbance variation after IF1 addition, which indicates
the final ATPase activity. kapp represents the apparent inhibition rate constant.
The spectrophotometric recording was fitted to the following function
corresponding to a monoexponential decay of the ATPase activity:
y(t)=V(I) t +[(V(0)‐V(I)) /kapp] [1‐exp(‐kappt) ]+ y0 Eqn. (1)
where y(t) is the absorbance at time t, and y0 the absorbance at zero time defined as
the time of IF1 addition. V(0) is the constant rate of absorbance variation before IF1
addition in absorbance units per second (proportional to the initial ATPase activity),
V(I) the final rate of absorbance variation after IF1 addition (proportional to the final
ATPase activity), and kapp the apparent inhibition rate constant in s‐1. The obtained kapp
value was plotted as a function of the inhibitor concentration [I] to determine the rate
constants kon (in M‐1s‐1) and koff (in s
‐1) according to:

75
kapp = kon [I] + koff Eqn. (2)
The relation between the V(I)/V(0) ratio and the inhibitor concentration was fitted to
the following function:
V(I)/V(0) = vr + (1‐vr)/(1+ [I]/Kd) Eqn. (3)
where vr is the inhibitor‐insensitive fraction of V(0) (always lower than 5%).
Theoretically, Kd should be equal to the koff/kon ratio. koff was also directly calculated
using the following linear relationship between 1/kapp and V(I)/V(0), drawn from Eqns.
(1) and (3):
V(I)/V(0) = vr + (1‐vr) koff / kapp Eqn. (4)
In all of the experiments, the inhibitor concentration was much higher than the
enzyme concentration. Therefore the total and free concentrations of inhibitor could
be considered identical and constant during the kinetics of inhibition. One experiment
consisted in a set of at least ten kinetics obtained with different IF1 concentrations.

76
Chapter 3. Results and Discussions

77

78
3. Results and Discussions
3.1. Analyses of published X‐ray crystallographic structures of F1‐ATPase
In the protein data bank, we can find a lot of valuable studies about ATPase X‐
Ray diffractions. Those X‐ray crystallographic structures give access to further studies
of their functions and mechanisms. In this work, analyses of published X‐ray
crystallographic structures of F1‐ATPase helped us to visualize possible contacts
between protein subunits at an amino acid level. This was also one important point of
our mutation choices. In this chapter, I am going to show our analyses of bovine and
yeast crystal structures, images and measurements.
3.1.1. Bos taurus F1‐ATPase crystal structures, with or without IF1
Bovine mitochondrial F1‐ATPase has been widely studied. 66% of the published
radiocrystallographic F1‐ATPase structures belong to Bos taurus. The X‐ray diffraction
varies from a large resolution over 3 Å to 1.9 Å. The following structures are models of
bovine mitochondrial F1‐ATPase with and without IF1 bound corresponding to pdb files
2v7q and 1e79 respectively (Gibbons et al, 2000; Gledhill et al, 2007a).
Bovine mitochondrial F1‐ATPase consists of the crown‐like catalytic core, 3 pairs
of α/β subunits (stator), the central shaft gamma subunit, and delta, epsilon subunits
(rotor). The inhibitor protein IF1 inserts in one catalytic pair of αβ subunits. Crystal
structures are shown in figure 27. Target residues of this work are highlighted in
sphere. Top views (seeing from the top of Fo part) of the enzyme (c, d) show the three
catalytic pairs of αβ subunits in ribbon with their names and orientations, and γ
subunit in the centre. The three catalytic αβ interfaces are in different conformations.
These interfaces are named (αβ)TP, (αβ)DP and (αβ)E. This nomenclature was given
according to the catalytic nucleotide occupancy (ATP analogue, ADP or empty) in the
first published structure (Abrahams et al, 1994). And it refers more generally to the
rotor orientations even in the absence of nucleotides (Kabaleeswaran et al, 2009). Side

79
views of the enzyme (a, b) show the (αβ)DP catalytic interface of bovine F1‐ATPase, as
well as IF1 inserting site. In most of IF1‐free bovine crystals (e.g. pdb files 1bmf, 1e79
and 2jdi for F1‐ATPase, 2xnd for C8‐F1‐ATPase), F1‐ATPases have similar conformations
(Abrahams et al, 1994; Bowler et al, 2007; Gibbons et al, 2000; Watt et al, 2010). In the
inhibited complex, IF1 midpart is inserted in the (αβ)DP catalytic interface. Its N‐
terminal part mainly interacts with the central axis of γ subunit, and also with αE
subunit. The C‐terminal part is truncated. IF1 containing residues 1‐60 was solved only
with residues 8‐50 (Gledhill et al, 2007a). The minimal inhibitory sequence 14‐47 (van
Raaij et al, 1996b) is included in the visible part.
Bovine F1‐ATPase crystal structure used to be the most similar and comparable
reference to our model yeast, before the recently crystallised yeast IF1 inhibited F1‐
ATPase coming out in March 2013 (Robinson et al, 2013). Therefore, the basic
structural analysis and site‐directed mutagenesis in this work was carried out with help
of bovine crystal structures and sequence alignment of bovine and yeast ATP
synthases.
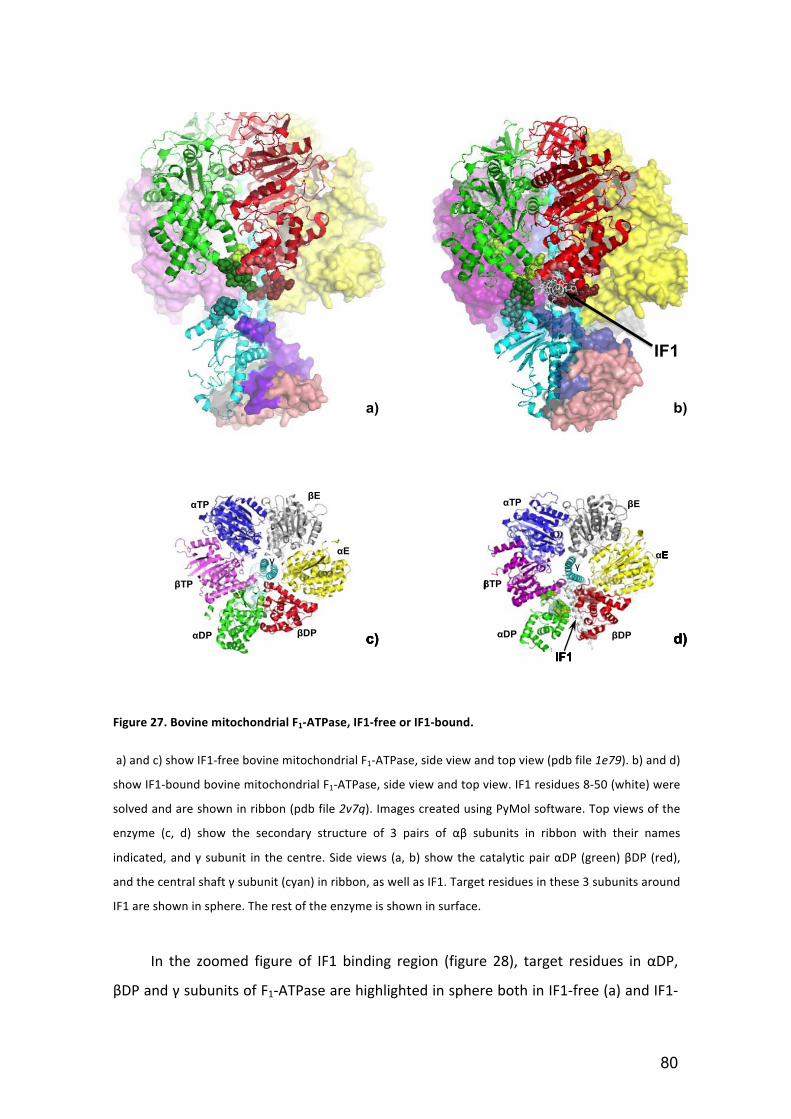
80
a) b)
αDP βDP
βE
βTP
αE
αTP
γ
αDP βDP
βE
βTP
αE
αTP
γ
IF1
c) d)
IF1
a) b)
αDP βDP
βE
βTP
αE
αTP
γ
αDP βDP
βE
βTP
αE
αTP
γ
IF1
c) d)
a) b)
αDP βDP
βE
βTP
αE
αTP
γ
αDP βDP
βE
βTP
αE
αTP
γ
αDP βDP
βE
βTP
αE
αTP
γ
IF1
αDP βDP
βE
βTP
αE
αTP
γ
IF1
c) d)
IF1
Figure 27. Bovine mitochondrial F1‐ATPase, IF1‐free or IF1‐bound.
a) and c) show IF1‐free bovine mitochondrial F1‐ATPase, side view and top view (pdb file 1e79). b) and d)
show IF1‐bound bovine mitochondrial F1‐ATPase, side view and top view. IF1 residues 8‐50 (white) were
solved and are shown in ribbon (pdb file 2v7q). Images created using PyMol software. Top views of the
enzyme (c, d) show the secondary structure of 3 pairs of αβ subunits in ribbon with their names
indicated, and γ subunit in the centre. Side views (a, b) show the catalytic pair αDP (green) βDP (red),
and the central shaft γ subunit (cyan) in ribbon, as well as IF1. Target residues in these 3 subunits around
IF1 are shown in sphere. The rest of the enzyme is shown in surface.
In the zoomed figure of IF1 binding region (figure 28), target residues in αDP,
βDP and γ subunits of F1‐ATPase are highlighted in sphere both in IF1‐free (a) and IF1‐

81
bound (b) structures. IF1 is presented in white ribbon, with its side chains. IF1 binding
site is well visualized, as well as the protein conformational changes before and after
IF1 binding (see below). Our target residues in αDP, βDP subunits around IF1 are
mainly classified in four groups according to their positions with respect to the foot of
γ subunit. Classification and mutations of the four groups in this work will be described
in detail in yeast structural analysis.
a) b)
IF1
a) b) a) b)
IF1
Figure 28. Zoom of IF1 binding region in bovine mitochondrial F1‐ATPase.
a) IF1‐free bovine mitochondrial F1‐ATPase. pdb file 1e79. b) IF1‐bound bovine mitochondrial F1‐ATPase
pdb file 2v7q. Both images are zoomed in IF1 binding region. Target residues in αDP, βDP and γ subunits
are shown in sphere. In αDP subunit, amino acids E355, Y397, R398, V400, and Q416 are shown on top
left in limon green; the loop 407GSDLDAAT
414 is shown in forest green on the left, note that in panel b)
only 410LDAAT
414 are visible in the IF1‐bound crystal. In βDP subunit, amino acids D380, S383, D471, and
A474 are shown on top right in salmon red; the lower loop 394DELSEED
400 is shown in ruby red. In γ
subunit, amino acids S114, I115, L116, H117 and R118 are shown on bottom left in dark cyan. Images
created using PyMol software.
In αDP subunit (figure 28), a and b, lines and spheres in green), the first group
contains amino acids E355, Y397, R398, V400 and Q416 shown on top left in limon
green. In βDP subunit, the second group of amino acids D380, S383, D471 and A474 is
shown on top right in salmon red. The two groups of residues locates inside the crevice
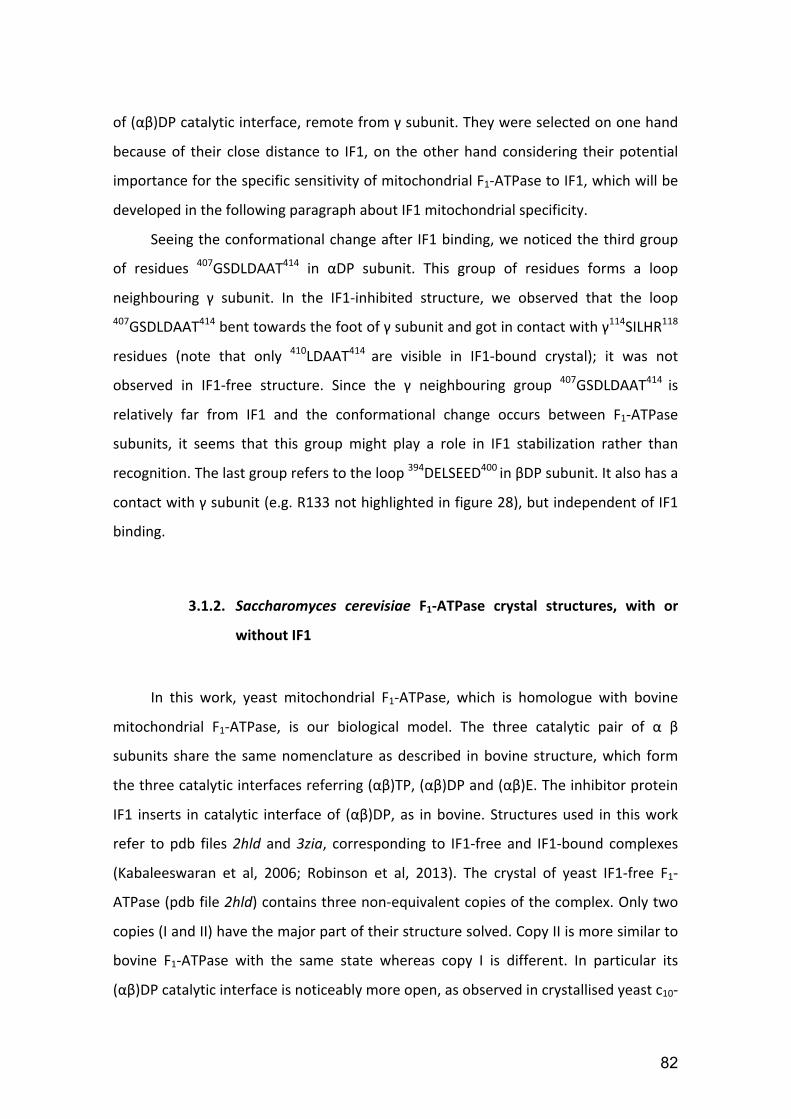
82
of (αβ)DP catalytic interface, remote from γ subunit. They were selected on one hand
because of their close distance to IF1, on the other hand considering their potential
importance for the specific sensitivity of mitochondrial F1‐ATPase to IF1, which will be
developed in the following paragraph about IF1 mitochondrial specificity.
Seeing the conformational change after IF1 binding, we noticed the third group
of residues 407GSDLDAAT414 in αDP subunit. This group of residues forms a loop
neighbouring γ subunit. In the IF1‐inhibited structure, we observed that the loop
407GSDLDAAT414 bent towards the foot of γ subunit and got in contact with γ114SILHR118
residues (note that only 410LDAAT414 are visible in IF1‐bound crystal); it was not
observed in IF1‐free structure. Since the γ neighbouring group 407GSDLDAAT414 is
relatively far from IF1 and the conformational change occurs between F1‐ATPase
subunits, it seems that this group might play a role in IF1 stabilization rather than
recognition. The last group refers to the loop 394DELSEED400 in βDP subunit. It also has a
contact with γ subunit (e.g. R133 not highlighted in figure 28), but independent of IF1
binding.
3.1.2. Saccharomyces cerevisiae F1‐ATPase crystal structures, with or
without IF1
In this work, yeast mitochondrial F1‐ATPase, which is homologue with bovine
mitochondrial F1‐ATPase, is our biological model. The three catalytic pair of α β
subunits share the same nomenclature as described in bovine structure, which form
the three catalytic interfaces referring (αβ)TP, (αβ)DP and (αβ)E. The inhibitor protein
IF1 inserts in catalytic interface of (αβ)DP, as in bovine. Structures used in this work
refer to pdb files 2hld and 3zia, corresponding to IF1‐free and IF1‐bound complexes
(Kabaleeswaran et al, 2006; Robinson et al, 2013). The crystal of yeast IF1‐free F1‐
ATPase (pdb file 2hld) contains three non‐equivalent copies of the complex. Only two
copies (I and II) have the major part of their structure solved. Copy II is more similar to
bovine F1‐ATPase with the same state whereas copy I is different. In particular its
(αβ)DP catalytic interface is noticeably more open, as observed in crystallised yeast c10‐

83
F1‐ATPase (pdb file 3zry) (Dautant et al, 2010). After analysing the structures, we
basically consider the copy II of pdb file 2hld as the most probable conformation of
yeast IF1‐free F1‐ATPase in this current work. And it is used through the whole study
except for special indications. The crystallographic structures of yeast IF1‐bound F1‐
ATPase discussed here is the lately published 3zia. (Robinson et al, 2013). The latter
contains two copies that are quite similar. This is the first published structure of yeast
IF1‐bound F1‐ATPase. Before this, our structure analyses of IF1 inhibited F1‐ATPase of
yeast was series of work including analyses of yeast IF1‐free structure, analyses of
yeast homologue structures (specially bovine crystal structures +/‐IF1), sequence
alignment and simulation of yeast IF1‐bound structure. Since bovine and yeast crystal
structures are quite similar, most of the analyses in bovine adapt well in yeast. A few
reasonable distance changes will be compared between the two crystals and discussed
in following paragraphs.
Presentations of yeast crystal structures are shown in figure 29. Target residues
of this work are highlighted in sphere. Top views of the enzyme (c, d) show the three
catalytic pairs of αβ subunits in ribbon with their names and orientations, and γ
subunit in the center. Side views of the enzyme (a, b) show the (αβ)DP catalytic
interface of yeast F1‐ATPase, as well as IF1 inserting site. In the inhibited complex, IF1
midpart is inserted in the (αβ)DP catalytic interface. Its N‐terminal part mainly
interacts with the central axis of γ subunit, similar as in bovine structure. The
difference from bovine IF1 is that this time yeast IF1 was fully expressed but the C‐
terminal part was partially solved. The full length of yeast IF1 is 63aa, only 1‐36 were
solved in this crystal (Robinson et al, 2013). The C‐terminal protruding part is
unfortunately invisible in the crystal.

84
Figure 29. Yeast mitochondrial F1‐ATPase, IF1‐free or IF1‐bound.
a) and c) show IF1‐free yeast mitochondrial F1‐ATPase, side view and top view. pdb file 2hld. b) and d)
show IF1‐bound yeast mitochondrial F1‐ATPase, side view and top view. IF1 residues 1‐36 (white) were
solved and are shown in ribbon. pdb file 3zia. Images created using PyMol software. Top views of the
enzyme (c, d) show the 3 pairs αβ subunits in ribbon with their names and orientations, and γ subunit in
the center. Side views (a, b) show the catalytic pair αDP (green) βDP (red), and the central shaft γ
subunit (cyan) in ribbon, as well as IF1. Target residues in these 3 subunits around IF1 are shown in
sphere. The rest of the enzyme is shown in surface.

85
In the zoomed figure of IF1 binding region (figure 30), target residues in αDP,
βDP and γ subunits of F1‐ATPase are highlighted in sphere both in IF1‐free (a) and IF1‐
bound (b) structures. IF1 is presented in white ribbon, with its side chains in sticks. IF1
binding site is well visualized, as described in bovine case. Our target residues in αDP,
βDP subunits around IF1 are mainly classified in four groups A, B, C and D with
according to their positions to γ subunit with respect of bovine structure analyses.
a) b)
A
B
CD
IF1
a) b) a) b)
A
B
CD
IF1
Figure 30. Zoom of IF1 binding region in yeast mitochondrial F1‐ATPase.
a) IF1‐free yeast mitochondrial F1‐ATPase. pdb file 2hld copy II. b) IF1‐bound yeast mitochondrial F1‐
ATPase pdb file 3zia. Both images are zoomed in IF1 binding region. Target residues in αDP, βDP and γ
subunits are shown in sphere. In αDP subunit, amino acids E357, Y399, R400, V402 and Q418 are shown
on top left in limon green, named as group A; the loop 409GSDLDAST
416 is shown in forest green on the
left named as group C. In βDP subunit, amino acids T380, S383, E471, and A474 are shown on top right
in salmon red, named as group B; the lower loop 394DELSEQD
400 is shown in ruby red, named as group D.
In γ subunit, amino acids M116, Q117 and L118 are shown on bottom left in dark cyan. Note that in the
case of IF1‐free F1‐ATPase a), γ‐Q117 and L118 are not visible, which makes the evaluation of their
proximity to group C residues difficult.
Group A and B contain selected residues from αDP, βDP subunits which are
remote from the foot of γ subunit. Group A consists of αDP‐E357, Y399, R400, V402
and Q418; whereas group B consists of βDP‐T380, S383, E471, and A474. The two
groups of residues locate in the catalytic interface facing IF1, which caught our first

86
attention. Furthermore, among all the amino acid around IF1, those were selected
considering their potential importance for the specific sensitivity of mitochondrial F1‐
ATPase to IF1. With the help of sequence alignment between a large variety of species
(see paragraph 3.1.3 figure 31 and 32), we found that around IF1 binding area some
particular amino acids were highly conserved in mitochondrial ATP synthases but quite
different in non‐mitochondrial ATP synthases, such as our group A and B. This
observation was linked to the IF1 inhibition test in vitro, which showed that IF1 from
any species could inhibit other mitochondrial ATPases but had no effect to bacterial or
chloroplast ATPases (Cabezon et al, 2002). Experiments in our lab also confirmed this
observation (shown in figure 36), which will be discussed in paragraph 3.2.1.
Therefore, site‐directed mutagenesis was performed to mutate residues in group A
and B into their non‐mitochondrial counterparts (details in 3.2.1). Group A, αDP‐
E357D, Y399F, R400A, V402L and Q418N; Group B, βDP‐T380R, S383E, E471K, and
A474E. Kinetic studies on the effect of mutations were then carried on.
Group C and D are γ subunit neighbouring residues selected from αDP, βDP
subunits. Group C is a loop with αDP‐409GSDLDAST416, whereas Group D consists of
βDP‐394DELSEQD400. They are both located around IF1 at first place, and also very close
to the foot of γ subunit. Group C has been observed being relatively close and getting
contact with γ116MQLL119 with IF1 bound (Figure 30). On one hand, this α‐γ contact
only appears with IF1 bound in bovine case, which makes this group of residues
interesting in a sense of link with IF1 binding process. On the other hand, it is difficult
to measure and compare their distance precisely in yeast case since there are two
residues missing (γ‐Q117, γ‐L118). But with the visible residues, such as γ‐M116, the
measurements suggest that the α‐γ contact exists all the time in yeast case. Therefore,
these residues in group C were mutated gradually into glycine in order to reduce the
steric hindrance. Group D has been widely studied. It is known as β‐DELSEED motif in
most species, and it periodically interacts with γ subunit during catalytic turnover
(Duncan et al, 1995). It is revealed involving in coupling catalysis to γ subunit rotation
(Hara et al, 2000; Mnatsakanyan et al, 2009; Tanigawara et al, 2012). It has also been
proposed to play a role in the inhibitory effect of the bacterial regulatory ε subunit

87
(Hara et al, 2001), which is the counterpart of mitochondrial δ subunit. Moreover, it
has a close distance with IF1 in the inhibited complex. With the same consideration as
group C, glycine substitutions were made for group D. Details in mutations of both
group C and D will be discussed later.
Comparing the structures with or without IF1, we could see not only the IF1
binding site, but also the conformational change of the protein complex. However, the
crystal structure of the inhibited F1‐ATPase shows only the dead‐end state of the
complex. The initial recognition step between F1‐ATPase and IF1 remains unknown.
The limit of structure studies would be overcome by the combination of mutagenesis
and kinetic approach, which we will discuss in following paragraphs.
3.1.3. Sequence alignment on α and β subunits of mitochondrial and
non‐mitochondrial ATP synthases
Sequence alignments on ATP synthase α and β subunits between different
species are presented in figure 31 and 32. Sequences containing selected residues are
shown with different colours representing conservation degrees. F1Fo ATP synthases
from either mitochondrial or non‐mitochondrial families share a number of common
sequences that assure their basic functions in common. At the same time, some highly
conserved residues are found in mitochondrial ATP synthases. In this work, we are
interested in residues highly conserved only in mitochondrial family that are related to
the interaction with IF1, such as group A and B described above. In addition, our
groups C and D are also very well conserved, not only in mitochondrial family but also
in some non‐mitochondrial species (details shown in figure 31 and 32). The similarity
of crucial sequences shared by ATP synthases from different species allows the
comparison and discussion of our work and previous studies in the same domain.
Moreover, by means of sequence alignment, we confirmed the compatibility between
bovine and yeast structures in our work.

88
352 363 395 423
Mitochondria
Non‐mitochondrial
396
352 363 395 423
Mitochondria
Non‐mitochondrial
352 363 395 423
Mitochondria
Non‐mitochondrial
396
Figure 31. Sequence alignment on α subunit of mitochondrial and non‐mitochondrial ATP synthases.
Sequence alignment was done with Jalview software using MAFFT alignment program. The above
numbering is related to Saccharomyces cerevisiae α subunit. Sequences from residues 352 to 363 and
from 396 to 423 are shown. 42 sequences of mitochondrial and non‐mitochondrial (chloroplastic and
bacterial) α‐subunits were compared. Percentage identity is shown in blue. Dark blue, the most
conserved residues; Light blue, the less conserved residues; Red, γ‐remote residues corresponding to
group A residues E357, Y399, R400, V402 and Q418; Grey, γ‐neighboring residues corresponding to
group C α‐SDLDAST.

89
Mitochondria
Non‐mitochondrial
378 402 463 478
Figure 32. Sequence alignment on β subunit of mitochondrial and non‐mitochondrial ATP synthase.
Sequence alignment was done with Jalview software using MAFFT alignment program. The above
numbering is related to Saccharomyces cerevisiae β subunit. Sequences from residue 378 to 402 and
from 463 to 478 are shown. 42 sequences of mitochondrial and non‐mitochondrial beta subunit were
compared. Percentage identity is showed in blue. Dark blue, the most conserved residues; Light blue,
the less conserved residues; Red, γ‐remote residues corresponding to group B residues T380, S383, E471
and A474; Grey, γ‐neighboring residues corresponding to group D β‐DELSEQD.

90
3.1.4. Kinetic parameters
Kinetic approach is the method that we used in this work to investigate IF1
binding to F1‐ATPase. Kinetic parameters obtained from different experiments helped
us to analyze step‐by‐step IF1 inhibition of F1‐ATPase. The calculations are detailed in
Material and Methods.
The rate constant of association kon is related to the IF1 recognition step,
whereas the kinetic constants of dissociation, Kd and koff, are inversely related to the
stability of the inhibited complex. Figure 33 shows one example of determination of
these constants from experimental data. The residual activity observed in kinetic
experiments which refers to the ATP hydrolysis activity resisting to IF1 inhibition is
shown in figure 33 as vr. This residual activity was observed especially in non‐
centrifuged SMP, which will be discussed in paragraph 3.1.5 SMP centrifugation.

91
Figure 33. Experimental determination of IF1 binding parameters to SMP WT.
Conditions are as described in Material and Methods, pH6.5. Experimental data of SMP WT shown in the
figure are the average of 29 single experiments. Panel a, rate constant of inhibition (kapp) as a function of
IF1 concentration, used as kon determination. Panel b, normalized ATPase activity at equilibrium as a
function of IF1 concentration, used as Kd determination. Panel c, normalized ATPase activity at
equilibrium as a function of 1/kapp, used as koff determination. Equations used as data calculation are
indicated beside the figure (details see Materials and methods). Resulting value of IF1 binding
parameters: kon= 4.3 105 M
‐1s‐1, Kd= 0.24 10
‐9 M, and koff= 1.8 10
‐4 s‐1.
It has been shown that the measured association rate constant kon of IF1
depends on MgATP concentration (Milgrom Ya, 1989), because it is actually modulated
by the nucleotide occupancy and the catalytic turnover of F1‐ATPase (Corvest et al,
2007; Corvest et al, 2005). As shown in figure 34 panel a, kapp for IF1 binding increases
with MgATP concentration and also with the filling of two catalytic sites. It reaches a
peak when enzymes have a competition of two catalytic sites occupied and three sites
occupied, and IF1 locking is more favoured than its release. When ATPases have all

92
three sites occupied, their ATP hydrolysis achieves the maximal level (Weber et al,
1996), whereas IF1 binding rate slightly decreases and reaches an equilibrium plateau
where it represents the real rate binding constant. A similar preliminary experiment
testing IF1 inhibition on function of MgATP concentration was performed using yeast
SMP WT in this work (figure 34, panel b). We observed the same IF1 binding feature.
So these results helped us to fix our experimental condition for MgATP concentration
at 1 mM, with which the kon value reaches the plateau.
a) b)
Figure 34. Experimental determination of IF1 binding parameters to MF1 WT (Corvest et al, 2007;
Corvest et al, 2005), and SMP WT.
Panel a, apparent rate constant of IF1 binding (‐‐) as a function of MgATP concentration. Apparent
binding rate constant, equivalent to kon, was obtained by dividing the apparent rate constant of
inhibition (kapp) by IF1 concentration (75 nM). The two dashed curves represent the proportion of the
F1‐ATPases with two (left curve) and three (right curves) bound nucleotides. Experiments were
performed with yeast MF1 WT and IF1, at pH 6.5, 25°C. Panel b, rate constant of IF1 inhibition kon (‐□‐)
as a function of MgATP concentration. kon was obtained by dividing the apparent rate constant of
inhibition (kapp) by IF1 concentration (50 nM). Here the residual activity vr was introduced to calculate
the kon value. Experiment was performed with yeast SMP WT and IF1, at pH 8, 25°C.

93
For the koff value, it used to be estimated only by the Kdkon product as described
in previous studies (Andrianaivomananjaona et al, 2011; Bason et al, 2011; Robinson et
al, 2013). However, we defined in this work the koff value by directly correlating kapp to
the residual activity at equilibrium (see Materials and methods, Eqn. 4). This method of
koff determination turns out to be insensitive to possible uncertainties on IF1
concentrations. For all the mutants we investigated, the koff values were calculated in
both ways and compared, so that the results would be more reliable.
3.1.5. SMP centrifugation
In order to carry out the kinetic approach, mitochondria were sonicated into
SMP. The inner membrane would enclose in a way that statistically half materials could
turn inside out, so that the ATP synthase could be exposed to the environment and are
accessible to the inhibitor. At the same time, SMP were incubated in the alkaline
buffer (pH 8.5) overnight at 4°C in order to facilitate the release of endogenous IF1. In
the previous studies, SMP were directly used at this step. Experimental condition of
most kinetics is at pH 6.5, 25°C except for a few experiments with indications. Since
the SMP injection in the measuring spectroscopic cuvette is extremely small volume
(2.5 to 5 µL comparing to the total volume 1mL), the effect of aliquot pH as well as the
contaminant endogenous IF1 are negligible. However, we always observed some
residual activities of ATP hydrolysis. For instance, in figure 35‐b1, the ATP hydrolysis
activity of non‐centrifuged SMP (‐□‐) kept always some certain resistance to IF1
inhibition even with a saturating IF1 concentration and long enough operating time
(from 30 to 120 min for some single experiments). This observation of residual activity
of ATP hydrolysis could be due to the enzyme partial resistance to IF1 inhibition, which
could be important for IF1 binding mechanism. It could also be due to the impurity of
SMP samples, partially degradation of the enzyme or the miss enclosure of SMP with
enzyme wrapping inside, etc. Therefore, in this study we added two extra
centrifugations before applying the SMP. One first centrifugation of SMP sample was
at low speed (8000xg, 4°C) in order to eliminate big impure elements such as degraded

94
membranes. One second centrifugation of the supernatant was at high speed
(100,000xg, 4°C) in order to eliminate small contaminant elements such as
endogenous IF1, or the membrane dissociated F1‐ATPase. We improved the SMP
purification with these two steps of centrifugation expecting minimizing the impurity‐
caused residual activity. Figure 35‐a‐b‐c shows two examples of kinetic experiments
comparing centrifuged or non‐centrifuged SMP.
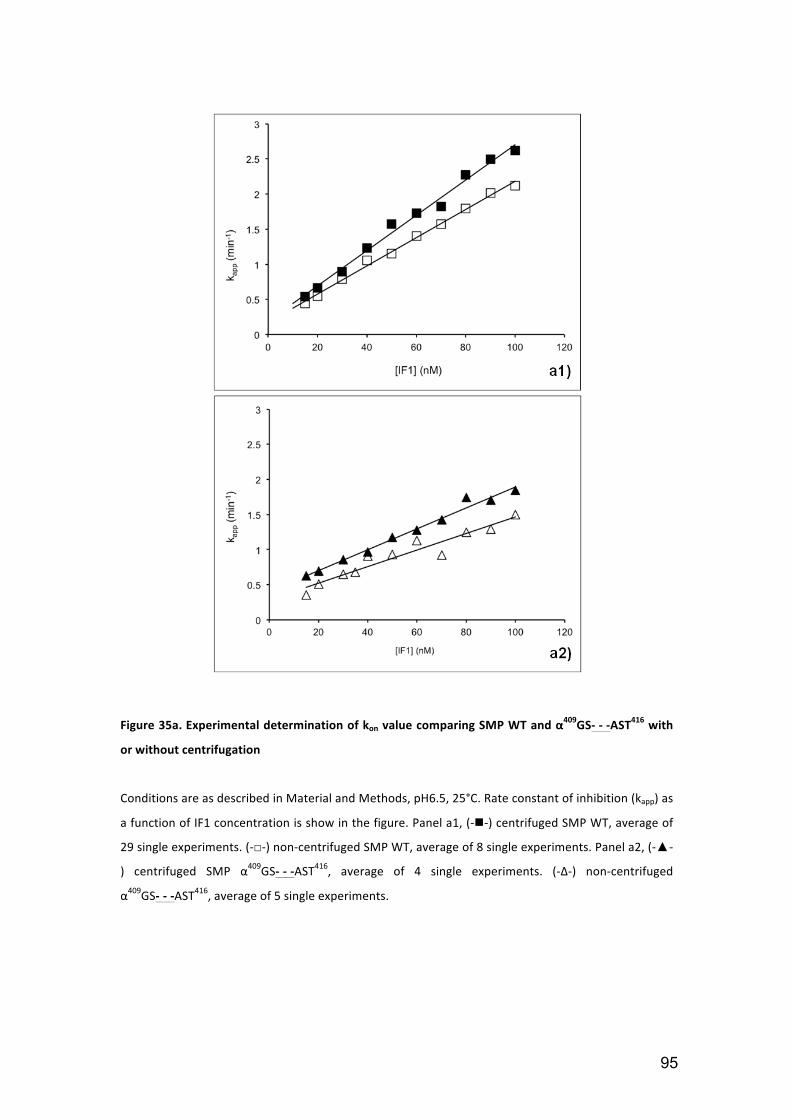
95
Figure 35a. Experimental determination of kon value comparing SMP WT and α409GS‐ ‐ ‐AST416 with
or without centrifugation
Conditions are as described in Material and Methods, pH6.5, 25°C. Rate constant of inhibition (kapp) as
a function of IF1 concentration is show in the figure. Panel a1, (‐‐) centrifuged SMP WT, average of
29 single experiments. (‐□‐) non‐centrifuged SMP WT, average of 8 single experiments. Panel a2, (‐▲‐
) centrifuged SMP α409GS‐ ‐ ‐AST416, average of 4 single experiments. (‐Δ‐) non‐centrifuged
α409GS‐ ‐ ‐AST416, average of 5 single experiments.
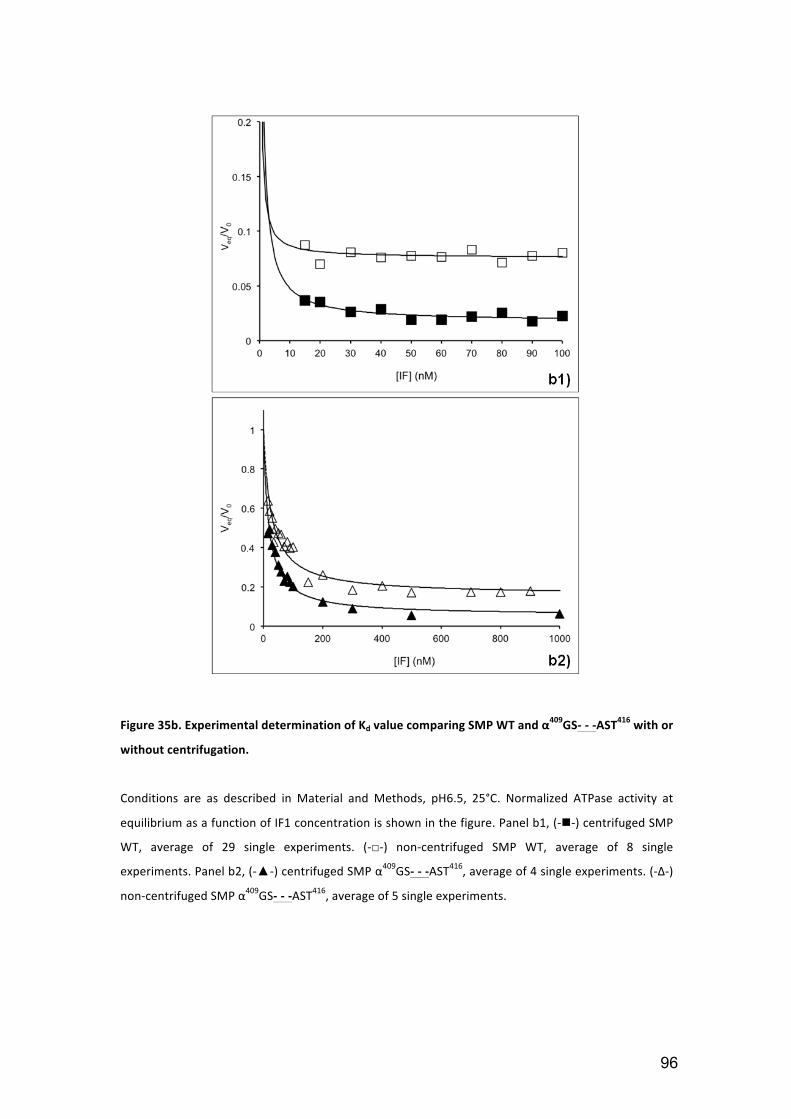
96
Figure 35b. Experimental determination of Kd value comparing SMP WT and α409GS‐ ‐ ‐AST416 with or
without centrifugation.
Conditions are as described in Material and Methods, pH6.5, 25°C. Normalized ATPase activity at
equilibrium as a function of IF1 concentration is shown in the figure. Panel b1, (‐‐) centrifuged SMP
WT, average of 29 single experiments. (‐□‐) non‐centrifuged SMP WT, average of 8 single
experiments. Panel b2, (‐▲‐) centrifuged SMP α409GS‐ ‐ ‐AST416, average of 4 single experiments. (‐Δ‐)
non‐centrifuged SMP α409GS‐ ‐ ‐AST416, average of 5 single experiments.

97
Figure 35c. Experimental determination of koff value comparing SMP WT and α409GS‐ ‐ ‐AST416 with
or without centrifugation.
Conditions are as described in Material and Methods, pH6.5, 25°C. Normalized ATPase activity at
equilibrium as a function of 1/kapp is shown in the figure. Panel c1, (‐‐) centrifuged SMP WT, average
of 29 single experiments. (‐□‐) non‐centrifuged SMP WT, average of 8 single experiments. Panel c2,
(‐▲‐) centrifuged SMP α409GS‐ ‐ ‐AST416, average of 4 single experiments. (‐Δ‐) non‐centrifuged SMP
α409GS‐ ‐ ‐AST416, average of 5 single experiments.

98
Results show that centrifuged SMP, both from WT and mutant . α409GS‐ ‐ ‐AST416
, have a lower residual activity of ATP hydrolysis. In the case of non‐centrifuged SMP,
the example of the mutant α409GS‐ ‐ ‐AST416 reached 19% whereas the centrifugation
decreased the residual to 5.8%. The SMP WT also had an important decrease of
residual activity from 7.6% to 1.6% after the centrifugation. Same phenomenon was
observed in all the mutants. At high concentration of IF1, ATP hydrolysis was inhibited
more completely with centrifuged SMP, which is to say the residual activity stays
between 1% to 10%. As a result, the residual activity is considered to be an artifact.
In addition, the kon increased about 25% for both WT and mutant
α409GS‐ ‐ ‐AST416 , after centrifugation. The increase stays in a reasonable range. The
same type of slight increase of kon was observed with almost all the mutants. It could
be simply variation of individual experiments. It could also be related to the residual
activity. On presence of the residual activity, it gave impression that it took more time
for IF1 to inhibit the enzyme, which could be a possible cause of the slightly lower kon.
Or, if the centrifugation of SMP has an effect on kon, it is probably due to the
elimination of the impurity of the sample including partially degraded ATPases, so that
IF1 binding becomes more efficient. In the case of koff values, the given examples
showed increases of different level. But for the rest of mutants in this work, the
modifications of koff seem more random, which is to say that the increase or decrease
of koff (as well as none changed cases) do not follow one same logic. However, with the
centrifuged SMP, we have done big amounts of kinetic experiments for each mutant
and WT, among which slight variations of kinetic parameters always existed even with
the same preparation of SMP sample. As a matter of fact, all the data showed
relatively reproducible results, which were not far away from non‐centrifuged ones
(except for the residual activities). We consider that the minor variation of kon, koff
values after additional SMP centrifugation do not affect the quality of our functional
experiments.
Finally, since this work, we improved our protocol of SMP preparation by adding
two extra centrifugations before doing kinetic experiments. The centrifugation

99
improved effectively the experimental conditions of IF1 inhibition. All the data shown
in this work were obtained by centrifuged SMP.
3.2. Specificity of mitochondrial ATPase inhibition by IF1
3.2.1. Original study of IF1 specificity
Studies of ATP synthase specificity to its inhibitor at a molecular level have been
published. It has been shown that some ATP synthase inhibitors specificity depends on
one or a group of critical residues, which are in charge of the molecular recognition of
their inhibitors. Modifications of these residues could effectively turn enzyme
insensitive of their inhibitors. For instance, the aurovertin sensitivity of mitochondrial
and E. coli F1‐ATPases is due to a single residue of β subunit, β‐R398 (Lee et al, 1989).
Structural study of aurovertin B inhibited bovine F1‐ATPase showed that aurovertin
interacted with β‐R412 (van Raaij et al, 1996a), the homologue of E. coli β‐R398.
Another good example is tentoxin. The tentoxin sensitivity of chloroplast and PS3
bacillus F1‐ATPase (Santolini et al, 2002) is owing to residue 83 of the β subunit and a
few residues of α subunits (Avni et al, 1992; Tucker et al, 2001). For instance, the
sequence SRLIESP containing residues α‐S127 to α‐P133 in spinach chloroplasts, and
the sequence TRPIESR containing α‐T126 to α‐R132 in PS3 bacillus are shown to play a
role in tentoxin sensitivity.
IF1 is a mitochondrial F1‐ATPase specific inhibitor as described in introduction.
IF1 from different species could inhibit, in vitro, any F1‐ATPase from mitochondrial
family (Cabezon et al, 2002), but not those from bacteria or chloroplast which have
their own inhibition systems (Cingolani & Duncan, 2011; Tsunoda et al, 2001). In
mitochondrial F1‐ATPase, a similar system could explain IF1 specificity. As a matter of
fact, kinetic experiments in our lab confirmed the IF1 specificity by adding a large
concentration of purified yeast IF1 during ATP hydrolysis of bacterial and chloroplast
F1‐ATPases, which were not inhibited at all, whereas 50 times less IF1 inhibited yeast
mitochondrial F1‐ATPase perfectly under the same condition (figure 36).

100
a
b
IF1
2 min
0.4
A340
0.2
A340
10 min
IF1
c
a
b
IF1
2 min
0.4
A340
0.2
A340
10 min
IF1
c
0.2
A340
10 min
0.2
A340
10 min
IF1IF1
c
!
Figure 36. Yeast IF1 inhibiting ATP hydrolysis of purified F1‐ATPases from different organisms.
Conditions are as described in Material and Methods, pH6.5, MgATP 1mM. Bacterial and chloroplast F1‐
ATPases were purified as described in previous study (Santolini et al, 2002) (Santolini et al., 2002). ATP
hydrolysis was monitored by the decrease of absorbance at 340nm. Yeast IF1 injections are indicated
by arrows. a) 10 nM PS3 bacillus F1‐ATPase (TF1) followed by injection of 5 µM yeast IF1, at 50°C; b) 1
nM Saccharomyces cerevisiae F1‐ATPase (MF1) followed by injection of 0.1 µM yeast IF1, at 25°C; c) 2
nM Spinacia oleracea chloroplast F1‐ATPase devoid of ε subunit (CF1‐ε) and pre‐treated with 5 mM
DTT, followed by injection of 5 µM yeast IF1, at 25°C.
Several years ago, in our laboratory Vincent Corvest and Yuan Luo started this
project about IF1 specificity. F1‐ATPases from different species were compared using
sequence alignment. Residues highly conserved in mitochondrial family were found
(figure 31, 32). After structural analyses, four residues located in β subunit close to IF1
were selected and mutated into their non‐mitochondrial counterpart. Two β‐subunit
residues (T380, S383) were mutated into the residues present in almost chloroplast
sequences and in a number of bacterial sequences. βE471 and βA474, located in a
region poorly conserved in the non‐mitochondrial world, were respectively mutated
into their E.coli and chloroplast homologues. Notice that by that time, crystal structure
of IF1 inhibited yeast F1‐ATPase was not resolved yet. Hence most structural analyses
were effectuated with its homologue bovine structures, and they were re‐examined in

101
the recently published yeast IF1 inhibited F1‐ATPase crystal structure. Selected
residues and their mutations are shown in table 11.
Table 11. Residues in β subunit selected for IF1 specificity study.
Selected residues located in F1‐ATPase β subunit, from bovine and yeast, are shown in the table.
Mutations of selected amino acids in yeast were made using site‐directed mutagenesis. Distance
between target residues and closest IF1 residues were measured using published bovine (pdb file: 2v7q)
and yeast (pdb file: 3zia) IF1 inhibited F1‐ATPase crystal structures.
Figure 37 shows locations of selected residues in F1‐ATPase β subunit
investigated for IF1 specificity. In bovine structure (figure 37a), IF1 8‐50 amino acids
were resolved. Measurements of distance between selected residues and IF1 are
shown to be close enough to have a possible interaction. After the yeast IF1 inhibited
F1‐ATPase published (figure 37b), we re‐examined the distance and compared to their
bovine homologue. The distances remained relatively close except for that yeast IF1
had only 1‐36 amino acids resolved, so that IF1 closest residues to β‐E471 and β‐A474
were not visible.

102
Figure 37. Bovine and yeast crystal structures showing the selected residues in F1‐ATPase β subunit for
IF1 specificity study.
IF1 is shown in helix, white ribbon with its side chains in sticks. Selected residues located in F1‐ATPase β
subunit are shown in red sticks. Their closest IF1 residues are highlighted in blue, and the distances
between them are measured and shown, see also in table 11. Panel a, bovine IF1 with 8‐50 amino acids
solved from pdb file 2v7q. Panel b, yeast IF1 with 1‐36 amino acids solved from pdb file 3zia, in which the
closest residues to β‐E471, A474 are not visible. Images created using PyMol software.
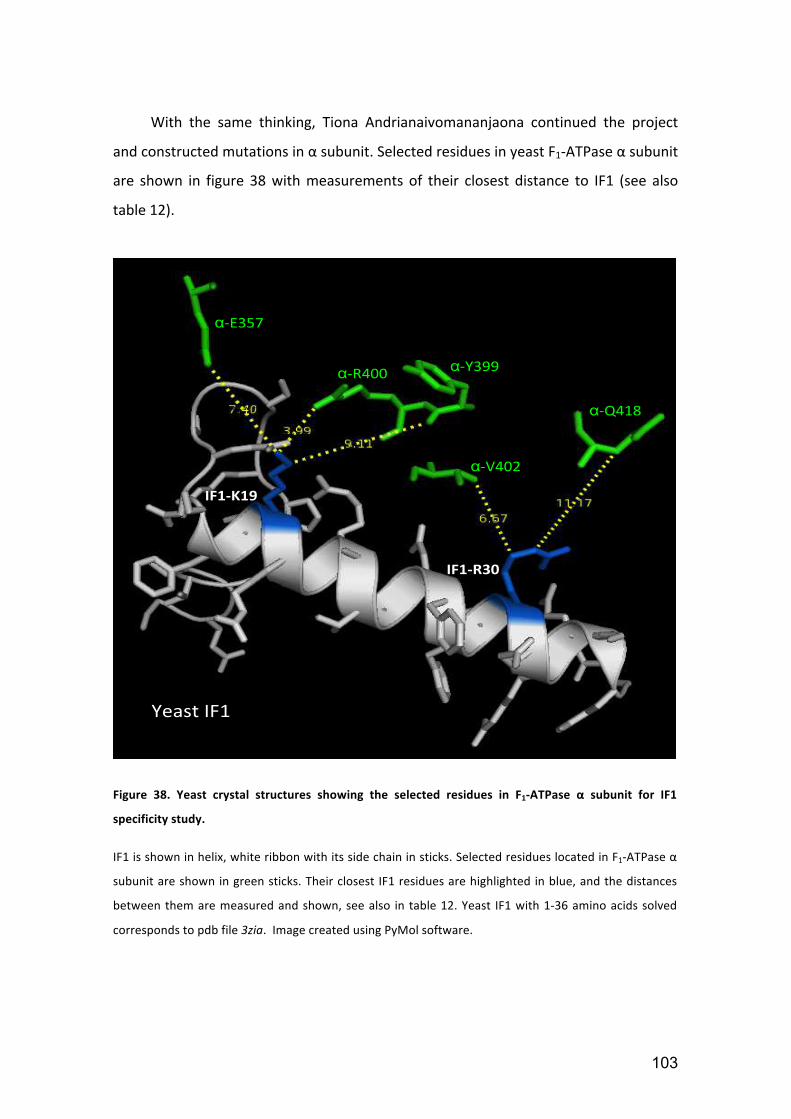
103
With the same thinking, Tiona Andrianaivomananjaona continued the project
and constructed mutations in α subunit. Selected residues in yeast F1‐ATPase α subunit
are shown in figure 38 with measurements of their closest distance to IF1 (see also
table 12).
Yeast IF1
α‐E357
IF1‐K19
IF1‐R30
α‐Y399α‐R400
α‐Q418
α‐V402
Yeast IF1
α‐E357
IF1‐K19
IF1‐R30
α‐Y399α‐R400
α‐Q418
α‐V402
Figure 38. Yeast crystal structures showing the selected residues in F1‐ATPase α subunit for IF1
specificity study.
IF1 is shown in helix, white ribbon with its side chain in sticks. Selected residues located in F1‐ATPase α
subunit are shown in green sticks. Their closest IF1 residues are highlighted in blue, and the distances
between them are measured and shown, see also in table 12. Yeast IF1 with 1‐36 amino acids solved
corresponds to pdb file 3zia. Image created using PyMol software.
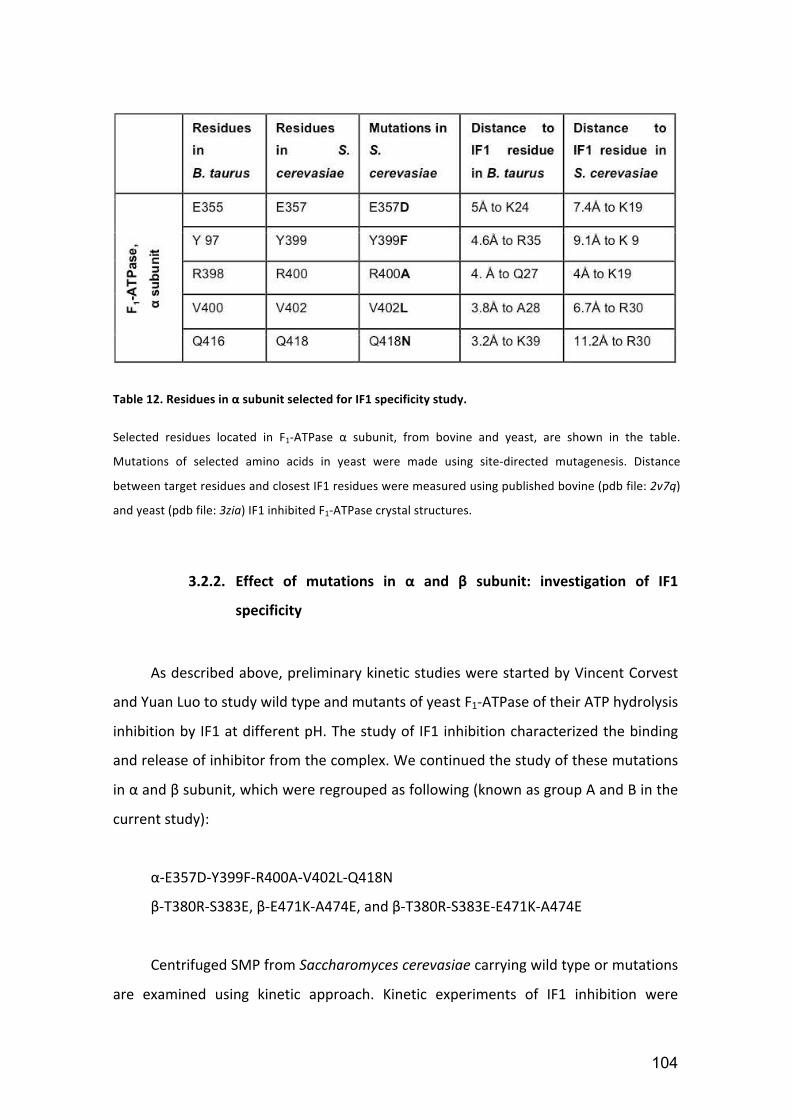
104
Table 12. Residues in α subunit selected for IF1 specificity study.
Selected residues located in F1‐ATPase α subunit, from bovine and yeast, are shown in the table.
Mutations of selected amino acids in yeast were made using site‐directed mutagenesis. Distance
between target residues and closest IF1 residues were measured using published bovine (pdb file: 2v7q)
and yeast (pdb file: 3zia) IF1 inhibited F1‐ATPase crystal structures.
3.2.2. Effect of mutations in α and β subunit: investigation of IF1
specificity
As described above, preliminary kinetic studies were started by Vincent Corvest
and Yuan Luo to study wild type and mutants of yeast F1‐ATPase of their ATP hydrolysis
inhibition by IF1 at different pH. The study of IF1 inhibition characterized the binding
and release of inhibitor from the complex. We continued the study of these mutations
in α and β subunit, which were regrouped as following (known as group A and B in the
current study):
α‐E357D‐Y399F‐R400A‐V402L‐Q418N
β‐T380R‐S383E, β‐E471K‐A474E, and β‐T380R‐S383E‐E471K‐A474E
Centrifuged SMP from Saccharomyces cerevasiae carrying wild type or mutations
are examined using kinetic approach. Kinetic experiments of IF1 inhibition were

105
performed at pH 6.5, 25°C (see description in Materials and Methods). Results for a
single IF1 concentration are shown in figure 39.
Figure 39. IF1 inhibition of wild type and mutant SMP from yeast.
Conditions are as described in Material and Methods, pH6.5, at 25°C. Wild type and mutants modifying
ATP synthase α and β subunits were expressed in yeast. Centrifuged SMP were prepared as described in
Material and Methods. ATP hydrolysis was monitored by the decrease of absorbance at 340nm. Arrow
indicates 100nM of yeast IF1 injections. a) SMP WT; b) SMP mutant α‐E357D‐Y399F‐R400A‐V402L‐
Q418N; c) SMP mutant β‐T380R‐S383E; d) SMP mutant β‐E471K‐A474E; e) SMP mutant β‐T380R‐S383E‐
E471K‐A474E.
Our data show that no mutation abolished IF1 inhibition. At a saturating
concentration of IF1, such as 100nM indicated in figure 39, it inhibited both WT and
mutants ATP hydrolysis almost 100%. Mutant α‐E357D‐Y399F‐R400A‐V402L‐Q418N
and β‐T380R‐S383E showed similar inhibition as WT (figure 39‐a, b, c), where the
inhibition occurred immediately and effectively after IF1 injection. In the case of β‐
E471K‐A474E and β‐T380R‐S383E‐E471K‐A474E (figure 39‐d, e), mutations resulted in
slowing down the inhibition. These observations are very interesting for studying IF1

106
inhibition process, more complete study and further discussion will be done in
paragraph 3.3. However, talking about IF1 specificity study here, all the mutants
maintain the sensitivity to IF1.
3.2.3. Discussion
In yeast SMP, with a saturating concentration of IF1 (100 nM), all mutants of F1‐
ATPase were totally inhibited. The results suggest that none of the selected residues
from α or β subunit are in charge of IF1 specificity to mitochondrial ATPase. The study
of IF1 specificity still remains a big question. Our hypothesis of specific recognition in
molecular level between IF1 and F1‐ATPase requires more investigation in other
residues. Since the crystal structures of IF1 inhibited complex show only the final state
of the inhibition, it is hard to imagine the whole enzyme‐inhibitor recognition process.
Maybe the specific molecular recognition occurred only in some transient step that
would be more difficult to visualize with a crystal structure. Afterall, it is quite possible
that there exist crucial residues in mitochondrial ATP synthases that are in charge of
IF1 specific recognition, seeing examples of other inhibitor cited at the beginning of
this part. In our previous work, we were concentrated in highly conserved
mitochondrial F1‐ATPase residues that had also close distances with IF1 in final state.
Further study of IF1 specificity could be on residues of F1‐ATPase highly conserved in
mitochondrial ATP synthases, but more exposed in peripheral region where possibly
occurs the first contact with IF1. Those entire hypotheses need further investigation to
confirm.
By the way, we found modifications of IF1 inhibition with some mutants. Even if
these residues are not responsible for IF1 specificity to mitochondrial F1‐ATPase, some
of them are still implicated in IF1 inhibition process shown by their mutations that
modified the inhibition rate. What roles do they play during IF1 inhibition? It is also a
very interesting question. Therefore, studies of mutants in group A and B are
regrouped with group C and D. Further examination and discussion about IF1 inhibition
process will be described as following.

107
3.3. IF1‐F1‐ATPase interaction process in Saccharomyces cerevisiae: Grasping
and locking of inhibitor IF1 by yF1‐ATPase?
3.3.1. Previous studies lead the pathway to study IF1 binding process
The regulation of mitochondrial ATP synthase by its endogenous inhibitor IF1 is a
complex mechanism. IF1 binding to the ATP synthase and inhibition of ATPase activity
are favoured by an acidic pH (pH6.5‐6.7) (Cabezon et al, 2000b). Although many X‐ray
crystal structures of the inhibited enzyme have been solved and the activity of IF1 has
been characterized, little is known of the IF1 binding process. Moreover, many
researchers have mutated individual amino acid residues of IF1 implicated in its
inhibition but not those of ATP synthase. Known a protein‐protein interaction occurs
on both proteins, it appears interesting to us to complete the study from the point of
view ATP synthase.
In order to understand the contributions of individual amino acid residues to IF1
binding, point mutations and deletions in yeast F1‐ATPase α, β, and γ subunits have
been produced and examined. Thanks to the analyses of kinetics, we characterized
different sites in yeast F1‐ATPase that participate in the initial binding event and those
that stabilize the IF1‐F1‐ATPase.
3.3.2. Group A and B: γ‐remote residues from αDP, βDP
Group A: αDP‐E357, Y399, R400, V402 and Q418
Group B: βDP‐T380, S383, E471, and A474
As defined in the previous chapter, investigation of these two groups of residues
was first oriented to the IF1 specific inhibition of mitochondrial ATPases, and then
focused on their roles during the IF1 binding process. SMP devoid of endogenous IF1
were centrifuged and kinetics of ATP hydrolysis and IF1 inhibition were carried out at
pH 6.5.
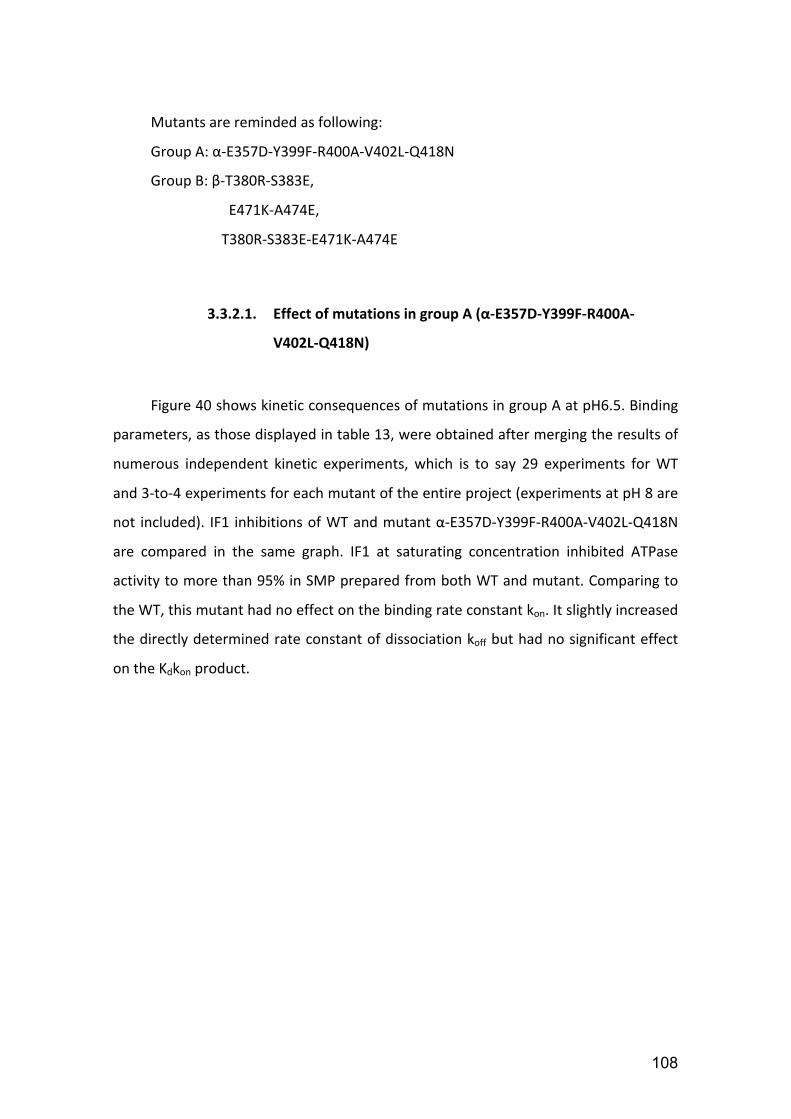
108
Mutants are reminded as following:
Group A: α‐E357D‐Y399F‐R400A‐V402L‐Q418N
Group B: β‐T380R‐S383E,
E471K‐A474E,
T380R‐S383E‐E471K‐A474E
3.3.2.1. Effect of mutations in group A (α‐E357D‐Y399F‐R400A‐
V402L‐Q418N)
Figure 40 shows kinetic consequences of mutations in group A at pH6.5. Binding
parameters, as those displayed in table 13, were obtained after merging the results of
numerous independent kinetic experiments, which is to say 29 experiments for WT
and 3‐to‐4 experiments for each mutant of the entire project (experiments at pH 8 are
not included). IF1 inhibitions of WT and mutant α‐E357D‐Y399F‐R400A‐V402L‐Q418N
are compared in the same graph. IF1 at saturating concentration inhibited ATPase
activity to more than 95% in SMP prepared from both WT and mutant. Comparing to
the WT, this mutant had no effect on the binding rate constant kon. It slightly increased
the directly determined rate constant of dissociation koff but had no significant effect
on the Kdkon product.
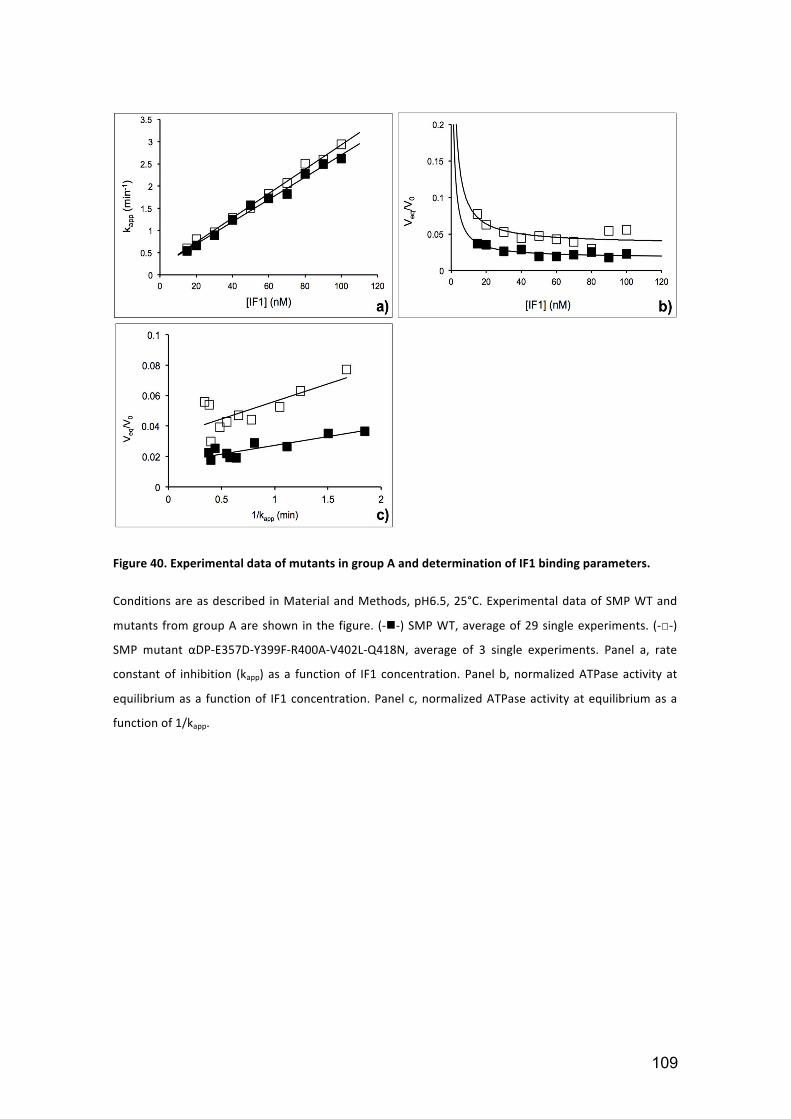
109
Figure 40. Experimental data of mutants in group A and determination of IF1 binding parameters.
Conditions are as described in Material and Methods, pH6.5, 25°C. Experimental data of SMP WT and
mutants from group A are shown in the figure. (‐‐) SMP WT, average of 29 single experiments. (‐□‐)
SMP mutant αDP‐E357D‐Y399F‐R400A‐V402L‐Q418N, average of 3 single experiments. Panel a, rate
constant of inhibition (kapp) as a function of IF1 concentration. Panel b, normalized ATPase activity at
equilibrium as a function of IF1 concentration. Panel c, normalized ATPase activity at equilibrium as a
function of 1/kapp.
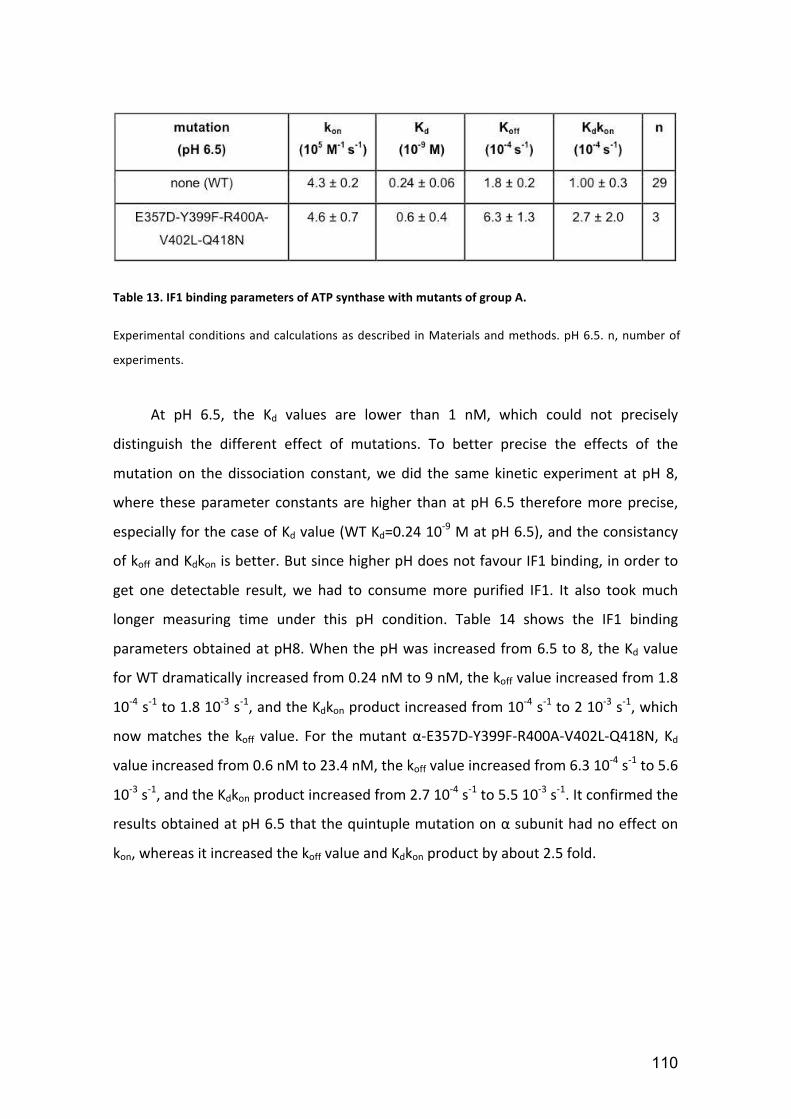
110
Table 13. IF1 binding parameters of ATP synthase with mutants of group A.
Experimental conditions and calculations as described in Materials and methods. pH 6.5. n, number of
experiments.
At pH 6.5, the Kd values are lower than 1 nM, which could not precisely
distinguish the different effect of mutations. To better precise the effects of the
mutation on the dissociation constant, we did the same kinetic experiment at pH 8,
where these parameter constants are higher than at pH 6.5 therefore more precise,
especially for the case of Kd value (WT Kd=0.24 10‐9 M at pH 6.5), and the consistancy
of koff and Kdkon is better. But since higher pH does not favour IF1 binding, in order to
get one detectable result, we had to consume more purified IF1. It also took much
longer measuring time under this pH condition. Table 14 shows the IF1 binding
parameters obtained at pH8. When the pH was increased from 6.5 to 8, the Kd value
for WT dramatically increased from 0.24 nM to 9 nM, the koff value increased from 1.8
10‐4 s‐1 to 1.8 10‐3 s‐1, and the Kdkon product increased from 10‐4 s‐1 to 2 10‐3 s‐1, which
now matches the koff value. For the mutant α‐E357D‐Y399F‐R400A‐V402L‐Q418N, Kd
value increased from 0.6 nM to 23.4 nM, the koff value increased from 6.3 10‐4 s‐1 to 5.6
10‐3 s‐1, and the Kdkon product increased from 2.7 10‐4 s‐1 to 5.5 10‐3 s‐1. It confirmed the
results obtained at pH 6.5 that the quintuple mutation on α subunit had no effect on
kon, whereas it increased the koff value and Kdkon product by about 2.5 fold.
111
Table 14. IF1 binding parameters of ATP synthase with mutants of group A.
Experimental conditions and calculations as described in Materials and methods. pH 8. n, number of
experiments.
3.3.2.2. Effect of mutations in group B (β‐T380R‐S383E, E471K‐A474E
and T380R‐S383E‐E471K‐A474E)
Residues selected in group B are located in βDP subunit bordering IF1 midpart.
Three different mutants were T380R‐S383E, E471K‐A474E and T380R‐S383E‐E471K‐
A474E. Figure 41 shows the effect of mutations in group B at pH6.5. Binding
parameters were obtained after merging the results of numerous independent kinetic
experiments as those displayed in table 15. IF1 inhibitions of WT and mutants are
compared in the same graph. IF1 at saturating concentration inhibited ATPase activity
to more than 95% in SMP mutants, the same as described in group A. Comparing to
the WT, mutant T380R‐S383E had no effect on the binding rate constant kon, and
mutant E471K‐A474E decreased the kon by a factor of 7. The combination of the four
mutations had no significant additional effect as compared to E471K‐A474E. However,
at first sight none of this set of mutations had significant effect on the rate constant of
dissociation.

112
Figure 41. Experimental data of mutants in group B and determination of IF1 binding parameters
Conditions are as described in Material and Methods, pH6.5, 25°C. Experimental data of SMP WT and mutants
from group B are shown in the figure. (‐‐) SMP WT, average of 29 single experiments. (‐Δ‐) SMP mutant β‐
T380R‐S383E, average of 3 single experiments. (‐O‐) SMP mutant β‐E471K‐A474E, average of 4 single
experiments. (‐X‐) SMP mutant β‐T380R‐S383E‐E471K‐A474E, average of 3 single experiments. Panel a, rate
constant of inhibition (kapp) as a function of IF1 concentration. Panel b, normalized ATPase activity at
equilibrium as a function of IF1 concentration, where the zoomed area corresponds to IF1 concentration up to
120 nM. Panel c, normalized ATPase activity at equilibrium as a function of 1/kapp.

113
Table 15. IF1 binding parameters of ATP synthase with mutants of group B.
Experimental conditions and calculations as described in Materials and Methods. pH 6.5, 25°C.
As described in group A, the same kinetic experiments at pH 8 were done for
mutants in group B. Results are displayed in table 16. At this pH, mutant T380R‐S383E
still had no effect either on kon, or on koff. Mutants E471K‐A474E and T380R‐S383E‐
E471K‐A474E both kept the same range of decrease on kon. By the way, these two
mutants showed an effect of increasing the koff by 2 to 2.5 fold at pH 8 by both
methods of koff determination. The cause of the koff modification effect is not clear. But
maybe it was related to pH change that modified the charges of protonable residues.
Thus the electrostatic interaction between mutated residues (especially E471K and
A474E) and IF1 could be slightly affected, which decreased the stability of the protein
complex. It could be other reason that still needs further verification.
Table 16. IF1 binding parameters of ATP synthase with mutants of group B, at pH 8.

114
3.3.2.3. Discussion
The mutant α‐E357D‐Y399F‐R400A‐V402L‐Q418N classified as group A does not
affect IF1 binding step, and it contributes only a little to the stability of the inhibited
complex suggested by the 2.5‐fold increase of koff with their simultaneous mutation
into their non‐mitochondrial counterparts. These mutations globally decrease the
volume of the lateral chains except for V402L. Thus some of these residues probably
limit movements of IF1 when it is trapped in between αDP and βDP. The limited effect
of mutagenesis could be due to the nature of the mutations of the residues. Since they
were designed for IF1 specificity study, these mutations did not effectively reduce the
IF1‐F1‐ATPase interaction. It could also be due to their relative remoteness from IF1
suggested by the yeast crystal. According to the structural analyses, residues in group
A are closer to IF1 in bovine crystal but not in yeast, where four of the five residues are
more than 6 Å to IF1 (see figure 36). Thus, other type of mutations could be interesting
to examine the roles played by these residues during IF1 inhibition, such as glycine
substitutions. And other residues in this region could also be interesting to investigate.
In group B, the Cter extremity residues E471 and A474 are clearly involved in IF1
initial binding step judging from the 7‐fold decrease of kon observed from its mutant.
The Cter extremity of β subunit protrudes from the complex regardless the catalytic
state of the interface, which is a facility of IF1 grasping. This initial IF1 grasping step
occurs in one of the three catalytic states of the interface, and it follows large
conformational changes until the dead‐end state. It is also interesting to wonder which
residues from IF1 part might interact with E471 and A474. In bovine F1‐ATPase
crystallized complex with bound IF1, residues E471 and A474 of βDP are close to IF1
residues L42, L45 and K46 (figure 42), whereas in yeast complex the homologues of
these IF1 residues are not visible. In yeast crystal, residues E471 and A474 of βDP have
a distance more than 10 Å to the closest IF1 residue (Q36, see figure 38). One could
possibly imagine that in yeast IF1 homologue region, which refers IF1‐L37 to L40, there
exist residues closer to βDP E471 and A474. Mutations of these residues could be
helpful to confirm our finding of βDP‐E471 and A474. Interestingly, mutation into

115
alanine of yeast IF1‐L40, the homologue of bovine IF1‐L45, has been recently shown to
decrease kon by a factor of 5 (Robinson et al, 2013). This matches our finding of the 7‐
fold decrease of kon for the mutant β‐E471K‐A474E. Therefore, it strengthens the idea
that interaction between the β C terminal extremity and IF1 midpart (presumably IF1‐
L40 or its neighbours) is involved in the recognition step. On the other hand, the
residues T380 and S383 play no role in IF1 binding process.
E471
A474
L42
L45 K46
Figure 42. Interaction between βDP‐E471, A474 and IF1 midpart in bovine IF1‐F1‐ATPase.
Image created form the pdb file 2v7q using PyMol software. Residues of IF1 L42, L45 and K46 are
shown in white sticks. Residues of βDP‐E471, A474 are shown in salmon sticks. The closed distance
between IF1 and βDP residues are measured and shown in yellow.
In addition, the result of the mutation β‐E471K‐A474E consists of slight increase
of the dissociation rate constant at pH 8, which suggests that these two residues are
also involved in stabilizing the inhibited complex but with a very limited function.
3.3.3. Group C and D: γ‐neighbouring residues from αDP, βDP
Group C: αDP409GSDLDAST416
Group D: βDP394DELSEQD400

116
As defined previously, these two groups of residues are located in αDP, βDP
subunits Cter. They are highly conserved in ATP synthases. And they interact with the
foot of γ subunit as well as IF1. The central shaft γ subunit of ATP synthase connects
the Fo rotary motor and the F1 catalytic core. It deforms sequentially the three catalytic
pairs of α, β subunits in order to achieve ATP synthesis or hydrolysis. The contact
between γ subunit and the C terminal extremity of α, β subunits, especially α, appears
after IF1 bound in bovine ATP synthase, but this contact remains more constant in
yeast ATP synthase according to the observations of crystal structures with or without
IF1 bound. Here we consider that this interaction might indirectly contribute to the
inhibitory effect of IF1.
Figure 43. Zoom of residues in Group C and D in bovine mitochondrial F1‐ATPase.
IF1‐bound bovine mitochondrial F1‐ATPase pdb file 2v7q, image created in PyMol. The figure shows IF1
(grey ribbon in middle) binding region. Group C and D residues in αDP, βDP subunits are shown in
sphere. In αDP subunit (green lines), the loop 407GSDLDAAT
414 is shown in forest green on sphere. In
βDP subunit (red lines), the loop 394DELSEED
400 is shown in ruby red. γ subunit is shown on cyan ribbon.

117
These two groups of selected residues were gradually mutated into glycine using
site‐directed mutagenesis in the aim of reducing their steric hindrance and eventually
weaken their contact to γ subunit and to IF1. Obtained mutants are as following:
Group C: α409GSGLDAST416
α409GSDLGAST416
α409GSGLGAST416
α409GSGGGAST416
α409GGGGGAST416
α409GSGGGGGG416
α409GGGGGGGG416
α409GS‐ ‐ ‐AST416
Group D: β394GELSEQD400
β394DGLSEQD400
β394DELSGQG400
β394DGGGEQD400
SMP of different mutants devoid of endogenous IF1 were investigated by kinetics
of ATP hydrolysis and IF1 inhibition at pH 6.5. Then we studied the IF1 binding
parameters of these two groups of mutations.
3.3.3.1. Effect of mutations in Group C:
α409GSGLDAST416
α409GSDLGAST416
α409GSGLGAST416
α409GSGGGAST416
α409GGGGGAST416
α409GSGGGGGG416
α409GGGGGGGG416
α409GS‐ ‐ ‐ AST416
118
Kinetic results of this group of mutations are shown in figure 44‐a‐b‐c, and the
binding parameters obtained from numerous single experiments were calculated and
shown in table 17. To better visualize the results, the calculated kon and koff values of
different mutants are shown in table 17 were plotted in figure 45.

119
Figure 44a. Group C: rate constant of inhibition (kapp) as a function of IF1 concentration.
Conditions are as described in Material and Methods, pH6.5, 25°C.
(‐‐) SMP WT, average of 29 single experiments, presenting in each figure as control.
Panel a1, (‐Δ‐) SMP mutant α409GSGLDAST
416, average of 3 single experiments.
(‐□‐) SMP mutant α409GSDLGAST
416, average of 3 single experiments.
(‐O‐) SMP mutant α409GSGLGAST
416, average of 3 single experiments.
(‐x‐) SMP mutant α409GSGGGAST
416, average of 3 single experiments.
Panel a2, (‐O‐) SMP mutant α409GGGGGAST
416, average of 3 single experiments.
(‐x‐) SMP mutant α409GSGGGGGG
416, average of 4 single experiments.
(‐Δ‐) SMP mutant α409GGGGGGGG
416, average of 3 single experiments.
(‐□‐) SMP mutant α409GS‐ ‐ ‐AST416, average of 4 single experiments.

120
Figure 44b. Group C: normalized ATPase activity at equilibrium as a function of IF1 concentration.
(‐‐) SMP WT, average of 29 single experiments, presenting in each figure as control.
Panel a1, (‐Δ‐) SMP mutant α409GSGLDAST
416, average of 3 single experiments.
(‐□‐) SMP mutant α409GSDLGAST
416, average of 3 single experiments.
(‐O‐) SMP mutant α409GSGLGAST
416, average of 3 single experiments.
(‐x‐) SMP mutant α409GSGGGAST
416, average of 3 single experiments.
Panel a2, (‐O‐) SMP mutant α409GGGGGAST
416, average of 3 single experiments.
(‐x‐) SMP mutant α409GSGGGGGG
416, average of 4 single experiments.
(‐Δ‐) SMP mutant α409GGGGGGGG
416, average of 3 single experiments.
(‐□‐) SMP mutant α409GS‐ ‐ ‐AST416, average of 4 single experiments Conditions and labels are as
described in figure 42a. Panel b1, SMP WT and mutants are the same as figure 42‐a1. Panel b2, SMP WT
and mutants are the same as figure 42‐a2.

121
Figure 44c. Group C: normalized ATPase activity at equilibrium as a function of 1/kapp.
(‐‐) SMP WT, average of 29 single experiments, presenting in each figure as control.
Panel a1, (‐Δ‐) SMP mutant α409GSGLDAST
416, average of 3 single experiments.
(‐□‐) SMP mutant α409GSDLGAST
416, average of 3 single experiments.
(‐O‐) SMP mutant α409GSGLGAST
416, average of 3 single experiments.
(‐x‐) SMP mutant α409GSGGGAST
416, average of 3 single experiments.
Panel a2, (‐O‐) SMP mutant α409GGGGGAST
416, average of 3 single experiments.
(‐x‐) SMP mutant α409GSGGGGGG
416, average of 4 single experiments.
(‐Δ‐) SMP mutant α409GGGGGGGG
416, average of 3 single experiments.
(‐□‐) SMP mutant α409GS‐ ‐ ‐AST416, average of 4 single experiments

122
Table 17. IF1 binding parameters of ATP synthase with mutants of Group C.
Experimental conditions and calculations as described in Materials and methods. pH 6.5, at 25°C. n,
number of experiments.
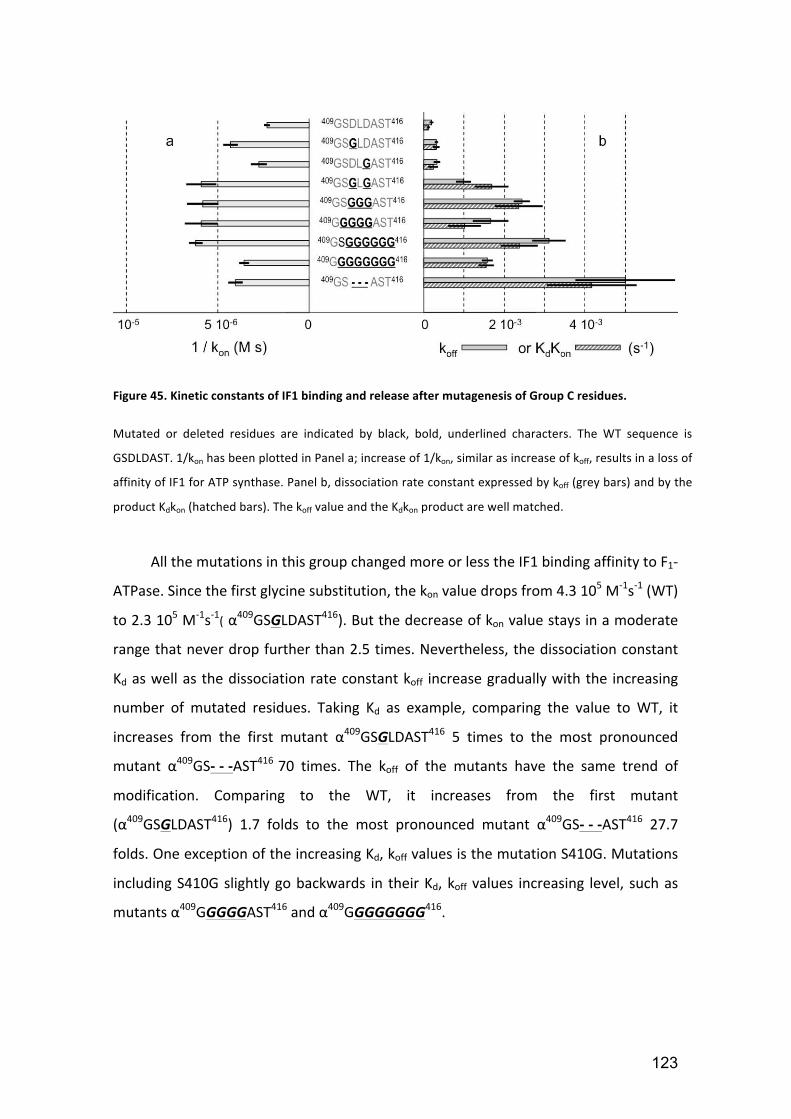
123
Figure 45. Kinetic constants of IF1 binding and release after mutagenesis of Group C residues.
Mutated or deleted residues are indicated by black, bold, underlined characters. The WT sequence is
GSDLDAST. 1/kon has been plotted in Panel a; increase of 1/kon, similar as increase of koff, results in a loss of
affinity of IF1 for ATP synthase. Panel b, dissociation rate constant expressed by koff (grey bars) and by the
product Kdkon (hatched bars). The koff value and the Kdkon product are well matched.
All the mutations in this group changed more or less the IF1 binding affinity to F1‐
ATPase. Since the first glycine substitution, the kon value drops from 4.3 105 M‐1s‐1 (WT)
to 2.3 105 M‐1s‐1( α409GSGLDAST416). But the decrease of kon value stays in a moderate
range that never drop further than 2.5 times. Nevertheless, the dissociation constant
Kd as well as the dissociation rate constant koff increase gradually with the increasing
number of mutated residues. Taking Kd as example, comparing the value to WT, it
increases from the first mutant α409GSGLDAST416 5 times to the most pronounced
mutant α409GS‐ ‐ ‐AST416 70 times. The koff of the mutants have the same trend of
modification. Comparing to the WT, it increases from the first mutant
(α409GSGLDAST416) 1.7 folds to the most pronounced mutant α409GS‐ ‐ ‐AST416 27.7
folds. One exception of the increasing Kd, koff values is the mutation S410G. Mutations
including S410G slightly go backwards in their Kd, koff values increasing level, such as
mutants α409GGGGGAST416 and α409GGGGGGGG416.

124
3.3.3.2. Effect of mutations in Group D
β394GELSEQD400
β394DGLSEQD400
β394DELSGQG400
β394DGGGEQD400
This group of residues refers to the highly conserved motif, termed DELSEED‐
loop, described previously. The DELSEED‐loop of β subunit makes contact with the foot
of γ subunit. It also has direct interaction with IF1. Mutations of these residues into
glycine reduce the steric hindrance of the loop, so that it may weaken the contact at
the same time between β and γ subunits, and between β subunit and IF1. But since
this β‐DELSEED‐loop has been suggested to be involved in coupling between catalysis
and rotation (Mnatsakanyan et al, 2011), our mutations in this group did not go further
than triple glycine substitution in order not to affect enzyme functions.
Kinetic results of this group of mutations are shown in figure 46, and the binding
parameters obtained from numerous single experiments were calculated and shown in
table 18.
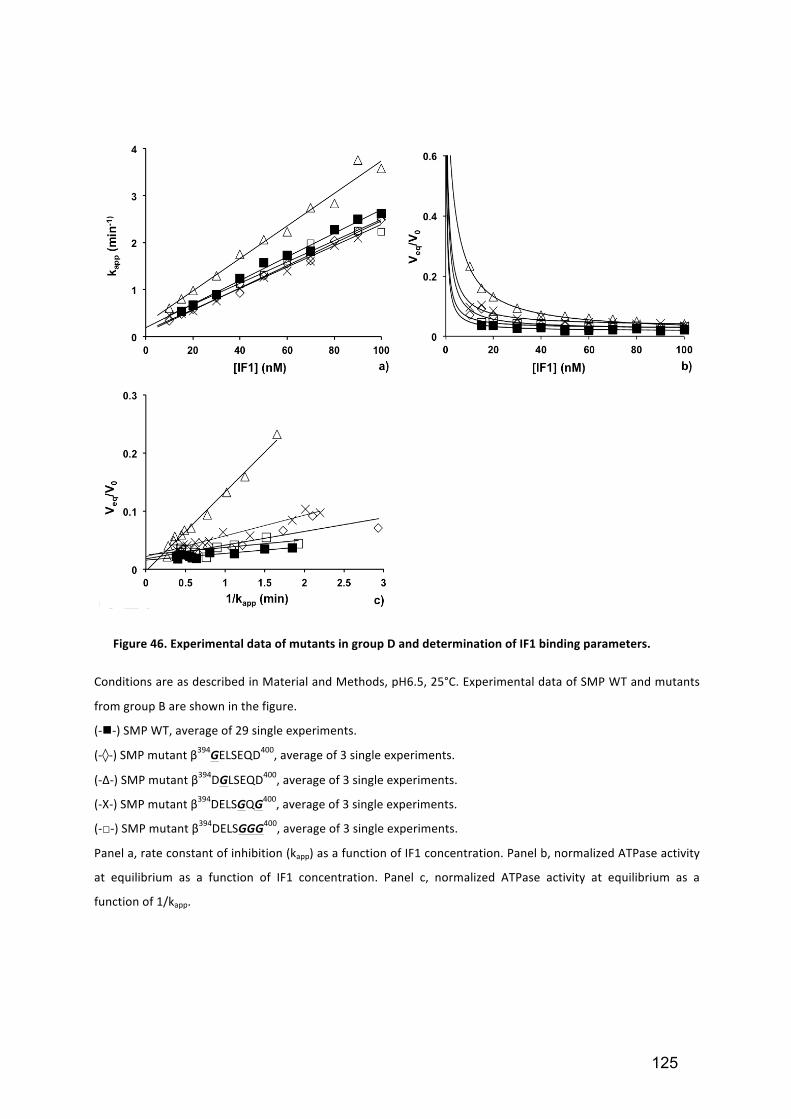
125
Figure 46. Experimental data of mutants in group D and determination of IF1 binding parameters.
Conditions are as described in Material and Methods, pH6.5, 25°C. Experimental data of SMP WT and mutants
from group B are shown in the figure.
(‐‐) SMP WT, average of 29 single experiments.
(‐◊‐) SMP mutant β394GELSEQD
400, average of 3 single experiments.
(‐Δ‐) SMP mutant β394DGLSEQD
400, average of 3 single experiments.
(‐X‐) SMP mutant β394DELSGQG
400, average of 3 single experiments.
(‐□‐) SMP mutant β394DELSGGG
400, average of 3 single experiments.
Panel a, rate constant of inhibition (kapp) as a function of IF1 concentration. Panel b, normalized ATPase activity
at equilibrium as a function of IF1 concentration. Panel c, normalized ATPase activity at equilibrium as a
function of 1/kapp.

126
Table 18. IF1 binding parameters of ATP synthase with mutants of Group D.
Experimental conditions and calculations as described in Materials and methods. pH 6.5, 25°C. n,
number of experiments.
None of the mutations in group D shows significant effect on the rate constant of
IF1 association. But all the four mutations have more or less increased the rate
constant of dissociation koff, as well as the Kd. The most remarkable effect is observed
with the mutant β394DGLSEQD400(E395G). This single substitution on glycine brings a
10‐fold increase in koff. However, this important increase of koff does not appear with
the triple mutation β394DGGGEQD400 that includes E395G. The results suggest that
βE395 plays a specific role.
3.3.3.3. Combination of crucial mutations α409GS‐ ‐ ‐AST416 and
β394DGLSEQD400
With the observations of mutations in group C and D, we selected one crucial
mutation from each of the subunit: α409GS‐ ‐ ‐AST416 and β394DGLSEQD400. In the aim of
detecting a maximal effect of mutations from γ remote residues, we combined the two
selected mutations and created a new “double mutant”, α409GS‐ ‐ ‐AST416 and
β394DGLSEQD400. Kinetics of ATP hydrolysis and IF1 inhibitions are displayed in figure
47. Experimental data are shown in table 17.
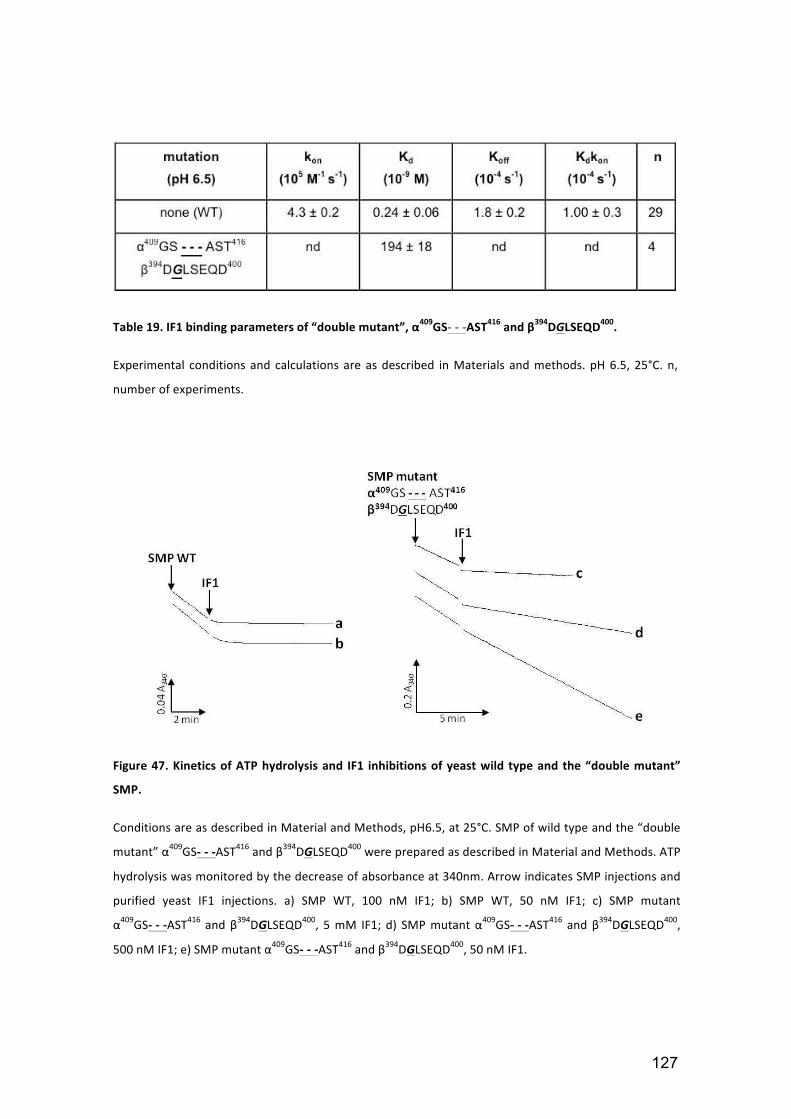
127
Table 19. IF1 binding parameters of “double mutant”, α409GS‐ ‐ ‐AST416 and β394DGLSEQD400.
Experimental conditions and calculations are as described in Materials and methods. pH 6.5, 25°C. n,
number of experiments.
Figure 47. Kinetics of ATP hydrolysis and IF1 inhibitions of yeast wild type and the “double mutant”
SMP.
Conditions are as described in Material and Methods, pH6.5, at 25°C. SMP of wild type and the “double
mutant” α409GS‐ ‐ ‐AST416 and β394DGLSEQD400
were prepared as described in Material and Methods. ATP
hydrolysis was monitored by the decrease of absorbance at 340nm. Arrow indicates SMP injections and
purified yeast IF1 injections. a) SMP WT, 100 nM IF1; b) SMP WT, 50 nM IF1; c) SMP mutant
α409GS‐ ‐ ‐AST416 and β394DGLSEQD400
, 5 mM IF1; d) SMP mutant α409GS‐ ‐ ‐AST416 and β394DGLSEQD400
,
500 nM IF1; e) SMP mutant α409GS‐ ‐ ‐AST416 and β394DGLSEQD400
, 50 nM IF1.
128
As expected, the combination of the two important mutations results in a
dramatic decrease of IF1 affinity. The Kd value drops from 0.24 10‐9 M to 194 10‐9 M.
However, it requires extremely high concentration of IF1 to achieve a detectable
inhibition. As a consequence, it reaches instantly the equilibrium between active and
inhibited forms of ATPase, and the kon and koff values are not detectable (see examples
of single experiments in figure 47). Finally, the result of the final inhibition Kd
estimation corresponds to the multiplication of Kd values of each “single mutation”. As
the Kd value and IF1 binding energy are logarithmically related, the binding energy
change of the “double mutation” should be the addition of energy from each “single
mutation” from different region of α, β subunits. In fact, our calculation based on the
experimental data shows that both the Kd value and binding energy calculation are in
accord with the independent contribution to IF1 interaction from each side of α, β
subunits.
3.3.3.4. Residues in γ subunit interacting with Group C
According to the crystal structure of IF1‐F1‐ATPase, γ116MQLL119 are facing
αDP409GSDLDAST416. The contact between α and γ subunits might be linked to the IF1
binding process. Since the series of mutations in group C showed significant effect in
koff, it is also very interesting to know whether it has the same effect with the same
type of diminishing‐volume mutations in γ subunit. A series of glycine substitutions in γ
subunit was designed and constructed through the collaboration with Dr. Emmanuel
Tetaud at Bordeaux. Until recently, two mutants have been successfully grown and
determined of their kinetic parameters (table 20).

129
Table 20. IF1 binding parameters of mutants in γ subunit.
Experimental conditions and calculations as described in Materials and methods. pH 8, at 25°C. n,
number of experiments.
Kinetics have been performed at pH 8, at 25°C. The two mutants in γ subunit
facing residues in group C have no effect on rate constant of IF1 association. But the
double mutant γ‐M116G‐Q117G increased the dissociation rate constant by around
70% comparing to WT. The triple mutant γ‐M116G‐Q117G‐L118G abolished this
increase in koff, which is similar to the mutation αS410G. This result of limited effect is
accordable to the effect of group C mutations afterall.
3.3.3.5. Discussion
In α subunit, the group C residues αDP409GSDLDAST416 seems somehow
participate in the initial step of IF1 recognition according to the moderate decrease of
kon value while mutated into glycine. Since the first substitution of glycine (D411G),
enzyme showed a remarkable effect. So this residue D411 probably has the main
contribution for IF1 recognition among all the target residues in group C. Since the
group C is relatively far from IF1 in the crystal structure comparing to group B that
plays a main role in IF1 binding step, it is reasonable for this group to have a minor
contribution to initial binding step. Known the crystal structure shows only the final
state of the inhibited complex, the initial binding step including the transient
conformational changes remains unclear. We could possibly imagine that the group C

130
residues are partially involved in IF1 loose binding step. Then after enzyme performing
a fraction of turn, they turn to play the main role of stabilizing the inhibited complex.
Suggested by the modification of koff values, αDP409GSDLDAST416 shows
important contribution to the stability of inhibited complex. According to the crystal
structure, these residues in αDP subunit do not have direct contact with IF1 in the final
state, except one possible electrostatic interaction between αD413 and IF1‐R30, and
one other possible hydrophobic interaction between αL412 and IF1‐F27. These weak
interaction with IF1 would probably limit the inhibitor movement inside the (αβ)DP
crevice. Moreover, their position in the enzyme and their steric hindrance allow the
formation of a pliers‐like motif cooperating with βDP subunit through their lateral
chains in order to block IF1 movement. The contact between αDP409GSDLDAST416 and
γ115KMQLL119 might contribute to the rigidity of these pliers (figure 48).
In β subunit, the motif DELSEQD is not involved in IF1 recognition, but it
contributes to stabilize the IF1 inhibited complex, as suggested by koff increase with
mutations. The most significant contribution to IF1 stability was observed with
mutation in β‐E395. On one hand, βDP‐E395 has no close distance to IF1 (more than 9
Å), but it is close enough with γ‐R30 to establish a salt bridge (less than 3 Å), as well as
electrostatic interactions with γ‐K81. On the other hand, βTP‐E395 also seems to play a
role to the stability of the inhibited complex, since it has a relatively close distance
with IF1‐R20 (more than 4.8 Å). Moreover, the β‐E398 was also observed by the crystal
structure holding a close distance to IF1, such as βDP‐E398 establishing a salt bridge
with IF1‐R32 (3.2 Å), and βTP‐E398 forming a H‐bond with γ‐Q117. All these
interactions contribute to IF1 stability, which were confirmed by kinetics with
mutations reducing the interactions (figure 49).
All together, the results suggest that not only the direct contacts between α/β
subunit and IF play a role in stabilizing the inhibited complex, but also the interaction
between α/β subunit and γ subunit. It is a complicated subunit‐subunit cooperation
that keeps the IF1‐F1‐ATPase stable.

131
IF1-R30
IF1-F27
IF1
γ116MQLL119
αDP-GSDLDAST
αDP-D413
βDP-DELSEQD
αDP-L412
γ116MQLL119
Figure 48. Interaction between αDP409GSDLDAST416 and its neighbouring residues.
Image created form the pdb file 3zia using PDBviewer software. On the left, γ subunit is shown on cyan
sticks, with indicated residues γ115KMQLL
119 on sphere. IF1 secondary structure is shown on white
ribbon, with its side chains on sticks. αDP409GSDLDAST
416 (green) and βDP‐DELSEQD (red) are shown on
sphere. On the right, residues of αDP409GSDLDAST
416 are shown in green sticks with the label of αL412
and αD413. IF1 F27 and R30 are shown in white sticks. Residues of γ115KMQLL
119 are shown on cyan
sticks. The closed distance between αDP409GSDLDAST
416 and its neighbouring residues in IF1 and
γ115KMQLL
119 are measured and shown in yellow.

132
IF1
βTP-DELSEQD βDP-DELSEQD
γ-116MQLL119
γ-R30
Figure 49. Interaction between β‐DELSEQD and its neighbouring residues.
Image created form the pdb file 3zia using PDBviewer software. On the top, IF1 secondary structure is
shown on white ribbon, with its side chains on sticks. Residues in γ subunit are shown on cyan sticks.
βTP‐DELSEQD (yellow) and βDP‐DELSEQD (red) are shown on sticks. On the bottom left, residues
interacting βTP‐DELSEQD (IF1‐R20: white sticks, γ‐Q117: cyan sticks) are zoomed with measured
distance indicated in yellow. On the bottom right, residues interacting βDP‐DELSEQD (IF1‐R32: white
sticks, γ‐R30 and K81: cyan sticks) are zoomed with measured distance indicated in yellow.

133

134
Chapter 4. Conclusion and Perspectives

135

136
4. Conclusion
Being an essential enzyme in the mitochondria of a cell, ATP synthase functions
as an energy producer. The reverse action of ATP hydrolysis is a potential danger for
the cell in most cases. Therefore, the regulation of mitochondrial ATPase by its natural
inhibitor IF1 is important. During the three years of my thesis, our team worked on the
ATPase regulation by IF1 in the model of Saccharomyces cerevisiae mitochondria. This
work was ained in studying the dynamics of the inhibition process, by discriminating
motifs or residues of ATP synthase that are involved in the IF1 recognition and locking
steps; as well as in understanding the specificity of mitochondrial ATPase inhibition
that IF1 showed in in vitro experiments.
Numerous residues in ATPase α, β and γ subunits that are most probably
implicated in IF1 binding process were selected and mutated. Mutants were classified
into four different groups according to their locations and their mutation types.
Mutagenesis was then combined with kinetic approach in order to study the effect of
mutations in IF1 inhibition and consequently analyze the roles played by each residue
during IF1 binding and locking to ATPase.
Firstly, with the preliminary experiments in the lab showing that IF1 inhibits
specifically mitochondrial ATPase, we examined residues of group A and B. Results
show that none of the selected residues are responsible for IF1 specific inhibition of
mitochondrial ATPase. This specificity, if it exists, could involve in specific molecular
recognition occurring only in some transient steps that are not visualized in a crystal
structure. It could also possibly involve in other residues that we did not mutate. And it
requires more investigations.
Secondly, kinetic studies were performed to estimate the effect of mutations on
ATPase represented in four groups during IF1 inhibition. Kinetic parameters of IF1
binding to ATPase were observed. These results revealed the formation of the
interaction between IF1 and ATPase, from the initial recognition step to the
stabilization of inhibited complex. With the help of structural analyses, we proposed in
this work the sequence of events occurring in mitochondrial ATPase inhibition by IF1
(see figure 50).

137
1) IF1 midpart is recognized by the C-terminal extremity of ATPase β
subunit (in particular E471, A474), which belongs to one of the
three αβ catalytic interfaces. At the same time, the α motif
GSDLDAST slightly contributes to IF1 recognition.
2) After IF1 loose binding, ATPase still experiences one fraction of
turn and the catalytic interface that has just bound IF1 closes and
becomes (αβ)DP. IF1 is then trapped.
3) IF1 trapping involves αDP-GSDLDAST and βDP-DELSEQD,
which form a pair of pliers that encage IF1. Whereas β C-terminal
extremity becomes much less important than the beginning. In
addition, other residues in α subunit (group A) facing IF1 midpart
modestly contribute to IF1 trapping by limiting its movements
inside the (αβ)DP crevice.
4) The interactions between α, γ and β, γ subunits (α-GSDLDAST
and foot of γ, β-DELSEQD and foot of γ) ensure the rigidity of the
pliers mentioned in step 3.
5) Another contribution comes from the N-terminal part of IF1, which
was shown to play a key role in stabilizing the inhibited complex.
(Andrianaivomananjaona et al, 2011; Ichikawa et al, 2001) by
interacting with central axis of γ and internal parts of α and β
subunits.
Figure 50. Representation of IF1 binding‐locking process in yeast mitochondrial ATPase.

138
All together, the regulation of mitochondrial ATPase by IF1 is shown to be
complicated subunit‐subunit cooperation. Most of the enzyme‐inhibitor interaction in
the initial binding step are not visualized in crystal structure, but are suggested in this
work by the combination of kinetics and site‐directed mutagenesis, as well as
accumulation of experiments. This approach notably improves our knowledge of IF1
inhibition mechanism. There are still other aspects about IF1 regulation that remain to
be elucidated.

139

140
5. Perspectives
In this work, we have mutated and examined the role of numerous residues
implicated in the IF1 binding process, located in four different regions involving three
subunits. Still, there are several things we could do in the future work to improve the
understanding of IF1 inhibition to mitochondrial ATPase.
Speaking about the mutagenesis, we barely started to study residues in γ subunit
that are in contact with α and β subunit. By those limited mutations, we found
interesting results that matched the effect of mutations in their counterpart in α and β
subunit. Thus, more investigations in γ subunit will be interesting. For instance, around
the region γ‐116MQLL119, those amino acids are suggested to be in contact with α
subunit stabilizing the inhibited complex. They also have a close distance with βTP‐
DELSEQD. But in the crystal structure, there are some residues missing in γ subunit.
Plus, the transient interaction between the two subunits remains unknown. We need
to re‐examine the structures in order to find and study more potential candidates
located in α‐contacting region of γ subunit involving in IF1 binding process, which
would definitely help the understanding of IF1 interaction especially the stabilization
step. On its other side, γ subunit is in contact with βDP‐DELSEQD, perhaps participating
in the stabilization of the complex. As we discussed previously, γ‐R30 is a good
candidate, as well as γ‐K81. They get really close to βDP‐DELSEQD, less than 4 Å. So
that they could probably play an important role as γ‐116MQLL119 (or their
neighbourhood residues), contributing to the stabilization of inhibited complex. So, it
would be interesting to mutate these regions of γ subunit and compare the effect to
mutations in α and β subunits. On the other hand, inside α and β subunits, especially
those regions contacting IF1 midpart, there is also something interesting that could be
tested, which could then be compared to group A and B. Since we turned the focus
now to the research of IF1 binding process, it could be interesting to re‐examine these
residues by glycine substitutions. In this way, we could more effectively weaken the
interaction between IF1 and F1‐ATPase, and consequently study the IF1 recognition
step by these residues. Besides, the choices of these residues were made on basis of

141
sequence alignment between different organisms (mitochondrial versus non‐
mitochondrial families). The most conserved residues in mitochondrial family were
selected, but they were not meant to be the closest residues interacting with IF1
midpart. Which is to say that further intensive work could be done to study other
residues located in the catalytic αβ interface facing IF1 midpart, in order to identify
other residues that contribute to IF1 recognition.
Speaking about the technique, until now the studies of interaction between IF1
and ATPase are mainly realized by two approaches: X‐ray crystallography, and enzyme
kinetics combined to site‐directed mutagenesis. X‐ray crystallography allows to solve
the 3D structure of the IF1 inhibited ATPase, which is the dead‐end conformation.
Kinetic experiments with mutations allow distinguishing two steps in the inhibition
process (recognition and stabilization), and identifying residues involved in the
process. However the successive conformational changes of ATPase and IF1 during
their interaction are not revealed. Structural characterization of these different states
is necessary to have a dynamic view of the inhibition process, in particular to
understand the uni‐directional, mitochondrial ATPase inhibition process. The
remaining questions are as follows: What is the catalytic state of αβ interface that
initially binds IF1? How does IF1 adjust its conformation during the inhibition? We
proposed that IF1 is recognized by the enzyme through its midpart and the N‐
termainal part folds in the opposite direction (Andrianaivomananjaona et al, 2011).
Winding of its N‐terminal part around the central γ subunit is likely to occur in the
following steps to stabilize the complex. But it lacks direct visualizing evidence. What
happens in the transient binding steps? How does IF1 specifically inhibit mitochondrial
ATPase? What role does the dimerization of yeast IF1 play in the inhibition?
To solve these questions, new experimental approaches are required. For
instance, the spin‐labeling EPR spectroscopy could be used to characterize the protein‐
protein interaction at the structure level. IF1 and F1‐ATPase will be labeled at certain
sites and observed of their conformational transitions as well as biomolecule
associations by EPR spectroscopy under different conditions, such as presence of ATP,
absence of ATP and so on. The FRET (Fluorescence Resonance Energy Transfer) could

142
also be used to estimate time‐dependent or conformer‐dependent distance within the
IF1‐F1‐ATPase complex. Since FRET is a distance‐dependent interaction between the
electronic exited states of two dyes, it is powerful to study interaction between
proteins and conformational changes within proteins. Although complicated, it is also
interesting to crystalize those mutated F1‐ATPases with IF1 bound in order to visualize
the effect of mutations in a dead‐end complex.
Of course, it exists other methods to study this same phenomenon. Hence, we
just need a little bit more imagination, creative ideas, courage and skills, patience and
financial support.

143

144
References

145
146
6. References
Abrahams JP, Leslie AG, Lutter R, Walker JE (1994) Structure at 2.8 A
resolution of F1-ATPase from bovine heart mitochondria. Nature 370: 621-628
Amano T, Hisabori T, Muneyuki E, Yoshida M (1996) Catalytic activities of alpha3beta3gamma complexes of F1-ATPase with 1, 2, or 3 incompetent catalytic sites. J Biol Chem 271: 18128-18133
Andrianaivomananjaona T, Moune-Dimala M, Herga S, David V, Haraux F (2011) How the N-terminal extremity of Saccharomyces cerevisiae IF1 interacts with ATP synthase: a kinetic approach. Biochim Biophys Acta 1807: 197-204
Arnold I, Pfeiffer K, Neupert W, Stuart RA, Schagger H (1998) Yeast mitochondrial F1F0-ATP synthase exists as a dimer: identification of three dimer-specific subunits. EMBO J 17: 7170-7178
Arselin G, Vaillier J, Salin B, Schaeffer J, Giraud MF, Dautant A, Brethes D, Velours J (2004) The modulation in subunits e and g amounts of yeast ATP synthase modifies mitochondrial cristae morphology. J Biol Chem 279: 40392-40399
Avni A, Anderson JD, Holland N, Rochaix JD, Gromet-Elhanan Z, Edelman M (1992) Tentoxin sensitivity of chloroplasts determined by codon 83 of beta subunit of proton-ATPase. Science 257: 1245-1247
Axelsen KB, Palmgren MG (1998) Evolution of substrate specificities in the P-type ATPase superfamily. J Mol Evol 46: 84-101
Baerlocher KE, Feldges A, Weissert M, Simonsz HJ, Rotig A (1992) Mitochondrial DNA deletion in an 8-year-old boy with Pearson syndrome. J Inherit Metab Dis 15: 327-330
Baker LA, Watt IN, Runswick MJ, Walker JE, Rubinstein JL (2012) Arrangement of subunits in intact mammalian mitochondrial ATP synthase determined by cryo-EM. Proc Natl Acad Sci U S A 109: 11675-11680
Bald D, Amano T, Muneyuki E, Pitard B, Rigaud JL, Kruip J, Hisabori T, Yoshida M, Shibata M (1998) ATP synthesis by F0F1-ATP synthase

147
independent of noncatalytic nucleotide binding sites and insensitive to azide inhibition. J Biol Chem 273: 865-870
Ballhausen B, Altendorf K, Deckers-Hebestreit G (2009) Constant c10 ring stoichiometry in the Escherichia coli ATP synthase analyzed by cross-linking. J Bacteriol 191: 2400-2404
Bason JV, Runswick MJ, Fearnley IM, Walker JE (2011) Binding of the inhibitor protein IF(1) to bovine F(1)-ATPase. J Mol Biol 406: 443-453
Bianchet MA, Hullihen J, Pedersen PL, Amzel LM (1998) The 2.8-A structure of rat liver F1-ATPase: configuration of a critical intermediate in ATP synthesis/hydrolysis. Proc Natl Acad Sci U S A 95: 11065-11070
Bickel-Sandkötter S, Wagner V, Schumann D (1998) ATP-synthesis in archaea: Structure-function relations of the halobacterial A-ATPase. Photosynthesis Research 57: 10
Bottcher B, Schwarz L, Graber P (1998) Direct indication for the existence of a double stalk in CF0F1. J Mol Biol 281: 757-762
Bowler MW, Montgomery MG, Leslie AG, Walker JE (2007) Ground state structure of F1-ATPase from bovine heart mitochondria at 1.9 A resolution. J Biol Chem 282: 14238-14242
Boyer PD (1993) The binding change mechanism for ATP synthase--some probabilities and possibilities. Biochim Biophys Acta 1140: 215-250
Boyer PD (2000) Catalytic site forms and controls in ATP synthase catalysis. Biochim Biophys Acta 1458: 252-262
Bublitz M, Morth JP, Nissen P (2011) P-type ATPases at a glance. J Cell Sci 124: 2515-2519
Bullough DA, Ceccarelli EA, Verburg JG, Allison WS (1989) Localization of sites modified during inactivation of the bovine heart mitochondrial F1-ATPase by quinacrine mustard using [3H]aniline as a probe. J Biol Chem 264: 9155-9163
148
Burnett BB, Gardner A, Boles RG (2005) Mitochondrial inheritance in depression, dysmotility and migraine? J Affect Disord 88: 109-116
Butler IJ, Gadoth N (1976) Kearns-Sayre syndrome. A review of a multisystem disorder of children and young adults. Arch Intern Med 136: 1290-1293
Cabezon E, Arechaga I, Jonathan P, Butler G, Walker JE (2000a) Dimerization of bovine F1-ATPase by binding the inhibitor protein, IF1. J Biol Chem 275: 28353-28355
Cabezon E, Butler PJ, Runswick MJ, Carbajo RJ, Walker JE (2002) Homologous and heterologous inhibitory effects of ATPase inhibitor proteins on F-ATPases. J Biol Chem 277: 41334-41341
Cabezon E, Butler PJ, Runswick MJ, Walker JE (2000b) Modulation of the oligomerization state of the bovine F1-ATPase inhibitor protein, IF1, by pH. J Biol Chem 275: 25460-25464
Cabezon E, Runswick MJ, Leslie AG, Walker JE (2001) The structure of bovine IF(1), the regulatory subunit of mitochondrial F-ATPase. EMBO J 20: 6990-6996
Chipuk JE, Bouchier-Hayes L, Green DR (2006) Mitochondrial outer membrane permeabilization during apoptosis: the innocent bystander scenario. Cell Death Differ 13: 1396-1402
Cingolani G, Duncan TM (2011) Structure of the ATP synthase catalytic complex (F(1)) from Escherichia coli in an autoinhibited conformation. Nat Struct Mol Biol 18: 701-707
Cintron NM, Pedersen PL (1979) A protein inhibitor of the mitochondrial adenosine triphosphatase complex of rat liver. Purification and characterization. J Biol Chem 254: 3439-3443
Corvest V, Sigalat C, Haraux F (2007) Insight into the bind-lock mechanism of the yeast mitochondrial ATP synthase inhibitory peptide. Biochemistry 46: 8680-8688

149
Corvest V, Sigalat C, Venard R, Falson P, Mueller DM, Haraux F (2005) The binding mechanism of the yeast F1-ATPase inhibitory peptide: role of catalytic intermediates and enzyme turnover. J Biol Chem 280: 9927-9936
Dautant A, Velours J, Giraud MF (2010) Crystal structure of the Mg.ADP-inhibited state of the yeast F1c10-ATP synthase. J Biol Chem 285: 29502-29510
Devenish RJ, Prescott M, Boyle GM, Nagley P (2000) The oligomycin axis of mitochondrial ATP synthase: OSCP and the proton channel. J Bioenerg Biomembr 32: 507-515
Di Pancrazio F, Mavelli I, Isola M, Losano G, Pagliaro P, Harris DA, Lippe G (2004) In vitro and in vivo studies of F(0)F(1)ATP synthase regulation by inhibitor protein IF(1) in goat heart. Biochim Biophys Acta 1659: 52-62
Di Pietro A, Godinot C, Gautheron DC (1981) Interaction between catalytic and regulatory sites of mitochondrial F1 adenosine-5'-triphosphatase as monitored by the differential effects of inhibitors and nucleotide analogues on the "hysteretic" behavior of the enzyme. Biochemistry 20: 6312-6318
Di Pietro A, Penin F, Godinot C, Gautheron DC (1980) "Hysteric" behavior and nucleotide binding sites of pig heart mitochondrial F1 adenosine 5'-triphosphatase. Biochemistry 19: 5671-5678
Dickson VK, Silvester JA, Fearnley IM, Leslie AG, Walker JE (2006) On the structure of the stator of the mitochondrial ATP synthase. EMBO J 25: 2911-2918
Diez M, Zimmermann B, Borsch M, Konig M, Schweinberger E, Steigmiller S, Reuter R, Felekyan S, Kudryavtsev V, Seidel CA, Graber P (2004) Proton-powered subunit rotation in single membrane-bound F0F1-ATP synthase. Nat Struct Mol Biol 11: 135-141
Dimroth P, von Ballmoos C, Meier T (2006) Catalytic and mechanical cycles in F-ATP synthases. Fourth in the Cycles Review Series. EMBO Rep 7: 276-282
Dou C, Fortes PA, Allison WS (1998) The alpha 3(beta Y341W)3 gamma subcomplex of the F1-ATPase from the thermophilic Bacillus PS3 fails to

150
dissociate ADP when MgATP is hydrolyzed at a single catalytic site and attains maximal velocity when three catalytic sites are saturated with MgATP. Biochemistry 37: 16757-16764
Duncan TM, Bulygin VV, Zhou Y, Hutcheon ML, Cross RL (1995) Rotation of subunits during catalysis by Escherichia coli F1-ATPase. Proc Natl Acad Sci U S A 92: 10964-10968
Eble KS, Coleman WB, Hantgan RR, Cunningham CC (1990) Tightly associated cardiolipin in the bovine heart mitochondrial ATP synthase as analyzed by 31P nuclear magnetic resonance spectroscopy. J Biol Chem 265: 19434-19440
Efremov RG, Baradaran R, Sazanov LA (2010) The architecture of respiratory complex I. Nature 465: 441-445
Eubel H, Jansch L, Braun HP (2003) New insights into the respiratory chain of plant mitochondria. Supercomplexes and a unique composition of complex II. Plant Physiol 133: 274-286
Faccenda D, Campanella M (2012) Molecular Regulation of the Mitochondrial F(1)F(o)-ATPsynthase: Physiological and Pathological Significance of the Inhibitory Factor 1 (IF(1)). Int J Cell Biol 2012: 367934
Feniouk BA, Suzuki T, Yoshida M (2006) The role of subunit epsilon in the catalysis and regulation of FOF1-ATP synthase. Biochim Biophys Acta 1757: 326-338
Fillingame RH, Angevine CM, Dmitriev OY (2002) Coupling proton movements to c-ring rotation in F(1)F(o) ATP synthase: aqueous access channels and helix rotations at the a-c interface. Biochim Biophys Acta 1555: 29-36
Fillingame RH, Dmitriev OY (2002) Structural model of the transmembrane Fo rotary sector of H+-transporting ATP synthase derived by solution NMR and intersubunit cross-linking in situ. Biochim Biophys Acta 1565: 232-245
Fillingame RH, Jiang W, Dmitriev OY (2000) The oligomeric subunit C rotor in the fo sector of ATP synthase: unresolved questions in our understanding of function. J Bioenerg Biomembr 32: 433-439
151
Formentini L, Sanchez-Arago M, Sanchez-Cenizo L, Cuezva JM (2012) The mitochondrial ATPase inhibitory factor 1 triggers a ROS-mediated retrograde prosurvival and proliferative response. Mol Cell 45: 731-742
Gao X, Wen X, Esser L, Quinn B, Yu L, Yu CA, Xia D (2003) Structural basis for the quinone reduction in the bc1 complex: a comparative analysis of crystal structures of mitochondrial cytochrome bc1 with bound substrate and inhibitors at the Qi site. Biochemistry 42: 9067-9080
Garcia JJ, Capaldi RA (1998) Unisite catalysis without rotation of the gamma-epsilon domain in Escherichia coli F1-ATPase. J Biol Chem 273: 15940-15945
Gibbons C, Montgomery MG, Leslie AG, Walker JE (2000) The structure of the central stalk in bovine F(1)-ATPase at 2.4 A resolution. Nat Struct Biol 7: 1055-1061
Gietz RD, Schiestl RH, Willems AR, Woods RA (1995) Studies on the transformation of intact yeast cells by the LiAc/SS-DNA/PEG procedure. Yeast 11: 355-360
Girvin ME, Rastogi VK, Abildgaard F, Markley JL, Fillingame RH (1998) Solution structure of the transmembrane H+-transporting subunit c of the F1F0 ATP synthase. Biochemistry 37: 8817-8824
Gledhill JR, Montgomery MG, Leslie AG, Walker JE (2007a) How the regulatory protein, IF(1), inhibits F(1)-ATPase from bovine mitochondria. Proc Natl Acad Sci U S A 104: 15671-15676
Gledhill JR, Montgomery MG, Leslie AG, Walker JE (2007b) Mechanism of inhibition of bovine F1-ATPase by resveratrol and related polyphenols. Proc Natl Acad Sci U S A 104: 13632-13637
Gledhill JR, Walker JE (2005) Inhibition sites in F1-ATPase from bovine heart mitochondria. Biochem J 386: 591-598
Groth G, Pohl E (2001) The structure of the chloroplast F1-ATPase at 3.2 A resolution. J Biol Chem 276: 1345-1352

152
Gruber G, Capaldi RA (1996) Differentiation of catalytic sites on Escherichia coli F1ATPase by laser photoactivated labeling with [3H]-2-Azido-ATP using the mutant beta Glu381Cys:epsilonSer108Cys to identify different beta subunits by their interactions with gamma and epsilon subunits. Biochemistry 35: 3875-3879
Grubmeyer C, Cross RL, Penefsky HS (1982) Mechanism of ATP hydrolysis by beef heart mitochondrial ATPase. Rate constants for elementary steps in catalysis at a single site. J Biol Chem 257: 12092-12100
Guelin E, Chevallier J, Rigoulet M, Guerin B, Velours J (1993) ATP synthase of yeast mitochondria. Isolation and disruption of the ATP epsilon gene. J Biol Chem 268: 161-167
Hadavi S, Markowitz SN, Reyes SV (2013) Leber's neuropathy and preferred retinal loci. Can J Ophthalmol 48: e8-9
Hara KY, Kato-Yamada Y, Kikuchi Y, Hisabori T, Yoshida M (2001) The role of the betaDELSEED motif of F1-ATPase: propagation of the inhibitory effect of the epsilon subunit. J Biol Chem 276: 23969-23973
Hara KY, Noji H, Bald D, Yasuda R, Kinosita K, Jr., Yoshida M (2000) The role of the DELSEED motif of the beta subunit in rotation of F1-ATPase. J Biol Chem 275: 14260-14263
Hashimoto T, Negawa Y, Tagawa K (1981) Binding of intrinsic ATPase inhibitor to mitochondrial ATPase--stoichiometry of binding of nucleotides, inhibitor, and enzyme. J Biochem 90: 1151-1157
Hashimoto T, Yoshida Y, Tagawa K (1990) Simultaneous bindings of ATPase inhibitor and 9K protein to F1F0-ATPase in the presence of 15K protein in yeast mitochondria. J Biochem 108: 17-20
Hausrath AC, Gruber G, Matthews BW, Capaldi RA (1999) Structural features of the gamma subunit of the Escherichia coli F(1) ATPase revealed by a 4.4-A resolution map obtained by x-ray crystallography. Proc Natl Acad Sci U S A 96: 13697-13702

153
Havlickova V, Kaplanova V, Nuskova H, Drahota Z, Houstek J (2010) Knockdown of F1 epsilon subunit decreases mitochondrial content of ATP synthase and leads to accumulation of subunit c. Biochim Biophys Acta 1797: 1124-1129
Henze K, Martin W (2003) Evolutionary biology: essence of mitochondria. Nature 426: 127-128
Herrmann JM, Neupert W (2000) Protein transport into mitochondria. Curr Opin Microbiol 3: 210-214
Hong S, Pedersen PL (2002) ATP synthase of yeast: structural insight into the different inhibitory potencies of two regulatory peptides and identification of a new potential regulator. Arch Biochem Biophys 405: 38-43
Ichikawa N, Karaki A, Kawabata M, Ushida S, Mizushima M, Hashimoto T (2001) The region from phenylalanine-17 to phenylalanine-28 of a yeast mitochondrial ATPase inhibitor is essential for its ATPase inhibitory activity. J Biochem 130: 687-693
Iino R, Murakami T, Iizuka S, Kato-Yamada Y, Suzuki T, Yoshida M (2005) Real-time monitoring of conformational dynamics of the epsilon subunit in F1-ATPase. J Biol Chem 280: 40130-40134
Iwata S, Ostermeier C, Ludwig B, Michel H (1995) Structure at 2.8 A resolution of cytochrome c oxidase from Paracoccus denitrificans. Nature 376: 660-669
Jager H, Birkenhager R, Stalz WD, Altendorf K, Deckers-Hebestreit G (1998) Topology of subunit a of the Escherichia coli ATP synthase. Eur J Biochem 251: 122-132
Jiang W, Hermolin J, Fillingame RH (2001) The preferred stoichiometry of c subunits in the rotary motor sector of Escherichia coli ATP synthase is 10. Proc Natl Acad Sci U S A 98: 4966-4971
Junge W, Lill H, Engelbrecht S (1997) ATP synthase: an electrochemical transducer with rotatory mechanics. Trends Biochem Sci 22: 420-423

154
Kabaleeswaran V, Puri N, Walker JE, Leslie AG, Mueller DM (2006) Novel features of the rotary catalytic mechanism revealed in the structure of yeast F1 ATPase. EMBO J 25: 5433-5442
Kabaleeswaran V, Shen H, Symersky J, Walker JE, Leslie AG, Mueller DM (2009) Asymmetric structure of the yeast F1 ATPase in the absence of bound nucleotides. J Biol Chem 284: 10546-10551
Karrasch S, Walker JE (1999) Novel features in the structure of bovine ATP synthase. J Mol Biol 290: 379-384
Komatsu-Takaki M (1989) Energy-dependent conformational changes in the epsilon subunit of the chloroplast ATP synthase (CF0CF1). J Biol Chem 264: 17750-17753
Kovarova N, Cizkova Vrbacka A, Pecina P, Stranecky V, Pronicka E, Kmoch S, Houstek J (2012) Adaptation of respiratory chain biogenesis to cytochrome c oxidase deficiency caused by SURF1 gene mutations. Biochim Biophys Acta 1822: 1114-1124
Kramer DM, Roberts AG, Muller F, Cape J, Bowman MK (2004) Q-cycle bypass reactions at the Qo site of the cytochrome bc1 (and related) complexes. Methods Enzymol 382: 21-45
Krause F, Reifschneider NH, Goto S, Dencher NA (2005) Active oligomeric ATP synthases in mammalian mitochondria. Biochem Biophys Res Commun 329: 583-590
Kuki M, Noumi T, Maeda M, Amemura A, Futai M (1988) Functional domains of epsilon subunit of Escherichia coli H+-ATPase (F0F1). J Biol Chem 263: 17437-17442
Lau WC, Baker LA, Rubinstein JL (2008) Cryo-EM structure of the yeast ATP synthase. J Mol Biol 382: 1256-1264
Lee RS, Pagan J, Satre M, Vignais PV, Senior AE (1989) Identification of a mutation in Escherichia coli F1-ATPase beta-subunit conferring resistance to aurovertin. FEBS Lett 253: 269-272
155
Lesnefsky EJ, Moghaddas S, Tandler B, Kerner J, Hoppel CL (2001) Mitochondrial dysfunction in cardiac disease: ischemia--reperfusion, aging, and heart failure. J Mol Cell Cardiol 33: 1065-1089
Long JC, Wang S, Vik SB (1998) Membrane topology of subunit a of the F1F0 ATP synthase as determined by labeling of unique cysteine residues. J Biol Chem 273: 16235-16240
Marzuki S, Watkins LC, Choo WM (1989) Mitochondrial H+-ATPase in mutants of Saccharomyces cerevisiae with defective subunit 8 of the enzyme complex. Biochim Biophys Acta 975: 222-230
Matsubara H, Hase T, Hashimoto T, Tagawa K (1981) Amino acid sequence of an intrinsic inhibitor of mitochondrial ATPase from yeast. J Biochem 90: 1159-1165
Meier T, Ferguson SA, Cook GM, Dimroth P, Vonck J (2006) Structural investigations of the membrane-embedded rotor ring of the F-ATPase from Clostridium paradoxum. J Bacteriol 188: 7759-7764
Meier T, Morgner N, Matthies D, Pogoryelov D, Keis S, Cook GM, Dimroth P, Brutschy B (2007) A tridecameric c ring of the adenosine triphosphate (ATP) synthase from the thermoalkaliphilic Bacillus sp. strain TA2.A1 facilitates ATP synthesis at low electrochemical proton potential. Mol Microbiol 65: 1181-1192
Milgrom Ya M (1989) An ATP dependence of mitochondrial F1-ATPase inactivation by the natural inhibitor protein agrees with the alternating-site binding-change mechanism. FEBS Lett 246: 202-206
Milgrom Ya M, Murataliev MB (1987a) On the rate of F1-ATPase turnover during ATP hydrolysis by the single catalytic site. Evidence that hydrolysis with a slow rate of product release does not occur at the alternating active site. FEBS Lett 222: 32-36
Milgrom Ya M, Murataliev MB (1987b) Steady-state rate of F1-ATPase turnover during ATP hydrolysis by the single catalytic site. FEBS Lett 212: 63-67
Milgrom YM, Cross RL (1997) Nucleotide-depleted beef heart F1-ATPase exhibits strong positive catalytic cooperativity. J Biol Chem 272: 32211-32214
156
Milgrom YM, Cross RL (2005) Rapid hydrolysis of ATP by mitochondrial F1-ATPase correlates with the filling of the second of three catalytic sites. Proc Natl Acad Sci U S A 102: 13831-13836
Milgrom YM, Ehler LL, Boyer PD (1990) ATP binding at noncatalytic sites of soluble chloroplast F1-ATPase is required for expression of the enzyme activity. J Biol Chem 265: 18725-18728
Minet M, Dufour ME, Lacroute F (1992) Complementation of Saccharomyces cerevisiae auxotrophic mutants by Arabidopsis thaliana cDNAs. Plant J 2: 417-422
Mnatsakanyan N, Kemboi SK, Salas J, Weber J (2011) The beta subunit loop that couples catalysis and rotation in ATP synthase has a critical length. J Biol Chem 286: 29788-29796
Mnatsakanyan N, Krishnakumar AM, Suzuki T, Weber J (2009) The role of the betaDELSEED-loop of ATP synthase. J Biol Chem 284: 11336-11345
Murataliev MB, Boyer PD (1994) Interaction of mitochondrial F1-ATPase with trinitrophenyl derivatives of ATP and ADP. Participation of third catalytic site and role of Mg2+ in enzyme inactivation. J Biol Chem 269: 15431-15439
Nelson N, Perzov N, Cohen A, Hagai K, Padler V, Nelson H (2000) The cellular biology of proton-motive force generation by V-ATPases. J Exp Biol 203: 89-95
Nishizaka T, Oiwa K, Noji H, Kimura S, Muneyuki E, Yoshida M, Kinosita K, Jr. (2004) Chemomechanical coupling in F1-ATPase revealed by simultaneous observation of nucleotide kinetics and rotation. Nat Struct Mol Biol 11: 142-148
Noji H, Yasuda R, Yoshida M, Kinosita K, Jr. (1997) Direct observation of the rotation of F1-ATPase. Nature 386: 299-302
Norais N, Prome D, Velours J (1991) ATP synthase of yeast mitochondria. Characterization of subunit d and sequence analysis of the structural gene ATP7. J Biol Chem 266: 16541-16549

157
Norling B, Tourikas C, Hamasur B, Glaser E (1990) Evidence for an endogenous ATPase inhibitor protein in plant mitochondria. Purification and characterization. Eur J Biochem 188: 247-252
Nowak KF, Tabidze V, McCarty RE (2002) The C-terminal domain of the epsilon subunit of the chloroplast ATP synthase is not required for ATP synthesis. Biochemistry 41: 15130-15134
Oyedotun KS, Lemire BD (2004) The quaternary structure of the Saccharomyces cerevisiae succinate dehydrogenase. Homology modeling, cofactor docking, and molecular dynamics simulation studies. J Biol Chem 279: 9424-9431
Palade GE (1952) The fine structure of mitochondria. Anat Rec 114: 427-451
Paumard P, Vaillier J, Coulary B, Schaeffer J, Soubannier V, Mueller DM, Brethes D, di Rago JP, Velours J (2002) The ATP synthase is involved in generating mitochondrial cristae morphology. EMBO J 21: 221-230
Pavlakis SG, Phillips PC, DiMauro S, De Vivo DC, Rowland LP (1984) Mitochondrial myopathy, encephalopathy, lactic acidosis, and strokelike episodes: a distinctive clinical syndrome. Ann Neurol 16: 481-488
Perkins GA, Frey TG (2000) Recent structural insight into mitochondria gained by microscopy. Micron 31: 97-111
Petersen J, Forster K, Turina P, Graber P (2012) Comparison of the H+/ATP ratios of the H+-ATP synthases from yeast and from chloroplast. Proc Natl Acad Sci U S A 109: 11150-11155
Pfeiffer K, Gohil V, Stuart RA, Hunte C, Brandt U, Greenberg ML, Schagger H (2003) Cardiolipin stabilizes respiratory chain supercomplexes. J Biol Chem 278: 52873-52880
Plesner L (1995) Ecto-ATPases: identities and functions. Int Rev Cytol 158: 141-214

158
Pogoryelov D, Reichen C, Klyszejko AL, Brunisholz R, Muller DJ, Dimroth P, Meier T (2007) The oligomeric state of c rings from cyanobacterial F-ATP synthases varies from 13 to 15. J Bacteriol 189: 5895-5902
Polgreen KE, Featherstone J, Willis AC, Harris DA (1995) Primary structure and properties of the inhibitory protein of the mitochondrial ATPase (H(+)-ATP synthase) from potato. Biochim Biophys Acta 1229: 175-180
Pullman ME, Monroy GC (1963) A Naturally Occurring Inhibitor of Mitochondrial Adenosine Triphosphatase. J Biol Chem 238: 3762-3769
Rastogi VK, Girvin ME (1999) 1H, 13C, and 15N assignments and secondary structure of the high pH form of subunit c of the F1F0 ATP synthase. J Biomol NMR 13: 91-92
Richter ML, McCarty RE (1987) Energy-dependent changes in the conformation of the epsilon subunit of the chloroplast ATP synthase. J Biol Chem 262: 15037-15040
Rigoulet M, Mourier A, Galinier A, Casteilla L, Devin A (2010) Electron competition process in respiratory chain: regulatory mechanisms and physiological functions. Biochim Biophys Acta 1797: 671-677
Robinson GC, Bason JV, Montgomery MG, Fearnley IM, Mueller DM, Leslie AG, Walker JE (2013) The structure of F(1)-ATPase from Saccharomyces cerevisiae inhibited by its regulatory protein IF(1). Open Biol 3: 120164
Rodgers AJ, Wilce MC (2000) Structure of the gamma-epsilon complex of ATP synthase. Nat Struct Biol 7: 1051-1054
Rubinstein JL, Walker JE, Henderson R (2003) Structure of the mitochondrial ATP synthase by electron cryomicroscopy. EMBO J 22: 6182-6192
Sambongi Y, Iko Y, Tanabe M, Omote H, Iwamoto-Kihara A, Ueda I, Yanagida T, Wada Y, Futai M (1999) Mechanical rotation of the c subunit oligomer in ATP synthase (F0F1): direct observation. Science 286: 1722-1724

159
Sanchez-Cenizo L, Formentini L, Aldea M, Ortega AD, Garcia-Huerta P, Sanchez-Arago M, Cuezva JM (2010) Up-regulation of the ATPase inhibitory factor 1 (IF1) of the mitochondrial H+-ATP synthase in human tumors mediates the metabolic shift of cancer cells to a Warburg phenotype. J Biol Chem 285: 25308-25313
Santolini J, Minoletti C, Gomis JM, Sigalat C, Andre F, Haraux F (2002) An insight into the mechanism of inhibition and reactivation of the F(1)-ATPases by tentoxin. Biochemistry 41: 6008-6018
Schwerzmann K, Pedersen PL (1986) Regulation of the mitochondrial ATP synthase/ATPase complex. Arch Biochem Biophys 250: 1-18
Shoffner JM (1999) Oxidative phosphorylation disease diagnosis. Semin Neurol 19: 341-351
Spannagel C, Vaillier J, Arselin G, Graves PV, Velours J (1997) The subunit f of mitochondrial yeast ATP synthase--characterization of the protein and disruption of the structural gene ATP17. Eur J Biochem 247: 1111-1117
Steigmiller S, Turina P, Graber P (2008) The thermodynamic H+/ATP ratios of the H+-ATPsynthases from chloroplasts and Escherichia coli. Proc Natl Acad Sci U S A 105: 3745-3750
Stock D, Leslie AG, Walker JE (1999) Molecular architecture of the rotary motor in ATP synthase. Science 286: 1700-1705
Suzuki T, Murakami T, Iino R, Suzuki J, Ono S, Shirakihara Y, Yoshida M (2003) F0F1-ATPase/synthase is geared to the synthesis mode by conformational rearrangement of epsilon subunit in response to proton motive force and ADP/ATP balance. J Biol Chem 278: 46840-46846
Tanigawara M, Tabata KV, Ito Y, Ito J, Watanabe R, Ueno H, Ikeguchi M, Noji H (2012) Role of the DELSEED loop in torque transmission of F1-ATPase. Biophys J 103: 970-978
Thomas D, Bron P, Weimann T, Dautant A, Giraud MF, Paumard P, Salin B, Cavalier A, Velours J, Brethes D (2008) Supramolecular organization of the yeast F1Fo-ATP synthase. Biol Cell 100: 591-601

160
Toei M, Gerle C, Nakano M, Tani K, Gyobu N, Tamakoshi M, Sone N, Yoshida M, Fujiyoshi Y, Mitsuoka K, Yokoyama K (2007) Dodecamer rotor ring defines H+/ATP ratio for ATP synthesis of prokaryotic V-ATPase from Thermus thermophilus. Proc Natl Acad Sci U S A 104: 20256-20261
Tsukihara T, Aoyama H, Yamashita E, Tomizaki T, Yamaguchi H, Shinzawa-Itoh K, Nakashima R, Yaono R, Yoshikawa S (1996) The whole structure of the 13-subunit oxidized cytochrome c oxidase at 2.8 A. Science 272: 1136-1144
Tsunoda SP, Rodgers AJ, Aggeler R, Wilce MC, Yoshida M, Capaldi RA (2001) Large conformational changes of the epsilon subunit in the bacterial F1F0 ATP synthase provide a ratchet action to regulate this rotary motor enzyme. Proc Natl Acad Sci U S A 98: 6560-6564
Tucker WC, Du Z, Hein R, Gromet-Elhanan Z, Richter ML (2001) Role of the ATP synthase alpha-subunit in conferring sensitivity to tentoxin. Biochemistry 40: 7542-7548
Uchihashi T, Iino R, Ando T, Noji H (2011) High-speed atomic force microscopy reveals rotary catalysis of rotorless F(1)-ATPase. Science 333: 755-758
van Raaij MJ, Abrahams JP, Leslie AG, Walker JE (1996a) The structure of bovine F1-ATPase complexed with the antibiotic inhibitor aurovertin B. Proc Natl Acad Sci U S A 93: 6913-6917
van Raaij MJ, Orriss GL, Montgomery MG, Runswick MJ, Fearnley IM, Skehel JM, Walker JE (1996b) The ATPase inhibitor protein from bovine heart mitochondria: the minimal inhibitory sequence. Biochemistry 35: 15618-15625
Venard R, Brethes D, Giraud MF, Vaillier J, Velours J, Haraux F (2003) Investigation of the role and mechanism of IF1 and STF1 proteins, twin inhibitory peptides which interact with the yeast mitochondrial ATP synthase. Biochemistry 42: 7626-7636
Vik SB, Antonio BJ (1994) A mechanism of proton translocation by F1F0 ATP synthases suggested by double mutants of the a subunit. J Biol Chem 269: 30364-30369
161
Vik SB, Long JC, Wada T, Zhang D (2000) A model for the structure of subunit a of the Escherichia coli ATP synthase and its role in proton translocation. Biochim Biophys Acta 1458: 457-466
Wach A, Brachat A, Pohlmann R, Philippsen P (1994) New heterologous modules for classical or PCR-based gene disruptions in Saccharomyces cerevisiae. Yeast 10: 1793-1808
Walker JE, Fearnley IM, Gay NJ, Gibson BW, Northrop FD, Powell SJ, Runswick MJ, Saraste M, Tybulewicz VL (1985) Primary structure and subunit stoichiometry of F1-ATPase from bovine mitochondria. J Mol Biol 184: 677-701
Watt IN, Montgomery MG, Runswick MJ, Leslie AG, Walker JE (2010) Bioenergetic cost of making an adenosine triphosphate molecule in animal mitochondria. Proc Natl Acad Sci U S A 107: 16823-16827
Watts SD, Zhang Y, Fillingame RH, Capaldi RA (1995) The gamma subunit in the Escherichia coli ATP synthase complex (ECF1F0) extends through the stalk and contacts the c subunits of the F0 part. FEBS Lett 368: 235-238
Weber J, Bowman C, Senior AE (1996) Specific tryptophan substitution in catalytic sites of Escherichia coli F1-ATPase allows differentiation between bound substrate ATP and product ADP in steady-state catalysis. J Biol Chem 271: 18711-18718
Weber J, Senior AE (2000) ATP synthase: what we know about ATP hydrolysis and what we do not know about ATP synthesis. Biochim Biophys Acta 1458: 300-309
Weber J, Senior AE (2001) Bi-site catalysis in F1-ATPase: does it exist? J Biol Chem 276: 35422-35428
Weber J, Wilke-Mounts S, Lee RS, Grell E, Senior AE (1993) Specific placement of tryptophan in the catalytic sites of Escherichia coli F1-ATPase provides a direct probe of nucleotide binding: maximal ATP hydrolysis occurs with three sites occupied. J Biol Chem 268: 20126-20133
Weber J, Wilke-Mounts S, Senior AE (1994) Cooperativity and stoichiometry of substrate binding to the catalytic sites of Escherichia coli F1-

162
ATPase. Effects of magnesium, inhibitors, and mutation. J Biol Chem 269: 20462-20467
Wilkens S, Capaldi RA (1998) ATP synthase's second stalk comes into focus. Nature 393: 29
Wu SB, Ma YS, Wu YT, Chen YC, Wei YH (2010) Mitochondrial DNA mutation-elicited oxidative stress, oxidative damage, and altered gene expression in cultured cells of patients with MERRF syndrome. Mol Neurobiol 41: 256-266
Yasuda R, Noji H, Kinosita K, Jr., Yoshida M (1998) F1-ATPase is a highly efficient molecular motor that rotates with discrete 120 degree steps. Cell 93: 1117-1124
Yasuda R, Noji H, Yoshida M, Kinosita K, Jr., Itoh H (2001) Resolution of distinct rotational substeps by submillisecond kinetic analysis of F1-ATPase. Nature 410: 898-904
Yoshida M, Muneyuki E, Hisabori T (2001) ATP synthase--a marvellous rotary engine of the cell. Nat Rev Mol Cell Biol 2: 669-677
Zhang M, Mileykovskaya E, Dowhan W (2005) Cardiolipin is essential for organization of complexes III and IV into a supercomplex in intact yeast mitochondria. J Biol Chem 280: 29403-29408

163

164
Appendix
Article submitted to
Biochimica Biophysica Acta Bioenergetics
Under revision

165
166
Interactions involved in grasping and locking of the inhibitory peptide IF1 by mitochondrial ATP
synthase
Qian Wu 1, #, Tiona Andrianaivomananjaona 1, #, Emmanuel Tetaud 2, Vincent Corvest 1, 3 and Francis
Haraux 1
1 UMR 8221 CNRS-CEA-Université Paris-Sud, iBiTec-S CEA Saclay, 91191 Gif-sur-Yvette, France
[email protected]; [email protected]
2 Institut de Biochimie et Génétique Cellulaires, UMR 5095 CNRS, Université Victor Segalen, 1, rue
Camille Saint Saëns, 33077 Bordeaux, France
3 present address: Calixar, 7 Passage du Vercors, 69007 Lyon, France
# Contributed equally to this work
Address correspondence to: Francis Haraux, UMR 8221 CNRS-CEA-Université Paris-Sud, iBiTec-S
CEA Saclay, 91191 Gif-sur-Yvette, France; Tel.: 33 (0) 1 69 08 98 91; Fax: 33 (0) 1 69 08 87 17; E-mail:

167
ABSTRACT
When mitochondria gets deenergized, futile ATP hydrolysis is prevented by reversible binding of an
inhibitory peptide called IF1 to ATP synthase. Between IF1 initial binding and locking the enzyme
experiences large conformational changes. Structural studies give access to analysis of the dead-end
inhibited state, not of the transient ones. Here, we studied both initial and final states by reporting, for the
first time, the consequences of mutations of Saccharomyces cerevisiae ATP synthase on its inhibition by
IF1. Kinetic studies allowed identifying amino acids or motifs of the enzyme involved in recognition
and/or locking of IF1 α-helical midpart. This led to draw an outline of IF1 binding process. In the
recognition step, α and especially β subunits protruding parts grasp IF1, probably by a few residues of its
α-helical midpart. Locking IF1 within the αβ interface involves additional residues of both subunits.
Interactions of α and β subunits with the foot of the γ subunit might contribute to lock and to stabilize the
dead-end state.
KEYWORDS
ATP synthase
IF1 inhibitory peptide
mitochondria
kinetics
protein-protein interactions
regulation
ABBREVIATIONS
The abbreviations used are: F0F1-ATPase, ATP synthase complex (EC 3.6.3.14); F1-ATPase, isolated
extrinsic part of ATP synthase; IF1, endogenous inhibitory peptide of mitochondrial ATP synthase; yIF1,
IF1 from yeast; SMP, submitochondrial particles; pmf, protonmotive force; Tris,
tris(hydroxymethyl)aminomethane; MES, 2-(N-morpholino)ethanesulfonic acid; FCCP, carbonyl
cyanide-p-trifluoromethoxyphenylhydrazone; Ni-NTA, nickel-nitrilotriacetic acid; PGK,
phosphoglycerate kinase; KanMX4, kanamycin-resistance gene; G418, geneticin.

168
1. INTRODUCTION
ATP synthase, also called F0F1-ATPase, plays a key role in energetics of the cell. This enzymatic
complex is anchored to bacterial, chloroplastic and mitochondrial energy-transducing membranes. It
consists of a membranous sector (F0) and an extrinsic subcomplex (F1). It recycles ATP, the main
biological energy vector, at the expense of a transmembrane electrochemical proton gradient also called
protonmotive force (pmf) [1]. ATP synthase is a molecular motor driven by protons [2]. A downhill
proton flow through the F0 sector rotates a cylindrical homo-oligomer containing 8 or 10 transmembrane
c subunits [3-4] in the case of mitochondria and bound to the central shaft (γδε subunits) of the extrinsic
part of the complex. The rotation is thus transmitted to the γ subunit, that sequentially distorts the three
catalytic sites located at the interfaces of the peripheral α and β subunits arranged in a (αβ)3 crown-like
structure. These conformational changes induce binding of ADP and inorganic phosphate (Pi), their
condensation into ATP and the release of ATP, according to the classical "binding-change" mechanism
[5]. Viewed from the membrane, the central shaft rotates clockwise during ATP synthesis and in the
opposite direction during ATP hydrolysis [2, 6]. The direction of the reaction depends on the energetic
balance between the pmf and the Gibbs' free energy of the reaction, determined by ADP, Pi and ATP
concentrations.
The activity of ATP synthase is regulated. Collapse of the pmf, which should theoretically
trigger ATP hydrolysis, actually leads to enzyme inhibition. In mitochondria, this process involves a
regulatory peptide called IF1 [7]. IF1 is a soluble peptide, 84 residues-long in B. taurus and 63 residues-
long in S. cerevisiae [8]. Its structure is α-helical, except for its N-terminal extremity [9-11].
Radiocrystallographic structures of bovine and yeast F1-ATPases, with or without bound IF1, have been
published and revealed that the three catalytic (αβ) interfaces are in different conformations. These
interfaces are named (αβ)TP, (αβ)DP and (αβ)E. This nomenclature was given according to the catalytic
nucleotide occupancy (ATP analogue, ADP or empty) in the first published structure [12], and more
generally to the rotor orientation, which determines interface conformations even in the absence of
nucleotides [13]. In crystallized bovine and yeast F1-ATPase in complex with IF1, the inhibitory peptide
interacts with α, β and γ subunits. The middle part of IF1 is inserted in the (αβ)DP catalytic interface. The
N-terminal part mainly interacts with the central axis of the γ subunit and also with the αE subunit. The
C-terminal part is truncated in the bovine crystal and not visible in the yeast crystal [10-11].
When the inner membrane is deenergized, IF1 thus binds to the catalytic part of ATP synthase
and blocks ATP hydrolysis. As soon as the pmf is restored, the affinity of IF1 for ATP synthase
dramatically decreases, which leads to its release and therefore allows the enzyme to catalyze ATP
synthesis [14-21]. The reason for this pmf-dependent binding/release is not yet understood, its elucidation
requires analysis of IF1 binding dynamics. Previous studies with the isolated F1-ATPase subcomplex
have distinguished a first step, in which IF1 loosely binds to a catalytic site in an adequate conformation,
and a second step, turnover-dependent, in which it is trapped within the complex [22-23]. Kinetic
experiments using IF1 with the N-terminal extremity deleted [24-25] or attached to a globular protein

169
suggested that this part of IF1 is not involved in the recognition step but contributes to the stability of the
inhibited complex [24].
In this work, we intended to identify amino acids or motifs of F1-ATPase involved in the
different steps of IF1 binding process. To reach this goal, we mutated residues of S. cerevisiae ATP
synthase selected on the basis of structures of the IF1-inhibited F1-ATPase complex. Then, using
submitochondrial particles prepared from wild type and mutated cells, we studied the kinetics of
inhibition of ATP hydrolysis by IF1. For the first time, the effect of mutations in α, β and γ subunits on
IF1 binding parameters (kon, Kd and koff) was observed. These data reveal how the set of interactions
between IF1 and F1-ATPase subunits varies between IF1 grasping and formation of the dead-end state.
Moreover, they bring a new insight on the inhibition process by suggesting that subunit-subunit
interactions within F1-ATPase contribute to the stabilization of the inhibited complex.
2. MATERIALS AND METHODS
2.1. Mutagenesis of α subunit and β subunit - α subunit and β subunit mutagenesis was achieved
by transforming Δatp1 and/or Δatp2 S. cerevisiae cells with plasmids containing WT or mutated ATP1
and/or ATP2 genes, respectively. The plasmid with ATP1 gene was obtained by modifying the plasmid
pFL61 [26] as following. First, the 2 micron replication origin was replaced by the ARS/CEN replication
origin. Then, the coding DNA sequence of ATP1 gene was inserted into this plasmid under the control of
PGK promoter and terminator, leading to the plasmid pVC2-ATP1. The plasmid with ATP2 gene was
pRS313/ATP2-H10 [23]. Mutagenesis of ATP1 and ATP2 genes in the two plasmids was performed
using PCR. Primers used for PCR are displayed in Supplementary Material, Figure SM1. All mutants of α
subunit and most mutants of β subunit were obtained by successively transforming S. cerevisiae cells
(W303-1A-Δatp1Δatp2 MAT a, ade2-1, his3-1,15, leu2-3,112, trp1-1, ura3-1) kindly provided by Pr
David Mueller (Chicago, IL, USA) with pVC2-ATP1 and pRS313/ATP2-H10 plasmids. Cells were first
transformed by WT or mutated pRS313/ATP2-H10 and selected on a fermentable medium (FM)
containing 0.7% Yeast Nitrogen Base without aminoacids, 2% glucose, supplemented with 60 mg/L
leucine, 20 mg/L adenine, 20 mg/L tryptophan and 20 mg/L uracil. Selected cells were grown in a
medium containing 1% Yeast Extract, 1% Bacto Peptone and 2% glucose. Then they were transformed
with WT or mutated pVC2-ATP1 plasmid. Transformed cells were selected and grown at 30°C on a
strictly respiratory medium (RM) containing 1% yeast extract, 0.1% KH2PO4, 0.12% SO4(NH4)2, 2%
lactate, supplemented with 60 mg/L leucine, 20 mg/L adenine and 20 mg/L tryptophan, pH 5.5.
Auxotrophy of each of the mutated strains was checked on the final sample used for mitochondria
preparation. For double mutations β-T380R-S383E, β-E471K-A474E and the quadruple mutation β-
T380R-S383E-E471K-A474E, S. cerevisiae cells (Euroscarf BY4741-Datp2 MAT a, his3D1, leu2D0,
met15D0, ura3D0, YJR121w::kanMX4) were transformed with the WT or the mutated pRS313/ATP2-
H10 plasmid. Transformants were selected and grown at 30°C on RM supplemented with 40 mg/L

170
methionine, 60 mg/L leucine, 20 mg/L adenine, 20 mg/L tryptophan, 20 mg/L uracil, and 200 mg/L
G418 pH 5.5.
2.2. Mutagenesis of γ subunit - γ subunit mutagenesis was achieved by PCR amplification using
DNA from strain W303-1B as a template. Primers used for PCR are displayed in Supplementary
Material, Figure SM1. PCR product was digested with HindIII-NotI and ligated into the vector pES425#1
(Doron Rapaport). All mutants of γ subunit were obtained by transforming S. cerevisiae cells (W303-1B
MAT α, ade2-1, his3-1,15, leu2-3,112, trp1-1, ura3-1) with the pES452-γ vector and selected on FM
supplemented with 20 mg/L adenine, 20 mg/L tryptophan, 20 mg/L histidine and 20 mg/L uracil.
Obtained strains were subsequently deleted for ATP3 gene with the deletion cassette of ATP3 obtained
by the PCR amplification of the pUG6 plasmid containing the KanMX4 module [27] as a template and
primers displayed in Supplementary Material, Figure SM1. Transformants were selected on complete
synthetic medium supplemented with 200 µg/ml G418. Transformed cells were grown at 30°C on RM
supplemented with 20 mg/L adenine, 20 mg/L histidine, 20 mg/L uracil and 20 mg/L tryptophan, pH 5.5.
Auxotrophy of the mutated strains was checked on the final sample used for mitochondria preparation.
2.3. Biological materials - S. cerevisiae cells were grown at 30 °C in a large volume of RM as
indicated above, and cells were harvested in exponential phase to prepare mitochondria as previously
described [28]. Sub-mitochondrial particles devoid of IF1 were prepared by sonication in TSE (20 mM
Tris-SO4, 200 µM EDTA, pH 8.5) as previously [28], except that after endogenous IF1 release (4°C,
overnight) they were centrifuged for 20 min (8000 g, 4°C). The supernatant was then centrifuged for 40
min (100,000 g, 4°C), and the new pellet was resuspended into a small volume (100-200 µl) of TSE, then
kept on ice before use. His-tagged yIF1 was overexpressed in E. coli and the peptide was purified as
previously [24] using a Ni-NTA column. The His-tag was removed using enterokinase. yIF1 produced in
this work differed from the WT in two points: Phe28 was replaced by Trp to allow spectrophotometric
detection of the protein at 280 nm, and the first residue (Ser) was replaced by the triplet Ala-Met-Ala,
which was found to improve the purification and the stability of the peptide. None of these modifications
altered the binding properties of the inhibitory peptide.
2.4. ATP hydrolysis measurement and kinetic analysis - Continuous monitoring of ATP
hydrolysis by SMP coupled to NADH oxidation was carried out spectrophotometrically as described [24].
The reaction was observed in a stirred and thermostated cuvette (25°C) containing 50 mM MES (pH 6.5)
or 50 mM Tris (pH 8.0), 20 mM KCl, 1 mM MgCl2, 1 mM phosphoenolpyruvate, 20 units/mL pyruvate
kinase, 50 units/mL lactate dehydrogenase, 0.4 mM NADH, 1 mM MgATP, 2 µM antimycin and 2 µM
FCCP. ATP hydrolysis was initiated by adding SMP and monitored by NADH absorbance decrease at
340 nm. After 2-4 min, yIF1 was injected and ATPase activity decayed. The spectrophotometric
recording was fitted to the following function corresponding to a monoexponential decay of the ATPase
activity:
y(t) = v(I) t + [(V(0)-V(I))/kapp] [1- exp(- kapp t)] + y0 (1)

171
where y(t) is the absorbance at time t, and y0 the absorbance at zero time defined as the time of
IF1 addition. V(0) is the constant rate of absorbance variation before IF1 addition in absorbance units per
second (proportional to the initial ATPase activity), V(I) the final rate of absorbance variation after IF1
addition (proportional to the final ATPase activity), and kapp the apparent inhibition rate constant in s-1.
The obtained kapp value was plotted as a function of the inhibitor concentration [I] to determine the rate
constants kon (in M-1s-1) and koff (in s-1) according to:
kapp = kon [I] + koff (2)
The relation between the V(I)/V(0) ratio and the inhibitor concentration was fitted to the following
function:
V(I) / (V(0) = vr + (1- vr) / (1 + [I] / Kd) (3)
where vr is the inhibitor-insensitive fraction of V(0) (always lower than 5%). Theoretically, Kd
should be equal to the koff/kon ratio. koff was also directly calculated using the following linear
relationship between 1/kapp and V(I)/V(0), drawn from Eqns. (1) and (3):
V(I) / (V(0) = vr + [(1 - vr) / koff] (1 / kapp) (4)
kon, Kd and koff values and their standard errors were obtained by fitting the experimental data
with Eqns. (2), (3) and (4), respectively, using Microcal Origin software. In all of the experiments, the
inhibitor concentration was much higher than the enzyme concentration. Therefore the total and free
concentrations of inhibitor could be considered identical and constant during the kinetics of inhibition.
One experiment consisted in a set of at least ten kinetics obtained with different IF1 concentrations.
2.5. Chemicals and reagents - All reagents were of analytical grade. PCR mutagenesis was
carried out using the QuikChange Site-Directed Mutagenesis Kit from Stratagene (La Jolla, CA, USA).
DNA ligase was from New England Biolabs (Ipswitch, MA, USA). BCIP (5-bromo-4-chloro-3-indolyl
phosphate) and NBT (nitro blue tetrazolium) were from Bethesda Research Laboratories (Gaithersburg,
MD, USA). Yeast extract was from Difco (Detroit, MI, USA). ATP, NADH, and phosphoenolpyruvate
were purchased from Roche (Basel, Switzerland). Pyruvate kinase and lactate dehydrogenase were
purchased from Sigma-Aldrich (St Louis, MO, USA).

172
3. RESULTS
3.1. Classes of mutations in α and β subunits - In order to determine their role in IF1 recognition
and locking, we mutated some residues or groups of residues of the yeast ATP synthase and examined the
consequences of these mutations on IF1 binding parameters. To select the amino acids to be mutated, we
defined four distinct classes of residues surrounding IF1 in the crystallized IF1/F1-ATPase complexes
[10-11], two located in αDP subunit (classes A and C) and two in βDP subunit (classes B and D) (Figure
1). In each subunit, the two classes of residues were discriminated on the basis of the distance from the
foot of the γ subunit. Class A (α subunit) and B (β subunit) consist of discrete amino acids, remote from
γ, generally well conserved within mitochondrial ATP synthases but not in other ATP synthases. Class C
(α subunit) and D (β subunit) are motifs of contiguous, highly conserved amino acids, some of which
interact with γ.
3.2. Kinetic parameters estimates and meaning - The rate constant of association kon is related to
the recognition step, whereas thermodynamic and kinetic constants of dissociation, Kd and koff, are
inversely related to the stability of the inhibited complex. Figure 2 shows typical examples of
determination of these constants from single experiments. It has been previously shown that the measured
association rate constant kon of IF1 depends on MgATP concentration [29], because it is actually
modulated by the nucleotide occupancy and the catalytic turnover of F1-ATPase [22-23]. Experiments
reported here were carried out with 1 mM MgATP. At this MgATP concentration the kon value reaches a
plateau and represents the true rate binding constant. Importantly, the koff value was here estimated not
only by the Kdkon product as in previous studies [24-25, 11], but also by directly correlating kapp to the
residual activity at equilibrium (see Materials and Methods, Eqn. 4). This makes koff determination
insensitive to possible uncertainties on IF1 concentrations. Comparison of these two koff values allows
evaluating self-consistency, and then reliability of parameter estimates. Figure 2 shows an example of
single experiments from three phenotypes in which the koff/Kdkon ratios are 1.6 ± 1.2, 1.4 ± 0.5 and 1.05
± 0.26. These values are reasonably close to the theoretically expected ratio of 1.
3.3. Effect of mutations of γ-remote residues - The residues of classes A and B were selected on
the basis of two criteria: their proximity of IF1 in crystals and their relative specificity to mitochondrial
F1-ATPases (Figure SM2 of Supplementary Material). This second criterion was applied with the aim to
identify residues responsible for the fact that IF1 specifically inhibits mitochondrial ATP synthases in
vitro. IF1 peptides purified from B. taurus and S. cerevisiae indeed non-specifically inhibit F1-ATPase
from both species, but they do not inhibit F1-ATPase from E. coli [30]. Accordingly, purified yIF1 does
not inhibit F1-ATPase from PS3 bacillus and from spinach chloroplasts, even after removal of the ε
subunit in the latter case (Figure SM3 of Supplementary Material).
The selected residues were mutated into their non-mitochondrial counterparts (Figure SM2). All α-
subunit residues (E357, Y399, R400, V402, Q418) and two β-subunit residues (T380, S383) were
mutated into the residues present in almost chloroplastic sequences and in a number of bacterial
173
sequences. βE471 and βA474, located in a region poorly conserved in the non-mitochondrial world, were
respectively mutated into their E.coli and chloroplastic homologues. IF1 at saturating concentration
inhibited ATPase activity to more than 95% in SMP prepared from all these mutants. Binding parameters
were obtained after merging the results of several independent kinetic experiments as those displayed in
Fig. 2, 3-4 experiments for mutants, and 29 experiments for WT. The results obtained at pH 6.5 are
displayed in Table I. and Fig. 3a focuses on the values of IF1 association and dissociation constants, the
latter being estimated by koff as well as by the Kdkon product (see Materials and Methods and section
3.2). Combined mutagenesis of the five residues selected on α (class A) had no effect on the binding rate
constant kon. It increased the rate constant of dissociation or had no significant effect, depending whether
it is determined by koff or by the product Kdkon. On the β subunit (class B), the double mutation
T380R-S383E had no significant effect on kon value and the double mutation β-E471K-A474E decreased
the kon value by a factor of 7. Combining the four mutations has no significant additional effect as
compared to E471K-A474E. Mutations on the β subunit had no significant effect on the rate constant of
dissociation.
To precise the effects of the mutations on the dissociation rate constants, we did some
complementary experiments at pH 8 for which these constants are higher. At this pH, the Kd value of WT
dramatically increased from 0.24 nM to 9 nM, the koff value from 1.8 10-4 s-1 to 1.8 10-3 s-1, and the
Kdkon product from 0.9 10-4 to 2 10-3 s-1, which almost perfectly matches the koff value. Binding
constants values at pH 8 are displayed in Table II and kon, koff and Kdkon are shown in Figure 3b. It is
confirmed that the quintuple mutation on α subunit had no effect on kon, whereas it increased the koff
value and the Kdkon product by about 2.5 fold. It seems that the double mutation β-E471K-A474E or the
quadruple mutation β-T380R-S383E-E471K-A474E actually increased by a factor of 2 to 2.5 the
dissociation rate constant estimated either by koff or by Kdkon, whereas the double mutation β-T380R-
S383E had no effect.
3.4. Effect of mutations of α subunit residues close to the foot of γ subunit - This region of α
subunit was chosen for mutagenesis because in the αDP case it interacts with the foot of the γ subunit.
This interaction might indirectly contribute to the inhibitory effect of IF1. We studied IF1 binding
parameters after mutation into glycine of an increasing number of residues of the 409GSDLDAST416
motif. Results are displayed in Table I (Class C), and Fig. 4 focuses on the values of IF1 association and
dissociation constants. Mutations into glycine resulted in moderate decrease of the kon value and in more
pronounced decrease of IF1 affinity. The dissociation rate constant gradually increases with the number
of mutated residues, except when S410 is replaced by G, which results in a small decrease of koff :
compare 409GGGGGAST416 to 409GSGGGAST416 and 409GGGGGGGG416 to
409GSGGGGGG416. The highest koff value was obtained after mutating 6 amino acids into glycine. It
reached about 3 10-3 s-1, i.e 15-30 times the value obtained with the WT. Another mutation, which
consisted in removing α-D411, α-L412 and α-D413, had a higher effect on koff, which reached here 5 10-
3 s-1.

174
Globally, except for S410G, decreasing the steric hindrance of the α409GSDLDAST416 motif
tends to destabilize the inhibited IF1-F1ATPase complex. In the αDP subunit of the crystallized IF1-
ATPase complex, 409GSDLDAST416 amino acids face 116MQLL119 residues belonging to an α-helix
of the γ subunit. In particular, residues αD411, αL412 and αD413 are closer to this γ116MQLL119 motif
than to IF1 (Figure 1). This suggests that koff increase consecutive to their mutation or deletion could be
due, at least in part, to modifications of αDP-γ interactions in this region. In this case, diminishing the
steric hindrance of the γ116MQLL119 motif is also expected to increase koff. We have then performed
the double mutation γ-M116G-Q117G and the triple mutation γ-M116G-Q117G-L118G and examined
their effect on IF1 binding. Not surprisingly, these mutations had no effect on the kon value. The double
mutation γ-M116G-Q117G resulted in increasing the dissociation rate constant by more than 70%, a
limited but significant effect observed both at pH 6.5 and at pH 8. At pH 8, the koff value shifted from
1.8 10 3 s 1 (WT) to 3.1 10 3 s 1 (γ-M116G-Q117G). The triple mutation γ-M116G-Q117G-L118G
restored koff to the wild type value. The detailed results obtained at pH 8 are displayed in Table II and in
Figure 5.
Taken together, these results show that modifications in the α-γ contact region involving
409GSDLDAST416 and γ-116MQLL119 affect the dissociation rate constant and the affinity of the
peptide for the enzyme. The effect of the double mutation γ-M116G-Q117G is limited and reversed by
the additional γ-L118G mutation, but it remains consistent with a contribution of this α-γ contact in
stabilization of the IF1-inhibited complex.
3.5. Effect of mutations of β subunit residues close to the foot of γ subunit - DELSEED
(394DELSEQD400 in yeast) is a well-conserved motif of β subunit, which periodically interacts with γ
subunit during catalytic turnover [31]. Without being essential, it is involved in coupling catalysis to γ
subunit rotation [32-34] and has been proposed to play a role in the inhibitory effect of the bacterial
regulatory ε subunit [35], the counterpart of the mitochondrial δ subunit. Like αDP-409GSDLDAST416,
βDP-394DELSEQD400 is located in a region close to the foot of the γ subunit. Table I (Class D) shows
IF1 binding parameters of ATP synthase in which different residues of DELSEQD have been mutated
into glycine. These mutations had no effect of the rate constant of IF1 binding. All the mutations
increased the rate constant of dissociation. The most important increase (10-15 fold) was by far obtained
with the single mutation of αE395 into glycine, which suggests a specific role for this residue. This effect
was partly reversed by the additional double mutation αL396G-αS397G.
We also combined the two mutations that had separately the greatest effect on Kd and koff, α-
409GS - - - AST416 and β-394DGLSEQD400. It resulted in a dramatic decrease of IF1 affinity.
Minimum IF1 concentrations required to obtain significant inhibition were so high that the equilibrium
between active and inhibited forms of the enzyme was reached in a few seconds. As a consequence, the
inhibition could not be kinetically solved here and kon could not be estimated. Only the final levels of
inhibition could be estimated, which gave a Kd value of almost 200 nM (Table I, Classes C-D). This
additive effect of mutations on α and β subunits illustrates the fact that multiple interactions contribute to
the binding energy.
175
4. DISCUSSION
4.1. Rationale. The approach developed here, a combination of site-directed mutagenesis and
kinetic experiments, allows identifying domains of ATP synthase involved in initial and late steps of IF1
binding process. Until now only the effect of IF1 modifications on its binding properties have been
reported [36-39, 24-25, 11] including only a few kinetic studies [24-25, 11]. Here, for the first time, the
effects of mitochondrial ATP synthase mutations on IF1 binding kinetics have been investigated.
Residues to be mutated were initially selected on the basis of distances between their
homologues and IF1 in the bovine IF1/F1-ATPase crystallized complex (pdb file 2v7q). The recently
published structure of the equivalent yeast complex (pdb file 3zia) has revealed some differences that will
be discussed below. The γ-remote residues of α and β subunits were also selected considering their
potential importance for the specific sensitivity of mitochondrial F1-ATPases to IF1. For other F1-
ATPases inhibitors, specificity indeed depends on critical residues. For example, the aurovertin-
sensitivity of mitochondrial and E. coli F1-ATPases is due to a single residue of β subunit [40], which
matches structural data [41]; the tentoxin-sensitivity of chloroplast and PS3 bacillus F1-ATPases [42] is
determined by a few residues of α and β subunits [43-44]. The case of IF1 appears more complex, since
the mutations of the γ-remote residues into their non-mitochondrial counterparts had limited effects.
4.2. F1-ATPase motifs or residues implicated in IF1 recognition - In initial binding step IF1 is
recognized by a catalytic pair of α and β subunits, the conformation of which differs from that of the
(αβ)DP pair in the dead-end inhibited complex. With this restriction in mind, locations of the different
residues shown to be implicated in this step are visualized in Figure 6a (yeast IF1/F1-ATPase complex,
pdb entry 3zia).
In β subunit the C-terminal extremity (E471, A474) is clearly involved in initial binding step. By
contrast, neither the couple of residues located in the α-helix preceding the β-DELSEQD motif (T380,
S383), nor the β-DELSEQD motif itself are involved in IF1 recognition. It is also interesting to wonder
which IF1 residues might be implicated. In the bovine F1-ATPase crystallized complex with bound IF1,
residues E471 and A474 of βDP are close to residues L42, L45 and K46 of IF1, whereas in the yeast
complex the homologue region of IF1 is not visible. Interestingly, mutation into alanine of yeast IF1-L40,
the homologue of bovine IF1-L45, has been recently shown to decrease kon by a factor of 5 [11]. This
matches the 7-fold decrease of kon observed here for the double mutation βE471K-βA474E. It therefore
strengthens the idea that interaction between the β C-terminal extremity and IF1 midpart, presumably
IF1-L40 or its neighbours, is involved in the recognition step.
In α subunit the GSDLDAST motif also seems implicated in IF1 recognition, but much less than
the C-terminal extremity of β subunit. αD411 seems to have the main contribution, but in the αDP subunit
of the yeast crystal it is not really close to IF1, and its homologue αD409 is not visible in the bovine
crystal. It should be mentioned that interactions involved in recognition might be transient, and not
present in the dead-end inhibited state thought to be that of the crystallized complex. Finally, residues of

176
αDP subunit bordering IF1 midpart (αE357, αY399, αR400, αV402, αQ418) do not play any role in initial
binding step.
Among the residues that we have mutated, those belonging to the C-terminal extremity of β
subunit play the major role in IF1 recognition. This part of β protrudes from the complex regardless the
catalytic state of the interface, which is a facility in IF1 grasping.
4.3. F1-ATPase motifs or residues implicated in the inhibited complex stabilization - After the
loose IF1 binding during the recognition step [22-23], partial catalytic turnover modifies subunit-subunit
interactions and IF1-F1 interactions. This leads to the final inhibited state. In β subunit, the C-terminal
extremity (E471, A474) poorly contributes to stabilize the inhibited complex. The DELSEQD motif of β
subunit, and more especially E395, has a more significant contribution on the basis of the koff increase
resulting from mutations. This result needs to be related to the interactions of βDP and βTP subunits with
IF1 and γ subunit in the crystallized yeast IF1-inhibited F1-ATPase complex (Figure 6b). In the βDP
subunit, E395 does not interact with IF1, the closest residue of which is distant by more than 9 Å. On the
other hand, the lateral chain of βDP-E395 closely interacts with γ subunit, with distances lower than 3 Å.
It may establish a salt bridge with γ-R30 and attractive electrostatic interactions with γ-R30 and γ-K81. In
the βTP subunit (not visible in Fig. 6b), the only IF1 residue located in the neighbouring of E395 is R20,
with a distance higher than 4.7 Å. The βE398 residue also contributes, to a lower extent, to stabilize the
inhibited complex. In βDP, its lateral chain may establish a salt bridge with IF1-R32. In βTP, it makes a
H-bond with γ-Q117. Both interactions may play a role. Overall, residues of the β-DELSEQD motif
which contributes the most to IF1 locking interact more with the γ subunit than with IF1 in the
crystallized complex.
In α subunit, the GSDLDAST motif has a sizeable role in the stability of the inhibited complex.
Except for a possible hydrophobic interaction between αL412 and IF1-F27 (distance 4.2 Å) and a
possible electrostatic interaction between αD413 and IF1-R30, α-GSDLDAST does not establish specific
interactions with IF1. Since koff grossly increases with the number of glycine substitution mutations, this
effect is likely due to steric hindrance decrease. The αDP-GSDLDAST motif forms pliers together with
βDP subunit, and its lateral chains probably contribute to limit IF1 movements within these pliers. It
should be noted that αDP-GSDLDAST is close not only to IF1, but also to the 115KMQLL119 motif of
the γ subunit. Therefore contacts between α-GSDLDAST and the foot of γ subunit may contribute to the
rigidity of pliers. Although quite modest, the effect of mutagenesis of γ-M116G-Q117G is detectable, and
then it is consistent with this view. A more extensive mutagenesis of this region of γ would be susceptible
to confirm or infirm this proposal.
Among the α subunit residues we have mutated, one or several of the five residues bordering IF1
midpart (αE357, αY399, αR400, αV402, αQ418) contribute only a little to the stability of the inhibited
complex. Their simultaneous mutation into their non-mitochondrial counterparts results in a 2.5-fold koff
increase. Except for V402L, these mutations globally decrease the volume of the lateral chains. Thus
some of these residues probably limit movements of IF1 trapped in the cavity between αDP and βDP.
Compared to α-GSDLDAST, the effect of mutagenesis is much less important. This could be due to the

177
nature of the mutations of the residues, to their relative remoteness from IF1 suggested by the yeast
crystal, or to the lack of stabilizing interaction with the γ subunit.
Residues involved in stabilization of the inhibited complex were found in different regions of α
and β subunits interacting not only with IF1, but also with the foot of γ subunit. This supports the idea
that a part of the stabilization energy of the inhibited complex is brought by α/γ and/or β/γ interactions.
4.4. Possible distortion of F1-ATPase by IF1 binding - Since IF1 locking may involve contacts
not only between the inhibitory peptide and ATP synthase, but also between different subunits of the
enzyme, it is interesting to know how the latter can be distorted by IF1 binding. This can be done by
comparing the published structures of F1-ATPase with and without bound IF1. In most of IF1-free bovine
crystals (e.g. pdb files 1bmf, 1e79 and 2jdi for F1-ATPase, 2xnd for c8-F1-ATPase) F1-ATPases have
similar conformations [12, 45-46, 3]. This is not the case for yeast. The crystal of IF1-free yeast F1-
ATPase with two catalytic nucleotides (pdb file 2hld) contains three non-equivalent copies of the
complex [47]. Only two copies (I and II) have the major part of their structure solved. Copy II looks
similar to bovine F1-ATPase, but copy I is different and in particular its (αβ)DP catalytic interface is
noticeably more open, as in crystallized yeast c10-F1-ATPase (pdb file 3zry) [4]. In the following, copy II
of pdb file 2hld will be considered the most probable conformation of IF1-free yeast F1-ATPase.
The crystallographic structures of F1-ATPase with bound IF1 are 2v7q for bovine [10] and 3zia
for yeast [11]. The latter contains two copies that are quite similar. In bovine case, comparison of these
structures with IF1-free structures as defined above suggests that interaction between the motifs
homologous to αDP-409GSDLDAST416 and γ116MQLL119 occurs only after IF1 binding. This IF1-
dependent distortion due to incomplete closure of (αβ)DP catalytic interface is not observed in yeast
crystals, where the two motifs always appear in contact. The situation is different for the contact between
βDP-DELSEQD motif (especially E395) and γ subunit. In yeast this interaction seems to be a
consequence of IF1 binding. In bovine and in yeast the γ subunit residues interacting with βDP-E395 are
not homologous, and in bovine their interaction does not seem to depend on IF1 binding.
Comparison of structures with and without IF1 also provides a clue for the role of αS410 in
409GSDLDAST416 motif. The koff decrease due to αS410G mutation suggests that αS410 weakens the
stability of the IF1-inhibited complex. This residue makes a H-bond with αA406 in the yeast IF1-free
crystal, but not in the yeast IF1-inhibited one. This H-bond could stabilize the loop containing S410 in its
non-inhibited conformation, and therefore its suppression by mutagenesis might displace the equilibrium
towards the conformation inhibited by IF1.
Examination of published structural data may help to know whether distortions of the catalytic
interface by IF1 binding indirectly contribute to the stabilization of the inhibited complex, by favouring
contacts between the stator and the rotor. However, these distortions may differ between species. In the
yeast case, the evidence for such distortions depends on the choice of the IF1-free state.
4.5. Energetic considerations - Kd variations induced by the different mutations reflect IF1
binding energy variations. The relationship between the equilibrium constant of dissociation (in M) and

178
the binding energy (in kJ mol-1) is, at 25°C, ΔG0 = - 5.7 log10 Kd. The variations observed in this work
ranged between 2 kJ mol-1 (about doubling the Kd value) and 10 kJ mol 1 (multiplying Kd by about 70)
when a single subunit was mutated. These values are moderate and range in the same order of magnitude
as those previously obtained after deleting the N-terminal extremity of IF1 [24]. This illustrates the fact
that binding energy is shared between lots of interactions. We think that the lowest energetic
contributions (2 kJ mol-1) are not due to specific interactions, but to steric hindrance limiting the mobility
of IF1 within its binding site. Although low, these values are significant and may reveal proximities that
cannot be deduced from structural data. For example, the couple βDP-E471-A474 is in contact with IF1
residues that are not visible in the yeast IF1-inhibited F1-ATPase complex. Interestingly, the loss of
binding energy due to the combination of 11DLD13 deletion in α and E395G in β is 16.6 kJ mol-1. It is
the sum of energy losses associated with separate mutations: 10.5 kJ mol-1 for α-11DLD13 deletion and
6.0 kJ mol-1 for β-E395G. These numbers should be cautiously considered regarding uncertainties on the
Kd value for the WT enzyme. Nevertheless, they suggest that α-GSDLDAST and β-DELSEQD motifs
would independently contribute to IF1 binding energy. This example shows that combinations of
different mutations could reveal possible cooperativity between different contact zones within the IF1-
inhibited F1-ATPase complex.
4.6. An outline of IF1 binding process - Our work together with structural data analysis and
previous functional studies allow proposing the following sequence of events for inhibition of
mitochondrial ATP synthase by IF1. First, IF1 midpart is recognized by one of the three catalytic αβ
interfaces. It interacts mainly with the very C-terminal extremity of β subunit, but also somehow with the
GSDLDAST motif of α subunit. After IF1 loose binding, the enzyme still experiences a fraction of turn
and the catalytic interface which has just bound IF1 closes and becomes (αβ)DP, which results in IF1
trapping. Thus αDP-GSDLDAST and βDP-DELSEQD motifs become elements of pliers that encage IF1,
where the α-motif interacts more tightly with IF1. The role of β subunit C-terminal extremity becomes
much less important than during the initial step. In addition, other αDP residues flanking IF1 midpart
modestly contribute to trapping, probably by limiting IF1 movements within the crevice between αDP
and βDP. The rigidity of the pliers formed by αDP-GSDLDAST and βDP-DELSEQD is partially ensured
by their interactions with the foot of the γ subunit. These α-γ and β-γ interactions could be slightly
different in bovine and yeast enzymes according to the structure comparisons, which suggest that IF1
binding brings αDP-GSDLDAST closer to γ in the bovine case and brings βDP-DELSEQD closer to γ in
the yeast case. Another contribution to locking comes from the N-terminal part of IF1 that penetrates in
the complex and interacts with γ and internal parts of α and β subunits. IF1-F17, located at the boundary
between the α-helical midpart of IF1 and the flexible N-terminal extremity, also plays a key role in
stabilization of the inhibited complex [39, 24]. To make exhaustive this dynamic scheme, a more
systematic program of mutagenesis should be undertaken. More than the precise role of key residues, the
present pioneering work reveals the global role of different motifs and regions in the different steps of
inhibition by IF1. This approach notably improves our knowledge of its mechanism. Other aspects remain

179
to be elucidated, like the possible energetic interferences between the different locking events and their
time-sequence. This will be a challenge for future studies.
5. ACKNOWLEDGEMENTS
Thanks are due to Dr Marie-France Giraud for her help in microbiology of S. cerevisiae W303-
1A-Δatp1Δatp2. We are indebted to Gwénaëlle Moal for her excellent technical help. We particularly
thank Amina Boudghene Stambouli for technical assistance in the mutagenesis of γ subunit.
REFERENCES
[1] P. Mitchell. Coupling of phosphorylation to electron and hydrogen transfer by a chemi-
osmotic type of mechanism. Nature 191 (1961) 144-148.
[2] H. Noji, R. Yasuda, M. Yoshida, K. Kinosita. Direct observation of the rotation of F1-ATPase.
Nature 386 (1997) 299-302.
[3] I.N. Watt, M.G. Montgomery, M.J. Runswick, A.G.W. Leslie, J.E. Walker. Bioenergetic cost
of making an adenosine triphosphate molecule in animal mitochondria. Proc. Natl. Acad. Sci. USA 107
(2010) 16755-16756.
[4] A. Dautant, J. Velours, M.-F. Giraud. Crystal structure of the Mg.ADP-inhibited state of the
yeast F1c10-ATP synthase. J. Biol. Chem. 285 (2010) 29502-29510.
[5] P.D. Boyer. The ATP synthase - a splendid molecular machine. Annu. Rev. Biochem. 66
(1997) 717-749.
[6] H. Itoh, A. Takahashi, K. Adachi, H. Noji, R. Yasuda, M. Yoshida, K. Kinosita. Mechanically
driven ATP synthesis by F1-ATPase. Nature 427 (2004) 465-468.
[7] M.E. Pullmann, G.C. Monroy. A naturally occurring inhibitor of mitochondrial adenosine
triphosphatase. J. Biol. Chem. 238 (1963) 3762-3768.
[8] H. Matsubara, T. Hase, T. Hashimoto, K. Tagawa. Amino acid sequence of an intrinsic
inhibitor of mitochondrial ATPase from yeast. J. Biochem. 90 (1981) 1159-1165.
[9] E. Cabezón, M.J. Runswick, A.G. Leslie, J.E. Walker. The structure of bovine IF(1), the
regulatory subunit of mitochondrial F-ATPase, EMBO J. 20 (2001) 6990-6996.
[10] J.R. Gledhill, M.G. Montgomery, A.G.W. Leslie, J.E. Walker. How the regulatory protein,
IF1, inhibits F1-ATPase from bovine mitochondria. Proc. Natl. Acad. Sci. USA 104 (2007) 15671-15676.
[11] G.C. Robinson, J.V. Bason, M.G. Montgomery, I.M. Fearnley, D.M. Mueller, A.G.W. Leslie,
J.E. Walker. The structure of F1-ATPase from Saccharomyces cerevisiae inhibited by its regulatory
protein IF1. Open Biol. 3 (2013) 120164.
[12] J.P. Abrahams, A.G.W. Leslie, R. Lutter, J.E. Walker. Structure at 2.8 Å resolution of F1-
ATPase from bovine heart mitochondria. Nature 370 (1994), 621-628.
180
[13] V. Kabaleeswaran, H. Shen, J. Symersky, J.E. Walker, A.G.W. Leslie, D.M. Mueller.
Asymmetric structure of the yeast F1-ATPase in the absence of bound nucleotides. J. Biol. Chem. 284
(2009) 10546-10551.
[14] K. Schwerzmann, P.L. Pedersen. Regulation of the mitochondrial ATP synthase/ATPase
complex. Arch. Biochem. Biophys. 250 (1986) 1-18.
[15] R.J. Van de Stadt, B.L. de Boer, K. Van Dam. The interaction between the mitochondrial
ATPase (F1) and the ATPase inhibitor. Biochim. Biophys. Acta 292 (1973) 338-349.
[16] I. Husain, D.A. Harris. ATP synthesis and hydrolysis in submitochondrial particles subjected
to an acid-base transition. Effects of the ATPase inhibitor protein. FEBS Lett. 160 (1983) 110-114.
[17] J. Power, R.L. Cross, D.A. Harris. Interaction of F1-ATPase from ox heart mitochondria with
its naturally occurring inhibitor protein. Studies using radio-iodinated inhibitor protein. Biochim.
Biophys. Acta 724 (1983) 128-141.
[18] G. Klein, P.V. Vignais. Effect of the protonmotive force on ATP-linked processes and
mobilization of the bound natural ATPase inhibitor in beef heart submitochondrial particles. J. Bioenerg.
Biomembr. 15 (1983) 347-362.
[19] I. Husain, P.J. Jackson, D.A. Harris. Interaction between F1-ATPase and its naturally
occurring inhibitor protein. Studies using a specific anti-inhibitor antibody. Biochim. Biophys. Acta 806
(1985) 64-74.
[20] G. Lippe, M.C. Sorgato, D.A. Harris. Kinetics of the release of the mitochondrial inhibitor
protein. Correlation with synthesis and hydrolysis of ATP. Biochim. Biophys. Acta 933 (1988) 1-11.
[21] G. Lippe, M. C. Sorgato, D.A. Harris. The binding and release of the inhibitor protein are
governed independently by ATP and membrane potential in ox-heart submitochondrial vesicles. Biochim.
Biophys. Acta 933 (1988) 12-21.
[22] V. Corvest, C. Sigalat, R. Venard, P. Falson, D.M. Mueller, F. Haraux. The binding
mechanism of the yeast F1-ATPase inhibitory peptide: role of catalytic intermediates and enzyme
turnover. J. Biol. Chem. 280 (2005) 9927-9936.
[23] V. Corvest, C. Sigalat, F. Haraux. Insight into the bind-lock mechanism of the yeast
mitochondrial ATP synthase inhibitory peptide. Biochemistry 46 (2007) 8680-8688.
[24] T. Andrianaivomananjaona, M. Moune-Dimala, S. Herga, V. David, F. Haraux. How the N-
terminal extremity of Saccharomyces cerevisiae IF1 interacts with ATP synthase: a kinetic approach.
Biochim. Biophys. Acta 1807 (2011) 197-204.
[25] J. V. Bason, M.J. Runswick, I.M. Fearnley, J.E. Walker. Binding of the inhibitor protein IF1
to bovine F1-ATPase. J. Mol. Biol. 406 (2011) 445-453.
[26] M. Minet, M.E. Dufour, F. Lacroute. Complementation of Saccharomyces cerevisiae
auxotrophic mutants by Arabidopsis thaliana cDNAs. Plant J. 2 (1992) 417-422.
[27] A. Wach, A. Brachat, R. Poehlmann, P. Philippsen. New heterologous modules for classical
or PCR-based gene disruptions in Saccharomyces cerevisiae. Yeast 10 (1994) 1793-1808.

181
[28] R. Venard, D. Brèthes, M.-F. Giraud, J. Vaillier, J. Velours, F. Haraux. Investigation of the
role and mechanism of IF1 and STF1 proteins, twin inhibitory peptides which interact with the yeast
mitochondrial ATP synthase. Biochemistry 42 (2003) 7626-7636.
[29] Y.M. Milgrom. An ATP dependence of mitochondrial F1-ATPase inactivation by the natural
inhibitor protein agrees with the alternating-site binding-change mechanism. FEBS Lett. 246 (1989), 202-
206.
[30] E. Cabezón, P.J. Butler, M.J. Runswick, R.J. Carbajo, J.E. Walker. Homologous and
heterologous inhibitory effects of ATPase inhibitor proteins on F-ATPases. J. Biol. Chem. 277 (2002)
41334-41341.
[31] T.M. Duncan, V.V. Bulygin, Y. Zhou, M.L. Hutcheon, R.L. Cross. Rotation of subunits
during catalysis by Escherichia coli Fl-ATPase. Proc. Natl. Acad. Sci. USA 92 (1995) 10964-10968.
[32] K.Y. Hara, H. Noji, D. Bald, R. Yasuda, K. Kinosita, M. Yoshida. The role of the DELSEED
motif of the β subunit in rotation of F1-ATPase. J. Biol. Chem. 275 (2000) 14260-14263.
[33] N. Mnatsakanyan, A.M. Krishnakumar, T. Suzuki, J. Weber. The Role of the DELSEED-loop
of ATP Synthase. J. Biol. Chem. 284 (2009) 11336-11345.
[34] M. Tanigawara, K.V. Tabata, Y. Ito, J. Ito, R. Watanabe, H. Ueno, M. Ikeguchi, H. Noji. Role
of the DELSEED loop in torque transmission of F1-ATPase. Biophys. J. 103 (2012) 970-978.
[35] K.Y. Hara, Y. Kato-Yamada, Y. Kikuchi, T. Hisabori, M. Yoshida. The role of the
βDELSEED motif of F1-ATPase; propagation of the inhibitory effect of the ε subunit. J. Biol. Chem. 276
(2001) 23969-23973.
[36] J.S. Stout, B.E. Partridge, D.A. Dibbern, S.M. Schuster. Peptide analogs of the beef heart
mitochondrial F1-ATPase inhibitor protein. Biochemistry 32 (1993) 7496-7502.
[37] M. J. van Raaij, G.L. Orriss, M.G. Montgomery, M.J. Runswick, I.M. Fearnley, J.M. Skehel,
J. E. Walker. The ATPase inhibitor protein from bovine heart mitochondria: the minimal inhibitory
sequence. Biochemistry 35 (1996) 15618-15625.
[38] M.S. Lebowitz, P.L. Pedersen. Protein inhibitor of mitochondrial ATP synthase: relationship
of inhibitor structure to pH-dependent regulation. Arch. Biochem. Biophys. 330 (1996) 342-345.
[39] N. Ichikawa, A. Karaki, M. Kawabata, S. Ushida, M. Mizushima, T. Hashimoto. The region
from phenylalanine-17 to phenylalanine-28 of a yeast mitochondrial ATPase inhibitor is essential for its
ATPase inhibitory activity. J. Biochem. 130 (2001) 687-693.
[40] R.S. Lee, J. Pagan, M. Satre, P.V. Vignais, A.E Senior. Identification of a mutation in
Escherichia coli F1-ATPase beta-subunit conferring resistance to aurovertin. FEBS Lett. 253 (1989) 269-
272.
[41] M.J. van Raaij, J.P. Abrahams, A.G.W. Leslie, J.E. Walker. The structure of bovine F1-
ATPase complexed with the antibiotic inhibitor aurovertin B. Proc. Natl. Acad. Sci. USA 93 (1996)
6913-6917.
[42] J. Santolini, C. Minoletti, J.M. Gomis, C. Sigalat, F. André, F. Haraux. An insight into the
mechanism of inhibition and reactivation of the F1-ATPases by tentoxin. Biochemistry 41 (2002) 6008-
6018
182
[43] A. Avni, J.D. Anderson, N. Holland, J.D. Rochaix, Z. Gromet-Elhanan, M. Edelman.
Tentoxin sensitivity of chloroplasts determined by codon 83 of beta subunit of proton-ATPase. Science
257 (1992) 1245-1247.
[44] W.C. Tucker, Z. Du, R. Hein, Z. Gromet-Elhanan, M.L. Richter. Role of the ATP synthase
alpha-subunit in conferring sensitivity to tentoxin. Biochemistry 40 (2001) 7542-7548.
[45] C. Gibbons, M. G. Montgomery, A.G.W. Leslie, J.E. Walker. The structure of the central
stalk in bovine F1-ATPase at 2.4 Å resolution. Nat. Struct. Biol. 7 (2000) 1055-1061.
[46] M.W. Bowler, M.G. Montgomery, A.G.W. Leslie, J.E. Walker. Ground state structure of F1-
ATPase from bovine heart mitochondria at 1.9 Å resolution. J. Biol. Chem. 282 (2007) 14238-14242.
[47] V. Kabaleeswaran, N. Puri, J.E. Walker, A.G.W. Leslie, D.M. Mueller. Novel features of the
rotary catalytic mechanism revealed in the structure of yeast F1 ATPase. EMBO. J. 25 (2006) 5433-5442.

183

184
FIGURE LEGENDS
FIGURE 1. Location of the mutated residues in the yeast F1-ATPase inhibited with IF1 and of
corresponding residues in the bovine species. Left image, S. cerevisiae model, pdb entry 3zia; only
residues 1-36 of IF1 were solved. Right image, B. taurus model, pdb entry 2v7q; only residues 8-50 of
truncated IF1 containing residues 1-60 were solved. Image created using PyMol software. Only αDP,
βDP, γ and IF1 are represented for the sake of clarity. A, B, group of discrete residues remote from the
foot of γ subunit; A, residues located on αDP subunit, close to the catalytic interface entrapping IF1
midpart; B, residues located on βDP subunit, close to the N-extremity or to the midpart of IF1; C, D,
groups of contiguous residues close to the foot of γ subunit, only a part of which are close to IF1; C,
residues located on αDP subunit; D, residues located on βDP subunit. The topological arrangement of all
F1-ATPase subunits is recalled by the scheme in the right part of the figure. Nomenclature of catalytic
interfaces (DP, TP, E) is defined by their nucleotide occupancy in the reference 3D structural model (12),
see Introduction for details.
FIGURE 2. Data from single typical experiments carried out with SMP from three different cell
lines and determination of binding parameters. Conditions as described under Material and Methods, pH
6.5. ( ■ ) WT; ( ) α Δ[D411 L412 D413]; ( ) β E471K A474E. Panel a, rate constant of inhibition
(kapp) as a function of IF1 concentration, for kon determination. Panel b, normalized ATPase activity at
equilibrium as a function of IF1 concentration, for Kd determination. Panel c, normalized ATPase activity
at equilibrium as a function of 1/kapp, for koff determination. Enlarged view of WT data is displayed in b
and c. Resulting parameters: WT, kon = (4.7 ± 0.3) 105 M 1 s 1, Kd = (3.0 ± 1) 10 10 M, koff = (2.3 ±
0.8) 10 4 s 1, koff / Kdkon = 1.6 ± 1.2; α Δ[D411 L412 D413], kon = (2.2 ± 0.6) 105 M 1 s 1, Kd = (1.18
± 0.08) 10 8 M, koff = (3.6 ± 0.3) 10 3 s 1, koff / Kdkon = 1.4 ± 0.5; β E471K A474E, kon = (7.9 ± 0.2)
104 M 1 s 1, Kd = (1.4 ± 0.2) 10 9 M, koff = (1.1 ± 0.1) 10 4 s 1, koff / Kdkon = 1.05 ± 0.26). The koff /
Kdkon ratio should theoretically be 1.
FIGURE 3. Kinetic constants of IF1 binding and release after mutagenesis of group A and group B
residues. (a), pH 6.5; (b), pH 8. For a better comparison, 1/kon, and not kon, has been plotted in the left.
increase of 1/kon, like increase of koff, results in a loss of affinity of IF1 for ATP synthase. The
dissociation constant is expressed by koff (grey bars) or by the product Kdkon (hatched bars). The effects
of mutations on kon are similar at pH 6.5 and pH 8. The effect on koff and Kdkon appears more
consistent at pH 8 than at pH 6.5 (see text for details).
FIGURE 4. Kinetic constants of IF1 binding and release after mutagenesis of group C residues.
Data from Table II. Mutated or deleted residues are indicated by black, bold, underlined characters. The
WT sequence is GSDLDAST. For a better comparison, 1/kon, and not kon, has been plotted in Panel a;
increase of 1/kon, like increase of koff, results in a loss of affinity of IF1 for ATP synthase. Panel b,

185
dissociation rate constant expressed by koff (grey bars) or by the product Kdkon (hatched bars). These
two different estimates are reasonably equivalent within the experimental errors.
FIGURE 5. Binding parameters obtained at pH 8 with SMP from wT and γ subunit mutants.
Conditions as described under Materials and Methods. Averaged data from at least three different
experiments. ( ■ ) wT; ( ) γ M116G Q117G; ( Δ ) γ M116G Q117G L118G. Panel a, rate constant of
inhibition (kapp) as a function of IF1 concentration, for kon determination. Panel b, normalized ATPase
activity at equilibrium as a function of IF1 concentration, for Kd determination. Panel c, normalized
ATPase activity at equilibrium as a function of 1/kapp, for koff determination. Resulting parameters: wT,
kon = (2.21 ± 0.09) 105 M 1 s 1, Kd = (9.1 ± 0.6) 10 9 M, koff = 1.84 ± 0.13) 10 3 s 1, koff / Kdkon =
0.92 ± 0.16; γ M116G Q117G, kon = (2.2 ± 0.1) 105 M 1 s 1, Kd = (1.98 ± 0.15) 10 8 M, koff = (3.09 ±
0.08) 10 3 s 1, koff / Kdkon = 0.72; γ M116G Q117G L118G, kon = (2.56 ± 0.12) 105 M 1 s 1, Kd =
(9.00 ± 0.58) 10 9 M, koff = (2.12 ± 0.081) 10 3 s 1, koff / Kdkon = 0.92.
FIGURE 6. Yeast F1-ATPase motifs or residues involved in IF1 recognition and locking. Images
created from the pdb file 3zia using PyMol software. IF1 (residues 1-36, shown in grey sticks and ribbon)
is mainly located between αDP (green) and βDP (red) subunits. Panel a, IF1 residues 37-40, not visible in
yeast structure, were added according to the homologue bovine structure (magenta sticks and ribbon) to
show the possible proximity to βDP-E471, A474 (orange sticks). Highlighted motifs in both αDP and
βDP subunits are implicated in IF1 recognition step. βDP-E471, A474 play a more important role than
motif α-409GSDLDAST416 (green sticks and ribbon), in which D411, L412 and D413 have the main
contribution. Panel b, γ subunit appears in blue. The motif α-409GSDLDAST416 (green sticks and
ribbon) and the motif β-394DELSEQD400 (dark red sticks, E395 in light red), located on left and right
side of IF1, respectively, play the major role in IF1 locking step. The group of residues αDP-E357-Y399-
R400-V402-Q418 (green sticks) has a less important contribution, as well as βE471, A474 represented in
Panel a. Highlighted residues M116, Q117 in γ subunit (black sticks) participate indirectly in IF1 locking
through the possible interaction with α-409GSDLDAST416. Similarly, γ-R30 (black stick, residue not
mutated) could contribute to IF1 locking through the potential interaction with β-394DELSEQD400.
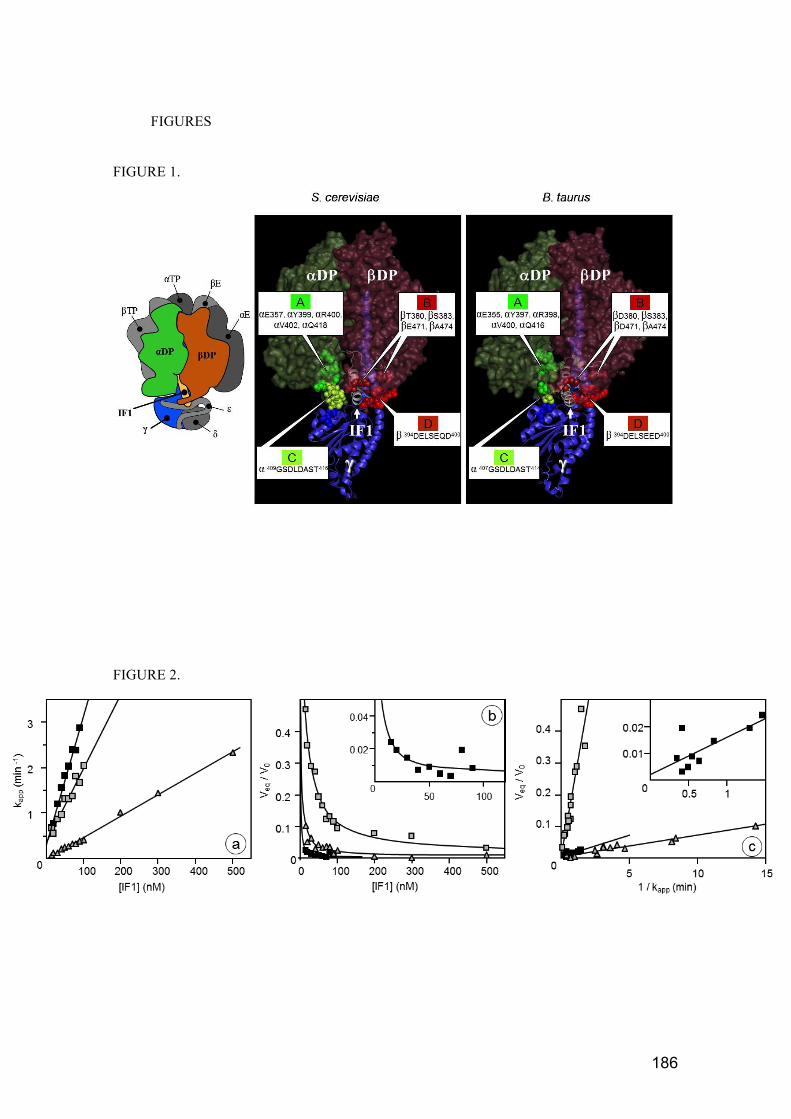
186
FIGURES
FIGURE 1.
FIGURE 2.

187
FIGURE 3.
FIGURE 4.

188
FIGURE 5.
.
FIGURE 6.
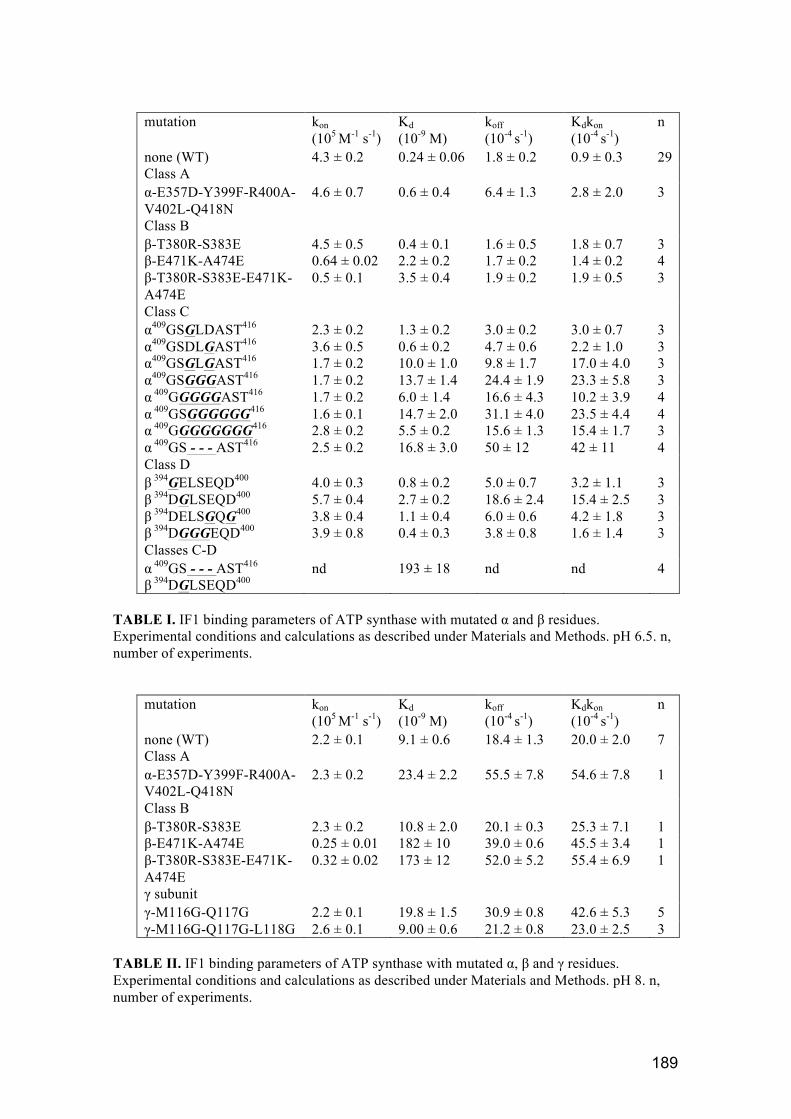
189
mutation
kon
(105 M-1 s-1) Kd
(10-9 M) koff
(10-4 s-1) Kdkon
(10-4 s-1) n
none (WT) 4.3 ± 0.2 0.24 ± 0.06 1.8 ± 0.2 0.9 ± 0.3 29 Class A α-E357D-Y399F-R400A- V402L-Q418N
4.6 ± 0.7 0.6 ± 0.4 6.4 ± 1.3 2.8 ± 2.0 3
Class B β-T380R-S383E 4.5 ± 0.5 0.4 ± 0.1 1.6 ± 0.5 1.8 ± 0.7 3 β-E471K-A474E 0.64 ± 0.02 2.2 ± 0.2 1.7 ± 0.2 1.4 ± 0.2 4 β-T380R-S383E-E471K-A474E
0.5 ± 0.1 3.5 ± 0.4 1.9 ± 0.2 1.9 ± 0.5 3
Class C α
409GSGLDAST416 2.3 ± 0.2 1.3 ± 0.2 3.0 ± 0.2 3.0 ± 0.7 3 α
409GSDLGAST416 3.6 ± 0.5 0.6 ± 0.2 4.7 ± 0.6 2.2 ± 1.0 3 α
409GSGLGAST416 1.7 ± 0.2 10.0 ± 1.0 9.8 ± 1.7 17.0 ± 4.0 3 α
409GSGGGAST416 1.7 ± 0.2 13.7 ± 1.4 24.4 ± 1.9 23.3 ± 5.8 3 α
409GGGGGAST416 1.7 ± 0.2 6.0 ± 1.4 16.6 ± 4.3 10.2 ± 3.9 4 α
409GSGGGGGG416 1.6 ± 0.1 14.7 ± 2.0 31.1 ± 4.0 23.5 ± 4.4 4
α 409GGGGGGGG
416 2.8 ± 0.2 5.5 ± 0.2 15.6 ± 1.3 15.4 ± 1.7 3 α
409GS - - - AST416 2.5 ± 0.2 16.8 ± 3.0 50 ± 12 42 ± 11 4 Class D β
394GELSEQD400 4.0 ± 0.3 0.8 ± 0.2 5.0 ± 0.7 3.2 ± 1.1 3
β 394DGLSEQD400 5.7 ± 0.4 2.7 ± 0.2 18.6 ± 2.4 15.4 ± 2.5 3 β
394DELSGQG400 3.8 ± 0.4 1.1 ± 0.4 6.0 ± 0.6 4.2 ± 1.8 3
β 394DGGGEQD400 3.9 ± 0.8 0.4 ± 0.3 3.8 ± 0.8 1.6 ± 1.4 3
Classes C-D α
409GS - - - AST416 β
394DGLSEQD400 nd 193 ± 18 nd nd 4
TABLE I. IF1 binding parameters of ATP synthase with mutated α and β residues. Experimental conditions and calculations as described under Materials and Methods. pH 6.5. n, number of experiments.
mutation
kon
(105 M-1 s-1) Kd
(10-9 M) koff
(10-4 s-1) Kdkon
(10-4 s-1) n
none (WT) 2.2 ± 0.1 9.1 ± 0.6 18.4 ± 1.3 20.0 ± 2.0 7 Class A α-E357D-Y399F-R400A- V402L-Q418N
2.3 ± 0.2 23.4 ± 2.2 55.5 ± 7.8 54.6 ± 7.8 1
Class B β-T380R-S383E 2.3 ± 0.2 10.8 ± 2.0 20.1 ± 0.3 25.3 ± 7.1 1 β-E471K-A474E 0.25 ± 0.01 182 ± 10 39.0 ± 0.6 45.5 ± 3.4 1 β-T380R-S383E-E471K-A474E
0.32 ± 0.02 173 ± 12 52.0 ± 5.2 55.4 ± 6.9 1
γ subunit γ-M116G-Q117G 2.2 ± 0.1 19.8 ± 1.5 30.9 ± 0.8 42.6 ± 5.3 5 γ-M116G-Q117G-L118G 2.6 ± 0.1 9.00 ± 0.6 21.2 ± 0.8 23.0 ± 2.5 3
TABLE II. IF1 binding parameters of ATP synthase with mutated α, β and γ residues. Experimental conditions and calculations as described under Materials and Methods. pH 8. n, number of experiments.
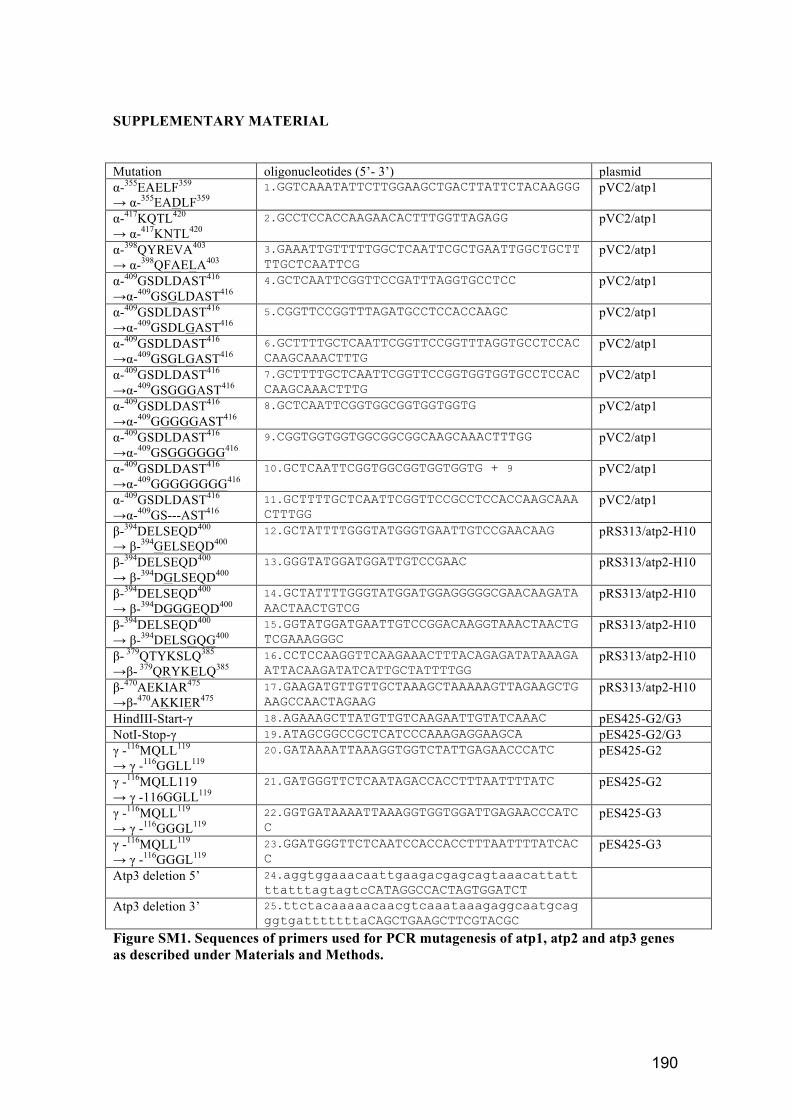
190
SUPPLEMENTARY MATERIAL
Mutation oligonucleotides (5’- 3’) plasmid α-355EAELF359 → α-355EADLF359
1.GGTCAAATATTCTTGGAAGCTGACTTATTCTACAAGGG pVC2/atp1
α-417KQTL420 → α-417KNTL420
2.GCCTCCACCAAGAACACTTTGGTTAGAGG pVC2/atp1
α-398QYREVA403 → α-398QFAELA403
3.GAAATTGTTTTTGGCTCAATTCGCTGAATTGGCTGCTT
TTGCTCAATTCG
pVC2/atp1
α-409GSDLDAST416
→α-409GSGLDAST416
4.GCTCAATTCGGTTCCGATTTAGGTGCCTCC
pVC2/atp1
α-409GSDLDAST416
→α-409GSDLGAST416 5.CGGTTCCGGTTTAGATGCCTCCACCAAGC
pVC2/atp1
α-409GSDLDAST416
→α-409GSGLGAST416 6.GCTTTTGCTCAATTCGGTTCCGGTTTAGGTGCCTCCAC
CAAGCAAACTTTG
pVC2/atp1
α-409GSDLDAST416
→α-409GSGGGAST416 7.GCTTTTGCTCAATTCGGTTCCGGTGGTGGTGCCTCCAC
CAAGCAAACTTTG
pVC2/atp1
α-409GSDLDAST416
→α-409GGGGGAST416 8.GCTCAATTCGGTGGCGGTGGTGGTG pVC2/atp1
α-409GSDLDAST416
→α-409GSGGGGGG416 9.CGGTGGTGGTGGCGGCGGCAAGCAAACTTTGG
pVC2/atp1
α-409GSDLDAST416
→α-409GGGGGGGG416
10.GCTCAATTCGGTGGCGGTGGTGGTG + 9 pVC2/atp1
α-409GSDLDAST416
→α-409GS---AST416
11.GCTTTTGCTCAATTCGGTTCCGCCTCCACCAAGCAAA
CTTTGG
pVC2/atp1
β-394DELSEQD400 → β-394GELSEQD400
12.GCTATTTTGGGTATGGGTGAATTGTCCGAACAAG
pRS313/atp2-H10
β-394DELSEQD400 → β-394DGLSEQD400
13.GGGTATGGATGGATTGTCCGAAC
pRS313/atp2-H10
β-394DELSEQD400 → β-394DGGGEQD400
14.GCTATTTTGGGTATGGATGGAGGGGGCGAACAAGATA
AACTAACTGTCG
pRS313/atp2-H10
β-394DELSEQD400 → β-394DELSGQG400
15.GGTATGGATGAATTGTCCGGACAAGGTAAACTAACTG
TCGAAAGGGC
pRS313/atp2-H10
β- 379QTYKSLQ385
→β- 379QRYKELQ385 16.CCTCCAAGGTTCAAGAAACTTTACAGAGATATAAAGA
ATTACAAGATATCATTGCTATTTTGG pRS313/atp2-H10
β-470AEKIAR475
→β-470AKKIER475 17.GAAGATGTTGTTGCTAAAGCTAAAAAGTTAGAAGCTG
AAGCCAACTAGAAG
pRS313/atp2-H10
HindIII-Start-γ 18.AGAAAGCTTATGTTGTCAAGAATTGTATCAAAC pES425-G2/G3 NotI-Stop-γ 19.ATAGCGGCCGCTCATCCCAAAGAGGAAGCA pES425-G2/G3 γ -116MQLL119 → γ -116GGLL119
20.GATAAAATTAAAGGTGGTCTATTGAGAACCCATC
pES425-G2
γ -116MQLL119 → γ -116GGLL119
21.GATGGGTTCTCAATAGACCACCTTTAATTTTATC
pES425-G2
γ -116MQLL119 → γ -116GGGL119
22.GGTGATAAAATTAAAGGTGGTGGATTGAGAACCCATC
C
pES425-G3
γ -116MQLL119 → γ -116GGGL119
23.GGATGGGTTCTCAATCCACCACCTTTAATTTTATCAC
C
pES425-G3
Atp3 deletion 5’ 24.aggtggaaacaattgaagacgagcagtaaacattatt
ttatttagtagtcCATAGGCCACTAGTGGATCT
Atp3 deletion 3’ 25.ttctacaaaaacaacgtcaaataaagaggcaatgcag
ggtgatttttttaCAGCTGAAGCTTCGTACGC
Figure SM1. Sequences of primers used for PCR mutagenesis of atp1, atp2 and atp3 genes
as described under Materials and Methods.

191
352 363 395 423
Mitochondria
Non‐m
itochondrial
Figure SM2(a). Sequence alignment on α subunit of mitochondrial and non-
mitochondrial ATP synthase. Sequence alignment was done with Jalview software using MAFFT alignment program. The above numbering is related to the numbering of the sequence of alpha subunit from Saccharomyces cerevisiae. Sequence from residue 352 to 363 and from 395 to 423 are shown. 42 sequences of mitochondrial and non-mitochondrial (chloroplastic and bacterial) α subunits were compared. Percentage identity is shown in blue. In dark blue, the most conserved residues and in light blue, the less conserved residues. In red, γ remote residues corresponding to residues αE357, αY399, αR400, αV402, and αQ418 (yeast nomenclature). In grey, residues in the neighbouring of the foot of γ subunit corresponding to the S. cerevisiae α-SDLDAST sequence.
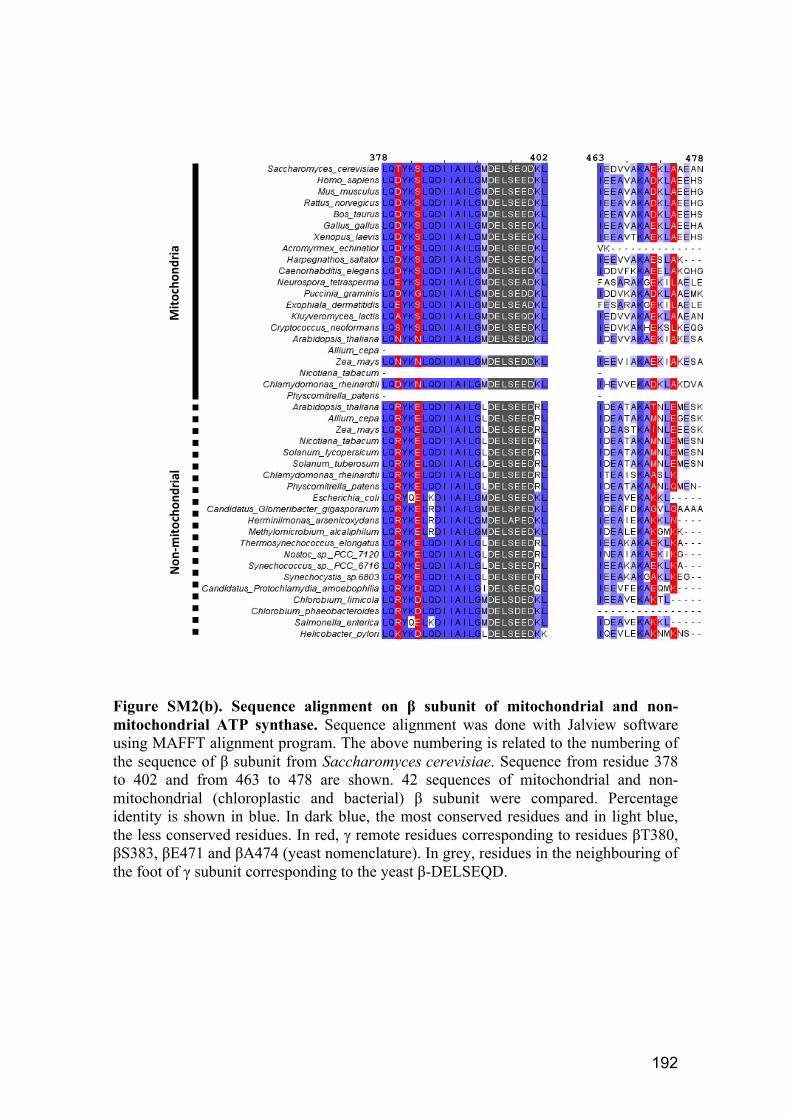
192
Mitochondria
Non‐m
itochondrial
378 402 463 478
Figure SM2(b). Sequence alignment on β subunit of mitochondrial and non-
mitochondrial ATP synthase. Sequence alignment was done with Jalview software using MAFFT alignment program. The above numbering is related to the numbering of the sequence of β subunit from Saccharomyces cerevisiae. Sequence from residue 378 to 402 and from 463 to 478 are shown. 42 sequences of mitochondrial and non-mitochondrial (chloroplastic and bacterial) β subunit were compared. Percentage identity is shown in blue. In dark blue, the most conserved residues and in light blue, the less conserved residues. In red, γ remote residues corresponding to residues βT380, βS383, βE471 and βA474 (yeast nomenclature). In grey, residues in the neighbouring of the foot of γ subunit corresponding to the yeast β-DELSEQD.

193
a
b
IF1
2 min
0.4
A340
0.2
A340
10 min
IF1
c
a
b
IF1
2 min
0.4
A340
0.2
A340
10 min
IF1
c
0.2
A340
10 min
0.2
A340
10 min
IF1IF1
c
Figure SM3. yIF1 effect on ATP hydrolysis catalyzed by isolated F1-ATPase from
different organisms. Conditions as described under Material and Methods, pH 6.5. Bacterial and chloroplast F1-ATPases were prepared as in Santolini et al. (2002) Biochemistry 41, 6008-6018. ATP hydrolysis followed by the decrease of absorbance at 340 nm. yIF1 addition indicated by arrows. Curve a, 10 nM F1-ATPase from PS3
bacillus (TF1) at 50°C, addition of 5 µM yIF1. Curve b, 1 nM F1-ATPase from Saccharomyces cerevisiae (MF1) at 25°C, addition of 0.1 µM yIF1. Curve c, 2 nM chloroplast F1-ATPase from Spinacia oleracea, devoid of ε subunit (CF1-ε) and pretreated with 5 mM DTT, 25°C, addition of 5 µM yIF1. Despite the very high concentrations used (50-fold higher than for MF1), yIF1 has no effect on TF1 and CF1-ε activities.

194
Abstract
ATP synthase is an essential protein complex located in the mitochondrial inner
membrane, which synthesizes ATP by coupling to a rotary proton transport across the membrane at the expense of the electrochemical proton gradient created by the
electron transport chain. This reaction guarantees the supply of energy to biological
processes in a cell. When mitochondria get deenergized, i.e. the protomotive force
across the mitochondrial inner membrane collapses, the ATP synthase switches from ATP synthesis to hydrolysis. This hydrolytic activity is then immediately prevented by a
natural soluble mitochondrial ATPase inhibitor, IF1. This efficient reversible inhibition
system protects cells from wasting energy. In yeast, IF1 is a small protein consisting of 63 amino acids. It binds to one of the three (αβ) catalytic interfaces of ATP synthase
and thereby blocks the rotary catalysis. Although the crystal structure of the dead-end
IF1 inhibited F1-ATPase complex has been resolved, IF1 initial binding and locking to ATPase still remain unclear events at the molecular level.
During my thesis, we have been interested in the dynamic mechanism of ATPase
inhibition by IF1. By means of analyses of published structures and protein sequence
alignment, we selected numerous residues located in different regions of Saccharomyces cerevisiae ATP synthase α, β subunits, which might potentially
paticipate in IF1 binding process. Using site-directed mutagenesis combined with
kinetic experiments, we studied the effect of mutations of the selected candidates on the rate and extent of ATPase inhibition by IF1. In this way we identified residues or
motifs in ATP synthase α, β subunits involved in IF1 recognition and/or locking steps,
which allows complementing structural studies and drawing an outline of IF1 binding.
Résumé
ATP synthase est une protéine essentielle associée à la membrane interne
mitochondriale, qui synthétise l'ATP par couplage d’un transport de protons au travers de la membrane, en dissipant un gradient électrochimique de protons créé par la
chaîne respiratoire. Cette réaction assure l’alimentation en énergie des processus
biologiques cellulaires. Si la membrane mitochondriale se dépolarise, la réaction inverse d’hydrolyse d’ATP est rapidement bloquée par un inhibiteur soluble naturel de
l’ATPase mitochondriale, IF1. Cette régulation efficace et réversible évite le gaspillage
de l’énergie par la cellule. Chez la levure, IF1 est une petite protéine de 63 amino-acides. Elle se fixe sur l'une des trois interfaces catalytiques de l’ATP synthase et
inhibe l’hydrolyse d’ATP. Bien que les structures cristallographiques des complexes F1-
ATPase inhibés par IF1 aient été résolus, l'étape initiale de reconnaissance et celle du
verrouillage d’IF1 restent peu claires au niveau moléculaire. Pendant ma thèse, nous nous sommes intéressés au mécanisme d’inhibition de
l’ATPase par IF1. Par des analyses des structures disponibles et des alignements de
séquence, nous avons sélectionné de nombreux résidus localisés dans différentes régions des sous-unités α et β de l'ATP synthase de Saccharomyces cerevisiae et
susceptibles de participer au processus de fixation d'IF1. En utilisant le mutagenèse
dirigée combinée à des experiences cinétiques, nous avons étudié les effects des
mutations sur l’inhibition de l’ATP synthase par IF1 chez Saccharomyces cerevisiae. Dans ce travail, nous avons identifié des résidus ou motifs des sous-unités α et β de
l’ATP synthase impliqués dans les étapes de reconaissance et/ou vérrouillage d’IF1,
ce qui nous permet de compléter les études structurales et d'esquisser un mécanisme de fixation d'IF1.
![Prevention of doxorubicin-induce renal function abnormalities ......ATPase, Mg2+-ATPase and Na+, K+-ATPase activities [15, 16]. Turmeric is a golden spice derived from the rhizome](https://img.dokumen.tips/doc/110x75/61385b7c0ad5d20676493447/prevention-of-doxorubicin-induce-renal-function-abnormalities-atpase-mg2-atpase.jpg)


![OleicAcidInducesLungInjuryinMicethrough ...2 Mediators of Inflammation [16–18]. Oleic acid (OA) is an inhibitor of the Na/K-ATPase activity in bovine serum [19] and is also a Na/K-ATPase](https://img.dokumen.tips/doc/110x75/60c8bb5d6300d261b231ffb8/oleicacidinduceslunginjuryinmicethrough-2-mediators-of-iniammation-16a18.jpg)