Embed Size (px)
Citation preview

REGIONAL TOURISM PLANNING STUDY
HANDOUT 1.1
OUTBACK SA (Author, BillWright)
• Desired Study Objectives
The outback region in the Far North of South Australia has greatpotential for domestic and international tourism. It is one of the mostimportant tourism regions in the State containing many unique naturalfeatures with great potential for the emerging eco-tourism, nature-based travel and special interest markets.
There are a number of development initiatives required if the region isto achieve its tourism potential focussing on improving visitation, yield,product and infrastructure.
Specific objectives for the study to achieve these aims have been setas follows:-
• To identify development opportunities for new and upgraded productsand packages particularly for eco-tourism and special interest tourism
• To encourage sustainable tourism development that reflects andreinforces the character, culture and natural features of the region
• To identify existing barriers to successful tourism development and toidentify solutions
• To determine the tourism opportunities that would maximise the use ofthe existing infrastructure within the region, particularly majorsettlements
• To devise strategies which should encourage private sectorinvestment in tourism development within the region.
• To provide a direction for the preparation of business and marketingplans
• Desired Outcomes
In order to give expression to these objectives the following outcomesare anticipated:-
• Specific product packages for sale and distribution to the retail andwholesale markets to be trialed in major domestic and internationalmarkets with assistance from the South Australian TourismCommission;

• Detailed marketing and strategic directions for the development oftourism in the Northern Tourism Marketing Board area;
• An action plan to address the major tourism product and infrastructuregaps;
• Identification of the infrastructure required to support investment andto provide for and manage the impact of visitors;
• Objectives and strategies to achieve economic and environmentalsustainability;
• An implementation strategy that identifies the program of works andactions, organisational responsibilities and timelines;
• Draft guidelines for tourism development in the region.
• Required Study Program
The study program should be developed around eight stages. Estimatedtimes are shown for each activity and stage.
Study Hours
· Stage 1 - Briefing July 1995 24
· Stage 2 - Research July/August 1995 268
· Stage 3 - Public Consultation August/September 1995 105
· Stage 4 - Strategic Analysis August-September 1995 82
· Stage 5 - Draft Strategy September/October 1995 190
· Stage 6 - Public Review November/December 1996 163
· Stage 7 - Market Validation December 1995 - January 1996 186
· Stage 8 - Final Strategy January 1996 66
STAGE 1 - BRIEFING
3 activities, total 24 estimated study hours.
Steering Committee Meeting 1 - Briefing (say 6 study hours)
• The structure for membership of the steering committee is one member ofthe eco-tourism project Steering Committee, two representativesselected by the Regional Marketing Board, one representative from theDepartment of Environment and Natural Resources and one
2

representatives from the Tourism Commission who should chair theCommittee.
• Finalise all details of the project with the Steering Committee prior tocommencing the project
• Receive the latest documentation on tourism marketing strategy preparedby the Commission and the Regional Marketing Board.
• Discuss the study program in general terms and note any key factors interms of priorities, content and process that need to be added orvaried, particularly for Stage 2.
Industry organisation briefing (say 16 study hours)
Each of the above organisations is to be visited
• to receive any further strategy, planning and budgetingdocumentation prepared by them.
• to discuss organisation structure and relevant job descriptions
• to discuss a list of key contacts and industry members for databasepreparation.
• to discuss the study program and steps involving their organisation
Public notification (say 2 study hours)
• The public consultation process is detailed under Stage 3 and Stage 6headings below.
• Appropriate letters and advertisements should be prepared notifyingindustry members and the general public about a series of meetings tobe held in various locations during the public consultation phase.
• It is recognised that communication is a key component in the study andall publicity material should be designed not only to inform but also toenthuse the target audience.
STAGE 2 - RESEARCH
14 activities, total 198 estimated study hours.
Computer data base - references & contacts (say 40 study hours)
• A computerised database should be established for both references andcontacts.

• All the existing reference material and documentation relevant to the studyshould need to be perused and catalogued.
• Contact information (e.g. name, address and other details) should need tobe recorded for each relevant individual and organisation, to ensurethe widest possible reach for communication material and for surveyquestionnaires. .
Tourism market analysis (say 20 study hours)
• All relevant statistical and market reports should be studied and evaluatedin order to get a clear picture of market profiles, trends, segments,competitive behaviour and problem and opportunity areas.
• A summary of market information gaps should also be prepared.
Analyse existing consumer & trade research (say 20 study hours)
• Relevant quantitative and qualitative surveys should be studied includingrelevant overseas material relating to eco-tourism and nature-basedtourism, etc.
• Information gaps relevant to the project area should also be identified.
New consumer & trade research - focus groups (say 40 study hours)
• From a planning and marketing point of view the identification andsatisfaction of consumer needs is paramount.
• The study must allow for some additional consumer and trade marketresearch, by way of interview, to explore motivations and the rangeand depth of consumer attitudes concerning image and productpreference, particularly for the interstate and overseas traveller.
• Some of this research should be carried out in key destination areas andsome in the nearest capital cities.
• Should a more detailed survey be considered necessary in the future, thismust be outlined in the strategy recommendations.
Tourism inventory analysis (say 40 study hours)
• A comprehensive tourism inventory analysis is required for each productand location category with cross-references to the target marketsserved and visitation and yield being generated.
• Objectively assess the natural and built features of the area to determinecultural, heritage and eco-tourism opportunities.
• Consequent development concepts must be studied in line with travellertrends, heritage and ecological interpretation and visitor management.
4

• Proposed projects (mooted or approved) should also be examined andconceptually screened as to their fit with existing target marketing andproduct strategy documentation.
• Where a reasonable prima facie case exists for their inclusion, additionaldevelopment concepts should be noted.
Existing strategy research - tourism (say 5 study hours)
• All the relevant planning documentation, performance indicators andtrends which might affect the region must be researched andconsidered at this point and input into the process for jointunderstanding and evaluation.
Existing strategy research - economic development (say 5 studyhours)
• Some economic development workshop and planning activity has alreadybeen conducted in the region and the results should be studied as partof the process.
• In addition State and regional economic strategy plans must also beanalysed.
Existing strategy research - environmental & development planning(say 20 study hours)
• A full environmental audit is not anticipated
• Instead there must be a focus on the key issues for sensitive areas(including carrying capacities) as well as for the project area as awhole.
• Part of this assessment should include the management and fundingconsiderations for environmental protection and upgrading andappropriate policies and objectives for land use planning and zoning. Itis anticipated that the "user pay" issue should emerge during thepublic consultation phase and a full understanding of the costsinvolved is essential.
• Particular attention should be given to the definition of desired futurecharacters for key tourism zones and to principles for guiding planningand development in these areas.
Industry organisation research (say 12 study hours)
• It will be necessary to re-visit the industry organisations mentioned inStage 1 (and others) to be fully informed about what has been done inthe past and what is planned for the future.

• An assessment of the effectiveness of each organisation in terms ofperformance achievement against objectives and goals andperception about the organisation's standing and credibility amongorganisation members ( perhaps using survey techniques) should bemade.
Competitor analysis (say 10 study hours)
• A comparison should be made of the project area’s strengths andweaknesses relative to other regional and interstate competitivelocations in order to help develop a unique competitive productoffering.
• The opportunities for developing a co-operative approach with adjoiningareas in order to expand the market further must also be considered.
Issue research (say 10 study hours)
• The study of documentation in previous steps, along with further research,interviews and discussions should help generate a list of issues whichcan be defined and analysed for later use, particularly in preparationfor workshop activity.
• Care should be taken not to pre-empt the rights and opportunity forworkshop attendees to brainstorm and develop their own issuestatements. However, prior preparation should help workshopfacilitation..
Preliminary situation and SWOT Analysis (say 20 study hours)
• A situation analysis should be prepared by distilling the analyses preparedin the previous steps including:-
• a summary of the market situation from the marketing analysis bylooking at the demand and supply situation and history
• the underlying determinants of demand should be listed andweighted for the total market and for each important segment.
• on the supply side, a summary of the major factors at workincluding competitive positioning, investment attraction,infrastructure funding and industry organisation structure andeffectiveness.
• three scenarios of future demand (optimistic, realistic andpessimistic) with relevant assumptions.
• A preliminary SWOT analysis should be prepared listing in a preliminaryfashion the relevant strengths, weaknesses, opportunities and threatsfor the area for potential use during the public consultation phase,again without pre-empting the attendees right and opportunity to
6
participate in a "clean sheet" SWOT analysis, and later in a survey tovalidate SWOT conclusions.
Stage 2 report - progress & plan (say 20 study hours)
• Report to summarise activities, key points and remaining work.
• Position papers may be necessary.
Steering Committee Meeting 2 - review (say 6 study hours)
To review the progress report and endorse the plan for the next stage.
STAGE 3 - PUBLIC CONSULTATION
5 activities, total 105 estimated study hours.
• A series of both regional and special interest workshops should beconducted to canvass views about the project and particularly attitudesas to
• whether tourism is seen in a positive or negative light
• the mix of tourism and in particular to eco- and cultural tourism
• issues that need to be addressed by the region to ensure that itcan increase and control tourism visitation growth
• These issues and ideas should then be considered within a clearbusiness planning framework to arrive at groups of issues, goals andstrategies and prioritisation of these into clear actions
• Stakeholders' to be invited should include tourism operators, members ofthe community in general, local government, (both within, and adjacentto, the area) local or regional development authorities, standingmembers of State and Federal government, academic institutions,tourist associations, farmers and other resource associations, retailers,commence, banking, etc. parks and local government bodies etc
Key stakeholder workshops (say 9 study hours)
• Separate workshops for key industry members should precede the publicworkshop.
• It may be necessary also to hold additional workshops with industrygroups after the public workshop process to take the findings to agreater depth.
• Discussion and debate on identity / image, key problem and opportunityareas, priorities and alternative strategy definition must beencouraged.

• As the draft strategy develops we should be trying to stimulate theawareness, interest and motivation of the key players to seethemselves taking ownership of the plan and process after the study iscompleted.
• In a sense, we should be marketing the study itself while it is beingcompleted and also examining first-hand the way each organisationworks and the need for changes to these organisation structures todrive the process better for the long term.
Public consultation workshops (say 40 study hours)
• This is a key step in the project and essential for community ownershipand commitment. The workshop process is a medium not only forinput but for establishing communication links and promoting thestudy.
• In each workshop there should be ample opportunity to discuss strengths,weaknesses, opportunities, threats, existing character, desired futurecharacter, community values and concerns, etc.
• Emerging from the discussion should be the identification of key issues.
• Some demographic analysis of the residential population in each areashould be completed and any existing social analyses at the local levelshould be examined.
• It is to be expected that issues concerning sustainability will need to beproperly addressed and discussed in an objective way in order to helpresolve the economic and environmental concerns of the local andwider community.
• If these issues can be identified early enough it may be possible tomanage their development and resolution in a way suitable to mostpeople without risking the progress of the study through subjectivelybased opposition which falls outside the ambit of commonly agreed,desired and sustainable outcomes.
• Strategies for communication and key player involvement should bedesigned to avoid these risks while at the same time building apositive and creative climate to ensure widespread acceptance andeffective follow-through to attain the agreed objectives.
• The nexus between the community's physical resources and the ability ofits human resources to respond to the challenges of growth that lieahead must be recognised.
Issue validation survey (SPSS) (say 30 study hours)
• The issues identified during the industry and public workshops should bedefined and presented in questionnaire format afterwards for
8

distribution to the attendees in order to gain a more thorough andobjective assessment of attitudes.
• Some of the industry and public participants may not have been properlyinformed as to the breadth and depth of the issues involved and mightvalue an opportunity to provide additional input in a properly structuredand presented way.
• Completed questionnaires should be processed using SPSS software(Statistical Package for Social Sciences) and the frequency and cross-tabulation responses presented accordingly.
Stage 3 report - progress & plan (say 20 study hours)
• A progress report for this stage summarising the activities undertaken andthe points to be highlighted together with details of the work plan forthe following stage should be prepared and provided to the SteeringCommittee.
• Part of this progress report might need to be released in the form ofposition papers to a select wider group for feedback to the SteeringCommittee, particularly on critical issues, and to help to moreeffectively plan the remaining stages.
Steering Committee Meeting 3 - review (say 6 study hours)
• Report to summarise activities, key points and remaining work.
• Position papers may be necessary.
STAGE 4 - STRATEGIC ANALYSIS
10 activities, total 96 estimated study hours.
Final situation and SWOT analysis (say 5 study hours)
• This should follow a similar process to the preliminary situation andSWOT analysis but should incorporate the findings from theworkshops and questionnaires.
• Questions concerning key situational facts and SWOT issues should beincluded in the questionnaire.
Target market evaluation (say 7 study hours)
• The target market identification and evaluation should flow from thepreceding market research.
• Each target market proposed should be screened first using appropriatemarket selection criteria.

• Target markets that are successfully screened should then be fullydescribed in both qualitative and quantitative terms to facilitate thedevelopment of the draft strategy and draft marketing plan.
Infrastructure & environmental analysis (say 5 study hours)
• This does not include product.
• Included are those community assets that help the tourist access theproduct, e.g. information distribution points, signage, transport, roads,air routes, public facilities, etc. This is traditionally the province ofLocal, State and Federal government.
• The environmental analysis should summarise the key environmentalconcerns and priorities identified in earlier steps.
Product portfolio & positioning analysis (say 15 study hours)
• This should be the first attempt to map the market in terms of product fit totarget market categories in a comprehensive way.
• The aim should be to identify gaps and niches based on an analysis of theproblems and opportunities evident from the matrix analysis.
• Positional strategies that build on strength, overcome weaknesses andestablish a clear and identifiable position in competitive and consumerterms should then be developed.
• All development strategies and levels of development should then beproperly defined for the next step.
• Product packages should be defined as part of this step in a format forlater validation.
Alternative scenario definition (say 4 study hours)
• Alternative scenarios based on proposals and levels from the previousstep together with the alternatives of future demand, (e.g. optimistic,realistic and pessimistic) should be prepared.
• Each scenario should be described fully together with consequences andimpact.
Strategic alliance strategies (say 4 study hours)
• The opportunities to forge alliances with adjoining regions and Statesshould be defined.
• A range of alternatives should be suggested but not analysed in anydepth on the basis of negotiations, etc.
10
• This activity would follow as part of the strategy once the strategy plan isapproved.
Investment attraction strategies (say 6 study hours)
• A key to the "yield" aim is to demonstrate existing and potential profitabilityfor operators, developers and investors.
• An investment attraction planning outline should be loosely defined to tiein with the product portfolio suggestions of an earlier step.
Cost benefit analysis (say 10 study hours)
• It should be important to have a descriptive assessment of the costs andbenefits of tourism to the community to help in the public reviewprocess by clearly defining the economic value of tourism.
• A clear answer to the question "Why tourism?" must be provided.
Stage 4 report - progress & plan (say 20 study hours)
• Report to summarise activities, key points and remaining work.
• Position papers may be necessary.
Steering Committee Meeting 4 - review (say 6 study hours)
To review the progress report and endorse the plan for the next stage
STAGE 5 - DRAFT STRATEGY
8 activities, total 210 estimated study hours.
Draft strategy definition (say 18 study hours)
• The draft strategy should be developed from the preceding research,consultation and analysis and should be subsequently modified duringthe public review and market validation stages.
• The overall strategy should represent a general action plan for applyingresources to meet major objectives. Emphasis is on the word 'general'.We define strategy as being a broad course of action designed to gainsignificant leverage on the achievement of the objectives. A strategy isa way forward, an alternative route in a range of alternative routes tothe objective as a destination. It is this feature that distinguishes astrategy from a detailed action plan.
• We are seeking proposals bold in character and vision, broad in scope, ofmajor importance, of a break-through nature ,and preferablyachievable with the lowest level of resource input.

• The following questions must be answered in respect to each of theproposed strategies:
Communicability
• is the proposed strategy "identifiable" and "understandable" for thestakeholders?
External fit
• is the proposed strategy consistent with State tourism strategy, thenatural environment and market opportunities?
Internal fit
• is the proposed strategy consistent with industry strengths,objectives, policies, resources and values?
• note, each product and market development proposal should bescreened as to its impact on the objectives
Risk
• does the proposed strategy achieve minimal risk with maximumyield consistent with resources and prospects?
Alternatives
• has the proposed strategy resulted from a process of objectiveanalysis and incorporate maximum application of imaginationand creativity?
• does it respond to defined problems and opportunities?
• has there been a careful appraisal and comparison with otheralternatives to help establish the key factors for success?
Quantification
• is the proposed strategy measurable in terms of time (not be openended) and performance?
• can identifiable outcomes and performance parameters be set?
Continuity
• should the proposed strategy be conducive for continual reviewand planning?
• A series of benchmark review points should be recommended over thenext five years, to monitor progress and to facilitate change ifnecessary, in order to ensure the best continuing outcomes,
12

particularly having in mind that possible changes in key players andpersonnel in the region.
Draft marketing plan definition (say 40 study hours)
• This should be drawn up to create and promote the identity, image orprofile of the area immediately and to work in with productdevelopment and projected visitation growth over the 10 year period.
• It should clearly identify target markets and aim very precisely for these, inall recommendations given.
• It should cover the complete marketing mix, not only the traditionalpositional advertising and promotion, but co-operative opportunitiespresented through State and Federal tourism agencies, through largehotel, airline or coach companies and through packaging suggestionsto inbound operators and wholesalers.
Financial & funding evaluation (say 20 study hours)
• All the major proposals should be individually costed andrecommendations concerning their fundability and source of fundingshould be provided to the best of our ability in the time available.
Product package evaluation - retail, wholesale (say 20 study hours)
• The product packages identified in the "product - portfolio" step shouldthen be tested at a retail and wholesale level to measure immediatereactions and likely product strength.
Draft Strategy report preparation (say 60 study hours)
• This is where the research, public consultation and strategic analysiscomes together in one report. The headings for this report might followthe steps in this consultancy schedule with provision of course forobjectives and the strategies identified.
• The challenge however is to prepare the report in an easy to followmanner. Whatever format is chosen, answers to the followingquestions must be provided:
Appreciation
• Where are we now?
• Where have we come from? (inc. current situation and SWOTanalysis, past performance review)
Aim
• Where do we want to go and why? (inc. mission / role, generalaims, direction, objectives, goals);

Alternatives
• Which ways might we go? (inc. alternative strategies and impactanalyses);
Analysis
• Which ways can we go?
Decide
• Which way should we go and why.
Plan
• What, how, who, when, where (action plan and budget);
Organise
• What resources are required (inc. human, physical and financial)
• What are the key roles and responsibilities in the industryorganisation structure?;
Staffing
• Who are the key players?
• How well does the existing human resource base and organisationstructure measure up to the plan requirements?
• What needs are there for education, training, motivation anddevelopment?
• Is human resource development / service a key strategy?;
Direction
• Who is in charge?
• Who should be in charge?
• How is the government / private sector partnership going to work?;
Control
• What controls are necessary for the allocation of funds and toreview, correct, re-plan and re-budget?.
Stage 5 report - progress & plan (say 20 study hours)
• Report to summarise activities, key points and remaining work.
14

• Position papers may be necessary.
Steering Committee Meeting 5 - endorsement (say 6 study hours)
To review the progress report and endorse the plan for the next stage
Publicity for public review process (say 6 study hours)
A notice advising of the following public review process should beprepared for insertion into local papers and direct mailed to those on thedatabase.
STAGE 6 - PUBLIC REVIEW
8 activities, total 148 estimated study hours.
Public dissemination & exhibitions (say 15 study hours)
• Copies of the draft strategy would be made available for inspection andcomment.
• It may be necessary to establish a "drop in" information area in localgovernment offices in each key local area with suitable displaymaterial to provide information about the draft strategy and to helpobtain additional comment.
Public workshops (say 40 study hours)
A further opportunity for industry and the public to come together anddevelop a consensus together.
Public attitude survey (Delphi )- prepare & send (say 30 study hours)
An essential follow-up. Participants in the workshops should be invited toparticipate in an iterative Delphi process to determine strength of feelingfor the various issues raised.
Public attitude survey (Delphi) - analysis (say 40 study hours)
This involves processing an analysis of the Delphi generated feedback.
Public attitude study (Delphi) - client review (say 6 study hours)
• The attitude study results would be essential for the framing andacceptance of the draft strategy.
• All stakeholders should have had the widest possible opportunity toexpress their views in the most systematic and objective wayavailable.

• This should provide some additional comfort to policy makers andlegislators. The study should help minimise the risks and maximise thechances for success for the strategy.
Amendments to draft strategy (say 6 study hours)
The attitude study should probably generate opportunities to tune thestrategy up further in terms of the desired aims and objectives.
Stage 6 report - progress & plan (say 20 study hours)
• Report to summarise activities, key points and remaining work.
• Position papers may be necessary.
Steering Committee Meeting 6 - review (say 6 study hours)
To review the progress report and endorse the plan for the next stage
STAGE 7 - MARKET VALIDATION
5 activities, total 186 estimated study hours.
New packages - consumer research (say 40 study hours)
• Several small focus groups would be organised just to test immediatereaction and attitude strength to the key development proposals.
• This is not meant to be an exhaustive consumer research study but just topoint the way for a wider exercise as part of the implementation workto follow the launch of the new strategy.
New packages - trade research (say 40 study hours)
• This is an essential step. The package must excite the trade and be seenas commercially viable for them.
• Small focus groups may be used but most of the work in this step shouldbe carried out by executive interview.
New packages - test marketing (say 80 study hours)
• This step needs to be more fully defined in conjunction with the Statetourism authority and depends very much on what findings can bepresented.
• The duration for this step should depend also on the test objectives, e.g. ifwe are looking for a sales response then the duration would be a lotlonger. If, however, the test objective is primarily to generate afavourable response to a commercially formatted package (rather thana concept) then this duration would be appropriate.
16

Stage 7 report - progress & plan (say 20 study hours)
• Report to summarise activities, key points and remaining work.
• Position papers may be necessary.
Steering Committee Meeting 7 - review (say 6 study hours)
To review the progress report and endorse the plan for the next stage.
STAGE 8 - FINAL STRATEGY
3 activities, total 66 estimated study hours.
Final Tourism Strategy - preparation (say 30 study hours)
Final Marketing Plan - preparation (say 30 study hours)
Steering Committee Meeting 8 - endorsement (say 6 study hours)

FAR NORTH & COOBER PEDY TOURISM MARKET ASSESSMENT HANDOUT 1.2(Author Bill Wright)
I. TOURISM IN SOUTH AUSTRALIA
• Between 1985 and 1992 tourism has shown steady growth with an annual averagerate of increase of around 2% in the number of visitors to South Australia
• Between 1985 and 1992 the number of international visitors to South Australia grew by10% pa. while visitor nights grew by 3% pa.
• Overall, the tourism growth achieved by SA reflects national trends of tourism growth.SA has achieved marginally better growth rates as a consequence of the success ofsome specific special events
• Tourism is an industry with considerable potential for future growth. At an internationallevel the World Tourism Organisation forecasts that
• international tourist arrivals will increase world wide, at an average annual rateof 4.2% during the 1990s
• for the Asia / Oceania Region the annual average rate of growth in touristarrivals will be over 8%
• Australia is well placed to capture a significant share of this market
• SA is positioned to capture emerging markets with its range of tourism opportunitiesemphasising close to nature, wildlife and aboriginal cultural experiences.
•
• COOBER PEDY PRODUCT
A. Identity / Image
Coober Pedy is in the Far North (Outback) region and provides adistinct opal and outback experience that has found favour withAustralian and overseas tourists alike.
South Australia is the opal capital of the world with 95% of theworld’s opal being mined in this State. Visitors have a strong interestin opal and there are even opal experiences in the City of Adelaidewhere visitors can see opal shops, opal manufacturing and videoson opal mining and opal-field lifestyles.
The whole Far North Region offers a large number of scenic, culturaland heritage related attractions with a unique natural landscape,outback lifestyle and significant Aboriginal and European heritage.
Whilst Coober Pedy is a well known opal mining area, it has greatstrategic significance as a gateway and hub for the Outback, andcould in time be compared with Alice Springs in character, albeit ona smaller scale.
18

It certainly will provide a key focus for tourists seeking Aboriginalcontact, culture and experience. Coober Pedy has a large Aboriginalpopulation, who with training and community involvement, couldbecome a valuable tourism asset. Furthermore, many Aboriginalslive in bush settings quite close by on nearby cattle stations.
Far North tourism has increased considerably with improvedaccessibility now that the Stuart Highway has been bituminised andalso because of an increasing trend for outback/adventure holidays.
2.2 Seasonal Nature
The prime season for holiday visitation is traditionally the wintermonths (May to October) when the weather provides ideal holidayconditions. This applies to tourists using the Far North as adestination or as a stopover for travellers on their way Further North.
Reflecting this, the peak accommodation occupancy month in theFar North is August (57.4%) with the period May-Septemberexceeding the yearly average (approximately 40%). The worstmonth is February (25%). In the five-year period 1984-1989 thehighest occupancy was in July 1987 with 65.1% and the lowest19.5% in January 1985.
Caravan parks in the Far North achieve an annual occupancy in thevicinity of 17% which is about the South Australian average.
2.3 Accommodation
In 1992/93 there were 9 accommodation establishments providing363 rooms. These establishments sold 47,650 nights with anaverage occupancy of 35.9%, which is comparable to other S.A.country areas.
•
• 3. COOBER PEDY VISITOR SURVEY
A visitor survey was carried out by the Office of Tourism IndustryDevelopment on behalf of the Coober Pedy Retail Business and TourismAssociation. It was conducted in 1993 during August and September andrepresents strong confirmation for new product development in CooberPedy.
Some of the highlights of this survey are as follows:
Visitor origin
15.5% of the sample were from overseas and half the sample camefrom Victoria, New South Wales and ACT. Visitors from Adelaidewere 15% of the sample.

Visitor Nights
56% stayed one night, 31% two nights and 12% for longer periods.
Activities undertaken
The statistics allow for multiple responses. 77% visited opal mines /displays, 59% visited an underground home, 50% took a town tour,48% purchased opal, 44% went opal noodling and 30% visited theBreakaways.
Activities enjoyed
46% found visiting opal mines / displays particularly enjoyable, 27%liked the town tour and 20% liked opal noodling. Generally speaking,these percentage responses indicate that there are manyopportunities for improvement.
Activities would have liked
This data provides the strongest possible confirmation for recentCoober Pedy new product proposals. Its importance must bestressed. It confirms the South Australian tourism strategy favouringgateway, Aboriginal, ecotourism concepts.
New product proposals should include;
• higher activity for opal mining than just noodling and passive visitsto opal mines;
• high contact with Aboriginals, particularly in authentic settings.
Product profile
The visitors agreed that Coober Pedy provided a really differentlifestyle (87%), was educational (78%), was not an over-developed place (77%), had lots of things to see and do (75%),loved the wide open spaces (65%) and was the experience of alifetime (64%). Of some concern however, is that 63% agreed thatthey would only want to visit Coober Pedy for a day or two. Thishighlights the need to strengthen the product to encourage alonger stay.
Mode of travel
53% travelled by normal passenger car, 10% by coach, 29% by 4-wheel drive and 1.5% by aeroplane. The high 4-wheel drivepercentage augurs well for “tagalong” tours. The low aeroplanepercentage would suggest an opportunity, particularly with stronggrowth rates for Coober Pedy tourism.
Recommend Visit
97% would recommend a visit to Coober Pedy.
20

Satisfaction71% rated “Range of things to see and do” as good but there were concerns about thequality and value of accommodation and tourism information, etc. There is obviousroom for improvement here
Opal ExpenditureThe average (mean) expenditure for the sample group was $107. The most common(median) expenditure was $4 and the maximum expenditure $8,500 by one tourist.
4. COOBER PEDY VISITATION
4.1 Domestic
The domestic statistics are collected from the Domestic TourismMonitor (DTM). Figures earlier than 1988 are not comparable withmore recent statistics and therefore the Office of Tourism IndustryDevelopment recommends their exclusion. They have provided thefollowing figures:
Visits Visitor Nights
1988/89 50,000 143,000
1989/90 64,000 173,000
1990/91 47,000 133,000
1991/92 52,000 135,000
1992/93 37,000 73,000
The Office of Tourism Industry Development cautions us in theinterpretation and use of these figures with the following note: “Atthe 95% confidence limit a survey estimate of 50,000 visits isassociated with confidence limits of plus or minus 60%”. Thereason for this cautionary note is that these statistics are basedon samples and are therefore not reliable. For example, the figurefor 1992/93 could easily be plus or minus 22,000 ie. it could be ashigh as 60,000.
In these circumstances, averaging the visitation statistics over the5-year period would be more appropriate. The average number ofvisits over the 5-year period is 50,000 visits per annum and theaverage number of visitor nights is 130,000. On average,therefore, visitors are staying 2.6 nights.
4.2 Competitive Positioning
As far as competitive positioning for domestic visitation isconcerned the figures for number of visits for 1988/89 indicatethat Coober Pedy ranked higher than many other towns, howeverbut could not match many of these towns in terms of number ofvisitor nights. The obvious conclusion from the 1989 statistics wasthat Coober Pedy had to increase the length of stay of visitors by

providing other experiences for tourists. The average nights stayin 1989 was 2.86 nights.
The figures for 1992/93 are more sobering with 37,000 visits,73,000 visitor nights and an average nights stay of 1.97 nights. Bycomparison, Coober Pedy visitation seems to have slippedcompared with 1988/89 and with other locations. This couldindicate statistical error and / or a higher dependence on the stateof the economy or even “fear” because of recent backpackermurders.
1988/89 1988/89 1992/93 1992/93 Visits Visitor Nights Visits Visitor Nights
Coober Pedy 50,000 143,000 37,000 73,000Pt Lincoln 48,000 324,000 46,000 213,000Glenelg 47,000 275,000 66,000 230,000Whyalla 45,000 173,000 92,000 394,000Loxton 44,000 70,000 35,000 103,000Robe 42,000 181,000 46,000 172,000Moonta 38,000 77,000 28,000 83,000Berri 35,000 71,000 40,000 111,000Clare 35,000 135,000 33,000 108,000
Source: Domestic Tourism Monitor (DTM)
Note 1: The source of the above estimates is the DTM. The data refersto only domestic visits and nights for persons 14 years and over.
Note 2: Because the DTM is based on a sample survey, caution needsto be exercised in the way data are used. This particularly applies todata for small regions / towns.
4.3 International Visitation
Figures are available from the International Visitor Survey (IVS).
In 1989 overseas visits to Coober Pedy (including daytrippers)reached 61,600 (placing domestic and overseas visitation on anequal footing for that year) with 25% of all incoming overseastourists including Coober Pedy on their itinerary.
By 1992, however, this figure had fallen to 17%, most likelybecause of the concerns about backpacker safety or alternativelya weakening in South Australian tourism marketing relative toother States (see following figures):
22

INTERNATIONAL VISITATION TO S.A.
1989 1992
Adelaide 91% 222,000 90% 206,600Barossa Valley 45% 109,900 40% 91,100Adelaide Hills 43% 104,000 33% 76,100Victor Harbor 26% 62,300 19% 44,000COOBER PEDY 25% 61,600 17% 39,900Hahndorf 24% 58,500 23% 52,900Cleland Wild Life Park 22% 52,600 14% 31,200River Murray 20% 48,100 14% 33,100Mt Gambier 13% 32,400 11% 26,000Kangaroo Island 12% 29,800 13% 30,800Flinders Ranges 12% 29,700 11% 24,100Clare Valley 10% 24,100 7% 15,700Port Lincoln 4% 9,300 3% 7,100
Note 1: These visitation statistics include “day trippers”, ie. thosepeople visiting a location without staying overnight. This shouldbe realised when making comparisons between these statisticsand those in paragraph 4.1 above.
Note 2: These figures are contained in the International VisitorSurvey (IVS) and are based on sample data for persons 15 yearsand over and should be interpreted with caution on a year by yearbasis but should be reasonably reliable when “smoothed” .
The level of overseas visitation to Coober Pedy is comparable toCleland Wild Life Park, Victor Harbor, Hahndorf and the AdelaideCasino.
The main generating areas of visitors coming to Australia areEurope, Canada, UK & Ireland, USA, Japan, Asia and NewZealand.
Twice as many USA visitors visit the Barossa Valley comparedwith Coober Pedy, but Coober Pedy is as popular as the RiverMurray and Victor Harbor. The Japanese like the Adelaide Hills,particularly Cleland Wild Life Park and Hahndorf and find CooberPedy as popular as the Barossa Valley and Victor Harbor. Visitorsfrom other parts of Asia have a stronger preference to see theBarossa Valley than the Japanese or the Americans and are moredisposed to see the Adelaide Hills. People from Hong Kong findCoober Pedy very attractive as do also the Europeans.

5. FAR NORTH VISITATION
5.1 Total Visitation
When we combine the statistics referred to below for domestic andinternational visitation the total picture is as follows:
No. of Visits
Domestic International Total Av.% Inc. pa
1985/86 73,000 8,400 81,4001986/87 103,000 14,800 117,800 44.7%1987/88 103,000 22,000 125,000 23.9%1988/89 130,000 28,900 158,900 25.0%1989/90 175,000 45,200 220,200 28.2%1990/91 143,000 42,100 185,100 17.9%1991/92 165,000 39,800 204,800 16.6%1992/93 130,000 39,600 169,600 11.1%
Average growth pa.
Over 7 years 8.6% 24.8% 11.1%
Number of Visitor Nights
Domestic International Total Av.% Inc. pa
1985/86 288,000 27,000 315,0001986/87 375,000 31,000 406,000 28.9%1987/88 536,000 32,000 568,000 34.3%1988/89 471,000 33,000 504,000 17.0%1989/90 646,000 101,000 747,000 24.1%1990/91 368,200 120,000 488,200 9.2%1991/92 516,000 173,000 689,000 13.9%1992/93 451,000 181,650 632,650 10.5%
Average growth pa.
Over 7 years 6.6% 31.3% 10.5%
The total visitation figures over the 7-year period 1985/86 - 1992/93 haveshown an average rate of growth of 11.1% pa. The domestic componentaverage rate of growth (see figures below) has been 8.6% pa. whilstinternational visitation has averaged 24.8% pa. Irrespective of the year toyear fluctuations, which are probably caused by the business cycle andperhaps “fear” because of backpacker murders, there is a strongundercurrent of growth. The same is true for visitor nights which over the 7year period have shown an average rate of growth of 10.5% pa. (domestic6.6% pa., international 31.3% pa.).
24

5.2 Domestic Visitation by State
Domestic visitation to the Far North (the Outback) has grownsignificantly in recent years, particularly from metropolitanAdelaide as the following figures and graph indicate:
Far North Number of Domestic Visits
% Av. Tot.Dom Adl. Oth SA Vic NSW Other
Inc. pa1985/86 73,000 28,000 12,000 13,000 11,000 9,0001986/87 41.1% 103,000 25,000 21,000 17,000 21,000 19,0001987/88 18.8% 103,000 29,000 18,000 23,000 16,000 17,0001988/89 21.2% 130,000 31,000 40,000 29,000 19,000 11,0001989/90 24.4% 175,000 69,000 27,000 19,000 27,000 33,0001990/91 14.4% 143,000 32,750 17,250 57,195 18,414 17,3911991/92 14.6% 165,000 48,804 34,196 44,116 17,794 20,0901992/93 8.6% 130,000 35,624 25,376 41,193 16,698 11,109
Average growth pa.
Over 7 years 8.6%
Note: The statistics for visits exclude “day trippers” ie. those just passingthrough, and therefore only include those staying overnight for one or morenights.
Of the 130,000 domestic tourists visiting in 1992/93, 27% came fromAdelaide, 20% from other parts of South Australia, 32% from Victoria and13% from New South Wales.
Far North Number of Visitor Nights
% Av. Tot.Dom Adl. Oth SA Vic NSW Other Inc. pa1985/86 288,000 179,000 57,000 19,000 15,000 18,0001986/87 28.9% 375,000 180,000 88,000 19,000 69,000 19,0001987/88 34.3% 536,000 234,000 103,000 117,000 33,000 49,0001988/89 17.0% 471,000 132,000 187,000 93,000 27,000 32,0001989/90 24.1% 646,000 241,000 141,000 63,000 130,000 71,0001990/91 9.2% 368,200 106,110 55,890 126,690 40,988 38,5221991/92 1.9% 516,000 163,464 114,536 128,044 51,646 58,3101992/93 10.5% 451,000 135,488 96,512 130,743 52,998 35,259
Average growth pa.
Over 7 years 10.5%

5.3 Overseas visitation
Overseas visitation to the Far North (the Outback) has also grownsignificantly:
No. of Visits % Av. No. of Visitor % Av.Inc. pa Nights Inc. pa
1985 8,400 27,0001986 14,800 76.2% 31,000 14.8%1987 22,000 (est) 61.8% 32,000 (est) 8.9% 1988 28,900 51.0% 33,000 6.9%1989 45,200 52.3% 101,000 39.1%1990 42,100 38.0% 120,000 34.8%1991 39,800 29.5% 173,000 36.3%1992 39,600 24.8% 181,650 31.3%Average 7 years: 24.8% 31.3%
Note: The statistics for visits exclude “day trippers” ie. those justpassing through, and therefore only include those stayingovernight for one or more nights.
5.4 Coober Pedy Share of Far North Visitation
When we compare the Far North and Coober Pedy visitationstatistics, we are able to form conclusions about market share.When we compare the 1988/89 figure of 130,000 domestictourists visiting the Far North with the 50,000 visiting Coober Pedythe market share percentage is 38%. In 1992/93 the relevantfigures are 175,000 Far North visits and 37,000 for Coober Pedymaking a market share of Far North visitation at 21%. Careshould be taken however by placing too much reliance on theyear by year figures when making comparisons. A more reliableconclusion would be to say that over those years an indicativerange of 25-35% might be appropriate.
5.5 Survey preferences
Tourism South Australia reports that in a recent sample survey45% of 191 respondents who visited the Far North (without goingto the Flinders Ranges) said that Coober Pedy provided thegreatest interest of all Far North attractions. Another group of 230separate respondents who visited both the Far North and theFlinders Ranges rated Coober Pedy at 27% compared withWilpena Pound 39%. The next highest ratings for this group wereDalhousie Springs / Mt Dare, Lake Eyre, Oodnadatta Track with11% - 12% each.
In the overall survey of 757 respondents (which included the 191and 230 respondents mentioned above as well as 336 who onlywent to the Flinders Ranges), Coober Pedy rated 20% comparedwith Wilpena 31%, confirming that it has considerable pullingpower.
26

6. FUTURE POTENTIAL
There is considerable potential to develop domestic tourism visitation toCoober Pedy particularly when the State’s promotional strategyemphasising Adelaide as a gateway to the Outback picks up pace andwhen Aboriginal tourism and ecotourism are more strongly promoted.
Furthermore, there should be a major campaign to increase length ofstay by providing stronger attractions and more activities for tourists.Whilst in 1989 Coober Pedy had 38% of Far North visits, it only had 30%of Far North visitor nights. The average night’s stay in Coober Pedy in1988/89 was 2.9 nights compared with Adelaide 4.2, Glenelg 5.8 and PtLincoln 6.8. By 1992/93 the average nights had fallen to 1.97 (37,000visits to Coober Pedy compared with 73,000 visitor nights) again,underlining the need for a major campaign to reverse this situation(providing the figures are right) and increase the average nights stay toat least 3.0.
Target marketing for Coober Pedy should also include rail passengersenjoying the Ghan Experience. With improved infrastructure at the sidingnear Mabel Creek Station, improved tourism transport to Coober Pedy,co-operation from Australian National and co-ordinated development andpromotion, many more tourists could gain a combined mining townexperience along with authentic Aboriginal contact at Mabel CreekStation. Uluru and Alice Springs do not offer a mining experiencewhereas Coober Pedy does.
There has been strong growth in international tourism in Australia inrecent years and the Bureau of Tourism Research is forecasting anaverage 8% pa. growth to the year 2000. This rate of growth is lowerthan that experienced in recent years due to a world economic slow-down, escalating Australian travel costs and the absence of key events.Japan is a strong growth market since Australia only attracts 4% ofall Japanese travellers, but their average stay is only 5 nights. CooberPedy would need to tap a longer staying segment of this market tobenefit from the strong growth expected from Japan.
The outlook for S.A. tourism activity over the next 10 years is promising.International visitation will continue to increase with improved airaccessibility, new product, increased awareness and continuedmarketing overseas.
Whilst there are some very healthy signs suggesting strong growth therewill obviously be limits and constraints to growth, not the least of whichwill be the carrying capacity of the Coober Pedy township andsurrounding environs. The Far North also suffers from the normalproblems of distance and lack of facilities. In some towns there areinadequate facilities for tourists, e.g. conveniences, communication andshopping and there is a need for higher standards.

There is a need to improve tourism resources, the quality of visitorexperience and length of stay, not only for first time visitors, but also forrepeat visitors. This will require an intensified marketing effort to selectedtarget markets, particularly to raise the level of awareness withprospective tourists.
There is also a need to improve marketing planning at the grass rootslevel, particularly through co-operative activity in planning, productdevelopment and promotion.
Also on the downside, Australian economic conditions may tend todampen tourism and S.A. will have to fight harder to win the domestictourism dollar in an increasingly competitive market. The key is toprovide tourism product and services that match consumer needs.
Market research needs to be intensified to ensure that operatorsunderstand the main markets and translate tourist needs andpreferences into saleable product, without impairing the existingcharacter of the product which is serving so well to attract tourists.
The Coober Pedy product has a good fit with the S.A. tourism productstrategy. This strategy emphasises priority themes, particularlyexperiences that are natural and adventurous, and which providelearning experiences and opportunities to see wildlife in its naturalhabitat. Coober Pedy should be able to build on its existing strength as a“top of mind” attraction for visitor generation.
7. FORECASTS
7.1 Disclaimer
The information contained in these forecasts is provided in goodfaith and is derived from sources believed to be reliable andaccurate. Readers of this report are advised that the author doesnot accept any liability for these forecasts. The statementscontained herein are of a preliminary nature and are subject tomarket fluctuations, both nationally and internationally, as well asthe capability of tourism operators to effectively manage theiroperations.
7.2 Far North Forecasting Assumptions
Great care should be taken in forecasts and the following figuresare preliminary estimates based more on arithmetical projectionrather than a fundamental study of supply and demand which wouldbe necessary for a more reliable study.
Attached are some calculations suggesting what we consider are tobe reasonable projections based on the following assumptions:
28

• that the average rate of growth over the last 7 years (1986/93) period will besustained due to the product strength and market attractiveness of CooberPedy and the Far North;
• normal business cycle activity is excluded;
• that Coober Pedy and the Far North will be able to manage the growth andprovide a carrying capacity in terms of infrastructure, community acceptanceand complementary product;
• increased room occupancy but constant length of stay (say 2.5 nights).
7.3 Far North Forecasts
Our projections for the Far North region are as follows:
CurrentPosition 1992/93 1995 2000
No. of visits
• Domestic 130,000 153,000 231,000
• International 39,600 62,000 187,000
Total 169,600 215,000 418,000
No. of visitor nights
• Domestic 451,000 513,000 706,000
• International 181,650 313,000 1,222,000
Total 632,650 826,0001,928,000
No. of guest rooms 363 363 420No. of room nights sold 47,650 55,000 80,000Room occupancy rate 36% 42% 52%
We have assumed that the current level of occupancy of 36% will increase. Wehave allowed for a 2% increase per annum starting at 40% occupancy for 1994.We have also allowed for the average rate of growth for the last 7 years for roomnights sold to be sustained at 7.6%. The existing number of rooms is 363 and weexpect this will be sustained through to 1995 whilst occupancies rise to 42%.
These forecasts have been prepared on the basis of sustaining theaverage rate of growth for the last 7 years through until the end ofthe century without any allowance for business cycle activity or anyother variables. Extreme care should be taken with theirinterpretation and use. In our opinion, however, they can be used asa basis for preparing an optimistic forecast for Coober Pedy tourism.

A more fundamental study of supply and demand variables would berequired in order to produce more reliable forecasts for majorinvestment decision making, e.g. for new hotels, airports, etc. Sucha study should also include a longer history of visitation statistics andcomparisons with similar locations. The key question is “Where arewe on the product life-cycle?”. We suspect that the Far North isabout to enter a period of higher growth because of its fit with theState’s tourism strategy / promotional campaigns and the strongworld trends towards ecotourism.
30

7.4 Coober Pedy Forecasts
We do not consider the Coober Pedy statistics to be reliable enough for forecastingpurposes. Rather, we would prefer to work on the basis of the Far North statisticsand projections using estimates for market share of Coober Pedy to total FarNorth. Our estimates are as follows:
CurrentPosition 1995
20001992/93 Total
TotalNo. of Visits
• Domestic say 50,000• International say 10,000• Total 60,000• Assume 25% Share of Far North 54,000
105,000• Assume 30% Share of Far North 65,000
125,000• Assume 35% Share of Far North 75,000
146,000
No. of Visitor Nights
• Domestic say 130,000• International say 20,000• Total 150,000• Assume 25% Share of Far North 207,000
482,000• Assume 30% Share of Far North 248,000
578,000• Assume 35% Share of Far North 289,000
675,000
No. of Room Nights Sold
• Assume 25% Share of Far North 14,000 20,000
• Assume 30% Share of Far North 16,000 24,000
• Assume 35% Share of Far North 19,000 28,000
Our major conclusion is that there is a distinct chance that, based onvisitation rates experienced over the last 7 years, visitation coulddouble in Coober Pedy by the Year 2000.
These statistics are only for visits staying overnight. Overseas daytripper visitation would be additional. In the current position for1992/93 we have estimated overseas visitors overnighting at 10,000based on a 25% share of 1992 overnighters 39,600. Remember thatthe International Visitor Survey (IVS) shows that 40,000-60,000

overseas visitors include Coober Pedy on their itinerary; this isequivalent to the total number of domestic visitors. Very few of thedomestic visitors will pass through without staying overnight. We canconclude therefore that for every one overseas visitor stayingovernight possibly five are passing through. This represents anexcellent target market opportunity through a combination ofimproved product development and promotion. In short, the tourismoutlook for Coober Pedy through to the end of the century is bright.
32

TOURISM PLANNING HANDOUT 1.4
A DISCUSSION ABOUT GOALS
1. NATIONAL GOALS - USA
Source: Mill & Morrison, 1985 “The Tourist System”, Prentice Hall
• Economic
• full employment
• economic growth with minimum inflation
• reduced international trade deficits
• balanced national transportation system
• Energy
• energy conservation
• economic viability of small business
• Social
• urban re-vitalisation
• consumer protection
• equal opportunity
• improved physical and mental health
• equitable taxation
• Government
• improved operation of the Federal Government
• minimum regulation of private industry
• Environment
• environmental protection
• judicious use of natural resources
• preservation of national heritage resources
• International

• improved international goodwill
1. TOURISM GOALS - USA
Source: Mill & Morrison, 1985 “The Tourist System”, Prentice Hall
Against this backdrop of national interests tourism goals can be developedalong four lines: - economic, consumer, national resource/environmental andgovernment operations.
• Economic
• optimise the contribution of tourism and recreation to economicprosperity
• full employment
• regional economic development
• improved international balance of payments.
• Consumer
• opportunity and benefits of travel and recreation accessible toresidents and visitors
• to contribute to the personal growth and education of thepopulation and to encourage their appreciation of thegeography, history and ethnic diversity of the nation
• to encourage free and welcome entry of foreigners.
• Environmental and National Resource
• to protect and preserve the historical and cultural foundations ofthe nation as a living part of community life and developmentand to ensure future generations have an opportunity to enjoythe rich heritage of the nation
• to ensure the compatibility of tourism, recreational and activitypolicies with other national interests in energy, environmentand judicious use of natural resources.
• Government Operations
• harmonise Federal activities supporting tourism and recreation
• support public and the public and private sector, leadership role.
3. NATIONAL TOURISM GOALS - AUSTRALIA
Source: DASETT, 1991
34
• Economic
To optimise the tourism industry’s contribution to national income,employment, growth and the balance of payments by creating afavourable environment for industry development
• Environmental
To provide for sustainable tourism development by encouragingresponsible planning and management practices consistent with theconservation of our natural and cultural heritage
• Social
To enhance access to quality tourism experiences and ensurefavourable social outcomes of tourism by diversifying the productbase, raising industry standards and protecting the public interest
• Support
To ensure the provision of adequate promotional, planning, co-ordination,research and statistical support to assist the industry’s development.
3. UNITED NATIONS
UN Conference on the human environment listed 4 quality of life needs:
• Improvement of human settlements and health
• Development and use of fresh water, land and energy resources.
• Harmonising development goals and social and cultural valueswith environmental quality objectives
• Protection of living resources and of the ocean, and avoidance ofinadvertent climate modification.
5. THE CHASE FOR COMPETITIVE ADVANTAGE
Source: Michael Porter, "The Competitive Advantage of Nations" (FreePress).
• Porter says that nations exist to give their peoples a rising standard ofliving. This depends above all on continual gains in productivityprovided only by individual firms that search constantly for freshsources of competitive advantage
• Contrast Michael Porter's approach with a traditional economic view thatcomparative advantage is essentially tied up with the idea that anation's wealth depends on it's ability to exploit natural or humanresources of which it has a relative abundance. In Australia's case thelucky country post war strategy emphasised agriculture, mining, etc.

• Porter, however, argues that comparative advantage is not somethinginherited, it is created. In his 4 year study of 8 countries: the US,Japan, Sweden, Switzerland, West Germany, Britain, Italy and SouthKorea, Porter concluded that a nation's international success dependsupon it's ability to upgrade it's advantages to the next level oftechnology and productivity. He argues that Japan's success is notdue to it's management or government planning but mostly to intensedomestic competition in it's export industries. He argues that thefundamental lesson for nations is that the quiet life is an enemy ofcompetitive advantage.
• Porter say Japan is the nation best prepared to compete in the globaleconomy. The answer is to create competition.
6. ALTERNATIVE VALUE SYSTEMS OR WORLD VIEWS Focus A B C D E
HI-TECH MOSTLY MIXED MOSTLY LO-TECH HI-TECH LO-TECH
1. ECONOMY Core Values Consumption
ConservationQuantity
QualityProduct Life LimitedLongProduction - Scale MassCraft (small is beautiful) - Food FactoryStoredTrade World WideBarteringGrowth HighSteady stateInvestment Capital Labour
intensiveintensiveUnemployment High Nil
2. ECOLOGYManagement IneffectiveEffectiveEnergy use HighLowPollution HighLowRe-cycling Little or noneHighConcern for NatureAlienatedIntegratedScience & Technology Dominating
Serving
3. COMMUNITYSettlement CityVillageFamily Scattered
36

CommunalCulture DisintegratingPreservedMotivation to work IncomeSatisfactionDependence on others HighSelf sufficientRecreation SeparatedIntegrated with work
4. GOVERNMENTPolitics ConsensusDemocraticOrganisation CentralisedDecentralised
5. PLANNING & DECISION-MAKINGComplex
SimpleMulti-Disciplinary
Common SenseRelative/Pragmatic
Stable/Principled
HANDOUT 1.5a
AN ORGANISATIONAL SWOT EXAMPLE
Strengths
• Strong capability for servicing the seniors market (80%rating compared to Competitor A 65%)
• Locational advantages provide an opportunity to build image
• Weaknesses
• Poor networking arrangements which leave us vulnerable toindustry rationalisation
• No CEO succession plan
• Opportunities

• Aging population offers opportunity to build on strength inproducts for senior citizens
• Threats
• Declining household formation threatens appliance demand
•
38
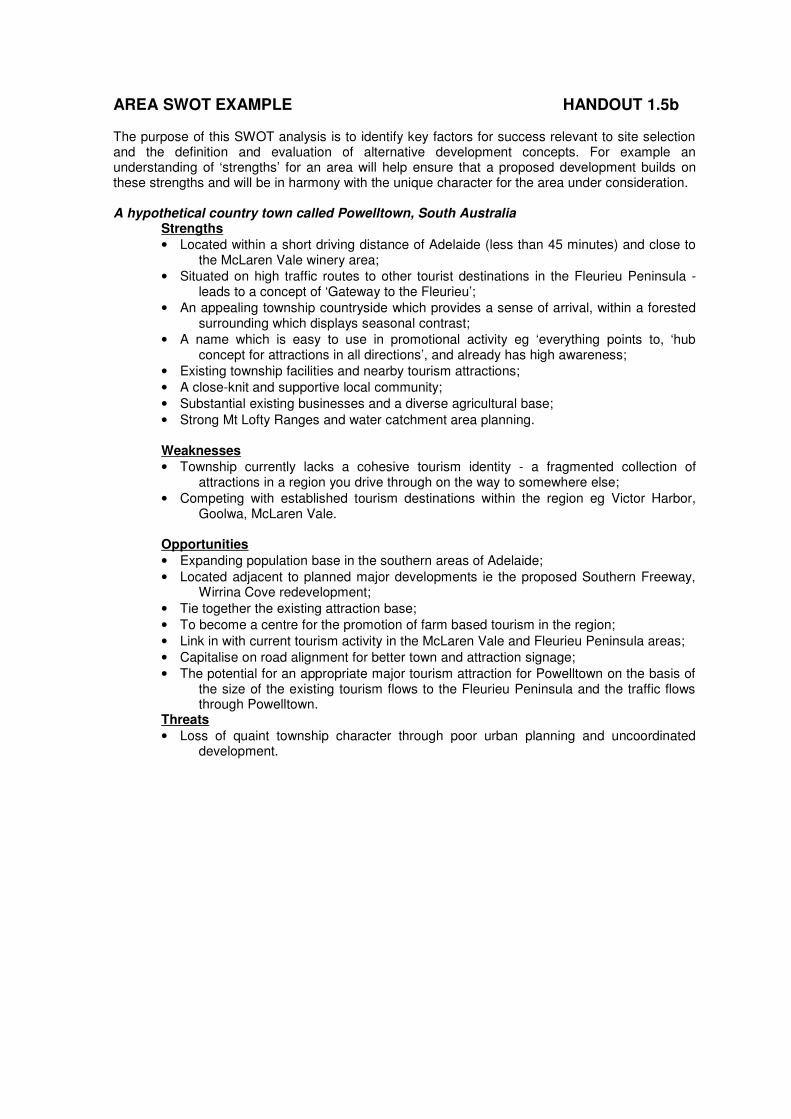
AREA SWOT EXAMPLE HANDOUT 1.5b
The purpose of this SWOT analysis is to identify key factors for success relevant to site selectionand the definition and evaluation of alternative development concepts. For example anunderstanding of ‘strengths’ for an area will help ensure that a proposed development builds onthese strengths and will be in harmony with the unique character for the area under consideration.
A hypothetical country town called Powelltown, South AustraliaStrengths
• Located within a short driving distance of Adelaide (less than 45 minutes) and close tothe McLaren Vale winery area;
• Situated on high traffic routes to other tourist destinations in the Fleurieu Peninsula -leads to a concept of ‘Gateway to the Fleurieu’;
• An appealing township countryside which provides a sense of arrival, within a forestedsurrounding which displays seasonal contrast;
• A name which is easy to use in promotional activity eg ‘everything points to, ‘hubconcept for attractions in all directions’, and already has high awareness;
• Existing township facilities and nearby tourism attractions;• A close-knit and supportive local community;• Substantial existing businesses and a diverse agricultural base;• Strong Mt Lofty Ranges and water catchment area planning.
Weaknesses
• Township currently lacks a cohesive tourism identity - a fragmented collection ofattractions in a region you drive through on the way to somewhere else;
• Competing with established tourism destinations within the region eg Victor Harbor,Goolwa, McLaren Vale.
Opportunities
• Expanding population base in the southern areas of Adelaide;• Located adjacent to planned major developments ie the proposed Southern Freeway,
Wirrina Cove redevelopment;• Tie together the existing attraction base;• To become a centre for the promotion of farm based tourism in the region;• Link in with current tourism activity in the McLaren Vale and Fleurieu Peninsula areas;• Capitalise on road alignment for better town and attraction signage;• The potential for an appropriate major tourism attraction for Powelltown on the basis of
the size of the existing tourism flows to the Fleurieu Peninsula and the traffic flowsthrough Powelltown.
Threats
• Loss of quaint township character through poor urban planning and uncoordinateddevelopment.
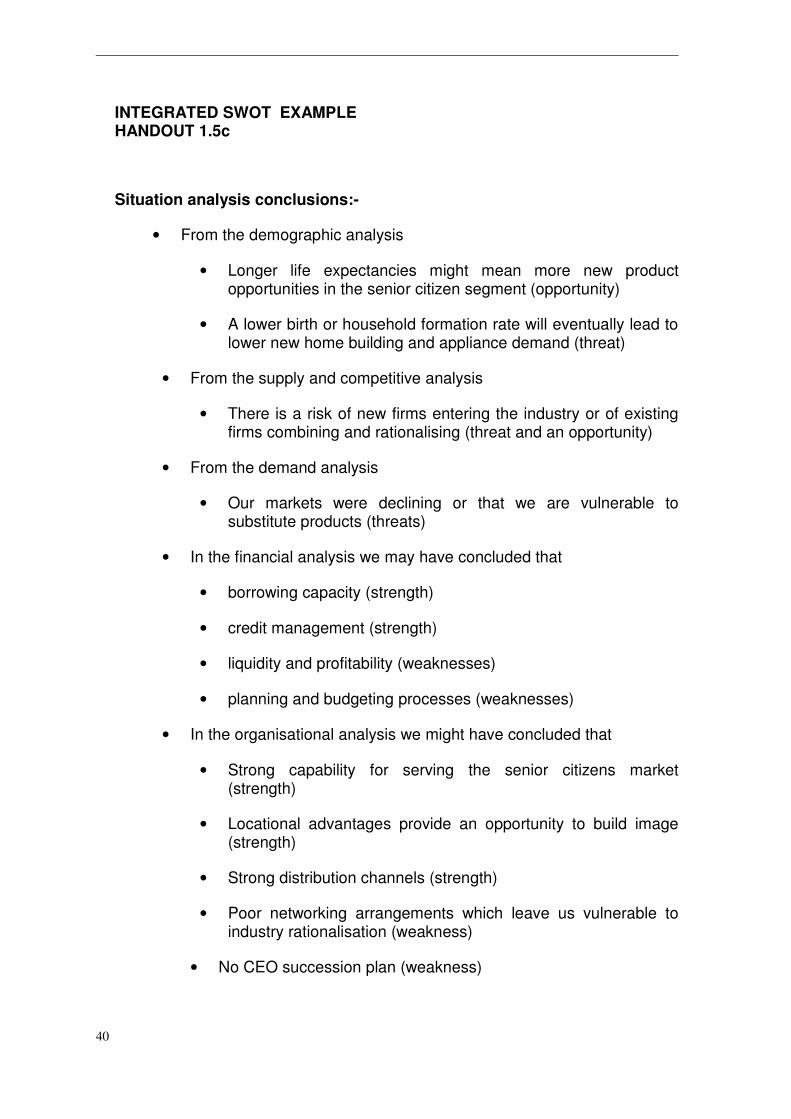
INTEGRATED SWOT EXAMPLEHANDOUT 1.5c
Situation analysis conclusions:-
• From the demographic analysis
• Longer life expectancies might mean more new productopportunities in the senior citizen segment (opportunity)
• A lower birth or household formation rate will eventually lead tolower new home building and appliance demand (threat)
• From the supply and competitive analysis
• There is a risk of new firms entering the industry or of existingfirms combining and rationalising (threat and an opportunity)
• From the demand analysis
• Our markets were declining or that we are vulnerable tosubstitute products (threats)
• In the financial analysis we may have concluded that
• borrowing capacity (strength)
• credit management (strength)
• liquidity and profitability (weaknesses)
• planning and budgeting processes (weaknesses)
• In the organisational analysis we might have concluded that
• Strong capability for serving the senior citizens market(strength)
• Locational advantages provide an opportunity to build image(strength)
• Strong distribution channels (strength)
• Poor networking arrangements which leave us vulnerable toindustry rationalisation (weakness)
• No CEO succession plan (weakness)
40
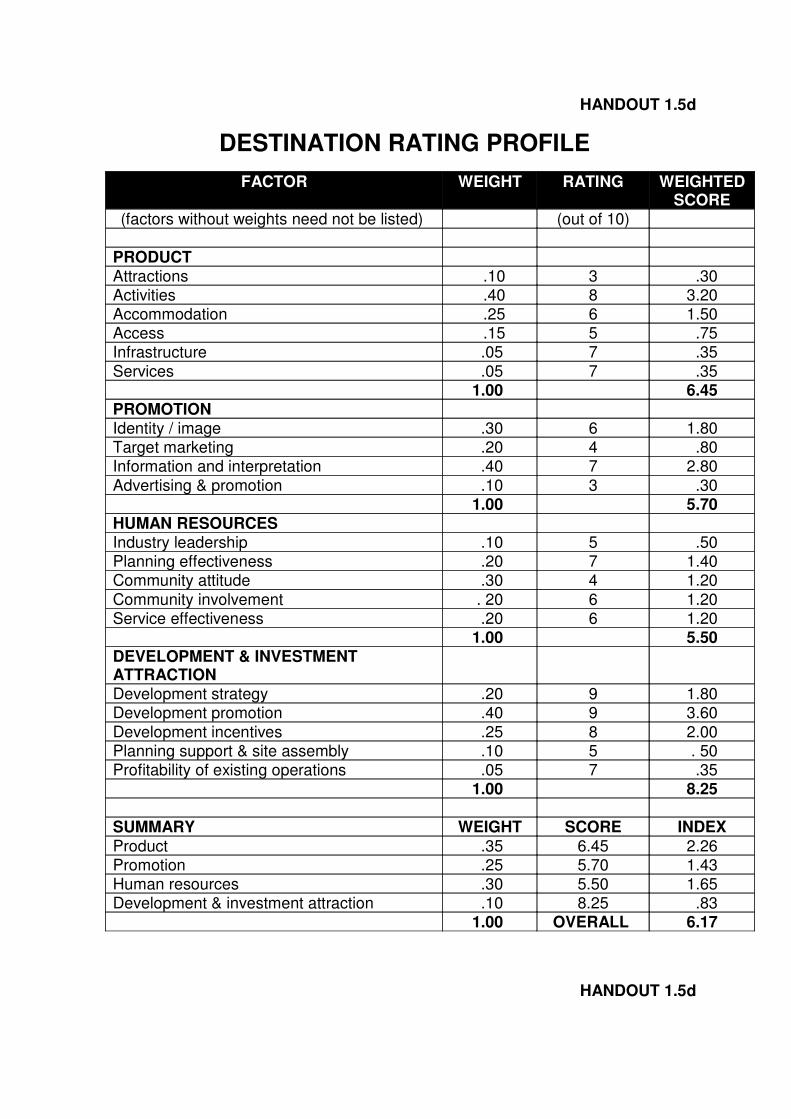
HANDOUT 1.5d
DESTINATION RATING PROFILE
FACTOR WEIGHT RATING WEIGHTEDSCORE
(factors without weights need not be listed) (out of 10)
PRODUCTAttractions .10 3 .30Activities .40 8 3.20Accommodation .25 6 1.50Access .15 5 .75Infrastructure .05 7 .35Services .05 7 .35
1.00 6.45PROMOTIONIdentity / image .30 6 1.80Target marketing .20 4 .80Information and interpretation .40 7 2.80Advertising & promotion .10 3 .30
1.00 5.70HUMAN RESOURCESIndustry leadership .10 5 .50Planning effectiveness .20 7 1.40Community attitude .30 4 1.20Community involvement . 20 6 1.20Service effectiveness .20 6 1.20
1.00 5.50DEVELOPMENT & INVESTMENTATTRACTIONDevelopment strategy .20 9 1.80Development promotion .40 9 3.60Development incentives .25 8 2.00Planning support & site assembly .10 5 . 50Profitability of existing operations .05 7 .35
1.00 8.25
SUMMARY WEIGHT SCORE INDEXProduct .35 6.45 2.26Promotion .25 5.70 1.43Human resources .30 5.50 1.65Development & investment attraction .10 8.25 .83
1.00 OVERALL 6.17
HANDOUT 1.5d

DESTINATION RATING PROFILE
FACTOR WEIGHT RATING WEIGHTEDSCORE
(factors without weights need not be listed) (out of 10)
PRODUCTAttractions .10 3 .30Activities .40 8 3.20Accommodation .25 6 1.50Access .15 5 .75Infrastructure .05 7 .35Services .05 7 .35
1.00 6.45PROMOTIONIdentity / image .30 6 1.80Target marketing .20 4 .80Information and interpretation .40 7 2.80Advertising & promotion .10 3 .30
1.00 5.70HUMAN RESOURCESIndustry leadership .10 5 .50Planning effectiveness .20 7 1.40Community attitude .30 4 1.20Community involvement . 20 6 1.20Service effectiveness .20 6 1.20
1.00 5.50DEVELOPMENT & INVESTMENTATTRACTIONDevelopment strategy .20 9 1.80Development promotion .40 9 3.60Development incentives .25 8 2.00Planning support & site assembly .10 5 . 50Profitability of existing operations .05 7 .35
1.00 8.25
SUMMARY WEIGHT SCORE INDEXProduct .35 6.45 2.26Promotion .25 5.70 1.43Human resources .30 5.50 1.65Development & investment attraction .10 8.25 .83
1.00 OVERALL 6.17
42

• LINKED SWOT EXAMPLE HANDOUT1.5e
• A tourist example to illustrate linking strengths and weaknesses withopportunities and threats
• Rationale for concentrating on visitation to Adelaide
• Strengths - our town is easily accessible to Adelaide, we have apleasant farming environment, good beaches and we are pricecompetitive
• Opportunities - visitation to Adelaide is growing strongly, governmentpromotional support is available, investment in major touristdevelopments is occurring in the region, growing interest in farm-based holidays and adventure
• We will focus on the short-trip market
• Strengths - accessibility, strong product line for places of interest(scenic features, museums, old mines)
• Threats - cost of petrol is increasing, consumer preference to dividetotal holiday time into more short trips
• We need a major magnet in the town
• Strengths - existing town character and community retail support,strong product line of support businesses
• Threats - potential new investment in an adjoining region will shift thecentre of gravity away from our region
• Opportunities - strong short trip support for unique themedevelopments

EXAMINATION - WAGON’S HO!
A well known media personality, Mick Dundee, has regular “bush tucker” spots on a TVtravel show. He has developed a strong personal following and there have even beensome “feelers” for his involvement in overseas TV through some large networks.
One of his dreams however has always been to lead outback horse and wagon adventuretours. He is able to gain exclusive access (in return for a 5% royalty) to aboriginal landsthrough a childhood aboriginal friend who is now chairman of the community council. Thearea contains not only the most remote aboriginal settlements in Australia which are stillinvolved in traditional hunting and food-gathering, but also the most beautiful country withmajestic mountain ranges, wide rock-strewn river-beds, deep billabongs and lush semi-tropical vegetation. Fortunately a network of old tracks exists to the major spots of interestas a result of past mining activities.
Mick approached you for some ideas. You are a tourism consultant and your first stepwas to summarise (after much discussion) the product concept, which now follows.
Wagons Ho! Is to provide a soft adventure holiday using four-wheeled wagons, eachpulled by two Clydesdale horses. Each wagon would carry four adult passengers or twoadults and three children plus driver. Each wagon would be fully equipped with qualitycamping equipment to provide maximum comfort and enjoyment.
The wagon concept would provide a new way to experience the Australian bush andcapture the pioneering spirit as families and/or groups trek leisurely along bush tracks,through forests and over grassy open spaces at a pace slow enough to relax and reallyexperience the natural beauty of the Australian environment.
Groups would leave on a Friday night from a country town base, travel via 4 wheel drivecoach to the “The Homestead” (a restored shearing shed and shearers quarters built inthe 1860s) and overnight there. Next morning the wagons would be hitched up (witheveryone taking part) together with a string of horses for those that want to tag-along or tocombine horse-riding with wagon travel.
From there to “Dreaming Rocks”, about 14 kilometres away, along a track that follows andregularly crosses a river-bed. The river flows for about 6 months of the year but isnormally low enough to cross. This is excellent camping country and well off the beatentourist track. Next day the wagons trek to “Billy Goat Lagoon” to camp, finishing up mid tolate afternoon in plenty of time for traditional campfire ceremonies involving aboriginals ata nearby camp.
Arrangements are in place to use local aboriginal custodians as tour guides for theextended treks through a Conservation Park for up to five days. These venture up to 20kilometres into the Park, which consists of rocky ridges, fertile valleys with large red gumsand golden wattles. Camping within the confines of the Park had been arranged at StagsCamp, an outback oasis. There is a short climb to the top of Goose Hill for a magnificentview of the surrounding countryside and an old chrysoprase mining site.
Prepare a short management report summarising what the consultant’s nextproduct development steps might be.
44