Embed Size (px)
Citation preview
USER GUIDE
Regional Infrastructure Review and Assessment: Decision Making Matrix
| MWH 83502243 | AUGUST 2015
PREPARED FOR REGIONAL DEVELOPMENT AUSTRALIA CENTRAL WEST & CENTRAL NSW COUNCILS
REGIONAL DEVELOPMENT AUSTRALIA CENTRAL WEST & CENTRAL NSW COUNCILS| Decision Making Matrix
December 2014 i
This document has been prepared for the benefit of Central NSW Councils and Regional Development Australia Central West. No liability is accepted by this company or any employee or sub-consultant of this company with respect to its use by any other person.
QUALITY STATEMENT
PROJECT MANAGER PROJECT TECHNICAL LEAD
J Tran E Pryor
PREPARED BY
………………………………............... 9/12/14…… E Pryor
CHECKED BY
………………………………............... 9/12/14…… T Belgrove
REVIEWED BY
………………………………............... 9/12/14…… T Belgrove
APPROVED FOR ISSUE BY
………………………………............... …9/12/14…… E Pryor
SYDNEY
Level 21, 141 Walker Street, North Sydney, NSW 2060
TEL +61 2 9493 9700,
REGIONAL DEVELOPMENT AUSTRALIA CENTRAL WEST & CENTRAL NSW COUNCILS| Decision Making Matrix
December 2014 ii
Contents
1 Introduction 1
1.1 Purpose ........................................................................................................... 1
1.2 Appropriate Use ............................................................................................... 1
2 Decision-Making Framework 2
2.1 Infrastructure Prioritisation .............................................................................. 2
2.2 Basic Setup ..................................................................................................... 4
3 Application 14
3.1 Identifying Candidate Projects .......................................................................14
3.2 Current Water Priorities .................................................................................15
3.3 Lessons Learned ...........................................................................................22
4 Other Guidance 24
4.1 Potential Funding Sources for Water Infrastructure ......................................24
4.2 Assessing Project Readiness ........................................................................25
REGIONAL DEVELOPMENT AUSTRALIA CENTRAL WEST & CENTRAL NSW COUNCILS| Decision Making Matrix
December 2014 iii
List of Tables
Table 1: Information Sources ........................................................................................................ 2
Table 2: Basic Components of the Matrix ..................................................................................... 4
Table 3: Matrix Element Descriptors ............................................................................................. 6
Table 4: Regional Water Priorities .............................................................................................. 15
Table 5: Water Priorities over $10M ............................................................................................ 19
Table 6: Water Priorities between $5M and $10M ...................................................................... 21
Table 7: Lessons Learned in Applying the Matrix ....................................................................... 22
Table 8: Water Infrastructure Potential Funding Sources ........................................................... 24
Table 9: General Project Readiness Guidance (modelled after Infrastructure Australia’s Reform and Investment Framework) ....................................................................................................... 26
List of Figures
Figure 1: Regional Priorities for Water ........................................................................................ 16
Figure 2: Geographic Priorities for Water ................................................................................... 18
REGIONAL DEVELOPMENT AUSTRALIA CENTRAL WEST & CENTRAL NSW COUNCILS| Decision Making Matrix
December 2014 iv
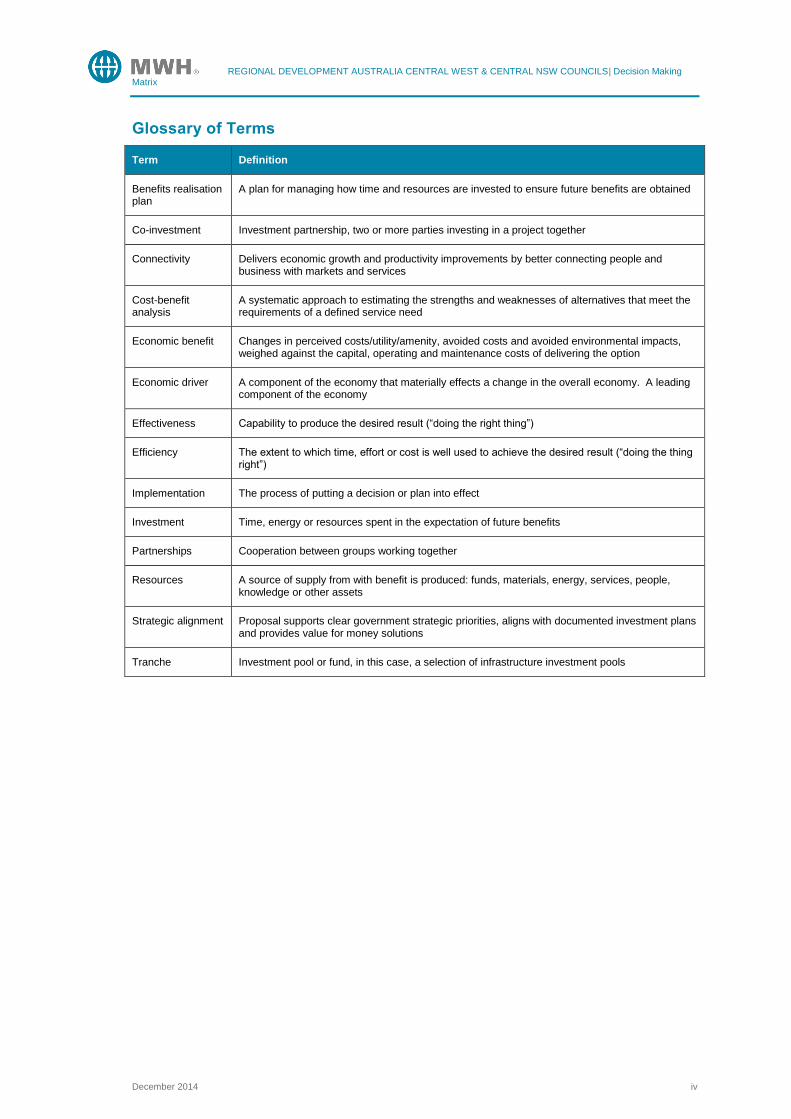
Glossary of Terms
Term Definition
Benefits realisation plan
A plan for managing how time and resources are invested to ensure future benefits are obtained
Co-investment Investment partnership, two or more parties investing in a project together
Connectivity Delivers economic growth and productivity improvements by better connecting people and business with markets and services
Cost-benefit analysis
A systematic approach to estimating the strengths and weaknesses of alternatives that meet the requirements of a defined service need
Economic benefit Changes in perceived costs/utility/amenity, avoided costs and avoided environmental impacts, weighed against the capital, operating and maintenance costs of delivering the option
Economic driver A component of the economy that materially effects a change in the overall economy. A leading component of the economy
Effectiveness Capability to produce the desired result (“doing the right thing”)
Efficiency The extent to which time, effort or cost is well used to achieve the desired result (“doing the thing right”)
Implementation The process of putting a decision or plan into effect
Investment Time, energy or resources spent in the expectation of future benefits
Partnerships Cooperation between groups working together
Resources A source of supply from with benefit is produced: funds, materials, energy, services, people, knowledge or other assets
Strategic alignment Proposal supports clear government strategic priorities, aligns with documented investment plans and provides value for money solutions
Tranche Investment pool or fund, in this case, a selection of infrastructure investment pools

REGIONAL DEVELOPMENT AUSTRALIA CENTRAL WEST & CENTRAL NSW COUNCILS| Decision Making Matrix
December 2014 1
1 Introduction
This document sets out the key elements of a decision-making matrix tool, and guidance on how to use the tool, to assist the councils of Central NSW in prioritising infrastructure. This project has been developed for Centroc and Regional Regional Development Australia Central West.
1.1 Purpose
Having a strategically prioritised regional view of infrastructure investment priorities for the Central NSW region, clearly aligned to the economic imperatives of the region, enables the region to proactively participate in the broader State and Federal infrastructure planning and funding processes in a strategic and targeted manner. This should lead to improved outcomes for each of the levels of government investing in infrastructure and the delivery of the higher priority, economically enabling, projects for the region. A considered view of regional priorities in advance of funding programs from the State and Federal government will allow the local governments of the Central NSW region to be proactive and responsive in developing their submissions to take full advantage of opportunities to attract funding to the region.
The purpose of this document is to describe the components of the decision-making matrix, provide guidance on its use, and to set out the results of its application to the urban water sector for Central NSW Councils.
1.2 Appropriate Use
Importantly, it needs to be recognised that any decision-making matrix is a tool to assist decision-makers, not a decision in and of itself. Like any multi-criteria analysis tool, depending on the weightings applied to prioritisation criteria, or indeed, the relevance of any given set of criteria to a particular funding entity’s interests, will result in different outcomes in terms of priorities. Similarly, priorities will change over time, and hence, the tool will need to be maintained both in terms of criteria incorporated (and hence why it has been built in the readily modifiable MS Excel) and in terms of the project list included.
The point of the tool is to allow decision-makers to rapidly assess and view these different potential outcomes to assist them in the decision-making process.
For this reason, it is appropriate to use the tool to inform decision-making, not to take the outputs of the tool as a strict production of priorities.
It is also for this reason that this document provides guidance to assist decision-makers in utilising the tool and in updating it over time.
It is also important to note that his decision-making matrix collates data from planning and design efforts, it does not generate this data. Whilst, in early planning phases, high level informed estimates of benefits and costs will need to be made, as planning continues, the level of accuracy of the data being utilised to input into the matrix should improve. The tool does not replace the need to do proper assessments to quantify the projects being prioritised. Rather, it forms a place to collate the proper assessment of each project to understand relative priorities.
REGIONAL DEVELOPMENT AUSTRALIA CENTRAL WEST & CENTRAL NSW COUNCILS| Decision Making Matrix
December 2014 2
2 Decision-Making Framework
This section sets out the general background to infrastructure prioritisation at a State and Federal level and how this was integrated into a decision-making framework for Central NSW Councils and Regional Development Australia Central West.
2.1 Infrastructure Prioritisation
The prioritisation of infrastructure needs is becoming increasingly important as governments’ at all three levels face tighter budgets and increasing service demands. In broad terms, ensuring the greatest economic benefit, and benefit to the largest number of people, is achieved for each investment in infrastructure has become central to government planning and support of infrastructure projects.
In this context, Central NSW Councils and RDA Central West intend to undertake a systematic analysis of their infrastructure needs to clearly demonstrate regional priorities. To complete this, a decision-making matrix has been developed, which is intended to capture many of the high level considerations applied by a variety of State and Federal infrastructure assessment approaches.
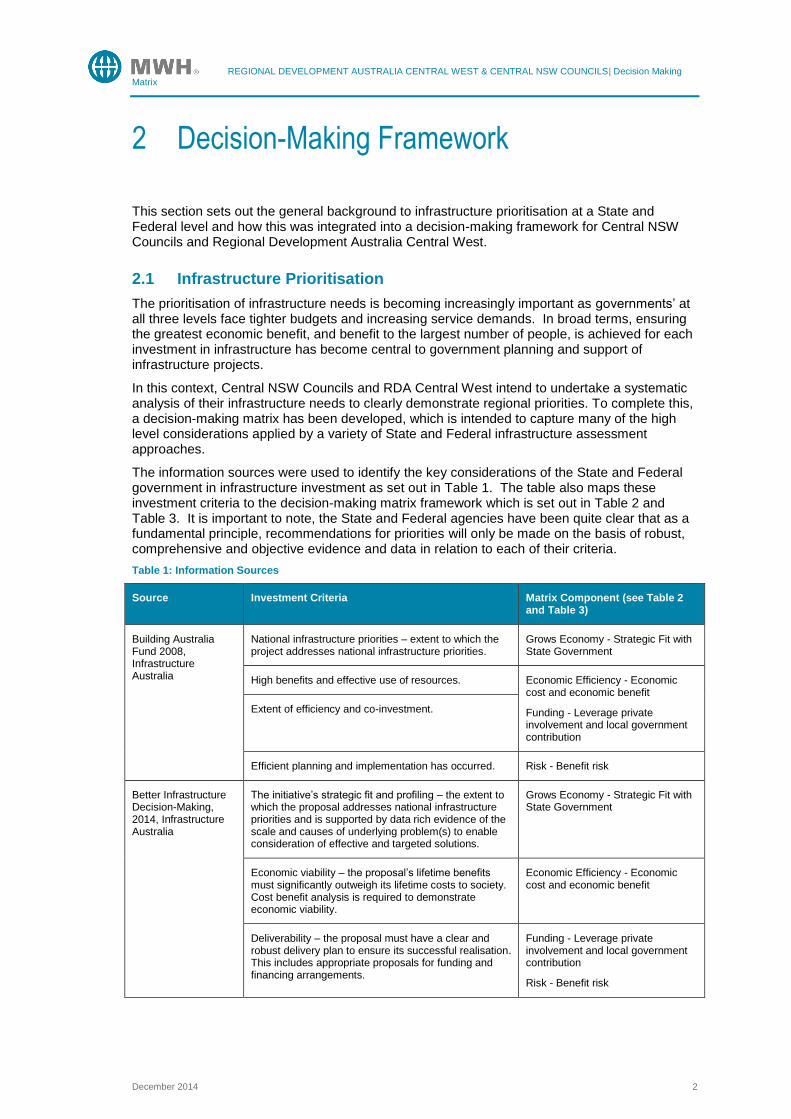
The information sources were used to identify the key considerations of the State and Federal government in infrastructure investment as set out in Table 1. The table also maps these investment criteria to the decision-making matrix framework which is set out in Table 2 and Table 3. It is important to note, the State and Federal agencies have been quite clear that as a fundamental principle, recommendations for priorities will only be made on the basis of robust, comprehensive and objective evidence and data in relation to each of their criteria.
Table 1: Information Sources
Source Investment Criteria Matrix Component (see Table 2 and Table 3)
Building Australia Fund 2008, Infrastructure Australia
National infrastructure priorities – extent to which the project addresses national infrastructure priorities.
Grows Economy - Strategic Fit with State Government
High benefits and effective use of resources. Economic Efficiency - Economic cost and economic benefit
Funding - Leverage private involvement and local government contribution
Extent of efficiency and co-investment.
Efficient planning and implementation has occurred. Risk - Benefit risk
Better Infrastructure Decision-Making, 2014, Infrastructure Australia
The initiative’s strategic fit and profiling – the extent to which the proposal addresses national infrastructure priorities and is supported by data rich evidence of the scale and causes of underlying problem(s) to enable consideration of effective and targeted solutions.
Grows Economy - Strategic Fit with State Government
Economic viability – the proposal’s lifetime benefits must significantly outweigh its lifetime costs to society. Cost benefit analysis is required to demonstrate economic viability.
Economic Efficiency - Economic cost and economic benefit
Deliverability – the proposal must have a clear and robust delivery plan to ensure its successful realisation. This includes appropriate proposals for funding and financing arrangements.
Funding - Leverage private involvement and local government contribution
Risk - Benefit risk
REGIONAL DEVELOPMENT AUSTRALIA CENTRAL WEST & CENTRAL NSW COUNCILS| Decision Making Matrix
December 2014 3
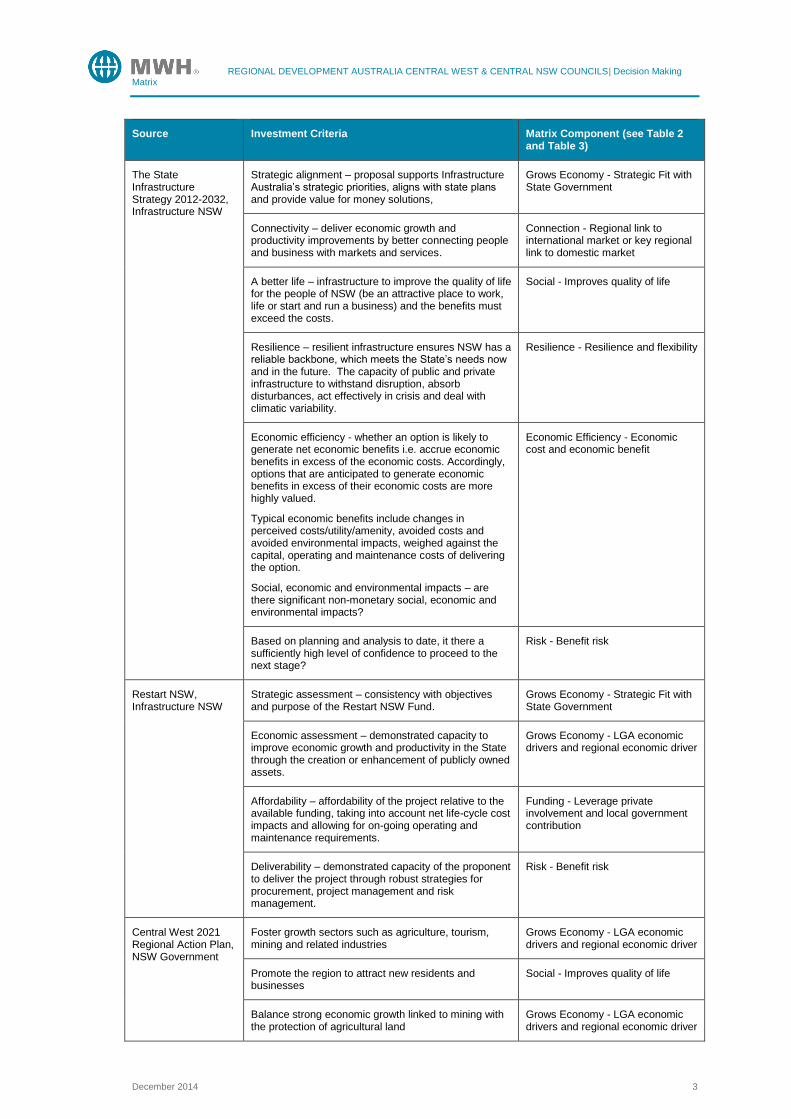
Source Investment Criteria Matrix Component (see Table 2 and Table 3)
The State Infrastructure Strategy 2012-2032, Infrastructure NSW
Strategic alignment – proposal supports Infrastructure Australia’s strategic priorities, aligns with state plans and provide value for money solutions,
Grows Economy - Strategic Fit with State Government
Connectivity – deliver economic growth and productivity improvements by better connecting people and business with markets and services.
Connection - Regional link to international market or key regional link to domestic market
A better life – infrastructure to improve the quality of life for the people of NSW (be an attractive place to work, life or start and run a business) and the benefits must exceed the costs.
Social - Improves quality of life
Resilience – resilient infrastructure ensures NSW has a reliable backbone, which meets the State’s needs now and in the future. The capacity of public and private infrastructure to withstand disruption, absorb disturbances, act effectively in crisis and deal with climatic variability.
Resilience - Resilience and flexibility
Economic efficiency - whether an option is likely to generate net economic benefits i.e. accrue economic benefits in excess of the economic costs. Accordingly, options that are anticipated to generate economic benefits in excess of their economic costs are more highly valued.
Typical economic benefits include changes in perceived costs/utility/amenity, avoided costs and avoided environmental impacts, weighed against the capital, operating and maintenance costs of delivering the option.
Social, economic and environmental impacts – are there significant non-monetary social, economic and environmental impacts?
Economic Efficiency - Economic cost and economic benefit
Based on planning and analysis to date, it there a sufficiently high level of confidence to proceed to the next stage?
Risk - Benefit risk
Restart NSW, Infrastructure NSW
Strategic assessment – consistency with objectives and purpose of the Restart NSW Fund.
Grows Economy - Strategic Fit with State Government
Economic assessment – demonstrated capacity to improve economic growth and productivity in the State through the creation or enhancement of publicly owned assets.
Grows Economy - LGA economic drivers and regional economic driver
Affordability – affordability of the project relative to the available funding, taking into account net life-cycle cost impacts and allowing for on-going operating and maintenance requirements.
Funding - Leverage private involvement and local government contribution
Deliverability – demonstrated capacity of the proponent to deliver the project through robust strategies for procurement, project management and risk management.
Risk - Benefit risk
Central West 2021 Regional Action Plan, NSW Government
Foster growth sectors such as agriculture, tourism, mining and related industries
Grows Economy - LGA economic drivers and regional economic driver
Promote the region to attract new residents and businesses
Social - Improves quality of life
Balance strong economic growth linked to mining with the protection of agricultural land
Grows Economy - LGA economic drivers and regional economic driver

REGIONAL DEVELOPMENT AUSTRALIA CENTRAL WEST & CENTRAL NSW COUNCILS| Decision Making Matrix
December 2014 4
Source Investment Criteria Matrix Component (see Table 2 and Table 3)
Regional Plan, 2013-2016, Regional Development Australia Central West
Facilitate partnerships and support initiatives that aim to improve the overall quality and standard of living across the Central West region.
Funding - Leverage private involvement and local government contribution
Support the development of hard and soft targeted infrastructure projects to meet the needs and opportunities of the Central West region
Grows Economy - LGA economic drivers and regional economic driver
2.2 Basic Setup
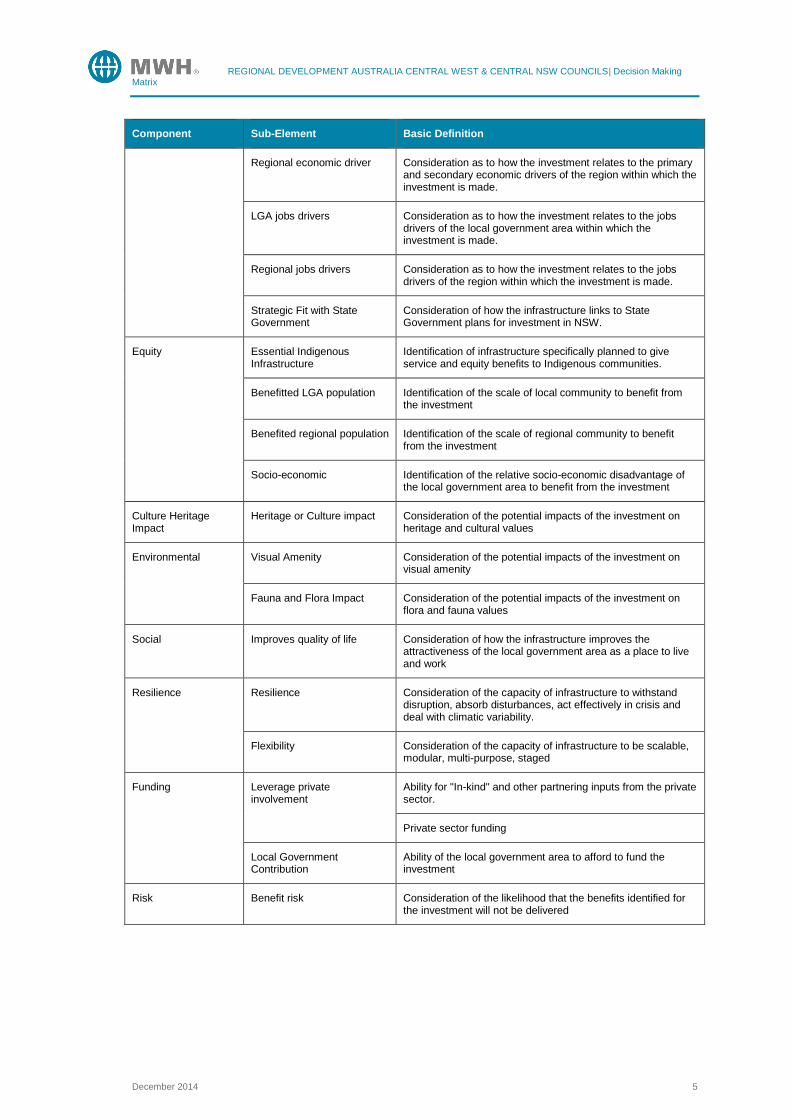
The matrix is essentially a multi-criteria analysis type tool. The basic components of the decision-making matrix tool are set out in Table 2. A full set of descriptors of terms and the rating scales used to define each sub element is set out in Table 3.
Table 2: Basic Components of the Matrix
Component Sub-Element Basic Definition
Project Description Project name Name for investment
Project Description Description of infrastructure
Local Government Area Local government area in which investment will be made
Tranche Central NSW Councils wished to be able to identify and prioritise infrastructure projects across the region in the following key infrastructure tranches:
Tranche 1: Freight, Logistics and Transport
Tranche 2: Water
Tranche 3: Education and Health
Tranche 4: Sporting and Cultural
Tranche 5: Energy
Tranche 6: Communications
Phase The point in the lifecycle of infrastructure investment development that this project presently occupies
Economic Efficiency Economic Cost Capital cost in $2014
Operation and maintenance costs in $2014 as an annualised cost
Economic Benefit Service levels / utility – improvements in service as a result of the investment
Revenue – additional revenue sourced from the investment
Avoided costs – costs avoided as a result of making the investment
Connection Regional link to international market
Ability of the investment to expand the market to which goods or services are provided
Key regional link to domestic market
Grows Economy LGA economic driver Consideration as to how the investment relates to the primary and secondary economic drivers of the local government area within which the investment is made.
REGIONAL DEVELOPMENT AUSTRALIA CENTRAL WEST & CENTRAL NSW COUNCILS| Decision Making Matrix
December 2014 5
Component Sub-Element Basic Definition
Regional economic driver Consideration as to how the investment relates to the primary and secondary economic drivers of the region within which the investment is made.
LGA jobs drivers Consideration as to how the investment relates to the jobs drivers of the local government area within which the investment is made.
Regional jobs drivers Consideration as to how the investment relates to the jobs drivers of the region within which the investment is made.
Strategic Fit with State Government
Consideration of how the infrastructure links to State Government plans for investment in NSW.
Equity Essential Indigenous Infrastructure
Identification of infrastructure specifically planned to give service and equity benefits to Indigenous communities.
Benefitted LGA population Identification of the scale of local community to benefit from the investment
Benefited regional population Identification of the scale of regional community to benefit from the investment
Socio-economic Identification of the relative socio-economic disadvantage of the local government area to benefit from the investment
Culture Heritage Impact
Heritage or Culture impact Consideration of the potential impacts of the investment on heritage and cultural values
Environmental Visual Amenity Consideration of the potential impacts of the investment on visual amenity
Fauna and Flora Impact Consideration of the potential impacts of the investment on flora and fauna values
Social Improves quality of life Consideration of how the infrastructure improves the attractiveness of the local government area as a place to live and work
Resilience Resilience Consideration of the capacity of infrastructure to withstand disruption, absorb disturbances, act effectively in crisis and deal with climatic variability.
Flexibility Consideration of the capacity of infrastructure to be scalable, modular, multi-purpose, staged
Funding Leverage private involvement
Ability for "In-kind" and other partnering inputs from the private sector.
Private sector funding
Local Government Contribution
Ability of the local government area to afford to fund the investment
Risk Benefit risk Consideration of the likelihood that the benefits identified for the investment will not be delivered
REGIONAL DEVELOPMENT AUSTRALIA CENTRAL WEST & CENTRAL NSW COUNCILS| Decision Making Matrix
December 2014 6
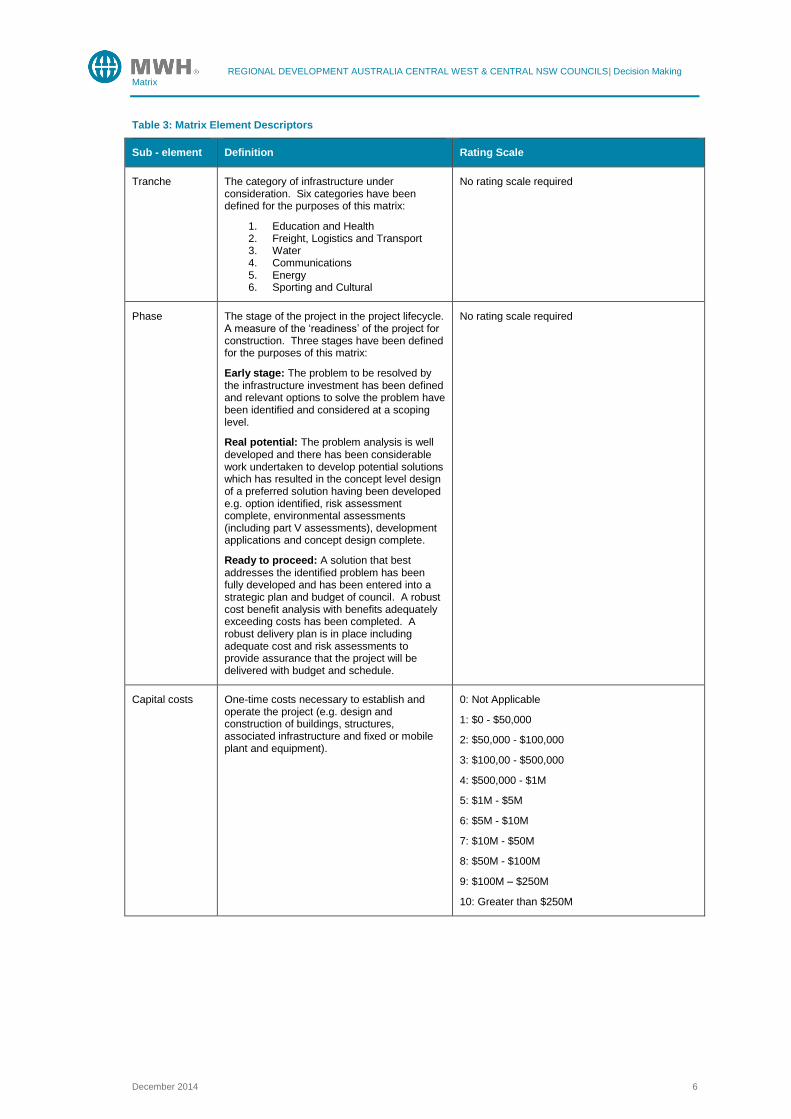
Table 3: Matrix Element Descriptors
Sub - element Definition Rating Scale
Tranche The category of infrastructure under consideration. Six categories have been defined for the purposes of this matrix:
1. Education and Health 2. Freight, Logistics and Transport 3. Water 4. Communications 5. Energy 6. Sporting and Cultural
No rating scale required
Phase The stage of the project in the project lifecycle. A measure of the ‘readiness’ of the project for construction. Three stages have been defined for the purposes of this matrix:
Early stage: The problem to be resolved by the infrastructure investment has been defined and relevant options to solve the problem have been identified and considered at a scoping level.
Real potential: The problem analysis is well developed and there has been considerable work undertaken to develop potential solutions which has resulted in the concept level design of a preferred solution having been developed e.g. option identified, risk assessment complete, environmental assessments (including part V assessments), development applications and concept design complete.
Ready to proceed: A solution that best addresses the identified problem has been fully developed and has been entered into a strategic plan and budget of council. A robust cost benefit analysis with benefits adequately exceeding costs has been completed. A robust delivery plan is in place including adequate cost and risk assessments to provide assurance that the project will be delivered with budget and schedule.
No rating scale required
Capital costs One-time costs necessary to establish and operate the project (e.g. design and construction of buildings, structures, associated infrastructure and fixed or mobile plant and equipment).
0: Not Applicable
1: $0 - $50,000
2: $50,000 - $100,000
3: $100,00 - $500,000
4: $500,000 - $1M
5: $1M - $5M
6: $5M - $10M
7: $10M - $50M
8: $50M - $100M
9: $100M – $250M
10: Greater than $250M

REGIONAL DEVELOPMENT AUSTRALIA CENTRAL WEST & CENTRAL NSW COUNCILS| Decision Making Matrix
December 2014 7
Sub - element Definition Rating Scale
Operations and maintenance costs
Ongoing project expenditure over the life of the project brought into an annualised cost today (e.g. operating expenditure, maintenance costs, decommission costs, depreciation)
0: Not Applicable
1: $0 - $20,000
2: $20,000 - $50,000
3: $50,000 - $100,000
4: $100,000 - $250,000
5: $250,000 - $500,000
6: $500,000 - $750,000
7: $750,000 - $1M
8: $1M - $5M
9: $5M - $10M
10: Greater than $10M
Service levels / Utility
Defined service quality for a particular activity. The service levels or performance measures are usually related to the following areas: quality, safety, reliability/responsiveness, sustainability and accessibility.
See below
Quality Describes the standard to which the project is provided e.g. is the project “fit for purpose" for the community.
0: Not Applicable
1 -2: Once-off improvement to effectiveness and efficiency of functions of services delivered
3 - 4: Effectiveness and efficiency of functions of services delivered are enhanced (State wide level)
5 - 6: Effectiveness and efficiency of major functions of services delivered are enhanced (Regional level)
7 - 8: Effectiveness and efficiency of functions of services delivered are enhanced (State wide level)
9 - 10: Effectiveness and efficiency of major functions of services delivered are enhanced (State wide level)
Safety Relates to the risks created by provision of the project and the degree to which these are mitigated e.g. the project reduces the hazard to the community
0: Not Applicable
1 - 2: Minimal opportunity for improvement relating to safety of the services delivered
3 - 4: Minor improvement relating to safety of the services delivered
5 – 6: Moderate improvement relating to safety of the services delivered
7 – 8: Major improvement relating to safety of the services delivered
9 – 10: Exceptional improvement relating to safety of the services delivered
REGIONAL DEVELOPMENT AUSTRALIA CENTRAL WEST & CENTRAL NSW COUNCILS| Decision Making Matrix
December 2014 8
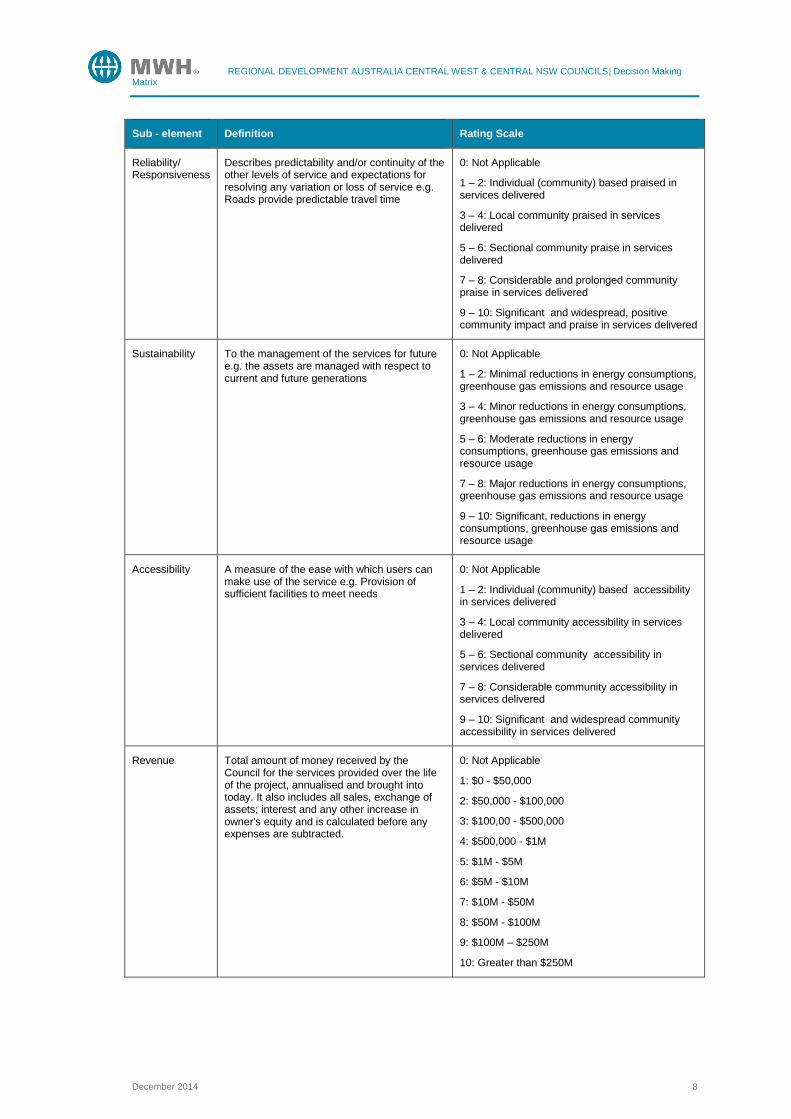
Sub - element Definition Rating Scale
Reliability/ Responsiveness
Describes predictability and/or continuity of the other levels of service and expectations for resolving any variation or loss of service e.g. Roads provide predictable travel time
0: Not Applicable
1 – 2: Individual (community) based praised in services delivered
3 – 4: Local community praised in services delivered
5 – 6: Sectional community praise in services delivered
7 – 8: Considerable and prolonged community praise in services delivered
9 – 10: Significant and widespread, positive community impact and praise in services delivered
Sustainability To the management of the services for future e.g. the assets are managed with respect to current and future generations
0: Not Applicable
1 – 2: Minimal reductions in energy consumptions, greenhouse gas emissions and resource usage
3 – 4: Minor reductions in energy consumptions, greenhouse gas emissions and resource usage
5 – 6: Moderate reductions in energy consumptions, greenhouse gas emissions and resource usage
7 – 8: Major reductions in energy consumptions, greenhouse gas emissions and resource usage
9 – 10: Significant, reductions in energy consumptions, greenhouse gas emissions and resource usage
Accessibility A measure of the ease with which users can make use of the service e.g. Provision of sufficient facilities to meet needs
0: Not Applicable
1 – 2: Individual (community) based accessibility in services delivered
3 – 4: Local community accessibility in services delivered
5 – 6: Sectional community accessibility in services delivered
7 – 8: Considerable community accessibility in services delivered
9 – 10: Significant and widespread community accessibility in services delivered
Revenue Total amount of money received by the Council for the services provided over the life of the project, annualised and brought into today. It also includes all sales, exchange of assets; interest and any other increase in owner's equity and is calculated before any expenses are subtracted.
0: Not Applicable
1: $0 - $50,000
2: $50,000 - $100,000
3: $100,00 - $500,000
4: $500,000 - $1M
5: $1M - $5M
6: $5M - $10M
7: $10M - $50M
8: $50M - $100M
9: $100M – $250M
10: Greater than $250M

REGIONAL DEVELOPMENT AUSTRALIA CENTRAL WEST & CENTRAL NSW COUNCILS| Decision Making Matrix
December 2014 9
Sub - element Definition Rating Scale
Avoided costs An action that prevents future spending e.g. Preventative maintenance for an asset which would prevent or delay the need for a costly asset refurbishment or replacement.
0: Not Applicable
1 - 2: Conservative Savings - < 1% of total project cost
3 - 4: Moderate Savings - 1% to 3 % of total project cost
5 - 6: Balanced Savings - 3% - 5% of total project cost
7 - 8: Savings - 5% to 10% of total project cost
9 -10 Aggressive Savings - 10% of total project cost
Connection Links to markets. Two types of links were defined for the purposes of this matrix:
Regional link to international market: helps to meet international demand for Australian products and exports in a timely and efficient way.
Key regional link to domestic market: boosts regional communities’ access to economic opportunities and drive growth and productivity.
0: Not Applicable
1: No
2: Yes
Economic drivers
Infrastructure directly contributes to enabling sectors driving gross regional product. For the purposes of this matrix, the top five drivers in each LGA have been considered. The addition of these drivers was used to determine the top five drivers for the region as a whole.
Automatically calculated based on the RDA 2012 assessment of each LGAs top five economic drivers.
Jobs drivers Infrastructure (over the project lifecycle) directly contributes to enabling sectors driving jobs in the economy. For the purposes of this matrix, the top five drivers in each LGA have been considered. The addition of these drivers was used to determine the top five drivers for the region as a whole.
Automatically calculated based on the RDA 2012 assessment of each LGAs top five jobs drivers.
Strategic Fit with State Government
The infrastructure has been identified by the State Government in a strategic plan for NSW. The right infrastructure in the right places, not only boosting productivity and competitiveness, but makes a difference to people's quality of life.
0: Not Applicable
1: No
2: Yes
Essential Indigenous infrastructure
Infrastructure provides for equity concerns in relation to Indigenous communities and ensures service provision.
0: Not Applicable
1: No
2: Yes
Benefitted LGA population
Potential LGA population benefitted 0: Not Applicable
1 -2: 5% -10% of LGA population benefitted
3 - 4: 10% - 15% of LGA population benefitted
5 - 7: 15% - 25% of LGA population benefitted
8 - 9: 25% - 35% of LGA population benefitted
10: Greater than 35% of LGA population benefitted
REGIONAL DEVELOPMENT AUSTRALIA CENTRAL WEST & CENTRAL NSW COUNCILS| Decision Making Matrix
December 2014 10
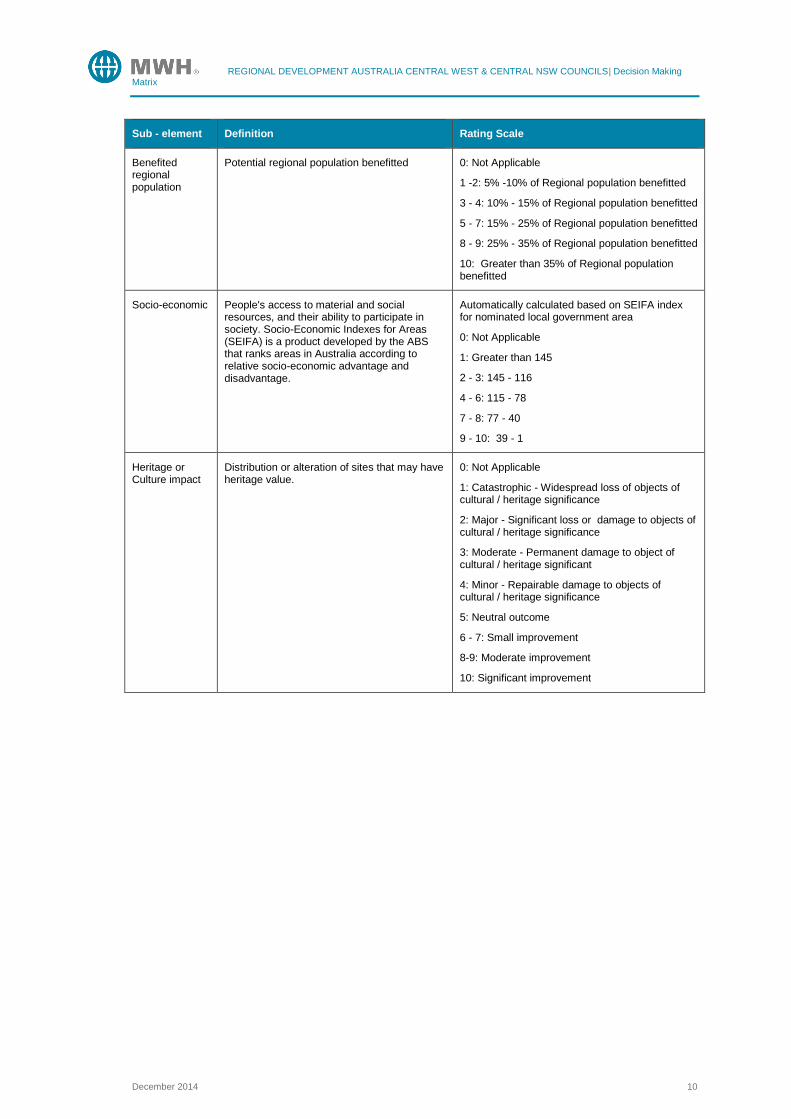
Sub - element Definition Rating Scale
Benefited regional population
Potential regional population benefitted 0: Not Applicable
1 -2: 5% -10% of Regional population benefitted
3 - 4: 10% - 15% of Regional population benefitted
5 - 7: 15% - 25% of Regional population benefitted
8 - 9: 25% - 35% of Regional population benefitted
10: Greater than 35% of Regional population benefitted
Socio-economic People's access to material and social resources, and their ability to participate in society. Socio-Economic Indexes for Areas (SEIFA) is a product developed by the ABS that ranks areas in Australia according to relative socio-economic advantage and disadvantage.
Automatically calculated based on SEIFA index for nominated local government area
0: Not Applicable
1: Greater than 145
2 - 3: 145 - 116
4 - 6: 115 - 78
7 - 8: 77 - 40
9 - 10: 39 - 1
Heritage or Culture impact
Distribution or alteration of sites that may have heritage value.
0: Not Applicable
1: Catastrophic - Widespread loss of objects of cultural / heritage significance
2: Major - Significant loss or damage to objects of cultural / heritage significance
3: Moderate - Permanent damage to object of cultural / heritage significant
4: Minor - Repairable damage to objects of cultural / heritage significance
5: Neutral outcome
6 - 7: Small improvement
8-9: Moderate improvement
10: Significant improvement
REGIONAL DEVELOPMENT AUSTRALIA CENTRAL WEST & CENTRAL NSW COUNCILS| Decision Making Matrix
December 2014 11
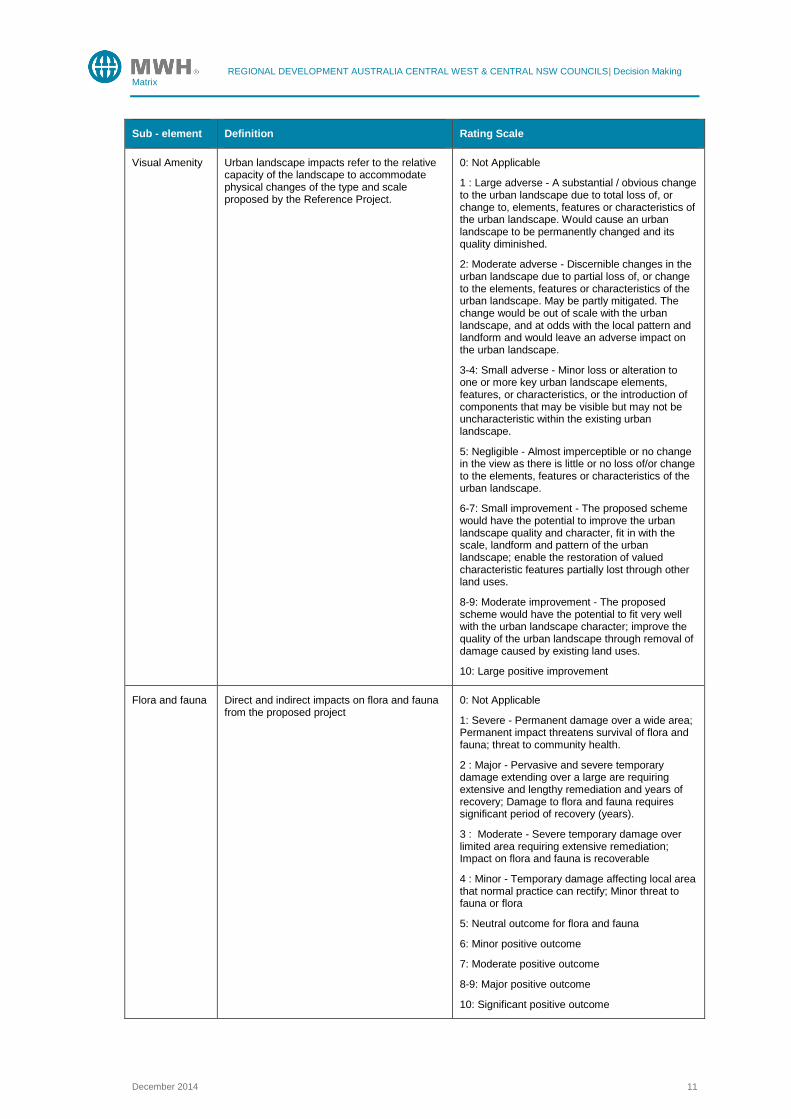
Sub - element Definition Rating Scale
Visual Amenity Urban landscape impacts refer to the relative capacity of the landscape to accommodate physical changes of the type and scale proposed by the Reference Project.
0: Not Applicable
1 : Large adverse - A substantial / obvious change to the urban landscape due to total loss of, or change to, elements, features or characteristics of the urban landscape. Would cause an urban landscape to be permanently changed and its quality diminished.
2: Moderate adverse - Discernible changes in the urban landscape due to partial loss of, or change to the elements, features or characteristics of the urban landscape. May be partly mitigated. The change would be out of scale with the urban landscape, and at odds with the local pattern and landform and would leave an adverse impact on the urban landscape.
3-4: Small adverse - Minor loss or alteration to one or more key urban landscape elements, features, or characteristics, or the introduction of components that may be visible but may not be uncharacteristic within the existing urban landscape.
5: Negligible - Almost imperceptible or no change in the view as there is little or no loss of/or change to the elements, features or characteristics of the urban landscape.
6-7: Small improvement - The proposed scheme would have the potential to improve the urban landscape quality and character, fit in with the scale, landform and pattern of the urban landscape; enable the restoration of valued characteristic features partially lost through other land uses.
8-9: Moderate improvement - The proposed scheme would have the potential to fit very well with the urban landscape character; improve the quality of the urban landscape through removal of damage caused by existing land uses.
10: Large positive improvement
Flora and fauna Direct and indirect impacts on flora and fauna from the proposed project
0: Not Applicable
1: Severe - Permanent damage over a wide area; Permanent impact threatens survival of flora and fauna; threat to community health.
2 : Major - Pervasive and severe temporary damage extending over a large are requiring extensive and lengthy remediation and years of recovery; Damage to flora and fauna requires significant period of recovery (years).
3 : Moderate - Severe temporary damage over limited area requiring extensive remediation; Impact on flora and fauna is recoverable
4 : Minor - Temporary damage affecting local area that normal practice can rectify; Minor threat to fauna or flora
5: Neutral outcome for flora and fauna
6: Minor positive outcome
7: Moderate positive outcome
8-9: Major positive outcome
10: Significant positive outcome
REGIONAL DEVELOPMENT AUSTRALIA CENTRAL WEST & CENTRAL NSW COUNCILS| Decision Making Matrix
December 2014 12
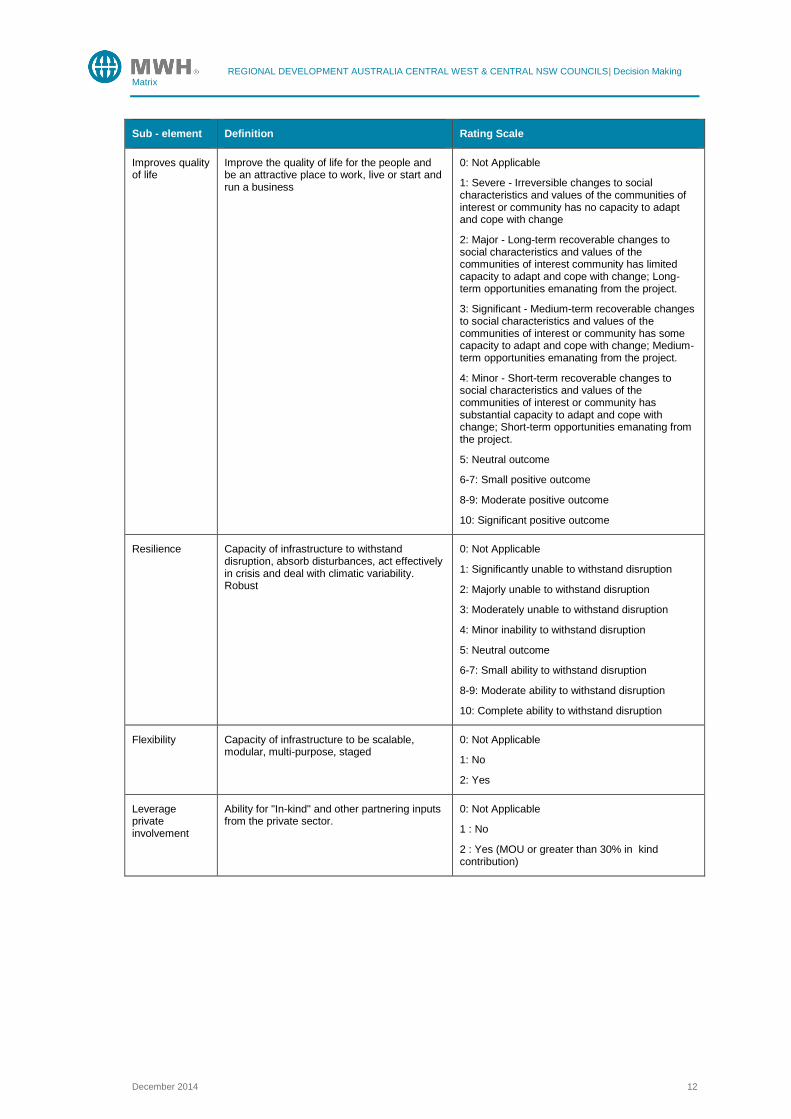
Sub - element Definition Rating Scale
Improves quality of life
Improve the quality of life for the people and be an attractive place to work, live or start and run a business
0: Not Applicable
1: Severe - Irreversible changes to social characteristics and values of the communities of interest or community has no capacity to adapt and cope with change
2: Major - Long-term recoverable changes to social characteristics and values of the communities of interest community has limited capacity to adapt and cope with change; Long-term opportunities emanating from the project.
3: Significant - Medium-term recoverable changes to social characteristics and values of the communities of interest or community has some capacity to adapt and cope with change; Medium-term opportunities emanating from the project.
4: Minor - Short-term recoverable changes to social characteristics and values of the communities of interest or community has substantial capacity to adapt and cope with change; Short-term opportunities emanating from the project.
5: Neutral outcome
6-7: Small positive outcome
8-9: Moderate positive outcome
10: Significant positive outcome
Resilience Capacity of infrastructure to withstand disruption, absorb disturbances, act effectively in crisis and deal with climatic variability. Robust
0: Not Applicable
1: Significantly unable to withstand disruption
2: Majorly unable to withstand disruption
3: Moderately unable to withstand disruption
4: Minor inability to withstand disruption
5: Neutral outcome
6-7: Small ability to withstand disruption
8-9: Moderate ability to withstand disruption
10: Complete ability to withstand disruption
Flexibility Capacity of infrastructure to be scalable, modular, multi-purpose, staged
0: Not Applicable
1: No
2: Yes
Leverage private involvement
Ability for "In-kind" and other partnering inputs from the private sector.
0: Not Applicable
1 : No
2 : Yes (MOU or greater than 30% in kind contribution)
REGIONAL DEVELOPMENT AUSTRALIA CENTRAL WEST & CENTRAL NSW COUNCILS| Decision Making Matrix
December 2014 13
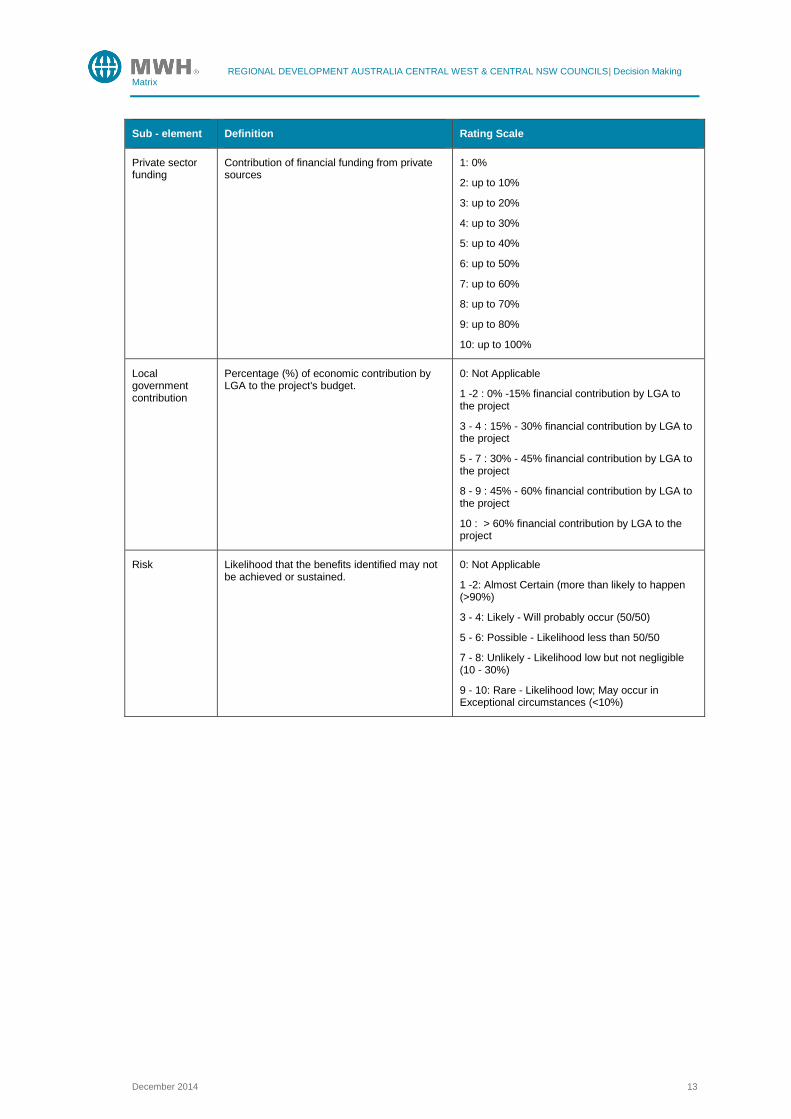
Sub - element Definition Rating Scale
Private sector funding
Contribution of financial funding from private sources
1: 0%
2: up to 10%
3: up to 20%
4: up to 30%
5: up to 40%
6: up to 50%
7: up to 60%
8: up to 70%
9: up to 80%
10: up to 100%
Local government contribution
Percentage (%) of economic contribution by LGA to the project's budget.
0: Not Applicable
1 -2 : 0% -15% financial contribution by LGA to the project
3 - 4 : 15% - 30% financial contribution by LGA to the project
5 - 7 : 30% - 45% financial contribution by LGA to the project
8 - 9 : 45% - 60% financial contribution by LGA to the project
10 : > 60% financial contribution by LGA to the project
Risk Likelihood that the benefits identified may not be achieved or sustained.
0: Not Applicable
1 -2: Almost Certain (more than likely to happen (>90%)
3 - 4: Likely - Will probably occur (50/50)
5 - 6: Possible - Likelihood less than 50/50
7 - 8: Unlikely - Likelihood low but not negligible (10 - 30%)
9 - 10: Rare - Likelihood low; May occur in Exceptional circumstances (<10%)

REGIONAL DEVELOPMENT AUSTRALIA CENTRAL WEST & CENTRAL NSW COUNCILS| Decision Making Matrix
December 2014 14
3 Application
This section of the document discusses how the matrix was populated for the water tranche, the infrastructure priorities identified as a result and the lessons learned in applying the matrix.
3.1 Identifying Candidate Projects
Existing water infrastructure strategic investment documents from across the region and each local government were collated and reviewed to identify candidate water tranche infrastructure projects. In general, this information sources included:
Strategic business plans for water supply and sewerage
Asset management plans for water supply, sewerage and stormwater
Demand and drought management plans
Local government stormwater management plans
Local government corporate plans
Catchment action plans
Regional Development Australia and Central West Strategic Plans
Specific feasibility, concept or detailed designs are available, including any business case materials and grant application documents supporting the investment decision
Centroc Water Security Study
CTW dam investigation study from 2013
Much of the information collated from these sources contained high level project information such as:
A general project description
A general description of the purpose of the investment
Broad sizing of infrastructure
Capital costs and operating costs
The best sources of information were the recently completed businesses cases for investment. Other strategic level documents did not necessarily cover all aspects of the candidate projects to complete the matrix assessment process. Similarly, as plans evolve over time, it was necessary to ensure all information about candidate investment projects was current.
Building on the information collated for each of the candidate projects, a series of virtual focus group sessions were held across the region to review the list of candidate projects identified. One focus group meeting was held per council in order to assess the projects using professional judgement to complete the matrix assessment of the candidate investment projects. This process was also used to confirm the currency of investment proposals so that only those that are still under contemplation are included in the matrix.
It is also important to note that, as there is a wide-spectrum of water tranche projects across the region, and the assessment was to identify priorities, working with Councils, only the top 10 (or less, as determined by council) projects for each council were considered for assessment. Councils were also asked to consider primarily priorities over the next five years or so to provide a clear view of current priorities.
A number of Councils identified renewal type projects which, in the main, are not available for grant funding opportunities. These have been included in the list, but should be considered in the light of funding opportunities.

REGIONAL DEVELOPMENT AUSTRALIA CENTRAL WEST & CENTRAL NSW COUNCILS| Decision Making Matrix
December 2014 15
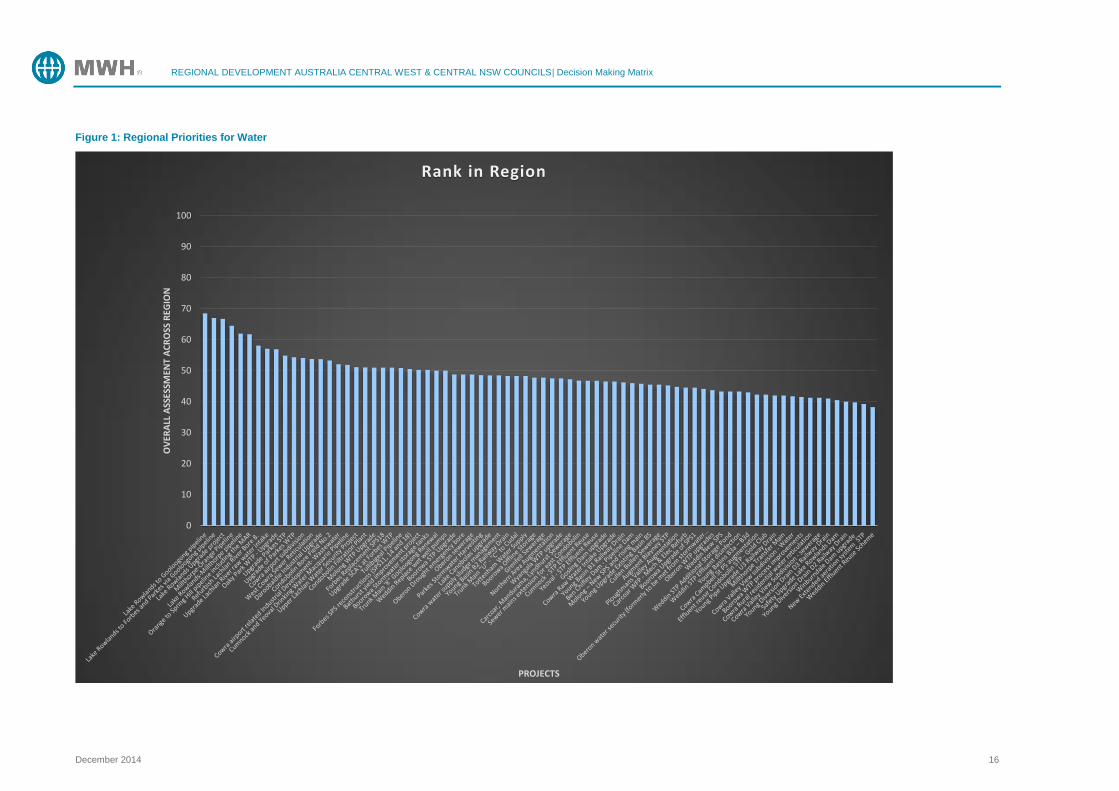
3.2 Current Water Priorities
Based on the process discussed in Section 3.1, a view of the priorities for the Centroc region for water is set out in Table 4. This view assumes each of the councils and each of the components of the matrix are equally weighted. The tool can be used to examine alternative weightings which would lead to different lists of priorities.
Table 4: Regional Water Priorities
Project Description Utility1 Potential
Funding Source
Work Required to Justify
Lake Rowlands to Gooloogong pipeline
The construction of a pipeline network to transfer water from increased storage across the region was a major feature of the recommended region-wide strategy in the Centroc Water Security Study, as well as recommending the augmentation of Lake Rowlands from 4,500ML to 26,500ML. 75km of 375mm diameter pipeline.
Central Tablelands Water
Not identified
Cost-benefit analysis
Lake Rowlands to Forbes Pipeline via Gooloogong (including connection to Parkes)
The construction of a pipeline network to transfer water from increased storage across the region was a major feature of the recommended region-wide strategy in the Centroc Water Security Study, as well as recommending the augmentation of Lake Rowlands from 4,500ML to 26,500ML. 50km of 150mm diameter pipeline.
Parkes
Forbes
Not identified
Cost-benefit analysis
Lake Rowlands Upgrade
The augmentation of Lake Rowlands (or an alternative such as equivalent function from Carcoar Dam) from 4,500 ML to 26,500ML as per the Centroc Water Security Study
Central Tablelands Water
Restart NSW
Cost-benefit analysis
Millthorpe-Orange Pipeline
The construction of a pipeline network to transfer water from increased storage across the region was a major feature of the recommended region-wide strategy in the Centroc Water Security Study, as well as recommending the augmentation of Lake Rowlands from 4,500ML to 26,500ML. 21km of 600mm diameter pipeline.
Central Tablelands Water
Not identified
Cost-benefit analysis
Lake Rowlands-Millthorpe pipeline
The construction of a pipeline network to transfer water from increased storage across the region was a major feature of the recommended region-wide strategy in the Centroc Water Security Study, as well as recommending the augmentation of Lake Rowlands from 4,500ML to 26,500ML. 36km of 500mm diameter pipeline.
Central Tablelands Water
Not identified
Cost-benefit analysis
Orange to Spring Hill pipeline
Orange to Spring Hill pipeline including the managed aquifer storage and recovery (MAR)
Orange Not identified
Cost-benefit analysis
This is also illustrated in Figure 1.
1 Utility is defined for the purposes of this report as the entity receiving raw water services.
REGIONAL DEVELOPMENT AUSTRALIA CENTRAL WEST & CENTRAL NSW COUNCILS| Decision Making Matrix
December 2014 16
Figure 1: Regional Priorities for Water
0
10
20
30
40
50
60
70
80
90
100
OV
ERA
LL A
SSES
SMEN
T A
CR
OSS
REG
ION
PROJECTS
Rank in Region

REGIONAL DEVELOPMENT AUSTRALIA CENTRAL WEST & CENTRAL NSW COUNCILS| Decision Making Matrix
December 2014 17
3.2.1 Geographic Priorities
Based on the process discussed in Section 3.1, a view of the priorities for each local government area for water is set out in Figure 2. This view assumes each of the councils and each of the components of the matrix are equally weighted. The tool can be used to examine alternative weightings which would lead to different lists of priorities.
This is also illustrated in Figure 2.

REGIONAL DEVELOPMENT AUSTRALIA CENTRAL WEST & CENTRAL NSW COUNCILS| Decision Making Matrix
December 2014 18
Figure 2: Geographic Priorities for Water
0
10
20
30
40
50
60
70
80
90
100
110
120
OV
ERA
LL A
SSES
SMEN
T A
CR
OSS
REG
ION
PROJECTS
Rank in LGA
REGIONAL DEVELOPMENT AUSTRALIA CENTRAL WEST & CENTRAL NSW COUNCILS| Decision Making Matrix
December 2014 19
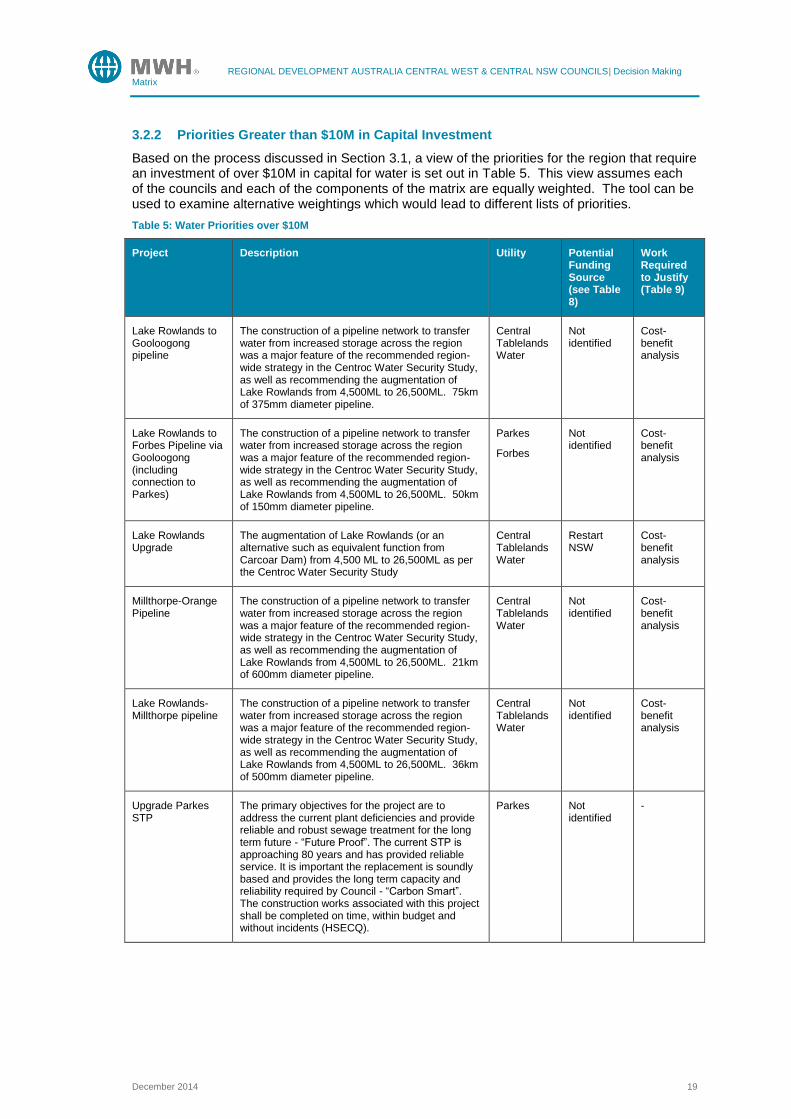
3.2.2 Priorities Greater than $10M in Capital Investment
Based on the process discussed in Section 3.1, a view of the priorities for the region that require an investment of over $10M in capital for water is set out in Table 5. This view assumes each of the councils and each of the components of the matrix are equally weighted. The tool can be used to examine alternative weightings which would lead to different lists of priorities.
Table 5: Water Priorities over $10M
Project Description Utility Potential Funding Source (see Table 8)
Work Required to Justify (Table 9)
Lake Rowlands to Gooloogong pipeline
The construction of a pipeline network to transfer water from increased storage across the region was a major feature of the recommended region-wide strategy in the Centroc Water Security Study, as well as recommending the augmentation of Lake Rowlands from 4,500ML to 26,500ML. 75km of 375mm diameter pipeline.
Central Tablelands Water
Not identified
Cost-benefit analysis
Lake Rowlands to Forbes Pipeline via Gooloogong (including connection to Parkes)
The construction of a pipeline network to transfer water from increased storage across the region was a major feature of the recommended region-wide strategy in the Centroc Water Security Study, as well as recommending the augmentation of Lake Rowlands from 4,500ML to 26,500ML. 50km of 150mm diameter pipeline.
Parkes
Forbes
Not identified
Cost-benefit analysis
Lake Rowlands Upgrade
The augmentation of Lake Rowlands (or an alternative such as equivalent function from Carcoar Dam) from 4,500 ML to 26,500ML as per the Centroc Water Security Study
Central Tablelands Water
Restart NSW
Cost-benefit analysis
Millthorpe-Orange Pipeline
The construction of a pipeline network to transfer water from increased storage across the region was a major feature of the recommended region-wide strategy in the Centroc Water Security Study, as well as recommending the augmentation of Lake Rowlands from 4,500ML to 26,500ML. 21km of 600mm diameter pipeline.
Central Tablelands Water
Not identified
Cost-benefit analysis
Lake Rowlands-Millthorpe pipeline
The construction of a pipeline network to transfer water from increased storage across the region was a major feature of the recommended region-wide strategy in the Centroc Water Security Study, as well as recommending the augmentation of Lake Rowlands from 4,500ML to 26,500ML. 36km of 500mm diameter pipeline.
Central Tablelands Water
Not identified
Cost-benefit analysis
Upgrade Parkes STP
The primary objectives for the project are to address the current plant deficiencies and provide reliable and robust sewage treatment for the long term future - “Future Proof”. The current STP is approaching 80 years and has provided reliable service. It is important the replacement is soundly based and provides the long term capacity and reliability required by Council - “Carbon Smart”. The construction works associated with this project shall be completed on time, within budget and without incidents (HSECQ).
Parkes Not identified
-

REGIONAL DEVELOPMENT AUSTRALIA CENTRAL WEST & CENTRAL NSW COUNCILS| Decision Making Matrix
December 2014 20
Project Description Utility Potential Funding Source (see Table 8)
Work Required to Justify (Table 9)
Upgrade Parkes WTP
The existing Parkes Water Treatment Plant (WTP) servicing the Parkes / Peak Hill water supply has insufficient capacity to supply the required quantity and quality of potable water to meet the projected demand of Parkes and Peak Hill urban areas. The existing works have reached end of their economic life. Further, there is insufficient space on the existing site to construct a new WTP.
Parkes Not identified
-
Condobolin borefield #2
he development of three (3) production bores with associated pipeline and electrical equipment to provide a reliable water supply source to Condobolin township to complement the existing town water supply from Goobang Creek.
Lachlan Not identified
Cost-benefit analysis
Bathurst Yield Improvement Project
Likely that as a result of the new NOW guidelines on secure yield for towns Bathurst will have an as yet unquantified security gap
Bathurst Not identified
Yield study
Parkes Stormwater Harvesting
The stormwater harvesting and reuse project consists of: a 13km long ring main distribution system and associated pumps around Parkes township. The 13km long ring main consists of a 10.7km long 200mm dia. PE Pipe and 2.3km long 300mm dia.; a 200ML holding pond and retrofitting the current storages to perform as wetlands around the Parkes township to trap, store and treat stormwater runoff; an alterative green energy source for pumps operation in order to reduce the carbon emission; construction of 8 trash-rack units to effectively reduce the gross pollutants and suspended solids; an automatic filter system will be installed in the pump(s) discharge pipework to capture the particles greater than 200 micron; and the constructed wetlands would be designed to capture and treat stormwater runoff. A small pump will be used to convey the stormwater for irrigation of the local parks and gardens with any excess flows directed into the ring main.
Parkes Not identified
-
Boorowa Offline Storage
This option involves the construction of a new storage facility near the existing weir and water treatment plant to minimise transfer distances.
Boorowa Not identified
Concept design
Northern Area Augmentation
Provision of urban water services to a new 7,000 home development and light industrial and manufacturing area which is likely to be of regional economic significance. A new clear water reservoir and associated trunk mains
Orange Not identified
Concept design
Ben Chifley Dam - Pipeline Dam
A new pipeline to provide the town water supply to the treatment plant via pipe rather than run of river to provide water efficiency savings
Bathurst Not identified
Cost-benefit analysis
Winburndale Dam upgrade
Upgrade of the outlets or raising of the walls at the flanks of the dam or providing rock tension anchors similar to those that are at Chifley Dam, so this is about making sure that in that one in 100,000 year maximum flood event that the dam is safe and will withstand such an occurrence
Bathurst Not identified
-
REGIONAL DEVELOPMENT AUSTRALIA CENTRAL WEST & CENTRAL NSW COUNCILS| Decision Making Matrix
December 2014 21
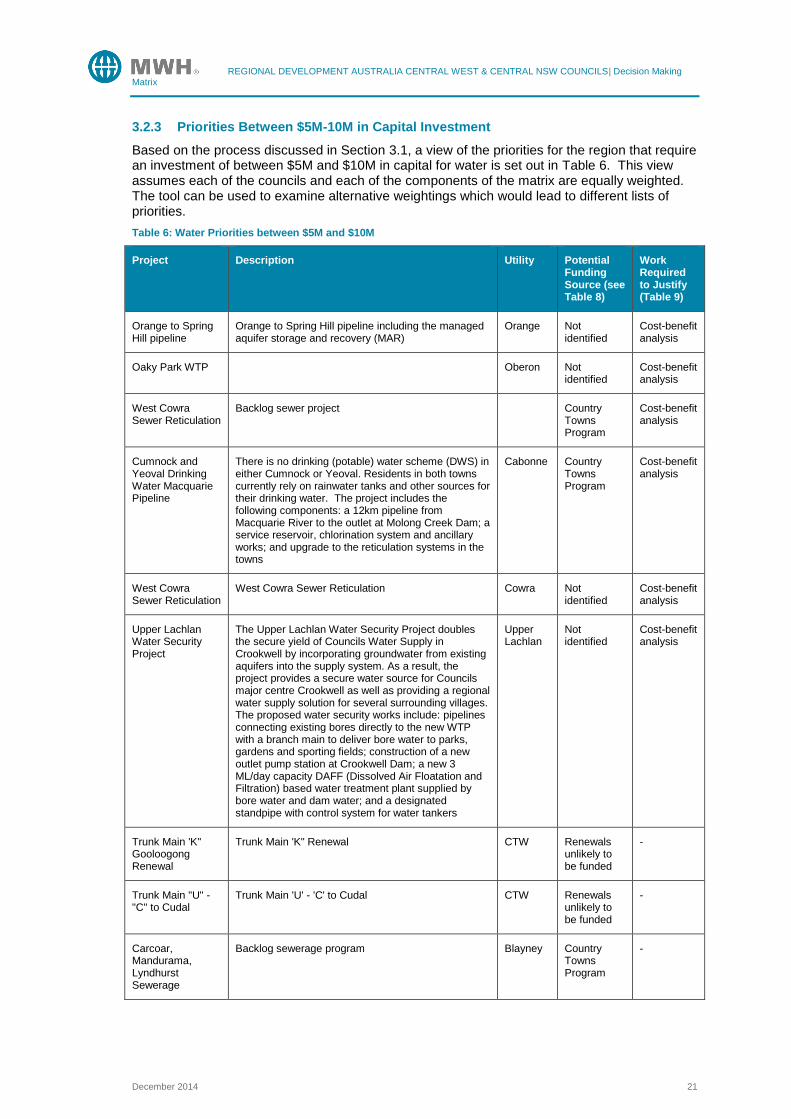
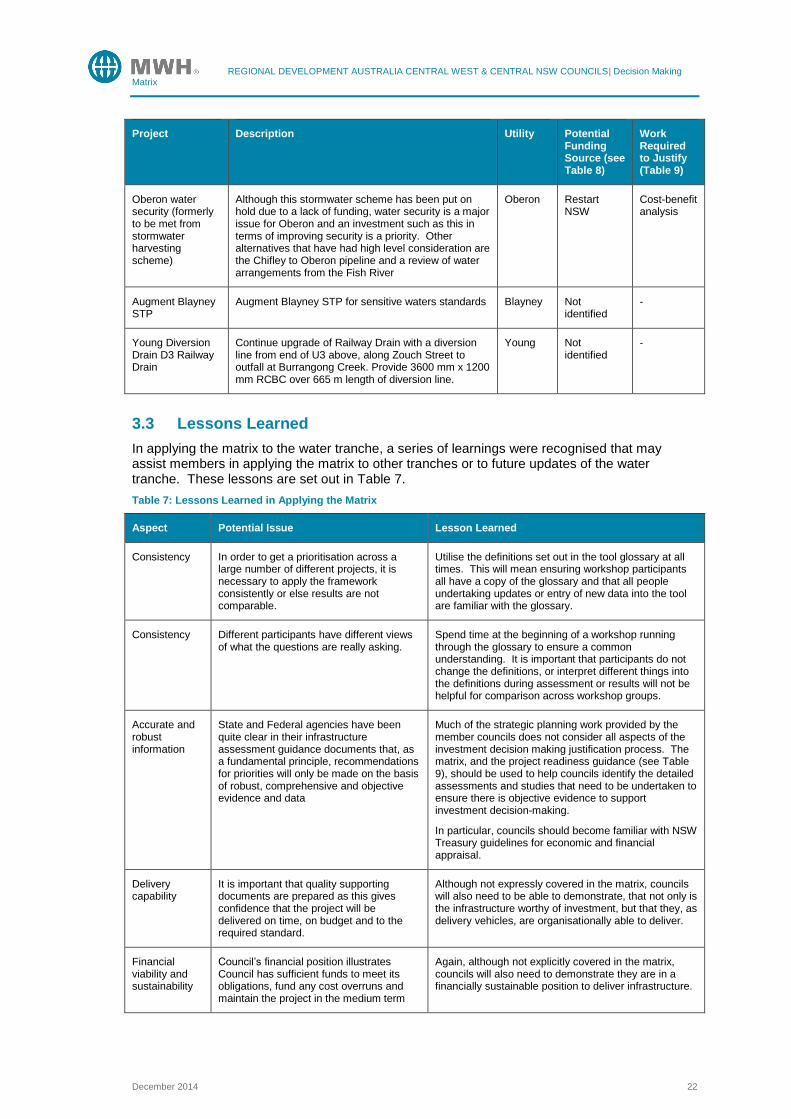
3.2.3 Priorities Between $5M-10M in Capital Investment
Based on the process discussed in Section 3.1, a view of the priorities for the region that require an investment of between $5M and $10M in capital for water is set out in Table 6. This view assumes each of the councils and each of the components of the matrix are equally weighted. The tool can be used to examine alternative weightings which would lead to different lists of priorities.
Table 6: Water Priorities between $5M and $10M
Project Description Utility Potential Funding Source (see Table 8)
Work Required to Justify (Table 9)
Orange to Spring Hill pipeline
Orange to Spring Hill pipeline including the managed aquifer storage and recovery (MAR)
Orange Not identified
Cost-benefit analysis
Oaky Park WTP Oberon Not identified
Cost-benefit analysis
West Cowra Sewer Reticulation
Backlog sewer project Country Towns Program
Cost-benefit analysis
Cumnock and Yeoval Drinking Water Macquarie Pipeline
There is no drinking (potable) water scheme (DWS) in either Cumnock or Yeoval. Residents in both towns currently rely on rainwater tanks and other sources for their drinking water. The project includes the following components: a 12km pipeline from Macquarie River to the outlet at Molong Creek Dam; a service reservoir, chlorination system and ancillary works; and upgrade to the reticulation systems in the towns
Cabonne Country Towns Program
Cost-benefit analysis
West Cowra Sewer Reticulation
West Cowra Sewer Reticulation Cowra Not identified
Cost-benefit analysis
Upper Lachlan Water Security Project
The Upper Lachlan Water Security Project doubles the secure yield of Councils Water Supply in Crookwell by incorporating groundwater from existing aquifers into the supply system. As a result, the project provides a secure water source for Councils major centre Crookwell as well as providing a regional water supply solution for several surrounding villages. The proposed water security works include: pipelines connecting existing bores directly to the new WTP with a branch main to deliver bore water to parks, gardens and sporting fields; construction of a new outlet pump station at Crookwell Dam; a new 3 ML/day capacity DAFF (Dissolved Air Floatation and Filtration) based water treatment plant supplied by bore water and dam water; and a designated standpipe with control system for water tankers
Upper Lachlan
Not identified
Cost-benefit analysis
Trunk Main 'K" Gooloogong Renewal
Trunk Main 'K" Renewal CTW Renewals unlikely to be funded
-
Trunk Main "U" - "C" to Cudal
Trunk Main 'U' - 'C' to Cudal CTW Renewals unlikely to be funded
-
Carcoar, Mandurama, Lyndhurst Sewerage
Backlog sewerage program Blayney Country Towns Program
-
REGIONAL DEVELOPMENT AUSTRALIA CENTRAL WEST & CENTRAL NSW COUNCILS| Decision Making Matrix
December 2014 22
Project Description Utility Potential Funding Source (see Table 8)
Work Required to Justify (Table 9)
Oberon water security (formerly to be met from stormwater harvesting scheme)
Although this stormwater scheme has been put on hold due to a lack of funding, water security is a major issue for Oberon and an investment such as this in terms of improving security is a priority. Other alternatives that have had high level consideration are the Chifley to Oberon pipeline and a review of water arrangements from the Fish River
Oberon Restart NSW
Cost-benefit analysis
Augment Blayney STP
Augment Blayney STP for sensitive waters standards Blayney Not identified
-
Young Diversion Drain D3 Railway Drain
Continue upgrade of Railway Drain with a diversion line from end of U3 above, along Zouch Street to outfall at Burrangong Creek. Provide 3600 mm x 1200 mm RCBC over 665 m length of diversion line.
Young Not identified
-
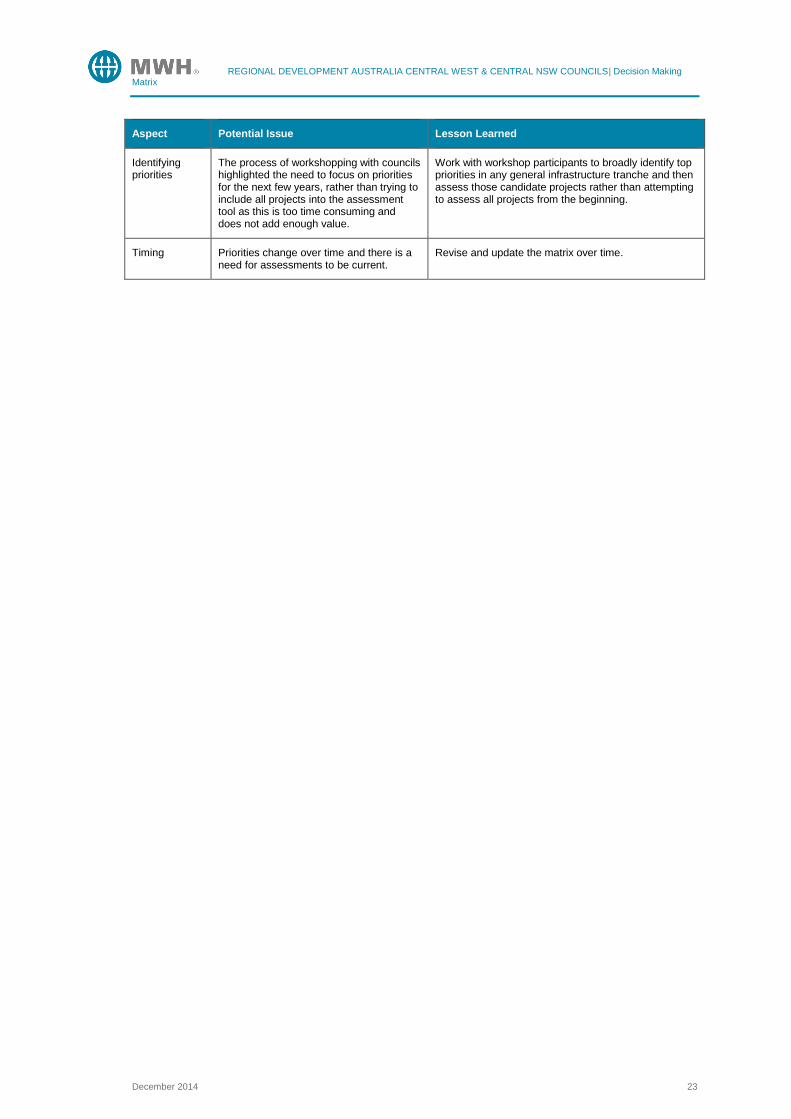
3.3 Lessons Learned
In applying the matrix to the water tranche, a series of learnings were recognised that may assist members in applying the matrix to other tranches or to future updates of the water tranche. These lessons are set out in Table 7.
Table 7: Lessons Learned in Applying the Matrix
Aspect Potential Issue Lesson Learned
Consistency In order to get a prioritisation across a large number of different projects, it is necessary to apply the framework consistently or else results are not comparable.
Utilise the definitions set out in the tool glossary at all times. This will mean ensuring workshop participants all have a copy of the glossary and that all people undertaking updates or entry of new data into the tool are familiar with the glossary.
Consistency Different participants have different views of what the questions are really asking.
Spend time at the beginning of a workshop running through the glossary to ensure a common understanding. It is important that participants do not change the definitions, or interpret different things into the definitions during assessment or results will not be helpful for comparison across workshop groups.
Accurate and robust information
State and Federal agencies have been quite clear in their infrastructure assessment guidance documents that, as a fundamental principle, recommendations for priorities will only be made on the basis of robust, comprehensive and objective evidence and data
Much of the strategic planning work provided by the member councils does not consider all aspects of the investment decision making justification process. The matrix, and the project readiness guidance (see Table 9), should be used to help councils identify the detailed assessments and studies that need to be undertaken to ensure there is objective evidence to support investment decision-making.
In particular, councils should become familiar with NSW Treasury guidelines for economic and financial appraisal.
Delivery capability
It is important that quality supporting documents are prepared as this gives confidence that the project will be delivered on time, on budget and to the required standard.
Although not expressly covered in the matrix, councils will also need to be able to demonstrate, that not only is the infrastructure worthy of investment, but that they, as delivery vehicles, are organisationally able to deliver.
Financial viability and sustainability
Council’s financial position illustrates Council has sufficient funds to meet its obligations, fund any cost overruns and maintain the project in the medium term
Again, although not explicitly covered in the matrix, councils will also need to demonstrate they are in a financially sustainable position to deliver infrastructure.
REGIONAL DEVELOPMENT AUSTRALIA CENTRAL WEST & CENTRAL NSW COUNCILS| Decision Making Matrix
December 2014 23
Aspect Potential Issue Lesson Learned
Identifying priorities
The process of workshopping with councils highlighted the need to focus on priorities for the next few years, rather than trying to include all projects into the assessment tool as this is too time consuming and does not add enough value.
Work with workshop participants to broadly identify top priorities in any general infrastructure tranche and then assess those candidate projects rather than attempting to assess all projects from the beginning.
Timing Priorities change over time and there is a need for assessments to be current.
Revise and update the matrix over time.

REGIONAL DEVELOPMENT AUSTRALIA CENTRAL WEST & CENTRAL NSW COUNCILS| Decision Making Matrix
December 2014 24
4 Other Guidance
In preparing this assessment for Central NSW Councils, other information was compiled that may be of assistance to the members. This information is set out in this section.
4.1 Potential Funding Sources for Water Infrastructure
Potential sources of funding for water infrastructure are identified in Table 8.
Table 8: Water Infrastructure Potential Funding Sources
Funding Source
Program Description Criteria
Restart NSW, Infrastructure NSW
The NSW Government’s Water Security for Regions Program, part of the Restart NSW Fund, has been set up to improve water security.
Under Water Security for Regions, $366 million has been reserved to help communities prepare for future drought conditions.
Projects including augmenting dams, pipeline and bore works and water efficiency mechanisms are being funded to help farmers and regional industries deal with drier conditions.
1. Strategic assessment – consistency with the objectives and purpose of the Restart NSW Fund, in this instance, ‘Infrastructure projects that will improve infrastructure required for the economic competitiveness of the State, including access to water’. The severity of water security conditions, referring to the NSW Government’s definition of Security of Supply basis (commonly known as the 5/10/10 rule) and the degree to which the affected community is impacted by water restrictions. Alignment with the relevant Integrated Water Cycle Management Plan identified works, NSW Government priorities, including NSW 2021 water service targets and other regional water strategies and plans.
2. Economic Assessment – demonstrated capacity to improve economic growth and productivity in the State through the creation or enhancement of publicly owned assets.
3. Affordability – affordability of the project relative to the available funding, taking into account net life-cycle cost impacts and allowing for on-going operating and maintenance requirements.
4. Deliverability - demonstrated capacity of the proponent to deliver the project through robust strategies for procurement, project management and risk management.
REGIONAL DEVELOPMENT AUSTRALIA CENTRAL WEST & CENTRAL NSW COUNCILS| Decision Making Matrix
December 2014 25
Funding Source
Program Description Criteria
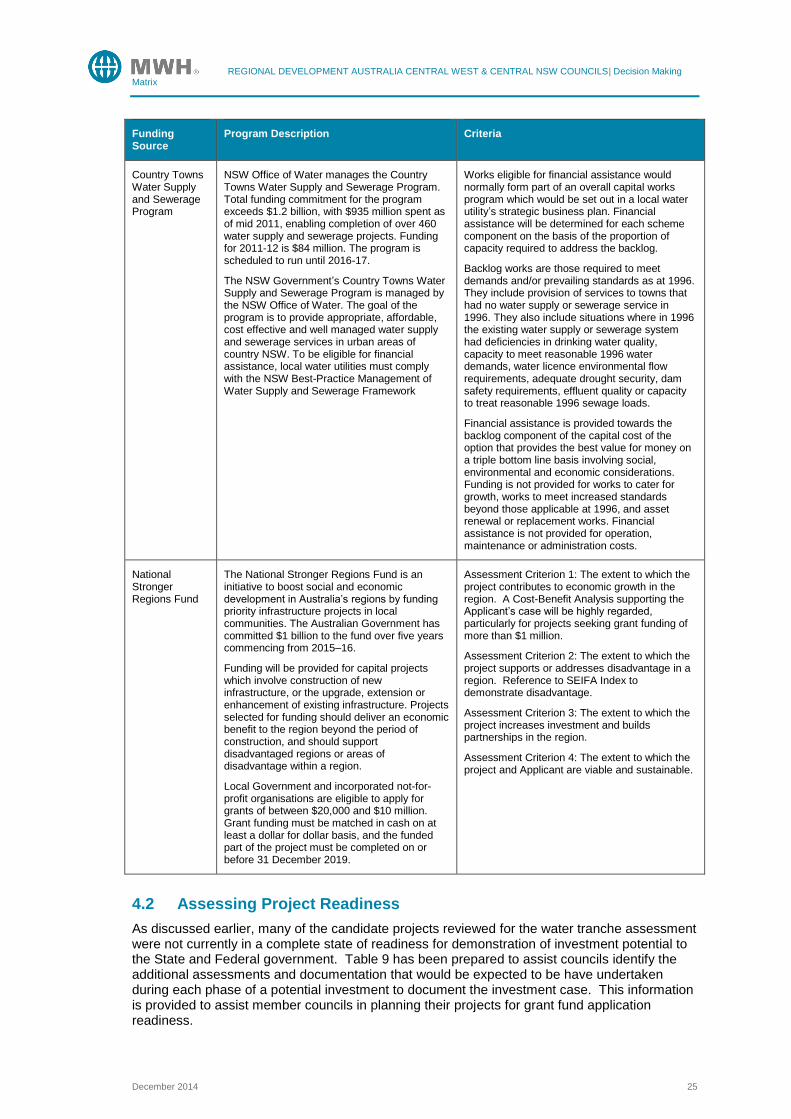
Country Towns Water Supply and Sewerage Program
NSW Office of Water manages the Country Towns Water Supply and Sewerage Program. Total funding commitment for the program exceeds $1.2 billion, with $935 million spent as of mid 2011, enabling completion of over 460 water supply and sewerage projects. Funding for 2011-12 is $84 million. The program is scheduled to run until 2016-17.
The NSW Government’s Country Towns Water Supply and Sewerage Program is managed by the NSW Office of Water. The goal of the program is to provide appropriate, affordable, cost effective and well managed water supply and sewerage services in urban areas of country NSW. To be eligible for financial assistance, local water utilities must comply with the NSW Best-Practice Management of Water Supply and Sewerage Framework
Works eligible for financial assistance would normally form part of an overall capital works program which would be set out in a local water utility’s strategic business plan. Financial assistance will be determined for each scheme component on the basis of the proportion of capacity required to address the backlog.
Backlog works are those required to meet demands and/or prevailing standards as at 1996. They include provision of services to towns that had no water supply or sewerage service in 1996. They also include situations where in 1996 the existing water supply or sewerage system had deficiencies in drinking water quality, capacity to meet reasonable 1996 water demands, water licence environmental flow requirements, adequate drought security, dam safety requirements, effluent quality or capacity to treat reasonable 1996 sewage loads.
Financial assistance is provided towards the backlog component of the capital cost of the option that provides the best value for money on a triple bottom line basis involving social, environmental and economic considerations. Funding is not provided for works to cater for growth, works to meet increased standards beyond those applicable at 1996, and asset renewal or replacement works. Financial assistance is not provided for operation, maintenance or administration costs.
National Stronger Regions Fund
The National Stronger Regions Fund is an initiative to boost social and economic development in Australia’s regions by funding priority infrastructure projects in local communities. The Australian Government has committed $1 billion to the fund over five years commencing from 2015–16.
Funding will be provided for capital projects which involve construction of new infrastructure, or the upgrade, extension or enhancement of existing infrastructure. Projects selected for funding should deliver an economic benefit to the region beyond the period of construction, and should support disadvantaged regions or areas of disadvantage within a region.
Local Government and incorporated not-for-profit organisations are eligible to apply for grants of between $20,000 and $10 million. Grant funding must be matched in cash on at least a dollar for dollar basis, and the funded part of the project must be completed on or before 31 December 2019.
Assessment Criterion 1: The extent to which the project contributes to economic growth in the region. A Cost-Benefit Analysis supporting the Applicant’s case will be highly regarded, particularly for projects seeking grant funding of more than $1 million.
Assessment Criterion 2: The extent to which the project supports or addresses disadvantage in a region. Reference to SEIFA Index to demonstrate disadvantage.
Assessment Criterion 3: The extent to which the project increases investment and builds partnerships in the region.
Assessment Criterion 4: The extent to which the project and Applicant are viable and sustainable.
4.2 Assessing Project Readiness
As discussed earlier, many of the candidate projects reviewed for the water tranche assessment were not currently in a complete state of readiness for demonstration of investment potential to the State and Federal government. Table 9 has been prepared to assist councils identify the additional assessments and documentation that would be expected to be have undertaken during each phase of a potential investment to document the investment case. This information is provided to assist member councils in planning their projects for grant fund application readiness.
REGIONAL DEVELOPMENT AUSTRALIA CENTRAL WEST & CENTRAL NSW COUNCILS| Decision Making Matrix
December 2014 26
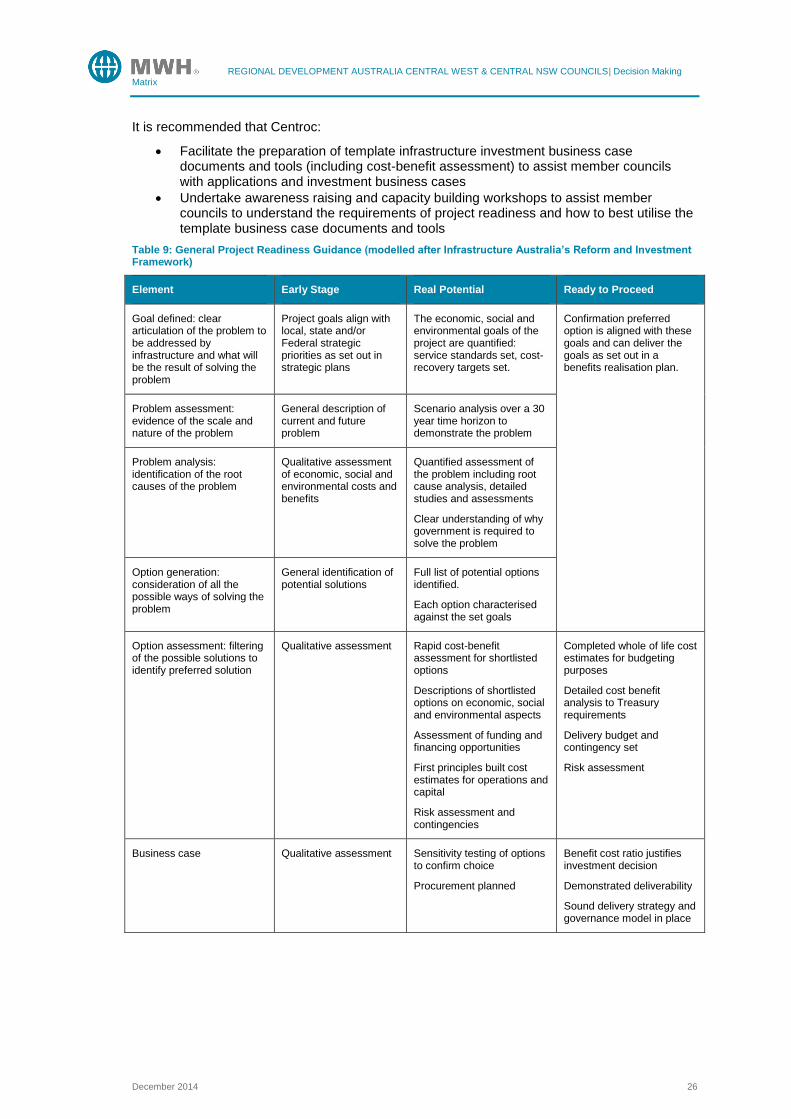
It is recommended that Centroc:
Facilitate the preparation of template infrastructure investment business case documents and tools (including cost-benefit assessment) to assist member councils with applications and investment business cases
Undertake awareness raising and capacity building workshops to assist member councils to understand the requirements of project readiness and how to best utilise the template business case documents and tools
Table 9: General Project Readiness Guidance (modelled after Infrastructure Australia’s Reform and Investment Framework)
Element Early Stage Real Potential Ready to Proceed
Goal defined: clear articulation of the problem to be addressed by infrastructure and what will be the result of solving the problem
Project goals align with local, state and/or Federal strategic priorities as set out in strategic plans
The economic, social and environmental goals of the project are quantified: service standards set, cost-recovery targets set.
Confirmation preferred option is aligned with these goals and can deliver the goals as set out in a benefits realisation plan.
Problem assessment: evidence of the scale and nature of the problem
General description of current and future problem
Scenario analysis over a 30 year time horizon to demonstrate the problem
Problem analysis: identification of the root causes of the problem
Qualitative assessment of economic, social and environmental costs and benefits
Quantified assessment of the problem including root cause analysis, detailed studies and assessments
Clear understanding of why government is required to solve the problem
Option generation: consideration of all the possible ways of solving the problem
General identification of potential solutions
Full list of potential options identified.
Each option characterised against the set goals
Option assessment: filtering of the possible solutions to identify preferred solution
Qualitative assessment Rapid cost-benefit assessment for shortlisted options
Descriptions of shortlisted options on economic, social and environmental aspects
Assessment of funding and financing opportunities
First principles built cost estimates for operations and capital
Risk assessment and contingencies
Completed whole of life cost estimates for budgeting purposes
Detailed cost benefit analysis to Treasury requirements
Delivery budget and contingency set
Risk assessment
Business case Qualitative assessment Sensitivity testing of options to confirm choice
Procurement planned
Benefit cost ratio justifies investment decision
Demonstrated deliverability
Sound delivery strategy and governance model in place
REGIONAL DEVELOPMENT AUSTRALIA CENTRAL WEST & CENTRAL NSW COUNCILS| Decision Making Matrix
December 2014 27
Appendix A – Maps of Priorities for Water
A Google Earth GIS layer has been developed to show the regional priorities. This will need to be updated as priorities are revised over time using the dynamic matrix tool.