Embed Size (px)
Citation preview

REGIONAL INEQUALITY IN INDIA: A STATE LEVEL ANALYSIS
Aviral PANDEY1 Richa GAUTAM2
Abstract: This paper tries to understand the nature and extent of inequality across states of India with special reference to Bihar. The study is based on secondary data collected from various sources, including NSSO, NFHS and other government/non-government documents and reports. The study analyzes inequalities under four themes: livelihood, education, health and gender. The analysis finds that, however, some positive changes can be seen in terms of enrolment in case of primary education, but still, productivity of education is the lowest in Bihar. The state government has invested money in attracting students to government schools, but because of a low per capita expenditure on education, access to facilities like computers in schools is the lowest in Bihar. In the case of health expenditure, the people of Bihar have to bear significantly higher per capita out of pocket expenditure. Though, Bihar has achieved higher growth in the last couple of years but the level of female empowerment is still very low in the state. Thus, this study finds that Bihar is still at lowest position in all four themes across states of India and, people of this state are facing grim challenges related to livelihood, quality education and health.
Keywords: Bihar, education, health, India, inequality, livelihood, empowerment index
Introduction
India is a country marked by contrasts and diversity (some of these are geographical in nature, and others are caste, religion and class). India obtained its independence in the year 1947. The size of population was around 361 Million in 1951, around 14 percent of the total world population. At present, India constitutes around 17.7 percent of total world population. The increase in population has not only opened new challenges in the country, but it has also been seen as dividend. The size of the economy has also changed tremendously. In 1951 per capita income was Rs. 7114, while in 2013-2014 (at 2004-05 prices) it was Rs. 39904 and Rs. 100151 in 2017-18 (at 2011-12 prices)3. Still,
1 Assistant Professor, A N Sinha Institute of Social Studies, Patna. Email: aviral.ansiss@ gmail.com, Mob: 8987100796.
2 Assistant Professor, M. R. M. College, Lalit Narayan Mithila University, Darbhanga, Email: [email protected]
3 http://mospi.nic.in/data, http://www.mospi.gov.in/sites/default/files/press_release/Press% 20Note% 20PE%202018-19-31.5.2019-Final.pdf.
Journal of Community Positive Practices, XX(4) 2020, 56-85 ISSN Print: 1582-8344; Electronic: 2247-6571
DOI: 10.35782/JCPP.2020.4.04
Aviral PANDEY, Richa GAUTAM 57
challenges lie in terms of rising inequality in India. It is also true that India is no stranger to income inequality, but the inequality is widening at faster rate in the country. Previous year's OXFAM survey had showed that India's richest 1% held 58% of the country's total wealth, which was higher than the global figure of about 50%. Between 2006 and 2015, ordinary workers saw their incomes rise by an average of just 2% a year, while billionaire wealth raised almost six times faster (OXFAM, 2018). Similarly, one can also see emerging inequalities within states of India. There are cities like Mumbai, in the state of Maharashtra, where 233 billionaire people live. On the contrary, in Mumbai, millions of people live in slums. It is known that Bihar has one of the lowest per capita incomes among all states of India. This shows some of the emerging dimensions of inequality within states of India. Such situations not only affect the development of the concerned state, but also the development of the country. For inclusive growth/ development, it is essential that every sector (economics, services etc.) and every state should perform equally well. But, the situation is gloomy in a state like Bihar, where more than 50 percent of workers are dependent on the agriculture sector, which in the last couple of years did not perform well. A World Bank analysis (2018) shows that populated states, including Bihar, are home of poor people in India (See Figure 1).
Figure 1. State Share in India’s Poor and India’s Population
Source World Bank (2018)1
One possible reason for such a situation is that most of the households in these states are highly dependent on the agriculture sector. So, even if Bihar has achieved higher growth in overall state’s income, a large chunk of population are not getting benefit out of this growth, as they are dependent on a slow growing sector (agriculture). Thus, it can be said that economic growth in Bihar has been less inclusive than in India as a
1 https://www.worldbank.org/en/news/feature/2016/05/26/india-states-briefs.

Regional inequality in India: A state level analysis 58
whole. In the case of Bihar, data also shows that construction activities, and government expenditure on administration (that can be seen in terms of increasing amount of expenditure on salary also), are two major sectors which have increased rapidly in the state. Unfortunately, most of the people who are in non-farm sector in Bihar are working mainly as low paid wage labour/worker in tertiary sector (Anubandhit, Niyojit, and outsourced workers are emerging categories of workers in Bihar). So, growth in the tertiary sector cannot be said to be inclusive in nature in Bihar.
It is also seen that poor states need high government investment on sectors like health and education. But, an analysis of the states’ budgets shows that in a state like Bihar, per capita investment by government on education and health is the lowest across states of India (Suhag, Tiwari, 2018). Due to low government expenditure on health and education, people of Bihar are spending higher amounts of their income on private education/tuition and private health care (either in the state or outside the state). Among all states, the share of OOPE (out of Pocket Expenditure) on health against the overall expenditure was highest in Bihar, at 77.6 per cent, against the national average of 60.6 per cent. On the other hand, central and State governments spent Rs. 5740 crore on healthcare in Bihar, where OOPE stood at Rs. 20857 crore in Bihar (NHA 2016-2017). Studies have also tried to explain the factors responsible for inequality in India. It cannot be denied that to some extent situations promoting inequality are already rooted in the history and administrative legacy of India. Just after the independence, the art of governance was highly influenced by the colonial legacy and emphasis was given on the role of government. After the 1980’s it can be seen that processes of liberalisation in different areas have been progressing at faster speed in India. Liberalisation has redefined the nature of governance in India as well. There has been a decline in the role of the state and the role of market has gained in importance in India. Thus, changes in nature and extent of inequality over the period are a combined result of internal and external factors and India’s excessive income inequality is associated with both market and non-market factors. Inequality is also likely to be present in India as large numbers of the work force are employed in sectors with low productivity, such as agriculture, which provides jobs to around 50 percent of the workforce, but the sector is contributing with only 17 per cent to the GDP of India. On the other hand, after the introduction of LPG regime, labour movements (Labour Union) are weakening day by day and are also affecting the share of labour in total production. It is also true that the privatisation of education and health also forces the poor to expend more on these services. This may affect the wealth creative capacity of poor people and thus it also contributes to a growing wealth inequality. On the opposite, tax benefits to corporate and NPAs (Non Performing Assets) may promote inequality.
On this background, this paper tries to understand the nature and extent of inequality across state of India and also tries to identify the position of Bihar in India in terms of inequality. This study is based on secondary data collected from various sources including NSSO, NFHS and other government/non-government documents and reports. Simple tabular and statistical tools have been used to fulfil the objectives of this study. This work is divided into five parts. Detailed methodology used in any particular section is explained in the concerned section.

Aviral PANDEY, Richa GAUTAM 59
Section I: Livelihood Inequality
Rising out migration from some states shows that situation of development is not as good as it is reported via GDP. Thus, growth in GDP data cannot be considered as indicator of inclusive development. Recent migration data released by the Census shows the emerging situation of livelihood crisis faced by households in some states and can be understood through analysing changing dimensions of migration in India. The analysis of Census data shows that the “Hindi Belt” is the main source of migrants in India. According to the 2011 Census, four states (Uttar Pradesh, Bihar, Rajasthan and Madhya Pradesh) accounted for 50 per cent of India’s total inter-state migrants. Uttar Pradesh and Bihar are responsible for most of the migrants in India. According to the 2011 Census, 20.9 million people migrated outside the state from these two states. This is 37% of the total number of people who were inter-state migrants according to that enumeration. The major destination states for migrants are Delhi, Maharashtra, Tamil Nadu, Gujarat, Andhra Pradesh and Kerala. Interestingly, Uttar Pradesh figures in both lists (emigration and immigration). Unfortunately, the situation of Bihar is different from any other state in India. The extent of emmigration (work or business is one of the most significant reasons behind this situation) shows how limited/good livelihood options are available to the people in Bihar. Although Bihar has experienced higher growth between 2005 and 2015, it seems that growth in income could not able to generate good livelihood options for its people.
One important section of academia believes that the growth outcome has not been very inclusive in nature in India, thus inequality can be witnessed between rural and urban areas and between different states of India. In this backdrop, an analysis has been done to see existing inequality across states. Inequality has been seen under physical capital, human capital and natural capital (as these are important for generating livelihood options in any particular location/region/state).
Physical Capital at Household Level: Inequality in Access to Assets in states of India
Assets are one of the important factors that are correlated with livelihood options. Correlation analysis between per capita income and value of households’ assets score at state level shows that asset scores are positively correlated with income level at state level in India. Including other sources, NFHS also provides data on household asset. Comparison of reports of different rounds of NFHS (National family Health Survey) shows the changing dimensions of inequality in India. Recently Mishra and Joe (2020) have estimated composite household assets score to see inequality in access to assets across households in India. Interestingly, the comparison of two data points (2005-06 and 2015-16) shows that access to assets has increased at overall level in India. The study also points out that the inequality has increased across states in terms of household economic well-being and ownership of assets (few exceptions are there). Still, Bihar is at the lowest level across states in India. In the case of Bihar, very small progress can be seen, as the value of composite household assets score has increased from 0.212 in 2005-06 to 0.227 in 2015-16. The Gini coefficient for the assets score has declined from 0.446 in 2005-06 to 0.401 in 2015-16. Bihar is at the top in terms of level

Regional inequality in India: A state level analysis 60
of inequality in asset score in India. On the other hand, one can find significant decline in inequality in asset score in case of Odisha, Tamil Nadu, Uttar Pradesh, and West Bengal (See Table 1).
Wealth quintiles wise distribution of assets also provides a way to understand interstate inequality in terms of distribution of economic well-being of households. In Jharkhand, Chhattisgarh and Odisha, more than 40 percent of the households were identified in the lowest income quintile in 2005-06. By 2015-16, the situation has improved in Odisha, Jharkhand and Chhattisgarh. On the other hand, more than 45 percent of the households are still in the group of lowest quintile in Jharkhand and Bihar. Thus, it seems that the situation has deteriorated in Bihar, and every second household in Bihar belongs to the lowest wealth quintile group category.
Table 1: Statewise Mean and Gini Coefficient for Household Asset Scores, NFHS 2005–06 and 2015–16
States Mean Asset Score Gini Coefficient
2005–06 2015–16 2005–06 2015–16
Andhra Pradesh(including Telangana)
0.286 0.357 0.394 0.270
Arunachal Pradesh 0.294 0.331 0.426 0.306
Assam 0.282 0.313 0.413 0.289
Bihar 0.212 0.227 0.446 0.401
Chhattisgarh 0.231 0.312 0.460 0.342
Delhi 0.594 0.533 0.236 0.194
Goa 0.560 0.576 0.263 0.180
Gujarat 0.399 0.410 0.333 0.269
Haryana 0.416 0.516 0.331 0.200
Himachal Pradesh 0.448 0.491 0.277 0.200
Jammu and Kashmir 0.405 0.444 0.322 0.256
Jharkhand 0.212 0.255 0.535 0.396
Karnataka 0.331 0.410 0.396 0.257
Kerala 0.495 0.577 0.241 0.169
Madhya Pradesh 0.247 0.316 0.498 0.376
Maharashtra 0.376 0.408 0.375 0.275
Manipur 0.360 0.403 0.307 0.256
Meghalaya 0.292 0.326 0.366 0.270
Mizoram 0.433 0.458 0.278 0.252
Nagaland 0.311 0.355 0.332 0.274
Odisha 0.223 0.274 0.486 0.360
Punjab 0.505 0.580 0.272 0.164
Rajasthan 0.279 0.355 0.481 0.340
Sikkim 0.366 0.396 0.293 0.163
Tamil Nadu 0.317 0.435 0.404 0.237
Tripura 0.288 0.326 0.336 0.263
Uttar Pradesh 0.264 0.319 0.460 0.363
Uttarakhand 0.410 0.434 0.351 0.254
West Bengal 0.261 0.311 0.455 0.312
All India 0.307 0.365 0.431 0.323
Source: Mishra and Joe (2020)

Aviral PANDEY, Richa GAUTAM 61
Table 2: Statewise Distribution of Households by Wealth Quintile, As per NFHS 2005–06 and 2015–16
States Lowest Second Middle Fourth Highest
2006 2016 2006 2016 2006 2016 2006 2016 2006 2016
Andhra Pradesh (including Telangana)
12 7 18 17 29 29 25 28 16 19
Arunachal Pradesh 21 19 24 24 20 26 17 22 18 9
Assam 20 25 30 38 22 18 15 13 13 6
Bihar 31 53 30 22 18 13 13 9 9 3
Chhattisgarh 43 35 26 24 13 16 8 12 9 13
Delhi 0 0 3 2 10 15 20 22 67 61
Goa 3 0 6 5 14 12 22 28 55 55
Gujarat 7 9 15 16 19 20 27 25 32 30
Haryana 4 2 13 8 25 18 28 26 30 46
Himachal Pradesh
1 2 9 10 23 23 31 33 35 32
Jammu and Kashmir 3 7 13 19 28 24 29 24 28 26
Jharkhand 52 48 15 20 10 13 11 10 12 9
Karnataka 11 7 22 20 23 26 22 26 21 21
Kerala 1 0 5 3 13 14 37 35 45 48
Madhya Pradesh 38 33 24 22 13 15 12 14 13 16
Maharashtra 12 10 16 16 18 22 23 25 32 26
Manipur 3 10 17 31 34 30 31 19 15 9
Meghalaya 12 12 22 35 23 31 26 16 16 7
Mizoram 2 6 6 11 19 21 36 29 37 33
Nagaland 7 12 22 31 30 27 26 20 15 10
Odisha 42 38 20 26 17 18 12 11 9 7
Punjab 1 1 7 4 17 12 30 22 45 61
Rajasthan 25 18 17 24 21 21 17 18 20 19
Sikkim 2 1 10 7 22 41 31 40 35 12
Tamil Nadu 12 5 16 15 29 27 23 31 19 22
Tripura 11 13 25 42 40 23 16 15 8 6
Uttar Pradesh 28 32 25 22 18 16 16 14 13 16
Uttarakhand 7 5 16 18 21 25 23 23 33 29
West Bengal 25 24 24 29 19 20 18 17 15 9
All India 20 20 20 20 20 20 20 20 20 20
Source: Mishra and Joe (2020)
Table 2 also points out that around 40 percent households with low wealth score in India are found in Bihar and Jharkhand. In terms of wealth score, 40 percent of the households are poor (at least relatively poor) in Bihar. On the other hand, between 2004-05 and 2014-15, Bihar emerged as one of the fastest growing states of India,

Regional inequality in India: A state level analysis 62
clocking over 10 per cent annual growth for the past decade. Thus, it can be concluded that economic growth has not affected the asset based economic well-being situation of households in Bihar (as around 50 percent of households are still in the lowest wealth quintile group). Here, we have also tried to understand how inequality in terms of human capital and natural capital can explain the existing nature on livelihood inequality across states of India.
Human Capital
India is the second populated country of world. The human capital index prepared by the World Bank points out towards some important facts. This index is supposed to present the value of productivity of the next generation workers. It covers three major dimensions, including survival, expected years of quality adjusted school and health environment. Recent report on this index (2018) shows that only 8% of the population is expected to be 75% as productive as they could be. The value of this index for India has been estimated at 0.44. This shows that a child born in India today will be only 44 percent as productive as she/he could be (if he/she enjoyed complete education and full health facilities/situation). Unfortunately, data related to all variables (those are used to measure human capital index) at state level is not available. So we have used proxies to understand the situation of human capital in the states of India using the ASER report1 and NFHS reports. Stunted percentage is one of the important variables of human capital index. NFHS 4 (2015-16) shows some emerging trend of child healthy growth in India. In states like Bihar, Uttar Pradesh, Jharkhand, Meghalaya, Madhya Pradesh, Dadar Nagar Haveli, more than 40 percentage of children below five years are stunted. In terms of percentage of children stunted, Bihar is at the lowest rank (see Table 3).
Table 3: Statewise Child Stunted Rate in India
Name of State Stunted Name of State Stunted
Bihar 48.3 Sikkim 29.6
Uttar Pradesh 46.3 Arunachal Pradesh 29.4
Jharkhand 45.3 Manipur 28.9
Meghalaya 43.8 Nagaland 28.6
Madhya Pradesh 42 Telangana 28.1
Dadar Nagar Haveli 41.7 Mizoram 28
Rajasthan 39.1 Chandigarh 27.6
Gujarat 38.5 Jammu & Kashmir 27.4
Chhattisgarh 37.6 Tamil Nadu 27.1
Assam 36.4 Lakshadweep 27
Karnataka 36.2 Himachal Pradesh 26.3
Maharashtra 34.4 Punjab 25.7
Odisha 34.1 Tripura 24.3
Haryana 34 Puducherry 23.7
1 The ASER survey is a nationwide household survey, covering 596 districts in rural India. A total
of 354,944 households and 546,527 children between ages three and 16 were surveyed to evaluate learning outcomes.

Aviral PANDEY, Richa GAUTAM 63
Name of State Stunted Name of State Stunted
Uttarakhand 33.5 Daman & Diu 23.4
West Bengal 32.5 Andaman and Nicobar 23.3
NCT Delhi 32.3 Goa 20.1
Andhra Pradesh 31.4 Kerala 19.7
Source: NFHS4
There is no such data related to quality of education at overall level for states of India. But ASER provides data on the quality of students of schools in India. It can be used to understand the situation of quality of education in school education in India and its probable effect on productivity. Table 4 and Table 5 show reading and analytical capacity of students (of Fifth Class) for enrolled students (of year 2018). If we consider the learning levels of children as an indicator of productivity of the education system, then the levels of productivity in 2008 and 2018 show that productivity of education has declined by nearly 9 percentage points, or about 17 percent (in terms of reading capacity) and nearly 12 percentage points, or about 34 percent (in terms of analytical capacity). Table 4 and Table 5 show significant disparities in terms of learning outcomes, progress made with reference to RTE Act 2009 and facilities at schools across states of India.
Table 4 and Table 5 show how each state has performed over the years in terms of productivity of education system. Overall, the performances of Bihar, Jharkhand, and Rajasthan have not been found very satisfactory during 2008 to 2018. Thus, parameters of malnutrition and education show that productivity of children in Bihar, Jharkhand and Rajasthan is lower than other states of India. These states are already at lower rank in terms of per capita income. Further, low productivity of children in these states in comparison to other states will increase the gap between the rich and poor states of India. The situation is more disastrous for Bihar, as more than 37 per cent of Bihar's current population is below the age of 14 and productivity level of state’s education and health system (in terms of IMR and situation of malnutrition) system are in bad situation in India.
Table 4: Percentage of Children in Government Schools in Std. V who can read Std. II level text, 2008-2018
2008 2010 2012 2014 2016 2018
India 53.1 50.7 41.7 42.2 41.7 44.2
Kerala 73.3 74 59.9 61.3 63.3 73.1
Maharashtra 74.3 71 55.3 51.7 63.1 66
Punjab 61.3 68.7 69.5 60.9 64 68.7
Uttarakhand 64.6 63.7 52.2 52 55.9 58
Haryana 61.1 60.7 43.5 53.9 54.6 58.1
Chhattisgarh 74.1 61 44 47.1 51 57.1
Assam 40.9 42.6 33.3 30.6 32.2 33.5
Madhya Pradesh 86.8 55.2 27.5 27.5 31.4 34.4
Karnataka 42.9 42.9 47.2 45.7 41.9 47.6
Himachal Pradesh 73.6 75.7 71.2 71.5 65.3 74.5
Odisha 59.6 45.5 46.1 49.1 48.8 56.2

Regional inequality in India: A state level analysis 64
2008 2010 2012 2014 2016 2018
Uttar Pradesh 33.4 36 25.6 26.8 24.3 36.2
Jharkhand 51.9 48.4 32.5 29.1 31.4 29.4
West Bengal 45.2 54.2 48.7 51.8 50.2 50.5
Gujarat 43.8 43.5 46.3 44.6 52.3 52
Rajasthan 45.1 44.2 33.3 34.4 42.5 39.1
Tamil Nadu 26.7 30.9 30.2 49.9 49.4 46.3
Bihar 62.8 57.9 43.1 44.6 38 35.1
Source: ASER (2018)
Table 5: Percentage of Children in Government Schools in Std. V who can do Division, 2008-2018
India 34.4 33.9 20.3 20.7 21.1 22.7
Himachal Pradesh 57.4 61.8 40.7 37.9 47.4 51.5
Punjab 39.7 70.8 48.6 37.1 42.4 50.1
Uttar Pradesh 15.8 18.7 9.1 12.1 10.4 17
Kerala 38.3 43.1 38 25.6 27.1 33.5
Chhattisgarh 59.5 37.8 13.1 14.1 18.6 26.1
Maharashtra 46.9 39.9 20.2 16.6 19.7 31.7
Madhya Pradesh 77.5 38 8.9 10 15.3 16.5
Gujarat 24.1 19.6 12.4 13.9 14.5 18.4
Uttarakhand 38.4 48.7 27.3 21.4 25.5 26.7
Assam 15.5 22.6 8.9 9 9.1 14.4
West Bengal 29.4 38.1 28.7 31.3 28.6 29.2
Haryana 45.7 50.5 25.4 30.8 30.1 34.4
Karnataka 14.9 18.7 17.4 16.7 17.2 19.6
Tamil Nadu 9 14.1 9.6 25.6 21.4 27.1
Bihar 50.9 51 30 31.4 28.9 24.1
Jharkhand 30.5 40.1 20.1 17.6 20 15.6
Rajasthan 25.9 25.2 9.9 12 15.6 14.1
Odisha 36 31.3 17.2 19.9 23.8 23.8
Source: ASER (2018)
Natural Capital
Normally, inequality seen in terms of income and consumption ignores the aspect of natural capital. Thus, it underestimates the existing level of inequality. This is true if some states are using natural capital faster than others. Like financial savings, the possibility of future growth also depends on the level of natural capital that one state or region keeps for use in future. If a region uses natural capital at a faster rate it will lead to another crisis that the region may have to face in near future. So, the importance of natural capital must not be ignored.

Aviral PANDEY, Richa GAUTAM 65
Table 6: Level of change in Natural Capital during year 2005 and 2015 in India
Level of change in natural capital during 2005-15
States
Increase greater than 5% Madhya Pradesh, Maharashtra, Manipur and Rajasthan
Increase between 0-5% Andhra Pradesh, Arunachal Pradesh, Chhattisgarh, Goa, Haryana, Himachal Pradesh, Jammu & Kashmir, Meghalaya, Nagaland, Odisha, Sikkim, Uttar Pradesh and West Bengal
Negative change Assam, Bihar, Gujarat, Jharkhand, Karnataka, Kerala, Mizoram, Punjab, Tamil Nadu, Tripura and Uttarakhand
Source: EnviStats-India 2018
Natural (or ecological) capital is an outcome of the natural system (ecological system). The natural system provides goods that depletes due to production of goods and services, and we ignore to depreciate the value of such depletion during estimation of GDP. It means that if we reduce the amount of the natural capital at higher rate it will affect the future ability to produce goods and services. A report on environment accounts released by the MoSPI (The Ministry of Statistics and Programme Implementation) shows that during 2005-15 for almost all states the average growth rate of gross state domestic product (GSDP) was around 7-8 per cent. During same years, 11 states registered a decline in their natural capital, 13 states showed a marginal growth in the range 0-5 per cent, and only four states saw their natural capital increase by more than 5 per cent (See Table 6). It seems that the present model of economic growth may not be sustainable for some states in India.
The report also reveals that states like Andhra Pradesh, Gujarat, Jharkhand, Kerala,
Maharashtra and Odisha show an increase in parameters such as transition of fallow
land to farmland, increase in forest cover along with growing carbon stock and new
sources of minerals. The report shows 24% decline in the area under snow and glacier
in some states and also shows the impact of climate change on wetlands/water bodies
in Himachal Pradesh, Sikkim and Jammu Kashmir. Unsustainable extraction of
groundwater resources is resulting into decline in the water levels in Tamil Nadu,
Chhattisgarh, Goa, Odisha and Rajasthan. Down to Earth’s State of India’s
Environment 2018 had also talked about increasing dependency and unsustainable use
of groundwater resources. It had revealed that in 2013, the country used 62 per cent of
the net available annual groundwater, which is a 58 per cent increase from 2004.
In the last 6 years, the rate of growth of forest stock has reduced by more than 10% in
almost all states. From 2006-07 to 2010-11, all states, except Goa and Sikkim, have
shown such a decline. However, from 2010-11 to 2015-16, even though there was a
marginal change in forest coverage in Assam and Uttarakhand, growing stock (of
forest) has reduced by more than 10 per cent. But in the case of Jharkhand, Madhya
Pradesh, Maharashtra and Rajasthan, despite a marginal change in forest cover, growing
stock has significantly increased by more than 10 per cent. Conversion of agricultural
land to meet needs of urban population also affects its productive capacity. The report
says that high rate of urban growth is likely to affect a productive capacity (of

Regional inequality in India: A state level analysis 66
agriculture) in states like Punjab, Haryana, Karnataka, Telangana and West Bengal.
Livelihood options in agriculture may be affected in Punjab, Haryana, Karnataka,
Telangana and West Bengal in upcoming years. Because natural capital is one of the
important sources of livelihood in most of the states India, an analysis of access to
natural capital across state level is important. We have analysed the situation of states as
per two most important natural capitals (forest and wetland) and these are also very
important for livelihood diversification in states of India, mostly in states where those
are highly dependent on primary sector. Table 7 and Table 8 show distribution of states
as per forest coverage in India. We can see that with reference to population the forest
coverage is low in almost 20 states of India. States like Jharkhand, Uttar Pradesh and
Bihar are also included in the list of these 20 states.
Table 7: Forest Coverage in India (A)
Per thousand area under tree (Sq.KM/Person)
Name of States
less than 1 Jharkhand, Kerala, Karnataka, Dadra & Nagar Haveli ,Telangana, Andhra Pradesh, Maharashtra, Lakshadweep, Tamil Nadu, Gujarat, Rajasthan, West Bengal, Daman & Diu, Uttar Pradesh, Bihar, Punjab, Haryana, Puducherry, Chandigarh, Delhi.
1 to less than 10 Nagaland, Manipur, Meghalaya, Sikkim, Uttarakhand, Himachal Pradesh, Chhattisgarh, Tripura, Goa, Odisha, Madhya Pradesh
Greater than 10 Arunachal Pradesh, Andman & Nicobar is.. Mizoram
Source: EnviStats-India 2018
Table 8: Forest Coverage in India (B)
Area under Forest Coverage (Area in percentage)
Name of States
Greater than 75 Lakshadweep, Mizoram, Andman & Nicobar is., Arunachal Pradesh, Meghalaya, Manipur, Nagaland
Less than 75 and greater than 50 percent
Tripura, Goa, Kerala
50 to greater than 25 Sikkim, Uttarakhand, Dadra & Nagar Haveli, Chhattisgarh, Assam, Odisha, Jharkhand, Himachal Pradesh, Madhya Pradesh
0-25 Tamil Nadu, Karnataka, Chandigarh, West Bengal, Daman & Diu, Telangana. Andhra Pradesh, Maharashtra, Delhi, Puducherry, Bihar, Gujarat, Uttar Pradesh, Rajasthan, Punjab, Haryana
Source: EnviStats-India 2018
In terms of area under forest coverage, states like Bihar and Uttar Pradesh are poor performer states in India. Similarly, in case of availability of wetland (see Table 9 and Table 10) Bihar is the poor performer. Significantly, one third of the countrys population is living in Bihar and Uttar Pradesh. And more than 50 percent of population of these two states are dependent on primary sector in India. Wetland and forest coverage is important for the reduction in the impacts of floods. They also absorb pollutants and improve water quality. Unfortunately, the situation of wetland and forest coverage is very poor in Bihar and Uttar Pradesh. Such situations may

Aviral PANDEY, Richa GAUTAM 67
further lead to decrease in livelihood potential in states like Bihar and Uttar Pradesh and, thus inequality may further lead to increase across states of India in near future.
Table 9: Wetlands in India (A)
Per lakh Population number of Wetland
States
Higher than 100 Andaman & Nicobar Is.
100 to 10 Arunachal Pradesh, Tripura, Mizoram, Chhattisgarh, West Bengal, Sikkim, Madhya Pradesh
less than 10 and greater than 5
Nagaland, Odisha, Meghalaya, Maharashtra, Manipur, Gujarat, Rajasthan, Assam, Jharkhand
Less than 5 Goa, Karnataka, Telangana, Andhra Pradesh, Uttarakhand, Tamil Nadu, Himachal Pradesh, Dadra & Nagar Haveli, Uttar Pradesh, Kerala, Puducherry, Punjab, Chandigarh, Haryana, Bihar, Delhi
Source: EnviStats-India 2018
Table 10: Wetlands in India (B)
Area under Wetland (in percentage)
Name of States
Greater than 10 Puducherry, Gujarat, West Bengal, Andaman & Nicobar is.
10 to 3 Chandigarh, Haryana, Punjab, Uttar Pradesh
less than 3 to 1 Assam, Uttarakhand, Tamil Nadu, Maharashtra, Kerala, Andhra Pradesh, Madhya Pradesh, Karnataka, Rajasthan, Dadra & Nagar Haveli, Odisha, Chhattisgarh, Meghalaya, Nagaland, Arunachal Pradesh, Telangana
Less than 1 Sikkim, Jharkhand, Goa, Manipur, Tripura, Bihar, Mizoram, Himachal Pradesh, Delhi
Source: EnviStats-India 2018
Section II: Inequality in Education
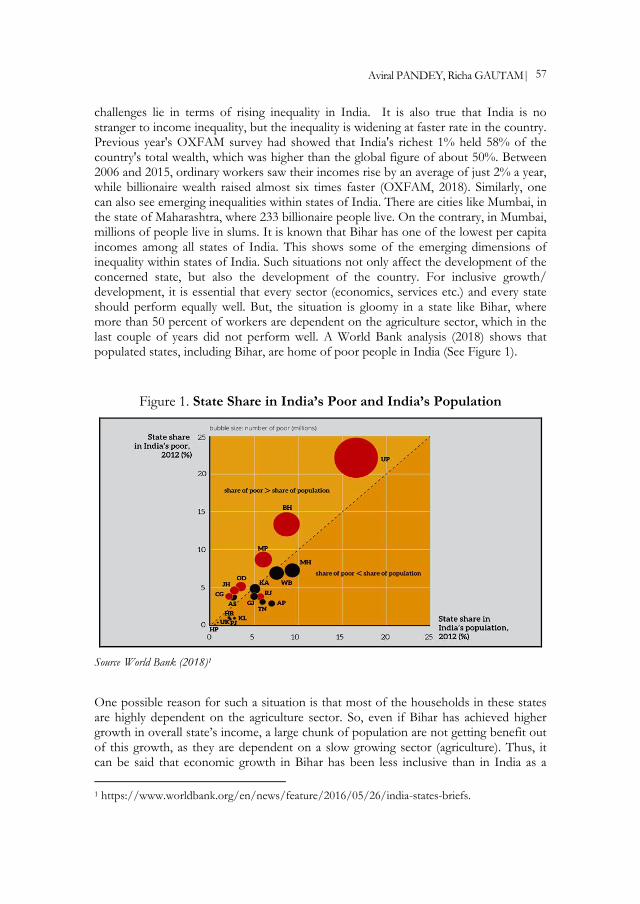
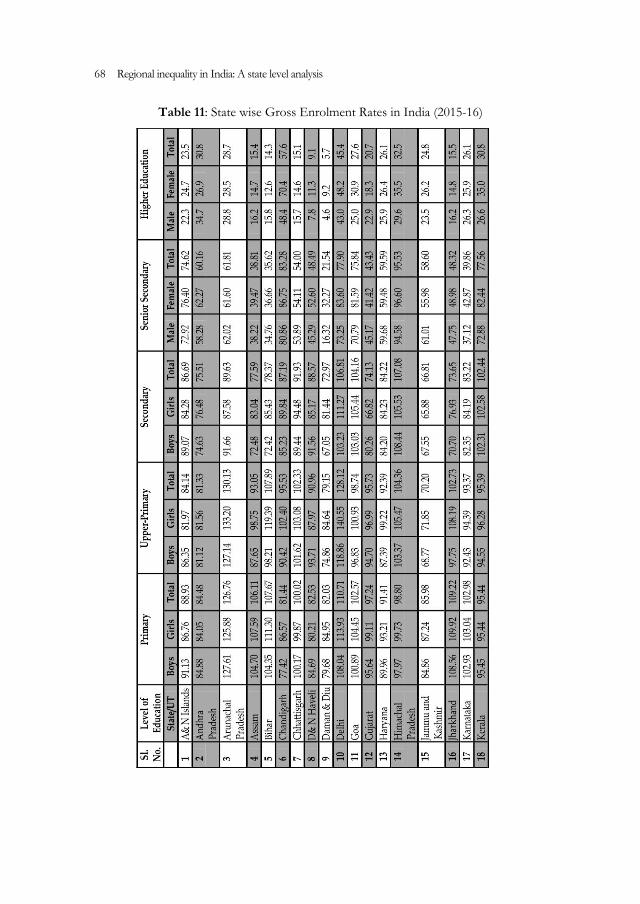
It can be seen that situation of enrolment in educational institutions in state like Bihar has improved after implementation of RTE (Table 11). Bihar and Jharkhand are performing well in case of primary and upper primary education. But as the level of education increases, we see a fall in the ranks of these states (as per gross enrolment ratio). In terms of access to facilities like computers, the situation has deteriorated in Bihar and Chhattisgarh in the last couple of years. As per the ASER report 2018, Bihar stands at lowest rank in terms of schools with computers. Figure 2 also shows the level of inequality across states in terms of availability of computers in schools. The situation of higher education is also gloomy in Bihar. Table 12 shows that Bihar is at lowest rank (excluding union territory) in terms of GER (Gross Enrolment Ratio) in higher educational institutions.
Regional inequality in India: A state level analysis 68
Table 11: State wise Gross Enrolment Rates in India (2015-16)

Aviral PANDEY, Richa GAUTAM 69
Source: Educational statistics at a Glance, MHRD 2018
Regional inequality in India: A state level analysis 70
Table 12: Rank wise distribution of State as per Gross Enrolment Ratio
Primary Upper Primary Secondary Upper Secondary Higher Education
Meghalaya Sikkim Sikkim Lakshadweep Chandigarh
Manipur Meghalaya Tripura Himachal Pradesh Delhi
Arunachal Pradesh
Mizoram Mizoram Chandigarh Tamil Nadu
Mizoram Arunachal Pradesh Himachal Pradesh Tamil Nadu Puducherry
Delhi Manipur Delhi Delhi Sikkim
Jharkhand Delhi Goa Kerala Telangana
Tripura Tripura Lakshadweep Goa Manipur
Bihar Bihar Kerala Uttarakhand Uttarakhand
Assam West Bengal Tamil Nadu Puducherry Himachal Pradesh
Tamil Nadu Himachal Pradesh Manipur A & N Islands Andhra Pradesh
Odisha Jharkhand Chhattisgarh Punjab Kerala
West Bengal Chhattisgarh Maharashtra Sikkim Maharashtra
Telangana Nagaland Arunachal Pradesh
Manipur Arunachal Pradesh
Karnataka Maharashtra Puducherry Maharashtra Goa
Sikkim Goa Dadra & Nagar Haveli
Arunachal Pradesh Punjab
Goa Punjab Meghalaya Telangana Haryana
Punjab Gujarat Chandigarh Uttar Pradesh Karnataka
Rajasthan Chandigarh Punjab Andhra Pradesh Jammu and Kashmir
Chhattisgarh Kerala A & N Islands Haryana Uttar Pradesh
Nagaland Odisha Uttarakhand Rajasthan Mizoram
Uttarakhand Tamil Nadu Haryana Jammu & Kashmir Andaman & Nicobar Islands
Himachal Pradesh Madhya Pradesh West Bengal Mizoram Meghalaya
Maharashtra Karnataka Karnataka Chhattisgarh Gujarat
Gujarat Assam Telangana West Bengal Rajasthan
Kerala Haryana Madhya Pradesh Dadra & Nagar Haveli
Odisha
Madhya Pradesh Rajasthan Odisha@ Jharkhand Madhya Pradesh
Uttar Pradesh Dadra & Nagar Haveli
Bihar Madhya Pradesh West Bengal
Haryana Telangana Assam Tripura Tripura
A & N Islands Puducherry Rajasthan Gujarat Jharkhand
Jammu & Kashmir
Uttarakhand Andhra Pradesh Meghalaya Assam
Puducherry A & N Islands Gujarat Karnataka Chhatisgarh
Andhra Pradesh Lakshadweep Jharkhand Assam Nagaland
Dadra & Nagar Haveli
Andhra Pradesh Daman & Diu Nagaland Bihar
Daman & Diu Daman & Diu Nagaland Bihar Dadra & Nagar Haveli
Chandigarh Uttar Pradesh Uttar Pradesh Daman & Diu Lakshadweep
Lakshadweep Jammu & Kashmir Jammu & Kashmir Daman & Diu
Notes: Name of state has been given on the basis of ranks as per Gross Enrolment ratio. Names of states have been mentioned in descending order.
Source: Author’s Calculation based on data given in Educational statistics at a Glance, MHRD 2018.

Aviral PANDEY, Richa GAUTAM 71
Table 13: Inequality among Male in School Attendance Rate (6–17) Years
State SC/gen State ST/gen State OBC/gen
Mizoram - Mizoram - Mizoram -
Arunachal Pradesh 1.06 Punjab - Meghalaya 1.14*
Goa 1.05* Arunachal Pradesh 1.12 Assam 1.07
Maharashtra 1.04 Assam 1.11 Nagaland 1.05*
Assam 1.04 Nagaland 1.09 Goa 1.03
West Bengal 1.01 Meghalaya 1.01 Jammu & Kashmir 1.03
Telangana 1.01 Sikkim 0.99 Maharashtra 1.03
Sikkim 1.01 Manipur 0.99 Telangana 1.02
Tripura 1.00 Jammu & Kashmir 0.99 Himachal 1.01
Jammu & Kashmir 1.00 Himachal 0.99 Sikkim 1.00
Chhattisgarh 0.97 Haryana 0.98* Tripura 1.00
Manipur 0.96 Goa 0.97 Manipur 0.99
Uttarakhand 0.96 Telangana 0.96 West Bengal 0.99
Himachal 0.96 Karnataka 0.95 Kerala 0.99
Andhra Pradesh 0.96 West Bengal 0.95 Bihar 0.99
Meghalaya 0.96 Tripura 0.95 Karnataka 0.98
Karnataka 0.95 Bihar 0.94 Andhra Pradesh 0.98
Haryana 0.95 Uttarakhand 0.93 Tamil Nadu 0.98
Kerala 0.95 Chhattisgarh 0.91 Chhattisgarh 0.98
Nagaland 0.94 Maharashtra 0.91 Odisha 0.98
Uttar Pradesh 0.94 Jharkhand 0.91 Jharkhand 0.97
Tamil Nadu 0.94 Uttar Pradesh 0.91 Haryana 0.96
Odisha 0.93 Kerala 0.90 Uttar Pradesh 0.96
Madhya Pradesh 0.92 Tamil Nadu 0.90 Madhya Pradesh 0.96
Bihar 0.92 Rajasthan 0.88 Rajasthan 0.95
Punjab 0.91 Andhra Pradesh 0.88 Punjab 0.95
Rajasthan 0.91 Odisha 0.86 Arunachal Pradesh 0.94
Gujarat 0.91 Gujarat 0.85 Uttarakhand 0.90
Jharkhand 0.90 Madhya Pradesh 0.82 Gujarat 0.90
* Based on 25-49 unweighted cases.
Note: Here, inequality is defined as the ratio of indicators for relevant groups and values are ranked.
Source: Author’s Calculation based on NFHS-4, State Reports (2017)
Table 14: Inequality among Female in School Attendance Rate (6–17) Years
State SC/gen State ST/gen State OBC/gen
Arunachal Pradesh
1.10 Nagaland 1.12 Nagaland 1.12
Sikkim 1.04 Arunachal Pradesh 1.11 Arunachal Pradesh 1.06
Maharashtra 1.03 Assam 1.06 Maharashtra 1.04
Manipur 1.00 Sikkim 1.01 West Bengal 1.03
Assam 1.00 Manipur 1.01 Himachal 1.02
Tripura 0.99 Meghalaya 0.98 Tripura 1.01
West Bengal 0.99 Tripura 0.97 Sikkim 1.01
Telangana 0.98 Himachal 0.97 Bihar 1.01
Goa 0.98* Uttarakhand 0.96 Telangana 1.00
Kerala 0.97 West Bengal 0.96 Goa 1.00
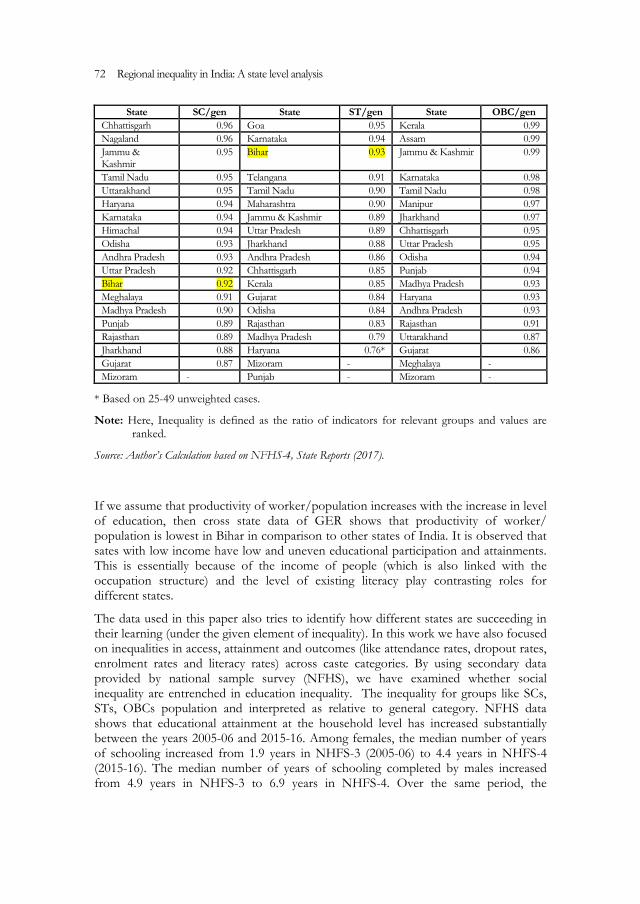
Regional inequality in India: A state level analysis 72
State SC/gen State ST/gen State OBC/gen
Chhattisgarh 0.96 Goa 0.95 Kerala 0.99
Nagaland 0.96 Karnataka 0.94 Assam 0.99
Jammu & Kashmir
0.95 Bihar 0.93 Jammu & Kashmir 0.99
Tamil Nadu 0.95 Telangana 0.91 Karnataka 0.98
Uttarakhand 0.95 Tamil Nadu 0.90 Tamil Nadu 0.98
Haryana 0.94 Maharashtra 0.90 Manipur 0.97
Karnataka 0.94 Jammu & Kashmir 0.89 Jharkhand 0.97
Himachal 0.94 Uttar Pradesh 0.89 Chhattisgarh 0.95
Odisha 0.93 Jharkhand 0.88 Uttar Pradesh 0.95
Andhra Pradesh 0.93 Andhra Pradesh 0.86 Odisha 0.94
Uttar Pradesh 0.92 Chhattisgarh 0.85 Punjab 0.94
Bihar 0.92 Kerala 0.85 Madhya Pradesh 0.93
Meghalaya 0.91 Gujarat 0.84 Haryana 0.93
Madhya Pradesh 0.90 Odisha 0.84 Andhra Pradesh 0.93
Punjab 0.89 Rajasthan 0.83 Rajasthan 0.91
Rajasthan 0.89 Madhya Pradesh 0.79 Uttarakhand 0.87
Jharkhand 0.88 Haryana 0.76* Gujarat 0.86
Gujarat 0.87 Mizoram - Meghalaya -
Mizoram - Punjab - Mizoram -
* Based on 25-49 unweighted cases.
Note: Here, Inequality is defined as the ratio of indicators for relevant groups and values are ranked.
Source: Author’s Calculation based on NFHS-4, State Reports (2017).
If we assume that productivity of worker/population increases with the increase in level of education, then cross state data of GER shows that productivity of worker/ population is lowest in Bihar in comparison to other states of India. It is observed that sates with low income have low and uneven educational participation and attainments. This is essentially because of the income of people (which is also linked with the occupation structure) and the level of existing literacy play contrasting roles for different states.
The data used in this paper also tries to identify how different states are succeeding in their learning (under the given element of inequality). In this work we have also focused on inequalities in access, attainment and outcomes (like attendance rates, dropout rates, enrolment rates and literacy rates) across caste categories. By using secondary data provided by national sample survey (NFHS), we have examined whether social inequality are entrenched in education inequality. The inequality for groups like SCs, STs, OBCs population and interpreted as relative to general category. NFHS data shows that educational attainment at the household level has increased substantially between the years 2005-06 and 2015-16. Among females, the median number of years of schooling increased from 1.9 years in NHFS-3 (2005-06) to 4.4 years in NHFS-4 (2015-16). The median number of years of schooling completed by males increased from 4.9 years in NHFS-3 to 6.9 years in NHFS-4. Over the same period, the

Aviral PANDEY, Richa GAUTAM 73
percentage of females and males with no schooling decreased from 42 percent of females and 22 percent of males to 31 percent of females and 15 percent of males. Table 13 and Table 14 show inequality between general and SC, General and ST and General and OBC in case of attendance rate among 6-17 years of age group of students. We find inequality between SC and General and ST and general categories of students. Bihar is among the list of high inequality states of India, especially in case of male SC and male General categories of students. Significantly, in case of female students we find low inequality between OBC and General category in comparison to male students in Bihar. In case of female we find equality between OBC and General category of students in Bihar. Table 15 shows situation of inequality at overall (male and female) level. Here, we find that situation of Gujarat is worst in India in case of inequality between SC and General Students (measured in terms of attendance rates). Table 16 shows inequality between SC and General Categories of students and Table 17 shows the inequality between OBC and General Categories of students. Both tables show that inequality between General and SC and General and OBC increase as the level of education increases in Bihar. Bihar has the highest inequality between SC and General Students at Upper Primary and Secondary & Higher Secondary level.
Table 15: Inequality in School Attendance Rate (6–17) Years
State SC/gen State ST/gen State OBC/gen
Arunachal Pradesh 1.08 Arunachal Pradesh
1.11 Meghalaya 1.11
Maharashtra 1.03 Nagaland 1.10 Nagaland 1.08
Sikkim 1.02 Assam 1.08 Maharashtra 1.03
Goa 1.02 Sikkim 1.00 Assam 1.03
Assam 1.01 Manipur 1.00 Goa 1.02
West Bengal 1.00 Meghalaya 0.99 Himachal 1.01
Telangana 1.00 Himachal 0.98 Telangana 1.01
Tripura 0.99 Goa 0.96 West Bengal 1.01
Manipur 0.98 Tripura 0.96 Jammu & Kashmir 1.01
Jammu & Kashmir 0.98 West Bengal 0.96 Tripura 1.00
Chhattisgarh 0.97 Karnataka 0.95 Sikkim 1.00
Kerala 0.96 Uttarakhand 0.95 Arunachal Pradesh 1.00
Uttarakhand 0.96 Jammu & Kashmir
0.94 Bihar 1.00
Nagaland 0.95 Telangana 0.94 Kerala 0.99
Himachal 0.95 Bihar 0.93 Manipur 0.98
Karnataka 0.95 Maharashtra 0.90 Karnataka 0.98
Haryana 0.95 Tamil Nadu 0.90 Tamil Nadu 0.98
Tamil Nadu 0.94 Uttar Pradesh 0.90 Jharkhand 0.97
Andhra Pradesh 0.94 Jharkhand 0.89 Chhattisgarh 0.96
Uttar Pradesh 0.93 Haryana 0.88 Odisha 0.96
Meghalaya 0.93 Chhattisgarh 0.88 Uttar Pradesh 0.96
Odisha 0.93 Kerala 0.87 Andhra Pradesh 0.95
Bihar 0.92 Andhra Pradesh
0.87 Haryana 0.95
Madhya Pradesh 0.91 Rajasthan 0.86 Madhya Pradesh 0.94
Punjab 0.90 Odisha 0.85 Punjab 0.94
Rajasthan 0.90 Gujarat 0.84 Rajasthan 0.93

Regional inequality in India: A state level analysis 74
State SC/gen State ST/gen State OBC/gen
Jharkhand 0.89 Madhya Pradesh
0.81 Uttarakhand 0.89
Gujarat 0.89 Mizoram - Gujarat 0.88
Mizoram - Punjab - Mizoram -
Note: Here, Inequality is defined as the ratio of indicators for relevant groups and values are ranked.
Source: Author’s Calculation based on NFHS-4, State Reports (2017).
Table 16: Inequality in Level of Education A
Sl. No.
SC/General
Illiterate Primary upper primary secondary &
higher Secondary
1 Dadra & N. Haveli Daman & Diu Daman & Diu Puducherry
2 Kerala Sikkim Delhi Arunachal Pradesh
3 Puducherry Chandigarh Nagaland Goa
4 Tamil Nadu Haryana Kerala Daman & Diu
5 Chhattisgarh Chhattisgarh Jammu & Kashmir Dadra & N. Haveli
6 Manipur Puducherry Uttarakhand Jammu & Kashmir
7 Jharkhand Himachal Pradesh Telangana Assam
8 Bihar Delhi Maharashtra Chandigarh
9 Chandigarh Madhya Pradesh Tamil Nadu Uttarakhand
10 Sikkim Tamil Nadu Jharkhand Delhi
11 Odisha Gujarat Rajasthan Meghalaya
12 Gujarat Odisha Himachal Pradesh Nagaland
13 Madhya Pradesh Jharkhand Meghalaya Sikkim
14 Andhra Pradesh Punjab Assam Tamil Nadu
15 Punjab Tripura Punjab Maharashtra
16 Delhi Bihar Madhya Pradesh Tripura
17 Rajasthan West Bengal Karnataka Kerala
18 Uttar Pradesh Maharashtra Puducherry Telangana
19 Haryana Uttar Pradesh Manipur Himachal Pradesh
20 Meghalaya Nagaland Goa Gujarat
21 Telangana Karnataka West Bengal Karnataka
22 Karnataka Kerala Haryana Manipur
23 Maharashtra Jammu & Kashmir Odisha West Bengal
24 Tripura Rajasthan Uttar Pradesh Andhra Pradesh
25 Uttarakhand Assam Gujarat Haryana
26 West Bengal Telangana Chandigarh Punjab
27 Himachal Pradesh Andhra Pradesh Tripura Uttar Pradesh
28 Goa Uttarakhand Chhattisgarh Rajasthan
29 Jammu & Kashmir Meghalaya Dadra & N. Haveli Madhya Pradesh
30 Assam Manipur Andhra Pradesh Chhattisgarh
31 Nagaland Goa Sikkim Jharkhand
32 Arunachal Pradesh Arunachal Pradesh Arunachal Pradesh Odisha
33 Daman & Diu Dadra & N. Haveli Bihar Bihar
Source: Authors’ calculation based on NSS (2014).

Aviral PANDEY, Richa GAUTAM 75
Figure 2. Computer Available For Children in Schools* (in Rural Areas)
Source: ASER 2018. Note: *As part of the ASER survey, one government school with primary sections was visited in each sampled village. Preference was given to a government upper primary school (Std. I-VII/VIII) if one exists in the village.
Table 17: Inequality in Level of Education B
OBC/General
Sl. No. Illiterate Primary Upper primary Secondary &
Higher Secondary
1 Mizoram Sikkim Daman & Diu Puducherry
2 Dadra & N. Haveli Chandigarh Nagaland Arunachal Pradesh
3 Puducherry Chhattisgarh Mizoram Nagaland
4 Chhattisgarh Puducherry Delhi Dadra & N. Haveli
5 Gujarat Meghalaya Punjab Goa
6 Jharkhand Gujarat Telangana Meghalaya
7 Tamil Nadu Odisha Karnataka Sikkim
8 Kerala Daman & Diu Chandigarh Daman & Diu
9 Delhi Mizoram Jharkhand Uttarakhand
10 Meghalaya Madhya Pradesh Himachal Pradesh Delhi
11 Bihar Uttarakhand Kerala A & N Islands
12 Madhya Pradesh Kerala Tamil Nadu Assam
13 Sikkim Jammu & Kashmir Maharashtra Manipur
14 Andhra Pradesh Tamil Nadu Odisha Maharashtra
15 Uttar Pradesh Bihar Madhya Pradesh Tamil Nadu
16 Rajasthan Delhi Meghalaya Karnataka
17 Manipur Himachal Pradesh Chhattisgarh Tripura
18 Telangana Haryana Tripura Haryana
19 Odisha A & N Islands West Bengal Chandigarh
20 Haryana West Bengal Rajasthan Jammu & Kashmir
21 Tripura Punjab Assam Punjab
22 Uttarakhand Maharashtra Gujarat Himachal Pradesh

Regional inequality in India: A state level analysis 76
OBC/General
Sl. No. Illiterate Primary Upper primary Secondary &
Higher Secondary
23 Punjab Uttar Pradesh Puducherry Kerala
24 Himachal Pradesh Rajasthan Jammu & Kashmir Telangana
25 Karnataka Jharkhand Goa West Bengal
26 West Bengal Karnataka Haryana Uttar Pradesh
27 Maharashtra Goa Uttar Pradesh Odisha
28 Jammu & Kashmir Andhra Pradesh Arunachal Pradesh Jharkhand
29 Assam Tripura Sikkim Rajasthan
30 Chandigarh Telangana Manipur Andhra Pradesh
31 Goa Assam Bihar Chhattisgarh
32 A & N Islands Manipur Andhra Pradesh Madhya Pradesh
33 Daman & Diu Arunachal Pradesh A & N Islands Bihar
Nagaland Nagaland Uttarakhand Gujarat
Arunachal Pradesh Dadra & N. Haveli Dadra & N. Haveli
Source: Authors’ calculation based on NSS (2014).
Table 18: Percentage of Students Taking Private Coaching in State/UT
Students taking private coaching for levels other than school education for each State/UT rural + urban
Sl. No.
State Percentage Sl. No. State Percentage
1 Tripura 81.2 19 Gujarat 19.4
2 West Bengal 78.4 20 Madhya Pradesh 18.9
3 Daman & Diu 50.8 21 Tamil Nadu 17.4
4 Chandigarh 50 22 Uttarakhand 16.2
5 Bihar 49.5 23 Uttar Pradesh 15.2
6 Odisha 47.9 24 Haryana 15
7 Manipur 35.5 25 Sikkim 13.7
8 Jharkhand 35 26 Karnataka 12.7
9 Delhi 34 27 Andhra Pradesh 10.3
10 Jammu & Kashmir 29.2 28 Rajasthan 10
11 Kerala 26.1 29 Lakshadweep 8.7
12 Maharashtra 25 30 Chhattisgarh 8.1
13 A & N Islands 24 31 Arunachal Pradesh 7.8
14 Goa 23.1 32 Himachal Pradesh 7.6
15 Puducherry 22.4 33 Meghalaya 6.1
16 Punjab 21.3 34 Telangana 5
17 Dadra & Nagar Haveli 20.6 35 Nagaland 3.8
18 Assam 19.6 36 Mizoram 1.9
Source: Authors’ calculation based on NSS (2014).
Privation in education is another important feature of education system in India. Thus, it is important to analyse the extent of privation of education across states of India. We have also analysed the pattern of expenditure (as an indicator of extent of private sectors’ role in education) by students on coaching. Table 18 shows who bears the burden of education in different states of India. We find that more than 30 percent of

Aviral PANDEY, Richa GAUTAM 77
students have to take private coaching even in poor states like Bihar, Odisha and Jharkhand etc. Bihar is among the top five states in terms of percentage of students who take coaching in India. Unfortunately, private coaching can only be accessed by households who are not poor. Thus, the increasing role of private coaching can further lead to a rise in inequality between poor and rich in Bihar (that is already on higher side). Also, in absence of quality education in government schools, students from poor states have to bear higher expenditure on education in terms of expenditure on coaching to compete with students of other states.
Section III: Gender Inequality
Inequality in India can also be seen in terms of gender. India is home of 121 crore
population and among them around 48 percent are female/women. Female constitute
half of the world’s population. However, gender equality is also one of the important
agenda of sustainable development, unfortunately gender inequality can be seen in
every sphere of the society. Female population continue to be underrepresented at the
level of politics and governance in India and states. One can find that females are not
able to enjoy similar opportunities and benefits that male population enjoy in India.
Women are paid unequally in India compared to men when it comes to hourly wages
for labour. As per a recent report by the International Labour Organization (ILO,
2019) on average, women are paid 34 per cent less than men. The gap in wages, known
as the gender wage gap, is the highest among 73 countries studied in the report. Studies
also show that sometimes women cannot take decisions for themselves. Around 40
percent of women aged 20 to 24 were married before their 18th birthday. Their
participation in social, economical and political sphere is highly dependent on factors
highly associated with male related situations (e.g. literacy of father). That is why the
concept of empowerment has evolved and policies have been designed to empower
female population so that they can get equal opportunities to excel in their life.
The lack of women’s empowerment is basically a critical form of inequality. At overall level
sex ratio is 933. But the level of sex ratio is not similar across states of India and some states
are lagging behind. The child sex ratio for 0 to 6 years of age group (918) is lower than
overall sex ratio in India. The level of child sex ratio is also not similar across states of India
and some states are lagging behind. We also find differences across states in case of age of
marriage. We also find difference between male and female in terms of literacy rate. Thanks
to government interventions and other factors, literacy rate for female has improved in last
couple of years, but around 35 per cent of female population is still illiterate and only 20 per
cent of male population are illiterate. We also find differences in terms of literacy rates.
Literacy among female is around 91 per cent in Kerala, while it is only 61 per cent in Bihar.
Across states, females do work for which they do not get any remuneration (unpaid work).
Females have to face inequality starting from birth that continues during their whole lives. In
some states, females are deprived of access to proper nutrition, and health care facility and
this lead to high mortality rate among female members (either in terms of high Infant

Regional inequality in India: A state level analysis 78
Mortality Rate among girl child or high Mother Mortality Rate). The case of Bihar is given in
Table 19.
Table 19: Infant Mortality rate by Sex and Residence
Bihar Total Male Female
2015 42 36 50
2014 42 39 46
2013 43 42 45
Rural
Male Female
2015 42 36 49
2014 43 39 46
2013 44 43 46
Urban
Male Female
2015 44 37 52
2014 37 37 38
2013 34 33 36
Source: Authors’ compilation using various years reports of Vital Statistics of SRS Bulletin
Females in most of the states have to face sexual violence and domestic violence. The physical, mental and sexual violence affects women (female) of different ages, and it can be seen in terms of numbers of dowry death cases, domestic violence cases, lower participation of females in labor market, lower participation of female members in social events and low literacy levels. The situation is serious in Bihar. Recent reports of NSS (national sample Survey) and PLFS (2019) on employment-unemployment show continuous decline in female work force participation since 2004-05. It is also seen that age of marriage affects the girls’ education. Low education translates into lack of access to technical knowledge and skills and lack of opportunities in the labour market. Thus, a deeper analysis of is required to understand the situation of case of women across states of India.
Women Empowerment Index
To identify that which state is better in terms of women empowerment, the “Women Empowerment Index” (WEI) has been calculated. This index has been calculated using data of NFHS. This index is based on the assumption that women empowerment is inclusive of female’ mental, social, household and physical situations. Thus, we have tried to cover variables related to female mental, social, household and physical situations to measure WEI. Women Empowerment index has been calculated using following twelve variables/indicators:
Women with 10 or more years of schooling (%)
Women age 20-24 years married before age 18 years (%)
Women age 15-19 years who were already mothers or pregnant at the time of the survey (%)
Women whose Body Mass Index (BMI) is below normal (BMI < 18.5 kg/m2)14 (%)
Aviral PANDEY, Richa GAUTAM 79
Currently married women who usually participate in household decisions (%)
Women who worked in the last 12 months who were paid in cash (%)
Ever-married women who have ever experienced spousal violence (%)
Ever-married women who have experienced violence during any pregnancy (%)
Women owning a house and/or land (alone or jointly with others) (%)
Women having a bank or savings account that they themselves use (%)
Women having a mobile phone that they themselves use (%)
Women age 15-24 years who use hygienic methods of protection during their menstrual period (%).
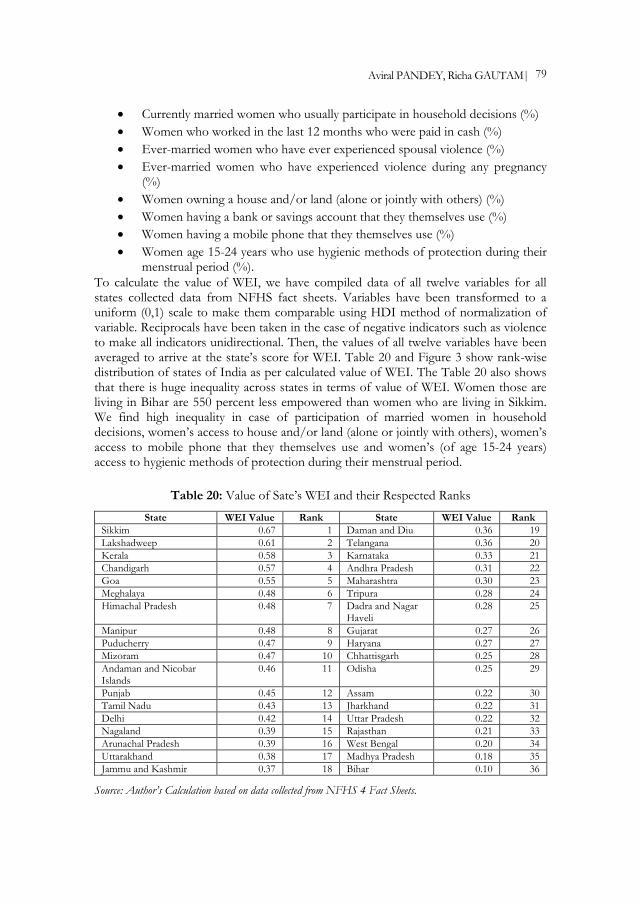
To calculate the value of WEI, we have compiled data of all twelve variables for all states collected data from NFHS fact sheets. Variables have been transformed to a uniform (0,1) scale to make them comparable using HDI method of normalization of variable. Reciprocals have been taken in the case of negative indicators such as violence to make all indicators unidirectional. Then, the values of all twelve variables have been averaged to arrive at the state’s score for WEI. Table 20 and Figure 3 show rank-wise distribution of states of India as per calculated value of WEI. The Table 20 also shows that there is huge inequality across states in terms of value of WEI. Women those are living in Bihar are 550 percent less empowered than women who are living in Sikkim. We find high inequality in case of participation of married women in household decisions, women’s access to house and/or land (alone or jointly with others), women’s access to mobile phone that they themselves use and women’s (of age 15-24 years) access to hygienic methods of protection during their menstrual period.
Table 20: Value of Sate’s WEI and their Respected Ranks
State WEI Value Rank State WEI Value Rank
Sikkim 0.67 1 Daman and Diu 0.36 19
Lakshadweep 0.61 2 Telangana 0.36 20
Kerala 0.58 3 Karnataka 0.33 21
Chandigarh 0.57 4 Andhra Pradesh 0.31 22
Goa 0.55 5 Maharashtra 0.30 23
Meghalaya 0.48 6 Tripura 0.28 24
Himachal Pradesh 0.48 7 Dadra and Nagar Haveli
0.28 25
Manipur 0.48 8 Gujarat 0.27 26
Puducherry 0.47 9 Haryana 0.27 27
Mizoram 0.47 10 Chhattisgarh 0.25 28
Andaman and Nicobar Islands
0.46 11 Odisha 0.25 29
Punjab 0.45 12 Assam 0.22 30
Tamil Nadu 0.43 13 Jharkhand 0.22 31
Delhi 0.42 14 Uttar Pradesh 0.22 32
Nagaland 0.39 15 Rajasthan 0.21 33
Arunachal Pradesh 0.39 16 West Bengal 0.20 34
Uttarakhand 0.38 17 Madhya Pradesh 0.18 35
Jammu and Kashmir 0.37 18 Bihar 0.10 36
Source: Author’s Calculation based on data collected from NFHS 4 Fact Sheets.

Regional inequality in India: A state level analysis 80
Figure 3. State as Per Women Empowerment Index in India
Source: Author’s Compilation using NFHS 4 Data. Note: Colour indicates rank, green is on better side and violet is on bad side. Darker of violet is worse and darker of green is best.
Section IV: Health Inequality Rising health inequality is another important dimension of inequality in the world and
India. World Bank country wise data on expenditure on health of year 2017 shows
high inequality across countries in terms of per capita current health expenditure on
PPP basis (current international $). The value of per capita current health expenditure
(on PPP basis and current international $) is 10246 in USA and it is lowest with 37 in
D.R. Congo. Neither the situation of India is very good in terms of health
expenditure, with a value of only 253 $ (on PPP basis) per capita. We see increase in
expenditure on health between 2000 and 2016 at world level. Unfortunately, we find
high variability in case of percentage of GDP expenditure on health at the overall
world level. We also find a huge inequality across countries in terms of percentage of
GDP expenditure on health. This varies from 17 per cent in USA to about 1 per cent
in Venezuela. The situation of India is also not satisfactory, as this ratio is only 3.53
per cent. The situation is better in terms of percentage of GDP expenditure on health
in Nepal (5.55 per cent) and Sri Lanka (3.81) in comparison to India. As per the
W.H.O. governments in countries (at overall level) provide an average of 51% of a
country’s health spending, while more than 35% of health spending per country
comes from out-of-pocket expenditure. Unfortunately, this ratio is very high in case
of India (around 62 percent in year 2017). The poor health conditions also can be

Aviral PANDEY, Richa GAUTAM 81
seen in terms of availability of health personnel in India. The Employment and
Unemployment Survey of 2017–18 reveals some important points related to
availability of total health personals in India and states: total personnel in all human
health activities working in institutions with some inpatient facility is around 26.3
lakh, of which 72% works are working in urban areas. Only 44% or 11.6 lakh workers
are working in public sectors. This shows high inequality between rural and urban
areas in India. The employment figures also show inequality in terms of availability of
health personnel per 10,000 people. It is 19.6 for all India. But, it varies from 49 for
Kerala to 26 for Punjab and 6.8 for Bihar and 8.9 for Uttar Pradesh.
NITI Aayog has released a report on the health index in June 2019 highlighting the
extreme disparity across states. This report shows that while the health situation in
Kerala is comparable to Brazil or Argentina, the situation in Odisha is similar to that
in Sierra Leone. The top five states are Kerala, Andhra Pradesh (undivided),
Maharashtra, Gujarat, and Punjab, and the bottom five states are Uttarakhand,
Madhya Pradesh, Odisha, Bihar, and Uttar Pradesh in that order. Regional inequality
often hides the social inequality in healthcare, especially in policy formulation and
planning, if there is any. The worst sufferers—both in access to and outcome in
healthcare—are those belonging to the Scheduled Caste (SC) and Scheduled Tribe
(ST) social categories.
Here, we have analysed health inequality across states of India in terms of health
expenditure as a percentage of total state expenditure, per capita health expenditure,
health expenditure as a percentage of GSDP (Gross State Domestic Product). We
find that Bihar is the worst performer in the case of per capita health expenditure,
and second worst performer in case of health expenditure as a percentage of total
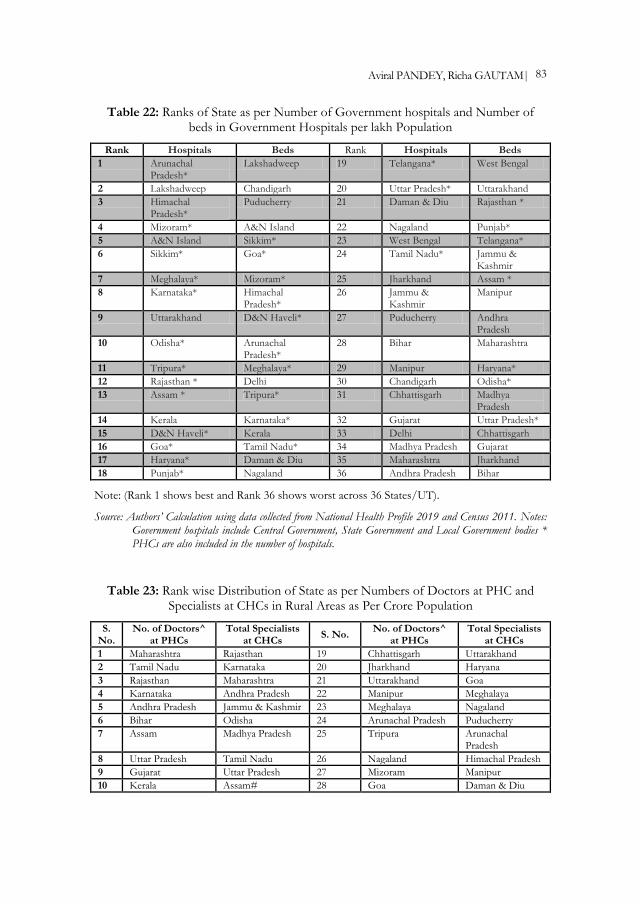
state expenditure (Table 21). We have also tried to see how lowest per capita
expenditure on health is affecting the availability of government hospitals and
number of beds in government hospitals in Bihar. Table 22 shows that in terms of
per crore numbers of hospitals, Delhi is worst performer in India. But in terms of
numbers of beds available in government hospitals, Bihar is the worst performer
across states of India. Table 23 shows availability of doctors per crore in rural areas
of states of India. We find that Bihar is among top five lowest in terms of number of
specialists at CHCs in India. The overall dimensions shows that even there is growth
in SDP (State Domestic Product), still expenditure on health per population is very
low in Bihar. Thus people who are in Bihar are getting low health security than other
states of India.

Regional inequality in India: A state level analysis 82
Table 21: Ranks of State as per Expenditure on Health: Per Capita, as share of Total State Expenditure and as share of GSDP for all State & Union Territories, 2015-16
Note: (Rank 1 shows best and Rank 36 shows worst across 36 States/UT)
Source: Authors’ Calculation based on data collected from National Health Profile 2019.
Aviral PANDEY, Richa GAUTAM 83
Table 22: Ranks of State as per Number of Government hospitals and Number of beds in Government Hospitals per lakh Population
Rank Hospitals Beds Rank Hospitals Beds
1 Arunachal Pradesh*
Lakshadweep 19 Telangana* West Bengal
2 Lakshadweep Chandigarh 20 Uttar Pradesh* Uttarakhand
3 Himachal Pradesh*
Puducherry 21 Daman & Diu Rajasthan *
4 Mizoram* A&N Island 22 Nagaland Punjab*
5 A&N Island Sikkim* 23 West Bengal Telangana*
6 Sikkim* Goa* 24 Tamil Nadu* Jammu & Kashmir
7 Meghalaya* Mizoram* 25 Jharkhand Assam *
8 Karnataka* Himachal Pradesh*
26 Jammu & Kashmir
Manipur
9 Uttarakhand D&N Haveli* 27 Puducherry Andhra Pradesh
10 Odisha* Arunachal Pradesh*
28 Bihar Maharashtra
11 Tripura* Meghalaya* 29 Manipur Haryana*
12 Rajasthan * Delhi 30 Chandigarh Odisha*
13 Assam * Tripura* 31 Chhattisgarh Madhya Pradesh
14 Kerala Karnataka* 32 Gujarat Uttar Pradesh*
15 D&N Haveli* Kerala 33 Delhi Chhattisgarh
16 Goa* Tamil Nadu* 34 Madhya Pradesh Gujarat
17 Haryana* Daman & Diu 35 Maharashtra Jharkhand
18 Punjab* Nagaland 36 Andhra Pradesh Bihar
Note: (Rank 1 shows best and Rank 36 shows worst across 36 States/UT).
Source: Authors’ Calculation using data collected from National Health Profile 2019 and Census 2011. Notes: Government hospitals include Central Government, State Government and Local Government bodies * PHCs are also included in the number of hospitals.
Table 23: Rank wise Distribution of State as per Numbers of Doctors at PHC and Specialists at CHCs in Rural Areas as Per Crore Population
S. No.
No. of Doctors^ at PHCs
Total Specialists at CHCs
S. No. No. of Doctors^
at PHCs Total Specialists
at CHCs
1 Maharashtra Rajasthan 19 Chhattisgarh Uttarakhand
2 Tamil Nadu Karnataka 20 Jharkhand Haryana
3 Rajasthan Maharashtra 21 Uttarakhand Goa
4 Karnataka Andhra Pradesh 22 Manipur Meghalaya
5 Andhra Pradesh Jammu & Kashmir 23 Meghalaya Nagaland
6 Bihar Odisha 24 Arunachal Pradesh Puducherry
7 Assam Madhya Pradesh 25 Tripura Arunachal Pradesh
8 Uttar Pradesh Tamil Nadu 26 Nagaland Himachal Pradesh
9 Gujarat Uttar Pradesh 27 Mizoram Manipur
10 Kerala Assam# 28 Goa Daman & Diu

Regional inequality in India: A state level analysis 84
S. No.
No. of Doctors^ at PHCs
Total Specialists at CHCs
S. No. No. of Doctors^
at PHCs Total Specialists
at CHCs
11 Madhya Pradesh West Bengal 29 Puducherry Tripura
12 Telangana Gujarat 30 A& N Islands
13 West Bengal Telangana 31 Sikkim
14 Odisha Punjab 32 Delhi
15 Jammu & Kashmir Jharkhand 33 D & N Haveli
16 Himachal Pradesh Bihar 34 Lakshadweep
17 Haryana Chhattisgarh 35 Daman & Diu
18 Punjab Kerala
Note: ^Allopathic Doctors. (Rank 1 shows best and Rank 35/29 shows worst across States/UT).
Source: Authors’ Calculation based on data collected from National Health Profile 2019.
Conclusions
Overall, this paper tried to analyse the nature and extent of inequality across states of India and tries to indicate the position of Bihar in India. This study is based on secondary data collected from various sources including NSSO, NFHS and other government/non-government documents and reports. The study analysed inequality under four themes: livelihood, education, health and gender. Overall the analysis found that even some positive changes can be seen in terms of enrolment in primary education but productivity of education is lowest in Bihar. State government has invested money in attracting students to schools but because of low per capita expenditure on education the access to facilities like computer among students is lowest in Bihar. And inequality can also be seen in education attainments across caste categories in Bihar. In case of health expenditure people of Bihar has to bear very high per capita out of pocket expenditure. However, Bihar has achieved higher growth in last couple of years, but, still the level of female empowerment is very low in Bihar. Overall, we find that growth have not reduced inequality across states in India. And, still poor state like Bihar is facing serious challenge related to livelihood, education, women empowerment and health and, due to this out migration from this state is highest across states in India.
References
ASER (2018). Annual Status of Education Report (ASER).
EnviStats - India (2018). EnviStats - India. Prepared by Ministry of Statistics and Programme Implementation.
Health Index (2019). Healthy States Progressive India: Report on Rank of States and Union Territories. Ministry of Health & Family Welfare, Niti Aayog.
Health Sector Financing by Centre and States/UTs in India 2015-16 to 2017-18, National Health Accounts Cell, Ministry of Health & Family Welfare.
ILO (2019). Global Wage Report 2018/19, What Lies Behind Gender Pay Gaps. International Labour Office.

Aviral PANDEY, Richa GAUTAM 85
Mishra, U. S., & William, J. (2020). Household Assets and Wealth Quintiles, India 2006–16. Economic & Poilitical Weekly, 55(6), 77.
NSS (2014). Education in India. National Sample Survey Organisation, 71st Round, Report number 575(71/25.2/1).
NSS (2019). Key Indicators of Household Social Consumption in India: Health. National Sample Survey Organisation.
OXFAM (2018). Reward work, not wealth. Oxfam Briefing Paper Summary.
PLFS (2019). Annual Report Periodic Labour Force Survey (PLFS) (July 2017 and June 2018). Ministry of Statistics and Programme Implementation. N.S.O.
State Finances (2019): A Study of Budgets, Reserve Bank of India.
Suhag, R., & Tiwari, S. (2018). State of State Finances. PRS Legislative Research Institute for Policy Research Studies.